JP2004521660A - Method and apparatus for assessing hemodynamic parameters and vascular position in the circulatory system of a living subject - Google Patents
Method and apparatus for assessing hemodynamic parameters and vascular position in the circulatory system of a living subject Download PDFInfo
- Publication number
- JP2004521660A JP2004521660A JP2001568497A JP2001568497A JP2004521660A JP 2004521660 A JP2004521660 A JP 2004521660A JP 2001568497 A JP2001568497 A JP 2001568497A JP 2001568497 A JP2001568497 A JP 2001568497A JP 2004521660 A JP2004521660 A JP 2004521660A
- Authority
- JP
- Japan
- Prior art keywords
- pressure
- parameter
- blood vessel
- blood
- lumen
- Prior art date
- Legal status (The legal status is an assumption and is not a legal conclusion. Google has not performed a legal analysis and makes no representation as to the accuracy of the status listed.)
- Pending
Links
Images


Classifications
-
- A—HUMAN NECESSITIES
- A61—MEDICAL OR VETERINARY SCIENCE; HYGIENE
- A61B—DIAGNOSIS; SURGERY; IDENTIFICATION
- A61B5/00—Measuring for diagnostic purposes; Identification of persons
- A61B5/02—Detecting, measuring or recording pulse, heart rate, blood pressure or blood flow; Combined pulse/heart-rate/blood pressure determination; Evaluating a cardiovascular condition not otherwise provided for, e.g. using combinations of techniques provided for in this group with electrocardiography or electroauscultation; Heart catheters for measuring blood pressure
- A61B5/021—Measuring pressure in heart or blood vessels
-
- A—HUMAN NECESSITIES
- A61—MEDICAL OR VETERINARY SCIENCE; HYGIENE
- A61B—DIAGNOSIS; SURGERY; IDENTIFICATION
- A61B5/00—Measuring for diagnostic purposes; Identification of persons
- A61B5/0048—Detecting, measuring or recording by applying mechanical forces or stimuli
- A61B5/0053—Detecting, measuring or recording by applying mechanical forces or stimuli by applying pressure, e.g. compression, indentation, palpation, grasping, gauging
-
- A—HUMAN NECESSITIES
- A61—MEDICAL OR VETERINARY SCIENCE; HYGIENE
- A61B—DIAGNOSIS; SURGERY; IDENTIFICATION
- A61B5/00—Measuring for diagnostic purposes; Identification of persons
- A61B5/02—Detecting, measuring or recording pulse, heart rate, blood pressure or blood flow; Combined pulse/heart-rate/blood pressure determination; Evaluating a cardiovascular condition not otherwise provided for, e.g. using combinations of techniques provided for in this group with electrocardiography or electroauscultation; Heart catheters for measuring blood pressure
- A61B5/02028—Determining haemodynamic parameters not otherwise provided for, e.g. cardiac contractility or left ventricular ejection fraction
-
- A—HUMAN NECESSITIES
- A61—MEDICAL OR VETERINARY SCIENCE; HYGIENE
- A61B—DIAGNOSIS; SURGERY; IDENTIFICATION
- A61B5/00—Measuring for diagnostic purposes; Identification of persons
- A61B5/02—Detecting, measuring or recording pulse, heart rate, blood pressure or blood flow; Combined pulse/heart-rate/blood pressure determination; Evaluating a cardiovascular condition not otherwise provided for, e.g. using combinations of techniques provided for in this group with electrocardiography or electroauscultation; Heart catheters for measuring blood pressure
- A61B5/021—Measuring pressure in heart or blood vessels
- A61B5/02108—Measuring pressure in heart or blood vessels from analysis of pulse wave characteristics
- A61B5/02116—Measuring pressure in heart or blood vessels from analysis of pulse wave characteristics of pulse wave amplitude
-
- A—HUMAN NECESSITIES
- A61—MEDICAL OR VETERINARY SCIENCE; HYGIENE
- A61B—DIAGNOSIS; SURGERY; IDENTIFICATION
- A61B8/00—Diagnosis using ultrasonic, sonic or infrasonic waves
- A61B8/06—Measuring blood flow
-
- A—HUMAN NECESSITIES
- A61—MEDICAL OR VETERINARY SCIENCE; HYGIENE
- A61B—DIAGNOSIS; SURGERY; IDENTIFICATION
- A61B8/00—Diagnosis using ultrasonic, sonic or infrasonic waves
- A61B8/08—Detecting organic movements or changes, e.g. tumours, cysts, swellings
- A61B8/0858—Detecting organic movements or changes, e.g. tumours, cysts, swellings involving measuring tissue layers, e.g. skin, interfaces
-
- A—HUMAN NECESSITIES
- A61—MEDICAL OR VETERINARY SCIENCE; HYGIENE
- A61B—DIAGNOSIS; SURGERY; IDENTIFICATION
- A61B2562/00—Details of sensors; Constructional details of sensor housings or probes; Accessories for sensors
- A61B2562/02—Details of sensors specially adapted for in-vivo measurements
- A61B2562/0247—Pressure sensors
Abstract
要約書なしNo summary
Description
【0001】
本願は、2000年3月23日に出願された「生被検体の循環系内の血行力学性質を査定する方法と装置(Method And Apparatus For Assessing Hemodynamic Properties within the Circulatory System of a Living Subject)」と題するかつ本願の讓受人に讓受され、かつ言及することによってその内容をその全体にわたって本明細書に組み入れてある米国特許出願第09/534,900号の一部継続出願である。
【0002】
(関連出願)
本願は、2001年3月22日に出願され、本願の讓受人に讓受された「血管位置を含む血行力学パラメータの非侵襲的査定方法と装置(Method And Apparatus For The Noninvasive Assessment Of Hemodynamic Parameters Including Blood Vessel Location)」と題する米国特許出願第09/815,982号に関する。
【0003】
(発明の背景)
(1.発明の分野)
本願は、一般に、生被検体の循環系と関連したパラメータを監視する方法と装置、特に、動脈血圧の被侵襲的監視に関する。
【0004】
(2.関連技術の説明)
動脈血圧測定
いくつかの周知の技術が被検体の動脈血圧波形を非侵襲的に監視するためにこれまでに使用されてきている。すなわち、聴診法(auscultation)、振動測定法(oscillometry)、圧力測定法(tonometry)これである。聴診法技術と振動測定法技術の両方は、被検体の上腕動脈を閉塞(occlude)する標準膨張性アーム・カフ(arm cuff)を使用する。聴診法技術は、カフをゆっくりと収縮させるに従って起こる或る種のコロトコフ(Korotkoff)音を監視することによって被検体の心収縮期圧(systolic pressure)と心拡張期圧(diastolic pressure)を決定する。他方、振動測定法技術は、カフを収縮させるに従ってカフ内に起こる実圧変化を測定することによって、これらの圧力ばかりでなく被検体の平均圧を測定する。両技術は圧力を決定する、しかし一方でそれは被検体の実血圧波形を再現することができない。それゆえ、真の連続的、拍動間血圧(beat−to−beat blood pressure)監視は、これらの技術を使用して達成することはできない。
【0005】
上に短く説明した種類の閉塞性カフ器械は、一般に、被検体の血圧の長期傾向を検知(sensing)するにはいくらか有効であってきた。しかしながら、このような器械は短期血圧変動を検知するには一般に有効でなかった。短期血圧振動を検知することは、外科を含む多くの医療応用に決定的に重要である。
【0006】
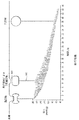
動脈圧力測定法の技術は、医療技術上また周知である。動脈圧力測定法の理論に従えば、橈骨動脈(radial artery)のような、充分な骨性支持器を伴う浅動脈(superficial artery)内の圧力は、経壁圧(transmural pressure)がゼロに等しいとき、圧平(applanation)掃引の間中に正確に記録される。用語、「平圧」は、動脈に印加される圧力を変動させるプロセスを称する。圧平掃引は、動脈への圧力を過圧縮から不足圧縮へ又はこの逆に変動させる間の時間間隔を称する。漸減(decreasing)圧平掃引の開始では、動脈は「ドッグ・ボーン(dog bone)」形状に過圧縮されるので、圧力パルスは記録されない。掃引の終で、動脈は不足圧縮されるので、最小振幅圧力パルスが記録される。掃引内では、動脈壁張力が圧力計表面に平行である間中に圧平が起こると想定する。ここで、動脈圧はその表面に垂直でありかつ圧力測定計センサによって検出された唯一のストレスである。この圧力では、得られた最大ピーク間振幅(「最大拍動(maximum pulsatile)」圧はゼロ経壁圧に相当すると想定する。この理論は、図1にグラフで例示してある。図1で、骨又は他の堅牢な部材が動脈の下にあると想定する。
【0007】
圧力測定法技術を実施する1先行技術のデバイスは、末梢動脈(peripheral artery)、例えば、橈骨動脈の上に横たわる組織に当てるミニアチャ圧力トランスジューサの堅牢なアレーを含む。それらのトランスジューサは、各々がその下に横たわる被検体の組織内の機械力を直接検知し、かつ各々がその下に横たわる動脈の小部分のみをカバーするように寸法を与えられている。アレーは、組織に対して圧迫されて、その下に横たわる動脈を圧平し、それによって動脈内の拍動間圧力変動を組織を通してトランスジューサの少なくとも或るものに結合させる。被検体上のアレーの位置にかかわらず、少なくとも1つのトランスジューサが動脈をおおって常にあることを保証するためにいろいろと異なったトランスジューサのアレーが使用される。しかしながら、圧力計のこの型式は、いくつかの欠点を抱えている。第1に、離散トランスジューサのアレーは、一般に、検知される動脈の上に横たわる被検体の組織の連続輪郭と自動的には両立しない。これは、歴史的に、結果のトランスジューサ信号に不正確さを生じることに立ち至る。更に、或る場合には、この非両立性は、組織外傷及び神経破壊を引き起こすおそれがあり、かつ末梢組織への血流量(blood flow)を制限するおそれがある。
【0008】
他の先行技術は、動脈の上に横に単一圧力測定法センサをより正確に置き、それによってセンサを動脈内の圧力変動により完全に結合することを求めている。しかしながら、このようなシステムは、センサが幾何学的には「心出しされている(centered)がしかし信号結合のためには最適には位置決めされない位置にセンサを置くことがあり、かつ測定の間中の被検体の動きに因って、典型的に、比較的頻繁に再校正又は再位置決めを必要とする。
【0009】
圧力測定法システムは、監視される被検体上の圧力トランスジューサの配向にまた普通極めて敏感である。特に、このようなシステムは、トランスジューサと動脈との間の角関係が「最適」入射角から変動するとき正確性の劣化を示す。これは重要な考慮すべき問題である。というのは、2つの測定がデバイスを動脈に対しておよそ精確に同じ角に置く又は維持するためしはないからである。横センサ位置決めへの前述のアプローチの多くは、手頸表面の湾曲のような、被検体の解剖学的特徴を償うのに適合していない位置決め機構が多くの場合原因で、横位置にかかわらず動脈と一定角関係を維持することができないという同じような難点がある。
【0010】
動脈圧力測定システムの他の重大な欠点は、一般に、動脈壁圧縮のレベルを連続的に監視しかつゼロ経壁圧という最適レベルへ調節することができないというそれらの不能力性である。一般に、動脈壁圧縮の最適化は、周期的再校正によってのみ達成されている。これは被検体監視機能の中断を必要としており、中断は決定的に重要な期間中に起こるおそれがある。この不能力性は、臨床環境での圧力計の受入れを厳しく制限する。
【0011】
圧力測定法アプローチの更に制限は、血管の内部から血管をおおう皮膚の表面上の測定点への不完全圧力パルス転送に関する。特に、動脈圧縮の最適レベルが達成されるときでさえも、血管壁を通して及び組織を通しての動脈血圧の皮膚表面への不完全かつ複雑結合があるので、血管内で起こる圧力変動の大きさが皮膚上に置かれた圧力測定法のセンサ(圧力トランスジューサ)によって測定されたものと異なっているようなことになる。それゆえ、皮膚で測定されたいずれの圧力信号又は圧力波形も動脈内の真圧と必然的に異なる。手頸の動脈壁、組織、筋系(musculature)、腱、骨、皮膚の肉体的応答をモデルすることは、一筋縄で行くものではなくて、各個人毎に本来的に不確定性と異常性を含む。これらの不確定性と異常性は、予期できない誤りを圧力測定法センサを経由して行われた血圧のいずれの測定にも導入する。
【0012】
圧力測定法による圧力測定を校正する1先行技術の方法は、振動測定法デバイス(すなわち、圧力カフ又はこれに類似のもの)を利用して「実」圧情報を周期的に得、この情報は次いで圧力測定法測定を校正するために使用される。このアプローチは、デバイス校正を維持するために、進行中校正事象を、特にカフの膨張/収縮を遂行する必要があるという難点がある。このような校正事象は、注意を散らせ、厄介であり、かつ比較的長い周期性で以てしか実際に遂行することができない。更になお、この技術は、循環系内に起こる実血行力学変化の測定に基づいて校正するのではなく、むしろ実変化の表現であることもないこともある外部測定に基づいている。介在した組織等に因る血管からセンサへの不完全パルス転送に対する補正用機構は、いずれにしても、備わっていない。
【0013】
他の先行技術による校正技術は、測定された血行力学パラメータに対するオフセット又は補正を発生するために、血管内を流れる血液に擾乱を伝送又は誘発し、かつその後、測定されたパラメータ(例えば、血圧波形)中のその信号の成分を検知することを企図している。例えば、ヴァイタル・インサイト社(Vital Insite,Inc.)に讓受された「血圧を決定するために誘発擾乱を測定する装置と方法(Apparaturs and Method for Measuring an Induced Perturbation toDetermine Blood Pressure)」と題する米国特許第5,590,649号(’649特許)を見られたい。’649特許のアプローチの下で、血圧の変化から表向き生じる種々の血行力学パラメータの変化がモデルされかつデバイス内に記憶され、かつ圧力測定法センサから得られたデータと比較される。しかしながら、このアプローチは、校正オフセットが評価される被検体の血行力学パラメータの直接測定によっては決定されないで、血圧と擾乱波速度との間の関係をモデルすることによって決定される。すなわち、速度と位相が血圧の変化と或る種の関係を持つようにモデルされる。したがって、理論上は、擾乱波の速度/位相の観察された変化が評価される被検体内の実血圧の推定を発生するために使用することができる。このシステムの限界は、多くの複雑な、非線形、相互依存パラメータを正確にモデルするばかりでなく、これらの多くのパラメータの時間分散を予測する能力によって明らかに支配される。
【0014】
循環系の血行力学と疾患
血行力学の科学、又は体内を流れる液体(血)流量の分析は、循環系の疾患又は同系内の欠陥を検出し及び/又は診断するために有効に現在使用される。例えば、弁膜疾患、心臓の構造的欠陥、静脈疾患、低下心機能、及び動脈疾患は、いかに血液が循環系の種々の部分を通して流れるか調べることによって査定される。特に注目されるのは、狭窄症(stenosis)(すなわち、動脈斑(artrial plaque)等に因る有効断面積の遮断又は縮小)のような動脈疾患の分析である。生被検体の血管内の狭窄症の程度が変動するに連れて、循環系のパラメータに及び被検体の全面的健康に或る種の変化が起こる。図2に例示したように、仮想血管内狭窄症の変動する程度は、その血管を全体的に比例する程度に閉塞することになる。すなわち、狭窄症がないならば閉塞と付随症状を生じない一方、完全な狭窄症は完全な閉塞を生じ、血管を通して血液は流れず、かつ非常に差し迫った症状が被検体に現れる。それらの間のどこかに入る狭窄症のレベルでは、反応(response)はいくぶんもっと複雑である。例えば、被検体は、所与の血管の有効断面積を非常に顕著に縮小させる狭窄症を患うが、なお運動(exercise)の普通のレベルの下ではなんらかの症状があっても非常に僅かしか現れないことがある。しかしながら、同じ被検体が運動を増すと共に劇的症状を示すことがあり得る。患者が更にそれに励むと、波及を受けた組織はより高い代謝要求を生じてこれが灌流(perfusion)の増大を必要とする。普通、血管拡張(vasodilation)と側副枝化(collateralized)血流量は、より高い容積要求を満たすために容積流量を増す補償機構を用意する。しかしながら、血管は顕著に狭窄しているから、補償機構は普通の無運動要求を満たすために既に利用されている。結果として、身体は容積要求を増すことができない。というのは、血管の狭窄(縮小)面積の抵抗を克服することに関連したエネルギー損失を最小限にする術(way)を持たないからである。容積流量が増えないならば、増大した代謝要求は満たされず、抹消組織は虚血症(ischemic)になる。
【0015】
内圧(P)、及び血質量流量(Q)又は血液速度(v)を有する流体系として狭窄症動脈をモデルすることによって、次のように動脈内の血液の流量を説明するために周知のベルヌーイの式の修正バージョンを応用することができる。
【0016】
【数1】
![]()
それゆえ、前掲の関係は、他が既知のとき、1つの血行力学パラメータを査定するために使用されることがある。例えば、動脈内の狭窄症を横断しての圧力勾配(ΔP)は、狭窄症を通して流れる血液の速度についてデータを得、次いでこの速度データを式(1)内に使用することによって推定される。速度データは、スペクトル・ドップラー超音波(spectral Doppler ultrasound)のような、多くの周知の技術によっても得ることができる。
【0018】
しかしながら、動脈内に存在する狭窄症及び他のこのような疾患の酷しさを査定するに当たってのそれらの有用性にかかわらず、先行技術の血行力学評価技術は、いずれかの所与の時刻に動脈内の絶対血圧を査定することは有効にはできない。理論上、循環系の反応の正確モデルは、(真の動脈圧のような)系内のパラメータの値を他のパラメータの既知の値又は測定された値に基づいて推定するために使用することができる。しかしながら、承知のように、生器官の、特に人間の循環系は、極端に複雑で、誇張なしに数千の相互接続血管を備える。この系は、なかでも、夥しい毛細管、静脈、動脈であって各々がそれら自体の独特の肉体的性質を有するものを含む。更になお、血管の前述のカテゴリの各々内で、個々の要素(constituent)は、著しく異なった性質を有しかつ循環系内で反応する。例えば、人間の身体内の2つの動脈は、(i)それらの長さに沿って異なる点で異なる直径を有し、(ii)他よりも静脈と毛細管に多く又は少なく供給し、(iii)多く又は少なく弾性を有し、及び(iv)それらと関連した狭窄症を多く又は少なく有する。
【0019】
血管の各々の性質と反応はまた、身体内への麻酔薬の導入のような、種々の内部刺激及び/又は外部刺激によって異なって影響されることがある。呼吸のような身体内の普通の自律反応でさえも循環系内の圧力に影響し、したがって、考慮する必要があるといえる。
【0020】
これらの制限を考慮すると、血圧推定に使用するために人間の循環系をその流体力学の面から正確にモデルすることは、不可能ではないにしても、極端に困難になる。たとえ仮説循環系を正確にモデルすることができても、このようなモデルの応用は、各被検体の特定肉体的性質と反応に因り被検体から被検体への顕著な変動性に影響されやすい。それゆえ、このようなアプローチは、最良であっても循環系の挙動の大まかな近似を形成する希望をすることしかできず、したがって、これまでの所、生被検体内の血圧を正確に決定するには有効でないことが判明している。
【0021】
前述に基づいて、必要であるのは、生被検体内の、血圧を含む、血行力学パラメータを査定する改善された方法と装置である。このような方法と装置は、理想的には非侵襲性であることになり、連続的に又はほとんど連続的に自己校正を行うことになり、かつ被検体が意識がある及び麻酔を掛けられているの両方のときのような、種々の異なった被検体生理的環境の下で有効である及び信頼性結果を生じるの両方であることになろう。最後に、このような改善された方法と装置は、査定される各特定被検体から測定されたパラメータに主として基づいていることになり、それによって各個に特有の校正を考慮することになろう。
【0022】
(発明の概要)
本発明は、生被検体内の、血圧を含む、血行力学パラメータを査定する改善された方法と装置によって前述の必要を満足させる。
【0023】
本発明の第1態様では、循環系内血圧を含む血行力学性質を査定する方法が開示される。本方法は、一般に、被検体の血管から第1パラメータを測定するステップ、その血管から第2パラメータを測定するステップ、第2パラメータに基づいて校正関数を導出するステップ、及び校正関数を使用して第1パラメータを補正するステップを含む。いったん校正されると、第2パラメータは連続的に又は周期的に監視され、そのパラメータの変化が注目の血行力学性質の変化を表示するために使用される。第1模範的実施の形態では、第1パラメータは圧力波形を含み、及び第2パラメータは血管内血液の全体流量運動エネルギーを含む。圧力波形の測定の間中、血管と循環系内血行力学性質に変化を誘発するように血管は圧平(圧縮)され、次いで、このような圧平の間中の運動エネルギーが測定され、かつ圧力波形中の1つ以上のアーチファクトを識別するために使用される。次いで、補正関数がこれらのアーチファクトに基づいて発生され、かつ測定された波形に適用されて、血管内の実圧を表す補正された又は校正された波形を発生する。第2模範的実施の形態では、校正関数を導出するために血管内の血流量の最高速度が音響信号を使用して決定される。
【0024】
本発明の第2態様では、1つ以上の測定されたパラメータを使用して、生被検体の血管から得られた圧力信号を校正する改善された方法が開示される。一般に、本方法は、血管から圧力波形を測定すること、血管から少なくとも周期的に第2パラメータを測定すること、第2パラメータに基づいて校正関数を導出すること、及び導出された校正関数を使用して第1パラメータを補正することを含む。1模範的実施の形態では、本方法は、被検体の血管から圧力波形を測定すること、少なくとも1回同じ血管から第2パラメータを測定すること、第2パラメータに基づいて圧力波形中の少なくとも1つのアーチファクトを識別すること、測定された第2パラメータと少なくとも1つのアーチファクトと関連した少なくとも1つの性質とに基づいて校正関数を導出すること、血管内の血圧の校正された表示を発生するために少なくとも1回校正関数を圧力波形に適用すること、及び時間に従う血圧の変動を識別するために第2パラメータを連続的に監視することを含む。
【0025】
本発明の第3態様では、生被検体の循環系の血行力学的反応を特徴表示する改善された方法が開示される。本方法は、一般に、或る種の条件の下で血管と関連した第1パラメータと第2パラメータとの間の第1機能関係を導出するステップ、これらの或る種の条件の下で非侵襲的に第1パラメータと第2パラメータを測定するステップ、測定されたパラメータの少なくとも1つ中の少なくとも1つのアーチファクトを識別するステップ、及び少なくとも第1機能関係と少なくとも1つのアーチファクトに基づいて第1パラメータの測定を拡大縮小するステップを含む。
【0026】
本発明の第4態様では、誤り成分を有する血行力学パラメータ測定を校正する改善された方法が開示される。一般に、本発明は、血管と関連した血行力学パラメータを測定すること、第1パラメータと関連した誤り源を識別すること、誤り源に基づいて校正関数を発生すること、及び校正関数を使用して測定された血行力学パラメータを補正することを含む。1模範的実施の形態では、本方法は、血管から圧力波形を測定すること、呼吸作用に因る時間を通しての血管内の血液の運動エネルギー(又は最高速度)と関連した周期的変動を識別すること、時間を通しての運動エネルギーの変動との同期に基づいて校正関数を発生すること、及び周期的変動に対して波形を補正するために校正関数をその波形に適用することを含む。この呼吸作用は、圧力信号から、及び潜在的には他の信号からも充分に検出可能である。
【0027】
本発明の第5態様では、生被検体の血管内の血行力学性質を測定する改善された装置が開示される。本装置は、一般に、血管と関連した第1血行力学パラメータを測定する第1トランスジューサ、血管と関連した第2血行力学パラメータを測定する第2トランスジューサ、及び第1トランスジューサと第2トランスジューサに動作上接続されて、第2トランスジューサによって生じた信号に基づいて校正関数を発生し、かつ補正関数を第1トランスジューサによって生じた信号に適用する信号プロセッサを含む。1模範的実施の形態では、血管は人間の橈骨動脈を含み、かつ本装置は、それの付近に非侵襲的に配置された圧力トランスジューサ、それの同じく付近にまた配置された音響トランスジューサ、血管を圧平するために使用される圧平デバイス、及び血管の圧平の間中圧力トランスジューサと音響トランスジューサからの信号を処理するプロセッサを含む。音響トランスジューサは、音響発射(acoustic emission)を血管内へ伝送しかつそれからの反響を受信する。次いで、圧平の間中の血液の速度及び/又は運動エネルギーに関する情報が、測定された圧力波形を校正するためにこの波形に印加される。
【0028】
本発明の第6態様では、血行力学の査定、モデリング、及び校正についての前述の方法を実施する改善されたコンピュータ・プログラムが開示される。1模範的実施の形態では、このコンピュータ・プログラムは、C++ソース・コード・リスティングのオブジェクト・コード表現を含み、このオブジェクト・コード表現はマイクロコンピュータ・システムの記憶デバイス上に配置され、かつマイクロコンピュータ・システムのマイクロプロセッサ上でランするように適合している。コンピュータ・プログラスは、マイクロコンピュータのディスプレイと入力デバイスに動作上結合されたグラフィカル・ユーザ・インタフェース(GUI)を更に含む。マイクロコンピュータに供給された測定されたパラメータ・データに基づいて本明細書に説明された血行力学査定、モデリング、及び校正方法論を実施する1つ位上のサブルーチン又はアルゴリズムがプログラムに含まれる。第2模範的実施の形態では、コンピュータ・プログラムは、前述の血行力学測定装置と関連したディジタル信号プロセッサ(DSP)の(埋込みプログラム・メモリのような)記憶デバイス内に配置された命令集合を含む。
【0029】
本発明の第7態様では、前述の方法に従って得られたパラメータ・データを分析するかつ前述のコンピュータ・プログラムを利用する改善された装置が開示される。1模範的実施の形態では、本装置は、プロセッサ、不揮発性記憶デバイス、ランダム・アクセス・モリ、入力デバイス、ディスプレイ・デバイス、及び1つ以上のセンシング・デバイスに動作上結合された直並列データ・ポートを有するマイクロコンピュータを含む。分析下にある被検体から得られたデータは、直列又は並列データ・ポートを経由してマイクロコンピュータに入力される。記憶デバイス上に記憶されたコンピュータ・プログラムのオブジェクト・コード表現は、マイクロコンピュータのランダム・アクセス・メモリ内へロードされ、かつユーザによって入力デバイスを経由して入力されたコマンドと関連して入力データを分析する要求に従ってプロセッサ上で実行される。
【0030】
本発明の第8態様では、前述の方法を使用して被検体に治療を施す改善された方法が開示される。本方法は、一般に、圧力データを測定するために有用な被検体の血管を選択するステップ、非侵襲的に被検体の圧力データを測定するステップ、校正関数を発生するステップ、血管内の血圧の校正された表示を生じるために校正関数を測定された圧力データに適用するステップ、及び校正された推定値に基づいて被検体に治療を施すステップを含む。1模範的実施の形態では、血管は人間の橈骨動脈を含み、かつ本方法は圧力トランスジューサを経由して橈骨動脈から圧力波形を測定すること、少なくとも1つの血行力学パラメータを測定するために音響波を使用すること、測定された血行力学パラメータに少なくとも一部分基づいて校正関数を導出すること、被検体内の1つ以上の医療状態を診断するために有用な血圧の校正された表示を導出するために校正関数を使用して圧力波形を校正すること、及び校正された表示に一部分基づいて被検体に対する治療の行程を用意することを含む。
【0031】
本発明の第9態様では、血管内に配置された管腔(lumen)の改善された検出方法が開示される。本方法は、一般に、血管内へ音響エネルギーを伝送すること、血管内でのエネルギーの伝搬の関数として音響エネルギーの反射の信号レベルを評価すること、及び反射内の低下した信号レベルの少なくとも1つの領域を識別することを含む。1模範的実施の形態では、パワー計量(power metric)がAモード包絡線から導出される。深さの関数として後方散乱パワーの積分がアーチファクト(例えば、「プラトー(plateaus)」)を識別するために利用され、アーチファクトは管腔の深さを検出するために、適当な制約付きで、使用される。第2実施の形態では、後方散乱エネルギー(例えば、Aモード信号)が、それらの中の低下信号レベルの領域を識別するために、事前選択された深さ間隔にわたって遂行されるパワー計算を使用して分析される。
【0032】
本発明の第10態様では、血管の少なくとも1つの壁を検出する方法が開示される。本方法は、一般に、血管内へ音響エネルギーを伝送すること、血管内の管腔と関連した少なくとも1つの領域を検出すること、及び管腔に対する血管の少なくとも1つの壁の位置を検出することを含み、位置を検出することは伝送された音響エネルギーから導出されたAモード・データを分析することを含む。1実施の形態では、壁は、所与の深さでの積分されたパワーを平均管腔パワーと比較することによって検出される。他の実施の形態では、包絡線平方(envelope squared)信号のレベル(振幅)が管腔のそれと比較される。
【0033】
本発明の第11態様では、血管の直径を決定する方法が開示される。本方法は、一般に、血管内へ音響エネルギーを伝送すること、血管内の管腔と関連した領域を検出すること、管腔に対する血管の第1壁の位置を検出すること、管腔に対する血管の第2壁の位置を検出すること、及び第1壁と第2壁の位置に少なくとも一部分基づいて血管の少なくとも部分の直径を決定することを含む。
【0034】
本発明の第12態様では、管腔検出を使用して生被検体と関連した1つ以上の血行力学パラメータを査定する改善された方法が開示される。本方法は、一般に、血管内へ音響エネルギーを伝送すること、血管と関連した管腔領域を検出すること、管腔の検出に基づいて血管と関連した少なくとも1つの壁を検出すること、及び注目の血行力学パラメータを推定するために印加されたストレスの関数として少なくとも1つの壁の位置の変化を分析することを含む。1模範的実施の形態では、本方法は、(管腔を経由して)前動脈壁と後動脈壁を検出するためにAモード信号を分析し、かつ動脈心拡張期血圧を決定するために圧力波形上に圧平圧力の関数として動脈直径の変動をマップすることを含む。
【0035】
本発明の第13態様では、生被検体の組織内の血管位置に関する改善された方法が開示される。本方法は、一般に、音響エネルギーを発生すること、血管の付近の被検体の組織内へ音響エネルギーを伝送すること、血管による後方散乱エネルギーの少なくとも部分を受信すること、後方散乱エネルギーに基づいて血管と関連した少なくとも1つのアーチファクトを検出すること、及び検出されたアーチファクトに少なくとも一部分基づいて血管の位置を決定することを含む。1模範的実施の形態では、血管は人間の橈骨動脈を含み、及び音響エネルギーは被検体の手頸/前腕の内部領域を経由して動脈内へ伝送される超音波エネルギーを含む。動脈壁と管腔から後方散乱されたエネルギーは、超音波トランスジューサによって受信され、かつ動脈に対するそのトランスジューサの位置及び/又は最適位置を識別するために積分されたパワー計量を使用して分析される。
【0036】
他の実施の形態では、積分されたパワー及び/又は信号レベルは、管腔の位置を検出するために組織内深さの関数として分析される。次いで、動脈壁の位置が管腔に対して決定され、それによって、動脈の直径の測定をできるようにする。動脈に対するトランスジューサの位置は壁分離(直径)を最大限にするように調節され、それによって動脈の直上にトランスジューサ(及びいずれかの関連圧平デバイス)を有効に維持する。血管に対していずれか他の所望配向で、例えば、固定オフセットを伴って、血管の直径の関数として変動するオフセットを伴って等、トランスジューサを維持するために、又は信号品質のような他のパラメータ、嚢胞性構成要素(cystic component)又はクラッタ(clutter)、等々の存在に基づいて、トランスジューサの位置を制御するために、アルゴリズムがまた調節されることがある。
【0037】
(発明の詳細な説明)
図面を参照するが、これらの図面を通じて同様の番号は同様の部品を指す。
【0038】
注意するのは、本発明は人間被検体の橈骨動脈(すなわち、手頸)を経由して循環系の血行力学パラメータを査定する方法と装置の面で本明細書に説明されるが、本発明は人体の他の位置でこのようなパラメータを監視するばかりでなく、他の温血種上のこれらのパラメータを監視するためにもまた具体化される又は適合しているといえることである。全てのこのような適合及び代替実施の形態は、本明細書に添付された特許請求の範囲に属すると考えられる。
【0039】
概 観
1基本的態様では、本発明は、生被検体の循環系上に人工的に「ストレス」を誘発することによってその被検体内の血行力学パラメータを査定する方法を含む。これらのストレスに対する循環系の反応は、知られているか又は決定可能であり、かつ観察されたデータで以てアーチファクト又はマーカを識別するのに有効である。これらのマーカは、その後、前述の血行力学パラメータの測定を校正するために使用される。
【0040】
例えば、下により詳細に説明するように、本発明は、人間の橈骨動脈をおおって配置された圧力測定法センサ又は表面圧力センサから得られた血圧波形を校正するのに有効であり、未校正の圧力波形は、橈骨動脈自体内に実際に経験される波形から潜在的に実質的に変動する。1実施の形態では、動脈に加えられた「ストレス」は圧平(すなわち、圧縮)であり、かつ圧平のエリアを通して流れる血液の速度は速度プロファイル中のマーカを識別するために監視される。これらのマーカは、なかでも、動脈壁を横断する近ゼロ経壁圧の状態に相当する。このようにして、真動脈圧の正確測定値が非侵襲的に得られることがある。しかしながら、納得するように、本明細書に説明する本発明は、血管内の2つの位置間の圧力差、静脈壁又は動脈壁のコンプライアンス、心室収縮の強度の変動、等々のような他の血行力学性質を査定するのにまたたやすく使用され、したがって、動脈血圧の測定に限定されない。
【0041】
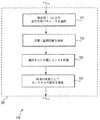
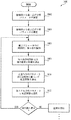
血行力学性質を査定する方法
図3を参照して、本発明に従って循環系内血圧を含む血行力学性質を査定する方法を説明する。図3に示したように、本方法300の第1ステップ302は、被検体の血管から第1パラメータを測定することを含む。本文脈の中では、測定されるパラメータは、本明細書に図3aに関して下に更に詳細に説明するように、被検体の橈骨動脈の付近に配置された圧力センサ又は圧力トランスジューサから導出された血圧波形であることになる。しかしながら、納得するように、先に注意したように他の血行力学パラメータもまた測定される。第1パラメータの測定に黙示されているのは1つ以上の誤り源の存在である。すなわち、パラメータの測定された値は、被検体の循環系に存在するパラメータの実値の完全なる表示ではない、つまり、それと異なっている。動脈血圧の場合には、実値は、侵襲的動脈カテーテル法(invasive aterial catheterization)のA線(A−line)技術又は「ゴールド・スタンダード(gold standard)技術によって測定されることがあるように、動脈自体内に存在する値である。このような誤り又は差の理由は、図3aを参照して下に更に詳細に論じる。
【0042】
次に、図3のステップ304で、ストレスが血管上に誘発され、このことが血管の血行力学性質を(少なくとも局所的に)変更し、それによって血管又は循環系と関連した他のパラメータに全体的に変化を誘発する。図3bに関して論じるように、このストレスは、1実施の形態では、時間の関数として血管を圧平する又は不定に圧縮し、それによって、なかでも、圧平の領域内の血液の質量流量(Q)、速度(v)又は速度勾配、及び運動エネルギー(KE)に変化を誘発する。しかしながら、注意するのは、例えば、動脈断面積に影響する(カフ状デバイスで以て起こるであろうような)環状面閉塞(cercumferential oculsion)、又は動脈のコンプライアンスに影響する被検体内への化学物質の局所化導入のような、類似の又は他の血行力学性質に影響するために、先に説明した圧平ストレス以外のストレッサ(stressors)を被検体に印加することもあることである。多くのこのようなストレッサ/血行力学パラメータ組合わせは、本発明と両立して使用されるといえる。
【0043】
ステップ306で、下のステップ308での校正関数の導出を容易にするために血管と関連した第2パラメータが測定される。本明細書に図3cに関してより詳細に論じるように、第2パラメータは、1実施の形態では、全血流量運動エネルギーを含む。というのは、このパラメータはステップ304におけるストレッサの印加の関数として或る種の容易に識別される「アーチファクト」を示すからである。本明細書に使用されるように、用語「アーチファクト(artifact)」とマーカは、同義に使用され、かつデータ集合内に存在するいずれもの識別可能特徴又は関係を称する。しかしながら、同じ又は他のアーチファクトを示す他のパラメータも、例えば、最高血液速度、最大血管断面積、及び最大血質量流量を含む校正関数を導出するために使用されることがある。
【0044】
図3のステップ308で、次に、校正計量又は校正関数がステップ306で導出されたパラメータ情報に基づいて導出される。特に、1つ以上のアーチファクト又はマーカがパラメータ・データ中で識別され、これらのアーチファクトは上のステップ302の第1パラメータの実値と測定された値との間に或る種の関係が存在するときを表示する。本明細書で図3dを参照して論じるように、校正関数を導出するプロセスの1実施の形態は、印加されたストレッサ(圧平)の領域内の全血流量運動エネルギーを測定し、かつ(血管の断面積のパーセンテージ減少に相関した)圧平の関数として心収縮期速度及び/又は心拡張期速度のプロファイル中の変化を識別する。
【0045】
図3の方法のステップ310では、補正された又は校正された測定を発生するために、ステップ308で導出された校正関数がステップ302の第1パラメータの測定に適用される。第1パラメータが時間の関数として連続的に(又は周期的に)測定されるならば、ステップ308の相関関数は適当であるに従って連続的に又は周期的に適用され、それによって進行様式又は連続様式で第1パラメータの校正された測定を発生することに注意されたい。しかしながら、種々の異なったファクタに因り、実「A線」動脈血圧と必要とされた校正関数の拡大縮小又は大きさの両方は時間の関数として変動することがあり、それゆえ、先に計算された校正関数に基づいたいずれの「校正された」測定も誤りがあることになる。1代替では、ストレッサを再印加(例えば、他の圧平掃引を遂行)し、更新された補正関数を発生し、かつこれを第1パラメータの測定された値に適用することによって、ユーザは簡単に周期的に再校正することもできる。
【0046】
しかしながら、本明細書で下に更に詳細に説明するように、本発明は、都合良く、第1時刻t1に校正関数を発生し、次いで、測定されたパラメータの変動を表示するために第2血行力学パラメータ(例えば、最高速度、最大運動エネルギー、最大面積、又は最大流量)を連続的に監視する能力を備える。これは、更に下で説明するように、真動脈圧と外圧との間に所定関係を確立するように動脈に印加される外圧を制御することによって方法300のステップ312で完遂される。
【0047】
ステップ312で、動脈内で動脈壁を横断する圧力(すなわち、「経壁圧」)を所望値に又は近くに維持するように、動脈に印加される圧力が第1パラメータの選択された値へ制御される。このプロセスは、本明細書では、特定値へ「サーボする(servoing)」と称す。本明細書に図5a〜5dを参照して詳細に論じるように、このサーボすることは圧平のエリアに特定血流量運動エネルギーを発生し、次いで、この運動エネルギーの変化が真動脈圧の変化を識別するために使用される。この「連続校正」は、本発明の望ましい属性である。というのは、被検体の血管を用いた血行力学の連続的正確測定は、特に血圧が被検体の治療における瞬間瞬間の決断の基礎として使用されるような外科又は他の生命治療展開の文脈の中で決定的に重要である。
【0048】
図3aを参照して、生被検体内の1つ以上の血行力学パラメータを測定する(図3のステップ302)方法の1実施の形態を説明する。図3aの方法320の第1ステップ322は、測定用1つ以上の血行力学パラメータを選択することを含む。測定されるパラメータの選択は、被検体の血圧又は動脈に関する狭窄症の酷しさのような、査定される状態のだけでなく、また下のステップ324で選択される監視位置の関数である(すなわち、離散点に肉体的に位置している動脈内の局所化狭窄症の場合のように、或る種のパラメータは或る定まった位置でのみ測定されることがある)。
【0049】
次に、ステップ324で、被検体の体内の血管が監視用に選択される。その立入り易さ(accessibility)及び皮膚の表面に比較的近接していることに因り、人間の橈骨動脈は循環系内の血行力学パラメータを監視するための優れた位置である。もっとも、承知のように人間(又は他の種)上の他の位置もこの目的に使用されることがある。上に注意したように、監視する位置はまた、査定される状態の又は遂行される監視の型式に関係する又はこの型式によって決定されることがある。もちろん、多数の監視位置が、逐次又は並列であろうと、本発明の方法で以て採用される。
【0050】
人間の橈骨動脈に関しては、更に注意するのは、橈骨動脈が糖尿病に因る狭窄症及び石灰化(calcification)を含む動脈疾患によって最小限にしか影響されないと逸話的証拠が示唆していることである。この観測された挙動に対する理由は、この論議の範囲を超えている。しかしながら、この挙動は、図3bに関して本明細書に行われる圧平ストレスについての論議にいくぶん重要である。というのは、内側石灰化(medial calcification)のような事前存在動脈疾患があることは動脈血圧を正確に測定する能力に強い影響を与えるおそれがある。印加ストレスとして制御された圧平を利用する血圧測定を遂行するとき橈骨動脈を選択することによって、ユーザは、事前存在する狭窄症や石灰化に関係する多くの潜在的誤り源から有効に隔離される。
【0051】
次に、図3aのステップ302で、選択されたパラメータを測定又は検知する能力のある1つ以上のパラメータ・センサが選択された血管の付近に配置される。人間の橈骨動脈上の血圧を測定する場合、圧力センサ(トランスジューサ)が、橈骨動脈の真上にあるように、手頸の内側表面上で皮膚と接触して物理的に配置される。トランスジューサは、それの表面に印加された圧力に既知の関係で圧力信号を生じる能力のある良く理解された圧電型、又はその他の型式の1つであってよい。最適信号結合と検知が達成されるというようにトランスジューサを位置決めする方法と装置は、血圧測定技術上また周知であり、したがって、本明細書で更に説明しないことにする。手頸の皮膚と接触している間トランスジューサは、下に横たわる組織/動脈の低又はゼロ圧縮の状態に初期的に維持され、理由は本明細書に更に充分に説明する。
【0052】
ステップ328で、信号が時間の関数としてトランスジューサから測定される。信号は、監視の所望頻度に依存して、離散的に(例えば、所定間隔で)又は連続的に測定されることがある。先に説明した模範的圧力トランスジューサの場合は、連続測定によっての出力信号は、時変(time variant)波形を含むことになる。動脈血圧の場合、波形は、一般に、実「ゴールド・スタンダード」動脈圧を追跡することになるが、心周期(cardiac cycle)の種々の位相に従う圧力変化に伴って変動する誤り又はオフセットをなお含むことになる。この時変的、非線形誤り、つまり測定された圧力波形と実血圧波形との間の「可変誤り」は測定プロセスに追加の複雑性を出現させるが、これは、下に更に詳細に説明するように、本発明がそれを克服するのに特に適合している1つである。
【0053】
図3bを参照して、被検体の循環系に1つ以上のストレスを誘発する(図3のステップ304)方法の1実施の形態を詳細に説明する。方法330の第1ステップ332で、印加されるストレスが選択される。本明細書に使用されるように、用語「ストレス」(又は「ストレッサ」)は、被検体の循環系内に人工的に誘発されるいずれかの肉体的又は生理的変化を称する。本実施の形態では、印加されるストレスは、圧平、つまり時間の関数としての選択された(橈骨)動脈の肉体的圧縮を含む。本明細書に使用された、圧平「掃引」は、一般に、動脈の上に横たわる皮膚の表面に全体的に垂直な方向に動脈へ増大する又は減少する圧力を定常印加することを称する。圧平の概念は、一方の手頸を他方の手の親指と人指し指との間に、親指をその手頸の内側部分の頂上に置いて、その動脈が閉塞されるまで、橈骨動脈上の圧力をゆっくりと増すことによって簡単に例示される。しかしながら、納得するように、一般的な主張(proposition)としては、本明細書に使用される圧平は、(i)時間を通して圧縮を増加又は減少させる連続的線形速度で、(ii)時間を通して圧縮を連続的非線形(例えば、対数関数的に)増加又は減少させる、(iii)不連続的又は区分的連続的線形又は非線形圧縮、(iv)圧縮と弛緩を交互させる、(vi)正弦波関数又は三角関数、又は(vi)(「ランダム・ウォーク」のような)ランダム運動のような、種々の異なった形を取ることがある。全てのこのような形は、用語「圧平」に包含されると考えられる。
【0054】
図4aと4bを参照して、平圧の血行力学的作用を詳細に説明する。直ちに納得するように、人間の橈骨動脈のような動脈400の圧平を増す結果、その動脈の有効断面を減少させる。先に説明した動脈狭窄症に類似して、圧平402は、動脈内の流体面積(flow area)を減少させ、それによって一定容積流を維持するために絞り(restriction)を通して血液速度(v)が上昇する結果となる。この関係は、流体力学技術で良く理解されている。減少する流体面積を横断しての速度のプロファイルは、図4aの速度勾配404によって例示されたように、また充分に変更される。それゆえ、圧平の結果、絞り流体面積を横断して、より高い最高速度、より急な速度勾配、かつより大きなエネルギー又はより急な圧力勾配を生じる。
【0055】
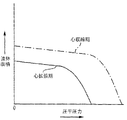
図4bは、動脈の流体面積のパーセント減少の関数としての動脈内のピーク又は最高流速を例示する。全血流量運動エネルギーが同様に面積に関係するのは速度とのその関係に一部分因っているが、もっとも導出するのは下により詳細に説明するように或る程度もっと困難である。現在の議論において簡単化のために、流体面積のパーセント減少は組織(皮膚)表面に印加された圧平圧力に正比例すると想定するが、もっとも実際にはこの関係は下に更に説明するように実質的にもっと複雑であることに注意されたい。更に、図4bは、「定常状態」動作を一般的に例示しており、かつ、下で更に詳細にまた論じる、例えば、正規心周期に因る圧力の変動の影響は調べない。
【0056】
図4bに例示したように、低圧平圧力の領域410では、流体面積のパーセンテージ減少は小さく、かつ流速と勾配への影響は最小限である。容積血流量(Q)は、影響されない。圧平圧力が増大する(領域412)に連れて、流体面積は更に減少させられ、かつ容積流量が維持される間に血液速度、速度勾配、圧力勾配、運動エネルギーは相当して増大し始める。圧平圧力が更に増大するに連れて、流体面積は実質的に減少させられ、速度、速度勾配、血厚勾配、及び運動エネルギーは実質的に上昇、増大する一方、正規代謝要求の下での容積流量を依然維持する。狭窄症動脈では、この領域414は、「亜危険(sub−critical)」狭窄症、すなわち、被検体の過剰容量(excess volumetric capacity)が顕著に減少させられ、一般に、付随症状が少ない又はない狭窄症のレベルに相当する。「亜危険」という名称は、正規代謝要求の下で適当な組織灌流があることで以て無症候性である事実を称する。
【0057】
流体面積が更に減少すると、「危険」領域416として知られている所を通して遷移を生じる。危険領域では、流体面積が非常に減少させられるので高まった流体抵抗を克服するには不充分なエネルギーしかなく、かつ容積流量はもはや維持されない。これらの領域414、416の間で、速度「ピーク」420が形成される。逸話的証拠は、このピーク420が動脈直径の大略50%減少点(流体面積の大略75%減少に相当する)で起こることを示唆する。結果として、狭窄症面積に対して抹消の血液速度、容積流量、及び流量運動エネルギーは、流体面積が更に減少するのと共に急激に低下する。動脈が全く閉塞されかつ流体面積がゼロに接近する(領域418)に連れて、容積流量(Q)は、血液速度と血流運動エネルギーと同じように、ゼロに接近する。
【0058】
図4bを調べることは、1印加ストレスに対する循環系の1反応を特徴表示する面で重要な情報を生じる。特に、圧平の関数としての速度の挙動、かつ最も著しくは速度プロファイル中の最高速度の上昇は、動脈内圧が外部圧平によって動脈の壁に印加された圧力と事実上等しい点の識別をできるようにする。この状態は、本明細書では、「ゼロ経壁圧」の状態と称する。図4aと4bに例示した圧平掃引の間中、動脈壁の外側に印加された外部圧力が動脈内圧によってちょうど相殺される点に到達する。この点に到達するまでは、流体面積に顕著な減少(かつ、先に説明したように、その結果に付随する速度や、速度勾配や、容積流量(Q)や、運動エネルギーの変化)は、起こらない。しかしながら、印加圧力が動脈内圧を超えると、動脈の直径と断面積は減少され始め、最高流速と速度勾配が上昇、急峻化し始める(図4bの領域414)。最高速度(と運動エネルギー)の上昇は、本実施の形態では経壁圧が概略的に平衡する点の「マーカ」として使用される。
【0059】
しかしながら、先に論じたように、循環系は静止系ではなく、むしろ動的でありかつ、正規心周期ばかりでなく、これと(下に論じる)呼吸のような他のファクタの両方に因って、顕著な動脈内圧力揺動(intra−aterial pressure fluctuation)を受ける。それゆえ、血行力学性質を、特に動脈内圧を測定するとき、このような圧力揺動をまた、考慮しなけれならない。
【0060】
図5a〜5dを参照して、前述の動的圧力揺動の下での循環系の反応を説明する。図5aは、人間の正規心洞調律(normal sinus cardiac rhythm)500を例示する。医療技術上周知であるように、この洞調律500中に心臓内の種々の心室機能に相当する心収縮期502と心拡張期504の両方がある。これらは、洞調律500中の、及び動脈内圧の最大値と最小値を事実上表す。
【0061】
図5bは、図5aについて前述した洞調律500の、及び図5cによる動脈に印加された外部圧平圧力の関数としての動脈壁の変位を例示する。2つの対向する動脈壁510、512を明確のために図5bに例示する。もっとも、これらは圧力反応の面では事実上互いに鏡像である。技術上周知であるように、動脈壁は、典型的に(健康な人間では)顕著な弾性(elasticity)と反発性(resiliency)を有する実質的にコンプライアンスな管(vessel)である。それゆえ、管内の圧力を増すと、動脈の対向する壁510、512は、外向きに反れる傾向があって、膨張している風船のように、大いに動脈の直径を増大する。同様に、動脈内圧を減少すると、動脈壁の反発性が直径を減少させる。人間の動脈が、正規心周期の間中或る程度周期的に拡張及び収縮することは周知である。
【0062】
図5bに示したように、動脈内血圧の変動は、動脈の壁を心収縮期圧502に相当する最大直径516へと外側へ向けて反らし、及び動脈壁を心拡張期圧504に相当する最小直径518へと凹ませる(collapse)。動脈の外側に印加された圧平圧力(図5c)が増大するに連れて、ゼロ経壁圧の先に説明した状態に心収縮期圧と心拡張期圧の両方によって逐次到達する。特に圧平圧力を増大するに伴って、心拡張期(より低圧)状態520でのゼロ経壁圧がまず達成され、これに心収縮期(より高圧)状態522でのゼロ経壁圧が続く。圧平圧力をゼロ経壁圧状態を超えて増大する際の、心拡張期状態520をまず考察すると、動脈の有効直径(と流体面積)が漸次減少し始め、その結果、先に説明したように、血流量勾配が急峻になり、ピーク血液速度が上昇し、及び運動エネルギーが増大する。圧平圧力を心拡張期圧の上へ充分に増大するに連れて、動脈は、心周期の心拡張期部分の間中点527でより完全に閉じる。同様に、圧平圧力を増すと、動脈の直径は、心収縮期状態522でまた減少し始めて、動脈が心周期の心拡張期部分527と心収縮期部分529の両方の下で完全に凹むまで、同様の結果を生じる。前述の挙動に基づいて、心拡張期状態520と心収縮期状態522の両方に対して、最高血液速度の変動とパーセント流体面積の減少に関して、2つの曲線を作図することができる(図5d)。心収縮期状態522の速度「ピーク」524は心拡張期状態520に対する相当するピーク526よりも圧平の高いレベルで起こり、それは大きな外圧は後者に反して前者では動脈を凹ませるために印加されなければならないからであることに注意されたい。更に注意するのは図5aの心収縮期最大と最小との間及び心拡張期最大と最小との間にある圧力で、図5dのそれらと類似の曲線の系列を作図することができ、曲線のこのような系列は全心周期の間中に動脈の挙動及び関連した血行力学パラメータを特徴表示するのに有効であることである。
【0063】
図4bの速度曲線で以てのように、図5dの曲線は、心周期の心拡張期部分と心収縮期部分の両方(又はそれらの間の他のいずれもの部分)の間中、ゼロ経壁圧が達成される点を圧平掃引の間中マークするために有用である。この情報の効用と応用は、本明細書に図3d〜3cを参照して詳細に説明する。
【0064】
圧縮ストレス又は圧平ストレスの前述の模範的印加は、なかでも、選択された動脈内血圧の測定に有用であるが、納得するように、ストレスの他の型式を循環系内に反応を誘発するために印加することもある。これらのストレスと関連したアーチファクト又は「マーカ」は、圧平ストレスに対するものと全体的に類似した様式で、すなわち、マーカ又は既知の関係の存在を一般には循環系又は特には血管内の或る種の血行力学状態と相関させることによって、利用することもできる。それゆえ、図3bの方法は、圧縮ストレスの使用に決して限定されない。
【0065】
図3bに再び帰って、ストレスを選択された血管に印加する方法330の第2ステップ334は、このようなストレスを印加することができる機構を用意することを含む。上に説明した圧平の文脈の中で、動脈を圧平する手段として(圧力波形を測定するために使用された)前述の圧力トランスジューサを使用することに特に効用がある。というのは、この配置(arrangement)は測定を精確に圧平の点で行うことをできるようにするからである。この型式の圧平機構は、本明細書に図12に関して説明する。しかしながら、承知のように、分離圧力トランスジューサと圧平機構、又は他の構成(configuration)も本発明と一緒に使用されることがある。
【0066】
図3bのステップ336で、用意された機構は、選択された動脈にストレスを印加するために利用される。圧平の特殊な場合に、圧力の連続的に高まるレベルで圧力トランスジューサが手頸の皮膚に対してアサート(assert)されるというように、先に説明した圧平「掃引」が印加され、それによって下に横たわる動脈を圧縮する。図3aの方法320で以てのように、動脈をおおう圧平デバイスの最適配置と最適配向は、いずれか種々の充分に理解された先行技術を使用して決定することができ、これらの技術は、讓受人の、1999年、6月29日に出願された「動脈血圧の非侵襲的決定方法と装置(Method And Apparatus For The Noninvasive Determination Of Arterial Blood Pressure)」と題する同時係属米国特許出願第09/342,549号、及び2001年3月22日に出願された「血管位置を含む血行力学パラメータの非侵襲的査定方法と装置(Method And Apparatus for the Noninvasive Assessment of Hemodynamic Parameters Including Blood Vessel Location)」と題する米国特許出願第09/815,982号に説明した技術を含み、これらの両方は言及することによってそれらの内容を全面的に本明細書に組み入れてある。しかしながら、注意するのは、前述の方法320は、(例えば、治療個別管理(individual administering treatment)に従う手動による)非最適トランスジューサ配置で以てさえも、このような場合の信号結合が妥当である限り、多分利用されることである。
【0067】
図3cを参照して、校正関数の導出を容易にするために血管と関連した第2血行力学パラメータを測定する(図3のステップ306)方法の1実施の形態を説明する。方法340の第1ステップ342で、測定される第2血行力学パラメータが選択される。このパラメータの選択は、或る点では、測定される第1血行力学パラメータの選択(図3a)ばかりでなく、循環系へのストレスの印加(図3b)に結合されている。先に説明したように血圧測定及び圧縮ストレスの使用(圧平)の文脈の中で、いくつかの「第2」血行力学パラメータは、思うに、血液速度、全血流量運動エネルギー、及び血容積流量ばかりでなく、それのらのいずれかの変形又は組合わせを、これらに限定することなく、含む校正関数を発生するために使用されることがある。全血流量運動エネルギーは、測定するために特に有用な1つのパラメータである。というのは、それがゼロ経壁圧状態又はその他の有用な関係の1つ以上のたやすく観察可能なマーカを含むからである。全血流量運動エネルギーは、或る種の他のパラメータよりもまた誤りを生じることが少ない。というのは、それが全血管を横断して得られた速度情報ばかりでなく、振幅情報を利用するからである。更に、運動エネルギーのピーキング(peaking)は、最最高速度のような他のパラメータのピーキングよりもめざましい。
【0068】
次に、ステップ344で、選択された「第2」パラメータが適当なセンサ又は測定技術を使用して測定される。運動エネルギーの測定又は血液速度の測定の場合、一般にこれらのパラメータを非侵襲的に測定するいくつかの周知の技術が存在する。特に注意するのは、血液速度を測定するために音響エネルギー(例えば、超音波)を使用することである。特に、音響測定技術は、一般に、速度測定上周知のドップラー原理を採用し、血管内を流れる血液によって反射された反響と関連した周波数偏移が血液速度の測定を行うために分析されるようになっている。音響による血液速度測定の多くのいろいろな変形が存在し、これらには連続波(CW)及び音響パルス(パルス・ドップラー)の使用がある。このような技術は、周知かつ充分に理解されており、したがって、更にここでは説明しないことにする。
【0069】
同様に、音響測定技術は、被検体血管内を流れる血液の運動エネルギーの測定を導出するために使用されることがある。注意するのは、圧平の間中血管内に作り出される複雑な血液速度勾配(図4a)の結果、血管内の血液の運動エネルギーの計算は、全体として、上に説明した最高血液速度の平方に単に比例するのではない。むしろ、その運動エネルギーの推定は、この勾配の複雑性を捕らえる加算技術又は積分技術の適用を必要とすることである。血液運動エネルギーを計算するこのような加算技術/積分技術は、技術上周知であり、したがって、本明細書に更に説明しない。
【0070】
他の実施の形態では、所望マーカが示されるに当たっての圧平(外部)圧力は、先に本明細書にその内容を組み入れてある讓受人の同時係属米国特許出願第09/342,549号に説明された時間−周波数方法論を使用して決定されることがある。この時間−周波数方法論を使用して、経壁圧がゼロに等しいに当たっての圧平圧力は、動脈内で反射された音響エネルギーの時間−周波数表示を作図することによって決定することができる。時間−周波数分布が最大限であるとき、ゼロ経壁圧状態が達成される。それゆえ、時間−周波数分布は、本発明の目的のためになお他のマーカとして働く。
【0071】
なお他の実施の形態では、第2血行力学パラメータを監視するためにいわゆる音響「Aモード」が使用されることがある。このアプローチでは、音響波が発生されかつ血管内へ伝送され、伝送からの反射つまり反響が受信されかつ伝送の時刻と受信の時刻との間の関係を決定するために分析される。このような分析を通して、時間上の異なった点、及び心周期内の異なった点での動脈の相対直径を決定することができる。周知の時間領域反射率計(TDR)に類似して、Aモード技術は、1実施の形態では、異なった音響性質の材料間の種々の境界(例えば、「近」動脈壁/組織境界、「近」動脈壁/血流(blood stream)境界、血流/「遠」動脈壁境界、等)を横切る音響波の遷移によって発生された反射を利用する。特に、これらの反射の相対タイミングが種々の境界間の距離を決定するために分析される。異なった媒体を通しての音響波の伝搬速度を知って、反射境界(すなわち、組織厚さ、動脈直径等)を決定することができる。図5bによって、(心周期の心収縮期部分と心拡張期部分の両方の下で)動脈壁の反れが圧平圧力の関数として変動することを思い出すならば、動脈直径(及びこれに関係した面積)の変化は、上昇する最高速度を使用することと類似して、ゼロ経壁圧状態又は重要な他の状態を識別するためにこれらの状態の「マーカ」として使用することもできる。
【0072】
Aモード音響を使用して血行力学パラメータを査定する他の技術もまた採用することができる。このような代替技術は、本明細書に図17〜39に関して更に詳細に論じる。
【0073】
更に納得するように、音響信号技術上周知である「Mモード」(運動モード)と「Bモード」(輝度モード)を含み、他の音響モード性(acousticmodality)も本明細書に説明した本発明と一緒に採用することができる。
【0074】
第2血行力学パラメータ及びそれと関連したマーカを測定する前述の実施の形態の各々での音響波の使用にかかわらず、納得するように、他の非音響技術がこのようなマーカを識別するために応用されることがある。例えば、干渉計法(interferometry)を使用するような、動脈直径/面積を正確に測定する他の方法がゼロ経壁圧状態を識別するために採用されることがある。全てのこのような技術は、本発明の範囲内に入ると考えられる。
【0075】
図3dを参照すると、所望血行力学状態が達成される当たってのストレッサ大きさ(例えば、ゼロ経壁圧が達成されるに当たっての圧平圧力)が実圧つまり真動脈圧に相関させられる。印加されたストレスと血管によって実際に感じられたストレスとの間に高度の結合がある簡単な場合には、測定されたストレスを実ストレスと等しいとすることができる。特に、圧平(圧縮)ストレスが印加されるに当たっての動脈血圧測定の文脈の中で、圧平デバイスによって印加されかつ関連した圧力トランスジューサによって検知された圧力は、アーチファクト状態又は「マーカ」状態が観察されるとき実動脈圧と等しいとすることがきできる。例えば、増大する血液運動エネルギーが先に論じたようにゼロ又は近ゼロ経壁圧の状態に相関するならば、運動エネルギーのこのような増大が観察されたときに動脈壁に印加された圧力は真動脈内圧に等しいであろう。それゆえ、印加点(例えば、皮膚)と動脈壁との間に印加された圧力が非常に高かったならば、印加点に印加された圧力は動脈壁に印加された圧力に近似しているであろう、したがってまた、動脈内圧に近似しているであろう。
【0076】
しかしながら、先に論じたように、動脈壁と圧力トランスジューサとの間に介在した組織、腱、及び皮膚は、多くの場合、トランスジューサ(又は圧平機構)によって印加された圧力と動脈壁によって実際に感じられた圧力との間に複雑な関係を作り出す。簡単に述べると、皮膚に印加された圧力のいくらかは、この介在した材料を圧縮するために使用される。それゆえ、外部的に印加された圧力の部分のみが実際には動脈壁によって感じられる。更に、注意するのは、組織は血管の下及び骨の上にまた存在し、同じくまたこの組織を圧縮するのにいくらかの損失が起こる。
【0077】
したがって、動脈圧の測定が外部的に印加された圧力(例えば、圧力トランスジューサによって測定された圧力)に基づくとき、所与の被検体についてその組織コンプライアンス及び結合の程度に依存して、このような測定に或る量の誤りが導入されることになる。
【0078】
この問題への1先行技術アプローチは、介在した材料の反応を(例えば、線形力定数を有するばねの系として)モデルし、かつ圧力トランスジューサによって測定された圧力をこのモデルに基づいて補正することであった。しかしながら、このアプローチは使用されたモデルほどに良いに過ぎない。異なった組織厚さ値、密度値、及びコンプライアンス値(ばかりでなく腱と骨の互いに対する及び動脈に対する位置)を持つ異なった被検体は異なって反応し、これらの差はこのようなモデルでは償われない。更になお、単一被検体についてさえ、その被検体の組織及び動脈の反応の変化は、時間を通じて起こるか又は外部的に誘発されたストレスの関数として起こることがある。例えば、麻酔薬が被検体の循環系に導入されると、所与の動脈は実質的によりコンプライアンス性のものになり、それによってその反発性の多くを失うことになる。コンプライアンスのこの変化は、実動脈圧と測定された動脈圧との間の関係を変更し、したがって、それに基づくいずれの血圧推定値の正確性をも低下させる。
【0079】
対照的に、本発明の方法論は、この重要な制限を、先行技術におけるように被検体を包括的にモデルするのに反して、各被検体についてその介在した組織と材料の実反応を測定することによって克服する。特に、本発明は、組織と動脈の実圧縮に基づいてこれらの構成要素のコンプライアンスの機能表示を発生する。
【0080】
図3dに例示した方法350の模範的実施の形態では、前述した「Aモード」音響伝送が圧平デバイスと動脈内壁との間に介在した構成要素の各々の圧縮を監視するために使用される。これらの構成要素の圧縮(ステップ352)は、一般に、それら構成要素の個々の材料性質に従って進行するが、これの材料性質は未知かつ相互依存性でありかつしたがってモデルするには甚だ複雑である。しかしながら、これらの構成要素の実圧縮の直接観察を行うことによって、外部的に印加された圧力と動脈壁と動脈内の加圧された流体(血液)との界面に印加された力との間に存在する伝達関数は、各個にかつ圧平される指定位置について近似的に決定することができる。図6に例示したように、動脈の内壁と動脈の上の皮膚の表面との間の領域は、皮膚602、組織604、及び動脈壁606のようないくつかの離散領域に副分割されるといえる。皮膚の表面608と皮膚/組織境界610との間の、皮膚/組織境界と組織/動脈境界612との間の、皮膚/動脈境界と動脈/血液境界614との間の、及び動脈/血液境界614と血液/動脈境界616との間の、それぞれ、距離d1、d2、d3、及びd4は、Aモード音響伝送を使用してステップ354で測定され、この音響伝送は、先に説明したように、これらの境界からの反射を識別する。更に、骨620と腱618との相対位置は、転送損失に大きな影響を及ぼす。事実、腱618と組織622との間、及び骨620と組織622との間にいろいろな種類の回復ばね力が存在する。圧力転送の損失は、これらの回復力を克服することばかりでなく、組織のコンプライアンスと少なくとも部分的に関連している。それゆえ、圧平の間中(及び心周期の特別部分の間中)、動脈直径(及び流体面積)と印加された外圧との間の伝達関数は、ステップ356によって開発される、特に、心周期の心拡張期部分と心収縮期部分に対しては、図7a〜7bに例示したように異なった伝達関数が存在する。(実動脈内圧に対して測定された)低印加圧力では、介在した組織、下に横たわる組織/腱、動脈壁、等の比較的小さな圧縮が起こっており、それゆえ、印加圧力の更に増大は、一般に、これらの構成要素の更なる圧縮に不釣合いに寄与する。印加圧力のより高い値では、介在した構成要素は実質的に圧縮され、かついくらかでも更に増大する圧平圧力の比較的小さい分数は介在したかつ下に横たわる構成要素の圧縮に使用される。それゆえ、一般に、「伝達関数」又は転送された圧力の印加された圧力に対する比は、図7bに例示したように、印加された圧力の関数として増大する。動脈内の加圧された血液とトランスジューサとの間に介在した自由浮動する非圧縮性材料という論理的場合には、伝達分数は1:1であることになり、完全結合を表示する。
【0081】
それで、前述の導出された伝達関数は、圧力検知によって測定された不完全圧力転送に介在組織等によって導入された誤りを、ステップ358によって注目の領域を識別することによって、補正するために利用することができる。例えば、60mmHg(8kPa)の圧力が測定されるとき心周期の心拡張期部分の間中に動脈内ゼロ経壁圧状態が達成されるならば、真心拡張期圧は或るパーセンテージより高いことになり、ここにパーセンテージは圧力転送損失の程度によって決定される。その監視する位置に対する伝達分数は、圧力測定センサの表面に転送される脈管圧(intravascular pressure)の分数又はパーセンテージである。
【0082】
伝達関数及び/又は伝達分数は、測定後に、図12の装置に関して下に更に説明するように、ディジタル・ランダム・メモリ内のルックアップ・テーブルのような、いずれか種々の異なったフォーマットで表示されかつ記憶されることがあることに注意されたい。更に、直ちに承知のように、上に説明した方法350は1つ以上の離散圧力状態(すなわち、心収縮期圧及び/又は心拡張期圧)に対する伝達分数を決定するために使用されるが、伝達分数は圧力の範囲に対してたやすく決定することができ、それによって、下に更に詳細に説明するように、圧力の関数として伝達関数を形成する。それゆえ、被検体の血圧が変動するならば、本発明は、いずれかの圧力範囲内の圧力の測定された値を補正するためにこの伝達関数を利用する。
【0083】
同様に、納得するように、Aモード音響技術以外の伝達関数/伝達分数を決定する方法も、単独で又はAモード技術と一緒に利用されることがある。
【0084】
要するに、図3dの方法350は、被検体に対する印加ストレス(例えば、圧力)と監視される位置に関係したような伝達関数/伝達分数を決定し、かつパラメータの実値を決定するために、指定された「マーカ」点で測定されたパラメータを、伝達関数/伝達分数を使用して校正することを伴う。血圧監視の場合、このプロセスは、運動エネルギー項が増大し始める(又はその代わりに、最高血液速度が上昇し始める、流体面積が減少し始める、又は或る他の所望状態が観察される)に当たっての圧平圧力を印加し、次いで、実動脈内圧を決定するために、伝達分数を使用して、測定された圧力の測定値を補正することを伴う。全心周期にわたって考えるとき、この方法350は、全測定された圧力波形800を真動脈内圧801へ校正するためにこの波形に適用される拡大縮小関数又は「伸縮(stretching)」関数を生じ、それによって図8に示したような「校正された(calibrated)」波形806を生じる。注意するのは、考えられている測定された圧力波形の部分(例えば、心拡張期部分、心収縮期部分、又はそれらの間)に依存して実動脈内圧又はA線(A−line)動脈内圧の測定された圧力に対する比が変動することである。この概念は図8にグラフで例示してあり、そこでは心周期の心収縮期部分での振幅の比R1802は、心拡張期部分出の振幅の比R2804に等しくない。
【0085】
注意を要するのは、或る種の環境及び個々の被検体が図3dに関して説明したような伝達関数の決定と適用を必要とするが、本発明の一般的方法論は或る場合には伝達関数がなくても潜在的に適用されることである。例えば、被検体が皮膚と動脈壁との間に高度の結合を有する場合、皮膚表面に置かれたトランスジューサを経由して測定された圧力に関連した誤りは、全測定の小さな分数を構成するに過ぎず、したがって、或る種の監視環境では許容可能であることになる。それゆえ、伝達関数の計算と適用は、あらゆる環境の下での本発明の要件ではない。
【0086】
図3eを参照して、血行力学パラメータを連続的に校正する方法を説明する。上で図3dを参照して論じたように、伝達関数は、介在した組織、動脈壁等の圧縮に対して測定された圧力波形を補正するために有用である。この伝達関数は、橈骨動脈のような、被検体上の所与の監視位置で遂行される圧平掃引の間中に得られる。しかしながら、被検体の動脈血圧の連続監視をできるようにするためには、測定されたパラメータの変化を正確に監視しかつ校正事象(例えば、圧平掃引)と事象との間で拡大縮小することができる機構が必要である。
【0087】
先に論じたように、先行技術の校正アプローチは、測定された圧力波形を「連続的に校正するために(アスクレトリ(asculatory)カフ測定のような)周期的校正事象に頼った。これらのシステムを参照して使用された用語「連続的に」は、いくぶん不適当な表し方である。というのは、実際に起こるのは拡大縮小関数の(連続的ではなくむしろ)周期的更新だからである。このアプローチは、少なくとも1つの深刻な欠陥を露呈し、それは周期的校正更新と更新との間隔中の校正の欠如である。監視される被検体の活動次第で、それらの真動脈血圧は、短期間に非常に顕著に、或る場合には急速に又はプロンプトする様相で変動することがある。例えば、外科手術の間中、動脈切除のような外科医による行為(action)は、被検体の動脈血圧を含む被検体の循環系に深い影響を及ぼすことがある。同様に、麻酔薬から結果する被検体の体内の動脈の多く内のコンプライアンスの変化に大部分起因して、誘発前(pre−induction)(すなわち、麻酔前)血圧値と誘発後血圧値との間の差は劇的に異なっている。
【0088】
先行技術のアプローチは動脈内に起こる実血行力学性質を決して監視しないから、もし真動脈血圧のこのような重大な変化が周期的校正事象の間に起こるならば、それらは、多くの場合、検出されないままである。むしろ、このような先行技術のアプローチは、血圧を典型的に圧力測定法的に監視し、これらの測定は、潜在的に、実動脈圧と非常に異なっている。先行技術のシステムは、(真血圧に接近していることもあり、ないこともある)圧力測定法による血圧の測定された変化を償うために、典型的に拡大縮小率又は校正を調節する。この方法の結果は、事実は校正されないで、広く変動する拡大縮小成分を含む、いわゆる、「校正された」血圧値を生じることを含む。校正事象と事象との間の実圧つまり真動脈血圧を追跡することのこの失敗は、外科手術の間中のような、血圧の分刻み(minute−to−minute)測定が決定的に重要であるといえる場合に壊滅的であるおそれがある。
【0089】
本発明の方法論は、下に更に詳細に説明するように、第1、つまり、「主(primary)」測定された血行力学パラメータ(例えば、血圧)の変化を追跡するために先に説明した測定された「第2」血行力学パラメータを使用することによって先行技術の前述の重大な限界を克服する。
【0090】
1実施の形態では、図3eの方法370によって例示したように、血液の運動エネルギーが前述の音響(又は他の)技術を使用して監視される一方、ゼロ経壁圧状態(又は重要であると判定された或る他の状態)が動脈内で維持される。特に、図12に関して下に説明する実施の形態ではまた圧力トランスジューサと超音波トランスジューサを含む圧平デバイスが所望圧力状態を維持するようにステップ372で監視される動脈の上の皮膚に対して「サーボ(servo)」され又は連続的に変調される。測定された(未校正の)主パラメータ、ここでは、圧力がステップ374によって同時に時間の関数として監視される。特定応用次第で、ステップ372の変調は、心周期の心拡張期部分の間中、又はこれに代わりその周期の心収縮期部分の間中指定値に経壁圧を維持するように制御されることがある。なお他の代替実施の形態では、圧平デバイスは、(1つ以上の完全な心周期にわたって計算された)平均経壁圧を所定値に維持するように変調され又はサーボされることがある。サーボすることは、所望最高血液速度状態、又は所望最大断面積状態を維持するためにまた実施されることがある。多くの他のこのような「ターゲット」サーボ値で置換しても等しく首尾良く行くことがあり、かつこのような値ばかりでなく(この値が基づいているパラメータ関係(例えば、それを動作させることが望ましい図5dの最高速度対流体面積プロット領域)がユーザのニーズ及び本方法を採用する特定応用によってもっぱら決定される。
【0091】
次に、ステップ376で、第2血行力学パラメータが適切な技術を使用して時間の関数として測定される。本実施の形態では、全運動エネルギー(又は最高血液速度)は、先に説明した型式の音響ドップラー・システムを使用して測定される。
【0092】
ステップ378で、ステップ376で測定された第2パラメータが、主パラメータの変化を識別するために分析される。例えば、圧平デバイスが心周期の心拡張期部分においてゼロ経壁圧を維持するようにサーボされるとき、運動エネルギーの変化は、動脈内血圧の変化を追跡するために使用される。この分析の結果は、圧平デバイスの更に調節が必要とされるかどうか決定するためにステップ380によって所定許容判定基準又は制御判定基準と比較される(ステップ382)。例えば、ステップ378〜382で全血流量運動エネルギーに顕著な増大又は増大の速度が観察され(それによって、動脈壁によって感じられた圧平圧力が真動脈圧を超えていた)としたならば、圧平圧力は、運動エネルギーのより僅かな増大又はその増大の速度の僅かな上昇によって反映される近ゼロ経壁圧状態を維持するように、減少させることができるであろう。納得するように、制御システム技術上周知の型式のファジイ論理又はPIDコントローラを含む、1つ以上の他のパラメータの測定に基づいて1つのパラメータを制御する制御方式のいずれの型式も、所望挙動を成し遂げるために使用することができる。
【0093】
前述にもかかわず、納得するように、図3eの方法を使用する第I血行力学パラメータの連続校正は、例えば、最高血液速度及び/又は動脈断面(流体)面積を含む追加の又は他の第2パラメータを使用して完遂されることがある。
【0094】
また再び注意するのは、先行技術アプローチと対照的に、上に論じた図3〜3eの技術は、都合良く、監視されている被検体の循環系内のパラメータのモデリングも推定も伴わない。全ての情報は、選択された位置での被検体の直接測定を介して導出され、したがって、その個人とその位置に特に適していることである。
【0095】
循環系の血行力学反応を特徴表示する方法
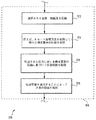
図9を参照して、生被検体の循環系の血行力学反応を特徴表示する方法を開示する。図9に例示したように、方法900の第1ステップ902は、印加ストレスに関係して血管と関連した第1パラメータと第2パラメータとの間の第1機能関係を導出することを含む。動脈血圧測定の文脈の中で、ステップ902で導出された第1機能関係は、本明細書に先に説明したように、動脈断面積(圧平圧力)と全血流量運動エネルギーとの間の関係を含む。もっとも、納得するように、多くのいろいろな異なった機能関係でそれを置換することがある。例えば、最高血液速度と流体面積との間、又は容積血流量(Q)と流体面積との間の機能関係を、所望ならば、使用してよい。
【0096】
次に、ステップ904で、上のステップ902で導出された機能関係中に現れる1つ以上のアーチファクト又はマーカが識別される。先に説明した動脈血圧測定の場合、アーチファクトは、ゼロ経壁圧の状態が心拡張期状態及び/又は心収縮期状態に対して達成された後増大する運動エネルギー又は上昇する血液速度を含む。これらのアーチアクトは、本明細書に図3c〜3eに関して先に説明した校正関数に対する点を含む。これに代わり、Aモード超音波技術又は他の類似の技術によって測定される際に、壁直径が心周期の心収縮期部分又は心拡張期部分で減少し始める点は、ゼロ経壁圧のマーカを構成することがある。
【0097】
次に、ステップ906で、上のステップ902からの機能的に関係したパラメータの1つが印加されたストレスの関数として非侵襲的に測定される。上で参照した例では、この測定は、時間(かつ圧平圧力)の関数として動脈内の血液速度を測定し、かつそれから全流量運動エネルギーを導出することを含むことになる。
【0098】
最後に、ステップ908で、校正「関数」(これは理論上1つほどの数少ないデータ点であることがある)が循環系と関連した選択されたパラメータの測定された反応にステップ904で識別されたアーチファクトに基づいて適用され、それによって、そのパラメータの反応の校正された特性表示を生じる。血圧については、選択されたパラメータは圧力測定法で測定された(すなわち、未校正の)圧力を含み、及び校正された特性表示は、なかでも、血液の運動エネルギーが増大し始める点で決定された校正された(又は「真の」)動脈血圧を含む。
【0099】
更になお、(組織コンプライアンスに原因がある不完全信号転送に因る誤りのような)潜在的誤りの影響が、ステップ908の部分として、また充分に償われることがある。
【0100】
呼吸を含む、周期的誤り源に対する校正方法
図10を参照して、周期的誤り源に対して血行力学測定を校正する方法を開示する。方法1000の第1ステップ1002は、血管と関連した第1血行力学パラメータを測定することを含む。先に説明したように、このパラメータは、動脈血圧、又は微分された圧力のような他の圧力を含むことがある。動脈血圧測定の場合、このパラメータは、圧力測定法の圧力トランスジューサを使用して測定された未校正の圧力波形である。
【0101】
次に、ステップ1004で、第2血行力学パラメータが、先に説明したように、被検体について測定される。この第2血行力学パラメータは、運動エネルギー、最高血液速度、最大動脈直径、最大流体面積等を含むことがある。1実施の形態では、運動エネルギーは、ドップラー超音波を使用して行われる血液速度の測定に基づいて計算される。
【0102】
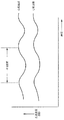
次に、ステップ1006で、第1パラメータと関連した周期的誤り源が第2パラメータ中で識別される。1模範的場合では、図11に例示した、周期的誤り源は、監視されている被検体の呼吸に関係する。図11に示したように、人間の橈骨動脈内を流れる血液の速度と運動エネルギーは、時間と共に変動する周期的成分を含む。この周期的挙動は、被検体の呼吸周期に実質的部分を起因しており、かつ典型的心周期よりも遥かに低い周波数で起こる。それゆえ、正規心周期1102は、周期的呼吸変動1104によって「振幅変調」されると考えることができる。
【0103】
呼吸周期的変動の起源は、横隔膜が上下するに連れて起こる変動する圧力に関係する。吸息と共に、横隔膜は当然下がり、腹腔内圧(intra−abdominal pressure)を上昇させ、かつ胸腔内圧(intra−tholacic pressure)を低下させる。腹腔から右心房への圧力差の増大は、右心房へ帰る容積流量を増大させる。呼気と共に、横隔膜は上がり、腹腔内圧は低下し、かつ胸腔内圧は上昇する。結果は、下肢から腹腔へのより多くの静脈環流であるが、しかし右心房への環流は少なくなる。容積と圧力の巡回変化は循環系全体を通してあらゆる所に反映する。というのは、それが閉じた系であるからである。
【0104】
上述の巡回呼吸変化は、なかでも、心拡張期圧と心収縮期圧に対して変動流速と変動運動エネルギーを生じる。正常成人では、本願の出願人によって得られた逸話的証拠は、このような変動の大きさが酷しい場合で20mmHg(2.7kPa)以上の程度であると示唆する。心収縮期圧と心拡張期圧の分数又はパーセンテージを取り挙げると、圧力のこの変動は、被検体が外科手術の間中のような特に歩行困難であるときに測定された低目の心拡張期圧に対して重大である。
【0105】
これらの変動は、本発明において、必要とされるとき、第2パラメータ(例えば、速度、運動エネギー、又は面積)の測定からの校正関数の導出に同期させることによって償われる。特に、方法1000のステップ1008で、呼吸変動の周期性が分析され、決定され、かつこの情報が校正関数の導出を周期(「搬送」)呼吸波形上の共通点に同期させるために使用される。呼吸成分とその周期性の識別は、信号処理技術上周知の多くのアルゴリズムのいずれか1つを使用して完遂される。したがって、このようなアルゴリズムは、本明細書に更に説明しないことにする。注意するのは、被検体の呼吸速度及び/又は呼吸の「深さ」は時間と共に変動するということができ、それによって動脈内の圧力変動/流量変動の周期性と大きさに影響するから、呼吸作用の周期性を連続的に(又は少なくとも頻繁に)計算するべきことである。
【0106】
次に、ステップ1010で、校正関数がステップ1008の結果によって規定された周期性で行われた第2パラメータの測定に基づいて開発される。例えば、一連の血液速度測定は7秒目毎に行われ(各測定は呼吸波形上の同じ相対点であるが、しかし時間的に変位した点に対応する)、かつこの情報は図3〜3eを参照して本明細書に先に説明した運動エネルギー値及び校正関数又は「伸縮」関数を導出するために使用される。
【0107】
最後に、ステップ1012で、ステップ1010の伸縮関数がステップ1002の測定された(すなわち、未校正の)波形に適用される。呼吸波形に対する類似の点で第2パラメータを測定することの効用で、全呼吸周期を横断しての呼吸の作用は償われることに注意されたい。それゆえ、導出された伸縮関数は、第2パラメータが実際に測定された時点に対応する波形の部分にのみ適用されるのとは対立的に、全未校正の圧力波形)に適用されるといえることに注意されたい。圧力転送が呼吸に伴う心収縮期圧変動の回りで、及び呼吸に伴う心拡張期圧変動の回りで比較的線形であると想定すると、他の補正は必要ないことになる。非線形性が充分に顕著ならば、呼吸周期の異なった位相で補正率(correction factor)を計算することによって、追加補正を適用することができる。これは、真動脈血圧の(周期的によるのとは対立的に)連続的に校正された表示を用意することの重要な利点を表す。
【0108】
納得するように、前述の論議は呼吸系作用に因る周期的誤りの面で行われているが、周期的又は非周期的な、他の型式の誤りも、図10に例示したような本発明の方法論を使用して、償うことができる。例えば、被検体の心臓内不整脈(arrhythmia)の作用は、校正関数の導出の間中に識別しかつ償うことができる。被検体の心臓内不整脈は、波形内の非周期的成分を識別する目的に特に適合した信号処理アルゴリズムを使用して識別することができ、このようなアルゴリズムは信号処理技術の当業者に周知である。非周期成分誤りの多くの他の型式もまた図10の方法と関連して識別することができる。
【0109】
血行力学査定装置
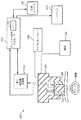
図12を参照して、生被検体の血管内血行力学性質を測定する装置を説明する。例示した実施の形態では、その装置は、人間の橈骨動脈内血圧の測定に適合している。もっとも、納得するように、他の血行力学パラメータ、他の監視サイト、及び生器官の他の型式も、本発明の最も広い意味で本発明と一緒に利用されることがある。図12の装置1200は、基本的に、圧力測定法によって橈骨動脈から血圧を測定する圧力トランスジューサ1202、その動脈上の圧平(圧縮)の程度を変動させるためにトランスジューサ1202に結合された圧平デバイス1204、音響発射が血液速度(と運動エネルギー)を作り出すために使用され、これらの音響発射とそれの反射を発生する音響トランスジューサ1206、圧力トランスジューサ1202、音響トランスジューサ1206によって発生された信号を分析しかつそれらの信号に基づいて校正関数を発生するためにこれらのトランスジューサに動作上接続された信号プロセッサ1208、動脈内への伝送用音響信号を発生しかつ音響トランスジューサ1206から信号を受信する信号発生器/受信器1210、及び動脈に印加される圧平圧力の程度を制御するために圧平デバイス1204と信号プロセッサ1208に動作上接続されたコントローラ1211を含む。
【0110】
圧力トランスジューサ1202は、本実施の形態では、圧電トランスジューサ素子であって、その検知面1212に印加された圧力に関数関係にある(例えば、比例した)電気信号を発生する。同様に、音響トランスジューサ1206は、圧電(セラミック)デバイスを含み、このデバイスはモードに依存して音響波及び/又はパルスを発生しかつこれらを受信する能力がある。例示の実施の形態では、音響トランスジューサ1206は、8MHzに中心を置いた超音波周波数を発生するように同調させられる。もっとも、変動帯域幅を持つ他の中心周波数を使用してもよい。信号発生器/受信器1210は電気信号又は電気パルスを発生し、これらは音響トランスジューサ1206に供給されかつ血管内へ放射される音響エネルギーに変換される。この音響エネルギーは、動脈内を流れる血液を含む動脈内の種々の構造物ばかりでなく、動脈の付近の組織及び他の肉体上の構成要素によって反射される。これらの音響反射(反響)は、音響トランスジューサ1206によって受信されかつ電気信号に変換され、電気信号は、次いで、信号発生器/受信器1210によって(例えば、ADCを使用して)ディジル形式に変換され、分析のために信号プロセッサ1208に送られる。採用された音響分析の型式とモードに依存して、信号プロセッサ1208は、受信された信号を分析するために(埋め込まれた又は外部記憶デバイスに記憶されたのどちらかの)そのプログラムを利用する。例えば、そのシステムが最高血液速度を測定するために使用されるならば、受信された反響は、なかでも、ドップラー周波数偏移について分析される。これに代わり、動脈直径(面積)が測定されるならば、前述のAモードに適当な分析が採用される。
【0111】
校正「掃引」の間中、コントローラ1211は、所定プロファイルに従って動脈(と介在した組織)を圧平するように圧平デバイスを制御する。この掃引の間中、音響信号は、組織の進行中の圧平に直接近接する領域内へ、好適には、動脈内へ伝送されかつこれから受信される。速度データ、運動エネルギー・データ、及び/又は動脈直径データは、受信された反響から抽出及び/又は導出され、かつ心周期の選択された部分に対する圧平圧力の関数として記録される。信号プロセッサ1208及び関連したアルゴリズムは、1つ以上のマーカを識別し、かつ連続監視が測定されたマーカに基づいて起こるに当たっての所望印加圧力を決定する。例えば、図4bに示した最高速度中のピークがマーカとして選択されたとしたならば、アルゴリズムは、このピークを識別しかつこのピークに相当する圧力データを識別することになるであろう。続く血圧監視の間中、コントローラ1211は、ターゲット圧力又はプログラマ/ユーザによって選択されたいずれかの値を維持するように圧平デバイス1204(本実施の形態では、圧力トランスジューサ1202)の位置をサーボすることになるであろう。測定されるパラメータ(例えば、全血液流運動エネルギー)のその後の変化は動脈内の実血圧の変化を識別するために使用され、それによって一連の校正掃引を引き続き行う必要を回避する。
【0112】
オプショナルに、装置1200は、信号源とセンサとの間に介在した組織及び他の肉体的構成要素の伝達関数を測定するようにまた構成される。上に図7に関して説明したように、動脈内の血液と圧力センサとの間にエネルギーの不完全転送又は分数転送がある。この問題点(issue)に取り組むために、図12の装置1200は、圧平されたときの動脈直径とその付近の肉体的構成要素の相対圧縮に関するAモード分析又は他の技術から得られたデータを利用する伝達関数アルゴリズム(図示してない)を含む。それゆえ、校正掃引の間中、装置1200は、変動する圧平圧力の関数として動脈と構成要素の相対圧縮を決定する伝達関数アルゴリズムによって使用されるAモード・データ又は他の匹敵するデータを記憶する。伝達関数(例えば、圧平圧力の関数としての動脈直径の変化)は、そのアルゴリズムによって発生され、かつルックアップ・テーブル又は数学関数のような、多くの異なった有様で記憶される。校正掃引に続いて、装置1200が識別されたマーカから導出された所望印加圧力にサーボするに連れて、補正が測定された圧力に伝達関数に基づいて課せられる。例えば、システムが圧力トランスジューサ1202によって測定された60mmHg(19.8kPa)の心拡張期圧へサーボしつつあるならば、動脈内の圧力の真値は、伝達関数に従って60mmHg(19.8kPa)よりもいくらか高い値へ補正される。
【0113】
図13を参照して、図12の血行力学パラメータを査定する装置の1特別実施の形態を説明する。図13の実施の形態では、装置1300は内蔵ユニットを含み、このユニットは組合わせ圧力トランスジューサ1302と圧平デバイス1304、音響トランスジューサ1306、(ファジイ論理アルゴリズムのような)制御マイクロ・コードを備えたマイクロコントローラ1308、埋込みメモリ1312と命令集合(校正ルックアップ・テーブルを含む)を備えたディジタル信号プロセッサ(DSP)1310、信号発生器と受信器ユニット1314、記憶デバイス1316、ディスプレイ・デバイス1318、及び電源1320を有する。この実施の形態では、マイクロコントローラ1308は、初期圧平「掃引」が遂行されるように、組合わせ圧力トランスジューサ1302/圧平デバイス1304の動作を制御するために使用される。特に、圧力トランスジューサ1302は、橈骨動脈をおおって、被検体の手頸の内側皮膚と連絡して置かれ、かつ図13に例示したようにあるべき場所に固定される。橈骨動脈から未校正の血圧測定が開始され、その直ぐ後でマイクロコントローラ1308は圧平機構1304に指令してトランスジューサ1304を被検体の手頸に対して押し圧すると共に圧力を増させ、それによってその下に横たわる動脈を圧平させる。動脈が圧平されるに連れて、音響トランスジューサ1306は、動脈をおおう皮膚と連絡するようにまた押し付けられ、かつ信号発生器1314は一連の音響パルスを発生し、これらのパルスは皮膚を通して動脈内へ伝送される。動脈の圧平が続くに連れて、信号発生器/受信器ユニット1314は、動脈内の血液及び他の構成要素から音響トランスジューサ1306を経由して反響を受信し、かつ受信された反響に関係する出力信号を発生する。この出力信号は、処理され、かつ次いで、DSP又は類似の処理エンジンによるその後の分析のためにディジタル化される。同様に、圧力トランスジューサ1302の出力信号は、ディジタル化され、かつDSPに入力される。ディジタル化された信号は、次いでDSP内の埋込みプログラムを使用して分析され、このプログラムは本明細書に後に説明するコンピュータ・プログラムの機械コード表現である。ディジタル信号プロセッサの出力は、補正された圧力波形であって、これが、次いで、ユーザに表示されるためにディスプレイ・デバイス1318に(使用されたデバイスの型式次第でディジタル形式でかアナログ形式でかいずれにせよ)供給される。オプショナルに、DSPの出力は、記憶デバイス1316内の1つ以上の記憶位置に記憶される及び/又は外部デバイスへ出力される。
【0114】
注意するのは、本明細書に説明した装置1200、1300は、種々の異なった構成要素を使用して、種々の構成に組み立てられることがあり、かつ種々の異なった血行力学パラメータを測定することがあることである。模範的な制御、信号発生/処理、及び圧平の機構及び回路は、先に本明細書にその内容を組み入れてある、讓受人の「動脈血圧の非侵襲的決定方法と装置(Method And Appratus For The Noninvasive Determination Of Arterial Blood Pressure)」と題する同時係属米国特許出願第09/342,549号に説明されている。
【0115】
コンピュータ・プログラムと関連装置
血行力学査定、モデリング、及び校正の前述した方法を実施するコンピュータ・プログラムを説明する。1模範的実施の形態では、そのコンピュータ・プログラムは、図3〜3e、9、及び10の方法論を、個々に又はそれらの組合わせのどちらかで実施するC++ソース・コード・リスティングのオブジェクト(「機械」)コード表現を含む。C++言語が本実施の形態に使用されるが、承知のように、例えば、VisualBasicTM、Fortran、及びC+を含む、他のプログラミング言語も使用されることもある。ソース・コード・リスティングのオブジェクト・コード表現は、図14a〜bに例示したように、コンパイルされかつコンピュータ技術上周知の型式の媒体記憶デバイス上に配置される。このような媒体記憶デバイスには、光ディスクやCD・ROMや磁気フロッピー(R)・ディスクや「ハード」ドライブや磁気バブル・メモリさえもが、これらに限定することなく、ある。コンピュータ・プログラムは、プログラミング技術上周知の型式のグラフィカル・ユーザ・インタフェース(GUI)を更に含み、これは(図15に関して下に説明するように)ホスト・コンピュータ又はプログラムがその上でランされる装置のディスプレイと入力デバイスに動作上結合される。
【0116】
全体構造の面で、プログラムは、1実施の形態では、ホスト・コンピュータに供給された測定されたパラメータに基づいて本明細書に説明した血行力学査定、モデリング、及び校正方法論を実施する一連のサブルーチン又はアルゴリズムで構成される。第2実施の形態では、コンピュータ・プログラムは、図12又は13の前述した血行力学測定装置と関連したディジタル信号プロセッサ(DSP)又はマイクロプロセッサの、埋込み記憶デバイス、すなわち、プログラム・メモリ内に配置されたアセンブリ言語/マイクロコード化命令集合を含む。
【0117】
本明細書に開示したようにパラメータ・データを分析しかつ血行力学パラメータの校正された値を発生する能力のある装置の1実施の形態を説明する。コンピューティング・デバイス1500はマザーボード1501を含み、このマザーボードは中央処理ユニット(CPU)1502、ランダム・アクセス・メモリ(RAM)1504、及び(直接メモリ・アクセス・コントローラのような)メモリ・コントローラ1505を有する。(ハード・ディスク・ドライブ又はCD−ROMのような)記憶デバイス1506、(キーボード又はマウスのような)入力デバイス1507、及び(CRT、プラズマ、TFTディスプレイのような)ディスプレイ・デバイス1508ばかりでなく、ホスト構成要素と周辺構成要素の動作を支援するために必要なバスがまた備わる。直列又は並列入出力ポート1511が、装置1500へのかつこれからのデータ及び/又は制御信号の転送のためにまた含まれる。
【0118】
血行力学パラメータを査定するために有効な上述のコンピュータ・プログラムは、パラメータ査定の間中にCPU1502によって使用されるためにRAM1504及び/又は記憶デバイス1506に機械読取り可能オブジェクト・コード表現の形で記憶される。ユーザ(図示してない)は、システム・オペレーションの間中にプログラム・ディスプレイと入力デバイス1507を経由してコンピュータ・プログラムと関連測定機器用1つ以上の機能モードを選択することによって注目の血行力学パラメータを査定する。特に、動脈血圧測定の場合、ユーザは、被検体の選択された血管上に必要なパラメータ・センサを置き、かつ連続的又は所定の間隔でのいずれかでそれらのセンサによって出力されたデータを受け取るようにコンピュータ・プログラムを構成する。コンピュータ・プログラムは、信号が装置1500に供給されるならば、先に説明した分析を遂行し、かつ校正された信号をディスプレイ・デバイス上に、又はシステム自体のディスプレイ上に表示されるように発生する。ルックアップ・テーブル又は類似の機構が、図12を参照して先に説明したように、校正を容易にするためにコンピュータ・メモリ・デバイス又は記憶デバイス内に記憶される。プログラムによって発生されたこのような校正された測定は、後の検索のために記憶デバイス1506にオプショナルにまた記憶されるか、又は所望ならば、直列又は並列ポート1512を経由して、プリンタ、データ記憶ユニット、その他の周辺構成要素のような外部デバイスへ出力される。更になお、装置1500は、ネットワーク・インタフェース・カード(network interface card; NIC)又は類似のインタフェース(図示してない)を経由して他のコンピューティング・デバイス又はデータベースにネットワークされることがあり、このことによって装置1600によって発生されたデータは遠隔で分析又は記憶されることがある。このような遠隔デバイスへの伝送は、ローカル・エリア・ネットワーク(LAN)や、イントラネットや、インターネットや、光ファイバ・システムや、ラジオ周波数(無線)デバイスのような種々の周知の方法を使用して完遂されるといえる。
【0119】
なお他の実施の形態では、装置は、(パーソナル・ディジタル・アシスタント、つまりPDAのような)パーソナル・コンピューティング・デバイスを含み、このデバイスは圧力センサと音響センサから入力データを受信しかつそのデータを分析して血圧の校正された測定を生じるために適合している。また納得するように、ラップ・トップコンピュータ、計算器、及びパーソナル・オーガナイザのような他のポータブル・デバイスも本発明のコンピュータ・プログラムをランさせるように構成することもできる。更になお、入力センサ・データをこれらのデバイスに伝送する種々の異なった方法を使用することもでき、これにはネットワークされたコンピュータ、又は無線データ・リンクがある。
【0120】
治療を施す方法
図16を参照して、血行力学パラメータを査定する前述の方法を使用して被検体に治療を施す方法を開示する。図16に例示したように、方法1600の第1ステップ1602は未校正の血行力学パラメータを非侵襲的に監視することを含む。血圧の場合、橈骨動脈に適用される模範的圧力トランスジューサは、本明細書に図3aに関して説明したように使用される。
【0121】
次に、図16のステップ1604で、ストレスが血管上に誘発され、血管はその血行力学性質を(少なくとも局所的に)変更し、それによって、全体的に血管又は循環系と関連した他のパラメータに変化を誘発する。本明細書に図3bに関して先に論じたように、このストレスは、1実施の形態では、血管を圧平する、つまり時間の関数として可変的に圧縮することを含み、それによってなかでも、圧平の領域で血液の容積流量(Q)、速度(v)、及び運動エネルギー(KE)に変化を誘発する。しかしながら、再び注意するのは、思うに他のストレッサも印加され、これらが同様の又は他の血行力学性質に影響することがあることである。
【0122】
次に、ステップ1606で、血管と関連した第2パラメータが下のステップ1608での校正関数の導出を容易にするために測定される。本明細書に図3cに関して論じたように、第2パラメータは、1実施の形態では、全血流量運動エネルギー又は最高血液速度を含む。というのは、これらのパラメータは、ステップ1604でのストレッサの印加の関数として或る種の容易に識別される「アーチファクト」を示すからである。しかしながら、同じ又は他のアーチファクトを示す他のパラメータも、校正関数を導出するために使用されることがある。
【0123】
図16のステップ1608で、校正計量又は校正関数がステップ1606で導出されたパラメータ情報に基づいて次に導出される。特に、1つ以上のアーチファクト又はマーカがパラメータ・データ中で識別され、これらのアーチファクトは上のステップ1602の第1パラメータの実値と測定された値との間に或る種の関係が存在するときを表示する。本明細書に図3〜3eを参照して論じたように、校正関数を導出するプロセスの1実施の形態は、(i)印加されたストレッサ(圧平)のエリアに近接する運動エネルギーの又は最高血液速度のプロファイルを測定し、かつ(血管の断面積のパーセンテージ減少に相関した)圧平の関数としてこれらのプロファイル中の速度を上昇させる又は運動エネルギーを増大させる領域を識別すること、及び(ii)圧力測定の領域内の組織と他の肉体的構成要素について伝達関数を測定することを含む。
【0124】
図16の方法のステップ1610で、ステップ1608で導出された校正関数は、補正された又は校正された測定を発生するためにステップ1602の第1パラメータの測定に適用される。第1パラメータが時間の関数として連続的に(又は周期的に)測定されるならば、ステップ1608の補正関数が適当であるに従って連続的に又は周期的に適用されるか、又はこれに代わり第2血行力学パラメータが校正関数の変化を表示するために(先に説明した圧力サーボする間中になど)監視されることに注意されたい。
【0125】
最後に、ステップ1612で、第1パラメータの校正された測定が被検体に治療を施す基礎として使用される。例えば、血圧測定の場合、校正された心収縮期血圧値と心拡張期血圧値が発生されかつ表示されるか、そうでなければ、外科手術の間中のような実時間に、保険管理プロバイダー(health care provider)に提供される。これに代わり、このような校正された測定が延長期間にわたって収集されかつ被検体の循環系の状態又は反応における長期傾向について分析されることがある。
【0126】
代替(後方散乱)実施の形態
先に論じたように、(「Aモード」超音波エネルギーのような)後方散乱音響エネルギーは、例えば、動脈直径と終末心拡張期血圧を含む血行力学パラメータを決定するために使用されることがある。本明細書に使用されるように、用語「Aモード」は、通例のAモード(すなわち、繰り返し線を経由する振幅対深さ(時間)表示)及びMモード(すなわち、時間次元にわたって分布したグレースケール画像)とBモード(すなわち、深さ(時間)対幅を表示する「ステアード(steered)」グレースケール画像)のような他の関連モード性の両方を含み、このような代替モード性は超音波技術における当業者に周知である。それゆえ、納得するように、次の議論はAモードの面で行われるが、他の関連モード性もまた充分に採用されることがある。
【0127】
図17〜37は、本発明に従って血行力学パラメータを測定する方法と装置のなお他の実施の形態を例示する。この実施の形態は、Aモード超音波エネルギーを使用して、その結果生じる反射されたエネルギーの波形の分析に基づいて動脈壁位置を決定し、壁位置は検知した圧力波形中の「マーカ」又はアーチファクトの識別を援助するために使用され、マーカ又はアーチファクトは血圧測定に相関している。本実施の形態のAモード超音波エネルギーは、都合良く、本明細書に先に説明したドップラー・スペクトル・モード性を相補するが、所望ならば単独でもまた使用されてよく、それによってシステム設計者と装置の最終エンド・ユーザの両方に設計と操作の両面で大いに強化された柔軟性を与える。特に、本発明によって少なくとも3つの異なった動作方式が企図され、それは、(i)Aモード単独、(ii)ドップラー・ベースト検出単独、及び(iii)Aモードとドップラー・モード性を一緒にした組合わせ、を含む。必要とするのではないが、(iii)におけるような相補モード性は、器械で以て得られた結果の信頼性と堅牢性を、都合良く、強化する。
【0128】
血管がますます圧縮される(圧平)に従って、種々のこのような血行力学的マーカが検知された圧力波形中に起こることが本願の讓受人によって観察されている。1態様では、波形の終末心拡張期部分中に或る種の「フラット・スポット」が起こり、そこでは時間の関数としての検知された圧力の変化が低い(又は、少なくとも、波形の周囲部分より低い)。これらのフラット・スポットは、血管を取り囲む組織及び血管自体内の種々の現象に相関し、これらの現象は血管の壁と関連したフープ(hoop)ストレスを克服することを含む。本明細書に先に論じたように、人間の橈骨動脈のような実質的に円筒中空体と関連したフープ・ストレスは、更なる圧縮に対して逆力(retarding force)として作用する。換言すると、有限力(つまり所与の面積にわたる圧力)を血管の断面積が顕著に変形する前に血管の外面に印加しなければならない。変形のこの点を超えると、血管を更に変形させるためには比例する小さな追加力が必要とされる。それゆえ、いったん克服されると、フープ・ストレス成分は有効に除去され、それによって、外部的に血管壁に印加された圧力が血管内を流れる加圧された管腔(例えば、血液)と平衡することができて、血管の断面を本質的に一定に(ゼロ経壁圧に)維持する。この状態は、いったんフープ・ストレスが克服されると、血管内圧が、事実、動脈壁を横断して直接伝送されるという点で重要である。しかしながら、このような平坦化(すなわち、ゼロ経壁圧)状態がその上に存在する圧平プロファイルに沿う点は、個から個で、種から種で、及び単独の個については位置から位置で、変動することになる。したがって、所望経壁圧状態が存在する圧力波形上の点を正確に孤立させるには、追加の技術が必要とされる。
【0129】
(下に更に詳細に説明する)1つのこのような技術は、評価される血管の前壁と後壁を検出することであり、この情報は血管の直径の減少を直接決定するために使用される。先に示したように、血管直径の減少は或る種の心収縮期条件と心拡張期条件に直接関係させることができ、かつ前述の血行力学マーカの或る種の生起と相関させることができる。
【0130】
管腔と壁検出
本発明の方法論は、都合良く、血管の管腔、及び前壁と後壁の位置を検出するためにAモード超音波エネルギーを採用する。本明細書に使用されるように、用語「前(front)」と「後(back)」は、特別な空間的配向(orientation)の意味を含むのではなく、超音波源から発射された移動する超音波の波頭が直接伝搬の間中に血管の壁と出合う順序を単に称する。それゆえ、1つのトランスジューサの配向で血行力学性質を測定するとき「前」壁であるといえるものが他のトランスジューサの配向で「後」壁になることがある。本発明に特有なのは、前壁と後壁の検出の手段としての管腔検出のまた使用である。すなわち、他の血管構成要素に比較して管腔による超音波エネルギーの比較的低い後方散乱に因り、管腔の位置は後方散乱のエネルギーから容易に識別されることがあり、かつ前血管壁と後血管壁はこれに対して識別される。
【0131】
図17は、本発明に従って管腔検出と壁検出に後方散乱超音波エネルギーを使用する一般的方法論を例示する。超音波エネルギーは装置(例えば、図12のシステム1200の超音波トランスジューサ1206)によって発生され、かつ被検体の皮膚を通してその下に横たわる組織内へ直接伝送され、かつ最終的に注目の血管を通る(ステップ1702)。本文脈の中で、用語「組織」は、検査される血管の付近に存在する全ての構成要素、いずれもの介在した皮膚、筋肉、骨、静脈ばかりでなく、血管(例えば、動脈)壁及び管腔自体を含む意味に取られる。次に、信号処理がその後の管腔検出と壁検出を援助するために受信された後方散乱エネルギーに遂行される(ステップ1704)。
【0132】
次いで、処理された信号が、その中で管腔の位置を検出するためにステップ1706で分析される。特に、処理された後方散乱エネルギー信号は、評価される種/年齢範囲での考察下の血管の深さと両立する深さの範囲内での後方散乱エネルギーの「最小」の生起を識別するために分析される。この最小の位置は、評価される血管内に存在する管腔と一致すると想定される。
【0133】
次に、1つ又は両血管壁が分析の開始点としてステップ1706で検出された管腔を使用してステップ1708で検出される。前血管壁と後血管壁と関連した信号は、動脈内管腔の識別された位置から前方へかつ後向へ探索することによって検出される。後方向での(トランスジューサへ向けての)探索と関連した後方散乱エネルギーが(下に詳細に説明する)規定された量又は率だけ平均管腔パワー又は血液信号の推定されたレベルを超えるというように、1つ以上の判定基準を満足させるとき、前壁が検出され、かつ線に沿う信号の位置が前壁の位置として解釈される。同様に、前への探索と関連した反射エネルギーが関連後壁判定基準を満足させるとき、後壁が検出されかつ線に沿う信号の位置が後壁の位置として解釈される。壁検出のための種々の方法論を図29aと29bを参照して下に説明する。
【0134】
図17aに示したように、図のAモード管腔及び壁検出アプローチと関連した信号処理(ステップ1704)の1実施の形態は、「生(raw)」後方散乱Aモード信号をベースバンド化(bssebanding)(直角復調)し(ステップ1720)、ベースバンド化されたAモード信号を平方し(ステップ1722)、それによって「包絡線平方」データを生じ、かつステップ1724によって所定サンプリング・レート(例えば、2MHz)にデシメートする。次に、深さ依存利得(例えば、TGC)がステップ1726によって包絡線平方データに適用されて、伝搬損失に対して調節する。これらの信号処理ステップは、次のパラグラフで更に詳細に説明する。
【0135】
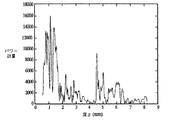
図18は、本明細書で「生(raw)」Aモード・データと称する生(living)被検体の橈骨動脈と関連したAモード信号振幅対時間のプロットである。注意するのは、図18の時間軸は組織を通しての超音波の伝搬速度に基づいて深さに変換されていることである。この変換が遂行されるのは、深さは本発明の目的のために時間よりも容易に解釈されるからである。もっとも、納得するように、時間(又は時間スケールのような他の表現)も等しく使用されて巧く行く。
【0136】
図18に明示した1つの重要な特徴は、深さの関数としてのAモード信号のレベル又は振幅である。図18に例示したように、この例では約1.5mmから3.35mmの明白な範囲があり、そこでは信号レベルが極めて低い。この低い信号振幅は、検査下の血管内を流れる血液(管腔)と関連したエネルギーの低後方散乱に由来する。
【0137】
更に、この例に使用された16MHz中心周波数は、図18に明白に描かれている。中心周波数は動脈壁の位置に関連する情報を輸送しないから、信号処理の第1ステップは、中心周波数を除去することである。このプロセスは、図17aにステップ1720として識別された、直角復調(又は包絡線検波)として表される。図18の模範的Aモード信号と関連した包絡線検出された信号を図19に示す。
【0138】
本実施の形態に使用された直角復調は、一般に、Aモード信号に正弦関数と余弦関数を乗算すること、及び低域通過フィルタリングを含む。直角復調の目的は、伝送搬送周波数の除去を通して、Aモード信号をベースバンド化することである。この方法を一般的に図20に例示する。図20に示したように、直角復調は、受信された後方散乱「生」Aモード信号に複素指数関数exp(−2πfct)を乗算することからなり、ここにfcは信号の伝送中心周波数を表す(ステップ2004)。これは、複素指数関数とAモード信号の和周波数と差周波数を表す一連の値を生じる。次に、その結果生じる信号を低域通過フィルタして(ステップ2006)差(ベースバンド)周波数成分のみを保持する。指数関数は複素数であるから、それぞれ、IとQで指定される同相チャネルと直角相チャネルの両方を生じる。このプロセスを図21にグラフで描いてある。
【0139】
例示の実施の形態では、正弦波の周波数は、Aモード信号の中心周波数fcに相当する16MHzである。正弦波のサンプリング間隔は、64MHzの実効レートでサンプリングされるディジタル化Aモード信号のそれに等しい。正弦波と余弦波による乗算は、次のようである。
【0140】
【数2】

ここにa(nT)はサンプリング間隔T=1/Fsを持つ「生」Aモード信号を表し、かつFsはサンリング・レート(例えば、64MHz)を表す。この乗算は、Aモード線の全持続時間に遂行される。同相成分と直角相成分、XI(nTD)とXQ(nTD)は、それぞれ、Ycos(nT)、Ysin(nT)を低域通フィルタすることによって得られる。ここに、TDは、デジメートされたサンプリング間隔を表す。
【0142】
低域通過フィルタリング(図20のステップ2006)は、例示の実施の形態では、37係数からなる有限インパルス応答(FIR)フィルタで以て完遂される。フィルタは、80%帯域幅を持つAモード・トランスジューサに相当する6MHzの通過帯域遮断を備えて設計される。これは、サンプリングにおいて4分の1倍だけのデシメーションをするようになっている。すなわち、フィルタ出力は、16MHz(=TD)のレートで生成される。周波数応答を図22に示す。この模範的低域通過フィルタと関連した係数を図23に示す。
【0143】
例示の場合、フィルタ出力は、64MHzの実効レートでサンプリングされる元の「生」Aモード信号と比較して、都合良く、約16MHzのレートでサンプリングされるだけで済むことに注意されたい。
【0144】
本発明の本実施の形態では、先に説明した複素包絡線の大きさは、後の処理に必要とされる唯一の成分である。もっとも、処理済みの又は未処理のAモード信号の他の成分も、所望ならば、他の目的に使用される。複素包絡線の大きさを得ることは、低域通過フィルタされた結果の平方の和の平方根を取ることを必要とする。すなわち、結果は複素数であるから、その大きさは、式4に示したように、平方同相成分と平方直角成分との和の平方根に等しい。
【0145】
【数3】
しかしながら、包絡線の大きさを計算するのではなく、続く信号処理は、本明細書に「包絡線平方」と称する、非平方根(non−square−rooted)信号に適用されることがある。この後者のアプローチは、平方根演算を遂行する必要を軽減し、それによって結果のアルゴリズム実施をいくらか簡単化する。包絡線平方波形を図24に示す。
【0147】
包絡線平方Esq(nTD)は、同相成分と直角成分から導出される。これは、式5に記述したように計算される。
【0148】
【数4】
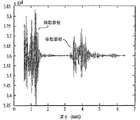
動脈壁の内部の管腔と関連した信号のレベルをより良く査定するために、(10を底とする)対数が図25に示したように得られる。管腔と関連した信号2502のレベルは、動脈壁からの後方散乱と関連した信号2504より大略30dB下にあることに注意されたい。
【0150】
しかしながら、納得するように、或る種の応用では、管腔検出方法論がAモード信号の絶対値にもっぱら基づいていたとしたならば、「偽」管腔検出が起こるかもしれない。例えば、絶対値のみに基づく管腔検出判定基準は、管腔がない所に管腔があると又は逆にそれが実在している所にないと誤って検出するかもしれない。このような偽検出は、例えば、トランスジューサと血管との間に介在した組織(静脈、筋肉等)からの後方散乱と反射、測定中の被検体の動き、等々を含む種々のファクタから起こるおそれがある。それゆえ、下に更に詳細に説明するように、本発明の方法論は、いずれか所与の管腔検出の真実性を確認するために管腔によって生じた信号アーチファクトに近い信号アーチファクトを更に検査し、かつ管腔とこれに隣接する管壁の両方の位置を正確に検出する。
【0151】
非線形深さ依存利得(図17aのステップ1726)が音響Aモード信号が皮膚、組織、及び血管を通して伝搬するに連れてのその信号の減衰を償うために包絡線にまた適用される。この深さ依存利得は、しばしば時間利得補償(Time Gain Compensation)、つまりTGCと呼ばれ、かつ深さは先に説明したようにこの応用では陰に関係しいる。利得に関する式は、下の式6によって与えられる。
【0152】
【数5】
![]()
ここに、深さはミリメートルで表されると想定し、かつ利得は包絡線平方に適用される。しかしながら、納得するように、他の利得関数も所によっては又は上の式6のそれと一致してのどちらかでたやすく適用されることがある。このような利得関数は、臨床試験を通してのように実験的に決定されるか、又は数学的誘導、又はAモード信号の又はこれに関する他のパラメータの逸話的や歴史的サンプリングのような他の手段を介して決定されることがある。
【0154】
利得関数のAモード信号の包絡線平方への適用は、図26に描いてある。図26で、実曲線2602はTGCを適用されたAモード信号に相当するのに対して、破曲線2604はTGCなしでのAモード信号に相当することに注意されたい。
【0155】
更に納得するように、前述の議論は直角復調、包絡線平方計算、及びフィルタリングの面で行われているが、他の型式の信号処理技術及び条件調整技術も本発明と両立して採用されることがある。
【0156】
信号処理の完了した後、図17の方法1700の次のステップ1706は、選択された血管(例えば、動脈)内の管腔を各Aモード線について検出する。1模範的実施の形態では、管腔は図27aの一般的方法論(以下「プラトー(plateau)法」)に従ってステップ1706で検出される。図27aに例示したように、管腔検出のプラトー法2700は、一般に、深さの関数としてパワー計量をまず決定する(ステップ2702)を含み、パワー計量は前述の包絡線平方関数に基づいている。図27bは、単一Aモード線についての深さの関数としての後方散乱パワーを例示する。
【0157】
次に、パワー計量が下の式7に従って積分される。すなわち、
【0158】
【数6】
![]()
ここに、Pint(k)は包絡線平方列のk番サンプルまで積分されたパワーを表し、及びP(k)は包絡線平方列のk番サンプルを表す。
【0160】
プラトー法2700の第2ステップ2704は、管腔内血液からの弱い後方散乱と関連したプラトーの最良推定値を識別することからなる。このステップ2704の部分として、積分されたパワー関数が、図27cに描いたように、単位へまず正規化される(ステップ2706)。次に、ステップ2708で、ゼロから単位までの範囲が所与の数の間隔(例えば、本実施の形態では、80等間隔、すなわち、0.0125の間隔、それであるから第1間隔は0から0.0125、第2間隔は0.0125から0.0250、等々のよう)に分割される。納得するように、他の数の間隔、及び事実、(対数関数のような関数によって決定されるもののような)非等間隔も、所望ならば、また充分に使用される。
【0161】
次に、プラトーがステップ2710によって検出される。まず、正規化されたパワーの各間隔内に起こるサンプルの数が計算される(ステップ2712)。この計算の背後の根本理由は、例えば、血液からの後方散乱に相当して、パワーが低いとき、1つの積分から次へと交差するように多くの値を積分しなければならないことである。それゆえ、多くのサンプルを含む間隔はプラトー(及び管腔)を表示する。図27aの例示の実施の形態では、3つの連続する間隔に含まれた点の数からなる試験が適用される(ステップ2714)ので、計量は下の式(8)に示すようになる。
【0162】
【数7】
ここに、Mcnt(k)はk番間隔で終わる3つの連続する間隔内のカウントの和を表し、及びm(n)はn番間隔内のサンプルの数を表す。この計量は、橈骨動脈の或る1つの横掃引の間のAモード線数50について図27dに示してある。間隔番号60より上の間隔内の比較的大きいピーク2730に注意されたい。これらは深い深さで起こる低パワーに一般に相当していて、しばしば管腔の偽検出を生じる。
【0164】
深い深さの方の低パワーに因るプラトーが偽管腔検出をトリガしないことを保証するために、追加項が前掲の計量に加えられた。特に、計量は、3つの連続する間隔に後動脈壁に相当する低カウントを持つ間隔を続けなければならいという要件を含む。それゆえ、修正された計量は、式9によって与えられる。
【0165】
【数8】
カウントm(k+2)、すなわち、3つの連続間隔のグループに先んじる2つの間隔が式9に含まれていることに注意されたい。単一Aモード線に対するこの計量のプロットは、本例の正規化され積分されたパワーについて図27eに示してある。
【0167】
ピークの検出の結果、管腔に相当する公算の最も大きいそれら3つの連続する間隔の識別が行われる。ピークに相当するそれら3つの間隔に先立つ全ての間隔内のサンプルの合計カウントは、管腔の深さを識別する。しかしながら、1模範的実施の形態では、その後の動脈壁探索の目的のために管腔と関連したAモード線内のサンプル点が第1間隔からそれら3つの連続する間隔内の第1間隔までの(かつこれを含む)全ての間隔内のサンプルの合計数から導出される。それゆえ、所与のAモード線についての管腔と関連したサンプルは、式10によって推定される。
【0168】
【数9】
ここに、Lは管腔面積に先立つサンプルの数を表し、及びKは3つの連続する間隔のうちのピークが検出された第3間隔に対する「ポインタ」を表す。
【0170】
更に、管腔パワーの平均の推定値がそれら3つの連続する間隔の1つ以上に含まれたパワーから導出されることがある(ステップ2716)。例えば、1模範的アプローチでは、それら3つの連続する間隔の第2間隔に相当する包絡線平方のサンプル値を単に平均することによって、平均管腔パワーがこの第2間隔から決定される。管腔後方散乱パワーのこの推定値は、下に更に詳細に説明するように、動脈壁を検出するために検出された管腔の推定された位置と関連してその後使用される。
【0171】
注意するのは、積分されたパワー・プロファイル中のプラトーは他の源からも生じることである。特に、人間橈骨動脈の場合、このようなプラトーは、圧平デバイスと注目の血管との間に位置した1つ以上の静脈の存在によって、又は嚢胞(cyst)や他の成長物の存在によって、また誘発されることがあることである。より普通であるが、静脈に因るプラトーは動脈の圧縮と関連した注目の「真」プラトーと比較して一般に極めて小さく、これは比較的的小さい静脈直径(と壁厚さ)に大部分因っている。更に、本発明の方法論は、比較的薄い壁の静脈を凹ませるために必要なレベルよりも上の圧平圧力で血管直径(及び積分された後方散乱パワー)の測定を実施することによってこの問題点を有効に克服する。静脈のこのような凹みは、大きな血管(例えば、橈骨動脈)の直径に重大に影響するために必要な圧力の充分下の圧力で一般に起こり、それによって、静脈に因る潜在的「偽」プラトーの問題に対する洗練された解決を用意する。
【0172】
静脈と対照的に、嚢胞又は成長関連のアーチファクトは、その母集団の非常に小さな分数部分にのみ一般に起こり、かつトランスジューサを動脈をおおう他の位置に再配置するとそれらから起こるいかなる作用も除去する程度に、しばしば空間的に局所化されている。更に、嚢胞性区(cystic area)は、相当するパルス圧又はパルス圧に関係した運動成分を持っておらず、それゆえ当業者に周知の多くの信号処理技術を使用してたやすく識別しかつ選別する(screen)ことができる。
【0173】
第2実施の形態では、図17のステップ1706での管腔の検出は、以下に「間隔法」と称する、Aモード線に沿う所定距離(例えば、1mm)内の平均パワーを計算することによって、完遂される。伝搬速度が1500m/sかつ式11から導出されると想定すると、1mm間隔は、1.33μsのAモード線に沿う時間間隔に相当する。
【0174】
【数10】
![]()
D=深さ、
c=伝搬の速度
t=伝搬の時間
【0175】
式11中の2なる係数は、双方向音響波伝搬を勘定に入れる。先に説明した16MHzのサンプリング・レートに対しては、1.33μsは、デサンプルド(de−sampled)Aモード線に沿う約22サンプルに相当する。
【0176】
パワー計算用1mm間隔は、例示の実施の形態では、検査下の血管(例えば、橈骨動脈)の直径が成人母集団の本質的に全てで1mmを超えるという、本願の讓受人による観察に基づいて選択されている。それゆえ、パワー計算は、管腔にのみ寄与する信号を構成するように合理的に保証される。しかしながら、納得するように、この間隔は、非成人母集団の測定、他の血管の使用、及び/又は他の種についてのその技術の使用のようなファクタに基づいて調節されることがある。また注意するのは、上に挙げた1mm間隔は、また都合良く、Aモード信号パワーの推定値について平均するサンプルの「合理的」数を提供する。
【0177】
16MHzのサンプリング・レートに対しては、前述の1mm間隔は、1.33μs、又は約22サンプルに相当する。時刻nTDでのパワーの推定値P1mm(nTD)は、式12に従って計算される。すなわち、
【0178】
【数11】
TGCで補正されたAモード・データの線に沿う1mm間隔内の音響パワーの模範的プロットは、図28aに描いてある。
【0180】
橈骨動脈の内部の管腔(例えば、血液)の位置は、1mm平均パワー計算における第1最小として検出される。この最小に対する探索は、Aモード線に沿う所定点(例えば、1mm)で開始し、かつ本例示では7mmに選択された第2所定深さまで続く。1mmから7mmのこの範囲は、橈骨動脈の前壁(すなわち、トランスジューサから放射された音響エネルギーが最初に出会う壁)が成人母集団の本質的に全てにおいてこの間隔内に起こるという観察に基づいて選択された。また注意するのは、前述の最小は図28aのプロット内で明確に区別可能であり、それによって、都合良く、良品質(すなわち、低雑音レベルと低他のアーチファクト)のAモード信号での容易な検出を見込む。電子信号内の最小の検出は、電子技術上周知の多くの技術によって完遂されるといえ、したがって、本明細書には説明しない。
【0181】
図28bは、前述の「間隔」法を使用する管腔検出をグラフで例示する。図28bに例示したように、管腔検出は、事前選択された深さで、本場合は1mmで動脈壁の探索を開始することを含む(ステップ2802)。最小パワーは、深さ=1mmに対するパワーで初期化される。次に、最大指定深さ(前述の例では、7mm)に対する関係がステップ2804によって決定される。最大深さを超えたならば、最小は検出されなかったのであり、かつ探索はステップ2805で終結され(かつオプショナルに再開始される)。最大指定深さをステップ2804で超えていなかったならば、次のパワー・サンプルがステップ2806によって分析される。最小値未満であるならば、最小が現在深さのサンプルと関連したパワー・レベルPにリセットされ、かつカウントがゼロにリセットされる(ステップ2808)。逆に、次のパワー・サンプルが現在最小以上であるならば、カウントは1だけ増分され(ステップ2810)、かつ整数のカウントが所定カウント制限パラメータ(例示の実施の形態では5)に対するその関係を決定するために分析される(ステップ2812)。現在カウントがカウント制限パラメータを超えるならば、第1最小が現在深さで検出されたと想定され、かつ探索は終結される(ステップ2814)。検出されないならば、ステップ2804から2814が適用可能であるに従って再び繰り返される。
【0182】
前述の手順の間中、管腔からの後方散乱Esq(blood)と関連したAモード信号は、管腔の領域がいったん識別されたならば、容易に識別することができる。推定値は、管腔が検出された深さに中心を置く範囲にわたる包絡線平方のサンプルの単なる平均として計算される。平均は、式13の模範的関係に従って計算される。
【0183】
【数12】
ここにNbloodは、血液検出の深さに相当する包絡線平方の指標を表す。式13で、平均は包絡線平方の15サンプルにわたって計算されることに注意されい。もっとも、納得するように、特定応用次第で他の値で置換されることもある。
【0185】
例えば、プラトー法又は間隔法のどちらかを使用して管腔が検出された後、前動脈壁と後動脈壁が検出され、かつそれらの空間位置(すなわち、センサ・ユニットに対する深さ)が推定される。特に、前動脈壁は、センサ・ユニットと検出された管腔の深さとの間、特にAモード信号が管腔と関連した積分されたパワー又は信号レベルへ低下する所の付近に一般に起こると想定される。この想定は、血管の管腔が壁に直ぐ隣接している(すなわち、トランスジューサに関して壁の遠い方の側上)にあるという知識に基礎を置いている。同様に、後動脈壁は、管腔信号の深さよりも深い深さかつ、積分されたパワー・レベル又は信号レベルが管腔と関連したレベルの上へ鋭く立ち上がる所の付近で一般に起こると想定される。動脈の前壁と後壁に相当するAモードの積分されたパワー・レベル又は信号レベルのこれらの変化は、例えば、TGC・Aモード・データに容易に観測可能である。
【0186】
第1模範的実施の形態(図29a)では、壁検出の方法は、(i)動脈壁に対する探索をそこから開始する管腔内の検出された位置、及び(ii)上の図27aに関して説明した検出しきい値をそこから導出する平均管腔パワーの推定値を利用する。Aモード線に沿う管腔の検出された位置は、後壁に対する探索の開始として役立つ。この位置から開始して(ステップ2902)、積分されたパワーは、Aモード信号の包絡線の平方の連続するサンプルを加算することによって計算される(ステップ2904)。定式化は、式14によって与えられる。
【0187】
【数13】
ここに、PbkはサンプルKstで開始してサンプルmまで後壁の方向における積分されたパワーを表し、及びP(k)はAモード信号の包絡線の平方のk番サンプルを表す。Pbk(m)が規定しきい値を超えるとき、後壁が検出されたと想定されかつ相当するサンプル値mは後壁の深さを表す(ステップ2906)。Aモード線に沿うサンプル数と深さは関係していることに注意されたい。実深さは、式15に示したようにサンプル数から導出される。
【0189】
【数14】
ここに、cは伝搬の速度を表し、Nsampはサンプル数を表し、及びFsは包絡線平方列と関連したサンプリング・レートを表す。
【0191】
前壁は、後壁とほとんど同じ仕方で検出される。後壁に対し使用された同じ位置から開始して、積分されたパワーは、前壁の方向にAモード信号の包絡線の平方の連続するサンプルを加算することによって計算される。それゆえ、サンプルは、サンプルKstから降順に取られる。積分されたパワーが規定しきい値を超えるとき、前壁が検出されたと想定されかつ相当するサンプル値は前壁の深さを決定する。
【0192】
図29aの実施の形態では、前述の管腔平均パワーの500倍に等しい前壁しきい値、及び管腔平均パワーの50倍に等しい後壁しきい値が利用される。これらの値は、本願の讓受人によって指定深さ依存利得(例えば、TGC)を用いて実験的に決定された。しかしながら、納得するように、他のしきい値及び他の型式の判定基準も使用されることがある。例えば、他のパラメータ(例えば、管腔内のクラッタ又は介在した組織内の減衰)の関数として変動する値を有する可変しきい値で置換される。更になお、納得するように、前壁のしきい値と後壁のしきい値の間の関係は、所定関係を考慮に入れることも入れないこともある、例えば、前壁しきい値は後壁しきい値の関数として決定されるか、又はこれに代わりそれから完全に独立である。他の変形も可能である。例えば、下のスコア付け(scoring)と加重についての議論を見られたい。
【0193】
更になお、処理を容易にするために、信号処理技術上周知であるように、Aモード線の線間平均が管腔検出と壁検出に先立って遂行されることがある。この技術は、管腔検出及び動脈壁深さ推定の両面で、システムの性能と堅牢性を改善するために使用することができる。
【0194】
動脈壁を検出する方法の実施の形態(図29b)では、包絡線平方の振幅Esq(nTD)が血液からの後方散乱Esq(blood)と関連した推定された信号レベルと比較される。これは、先に説明した積分パワー計算アプローチと明確に区別される。前のように、前壁に対する探索は、トランスジューサ素子への方向、すなわち、深さを減らす方向である。包絡線平方アーチファクトの振幅が指定された判定基準を満たす(例えば、推定された信号レベルを超える)とき、この振幅は前壁からの後方散乱に寄与する。この生起の深さは、前壁の位置であると指定され、所望ならば、オプショナル後続の確認プロセスに付される。これに代わりに(又は同時に)、包絡線平方変量の振幅に関係する以外の判定規準が採用されることがあることに注意されたい。
【0195】
後壁に対する探索は、前壁について説明したのと類似の仕方で遂行される。特に、探索は、検出された管腔の深さで開始されるが、しかし深さを増す(すなわち、超音波トランスジューサから遠ざかる)方向に進行する。前壁の場合のように、包絡線平方の振幅が指定された判定基準を超える、満たすとき、この振幅は後壁からの後方散乱に寄与する。この生起の深さは、後壁の位置であると想定される。
【0196】
したがって、Aモード・データが「合理的な」品質のものであるとき、簡単な探索アルゴリズムが前壁と後壁とに関連した位置を識別するために信号レベル(包絡線平方)方法論と一緒に使用される。特に、図29bに例示したように、方法2950は、管腔信号が検出された深さから出発して(ステップ2952)、管腔の信号レベルを(i)トランスジューサへの方向と、(ii)トランスジューサから遠ざかる方向の両方でAモード信号レベルと第1比較することを含む。信号レベルは、選択された方向で測定される(ステップ2954)。信号レベルが1つ以上の所定判定規準(例えば、上の(i)又は(ii)の信号レベルが管腔と関連した信号レベルの「n」倍ほどである)を満たすことが発見されるとき、信号は動脈壁に相当すると想定される(ステップ2956)。トランスジューサの方へのAモード線に沿う点であってこの判定規準がそこで満たされる点は前動脈壁の位置として表され、及び同様に、トランスジューサから遠ざかる方へのAモード線に沿う点であってこの判定規準がそこで満たされる点は後動脈壁の位置として表される。これは、図30にグラフで描いてあって、平均パワー計算3002とAモード包絡線3008内に存在する前壁アーチファクト、後壁アーチファクト3004、3006との間の関係を例示する。
【0197】
包絡線平方を計算し、指定された間隔(例えば、1mm)での相当する平均パワーと管腔信号を決定し、かつ前動脈壁と後動脈壁を検出するプロセスは、本実施の形態では、Aモード「一線一線(line−by−line)」式で遂行される。5000線からなる模範的Aモード・データ集合に対してこの仕方で決定された動脈壁位置を図31に示す。しかしながら、このような一線一線分析は、例えば、1つの線の部分、又は多数の線のグループ化(連続的であろうとそうでなかろと)、又は線平均のような他の分析的アプローチ又は増分で置換されることがある。
【0198】
いったん相対的壁位置が決定されると、血管の直径は、後壁と前壁の深さの差を取ることによって簡単に決定されるといえる。例えば、後壁が3.5mmの深さで起こり、かつ前壁が1.5mmの深さで起こるならば、血管の直径は、(3.5mm−1.5mm)=2.0mmで推定することができる。この決定は、1実施の形態では、本明細書に先に説明したように導出される平滑化された壁位置推定値(すなわち、他の信号処理技術を使用して平滑化のために数学的に平均されるもの)を使用して行われる。
【0199】
納得するように、壁検出の前述の模範的方法論(例えば、積分パワーと包絡線平方信号レベル)は血管の前壁と後壁の面で説明されたが、前壁又は後壁の検出アプローチは、別々に及び/又は孤立して応用されることがある。例えば、評価される或る種の被検体(又は或る共通の特性を有する被検体のグループ)について前壁アーチファクトが特に弱い、又はそうでなければ非信頼性であることが決定されるならば、後壁検出が補償上より実質的に加重される。同様に、検査下の血管内のクラッタが顕著であるならば、より多く影響された壁が加重の面で選択的にデエンファシスされる(de−emphasized)。他のこのような修正も特定応用次第でまた採用されることがある。
【0200】
更に、納得するように、積分されたパワーしきい値アプローチ及び包絡線信号レベル・アプローチは、単独で又は組合わせで使用されることがあり、又は他の方法(例えば、信号処理技術上周知の型式の、いわゆる「ボックスカー(boxcar)」平均)が採用されることがある。例えば、包絡線平均信号レベルと積分されたパワーの並列計算が遂行され、かつ計算された値が応用可能のしきい値判定基準(例えば、ぞれぞれ、4倍管腔信号レベル、及び500倍平均管腔パワー)と比較される。次いで、これらの比較の結果は、システム及び/又はユーザが後に使用することができる「信頼(confidence)レベル」計量の計算によるような、壁検出における相対的な信頼性(reliability)又は信頼(confidence)を決定するために使用される。積分されたパワー・アプローチ及び包絡線平方アプローチの両方に対する壁検出スコアが高いならば、結果の信頼計量は高い。壁検出のスコアが1つの技術に対して高くかつ他に対して低いならば、信頼計量の値は減少させられ、かつその後の確認処理が表示される。
【0201】
更になお、納得するように、全体として壁検出の文脈の中で、信号処理技術上知られたスコア付けと加重の種々の形式が前述の判定基準を置換して、又はこれと一緒に使用されることがある。このような技術は、都合良く、実臨床使用下でのシステムの堅牢性を増す。例えば、1代替実施の形態では、離散値(例えば、信号レベルの場合には4倍推定値信号レベル、又は積分アプローチの場合には500倍平均管腔パワー)を満たす又は超える包絡線平方パワー値又は積分されたパワー値を有するAモード信号は、「1.0」のスコアを割り当てられる。この離散値よりも低い値を有する信号は、窓関数w(x)に対するそれらの関係に基づいてスコアを割り当てられるので、所定しきい値(例えば、2倍の推定された信号レベル、又は250倍平均管腔)の下にある値は0.0のスコアを与えられ、及び所定しきい値と設計された判定基準との間の値は関数w(x)に従って0.0と1.0の間のスコアを割り当てられるというようになる。
【0202】
なお他の代替実施の形態では、所与のAモード測定と関連した包絡線平方パワー値又は積分されたパワー値は、その間隔中にサンプリングされたデータの品質に関係している或る外因性又は内因性「品質係数(quality fctor)」に基づいて加重されることがある。簡単な例として、評価される被検体が所与の一連のAモード線の間中に動くならば、データの品質は低下させられ、したがって、このデータに基づいて遂行されたいずれの管腔/壁検出計算も他のサンプルに比較して加重を人工的に下げられる。
【0203】
なお他の代替実施の形態では、或る決まった深さに相当するAモード線によって発生された包絡線平方パワー値又は積分されたパワー値が調節されるというように、「位置的(locational)」加重及び/又は位置的スコア付けが適用されることがある。例えば、先に説明したように、成人における皮膚の表面から1mm未満に橈骨動脈の前壁を見付ける公算は極端に低く、したがって、(1mmの深さに相当する)最初の「N」Aモード線から導出された包絡線平方パワー値又は積分されたパワー値は、大幅に切り下げられるか又は除去さえ(すなわち、ゼロ加重)されることになる。
【0204】
同様に、逐次間隔に次ぐ間隔(interval−to−interval)処理は、不連続Aモード線間隔に決定された壁アーチファクトが解決を必要とするあいまい性に従ってマークされるというように、実施されることがある。前壁アーチファクトが最初の1mm深さ間隔に検出され、かつ再び第3間隔に検出されるならば、(i)最初の間隔に検出されたアーチファクトは前壁でありかつ第3間隔で検出されたアーチファクトは後壁であるか、又は(ii)最初のアーチファクトは雑音であった、かつ第3間隔アーチファクトは真前壁信号であるかのいずれかを、信頼の或るレベルを以て想定することができる。このようなあいまい性は、成人母集団中の生起の低公算に基づいて第1アーチファクトを除去する前述した「位置的」加重の応用、又はそれらの間隔に対する後続Aモード信号のサンプリングの使用のような、多くの技術を通して解決することができる。
【0205】
本方法論は、必要な所での有意な平滑化/フィルタリングをまた含む。このような平滑化/フィルタリングは、更になお、心収縮期から心拡張期へと起こる時間変動ばかりでなく、呼吸によって引き起こされる拍動間(beat−to−beat)の変動を除去する。このような平滑化/フィリタリングは、信号処理技術上一般に充分理解されており、したがって、本明細書に更に説明しない。
【0206】
納得するように、本明細書に説明した壁検出方法論の正確性は、細い超音波伝送ビーム及び受信ビームを生じる能力に或る点で結び付いている。特に、2方向ビーム応答は、超音波トランスジューサが評価される血管に対してその最適位置の付近にあるとき、その血管の管腔(すなわち、血流量の断面積)内をヒットするためには充分に狭くあるべきである。そうでなければ、血管の側壁からの後方散乱が管腔の検出を妨げ、かつ前壁と後壁の空間位置の推定値の正確性を劣化させる。
【0207】
前壁と後壁の位置の評価で他の考慮することは、圧平の間中の組織の相対コンプライアンスと相対圧縮性である。図17〜31に関して上に説明したような優勢に静的な壁位置評価の下では、組織内の血管壁の絶対位置と相対位置は、顕著に変動するということはない。しかしながら、(下の図34〜37に関して論じる)このような壁位置決定に基づく血管の血行力学パラメータを査定するとき、そこでは血管及びその取り囲む組織の少なくとも部分が本明細書に図6に関して先に説明したように組織の圧平の間中圧縮されるようになっており、前壁と後壁の相対位置と絶対位置は変化する。
【0208】
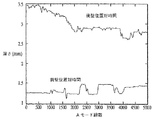
図32は、本願の讓受人によって得られた実データに基づいて、前述の問題をグラフで例示する。図32に示したように、血管の後壁3202の位置は、ゼロAモード線(すなわち、走査の開始)で深さ約4mmから600Aモード線の後約3mmの深さへ変動する。後壁の深さの変動は、直線並進(mm)が時間の関数として変動する(図32a)圧平デバイス1204の運動によって主として誘発される。圧力トランスジューサ(実圧平面を被検体の組織に接触している)上に記憶されたmmHgでの圧力を図32bに示す。それゆえ、圧平デバイスと圧力トランスジューサが圧力を血管の上の皮膚の表面に印加するに連れて、いくつかの効果が起こる。すなわち、(i)皮膚、筋肉、及び静脈を含む介在した組織が圧縮する、(ii)血管の背後の組織(すなわち、後壁の遠い側上)が圧縮する、及び(iii)血管自体が圧縮しかつ、先に説明したようにその固有のフープ・ストレスを克服する。これら3つのファクタは、図32に示したように前壁と後壁の深さに変化を生じるばかりでなく、血管の直径に変化を生じる。図33は、圧平の関数として、血管の前壁3302と後壁3304の位置の変化ばかりでなく、血管(管腔)直径3306の変動をグラフで例示する。図33は本発明の原理をより明確に例示する平滑化データを表すが、実データ又は未平滑化データは本来的に遥かに雑音性であることに注意されたい。
【0209】
図34は、上に説明した前壁と後壁検出方法を使用して血管(管腔)直径の変化の速度を決定する1方法論を例示する。変化の速度は、所与の期間にわたって血管直径の変化を取りかつその同じ間隔中のAモード線の数で除算することによって簡単に計算される。この後者の数を圧平デバイスの位置の線形変化(図33a)に相関させることもあり、それによっていろいろな種類の伝達関数(すなわち、線形圧平の関数としての血管直径の変化の速度)を発生し、伝達関数は圧縮中の組織と血管の挙動を記述します。
【0210】
後方散乱超音波エネルギーを使用して血行力学性質を査定する方法
図35を参照して前述した後方散乱超音波エネルギー(例えば、Aモード信号)を使用して血行力学性質を非侵襲的に査定する方法の1模範的代替実施の形態を説明する。納得するように、次の議論と模範的代替実施の形態は人間の橈骨動脈を使用しての動脈血圧の非侵襲的測定の面で行われるが、本明細書に記載した本発明の方法はより一般には、他の血行力学パラメータ、血管、及び種に応用されることがある。
【0211】
図35に示したように、方法3500は、一般に、(本明細書に図12に示したそれのような)適当な装置を査定される血管の領域に全体的に位置決めすることを含む(ステップ3502)。手頸上の橈骨動脈のような、装置のトランスジューサを置くサイトは、医務者(caregiver)には一般に知られている。次に、ステップ3504で、装置が活性化されて、血管及び介在した組織への装置の最適結合を達成するように、トランスジューサを血管に対して横位置決めする。納得するように、横位置決めするための多くの方法が使用されるといえる。例えば、本明細書に先に言及した、又は図40〜41に関して本明細書に後に説明する讓受人の同時係属米国特許出願第09/342,549号に説明された、観察された反射最小に基づく横位置決めの方法が単独又は他の方法と一緒に採用されることがある。
【0212】
「横」位置決めの行為は、縦位置決めの(すなわち、血管の縦軸に沿う)或る成分をまた含むことがあることに注意されたい。というのは、被検体の手頸/前腕上の装置の配置は手頸/前腕内の血管の配向に反して、手頸の肉体的属性によってより多く統制されるからである。特に、橈骨動脈が手頸の骨の軸に完全に平行な方向に走っていない位置にトランスジューサによって測定される点が起こる場合、このような「横」位置決めは、本来的に縦成分をまた充分に含む。更になお、血管に沿う或る種の点は、(例えば、超音波の伝送/反射と潜在的に干渉する静脈や、嚢胞や、他のセグメントの存在に因り)血行力学分析により良く適していることがある。
【0213】
次に、初期校正圧平掃引(すなわち、無圧縮から全圧縮へ又は血管の閉塞へ印加圧力を掃引すること)がステップ3506で遂行されて終末心拡張期圧プロファイルの傾斜の「平坦化(flattening)を識別し、したがって、圧力波形内の注目の点を局所化するのを援助する。図35aに示したように、図35aに示したように、終末心拡張期波形3554の平坦化領域3552は、一般に、急な勾配の2つの領域3558と3560との間に起こる。もっとも、これは常にたやすく検出可能とは限らない。更になお、注意するのは、多数の平坦領域が単一圧平掃引内に起こることがあることである。
【0214】
ステップ3508で、上側と下側の圧縮限界(本実施の形態では検査下の血管の直径減少のパーセンテージとして表される)が先行圧平掃引の間中に得られた情報に基づいてセットされる(ステップ3506)。直径の減少は、図17〜34に関して先に説明した前血管壁と後血管壁の検出技術を応用することによって決定される。例えば、25%直径減少の下限と50%直径減少の上限(それぞれ、44%と75%の断面積減少)が上側圧縮限界と下側圧縮限界として例示した実施の形態に使用される。もっとも、他の値及び/又は標印(indicia)も使用される。直径の25%減少の低値は、介在したかつ周囲の組織の圧縮が実質的に起こりかつ血管のフープ・ストレスが克服され始める点に大略等しくするように本願の讓受人によって実験的に決定されている。直径の50%減少の上側限界は、血管内の終末心拡張期血圧が印加された圧縮力によって克服される点に相関するように実験的に決定されている。
【0215】
更に、注意するのは、圧平掃引の間中に、最大拍動圧(maximum pulsatile pressure)が、平坦化する圧力波形の前述の領域の右手に(すなわち、より後の時刻に/より多量の血管圧縮で)起こることになり、それによって、波形中の注目の点を局所化することを更に助ける。特に、最大拍動動圧(これは技術上周知の多くの手段によってたやすく決定される)よりも多量の圧縮の状態の下で起こる波形中の他のアーチファクトは、差し引くこともでき、それによって、圧力波形中の注目の領域を狭める。したがって、最大拍動圧は、オプショナルにまた監視される(ステップ3510)ばかりでなく、動脈圧に上側窓限界をセットするのを援助する。
【0216】
ステップ3506の初期圧平掃引を完了し、かつ血管を弛緩させた(3512)後、血管は印加圧力と血管壁のフープ・ストレスとの間の平衡に大略相当する圧縮のレベルに再び圧平される(ステップ3514)。圧縮のこのレベルは、フープ・ストレス成分が除去されているから、終末心拡張期圧が血管に印加された圧縮力の測定値になるという点で、意味深い。先に説明したように、圧縮のこのレベルは、下側限界(例えば、血管直径の25パーセント減少、つまり断面積の44パーセント減少)と、上側限界(例えば、50パーセント減少、つまり断面積の75パーセント減少)によって制限される。圧平の最適レベルは、経壁圧を平衡させるようになっていて、下側直径減少限界判定基準に関連した圧力と上側直径減少限界判定基準に関連した圧力との間に形成された圧力の窓内に起こることになり、その窓はその中に圧力プロファイルの「平坦化」領域の少なくとも部分を有する。圧平のこの最適レベルで圧力トランスジューサによって測定された圧力は、伝達関数を介しての補正(ステップ3518)の基礎として使用される。ステップ3518に従って伝達関数を決定しかつ適用する1模範的方法は、図38と39を参照して下に説明する。
【0217】
納得するように、上側限界判定基準と上側限界判定基準によって作り出された圧力「窓」はかなり広いことがあり、したがって、追加の方法が窓内の最適圧力をより正確に決定するためにオプショナルに適用されることがある。本実施の形態では、これらの追加方法は、図36に関して下に更に詳細に説明するように最適圧平レベルのアルゴリズムに従う決定(ステップ3516)を含む。
【0218】
図36を参照して、最適圧平レベルの決定(ステップ3516)の方法論を説明する。図36に示したように、方法3600は、一般に、まず、終末心拡張期圧プロファイル内の「平坦化」スポットを識別する(ステップ3602)ことを含む。1模範的実施の形態では、圧平掃引にわたっての圧力プロファイルの端から導出されたヒストグラムが発生される(ステップ3606)。図36aは、ステップ3606に従って発生された模範的ヒストグラムである。ヒストグラム中で最大ビン(bin)値は、都合良く、終末心拡張期圧内の平坦スポットに相当する圧力プロファイルの領域で起こり、それによって平坦スポットのたやすい検出が見込まれる(ステップ3608)ことに注意されたい。
【0219】
次に、ステップ3604で、終末心拡張期圧が最大拍動圧で決定される。最大パルス圧(pulse pressure)は、例示の実施の形態では、パルズ圧データへの高次多項式適合(high order polynomial
fit)を使用して決定され(ステップ3610)、次いで、ピークをそれから決定する(ステップ3612)。このアプローチは、呼吸作用を含むパルス圧中の雑音を最小限にするのを助ける。次いで最大拍動圧で起こる終末心拡張期圧が記録される(ステップ3614)。
【0220】
終末心拡張期圧のこれら2つの指標(すなわち、「平坦スポット」と最大拍動圧)は、所望に従って分離して又は互いに一緒に使用することができることに注意されたい。更になお、他の技術が、最適圧平圧力のより正確な決定を血行力学測定の間中維持するために、これら2の指標の1つ又は両方を置換する、又はこれと組み合わせて使用されることがある。
【0221】
血行パラメータを査定する方法の代替実施の形態(図37に示した)では、方法3700は、血管をおおってトランスジューサを位置決めし(ステップ3702)、次いで、その後血管を圧平する(ステップ3704)一方、圧力波形を監視する(ステップ3706)ことを含む。次いで、終末心拡張期圧波形の屈曲(inflection)(例えば、勾配の変化)の点がステップ3708によって識別される。このような屈曲は、波形中の終末心拡張期圧値に関係した勾配の変化を識別するために適合したアルゴリズムを使用して自動的に識別される、又はこれに代わり手動で、例えば、熟練技術者による波形の視察によって、識別されることがある。前述の限界判定基準(例えば、25%血管直径減少公称下側限界、及び50%直径減少上側限界)が波形中の注目の点を更に局所化するためにステップ3710で適用される。
【0222】
伝達関数
図38と39を参照して、拡大縮小(伝達)関数を決定しかつ血行力学パラメータの測定された値に適用する(図35のステップ3518)方法の1模範的実施の形態を説明する。
【0223】
納得するように、次の議論は測定された動脈血圧値と使用される拡大縮小関数又は伝達関数の面で行われるが、その方法論は、より一般的には、図35のアプローチを使用して、又はそうでなく、測定された他の血行力学パラメータ又は波形に適用されることがある。例えば、被検体の循環系へのストレスの圧平が注目の状態(例えば、圧平の間中に圧力測定法によって測定された圧力対動脈直径の或るパーセンテージ減少が終末心拡張期圧と相関する)を生じるならば、本明細書に説明した方法論は、組織コンプライアンス及び他の作用を補正するために必要な拡大縮小を決定するために使用される。
【0224】
更になお、図38の方法論は、一般に、データの母集団に依存する実験に基づく技術を含むが、本発明は、図38の方法に代わりに又はこれと一緒に他の非実験的アプローチも企図しており、全てのこのような変形及び組合わせは本明細書に添付した特許請求の範囲に入る。したがって、図38の方法は、単に、性質の上で例証である。
【0225】
図38に従う血行力学パラメータ拡大縮小の方法3800は、一般に、相関を導出するために実験基準データ(empilical reference data)を使用することを含み、これらの相関は検査下の被検体から得られた血圧の現場測定に後に応用される。ストレスが実験基準データと現場測定との間で注目の1変量(例えば、終末心拡張期圧)に一致又は「定着(anchor)」するように、測定される血管に印加される。次いで、他の未定着変量(例えば、心収縮期圧及び平均血圧)に対する導出された補正が、実動脈内圧に事実上等価である補正された波形を得るために、評価される被検体の現場波形の相当する部分に適用される。
【0226】
図38に示したように、方法3800は、本明細書に先に説明した方法は別として、所望パラメータ(例えば、動脈血圧)の基準値又は基準波形を決定する(ステップ3802)ことをまずを含む。1実施の形態では、基準血圧データは、医療技術上周知の形式の「A線」侵襲性カテーテル・デバイスを経由して複数の生被検体から得られる。A線デバイスは、一般には、真動脈血圧(波形)を決定する正確な手段として受け入れられるが、しかし、都合悪く、被検体の循環系内へのカテーテル・プローブの挿入を必要とする。同じ患者についての圧力測定法による圧力データが同時に得られ(ステップ3804)、この圧力測定法による測定は、定着変量(ここでは終末心拡張期圧)の圧力測定法による測定値がA線によって決定された実終末心拡張期圧と可能な限り密接に整合するというように被検体の血管を圧平することを含む。
【0227】
1簡単な実施の形態では、圧平レベルは、圧力測定法の圧力トランスジューサによって測定された(かつ陰極線管(CRT)又はこれに類似のもののようなディスプレイ・デバイス上にグラフフで表示された)波形の定着変量がA線の同じ変量の値に実用可能な限り密接に整合するまで、漸次高められる。整合は、波形の同時的重なり、又はディスプレイ・デバイス上に表示された2つの数値の差の最小化のような眼に見える手段を介して主としてオペレータによって完遂される。次いで、オペレータは、圧平レベルを可能な整合の最良レベルへ調節する。
【0228】
他の実施の形態では、圧平は、A線波形と圧力測定法波形の両方から、注目の定着変量を、周期式に又は連続式に、自動的に計算し、かつそれらをスコア付け計量を使用して可能な限り密接に整合させることを企図するアルゴリズムによって制御される。例えば、離散時間間隔中の終末心拡張期圧どうし間の差に関係しているスコア付け計量が波形間の「適合(fit)」の品質を評価するために使用され、その計量は選択された時間間隔中に計量の値を最小限にするために圧力を変調するように先に説明した圧平モータ制御回路への入力として使用される。このような曲線を適合させる(curve−fitting)計量は、信号処理技術における当業者に周知であり、したがって、本明細書に更に説明しない。
【0229】
定着変量の整合及びデータの収集の後、データの2つの集合が分析されて、ステップ3806によってその個人についての真動脈圧(すなわち、A線値)と圧力測定法によって得られた圧力との間の関係の特性表示を用意する。基準値と圧力測定法のデバイスから導出されたものとの間の差は、なかでも、圧力測定法による測定の間中の介在した組織の圧縮に因る転送損失から生じた差である。特に、例示の実施の形態では、心収縮期圧と平均動脈血圧に対する補正は、2つの波形中の終末心拡張期圧が整合していた事実に基づいて計算される。次いで、これらの補正又は差は、「平均」心収縮期率と「平均」補正率を決定するために実験データがそこから収集された全ての他の被検体からの類似のデータに照らして統計的に分析される(ステップ3808)。心収縮期圧について研究された全ての患者にわたってのA線と圧力測定法による測定との間の平均誤りは−13.6%であり、かつ平均圧力についての誤りは−5.6%であったことが、数百の患者の橈骨動脈のサンプリングに基づいて、本願の讓受人によって実験的に決定されている。要するに、これらの数字は、終末心拡張期値を先に説明したように基準値に整合させたように圧力測定法のトランスジューサを圧平させたとき、基準デバイス(すなわち、A線)が心収縮期読取りについて約14%だけ公称的に高く、かつ平均読取りについて約6%高かったことを表示する。
【0230】
ステップ3808によって注目のパラメータに対する補正率が得られた後、ステップ3810によって本発明の非侵襲的血行力学査定装置が評価される被検体の注目の血管、例えば、橈骨動脈に当てられる。次に、ステップ3812で、ストレスが血管に印加される。特に、ストレスは、注目の「定着」変量(本実施の形態では終末心拡張期圧)が、一般に、定着変量の実値に対して或る既知の関係を帯びる所望値を最も達成する点へと血管内の血行力学性質に変化を誘発するために、印加される。本文脈の中で、ストレスのこの印加は、本明細書に先に説明した非侵襲性(圧力測定法の)圧平デバイスを使用して血管を圧平する一方、血管の圧力波形を非侵襲的に測定することを含み、圧平の程度は測定された圧力波形中の定着変量のその実値に対する関係によって決定される。
【0231】
次に、ステップ3814で、拡大縮小関数又は伝達関数が評価される被検体についての前述のデータから決定される。1実施の形態では、未補正の圧力の入力値と「補正済み」圧力の入力値に基づいて、曲線適合多項式に関する次の3つの同時方程式を解くことによって得られる。すなわち、
【0232】
【数15】
ここに、
Psc、Pdc、Psc=それぞれ、心収縮期、心拡張期、平均「補正済み」(拡大縮小)圧及び
Psu、Pdu、Pmu=それぞれ、心収縮期、心拡張期、平均「未補正」(原)圧である。
【0234】
定数k1、k2、k3について解くことによって、多項式曲線が発生され、これは、都合良く、圧力の全ての値に対して現被検体について圧力測定法によって得られた波形を拡大縮小する。したがって、これは、入力波形が終末心拡張期値に又は実値と既知の関係を持ついずれかの終末心拡張期点に(本明細書に先に説明した方法又は他の技術によって)整合させられるならば、拡大縮小された出力を用意する。
図39は、前述のプロセスのグラフ表示である。
【0235】
血管位置と位置決め
先に論じたように、装置の超音波トランスジューサと圧力トランスジューサの適正な横位置決めは、動脈血圧を含む血行力学パラメータの測定の強化された正確性の面で有利である。このような横位置きめは、一般に、注目の血管の局所内に装置を初期的に配置する際に断定され、その後、最適結合が達成されるというように、トランスジューサの位置を「微同調」させる。人間の橈骨動脈の場合、動脈の近接位置は、医務者によって知られている、すなわち、手頸の幅よりもいくらか狭いに相当する狭い帯内を、被検体の手頸/前腕の内側表面を縦に下へ発している。しかしながら、他の血管及び/又は他の種については、注目の血管の位置と配向は、容易には識別されないことがある。その近接位置と配向が周知である人間の橈骨動脈の文脈の中でさえも、医務者による装置の不適性な配置は、その位置から得られた血圧測定の一貫性と「堅牢性(robustness)」に影響するおそれがある。患者(及び他のファクタ)による動きもまた読取りの正確性に影響することがあり、測定装置の周期的再配置/再位置決めを必要とする。
【0236】
更になお、例えば、頸動脈(carotid artery)外科(人間の頸に沿って血管をマップする)、大腿動脈(femoral artery)のカテーテル法、及び時間的動脈局所化(temporal artery localization)を含む他形式の手順があり、そこでは(i)非侵襲的仕方で被検体の組織内の血管を容易にかつ信頼性を以て位置割出しするか、又は(ii)いったん位置割出しした血管に対して所定位置と配向に監視デバイス又は治療デバイスを維持するかのどちらかができることが大いに望ましい。
【0237】
したがって、本発明は、都合良く、注目の血管を位置割出しすること及び1つ以上の選択された装置を血管と所定の関係に維持することの両方に対して非侵襲性技術(と装置)を用意する。特に、1模範的応用では、後方散乱音響エネルギーが分析されて、被検体の、周囲の組織内に埋め込まれている血管を初期的に位置割出しする。他の応用では、後方散乱エネルギーがセンシング装置又は治療装置(例えば、本明細書に先に説明したNIBPデバイスの圧力トランスジューサ及び/超音波トランスジューサ)を血管に対して最適位置に維持するように使用される。
【0238】
1実施の形態では、注目の血管を検出しかつ位置割出しする方法がAモード線走査に出現した後方散乱超音波エネルギーの低下レベルに基づいて血管と関連した管腔を直接検出することによって完遂される。超音波エネルギーは、周囲の血管壁及び組織によってよりも(血液内に存在する赤血球及び血しようによるというように)管腔内により容易に吸収される。それゆえ、低下後方散乱エネルギーの領域を識別することによって血管が位置割出しされ、及び/又は監視デイスが位置決めされる。このような領域は、一次元(例えば、組織内の深さに関してのみ)、又は血管を横位置つまりトラバース位置及び深さ位置の両方に関して精確に位置割出しすることが望ましい場合のように、多次元で見付けることもできる。
【0239】
本発明の他の実施の形態は、後方散乱Aモード・エネルギーの分析に基づいて血管の前壁と後壁の両方の相対位置を検出する。この壁情報は、血管の有効直径を直接決定するために使用される。次いで、横位置つまりトラバース位置の関数としての血管直径の変動が測定デバイス又は治療デバイスの最適横位置を識別するために使用される。
【0240】
図40を参照して、被検体の組織内の血管を検出する方法の第1実施の形態を詳細に説明する。図40に示したように、方法4000は、まず音響(例えば、超音波)エネルギーを発生しかつ所望ビーム幅で一般に血管が位置割出しされている注目の領域内で被検体の組織内へ伝送する(ステップ4002)。例えば、橈骨動脈の場合、波を伝送する超音波トランスジューサを、超音波で以て血管の少なくとも部分を横断して切るように走査パターン内の注目の領域を横断して物理的に又は電子的に「ステア(seer)」することができる。例えば、皮膚の表面にわたって超音波トランスジューサを動かす(本明細書に先に説明したトラバース位置決め装置ような)組立て体が使用されることがある。これに代わり、大きな分散ビームが走査関数(scan function)の少なくとも部分を取り除くために使用されることがある。ビーム分散は、その後、所望ならば、より良い信号品質のために注目の血管又は領域の識別の際に調節されることがある。なお他の代替実施の形態として、フェーズド・アレー又は他の電子的にステア可能なデバイスがトランスジューサ素子の物理的運動を伴わず組織を走査する比較的狭い分散の伝送/受信ビームを発生するために使用されることがある。
【0241】
検査下にある組織は、その組織を「前負荷(pre−load)」するために先に説明したように圧平されることがまたある。このような前負荷は、静脈やその他の小さな血管が超音波トランスジューサと注目の血管との間に介在している、又は、人間の橈骨動脈の場合のように、注目の血管の付近に全体的に介在している場合に、有利である。特に、制御された前負荷は小さい静脈を動脈に比較してその小さいフープ・ストレスと低い管腔(血液)圧のゆえに先取的に凹ませ、それによって、下に説明する管腔検出技術の視野からそれを有効に除去する。本願の讓受人は、30mmHg(4kPa)の程度での前負荷圧平がトランスジューサと橈骨動脈との間に介在したいずれの静脈をも充分に凹ますために適していると決定している。もっとも、納得するように、特定応用次第で他の値も使用される。
【0242】
しかしながら、納得するように、注目の主血管の検出/位置割出しと同時に上に挙げた静脈のような他の血管を検出しかつ位置割出しをするのがまた望ましいことがある。それゆえ、前述の圧平を、管腔検出装置によって眺められたものを「フィルタ」するために所望するに従って選択的に使用することがある。例えば、所与の個人についてAモード信号に高度のクラッタ及び他の雑音が存在するならば、動脈の回りの静脈からのエネルギー後方散乱の影響を除去するために評価される領域を圧平するのが望ましい。これに代わり、雑音レベルが充分に低いならば、静脈の存在を検出することが望ましく、このような検出は非侵襲的血圧測定と一緒に使用される組織拡大縮小関数又は伝達関数の決定に潜在的に有用である。特に、介在した静脈の存在は、伝達関数の値にいくらか影響することがあり、それでからその存在を検出してかつその影響を補償することが望ましい。再び図40に帰って、走査される領域内の組織、血管、及び管腔から反射された後方散乱エネルギーが、次に、ステップ4004で同じ(又は他の)トランスジューサ素子によって受信され、かつステップ4006で装置内の処理によってAモード又は他の所望モード性に変換される。後の血管検出を強化するために、ステップ4008で、「包絡線平方」値の導出を含む(本明細書で先に詳細に説明した)追加信号処理がAモード線に適用される。最後に、ステップ4010で、注目の領域内で血管が存在している位置を識別するために、Aモード信号が所定計量又は他の判定基準の面で更に分析される。1変形では、計量は、注目の血管内管腔の存在から生じる正規化され積分されたパワー・プロファイル中のプラトーを識別するために適合している。それゆえ、積分された後方散乱パワー中に重要なプラトーがトラバース「掃引」の間中に識別されると、プラトーが検出されるときのトランスジューサの横位置は、血管の横位置に相当する。方法4000の他の変形では、包絡線平方パラメータの信号レベルは、管腔の存在からまた生じる局所最小を識別するために、また分析される。
【0243】
第2実施の形態では、図40のステップ4010での管腔の検出は、本明細書に先に「間隔」法と称した、Aモード線に沿う所定距離(例えば、1mm)内の平均パワーを計算することによって完遂される。
【0244】
図40の手順は、いずれかの数の空間的に分布した走査に必要なだけ繰り返されることがあり、このようにして、組織の「スライス」が注目の血管の横位置並びにまたその深さに関する情報を発生するために順序に(又は同時にさえも)深さ(時間)次元で検査されることがあることにまた注意されたい。このような「スライス」は、電子的に溶解又は組み合わされて、断層撮影法で周知であるように測定された包絡線平方値(又は先の実施の形態に関して説明した積分されたパワー)の多次元表現を用意する。本発明は、決定の正確性を向上するために多数のこのような技術の使用を更に企図する。例えば、「プラトー」検出と「間隔」検出の技術は、器械の堅牢性を増すために組み合わせられる。
【0245】
更になお、納得するように、管腔(血管)位置情報は、超音波トランスジューサ又は他の測定装置/治療装置を血管に対してどんな所望の配向にも、例えば、固定横オフセットして、(下に説明するように)血管の直径に機能的に関係している横オフセットして等、維持するために使用されることがある。同様に、管腔検出情報は、信号品質、嚢胞性構成要素(cystic component)又はクラッタの存在、圧平の程度(もしあれば)、等々に基づいてトランスジューサの位置を制御するために使用されることがある。
【0246】
図41を参照して、被検体の組織内の血管を検出しかつ位置割出しする方法の代替実施の形態を説明する。この代替実施の形態では、管腔検出の前述の技術が注目の血管の壁の位置の分析に対する開始点として使用される。それらの壁の位置は、血管の直径の間接的決定を与え、これがトランスジューサと血管との間に最適結合を維持するのを助けるために使用される。
【0247】
図41に示したように、血管に対して測定デバイス又は治療デバイスを位置決めするために壁直径を利用する方法の1模範的実施の形態を説明する。注意するのは、次の議論は人間の橈骨動脈に対して超音波トランスジューサを再位置決めするために使用される(本明細書に先に説明したような)横位置決め組立て体の面で行われるが、その一般的方法論は他の応用にもたやすく適合させられるといえることである。
【0248】
方法4100は、本明細書に先に説明したように、時間の関数として変動する「生」壁直径情報を導出すること(ステップ4102)を一般に含む。次に、ステップ4104で、ステップ4102の壁直径情報が、事前選択された有限時間間隔にわたって積分されて、生データを「平滑化」しかつ呼吸と心周期に関するほとんどの又は全てのアーチファクトを除去する。これは、時間の関数として変動する壁直径計量を生じる(ステップ4106)。次いで、壁直径計量は、絶対計量の値と機能的に関係している誤り信号を発生する(ステップ4108)ために使用される。次いで、この誤り信号は前述のコントローラ・デバイスに送られ、このデバイスは誤り信号の大きさを可能な限り小さく(又はこれに代えて直径計量を可能な限り大きく)有効に維持するようにトランスジューサ素子の横位置を変動させる(ステップ4110)。
【0249】
納得するように、上に挙げた壁直径情報は、先に本明細書にその内容を組み入れてある讓受人の同時係属米国特許出願第09/342,549号に説明したようなファジィ論理制御含む、多くの異なった制御方式の基礎として使用されることがある。このような変形と応用は、コントローラ技術における当業者に周知であり、したがって、本明細書には更に説明しない。
【0250】
最後に注意するのは、上に説明した方法の多くの変形が本発明と両立して利用されるといえることである。特に、或る種のステップは、オプショナルでありかつ所望するに従って遂行されることも削除されることもある。同様に、(例えば、追加データのサンプリングや、処理や、フィルタ動作(filteration)や、校正や、数学的分析のような)他のステップが前述の実施の形態に追加されることがある。更に、或る種のステップの遂行の順序は、所望ならば、入れ替えられ、又は並列(又は直列)に遂行される。それゆえ、前述の実施の形態は、本明細書に開示した本発明の広範ないくつもの方法の単に例示である。
【0251】
上の詳細な説明は種々の実施の形態に応用された本発明の新規な特徴を図示し、説明し、かつ指摘してきたが、いうまでもなく、例示したデバイス又はプロセスの形式と細部における種々の省略、置換、及び変更は、本発明の精神に反することなく当業者によって行われることがある。前述の説明は、本発明を実施するのに現在思考される最良のモードのものである。この説明は、限定であることを決して意味せず、むしろ本発明の一般原理の例示であると取られるべきである。本発明の範囲は、特許請求の範囲を参照して決定されるべきである。
【図面の簡単な説明】
【図1】
先行技術「最大拍動」理論に従う印加圧力と時間の関数としての動脈の断面形状を例示する複合グラフ図である。
【図2】
血管の壁に狭窄症の変動レベルを形成された血管を例示する図である。
【図3〜3e】
本発明に従って生被検体の循環系内の血行力学パラメータを査定する方法の1模範的実施の形態を例示する論理流れ図である。
【図4aと4b】
血液速度と血管の有効断面流体面積の減少との間の関係を例示するグラフ図である。
【図5a〜図5c】
本発明に従う圧平圧力と、心洞調律と、動脈壁変位との間の関係を例示するグラフ図である。
【図5d】
心拡張期圧と心収縮期圧の両方にについて最高血液速度と流体面積(圧平圧力)のパーセンテージ減少との間の関係を例示するグラフ図である。
【図6】
動脈と、皮膚と、介在した組織及び肉体的構成要素との間の関係を例示する典型的人間手頸の部分の断面図である。
【図7a〜7b】
心収縮期状態と心拡張期状態の両方について、図6の断面に対する、それぞれ、模範的伝達関数と伝達分数を例示するグラフ図である。
【図8】
本発明を利用して典型的人間についての測定された、実の、及び選択された(校正された)動脈圧対時間のグラフである。
【図9】
本発明に従って生被検体の循環系の血行力学反応をモデルする方法の1模範的実施の形態を例示する論理流れ図である。
【図10】
本発明に従って呼吸又は他の周期的誤り源に対して血行力学パラメータ測定を校正する方法の1模範的実施の形態を例示する論理流れ図である。
【図11】
呼吸の血管への影響を例示する、典型的血管内を流れる血液の速度と運動エネルギ−(KE)のプロット図である。
【図12】
本発明に従って生被検体の血管内の血行力学性質を測定する装置の1模範的実施の形態のブロック図である。
【図13】
人間の橈骨動脈上での図12の装置の使用を例示するその装置の第2実施の形態の機能ブロック図である。
【図14a〜図14b】
本発明の方法を組み込んだコンピュータ・プログラムのオブジェクト・コード表現を有する種々の機械読取り可能媒体の斜視図である。
【図15】
本発明に従ってパラメータ・データを分析する装置の第1実施の形態のブロック図である。
【図16】
前掲の方法を使用して被検体に治療を施す方法の1模範的実施の形態を例示する論理流れ図である。
【図17】
本発明に従う管腔と壁検出の一般的方法の1模範的実施の形態を例示する論理ブロック図である。
【図17a】
図17の方法によるAモード信号を処理する方法の1模範的実施の形態を例示する論理ブロック図である。
【図18】
監視される被検体の組織内深さの関数としての「生」Aモード信号のグラフ図である。
【図19】
図18の生Aモード・データから導出された包絡線のグラフ図である。
【図20】
本発明に従う直角復調とAモード信号フィルタリングの一般的方法論を例示する論理流れ図である。
【図21】
本発明に従うAモード信号の直角復調の方法を例示するブロック図である。
【図22】
本発明の低域通過有限インパルス応答(FIR)フィルタの1模範的実施の形態の周波数応答のグラフ図である。
【図23】
本発明の直角復調とフィルタリング方法に使用される(FIR)係数の模範的集合をリストするテーブルである。
【図24】
図18のAモード信号から導出された包絡線平方波形のグラフ図である。
【図25】
図24の包絡線平方波形の(10を底とする)対数のグラフ図である。
【図26】
図24のAモード信号の包絡線平方への利得関数(TGC)の適用のグラフ図である。
【図27a】
本発明に従う管腔検出の「プラトー」法を例示する論理流れ図である。
【図27b】
単一Aモード線について深さの関数として測定された後方散乱パワーを例示するプロット図である。
【図27c】
図27aのプラトー法に従う正規化され積分されたパワー関数のグラフ図である。
【27d】
図27aの方法と一緒に使用されたプラトー検出計量のグラフ図である。
【27e】
単一Aモード線に対する正規化されたプラトー検出計量のグラフ図である。
【図28a】
図26のTGC補正されたAモード線に沿うパワー・プロファイル(1mm間隔)のグラフ図である。
【図28b】
本発明に従ってAモード線信号を使用して管腔検出の「間隔」方法論を例示する論理流れ図である。
【図29a】
積分されたパワー計算に基づく前壁と後壁検出の第1模範的方法論を例示する論理流れ図である。
【図29b】
包絡線平方信号レベル決定に基づく前壁と後壁検出の第2模範的方法論を例示する論理流れ図である。
【図30】
図29bの方法に従う平均パワー計算と典型的Aモード包絡線に現れる前壁と後壁アーチファクトとの間の関係のグラフ図である。
【図31】
図29bの方法を使用する(5000Aモード信号線に基づく)時間の関数としての模範的血管の前壁と後壁の位置のグラフ図である。
【図32】
外部圧平デバイスによる圧平の間中の時間の関数としての血管の後壁の位置のグラフ図である。
【図32a】
典型的橈骨動脈の圧平の間中時間の関数としての圧平デバイスの線形位置(mm)のグラフ図である。
【32b】
図32aに従う間中に時間の関数として圧平圧力トランスジューサによって測定された圧力プロファイルのグラフ図である。
【図33】
圧平の関数としての、前及び後動脈壁位置(深さmm)、及び動脈直径(mm)のグラフ図である。
【図34】
本発明に従う圧平の関数としての血管直径の変化の速度を決定する方法論のグラフ図である。
【図35】
本発明に従って管腔検出と壁検出を使用して血行力学パラメータを査定する方法論の1実施の形態を例示する論理流れ図である。
【図35a】
終末心拡張期圧中の「フラット・スポット」を表示する、測定された動脈圧対圧平圧力のグラフである。
【図36】
本発明に従って血行力学測定の間中に最適圧平圧力を決定する1模範的方法論を例示する論理流れ図である。
【図36a】
本発明に従う模範的終末心拡張期「フラット・スポット」検出アルゴリズムのヒストグラム・プロット図である。
【図37】
心拡張期圧プロファイル中の屈曲点に基づいて後方散乱超音波エネルギーを使用して血行力学パラメータを査定する方法論の1模範的実施の形態を例示する論理流れ図である。
【図38】
組織損失を償うために測定された圧力を拡大縮小する方法の1模範的実施の形態を例示する論理流れ図である。
【図39】
図38の方法のグラフ図である。
【図40】
本発明に従う管腔検出を使用して血管を位置割出しする方法を例示する論理流れ図である。
【図41】
本発明に従う管腔検出と壁検出を使用して血管を位置割出しする方法の1模範的実施の形態を例示する論理流れ図である。[0001]
This application discloses a method and an apparatus for assessing hemodynamic properties in a circulatory system of a living subject, which was filed on March 23, 2000 (Method And Apparatus For Assessing Hemodynamic Properties with the System of a Financial System). No. 09 / 534,900, entitled and assigned to the assignee of the present application and incorporated herein by reference in its entirety.
[0002]
(Related application)
This application was filed on March 22, 2001, and assigned to the assignee of the present application, entitled "Method and Apparatus for Non-Invasive Assessment of Hemodynamic Parameters Including Vascular Location" (Method And Apparatus For The Noninvasive Assessment Of Hemodynamics). Inc. Blood Vessel Location), US Ser. No. 09 / 815,982.
[0003]
(Background of the Invention)
(1. Field of the Invention)
The present application relates generally to methods and devices for monitoring parameters associated with the circulatory system of a living subject, and more particularly, to invasive monitoring of arterial blood pressure.
[0004]
(2. Description of Related Technology)
Arterial blood pressure measurement
Several well-known techniques have been used to non-invasively monitor a subject's arterial blood pressure waveform. That is, auscultation, oscillometry, and pressure measurement. Both auscultation and vibrometry techniques use a standard inflatable arm cuff that occludes the brachial artery of the subject. Auscultation techniques determine a subject's systolic and diastolic pressure by monitoring certain Korotkoff sounds that occur as the cuff is deflated slowly. . Vibrometry techniques, on the other hand, measure these pressures as well as the average pressure of the subject by measuring the actual pressure change that occurs within the cuff as the cuff is deflated. Both techniques determine pressure, but on the other hand it cannot reproduce the actual blood pressure waveform of the subject. Therefore, true continuous, beat-to-beat blood pressure monitoring cannot be achieved using these techniques.
[0005]
Obstructive cuff devices of the type briefly described above have generally been somewhat effective in sensing long-term trends in a subject's blood pressure. However, such instruments have not generally been effective in detecting short-term blood pressure fluctuations. Sensing short-term blood pressure oscillations is critical for many medical applications, including surgery.
[0006]
The art of arterial pressure measurement is also well known in the medical arts. According to the theory of arterial pressure measurement, the pressure in a superficial artery with sufficient bony support, such as the radial artery, is such that the transmural pressure equals zero. Sometimes, it is accurately recorded during the applanation sweep. The term "flat pressure" refers to a process that varies the pressure applied to an artery. Applanation sweep refers to the time interval between varying the pressure on the artery from over-compressed to under-compressed or vice versa. At the start of a decreasing applanation sweep, no pressure pulses are recorded because the artery is overcompressed into a "dog bone" shape. At the end of the sweep, the artery is under-compressed, so a minimum amplitude pressure pulse is recorded. Within the sweep, it is assumed that applanation occurs while the arterial wall tension is parallel to the manometer surface. Here, the arterial pressure is perpendicular to its surface and is the only stress detected by the manometer sensor. At this pressure, it is assumed that the obtained maximum peak-to-peak amplitude ("maximum pulsatile") pressure corresponds to zero transmural pressure. This theory is illustrated graphically in FIG. Assume that bone, or other rigid member, is under the artery.
[0007]
One prior art device that performs the pressure measurement technique includes a rigid array of miniature pressure transducers that impinge on the peripheral artery, eg, the tissue overlying the radial artery. The transducers are dimensioned such that each directly senses the mechanical force in the underlying tissue of the subject and each covers only a small portion of the underlying artery. The array is compressed against the tissue and applanates the underlying artery, thereby coupling interpulsation pressure fluctuations in the artery through the tissue to at least some of the transducers. Regardless of the position of the array on the subject, a variety of different transducer arrays are used to ensure that at least one transducer is always over the artery. However, this type of pressure gauge has several disadvantages. First, arrays of discrete transducers are generally not automatically compatible with the continuous contour of the subject's tissue overlying the artery being sensed. This has historically led to inaccuracies in the resulting transducer signal. Further, in some cases, this incompatibility can cause tissue trauma and nerve destruction, and can limit blood flow to peripheral tissues.
[0008]
Other prior art calls for more accurate placement of a single pressure measurement sensor laterally over an artery, thereby more completely coupling the sensor to pressure fluctuations within the artery. However, such systems may place the sensor in a position where the sensor is "centered" geometrically but not optimally positioned for signal coupling, and during the measurement. Due to the movement of the subject therein, it will typically require relatively frequent recalibration or repositioning.
[0009]
Pressure measurement systems are also usually very sensitive to the orientation of the pressure transducer on the monitored subject. In particular, such systems exhibit reduced accuracy when the angular relationship between the transducer and the artery varies from an "optimal" angle of incidence. This is an important consideration. Because the two measurements do not place or maintain the device at approximately the same angle relative to the artery. Many of the aforementioned approaches to lateral sensor positioning, regardless of lateral position, are often due to positioning mechanisms that are not adapted to compensate for anatomical features of the subject, such as curvature of the wrist surface. There is a similar difficulty in that a constant angular relationship with the artery cannot be maintained.
[0010]
Another significant disadvantage of arterial pressure measurement systems is their inability to generally monitor the level of arterial wall compression continuously and adjust to an optimal level of zero transmural pressure. In general, optimization of arterial wall compression has only been achieved by periodic recalibration. This requires interruption of the subject monitoring function, which can occur during a critical time period. This inability severely limits the acceptance of manometers in a clinical setting.
[0011]
A further limitation of the pressure measurement approach relates to the imperfect pressure pulse transfer from inside the blood vessel to a measurement point on the surface of the skin covering the blood vessel. In particular, even when the optimal level of arterial compression is achieved, the magnitude of pressure fluctuations occurring in the blood vessels is limited by the incomplete and complex coupling of arterial blood pressure through the vessel wall and through the tissue to the skin surface. It will be different from that measured by the pressure measurement sensor (pressure transducer) placed on top. Therefore, any pressure signal or pressure waveform measured at the skin will necessarily be different from the true pressure in the artery. Modeling the physical response of the artery wall, tissue, musculature, tendons, bones, and skin of the wrist is not a straightforward process, but is inherently uncertain and unusual for each individual including. These uncertainties and abnormalities introduce unexpected errors into any measurement of blood pressure made via the pressure measurement sensor.
[0012]
One prior art method of calibrating a pressure measurement by a pressure measurement method utilizes a vibration measurement device (ie, a pressure cuff or the like) to periodically obtain “actual” pressure information, It is then used to calibrate the pressure measurement measurements. This approach has the disadvantage that in order to maintain the device calibration, it is necessary to perform an ongoing calibration event, especially a cuff inflation / deflation. Such calibration events are distracting, cumbersome, and can only be performed with a relatively long periodicity. Still further, the technique is not calibrated based on measurements of actual hemodynamic changes occurring in the circulatory system, but rather is based on external measurements that may or may not be a representation of the actual changes. In any case, a mechanism for correcting incomplete pulse transfer from a blood vessel to a sensor due to an intervening tissue or the like is not provided.
[0013]
Other prior art calibration techniques transmit or induce turbulence in the blood flowing through the blood vessel to generate an offset or correction to the measured hemodynamic parameters, and then transmit the measured parameters (eg, blood pressure waveforms). ) Are intended to detect the components of that signal. For example, "Apparatus and Method for Measuring an Induced Perturbation to Determinant Blood", which is assigned to Vital Insight, Inc. See U.S. Pat. No. 5,590,649 (the '649 patent). Under the approach of the '649 patent, changes in various hemodynamic parameters ostensibly resulting from changes in blood pressure are modeled and stored in the device and compared to data obtained from the pressure measurement sensor. However, this approach does not determine the calibration offset by direct measurement of the hemodynamic parameters of the subject being evaluated, but rather by modeling the relationship between blood pressure and disturbance wave velocity. That is, the speed and phase are modeled to have a certain relationship with the change in blood pressure. Thus, in theory, the observed change in the speed / phase of the disturbance wave can be used to generate an estimate of the actual blood pressure within the subject where the estimated change is evaluated. The limitations of this system are clearly governed by the ability to accurately model many complex, non-linear, interdependent parameters, as well as predict the time variance of these many parameters.
[0014]
Cardiovascular hemodynamics and diseases
The science of hemodynamics, or the analysis of fluid (blood) flow through the body, is effectively used today to detect and / or diagnose diseases of the circulatory system or defects in the system. For example, valvular disease, structural defects in the heart, venous disease, reduced heart function, and arterial disease are assessed by examining how blood flows through various parts of the circulatory system. Of particular interest is the analysis of arterial disease, such as stenosis (ie, blockage or reduction of effective area due to arterial plaque, etc.). As the degree of stenosis in the blood vessels of a living subject varies, certain changes occur in the parameters of the circulatory system and in the overall health of the subject. As illustrated in FIG. 2, the degree of fluctuation of the virtual intravascular stenosis is to occlude the blood vessel as a whole in proportion. That is, complete stenosis results in complete occlusion, no blood flow through the blood vessels, and very imminent symptoms appear in the subject without stenosis. At the level of stenosis that falls somewhere between them, the response is somewhat more complex. For example, the subject suffers from stenosis, which significantly reduces the effective cross-sectional area of a given blood vessel, but still shows very little if any symptoms under normal levels of exercise. There may not be. However, the same subject may exhibit dramatic symptoms with increased exercise. As the patient works harder, the affected tissue creates higher metabolic demands, which require increased perfusion. Normally, vasodilation and collateralized blood flow provide a compensating mechanism that increases the volume flow to meet higher volume requirements. However, because the blood vessels are significantly constricted, compensation mechanisms are already being used to meet common akinetic demands. As a result, the body cannot increase the volume demand. This is because there is no way to minimize the energy loss associated with overcoming the resistance of the stenotic (reduced) area of the vessel. If the volume flow is not increased, the increased metabolic demand will not be met and the peripheral tissue will be ischemic.
[0015]
By modeling the stenotic artery as a fluid system with internal pressure (P) and blood mass flow (Q) or blood velocity (v), the well known Bernoulli to describe the flow of blood in the artery as follows: A modified version of the equation can be applied.
[0016]
(Equation 1)
![]()
Therefore, the above relationships may be used to assess one hemodynamic parameter when the others are known. For example, the pressure gradient across a stenosis in an artery (ΔP) is estimated by obtaining data on the velocity of blood flowing through the stenosis and then using this velocity data in equation (1). Velocity data can also be obtained by a number of well-known techniques, such as spectral Doppler ultrasound.
[0018]
However, despite their usefulness in assessing the severity of stenosis and other such diseases present in the arteries, prior art hemodynamic assessment techniques require that the arterial Assessing the absolute blood pressure in a house cannot be effective. In theory, an accurate model of the circulatory response should be used to estimate the value of a parameter in the system (such as true arterial pressure) based on known or measured values of other parameters. Can be. However, as we know, the circulatory system of living organs, especially humans, is extremely complex and comprises thousands of interconnected vessels without exaggeration. This system includes, among other things, a large number of capillaries, veins, arteries, each having their own unique physical properties. Still further, within each of the aforementioned categories of vessels, the individual constituents have significantly different properties and react within the circulatory system. For example, two arteries within the human body have (i) different diameters at different points along their length, (ii) supply more or less veins and capillaries than others, and (iii) Have more or less elasticity and (iv) have more or less stenosis associated with them.
[0019]
The nature and response of each of the blood vessels may also be differently affected by various internal and / or external stimuli, such as the introduction of an anesthetic into the body. Even normal autonomous reactions in the body, such as breathing, can affect the pressure in the circulatory system and therefore need to be considered.
[0020]
Given these limitations, it becomes extremely difficult, if not impossible, to accurately model the human circulatory system for use in blood pressure estimation in terms of its hydrodynamics. Even if the hypothetical circulatory system can be accurately modeled, the application of such models is susceptible to significant subject-to-subject variability due to the specific physical properties and reactions of each subject . Therefore, such an approach can only hope to form a rough approximation of the behavior of the circulatory system, at best, and thus, to date, has accurately determined blood pressure in a living subject. Has proven to be ineffective.
[0021]
Based on the foregoing, what is needed is an improved method and apparatus for assessing hemodynamic parameters, including blood pressure, in a live subject. Such methods and devices would ideally be non-invasive, perform self-calibration continuously or almost continuously, and should be performed when the subject is conscious and anesthetized. As in both cases, it will be both effective and produce reliable results under a variety of different subject physiological environments. Finally, such improved methods and apparatus will be based primarily on the parameters measured from each particular analyte being assessed, thereby taking into account each individual's specific calibration.
[0022]
(Summary of the Invention)
The present invention satisfies the foregoing needs by an improved method and apparatus for assessing hemodynamic parameters, including blood pressure, in a live subject.
[0023]
In a first aspect of the present invention, a method for assessing hemodynamic properties, including circulatory blood pressure, is disclosed. The method generally includes measuring a first parameter from a blood vessel of the subject, measuring a second parameter from the blood vessel, deriving a calibration function based on the second parameter, and using the calibration function. Correcting the first parameter. Once calibrated, the second parameter is monitored continuously or periodically and changes in that parameter are used to indicate changes in hemodynamic properties of interest. In a first exemplary embodiment, the first parameter comprises a pressure waveform, and the second parameter comprises the total flow kinetic energy of the blood in the blood vessel. During the measurement of the pressure waveform, the blood vessel is applanated (compressed) to induce a change in the hemodynamic properties of the blood vessel and the circulatory system, then the kinetic energy during such applanation is measured, and Used to identify one or more artifacts in the pressure waveform. A correction function is then generated based on these artifacts and applied to the measured waveform to generate a corrected or calibrated waveform representing the actual pressure in the blood vessel. In a second exemplary embodiment, the maximum velocity of blood flow in the blood vessel is determined using an acoustic signal to derive a calibration function.
[0024]
In a second aspect of the present invention, an improved method for calibrating a pressure signal obtained from a blood vessel of a living subject using one or more measured parameters is disclosed. In general, the method includes measuring a pressure waveform from a blood vessel, measuring a second parameter at least periodically from the blood vessel, deriving a calibration function based on the second parameter, and using the derived calibration function. And correcting the first parameter. In one exemplary embodiment, the method comprises measuring a pressure waveform from a blood vessel of the subject, measuring a second parameter from the same blood vessel at least once, detecting at least one of the pressure waveforms based on the second parameter. Identifying a plurality of artifacts, deriving a calibration function based on the measured second parameter and at least one property associated with the at least one artifact, generating a calibrated representation of blood pressure in a blood vessel. Applying the calibration function to the pressure waveform at least once and continuously monitoring the second parameter to identify blood pressure variations over time.
[0025]
In a third aspect of the present invention, an improved method for characterizing the circulatory hemodynamic response of a living subject is disclosed. The method generally comprises deriving a first functional relationship between a first parameter and a second parameter associated with a blood vessel under certain conditions; Measuring the first parameter and the second parameter, identifying at least one artifact in at least one of the measured parameters, and determining the first parameter based on at least the first functional relationship and the at least one artifact. Scaling the measurement of.
[0026]
In a fourth aspect of the present invention, an improved method for calibrating a hemodynamic parameter measurement having an error component is disclosed. In general, the invention involves measuring a hemodynamic parameter associated with a blood vessel, identifying an error source associated with a first parameter, generating a calibration function based on the error source, and using the calibration function. Correcting the measured hemodynamic parameters. In one exemplary embodiment, the method measures a pressure waveform from a blood vessel and identifies periodic variations associated with kinetic energy (or maximum velocity) of blood in the blood vessel over time due to respiratory action. Generating a calibration function based on synchronization with the kinetic energy variation over time, and applying the calibration function to the waveform to correct the waveform for periodic variations. This respiratory effect is fully detectable from the pressure signal and potentially from other signals.
[0027]
In a fifth aspect of the present invention, an improved device for measuring hemodynamic properties in a blood vessel of a living subject is disclosed. The apparatus generally includes a first transducer for measuring a first hemodynamic parameter associated with a blood vessel, a second transducer for measuring a second hemodynamic parameter associated with a blood vessel, and operatively connected to the first and second transducers. A signal processor for generating a calibration function based on the signal produced by the second transducer and applying a correction function to the signal produced by the first transducer. In one exemplary embodiment, the blood vessel comprises the radial artery of a human, and the device includes a pressure transducer positioned non-invasively near the acoustic transducer, a sound transducer also positioned near the same, a blood vessel. It includes an applanation device used to applanate, and a processor that processes signals from pressure and acoustic transducers throughout the applanation of the vessel. An acoustic transducer transmits an acoustic emission into a blood vessel and receives echoes therefrom. Information about the velocity and / or kinetic energy of the blood during the applanation is then applied to the measured pressure waveform to calibrate it.
[0028]
In a sixth aspect of the present invention, there is disclosed an improved computer program for performing the foregoing method for hemodynamic assessment, modeling, and calibration. In one exemplary embodiment, the computer program is C ++ An object code representation of the source code listing is included, wherein the object code representation is located on a storage device of the microcomputer system and is adapted to run on a microprocessor of the microcomputer system. The computer program further includes a graphical user interface (GUI) operatively coupled to the display and input devices of the microcomputer. The program includes one or more subroutines or algorithms that perform the hemodynamic assessment, modeling, and calibration methodologies described herein based on the measured parameter data supplied to the microcomputer. In a second exemplary embodiment, a computer program comprises a set of instructions located in a storage device (such as an embedded program memory) of a digital signal processor (DSP) associated with the aforementioned hemodynamic measurement device. .
[0029]
In a seventh aspect of the present invention, there is disclosed an improved apparatus for analyzing parameter data obtained according to the above method and utilizing the above computer program. In one exemplary embodiment, an apparatus comprises a serial parallel data processor operatively coupled to a processor, a non-volatile storage device, a random access memory, an input device, a display device, and one or more sensing devices. Includes microcomputer with port. Data obtained from the subject under analysis is input to the microcomputer via a serial or parallel data port. The object code representation of the computer program stored on the storage device is loaded into a random access memory of the microcomputer and converts the input data in association with a command entered by the user via the input device. Executed on the processor according to the request to be analyzed.
[0030]
In an eighth aspect of the present invention, an improved method for treating a subject using the method described above is disclosed. The method generally includes selecting a subject's blood vessel to be useful for measuring pressure data, non-invasively measuring the subject's pressure data, generating a calibration function, measuring blood pressure in the blood vessel. Applying a calibration function to the measured pressure data to produce a calibrated display; and administering treatment to the subject based on the calibrated estimates. In one exemplary embodiment, the blood vessel includes a human radial artery, and the method includes measuring a pressure waveform from the radial artery via a pressure transducer, an acoustic wave to measure at least one hemodynamic parameter. Using, to derive a calibration function based at least in part on the measured hemodynamic parameters, to derive a calibrated representation of blood pressure useful for diagnosing one or more medical conditions in the subject. Calibrating the pressure waveform using the calibration function, and preparing a course of treatment for the subject based in part on the calibrated display.
[0031]
In a ninth aspect of the present invention, an improved method for detecting a lumen located within a blood vessel is disclosed. The method generally includes transmitting acoustic energy into the blood vessel, assessing a signal level of the acoustic energy reflection as a function of the propagation of the energy within the blood vessel, and at least one of the reduced signal level within the reflection. Including identifying regions. In one exemplary embodiment, a power metric is derived from an A-mode envelope. The integral of the backscattered power as a function of depth is used to identify artifacts (eg, "plateaus"), which are used, with appropriate constraints, to detect lumen depth. Is done. In a second embodiment, the backscattered energy (eg, A-mode signal) uses a power calculation performed over a preselected depth interval to identify regions of reduced signal level within them. Analyzed.
[0032]
In a tenth aspect of the present invention, a method for detecting at least one wall of a blood vessel is disclosed. The method generally comprises transmitting acoustic energy into a blood vessel, detecting at least one region associated with a lumen in the blood vessel, and detecting a position of at least one wall of the blood vessel relative to the lumen. Including, detecting position includes analyzing A-mode data derived from transmitted acoustic energy. In one embodiment, a wall is detected by comparing the integrated power at a given depth to the average luminal power. In another embodiment, the level (amplitude) of the envelope squared signal is compared to that of the lumen.
[0033]
In an eleventh aspect of the present invention, a method for determining a diameter of a blood vessel is disclosed. The method generally includes transmitting acoustic energy into the blood vessel, detecting a region associated with the lumen in the blood vessel, detecting a position of the first wall of the blood vessel relative to the lumen, Detecting a position of the second wall and determining a diameter of at least a portion of the blood vessel based at least in part on the positions of the first and second walls.
[0034]
In a twelfth aspect of the present invention, an improved method for assessing one or more hemodynamic parameters associated with a live subject using lumen detection is disclosed. The method generally comprises transmitting acoustic energy into a blood vessel, detecting a luminal region associated with the blood vessel, detecting at least one wall associated with the blood vessel based on the detection of the lumen, Analyzing the change in the position of at least one wall as a function of the stress applied to estimate the hemodynamic parameters of the at least one wall. In one exemplary embodiment, the method includes analyzing the A-mode signal to detect anterior and posterior arterial walls (via a lumen) and determining arterial diastolic blood pressure. This involves mapping arterial diameter variations as a function of applanation pressure on the pressure waveform.
[0035]
In a thirteenth aspect of the present invention, an improved method for vascular location in a tissue of a living subject is disclosed. The method generally includes generating acoustic energy, transmitting acoustic energy into a subject's tissue near a blood vessel, receiving at least a portion of the backscattered energy by the blood vessel, vascularizing the blood vessel based on the backscattered energy. Detecting at least one artifact associated with and determining a location of a blood vessel based at least in part on the detected artifact. In one exemplary embodiment, the blood vessels include the human radial artery, and the acoustic energy includes ultrasound energy transmitted into the artery via an internal region of the subject's wrist / forearm. The energy backscattered from the arterial wall and lumen is received by the ultrasound transducer and analyzed using an integrated power metric to identify the transducer's position and / or optimal position relative to the artery.
[0036]
In another embodiment, the integrated power and / or signal level is analyzed as a function of tissue depth to detect lumen position. The location of the arterial wall is then determined relative to the lumen, thereby allowing a measurement of the diameter of the artery. The position of the transducer relative to the artery is adjusted to maximize wall separation (diameter), thereby keeping the transducer (and any associated applanation devices) effective just above the artery. To maintain the transducer in any other desired orientation relative to the vessel, e.g., with a fixed offset, with an offset that varies as a function of the diameter of the vessel, or other parameters such as signal quality. Algorithms may also be adjusted to control the position of the transducer based on the presence of cystic components or clutter, etc.
[0037]
(Detailed description of the invention)
Reference is made to the drawings, wherein like numerals refer to like parts throughout the drawings.
[0038]
It is noted that the present invention is described herein in terms of a method and apparatus for assessing circulatory hemodynamic parameters via the radial artery (ie, the wrist) of a human subject. Can be said to be embodied or adapted not only to monitor such parameters at other locations in the body, but also to monitor these parameters on other warm-blooded species. All such adaptations and alternative embodiments are considered to be within the scope of the claims appended hereto.
[0039]
Overview
In one basic aspect, the invention includes a method for assessing hemodynamic parameters in a living subject by artificially inducing "stress" in the circulatory system of the subject. The response of the circulatory system to these stresses is known or determinable, and is useful for identifying artifacts or markers with the observed data. These markers are then used to calibrate the measurements of the aforementioned hemodynamic parameters.
[0040]
For example, as described in more detail below, the present invention is useful for calibrating a blood pressure waveform obtained from a pressure measurement sensor or a surface pressure sensor placed over the human radial artery, and is uncalibrated. Pressure waveforms potentially vary substantially from those actually experienced within the radial artery itself. In one embodiment, the "stress" applied to the artery is applanation (ie, compression), and the velocity of blood flowing through the area of applanation is monitored to identify markers in the velocity profile. These markers correspond to, among other things, near zero transmural pressure across the arterial wall. In this way, accurate measurements of true arterial pressure may be obtained non-invasively. However, it will be appreciated that the invention described herein may be applied to other blood circulations such as pressure differences between two locations within a blood vessel, compliance of the venous or arterial wall, variations in the intensity of ventricular contractions, and the like. It is also easily used to assess mechanical properties and is therefore not limited to measuring arterial blood pressure.
[0041]
How to assess hemodynamic properties
Referring to FIG. 3, a method for assessing hemodynamic properties, including circulatory blood pressure, according to the present invention will be described. As shown in FIG. 3, a
[0042]
Next, in
[0043]
At
[0044]
In
[0045]
In
[0046]
However, as will be described in further detail hereinbelow, the present invention advantageously provides for the first time t 1 To generate a calibration function, and then continuously monitor a second hemodynamic parameter (eg, maximum velocity, maximum kinetic energy, maximum area, or maximum flow rate) to indicate the variation of the measured parameter. Prepare. This is accomplished in
[0047]
At
[0048]
With reference to FIG. 3a, one embodiment of a method for measuring one or more hemodynamic parameters in a live subject (
[0049]
Next, in
[0050]
With regard to the human radial artery, a further note is that anecdotal evidence suggests that the radial artery is minimally affected by arterial disease, including stenosis and calcification due to diabetes. is there. The reasons for this observed behavior are beyond the scope of this discussion. However, this behavior is somewhat important in the discussion of applanation stress performed herein with respect to FIG. 3b. Pre-existing arterial disease, such as medial calcification, can strongly affect the ability to accurately measure arterial blood pressure. By selecting the radial artery when performing blood pressure measurements utilizing controlled applanation as applied stress, the user is effectively isolated from many potential sources of error related to pre-existing stenosis and calcification. You.
[0051]
Next, at
[0052]
At
[0053]
With reference to FIG. 3b, one embodiment of a method for inducing one or more stresses in the circulatory system of a subject (
[0054]
4a and 4b, the hemodynamic effect of flat pressure will be described in detail. As will be readily appreciated, increasing applanation of an
[0055]
FIG. 4b illustrates the peak or peak flow rate in the artery as a function of the percent reduction in arterial fluid area. Although the whole blood flow kinetic energy is also related to area, in part, due to its relationship to velocity, it is somewhat more difficult to derive, as described in more detail below. For the sake of simplicity in the current discussion, it is assumed that the percent decrease in fluid area is directly proportional to the applanation pressure applied to the tissue (skin) surface, but in practice this relationship is substantially reduced as described further below. Note that this is more complicated in nature. Further, FIG. 4b generally illustrates "steady state" operation, and does not examine the effects of pressure fluctuations due to, for example, normal cardiac cycles, also discussed in more detail below.
[0056]
As illustrated in FIG. 4b, in the region of
[0057]
As the fluid area further decreases, a transition occurs through what is known as a “danger”
[0058]
Examining FIG. 4b yields important information in characterizing one response of the circulatory system to one applied stress. In particular, the behavior of velocity as a function of applanation, and most notably the increase in maximum velocity in the velocity profile, allows the identification of points where the intraarterial pressure is virtually equal to the pressure applied to the arterial wall by external applanation To do. This state is referred to herein as a "zero transmural pressure" state. During the applanation sweep illustrated in FIGS. 4a and 4b, a point is reached where the external pressure applied outside the arterial wall is just offset by the intraarterial pressure. Until this point is reached, a significant decrease in fluid area (and, as explained above, the attendant changes in velocity, velocity gradient, volumetric flow (Q), and kinetic energy) Does not happen. However, as the applied pressure exceeds the intra-arterial pressure, the diameter and cross-sectional area of the artery begins to decrease, and the maximum flow velocity and velocity gradient begin to rise and steep (
[0059]
However, as discussed above, the circulatory system is not a stationary system, but rather a dynamic one, and is not only due to normal cardiac cycles, but also due to this and other factors such as respiration (discussed below). And undergoes significant intra-atrial pressure fluctuations. Therefore, such pressure fluctuations must also be taken into account when measuring the hemodynamic properties, in particular the arterial pressure.
[0060]
With reference to FIGS. 5a to 5d, the reaction of the circulation system under the aforementioned dynamic pressure fluctuation will be described. FIG. 5 a illustrates a human normal sinus
[0061]
FIG. 5b illustrates the displacement of the arterial wall as a function of the external applanation pressure applied to the artery according to FIG. 5a and of the
[0062]
As shown in FIG. 5 b, variations in intra-arterial blood pressure deflect the wall of the artery outward to a
[0063]
As with the velocity curve of FIG. 4b, the curve of FIG. 5d shows a zero curve during both the diastolic and systolic portions of the cardiac cycle (or any other portion therebetween). Useful for marking the point at which wall pressure is achieved throughout the applanation sweep. The utility and application of this information will be described in detail herein with reference to FIGS.
[0064]
The foregoing exemplary application of compressive stress or applanation stress is useful, inter alia, for measuring selected intra-arterial blood pressures, but evokes other types of stresses in the circulatory system to be convinced. In some cases. Artifacts or "markers" associated with these stresses are in a manner generally similar to those for applanation stress, i.e., the presence of markers or known relationships is generally determined by certain It can also be used by correlating with the hemodynamic state of the patient. Therefore, the method of FIG. 3b is by no means limited to the use of compressive stress.
[0065]
Returning to FIG. 3b, a
[0066]
In
[0067]
Referring to FIG. 3c, one embodiment of a method for measuring a second hemodynamic parameter associated with a blood vessel to facilitate the derivation of a calibration function (step 306 in FIG. 3) will be described. In a
[0068]
Next, at
[0069]
Similarly, acoustic measurement techniques may be used to derive a measurement of the kinetic energy of blood flowing through a subject vessel. Note that as a result of the complex blood velocity gradient created in the vessel during applanation (FIG. 4a), the calculation of the kinetic energy of the blood in the vessel as a whole is the square of the maximum blood velocity described above. Is not simply proportional to Rather, estimating its kinetic energy requires the application of summing or integrating techniques that capture the complexity of this gradient. Such summation / integration techniques for calculating blood kinetic energy are well known in the art and therefore will not be described further herein.
[0070]
In another embodiment, the applanation (external) pressure at which the desired marker is indicated is determined by the assignee's co-pending US patent application Ser. No. 09 / 342,549, the contents of which are previously incorporated herein. May be determined using the time-frequency methodology described in US Pat. Using this time-frequency methodology, the applanation pressure at which the transmural pressure equals zero can be determined by plotting a time-frequency representation of the acoustic energy reflected within the artery. When the time-frequency distribution is maximal, a zero transmural pressure condition is achieved. Therefore, the time-frequency distribution serves as yet another marker for the purposes of the present invention.
[0071]
In still other embodiments, a so-called acoustic "A-mode" may be used to monitor the second hemodynamic parameter. In this approach, acoustic waves are generated and transmitted into a blood vessel, reflections or reverberations from the transmission are received and analyzed to determine the relationship between the time of transmission and the time of reception. Through such analysis, the relative diameters of the arteries at different points in time and at different points in the cardiac cycle can be determined. Similar to the well-known time-domain reflectometer (TDR), the A-mode technique, in one embodiment, employs various boundaries between materials of different acoustic properties (eg, "near" arterial wall / tissue boundaries, " It takes advantage of the reflections generated by acoustic wave transitions across the "near" artery wall / bloodstream boundary, the blood flow / "far" artery wall boundary, etc. In particular, the relative timing of these reflections is analyzed to determine the distance between the various boundaries. Knowing the speed of propagation of the acoustic wave through the different media, the reflective boundaries (ie, tissue thickness, artery diameter, etc.) can be determined. Referring to FIG. 5b, if one recalls that the bowing of the arterial wall (under both the systolic and diastolic portions of the cardiac cycle) varies as a function of applanation pressure, the arterial diameter (and related The change in area can also be used as a "marker" for these conditions to identify zero transmural pressure conditions or other important conditions, similar to using increasing top speed.
[0072]
Other techniques for assessing hemodynamic parameters using A-mode sound may also be employed. Such alternative techniques are discussed in further detail herein with respect to FIGS.
[0073]
To further convince, the invention includes other acoustic modalities, including "M mode" (motion mode) and "B mode" (luminance mode), which are well known in the acoustic signal art. Can be adopted along with.
[0074]
Regardless of the use of acoustic waves in each of the foregoing embodiments for measuring the second hemodynamic parameter and its associated marker, other non-acoustic techniques may be used to identify such a marker, as will be appreciated. May be applied. Other methods of accurately measuring arterial diameter / area may be employed to identify a zero transmural pressure condition, for example, using interferometry. All such techniques are considered to be within the scope of the present invention.
[0075]
Referring to FIG. 3d, the stressor magnitude at which the desired hemodynamic state is achieved (eg, the applanation pressure at which zero transmural pressure is achieved) is correlated to the actual or true arterial pressure. In the simple case where there is a high degree of coupling between the applied stress and the stress actually felt by the blood vessels, the measured stress can be equal to the real stress. In particular, in the context of arterial blood pressure measurement as applanation (compression) stress is applied, the pressure applied by the applanation device and sensed by the associated pressure transducer is monitored by an artifact or "marker" condition. Can be equal to the actual arterial pressure. For example, if the increasing blood kinetic energy correlates to a state of zero or near zero transmural pressure, as discussed above, the pressure applied to the arterial wall when such an increase in kinetic energy is observed Will be equal to the intraarterial pressure. Therefore, if the pressure applied between the point of application (eg, skin) and the wall of the artery was very high, the pressure applied at the point of application would approximate the pressure applied to the wall of the artery. Yes, and will therefore also approximate the arterial pressure.
[0076]
However, as discussed above, the tissue, tendons, and skin intervening between the arterial wall and the pressure transducer often cause the pressure applied by the transducer (or applanation mechanism) and the arterial wall to actually reduce Creates a complex relationship with the perceived pressure. Briefly, some of the pressure applied to the skin is used to compress this intervening material. Therefore, only a portion of the externally applied pressure is actually felt by the arterial wall. Furthermore, it should be noted that the tissue is also under the blood vessels and above the bone, and there is also some loss in compressing this tissue.
[0077]
Thus, when arterial pressure measurements are based on externally applied pressure (eg, pressure measured by a pressure transducer), depending on the tissue compliance and degree of binding for a given subject, such A certain amount of error will be introduced in the measurement.
[0078]
One prior art approach to this problem is to model the response of the intervening material (e.g., as a system of springs with a linear force constant) and correct the pressure measured by the pressure transducer based on this model. there were. However, this approach is only as good as the model used. Different subjects with different tissue thickness, density, and compliance values (as well as tendon and bone positions with respect to each other and with respect to arteries) respond differently, and these differences are compensated for in such models. I can't. Still further, even for a single subject, changes in the tissue and arterial response of that subject may occur over time or as a function of externally induced stress. For example, when an anesthetic is introduced into a subject's circulatory system, a given artery becomes substantially more compliant, thereby losing much of its resilience. This change in compliance changes the relationship between the actual and measured arterial pressure, and thus reduces the accuracy of any blood pressure estimates based thereon.
[0079]
In contrast, the methodology of the present invention measures this important limitation, as opposed to comprehensively modeling the subject as in the prior art, but for each subject the actual reaction of its intervening tissue and material. Overcome by In particular, the present invention generates a functional indication of the compliance of these components based on the actual compression of tissue and arteries.
[0080]
In the exemplary embodiment of the
[0081]
Thus, the derived transfer function described above is used to correct errors introduced by intervening tissue or the like in the incomplete pressure transfer measured by pressure sensing by identifying the region of interest by
[0082]
The transfer function and / or transfer fraction is displayed after measurement in any of a variety of different formats, such as a look-up table in a digital random memory, as described further below with respect to the apparatus of FIG. And may be stored. Further, as will be immediately appreciated, the
[0083]
Similarly, as will be appreciated, methods for determining transfer functions / transfer fractions other than A-mode acoustic techniques may be used alone or in conjunction with A-mode techniques.
[0084]
In short, the
[0085]
It should be noted that while certain environments and individual subjects may require the determination and application of a transfer function as described with respect to FIG. 3d, the general methodology of the present invention may in some cases require a transfer function. Is potentially applicable without it. For example, if the subject has a high degree of coupling between the skin and the artery wall, errors related to the pressure measured via a transducer placed on the skin surface may constitute a small fraction of the total measurement. And thus may be acceptable in certain surveillance environments. Therefore, the calculation and application of the transfer function is not a requirement of the present invention under all circumstances.
[0086]
With reference to FIG. 3e, a method for continuously calibrating the hemodynamic parameters will be described. As discussed above with reference to FIG. 3d, the transfer function is useful for correcting the measured pressure waveform for compression of intervening tissue, arterial wall, etc. This transfer function is obtained during an applanation sweep performed at a given monitoring location on the subject, such as the radial artery. However, in order to be able to continuously monitor the arterial blood pressure of the subject, it is necessary to accurately monitor changes in the measured parameters and to scale between calibration events (eg applanation sweeps). A mechanism that can do this is needed.
[0087]
As discussed above, prior art calibration approaches have relied on periodic calibration events (such as asculatory cuff measurements) to "continuously" calibrate the measured pressure waveform. These systems. The term "continuously" used with reference to is a somewhat inappropriate expression. This is because what actually happens is a periodic (rather than continuous) update of the scaling function. This approach exposes at least one serious deficiency, the lack of calibration during the interval between periodic calibration updates. Depending on the activity of the monitored subject, their arterial blood pressure can fluctuate very quickly, in some cases rapidly or in a prompting manner. For example, during a surgical procedure, actions by the surgeon, such as an arterial resection, can have profound effects on the subject's circulatory system, including the subject's arterial blood pressure. Similarly, the pre-induction (ie, pre-anaesthesia) and post-induction blood pressure values are largely due to changes in compliance in many of the arteries in the subject's body resulting from the anesthetic. The differences between are dramatically different.
[0088]
Since prior art approaches never monitor the actual hemodynamic properties that occur within the arteries, if such significant changes in true arterial blood pressure occur during periodic calibration events, they are often detected. Remains untouched. Rather, such prior art approaches typically monitor blood pressure manometrically, and these measurements are potentially very different from the actual arterial pressure. Prior art systems typically adjust the scaling or calibration to compensate for the measured change in blood pressure by the pressure measurement (which may or may not be near true blood pressure). The results of this method include producing so-called "calibrated" blood pressure values that are not calibrated in fact, but include widely varying scaling components. This failure to track the actual pressure, or true arterial blood pressure, between calibration events is a consequence of minute-to-minute measurements of blood pressure, such as during surgery. If so, it could be catastrophic.
[0089]
The methodology of the present invention employs the measurement described above to track changes in the first, or "primary", measured hemodynamic parameters (eg, blood pressure), as described in further detail below. Overcoming the aforementioned critical limitations of the prior art by using the determined "second" hemodynamic parameters.
[0090]
In one embodiment, as illustrated by the method 370 of FIG. 3e, the kinetic energy of the blood is monitored using the acoustic (or other) technique described above, while the zero transmural pressure condition (or is significant). Is maintained in the artery. In particular, in the embodiment described below with respect to FIG. 12, also the applanation device, including the pressure transducer and the ultrasonic transducer, "servo" the skin over the artery monitored in
[0091]
Next, at
[0092]
At
[0093]
Notwithstanding the foregoing, as will be appreciated, the continuous calibration of the first hemodynamic parameters using the method of FIG. 3e can be performed, for example, with additional or other secondary blood flow rates and / or arterial cross-section (fluid) areas. May be accomplished using two parameters.
[0094]
Again, note that, in contrast to the prior art approach, the techniques of FIGS. 3-3e discussed above advantageously do not involve modeling or estimating parameters in the circulatory system of the subject being monitored. All information is derived via direct measurement of the subject at the selected location and is therefore particularly suitable for that individual and that location.
[0095]
How to characterize circulatory hemodynamic responses
Referring to FIG. 9, a method for characterizing the circulatory hemodynamic response of a living subject is disclosed. As illustrated in FIG. 9, a
[0096]
Next, in
[0097]
Next, at
[0098]
Finally, in
[0099]
Still further, the effects of potential errors (such as errors due to imperfect signal transfer due to organizational compliance) may be compensated as part of
[0100]
Calibration method for periodic error sources, including respiration
With reference to FIG. 10, a method for calibrating hemodynamic measurements for periodic error sources is disclosed. A
[0101]
Next, in
[0102]
Next, in
[0103]
The origin of the respiratory cycling is related to the fluctuating pressure that occurs as the diaphragm moves up and down. With inspiration, the diaphragm naturally lowers, increasing intra-abdominal pressure and decreasing intra-thoracic pressure. Increasing the pressure difference from the abdominal cavity to the right atrium increases the volume flow returning to the right atrium. With exhalation, the diaphragm rises, intraperitoneal pressure decreases, and intrathoracic pressure increases. The result is more venous regurgitation from the lower extremities to the abdominal cavity, but less regurgitation to the right atrium. Cyclic changes in volume and pressure are reflected everywhere throughout the circulation. For it is a closed system.
[0104]
The above-described cyclic respiratory changes produce, inter alia, fluctuating flow rates and fluctuating kinetic energies for diastolic and systolic pressure. In normal adults, anecdotal evidence obtained by the applicant of the present application suggests that the magnitude of such fluctuations is severe, on the order of 20 mmHg (2.7 kPa) or more. Taking the fractions or percentages of systolic and diastolic pressures, this variation in pressure is the lower diastolic measured when the subject is particularly difficult to walk, such as during surgery. Significant for period pressure.
[0105]
These variations are compensated for in the present invention, when needed, by synchronizing to the derivation of a calibration function from the measurement of the second parameter (eg, velocity, kinetic energy, or area). In particular, at
[0106]
Next, at
[0107]
Finally, at
[0108]
As will be appreciated, while the foregoing discussion has been in terms of periodic errors due to respiratory effects, other types of errors, periodic or aperiodic, may also be used in books such as that illustrated in FIG. Using the methodology of the invention, compensation can be made. For example, the effects of the subject's intracardiac arrhythmia can be identified and compensated during the derivation of the calibration function. The subject's intracardiac arrhythmia can be identified using signal processing algorithms that are particularly adapted for the purpose of identifying aperiodic components in the waveform, such algorithms being well known to those skilled in the signal processing arts. is there. Many other types of aperiodic component errors can also be identified in connection with the method of FIG.
[0109]
Hemodynamic assessment device
An apparatus for measuring the intravascular hemodynamic properties of a raw subject will be described with reference to FIG. In the illustrated embodiment, the device is adapted for measuring blood pressure in the radial artery of a human. However, as will be appreciated, other hemodynamic parameters, other monitoring sites, and other types of living organs may be utilized with the present invention in the broadest sense of the present invention. The
[0110]
The
[0111]
During the calibration “sweep”,
[0112]
Optionally,
[0113]
One particular embodiment of the apparatus for assessing hemodynamic parameters of FIG. 12 will be described with reference to FIG. In the embodiment of FIG. 13,
[0114]
Note that the
[0115]
Computer programs and related equipment
A computer program that implements the aforementioned methods of hemodynamic assessment, modeling, and calibration is described. In one exemplary embodiment, the computer program implements the methodologies of FIGS. 3-3e, 9, and 10 either individually or in combination. ++ Contains the object ("machine") code representation of the source code listing. C ++ A language is used in this embodiment, but as you know, for example, Visual Basic TM , Fortran, and C + Other programming languages may also be used, including The object code representation of the source code listing is compiled and placed on a type of media storage device well known in the computer arts, as illustrated in FIGS. 14a-b. Such media storage devices include, but are not limited to, optical disks, CD ROMs, magnetic floppy disks, "hard" drives, and even magnetic bubble memories. The computer program further includes a graphical user interface (GUI) of a type well known in the programming arts, which comprises a host computer (as described below with respect to FIG. 15) or a device on which the program is run. Operatively coupled to a display and an input device.
[0116]
In terms of overall structure, the program, in one embodiment, is a series of subroutines that implement the hemodynamic assessment, modeling, and calibration methodology described herein based on measured parameters provided to a host computer. Or, it is composed of an algorithm. In a second embodiment, the computer program is located in an embedded storage device, i.e., a program memory, of a digital signal processor (DSP) or microprocessor associated with the aforementioned hemodynamic measurement device of FIG. Including assembly language / microcoded instruction sets.
[0117]
One embodiment of a device capable of analyzing parameter data and generating a calibrated value of a hemodynamic parameter as disclosed herein is described.
[0118]
The above-described computer program useful for assessing hemodynamic parameters is stored in RAM 1504 and / or
[0119]
In still other embodiments, the apparatus includes a personal computing device (such as a personal digital assistant, or PDA), which receives input data from pressure and acoustic sensors and stores the data. Is adapted to produce a calibrated measurement of blood pressure. Also, as will be appreciated, other portable devices, such as laptop computers, calculators, and personal organizers, may be configured to run the computer programs of the present invention. Still further, various different methods of transmitting input sensor data to these devices can be used, including a networked computer or wireless data link.
[0120]
How to give treatment
Referring to FIG. 16, a method for treating a subject using the above-described method for assessing hemodynamic parameters is disclosed. As illustrated in FIG. 16, the
[0121]
Next, in
[0122]
Next, at
[0123]
In
[0124]
In
[0125]
Finally, in
[0126]
Alternative (backscatter) embodiment
As discussed above, backscattered acoustic energy (such as "A-mode" ultrasound energy) may be used to determine hemodynamic parameters including, for example, arterial diameter and end-diastolic blood pressure. is there. As used herein, the term "A-mode" refers to conventional A-mode (i.e., amplitude versus depth (time) indication via a repeating line) and M-mode (i.e., gray distributed over the time dimension). Scale modes) and other related modalities such as B-mode (ie, "steered" grayscale images that display depth (time) versus width), and such alternative modalities are super- It is well known to those skilled in the art of sonic technology. Therefore, to be convinced, the following discussion is in terms of A-mode, but other related modalities may also be fully employed.
[0127]
17-37 illustrate yet another embodiment of a method and apparatus for measuring hemodynamic parameters according to the present invention. This embodiment uses A-mode ultrasound energy to determine the arterial wall position based on analysis of the resulting reflected energy waveform, where the wall position is a "marker" or "marker" in the sensed pressure waveform. Used to help identify artifacts, the markers or artifacts are correlated to blood pressure measurements. The A-mode ultrasound energy of the present embodiment advantageously complements the Doppler spectral modality described earlier herein, but may also be used alone if desired, thereby providing a system designer And the ultimate end user of the device, with greatly enhanced flexibility in both design and operation. In particular, at least three different modes of operation are contemplated by the present invention: (i) A-mode alone, (ii) Doppler-based detection alone, and (iii) the combined A-mode and Doppler-mode functionality. Including, including. Although not required, complementary modality as in (iii) advantageously enhances the reliability and robustness of the results obtained with the instrument.
[0128]
It has been observed by the assignee of the present application that various such hemodynamic markers occur in the sensed pressure waveform as the blood vessels are increasingly compressed (applanation). In one aspect, certain "flat spots" occur during the end diastolic portion of the waveform, where the change in sensed pressure as a function of time is low (or at least, less than the peripheral portion of the waveform). Low). These flat spots correlate with various phenomena within the tissue surrounding the blood vessel and within the blood vessel itself, including overcoming the hoop stress associated with the walls of the blood vessel. As discussed earlier herein, hoop stress associated with a substantially cylindrical hollow body, such as the human radial artery, acts as a retarding force against further compression. In other words, a finite force (ie, pressure over a given area) must be applied to the outer surface of the vessel before the cross-sectional area of the vessel significantly deforms. Beyond this point of deformation, a proportionally small additional force is required to further deform the blood vessel. Thus, once overcome, the hoop stress component is effectively removed, thereby allowing pressure externally applied to the vessel wall to equilibrate with a pressurized lumen (eg, blood) flowing through the vessel. To keep the cross section of the vessel essentially constant (zero transmural pressure). This condition is important in that once hoop stress is overcome, intravascular pressure is in fact transmitted directly across the arterial wall. However, the point along the applanation profile on which such a flattened (ie, zero transmural pressure) condition exists is from individual to individual, from seed to seed, and from position to position for a single individual. , Will fluctuate. Therefore, additional techniques are required to accurately isolate points on the pressure waveform where the desired transmural pressure condition exists.
[0129]
One such technique (described in more detail below) is to detect the anterior and posterior walls of the vessel being evaluated, and this information is used to directly determine the reduction in vessel diameter. You. As indicated above, the decrease in vessel diameter can be directly related to certain systolic and diastolic conditions and correlated with certain occurrences of the aforementioned hemodynamic markers. it can.
[0130]
Lumen and wall detection
The methodology of the present invention advantageously employs A-mode ultrasonic energy to detect the lumen of the blood vessel and the position of the anterior and posterior walls. As used herein, the terms "front" and "back" do not imply a particular spatial orientation, but rather a movement fired from an ultrasound source. It simply refers to the order in which the resulting ultrasonic wavefront encounters the vessel wall during direct propagation. Therefore, what is said to be the "front" wall when measuring hemodynamic properties in one transducer orientation may become the "rear" wall in another transducer orientation. Specific to the present invention is the use of lumen detection as a means of front and back wall detection. That is, due to the relatively low backscatter of ultrasound energy by the lumen compared to other vascular components, the position of the lumen may be easily identified from the backscattered energy, and The posterior vessel wall is identified for this.
[0131]
FIG. 17 illustrates a general methodology for using backscattered ultrasonic energy for lumen and wall detection in accordance with the present invention. Ultrasound energy is generated by a device (eg, the
[0132]
The processed signal is then analyzed at
[0133]
Next, one or both vessel walls are detected in
[0134]
As shown in FIG. 17a, one embodiment of the signal processing (step 1704) associated with the illustrated A-mode lumen and wall detection approach is to baseband the "raw" backscattered A-mode signal (step 1704). bsebanding (quadrature demodulation) (step 1720), squaring the basebanded A-mode signal (step 1722), thereby producing "envelope squared" data, and by step 1724 a predetermined sampling rate (eg, Decimate to 2 MHz). Next, a depth dependent gain (eg, TGC) is applied to the envelope squared data by
[0135]
FIG. 18 is a plot of A-mode signal amplitude versus time associated with the radial artery of a living subject, referred to herein as “raw” A-mode data. Note that the time axis in FIG. 18 has been converted to depth based on the speed of propagation of the ultrasound through the tissue. This conversion is performed because depth is more easily interpreted than time for the purposes of the present invention. However, to be convinced, time (or other expressions such as time scales) is equally used and works.
[0136]
One important feature identified in FIG. 18 is the level or amplitude of the A-mode signal as a function of depth. As illustrated in FIG. 18, in this example there is a clear range of about 1.5 mm to 3.35 mm, where the signal level is very low. This low signal amplitude results from a low backscatter of energy associated with blood (lumen) flowing in the blood vessel under examination.
[0137]
Further, the 16 MHz center frequency used in this example is clearly depicted in FIG. The first step in signal processing is to remove the center frequency because the center frequency does not carry information related to the location of the artery wall. This process is represented as quadrature demodulation (or envelope detection), identified as
[0138]
The quadrature demodulation used in this embodiment generally involves multiplying the A-mode signal by a sine function and a cosine function, and low-pass filtering. The purpose of quadrature demodulation is to baseband the A-mode signal through removal of the transmission carrier frequency. This method is generally illustrated in FIG. As shown in FIG. 20, quadrature demodulation involves adding a complex exponential function exp (−2πf) to the received backscattered “raw” A-mode signal. c t), where f c Represents the transmission center frequency of the signal (step 2004). This yields a series of values that represent the sum and difference frequencies of the complex exponential and the A-mode signal. Next, the resulting signal is low-pass filtered (step 2006) to retain only the difference (baseband) frequency components. Since the exponential function is complex, it gives rise to both in-phase and quadrature channels designated by I and Q, respectively. This process is depicted graphically in FIG.
[0139]
In the exemplary embodiment, the frequency of the sine wave is the center frequency f of the A-mode signal. c 16 MHz, which corresponds to The sampling interval of the sine wave is equal to that of the digitized A-mode signal sampled at an effective rate of 64 MHz. Multiplication by a sine wave and a cosine wave is as follows.
[0140]
(Equation 2)
Where a (nT) is the sampling interval T = 1 / F s Represents a "raw" A-mode signal with s Represents a sampling rate (for example, 64 MHz). This multiplication is performed for the entire duration of the A-mode line. In-phase and quadrature components, X I (NT D ) And X Q (NT D ) Is Y cos (NT), Y sin (NT) is obtained by low-pass filtering. Where T D Represents a digitized sampling interval.
[0142]
The low pass filtering (
[0143]
Note that in the illustrated example, the filter output only needs to be conveniently sampled at a rate of about 16 MHz, as compared to the original "raw" A-mode signal sampled at an effective rate of 64 MHz.
[0144]
In this embodiment of the present invention, the magnitude of the complex envelope described above is the only component required for the subsequent processing. However, other components of the processed or unprocessed A-mode signal may be used for other purposes if desired. Obtaining the magnitude of the complex envelope requires taking the square root of the sum of the squares of the low-pass filtered result. That is, since the result is a complex number, its magnitude is equal to the square root of the sum of the square in-phase component and the square quadrature component, as shown in
[0145]
[Equation 3]
However, rather than calculating the magnitude of the envelope, subsequent signal processing may be applied to non-square-rooted signals, referred to herein as "envelope squared." This latter approach alleviates the need to perform a square root operation, thereby somewhat simplifying the resulting algorithmic implementation. The envelope square waveform is shown in FIG.
[0147]
Envelope square E sq (NT D ) Is derived from the in-phase and quadrature components. This is calculated as described in
[0148]
(Equation 4)
To better assess the level of signal associated with the lumen inside the arterial wall, a logarithm (base 10) is obtained as shown in FIG. Note that the level of the
[0150]
However, as will be appreciated, in certain applications, a "false" lumen detection may occur if the lumen detection methodology were solely based on the absolute value of the A-mode signal. For example, a lumen detection criterion based solely on absolute values may erroneously detect that a lumen is where there is no lumen, or conversely, that it is not where it actually exists. Such spurious detection may result from a variety of factors including, for example, backscattering and reflection from tissues (veins, muscles, etc.) interposed between the transducer and the blood vessels, movement of the subject during the measurement, and the like. is there. Therefore, as described in more detail below, the methodology of the present invention further examines signal artifacts close to the signal artifacts caused by the lumen to confirm the veracity of any given lumen detection. And the position of both the lumen and the adjacent wall of the lumen are accurately detected.
[0151]
A non-linear depth dependent gain (
[0152]
(Equation 5)
![]()
Here, depth is assumed to be expressed in millimeters, and gain is applied to the envelope square. However, as will be appreciated, other gain functions may be easily applied either in place or consistent with that of
[0154]
The application of the gain function to the envelope square of the A-mode signal is depicted in FIG. Note that in FIG. 26, the
[0155]
As will be further appreciated, while the foregoing discussion has been in terms of quadrature demodulation, envelope squaring, and filtering, other types of signal processing and conditioning techniques may be employed consistent with the present invention. Sometimes.
[0156]
After signal processing is complete, the
[0157]
Next, the power metric is integrated according to
[0158]
(Equation 6)
![]()
Where P int (K) represents the power integrated up to the kth sample in the envelope square sequence, and P (k) represents the kth sample in the envelope square sequence.
[0160]
The second step 2704 of the plateau method 2700 consists of identifying the best estimate of the plateau associated with weak backscatter from intraluminal blood. As part of this step 2704, the integrated power function is first normalized to units, as depicted in FIG. 27c (step 2706). Next, in
[0161]
Next, a plateau is detected by step 2710. First, the number of samples occurring within each interval of normalized power is calculated (step 2712). The underlying reason behind this calculation is that when power is low, many values must be integrated from one integration to the next, for example, corresponding to backscatter from blood. Therefore, intervals containing many samples indicate plateaus (and lumens). In the example embodiment of FIG. 27a, a test consisting of the number of points included in three consecutive intervals is applied (step 2714), so the metric becomes as shown in equation (8) below.
[0162]
(Equation 7)
Where M cnt (K) represents the sum of the counts in three consecutive intervals ending in the kth interval, and m (n) represents the number of samples in the nth interval. This metric is shown in FIG. 27d for an
[0164]
An additional term has been added to the above metric to ensure that the plateau due to low power at deeper depths does not trigger false lumen detection. In particular, weighing involves the requirement that three consecutive intervals must be followed by an interval with a low count corresponding to the posterior artery wall. Therefore, the modified metric is given by Equation 9.
[0165]
(Equation 8)
Note that the count m (k + 2), two intervals preceding a group of three consecutive intervals, is included in Equation 9. A plot of this metric for a single A-mode line is shown in FIG. 27e for the normalized integrated power of this example.
[0167]
The detection of the peak results in the identification of those three consecutive intervals that are most likely to correspond to the lumen. The total count of samples in all intervals preceding those three intervals corresponding to peaks identifies the depth of the lumen. However, in one exemplary embodiment, the sample points in the A-mode line associated with the lumen for the purpose of subsequent arterial wall search are from the first interval to the first of the three consecutive intervals. It is derived from the total number of samples in all intervals (and inclusive). Therefore, the sample associated with the lumen for a given A-mode line is estimated by
[0168]
(Equation 9)
Here, L represents the number of samples preceding the lumen area, and K represents the "pointer" to the third of three consecutive intervals at which the peak was detected.
[0170]
Further, an average estimate of luminal power may be derived from the power contained in one or more of these three consecutive intervals (step 2716). For example, in one exemplary approach, the average lumen power is determined from this second interval by simply averaging the envelope squared sample values corresponding to the second interval of the three consecutive intervals. This estimate of the luminal backscatter power is then used in conjunction with the estimated position of the detected lumen to detect the arterial wall, as described in more detail below.
[0171]
Note that the plateau in the integrated power profile can also come from other sources. In particular, in the case of the human radial artery, such a plateau may be caused by the presence of one or more veins located between the applanation device and the vessel of interest, or by the presence of cysts and other growths. It can also be triggered. Although more common, the plateau due to veins is generally very small compared to the "true" plateau of interest associated with arterial compression, which is largely due to the relatively small vein diameter (and wall thickness). ing. In addition, the methodology of the present invention addresses this problem by performing measurements of vessel diameter (and integrated backscatter power) at applanation pressures above those needed to dent relatively thin walled veins. Overcome points effectively. Such depression of the vein generally occurs at a pressure well below that required to significantly affect the diameter of large blood vessels (eg, the radial artery), thereby causing a potential “false” plateau due to the vein. Prepare a sophisticated solution to this problem.
[0172]
In contrast to veins, cysts or growth-related artifacts generally occur only in very small fractions of the population, and to the extent that repositioning the transducer to other locations over the artery will eliminate any effects resulting therefrom. And is often spatially localized. In addition, cystic areas do not have a corresponding pulse pressure or pulse pressure related motion component and are therefore easily identified and identified using many signal processing techniques well known to those skilled in the art. It can be screened.
[0173]
In the second embodiment, the detection of the lumen in
[0174]
(Equation 10)
![]()
D = depth,
c = speed of propagation
t = time of propagation
[0175]
The factor of 2 in Equation 11 accounts for bidirectional acoustic wave propagation. For the 16 MHz sampling rate described above, 1.33 μs corresponds to approximately 22 samples along the de-sampled A-mode line.
[0176]
The 1 mm interval for power calculation is based on the present assignee's observation that, in an exemplary embodiment, the diameter of the vessel under test (eg, the radial artery) is greater than 1 mm in essentially all of the adult population. Is selected. Therefore, the power calculation is reasonably guaranteed to construct a signal that only contributes to the lumen. However, as will be appreciated, this interval may be adjusted based on factors such as non-adult population measurements, use of other blood vessels, and / or use of the technique for other species. Note also that the 1 mm spacing listed above also advantageously provides a "reasonable" number of samples to average over an estimate of A-mode signal power.
[0177]
For a sampling rate of 16 MHz, the aforementioned 1 mm interval corresponds to 1.33 μs, or about 22 samples. Time nT D Power estimate P at 1mm (NT D ) Is calculated according to
[0178]
(Equation 11)
An exemplary plot of sound power within a 1 mm interval along the line of AGC data corrected with TGC is depicted in FIG. 28a.
[0180]
The position of the lumen (eg, blood) inside the radial artery is detected as the first minimum in the 1 mm average power calculation. The search for this minimum starts at a predetermined point (eg, 1 mm) along the A-mode line and continues in this example to a second predetermined depth selected at 7 mm. This range of 1 mm to 7 mm was selected based on the observation that the anterior wall of the radial artery (ie, the wall where the acoustic energy emitted from the transducer first meets) occurs within this interval in essentially all of the adult population. Was done. It should also be noted that the aforementioned minimums are clearly distinguishable in the plot of FIG. 28a, thereby advantageously and easily with good quality (ie, low noise levels and low other artifacts) A-mode signals. Anticipated detection. Minimal detection in the electronic signal may be accomplished by a number of techniques well known in the electronic arts and, therefore, will not be described herein.
[0181]
FIG. 28b graphically illustrates lumen detection using the “spacing” method described above. As illustrated in FIG. 28b, lumen detection involves initiating a search for an arterial wall at a preselected depth, in this
[0182]
Backscatter E from the lumen throughout the above procedure sq The A-mode signal associated with the (blood) can be easily identified once the region of the lumen has been identified. The estimate is calculated as simply the average of the envelope squared samples over the range centered on the detected depth of the lumen. The average is calculated according to the exemplary relationship in Equation 13.
[0183]
(Equation 12)
Where N blood Represents an index of an envelope square corresponding to the depth of blood detection. Note that in Equation 13, the average is calculated over 15 samples of the envelope square. However, it may be replaced with other values depending on the specific application.
[0185]
For example, after the lumen is detected using either the plateau method or the spacing method, the anterior and posterior arterial walls are detected and their spatial position (ie, depth relative to the sensor unit) is estimated. Is done. In particular, it is assumed that the anterior artery wall generally occurs between the sensor unit and the detected lumen depth, especially near where the A-mode signal drops to the integrated power or signal level associated with the lumen. Is done. This assumption is based on the knowledge that the lumen of the blood vessel is immediately adjacent to the wall (ie, on the far side of the wall with respect to the transducer). Similarly, the posterior artery wall is generally assumed to occur deeper than the depth of the luminal signal and near where the integrated power or signal level rises sharply above the level associated with the lumen. You. These changes in the A-mode integrated power or signal levels corresponding to the anterior and posterior walls of the artery are readily observable, for example, in TGC A-mode data.
[0186]
In the first exemplary embodiment (FIG. 29a), the method of wall detection is described with respect to (i) the detected position in the lumen from which the search for the arterial wall is started, and (ii) FIG. 27a above. An estimated value of the average luminal power is derived from the detected threshold value. The detected position of the lumen along the A-mode line serves as the start of a search for the posterior wall. Starting from this position (step 2902), the integrated power is calculated by adding successive samples of the square of the envelope of the A-mode signal (step 2904). The formulation is given by
[0187]
(Equation 13)
Where P bk Is sample K st , Representing the integrated power in the direction of the back wall up to sample m, and P (k) representing the k-th sample in the square of the envelope of the A-mode signal. P bk When (m) exceeds the specified threshold, it is assumed that the back wall has been detected and the corresponding sample value m represents the depth of the back wall (step 2906). Note that the number of samples and depth along the A-mode line are related. The actual depth is derived from the number of samples as shown in
[0189]
[Equation 14]
Where c represents the speed of propagation and N samp Represents the number of samples, and F s Represents the sampling rate associated with the envelope square sequence.
[0191]
The front wall is detected in much the same way as the rear wall. Starting from the same position used for the back wall, the integrated power is calculated by adding successive samples of the square of the envelope of the A-mode signal in the direction of the front wall. Therefore, the sample is sample K st Taken in descending order. When the integrated power exceeds a specified threshold, it is assumed that a front wall has been detected and the corresponding sample value determines the depth of the front wall.
[0192]
In the embodiment of FIG. 29a, a front wall threshold equal to 500 times the luminal average power described above and a rear wall threshold equal to 50 times the luminal average power are utilized. These values were determined empirically by the assignee of the present application using a designated depth-dependent gain (eg, TGC). However, other thresholds and other types of criteria may be used, as will be appreciated. For example, replaced by a variable threshold having a value that varies as a function of other parameters (eg, clutter in the lumen or attenuation in the intervening tissue). Still further, as will be appreciated, the relationship between the threshold of the front wall and the threshold of the back wall may or may not take into account a predetermined relationship, for example, the front wall threshold may be It is determined as a function of the wall threshold or alternatively is completely independent therefrom. Other variations are possible. For example, see the discussion on scoring and weighting below.
[0193]
Still further, to facilitate processing, inter-line averaging of A-mode lines may be performed prior to lumen detection and wall detection, as is well known in the signal processing arts. This technique can be used to improve the performance and robustness of the system, both for lumen detection and artery wall depth estimation.
[0194]
In an embodiment of the method for detecting the arterial wall (FIG. 29b), the amplitude of the envelope square E sq (NT D ) Is the backscatter E from the blood sq (Blood) is compared with the estimated signal level. This is clearly distinguished from the previously described integral power calculation approach. As before, the search for the front wall is in the direction towards the transducer element, i.e. in the direction of decreasing depth. When the amplitude of the envelope square artifact meets specified criteria (eg, exceeds the estimated signal level), the amplitude contributes to backscatter from the front wall. The depth of this occurrence is designated as the location of the front wall and, if desired, is subjected to an optional subsequent verification process. Note that instead (or simultaneously), other criteria than those relating to the amplitude of the envelope square variate may be employed.
[0195]
The search for the back wall is performed in a manner similar to that described for the front wall. In particular, the search is initiated at the depth of the detected lumen, but proceeds in a direction that increases in depth (ie, moves away from the ultrasound transducer). When the amplitude of the envelope square exceeds or satisfies a specified criterion, as in the case of the front wall, this amplitude contributes to backscatter from the rear wall. This occurrence depth is assumed to be the position of the rear wall.
[0196]
Thus, when the A-mode data is of "reasonable" quality, a simple search algorithm can be used with the signal level (envelope square) methodology to identify the locations associated with the front and back walls. used. In particular, as illustrated in FIG. 29b, starting from the depth at which the lumen signal was detected (step 2952), the
[0197]
The process of calculating the envelope square, determining the corresponding average power and luminal signal at specified intervals (eg, 1 mm), and detecting the anterior and posterior arterial walls is described in this embodiment as A mode is performed in a "line-by-line" manner. The arterial wall position determined in this manner for an exemplary A-mode data set consisting of 5000 lines is shown in FIG. However, such line-by-line analysis may be based on other analytical approaches or incrementals, such as, for example, a section of one line, or a grouping of many lines (whether continuous or not), or line averaging. May be replaced by
[0198]
Once the relative wall position has been determined, the diameter of the blood vessel can be simply determined by taking the difference in depth between the posterior and anterior walls. For example, if the posterior wall occurs at a depth of 3.5 mm and the anterior wall occurs at a depth of 1.5 mm, the diameter of the vessel is estimated at (3.5 mm-1.5 mm) = 2.0 mm. be able to. This determination is performed, in one embodiment, by a smoothed wall position estimate (ie, mathematically calculated for smoothing using other signal processing techniques) as described hereinabove. To be averaged).
[0199]
As will be appreciated, while the foregoing exemplary methodologies for wall detection (eg, integrated power and envelope squared signal level) have been described in terms of the anterior and posterior walls of a blood vessel, the anterior or posterior wall detection approach is , Separately and / or in isolation. For example, if it is determined that the anterior wall artifact is particularly weak or otherwise unreliable for certain subjects (or a group of subjects having certain common characteristics) being evaluated , The back wall detection is weighted substantially more for compensation. Similarly, if the clutter in the vessel under examination is significant, the more affected walls will be selectively de-emphasized in terms of weight. Other such modifications may also be employed depending on the particular application.
[0200]
Further, as will be appreciated, the integrated power threshold approach and the envelope signal level approach may be used alone or in combination, or in other ways (eg, as is well known in the signal processing arts). A so-called “box car” average of the type) may be employed. For example, a parallel calculation of the envelope average signal level and the integrated power is performed and the calculated value is applied to an applicable threshold criterion (e.g., a quadruple lumen signal level, and 500, respectively). (Double average luminal power). The results of these comparisons can then be used to calculate the relative reliability or confidence in wall detection, such as by calculating a "confidence level" metric that can be used later by the system and / or the user. ) Used to determine The higher the wall detection score for both the integrated power approach and the envelope square approach, the higher the confidence metric of the result. If the wall detection score is high for one technique and low for the other, the value of the confidence metric is reduced and a subsequent verification process is displayed.
[0201]
Still further, as will be appreciated, in the context of wall detection as a whole, various forms of scoring and weighting known in the signal processing art may be used to replace or with the aforementioned criteria. Sometimes. Such a technique advantageously increases the robustness of the system under real clinical use. For example, in one alternative embodiment, an envelope square power value that meets or exceeds a discrete value (eg, a quadruple estimate signal level for signal levels, or 500 times average lumen power for an integral approach) Alternatively, an A-mode signal having an integrated power value is assigned a score of “1.0”. Signals having values lower than this discrete value are assigned a score based on their relationship to the window function w (x), so that a predetermined threshold (eg, twice the estimated signal level, or 250 times) The value below the mean lumen) is given a score of 0.0, and the value between the predetermined threshold and the designed criterion is between 0.0 and 1.0 according to the function w (x). You can assign a score between them.
[0202]
In yet another alternative embodiment, the envelope squared power value or the integrated power value associated with a given A-mode measurement is a measure of some extrinsic power related to the quality of the data sampled during that interval. Or it may be weighted based on the intrinsic "quality factor". As a simple example, if the subject being evaluated moves during a given series of A-mode lines, the quality of the data will be degraded, and thus any lumen / The wall detection calculation can also artificially reduce the weight compared to other samples.
[0203]
In yet another alternative embodiment, the "square power" or "integral power value" generated by the A-mode line corresponding to a certain depth is adjusted such that "localization" is achieved. "Weighting and / or positional scoring may be applied. For example, as described above, the probability of finding the anterior wall of the radial artery less than 1 mm from the surface of the skin in an adult is extremely low, and therefore the first "N" A-mode line (corresponding to a depth of 1 mm) The envelope squared power value or the integrated power value derived from will be significantly rounded down or even removed (ie, zero weighted).
[0204]
Similarly, the interval-to-interval processing is performed such that wall artifacts determined at discrete A-mode line intervals are marked according to the ambiguity that needs to be resolved. There is. If the front wall artifact was detected at the first 1 mm depth interval and again at the third interval, (i) the artifact detected at the first interval was the front wall and was detected at the third interval. It can be assumed with a certain level of confidence that either the artifact is the back wall, or (ii) the first artifact was noise and the third interval artifact is a front wall signal. . Such ambiguity may be due to the application of the "positional" weighting described above to remove first artifacts based on the low likelihood of occurrence in the adult population, or to use the sampling of subsequent A-mode signals for their intervals. It can be solved through many technologies.
[0205]
The methodology also includes significant smoothing / filtering where needed. Such smoothing / filtering still removes the beat-to-beat variability caused by breathing, as well as the time variability that occurs from systole to diastole. Such smoothing / filtering is generally well understood in the signal processing arts, and thus will not be further described herein.
[0206]
As will be appreciated, the accuracy of the wall detection methodology described herein is in part tied to the ability to produce narrow ultrasonic transmit and receive beams. In particular, the two-way beam response is sufficient for the ultrasound transducer to hit within the lumen of the blood vessel (ie, the cross-sectional area of blood flow) when it is near its optimal location relative to the blood vessel being evaluated. Should be narrow. Otherwise, backscatter from the side walls of the blood vessels hinders lumen detection and degrades the accuracy of the spatial and spatial wall position estimates.
[0207]
Another consideration in assessing the anterior and posterior wall locations is the relative compliance and relative compressibility of the tissue during applanation. Under the predominantly static wall position assessment as described above with respect to FIGS. 17-31, the absolute and relative positions of the vessel walls within the tissue do not vary significantly. However, when assessing the hemodynamic parameters of a blood vessel based on such wall localization (discussed with respect to FIGS. 34-37 below), where at least a portion of the blood vessel and its surrounding tissue have been described hereinbefore with respect to FIG. As described, the tissue is compressed during applanation of the tissue, and the relative and absolute positions of the front and rear walls change.
[0208]
FIG. 32 illustrates the above problem graphically based on actual data obtained by the assignee of the present application. As shown in FIG. 32, the position of the posterior wall 3202 of the blood vessel varies from a depth of about 4 mm at the zero A mode line (ie, the start of the scan) to about 3 mm after the 600 A mode line. The variation in the depth of the back wall is mainly induced by the movement of the
[0209]
FIG. 34 illustrates one methodology for determining the rate of change in vessel (lumen) diameter using the anterior and posterior wall detection methods described above. The rate of change is calculated simply by taking the change in vessel diameter over a given time period and dividing by the number of A-mode lines during that same interval. This latter number may be correlated to a linear change in the position of the applanation device (FIG. 33a), thereby providing a different type of transfer function (ie, the rate of change in vessel diameter as a function of linear applanation). Generated and transfer functions describe the behavior of tissues and blood vessels during compression.
[0210]
A method for assessing hemodynamic properties using backscattered ultrasonic energy
One exemplary alternative embodiment of the method for non-invasively assessing hemodynamic properties using backscattered ultrasound energy (eg, A-mode signals) described above is described with reference to FIG. As will be appreciated, the following discussion and exemplary alternative embodiments take place in terms of non-invasive measurement of arterial blood pressure using the human radial artery, but the methods of the invention described herein are not More generally, it may be applied to other hemodynamic parameters, blood vessels, and species.
[0211]
As shown in FIG. 35, the
[0212]
Note that the act of "lateral" positioning may also include certain components of longitudinal positioning (i.e., along the longitudinal axis of the vessel). This is because the placement of the device on the subject's wrist / forearm is more controlled by the physical attributes of the wrist, contrary to the orientation of the blood vessels in the wrist / forearm. In particular, where the point measured by the transducer occurs at a position where the radial artery is not running in a direction completely parallel to the axis of the wrist bone, such "lateral" positioning inherently adds sufficient longitudinal component as well. Included. Still further, certain points along blood vessels are better suited for hemodynamic analysis (eg, due to the presence of veins, cysts, and other segments that potentially interfere with ultrasound transmission / reflection). Sometimes.
[0213]
Next, an initial calibration applanation sweep (ie, sweeping the applied pressure from no compression to full compression or to vessel occlusion) is performed in
[0214]
At
[0215]
It is further noted that during an applanation sweep, the maximum pulsatile pressure is on the right hand side of the aforementioned region of the flattening pressure waveform (ie, at a later time / more time). (With vessel compression), thereby further helping to localize points of interest in the waveform. In particular, other artifacts in the waveform that occur under conditions of more compression than the maximum pulsating pressure (which is easily determined by many means known in the art) can also be subtracted, , Narrow the region of interest in the pressure waveform. Thus, the maximum pulsatile pressure is not only optionally monitored (step 3510), but also assists in setting the upper window limit for arterial pressure.
[0216]
After completing the initial applanation sweep of
[0219]
As may be convinced, the upper limit criterion and the pressure "window" created by the upper limit criterion can be quite wide, and therefore additional methods are optional to more accurately determine the optimal pressure in the window. May apply. In this embodiment, these additional methods include a decision (step 3516) according to an algorithm for the optimal applanation level, as described in more detail below with respect to FIG.
[0218]
Referring to FIG. 36, a methodology for determining the optimal applanation level (step 3516) will be described. As shown in FIG. 36, the method 3600 generally includes first identifying a “flattened” spot in the end-diastolic pressure profile (step 3602). In one exemplary embodiment, a histogram derived from the edge of the pressure profile over the applanation sweep is generated (step 3606). FIG. 36a is an exemplary histogram generated according to
[0219]
Next, in
fit) (step 3610), and then the peak is determined therefrom (step 3612). This approach helps to minimize noise during pulse pressures, including respiratory effects. The end diastolic pressure occurring at the maximum pulsatile pressure is then recorded (step 3614).
[0220]
Note that these two indicators of end-diastolic pressure (ie, "flat spot" and peak pulsation pressure) can be used separately or together with one another as desired. Still further, other techniques may be used to replace or in combination with one or both of these two indicators to maintain a more accurate determination of optimal applanation pressure throughout the hemodynamic measurement. Sometimes.
[0221]
In an alternative embodiment of the method for assessing circulation parameters (shown in FIG. 37), the
[0222]
Transfer function
Referring to FIGS. 38 and 39, one exemplary embodiment of a method for determining and applying the scaling (transfer) function to the measured values of the hemodynamic parameters (
[0223]
As will be appreciated, the following discussion is in terms of the measured arterial blood pressure values and the scaling or transfer function used, but the methodology is more generally described using the approach of FIG. Or, alternatively, may be applied to other measured hemodynamic parameters or waveforms. For example, applanation of stress on the subject's circulatory system may be a condition of interest (eg, a certain percentage decrease in arterial diameter versus pressure measured by manometry during applanation correlates with end-diastolic pressure). If so, the methodology described herein is used to determine the scaling required to correct for tissue compliance and other effects.
[0224]
Still further, while the methodology of FIG. 38 generally includes empirical techniques that rely on a population of data, the present invention contemplates other non-experimental approaches instead of or in conjunction with the method of FIG. Accordingly, all such variations and combinations fall within the scope of the claims appended hereto. Thus, the method of FIG. 38 is merely exemplary in nature.
[0225]
The method of hemodynamic parameter scaling 3800 according to FIG. 38 generally involves using experimental reference data to derive correlations, where the correlations are obtained from the blood pressure obtained from the subject under test. It is later applied to the on-site measurement. Stress is applied to the blood vessel being measured so that the stress matches or “anchors” a variable of interest (eg, end-diastolic pressure) between the experimental reference data and the field measurements. The derived corrections to other unfixed variables (eg, systolic pressure and mean blood pressure) are then evaluated at the site of the subject to obtain a corrected waveform that is substantially equivalent to the actual arterial pressure. Applied to the corresponding part of the waveform.
[0226]
As shown in FIG. 38, the
[0227]
In one simple embodiment, the applanation level is a waveform measured by a pressure measuring pressure transducer (and displayed graphically on a display device such as a cathode ray tube (CRT) or the like). Is gradually increased until it is as close as practical to the value of the same variable in the A-line. Matching is accomplished primarily by the operator via visual means such as simultaneous overlapping of waveforms or minimizing the difference between two numbers displayed on a display device. The operator then adjusts the applanation level to the best level of alignment possible.
[0228]
In another embodiment, applanation automatically calculates the anchoring variables of interest, both from the A-line waveform and the pressure measurement waveform, either periodically or continuously, and scores them to a scoring metric. It is controlled by an algorithm that is intended to be used to match as closely as possible. For example, a scoring metric related to the difference between end-diastolic pressures during a discrete time interval is used to evaluate the quality of the "fit" between the waveforms, and the metric is selected. Used as an input to the applanation motor control circuit described above to modulate the pressure to minimize the value of the metric during the time interval. Curve-fitting metrics for such curves are well known to those skilled in the signal processing arts and, therefore, are not described further herein.
[0229]
After settling variable alignment and data collection, the two sets of data are analyzed to determine between
[0230]
After a correction factor for the parameter of interest is obtained in step 3808, the non-invasive hemodynamic assessment device of the present invention is applied in
[0231]
Next, in
[0232]
(Equation 15)
here,
P sc , P dc , P sc = Systole, diastole, mean “corrected” (scaled) pressure and
P su , P du , P mu = Systole, diastole, mean “uncorrected” (original) pressure, respectively.
[0234]
Constant k 1 , K 2 , K 3 , A polynomial curve is generated, which advantageously scales the waveform obtained by the pressure measurement method for the current subject for all values of pressure. Thus, this will match the input waveform to the diastolic value or to any diastolic point that has a known relationship to the actual value (by the methods or other techniques described herein above). If possible, provide scaled output.
FIG. 39 is a graphical representation of the process described above.
[0235]
Vessel position and positioning
As discussed above, proper lateral positioning of the ultrasound and pressure transducers of the device is advantageous in terms of enhanced accuracy in measuring hemodynamic parameters, including arterial blood pressure. Such lateral positioning is typically determined during initial placement of the device within a region of the vessel of interest, and then "fine-tuned" the transducer position such that optimal coupling is achieved. . In the case of the human radial artery, the proximity of the artery is known by the medical practitioner, i.e., within a narrow band corresponding to somewhat less than the width of the wrist and the inner surface of the subject's wrist / forearm. It emanates vertically down. However, for other blood vessels and / or other species, the location and orientation of the vessel of interest may not be easily identified. Even in the context of the human radial artery, whose proximity and orientation is well known, improper placement of the device by a physician can result in the consistency and "robustness" of blood pressure measurements obtained from that location. May be affected. Movement by the patient (and other factors) can also affect the accuracy of the reading, requiring periodic repositioning / repositioning of the measuring device.
[0236]
Still further, other forms include, for example, carotid artery surgery (mapping blood vessels along the human neck), femoral artery catheterization, and temporal artery localization. Where (i) easily and reliably locate a blood vessel in the subject's tissue in a non-invasive manner, or (ii) position a vessel relative to the once located blood vessel. It is highly desirable to be able to either maintain the monitoring device or the treatment device in the same orientation.
[0237]
Thus, the present invention advantageously provides non-invasive techniques (and devices) for both locating a vessel of interest and maintaining one or more selected devices in a predetermined relationship with the vessel. Prepare In particular, in one exemplary application, backscattered acoustic energy is analyzed to initially locate blood vessels of the subject that have been implanted in surrounding tissue. In other applications, backscattered energy is used to maintain a sensing or therapeutic device (eg, a pressure transducer and / or an ultrasonic transducer of the NIBP device described earlier herein) in an optimal position relative to the blood vessel. You.
[0238]
In one embodiment, a method for detecting and locating a blood vessel of interest is accomplished by directly detecting a lumen associated with the blood vessel based on a reduced level of backscattered ultrasound energy that has appeared in an A-mode line scan. Is done. Ultrasound energy is more readily absorbed in the lumen (such as by red blood cells and blood plasma present in the blood) than by surrounding blood vessel walls and tissues. Therefore, the vessel is located and / or the monitoring device is located by identifying areas of reduced backscatter energy. Such regions may be one-dimensional (e.g., only with respect to depth within the tissue) or multiple, such as when it is desired to accurately locate the vessel in lateral or traversal and depth positions. It can also be found in dimensions.
[0239]
Another embodiment of the present invention detects the relative position of both the anterior and posterior walls of a blood vessel based on analysis of backscattered A-mode energy. This wall information is used to directly determine the effective diameter of the vessel. The variation in vessel diameter as a function of the lateral or traverse position is then used to identify the optimal lateral position of the measurement or treatment device.
[0240]
With reference to FIG. 40, a first embodiment of a method for detecting a blood vessel in a tissue of a subject will be described in detail. As shown in FIG. 40, the
[0241]
The tissue under examination may also be applanated as described above to "pre-load" the tissue. Such preload may be due to veins or other small blood vessels intervening between the ultrasound transducer and the vessel of interest, or to a generalization near the vessel of interest, as in the human radial artery. It is advantageous when intervening. In particular, controlled preloading preempts small veins due to their small hoop stress and low lumen (blood) pressure compared to arteries, thereby providing a field of view for the lumen detection techniques described below. Effectively remove it from. The assignee of the present application has determined that a preload applanation on the order of 30 mmHg (4 kPa) is suitable for sufficiently denting any vein intervening between the transducer and the radial artery. However, as will be appreciated, other values may be used depending on the particular application.
[0242]
However, it may also be desirable to detect and locate other vessels, such as the veins listed above, at the same time as detecting / locating the main vessel of interest. Therefore, the aforementioned applanations may be selectively used as desired to "filter" what is viewed by the lumen detection device. For example, if there is a high degree of clutter and other noise in the A-mode signal for a given individual, applanation of the area evaluated to eliminate the effects of energy backscatter from veins around the artery. Is desirable. Alternatively, if the noise level is low enough, it may be desirable to detect the presence of veins, such detection being a potential for determining the tissue scaling or transfer function used in conjunction with non-invasive blood pressure measurements. Is useful. In particular, the presence of intervening veins may have some effect on the value of the transfer function, so it is desirable to detect its presence and compensate for its effects. Referring again to FIG. 40, the backscattered energy reflected from the tissue, blood vessels, and lumens in the scanned area is then received by the same (or other) transducer element in
[0243]
In the second embodiment, the detection of the lumen in
[0244]
The procedure of FIG. 40 may be repeated as needed for any number of spatially distributed scans, such that a “slice” of tissue is related to the lateral position of the vessel of interest as well as its depth. It should also be noted that the information may be examined in order (or even simultaneously) in the depth (time) dimension. Such "slices" may be electronically dissolved or combined into a multiplicity of envelope square values (or the integrated power described with respect to the previous embodiment) measured as is well known in tomography. Prepare a dimensional representation. The present invention further contemplates the use of a number of such techniques to improve the accuracy of the determination. For example, techniques for "plateau" detection and "spacing" detection are combined to increase instrument robustness.
[0245]
Still further, as will be appreciated, the lumen (vessel) position information can be obtained by positioning the ultrasound transducer or other measurement / treatment device in any desired orientation relative to the vessel, for example, with a fixed lateral offset (below). May be used to maintain, such as a lateral offset, which is operatively related to the diameter of the vessel (as described in). Similarly, lumen detection information is used to control the position of the transducer based on signal quality, the presence of cystic components or clutter, the degree of applanation (if any), etc. Sometimes.
[0246]
With reference to FIG. 41, an alternative embodiment of a method for detecting and locating blood vessels in tissue of a subject will be described. In this alternative embodiment, the aforementioned technique of lumen detection is used as a starting point for analysis of the location of the wall of the vessel of interest. The location of these walls gives an indirect determination of the diameter of the vessel, which is used to help maintain optimal coupling between the transducer and the vessel.
[0247]
One exemplary embodiment of a method that utilizes wall diameter to position a measurement or treatment device relative to a blood vessel, as shown in FIG. 41, is described. Note that the following discussion is in terms of a lateral positioning assembly (as described earlier herein) used to reposition the ultrasonic transducer relative to the human radial artery. The general methodology can easily be adapted to other applications.
[0248]
The
[0249]
As will be appreciated, the wall diameter information listed above may be obtained from a fuzzy logic control as described in co-pending U.S. patent application Ser. No. 09 / 342,549, incorporated herein by reference. It may be used as a basis for many different control schemes, including: Such variations and applications are well known to those skilled in the controller art and, therefore, will not be described further herein.
[0250]
Finally, it should be noted that many variations of the method described above can be used in conjunction with the present invention. In particular, certain steps are optional and may be performed or deleted as desired. Similarly, other steps (e.g., additional data sampling, processing, filtering, calibration, mathematical analysis, etc.) may be added to the foregoing embodiments. Further, the order of performance of certain steps may be reversed or performed in parallel (or series), if desired. Therefore, the above-described embodiments are merely illustrative of the broad variety of methods of the invention disclosed herein.
[0251]
While the above detailed description has illustrated, described, and pointed out novel features of the invention as applied to various embodiments, it will be understood that various features and forms of the illustrated devices or processes may be employed. Omissions, substitutions, and alterations may be made by those skilled in the art without departing from the spirit of the present invention. The preceding description is of the best modes currently contemplated for implementing the invention. This description is in no way meant to be limiting, but rather is to be taken as illustrative of the general principles of the invention. The scope of the invention should be determined with reference to the claims.
[Brief description of the drawings]
FIG.
1 is a composite graph illustrating the cross-sectional shape of an artery as a function of applied pressure and time according to the prior art "maximal pulsation" theory.
FIG. 2
FIG. 4 is a diagram illustrating a blood vessel having a stenosis variation level formed on a blood vessel wall.
FIGS. 3 to 3e
1 is a logic flow diagram illustrating one exemplary embodiment of a method for assessing hemodynamic parameters in the circulatory system of a living subject in accordance with the present invention.
FIGS. 4a and 4b
FIG. 4 is a graph illustrating the relationship between blood velocity and the decrease in effective cross-sectional fluid area of a blood vessel.
5a to 5c.
FIG. 4 is a graph illustrating the relationship between applanation pressure, sinus rhythm, and arterial wall displacement according to the present invention.
FIG. 5d
FIG. 4 is a graph illustrating the relationship between maximum blood velocity and percentage decrease in fluid area (applanation pressure) for both diastolic and systolic pressures.
FIG. 6
1 is a cross-sectional view of a typical human wrist portion illustrating the relationship between arteries, skin, and intervening tissue and physical components.
7a to 7b
FIG. 7 is a graph illustrating an exemplary transfer function and a transfer fraction for the cross section of FIG. 6 for both the systolic and diastolic states, respectively.
FIG. 8
4 is a graph of measured, real, and selected (calibrated) arterial pressure versus time for a typical human utilizing the present invention.
FIG. 9
1 is a logic flow diagram illustrating one exemplary embodiment of a method for modeling the circulatory hemodynamic response of a living subject in accordance with the present invention.
FIG. 10
5 is a logic flow diagram illustrating one exemplary embodiment of a method for calibrating hemodynamic parameter measurements for breathing or other periodic sources of error in accordance with the present invention.
FIG. 11
FIG. 4 is a plot of kinetic energy (KE) versus velocity of blood flowing through a typical blood vessel, illustrating the effects of respiration on blood vessels.
FIG.
1 is a block diagram of one exemplary embodiment of an apparatus for measuring intravascular hemodynamic properties of a living subject in accordance with the present invention.
FIG. 13
FIG. 13 is a functional block diagram of a second embodiment of the device illustrating the use of the device of FIG. 12 on a human radial artery.
14a to 14b
FIG. 3 is a perspective view of various machine-readable media having an object code representation of a computer program incorporating the method of the present invention.
FIG.
1 is a block diagram of a first embodiment of an apparatus for analyzing parameter data according to the present invention.
FIG.
5 is a logic flow diagram illustrating one exemplary embodiment of a method for administering treatment to a subject using the methods described above.
FIG.
1 is a logical block diagram illustrating one exemplary embodiment of a general method of lumen and wall detection according to the present invention.
FIG. 17a
FIG. 18 is a logic block diagram illustrating one exemplary embodiment of a method of processing an A-mode signal according to the method of FIG.
FIG.
FIG. 5 is a graphical illustration of a “raw” A-mode signal as a function of the depth of tissue in a monitored subject.
FIG.
FIG. 19 is a graph of an envelope derived from the raw A-mode data of FIG. 18.
FIG.
5 is a logic flow diagram illustrating the general methodology of quadrature demodulation and A-mode signal filtering according to the present invention.
FIG. 21
FIG. 3 is a block diagram illustrating a method of quadrature demodulation of an A-mode signal according to the present invention.
FIG.
FIG. 3 is a graph of the frequency response of one exemplary embodiment of the low pass finite impulse response (FIR) filter of the present invention.
FIG. 23
5 is a table listing an exemplary set of (FIR) coefficients used in the quadrature demodulation and filtering method of the present invention.
FIG. 24
FIG. 19 is a graph of an envelope square waveform derived from the A-mode signal of FIG. 18.
FIG. 25
FIG. 25 is a graphical illustration of the logarithm (base 10) of the envelope square waveform of FIG. 24.
FIG. 26
FIG. 25 is a graphical illustration of the application of a gain function (TGC) to the envelope square of the A-mode signal of FIG. 24.
FIG. 27a
5 is a logic flow diagram illustrating a "plateau" method of lumen detection according to the present invention.
FIG. 27b
FIG. 4 is a plot illustrating measured backscattered power as a function of depth for a single A-mode line.
FIG. 27c
FIG. 27b is a graph of a normalized and integrated power function according to the plateau method of FIG. 27a.
[27d]
FIG. 28 is a graphical illustration of a plateau detection metric used in conjunction with the method of FIG. 27a.
[27e]
FIG. 4 is a graphical illustration of a normalized plateau detection metric for a single A-mode line.
FIG. 28a
27 is a graph of a power profile (1 mm interval) along the AGC line corrected by TGC in FIG. 26. FIG.
FIG. 28b
5 is a logic flow diagram illustrating an "interval" methodology for lumen detection using A-mode line signals in accordance with the present invention.
FIG. 29a
5 is a logic flow diagram illustrating a first exemplary methodology for front and back wall detection based on integrated power calculations.
FIG. 29b
5 is a logic flow diagram illustrating a second exemplary methodology for front and back wall detection based on envelope square signal level determination.
FIG. 30
FIG. 30 is a graphical illustration of the relationship between the average power calculation according to the method of FIG. 29b and the front and back wall artifacts that appear in a typical A-mode envelope.
FIG. 31
FIG. 30 is a graphical illustration of an anterior and posterior wall position of an exemplary blood vessel as a function of time (based on a 5000A mode signal line) using the method of FIG.
FIG. 32
FIG. 3 is a graphical illustration of the position of the posterior wall of a blood vessel as a function of time during applanation by an external applanation device.
FIG. 32a
FIG. 2 is a graphical illustration of the linear position (mm) of an applanation device as a function of time during a typical radial artery applanation.
[32b]
FIG. 32 is a graphical illustration of a pressure profile measured by an applanation pressure transducer as a function of time during a period according to FIG. 32a.
FIG. 33
FIG. 4 is a graph of anterior and posterior artery wall position (depth mm) and artery diameter (mm) as a function of applanation.
FIG. 34
FIG. 4 is a graphical illustration of a methodology for determining a rate of change in vessel diameter as a function of applanation according to the present invention.
FIG. 35
5 is a logic flow diagram illustrating one embodiment of a methodology for assessing hemodynamic parameters using lumen detection and wall detection in accordance with the present invention.
FIG. 35a
FIG. 4 is a graph of measured arterial pressure versus applanation pressure displaying a “flat spot” during end diastolic pressure.
FIG. 36
5 is a logic flow diagram illustrating one exemplary methodology for determining an optimal applanation pressure during a hemodynamic measurement in accordance with the present invention.
FIG. 36a
FIG. 3 is a histogram plot of an exemplary end-diastolic "flat spot" detection algorithm according to the present invention.
FIG. 37
5 is a logic flow diagram illustrating one exemplary embodiment of a methodology for assessing hemodynamic parameters using backscattered ultrasound energy based on inflection points in a diastolic pressure profile.
FIG. 38
5 is a logic flow diagram illustrating one exemplary embodiment of a method for scaling measured pressure to compensate for tissue loss.
FIG. 39
FIG. 39 is a graph of the method of FIG. 38.
FIG. 40
5 is a logic flow diagram illustrating a method for locating a blood vessel using lumen detection according to the present invention.
FIG. 41
5 is a logic flow diagram illustrating one exemplary embodiment of a method for locating a blood vessel using lumen detection and wall detection according to the present invention.
Claims (30)
血管内へ音響エネルギーを伝送することと、
前記血管内の前記音響エネルギーの伝搬の関数として前記音響エネルギーの反射の信号レベルを評価することと、
前記反射内の低下信号レベルの少なくとも1つの領域を識別することと
を含む方法。A method for detecting a lumen in a blood vessel,
Transmitting acoustic energy into blood vessels;
Assessing the signal level of the reflection of the acoustic energy as a function of the propagation of the acoustic energy in the blood vessel;
Identifying at least one region of reduced signal levels in the reflection.
(i) 前記反射の第1周波数成分を導出することと、
(ii) 前記反射の第2周波数成分を導出することと、
(iii) 前記第1周波数成分と前記第2周波数成分との部分集合のみを保持するために前記第1周波数成分と前記第2周波数成分とをフィルタすることとを含む方法。3. The method of claim 2, wherein the act of demodulating comprises: (i) deriving a first frequency component of the reflection;
(Ii) deriving a second frequency component of the reflection;
(Iii) filtering the first frequency component and the second frequency component to retain only a subset of the first frequency component and the second frequency component.
平方パラメータを生じるために前記フィルタされた成分の部分集合を平方することと、
平方デシメート化パラメータを生じるために前記平方パラメータを第1サンプリング・レートへデシメートすることと
を更に含む方法。4. The method of claim 3, wherein
Squaring the subset of the filtered components to yield a square parameter;
Decimating said square parameter to a first sampling rate to produce a square decimating parameter.
複数の伝搬間隔中のパワーを決定することと、
前記複数の伝搬間隔の少なくとも1つ内の少なくとも1つの最小を識別することと
を更に含む方法。3. The method of claim 2, wherein
Determining power during a plurality of propagation intervals;
Identifying at least one minimum in at least one of the plurality of propagation intervals.
血管内へ音響エネルギーを伝送することと、
前記血管内の管腔と関連した少なくとも1つの領域を検出することと、
前記管腔に対する血管の前記少なくとも1つの壁の位置を検出することと
を含み、
位置を検出する行為は前記伝送する行為から導出されたAモード・データを分析することを含む
方法。A method for detecting at least one wall in a blood vessel, comprising:
Transmitting acoustic energy into blood vessels;
Detecting at least one region associated with a lumen within the blood vessel;
Detecting the position of the at least one wall of a blood vessel with respect to the lumen,
A method wherein the act of locating comprises analyzing A-mode data derived from the transmitting act.
(i) 前記管腔の前記領域と関連したAモード信号レベルを決定することと、
(ii) Aモード信号レベルが前記管腔の前記領域と関連した前記レベルとより高い信号レベルとの間で変動する少なくとも1つの領域を検出することと、
(iii) 前記少なくとも1つの壁を変動の前記少なくとも1つの領域と関連させることと
を更に含む方法。11. The method of claim 10, wherein the act of detecting a location comprises:
(I) determining an A-mode signal level associated with the region of the lumen;
(Ii) detecting at least one region where the A-mode signal level varies between the level associated with the region of the lumen and a higher signal level;
(Iii) associating the at least one wall with the at least one region of variation.
前記Aモード信号の第1周波数成分を導出することと、
前記Aモード信号の第2周波数成分を導出することと、
前記Aモード信号を表すベースバンド成分を得るために前記第1周波数成分と前記第2周波数成分とをフィルタすることと
を含む方法。13. The method of claim 12, wherein the act of demodulating derives a first frequency component of the A-mode signal;
Deriving a second frequency component of the A-mode signal;
Filtering the first frequency component and the second frequency component to obtain a baseband component representing the A-mode signal.
血管内へ音響エネルギーを伝送することと、
前記血管内の管腔と関連した領域を検出することと、
前記管腔に対する血管の第1壁の位置を検出することと、
前記管腔に対する血管の第2壁の位置を検出することと、
前記第1壁の前記位置と前記第2壁の前記位置とに少なくとも一部分基づいて前記血管の少なくとも部分の直径を決定することと
を含む方法。A method for determining the diameter of a blood vessel,
Transmitting acoustic energy into blood vessels;
Detecting a region associated with a lumen in the blood vessel;
Detecting the position of the first wall of the blood vessel with respect to the lumen;
Detecting the position of the second wall of the blood vessel with respect to the lumen;
Determining a diameter of at least a portion of the blood vessel based at least in part on the location of the first wall and the location of the second wall.
(i) 前記管腔の前記領域と関連したAモード信号レベルを決定することと、
(ii) Aモード信号レベルが前記管腔の前記領域と関連した前記レベルとより高い信号レベルとの間で変動する少なくとも1つの領域を検出することと、
(iii) 前記第1壁又は前記第2壁の位置を変動の前記少なくとも1つの領域とに関連させることと
を更に含む方法。15. The method of claim 14, wherein the act of determining a location comprises:
(I) determining an A-mode signal level associated with the region of the lumen;
(Ii) detecting at least one region where the A-mode signal level varies between the level associated with the region of the lumen and a higher signal level;
(Iii) associating a position of the first wall or the second wall with the at least one region of variation.
前記生被検体の血管から第1パラメータを測定することと、
前記血管を少なくとも部分的に圧縮することと、
前記圧縮する行為の間中前記血管から第2パラメータを測定することであって、前記第2パラメータを測定する行為は
(i) 前記血管内へ音響波を伝送することと、
(ii) 前記音響波の少なくとも1つの反響を受信することと、
(iii) 前記血管の直径の推定値を導出するために前記少なくとも1つの反響を分析することと
を含む前記第2パラメータを前記測定する行為と、
前記第2パラメータに少なくとも一部分基づいて校正関数を導出することと、
前記校正関数を使用して第1パラメータを校正することと
を含む方法。A method for assessing hemodynamic properties in a circulatory system of a living subject,
Measuring a first parameter from a blood vessel of the raw subject;
At least partially compressing the blood vessel;
Measuring a second parameter from the blood vessel during the act of compressing, wherein the act of measuring the second parameter comprises: (i) transmitting an acoustic wave into the blood vessel;
(Ii) receiving at least one echo of the acoustic wave;
(Iii) analyzing the at least one reverberation to derive an estimate of the vessel diameter;
Deriving a calibration function based at least in part on said second parameter;
Calibrating a first parameter using the calibration function.
前記第2パラメータ内の少なくとも1つのアーチファクトを識別することと、
前記少なくとも1つのアーチファクトに基づいて校正関数を発生することと
を含む方法。18. The method of claim 17, wherein deriving a calibration function comprises identifying at least one artifact in the second parameter;
Generating a calibration function based on the at least one artifact.
前記血管と関連した少なくとも第1血行力学パラメータを測定するために適合した第1トランスジューサと、
前記血管内へ超音波エネルギーを伝送しかつ前記血管から反響を受信するために適合した第2トランスジューサと、
前記第2トランスジューサに動作上接続されかつ前記反響に基づいて前記血管内の管腔を検出し、かつ前記管腔に基づいて前記血管の直径を推定するように構成された信号プロセッサであって、前記血管の直径の前記推定値は前記第1血行力学パラメータの前記測定を校正するために少なくとも一部分使用される前記信号プロセッサと
を含む装置。An apparatus for measuring hemodynamic properties in blood vessels of a raw subject,
A first transducer adapted to measure at least a first hemodynamic parameter associated with the blood vessel;
A second transducer adapted to transmit ultrasound energy into the vessel and receive reverberation from the vessel;
A signal processor operatively connected to the second transducer and configured to detect a lumen in the blood vessel based on the echo and to estimate a diameter of the blood vessel based on the lumen; The signal processor wherein the estimate of the diameter of the blood vessel is at least partially used to calibrate the measurement of the first hemodynamic parameter.
圧力データを測定するために有用である前記被検体の血管を選択することと、
非侵襲的に前記選択された血管から圧力データを測定することと、
前記血管内の管腔の相対的位置と前記血管の少なくとも1つの壁の相対的位置とを検出することによって前記血管から血行力学パラメータを測定することと、
前記血行力学パラメータの前記測定から得られたデータから校正関数を発生することと、
前記血管内の血圧の表示を生じるために前記血圧データに前記校正関数を適用することと、
前記表示に基づいて前記被検体に治療を施すことと
を含む方法。A method of treating a living subject,
Selecting a blood vessel of the subject that is useful for measuring pressure data;
Non-invasively measuring pressure data from the selected vessel;
Measuring hemodynamic parameters from the blood vessel by detecting a relative position of a lumen within the blood vessel and a relative position of at least one wall of the blood vessel;
Generating a calibration function from the data obtained from the measurement of the hemodynamic parameter;
Applying the calibration function to the blood pressure data to produce an indication of blood pressure in the blood vessel;
Administering a treatment to the subject based on the indication.
音響波を発生することと、
前記橈骨動脈内へ前記音響波を伝送することと、
前記音響波の反響を受信することと、
前記管腔の位置を検出するために前記反響を分析することと、
前記管腔を前記検出する行為に基づいて少なくとも1つの動脈壁の位置を検出することと、
前記管腔の位置と前記少なくとも1つの動脈壁の位置とに基づいて前記動脈の直径を決定することと
を含む方法。26. The method of claim 25, wherein the act of measuring a hemodynamic parameter comprises generating an acoustic wave;
Transmitting the acoustic wave into the radial artery;
Receiving the echo of the acoustic wave;
Analyzing the reverberation to detect the position of the lumen;
Detecting a position of at least one arterial wall based on the act of detecting the lumen;
Determining a diameter of the artery based on a location of the lumen and a location of the at least one artery wall.
非侵襲的に循環系と関連した第1パラメータの値を測定することであって、第1パラメータの測定された値は前記第1パラメータの実値とは異なっている第1パラメータを前記測定することと、
循環系の血行力学性質を変更するために前記循環系にストレスを印加することであって、ストレスの前記印加は前記循環系の少なくとも1つの血管内の管腔の位置を検出することによって少なくとも一部分決定されるストレスを前記印加することと、
ストレスが印加される間に循環系と関連した第2パラメータを測定することと、
循環系と関連した第3パラメータを測定することと、
測定された第2パラメータに少なくとも一部分基づいて校正関数を発生することと、
校正関数を使用して測定された第1パラメータを補正することと
を含む方法。A method for determining an actual value of a first parameter in a circulatory system of a raw subject,
Non-invasively measuring a value of a first parameter associated with the circulatory system, wherein the measured value of the first parameter is different from an actual value of the first parameter. That
Applying stress to the circulatory system to alter the hemodynamic properties of the circulatory system, wherein applying the stress is at least in part by detecting a position of a lumen within at least one blood vessel of the circulatory system. Applying the determined stress,
Measuring a second parameter associated with the circulatory system while the stress is applied;
Measuring a third parameter associated with the circulatory system;
Generating a calibration function based at least in part on the measured second parameter;
Correcting the measured first parameter using a calibration function.
(i) 前記第1パラメータを測定する行為は前記循環系の少なくとも部分内の圧力を測定することを含み、
(ii) 前記第2パラメータを測定する行為は前記循環系の前記少なくとも部分の直径を測定することを含み、かつ
(iii) 前記第3パラメータを測定する行為は前記管腔内を流れる血液の速度又は運動エネルギーを測定することを含む
方法。28. The method of claim 27,
(I) the act of measuring the first parameter includes measuring a pressure in at least a portion of the circulatory system;
(Ii) measuring the second parameter comprises measuring a diameter of the at least a portion of the circulatory system; and (iii) measuring the third parameter comprises a velocity of blood flowing through the lumen. Or a method comprising measuring kinetic energy.
基準波形を用意することと、
前記血行力学パラメータを含む未補正の波形を発生することと、
前記基準波形に少なくとも一部分基づいて前記未補正の波形に対する少なくとも1つの補正を決定することと、
前記未補正の波形を拡大縮小するために前記未補正の波形に前記補正を適用することと
を含む方法。A method of scaling a hemodynamic parameter, comprising:
Prepare a reference waveform,
Generating an uncorrected waveform including the hemodynamic parameters,
Determining at least one correction to the uncorrected waveform based at least in part on the reference waveform;
Applying the correction to the uncorrected waveform to scale the uncorrected waveform.
Applications Claiming Priority (3)
| Application Number | Priority Date | Filing Date | Title |
|---|---|---|---|
| US09/534,900 US6554774B1 (en) | 2000-03-23 | 2000-03-23 | Method and apparatus for assessing hemodynamic properties within the circulatory system of a living subject |
| US09/815,080 US7048691B2 (en) | 2000-03-23 | 2001-03-22 | Method and apparatus for assessing hemodynamic parameters within the circulatory system of a living subject |
| PCT/US2001/009115 WO2001070303A2 (en) | 2000-03-23 | 2001-03-22 | Method and apparatus for assessing hemodynamic parameters and blood vessel location within the circulatory system of a living subject |
Publications (2)
| Publication Number | Publication Date |
|---|---|
| JP2004521660A true JP2004521660A (en) | 2004-07-22 |
| JP2004521660A5 JP2004521660A5 (en) | 2005-01-27 |
Family
ID=38038690
Family Applications (1)
| Application Number | Title | Priority Date | Filing Date |
|---|---|---|---|
| JP2001568497A Pending JP2004521660A (en) | 2000-03-23 | 2001-03-22 | Method and apparatus for assessing hemodynamic parameters and vascular position in the circulatory system of a living subject |
Country Status (6)
| Country | Link |
|---|---|
| US (4) | US6554774B1 (en) |
| EP (1) | EP1324788A2 (en) |
| JP (1) | JP2004521660A (en) |
| AU (1) | AU4766501A (en) |
| CA (1) | CA2403728A1 (en) |
| WO (1) | WO2001070303A2 (en) |
Cited By (5)
| Publication number | Priority date | Publication date | Assignee | Title |
|---|---|---|---|---|
| JP2007244835A (en) * | 2006-02-17 | 2007-09-27 | Aloka Co Ltd | Ultrasonic diagnostic apparatus |
| JP2013144098A (en) * | 2011-12-14 | 2013-07-25 | Seiko Epson Corp | Blood pressure measuring apparatus and blood pressure measuring method |
| JP2014521452A (en) * | 2011-08-03 | 2014-08-28 | エコセンス | Method for determining in real time the probability that a biological tissue of interest is facing an ultrasonic transducer |
| JP2017512104A (en) * | 2014-03-11 | 2017-05-18 | ザ・ジョンズ・ホプキンス・ユニバーシティ | A method for determining flow and pressure gradients in arterial networks from contrast distributions based on patient-specific computed tomography algorithms |
| WO2017085896A1 (en) * | 2015-11-20 | 2017-05-26 | 富士通株式会社 | Information processing device, information processing method, and information processing program |
Families Citing this family (166)
| Publication number | Priority date | Publication date | Assignee | Title |
|---|---|---|---|---|
| US5797850A (en) * | 1993-11-09 | 1998-08-25 | Medwave, Inc. | Method and apparatus for calculating blood pressure of an artery |
| US7771402B2 (en) * | 1996-07-11 | 2010-08-10 | PulseCare Medical | Wound irrigation containment arrangement |
| US6471655B1 (en) * | 1999-06-29 | 2002-10-29 | Vitalwave Corporation | Method and apparatus for the noninvasive determination of arterial blood pressure |
| US6554774B1 (en) * | 2000-03-23 | 2003-04-29 | Tensys Medical, Inc. | Method and apparatus for assessing hemodynamic properties within the circulatory system of a living subject |
| EP1423048A1 (en) | 2001-05-09 | 2004-06-02 | Hemonix, Inc. | Non-invasive method and apparatus for measuring physiologic parameters |
| US8034026B2 (en) * | 2001-05-18 | 2011-10-11 | Deka Products Limited Partnership | Infusion pump assembly |
| MXPA03010576A (en) | 2001-05-18 | 2004-05-27 | Deka Products Lp | Infusion set for a fluid pump. |
| JP2003047601A (en) * | 2001-05-31 | 2003-02-18 | Denso Corp | Organism abnormality monitoring system, blood pressure monitoring system, organism abnormality monitoring method and blood pressure monitoring method |
| JP3898047B2 (en) * | 2001-07-09 | 2007-03-28 | セイコーインスツル株式会社 | Blood rheology measuring device |
| US7317409B2 (en) * | 2002-01-30 | 2008-01-08 | Tensys Medical, Inc. | Apparatus and method for interfacing time-variant signals |
| US6730038B2 (en) | 2002-02-05 | 2004-05-04 | Tensys Medical, Inc. | Method and apparatus for non-invasively measuring hemodynamic parameters using parametrics |
| US8774913B2 (en) | 2002-04-08 | 2014-07-08 | Medtronic Ardian Luxembourg S.A.R.L. | Methods and apparatus for intravasculary-induced neuromodulation |
| US8150519B2 (en) | 2002-04-08 | 2012-04-03 | Ardian, Inc. | Methods and apparatus for bilateral renal neuromodulation |
| US7653438B2 (en) | 2002-04-08 | 2010-01-26 | Ardian, Inc. | Methods and apparatus for renal neuromodulation |
| JP3632014B2 (en) * | 2002-05-14 | 2005-03-23 | コーリンメディカルテクノロジー株式会社 | Endothelial function evaluation device |
| US6865407B2 (en) * | 2002-07-11 | 2005-03-08 | Optical Sensors, Inc. | Calibration technique for non-invasive medical devices |
| CA2494548A1 (en) * | 2002-08-01 | 2004-02-12 | Tensys Medical, Inc. | Method and apparatus for control of non-invasive parameter measurements |
| US6974419B1 (en) * | 2002-08-01 | 2005-12-13 | Tensys Medical, Inc. | Method and apparatus for control of non-invasive parameter measurements |
| US6733461B2 (en) * | 2002-08-01 | 2004-05-11 | Hypertension Diagnostics, Inc. | Methods and apparatus for measuring arterial compliance, improving pressure calibration, and computing flow from pressure data |
| JP4269623B2 (en) * | 2002-10-07 | 2009-05-27 | 株式会社 東北テクノアーチ | Blood flow visualization diagnostic device |
| US20060184051A1 (en) * | 2002-10-11 | 2006-08-17 | Hempstead Russell D | Apparatus and methods for non-invasively measuring hemodynamic parameters |
| US20050080345A1 (en) * | 2002-10-11 | 2005-04-14 | Finburgh Simon E. | Apparatus and methods for non-invasively measuring hemodynamic parameters |
| US20040073123A1 (en) * | 2002-10-11 | 2004-04-15 | Hessel Stephen R. | Apparatus and methods for non-invasively measuring hemodynamic parameters |
| FR2848093B1 (en) * | 2002-12-06 | 2005-12-30 | Ge Med Sys Global Tech Co Llc | METHOD FOR DETECTING THE CARDIAC CYCLE FROM AN ANGIOGRAM OF CORONARY VESSELS |
| US20060106321A1 (en) * | 2003-01-16 | 2006-05-18 | Galil Medical Ltd. | Device, system, and method for detecting, localizing, and characterizing plaque-induced stenosis of a blood vessel |
| US7011631B2 (en) * | 2003-01-21 | 2006-03-14 | Hemonix, Inc. | Noninvasive method of measuring blood density and hematocrit |
| JP3838201B2 (en) * | 2003-01-21 | 2006-10-25 | オムロンヘルスケア株式会社 | Pulse wave detector |
| US20060287590A1 (en) * | 2003-09-18 | 2006-12-21 | Mceowen Edwin L | Noninvasive vital sign measurement device |
| US7559894B2 (en) * | 2003-09-18 | 2009-07-14 | New Paradigm Concepts, LLC | Multiparameter whole blood monitor and method |
| US7390303B2 (en) * | 2003-09-30 | 2008-06-24 | Ehud Dafni | Assessment of vascular dilatation |
| US7220230B2 (en) * | 2003-12-05 | 2007-05-22 | Edwards Lifesciences Corporation | Pressure-based system and method for determining cardiac stroke volume |
| US7422562B2 (en) * | 2003-12-05 | 2008-09-09 | Edwards Lifesciences | Real-time measurement of ventricular stroke volume variations by continuous arterial pulse contour analysis |
| US7452333B2 (en) * | 2003-12-05 | 2008-11-18 | Edwards Lifesciences Corporation | Arterial pressure-based, automatic determination of a cardiovascular parameter |
| US7672706B2 (en) * | 2004-08-23 | 2010-03-02 | Boston Scientific Scimed, Inc. | Systems and methods for measuring pulse wave velocity with an intravascular device |
| ATE538714T1 (en) * | 2004-08-24 | 2012-01-15 | Gen Hospital Corp | METHOD, SYSTEM AND SOFTWARE ARRANGEMENT FOR DETERMINING THE ELASTIC MODULE |
| US9820658B2 (en) | 2006-06-30 | 2017-11-21 | Bao Q. Tran | Systems and methods for providing interoperability among healthcare devices |
| US7946994B2 (en) * | 2004-10-07 | 2011-05-24 | Tensys Medical, Inc. | Compact apparatus and methods for non-invasively measuring hemodynamic parameters |
| US7708693B2 (en) * | 2005-01-27 | 2010-05-04 | Medtronic, Inc. | System and method for detecting artifactual hemodynamic waveform data |
| JP4767551B2 (en) * | 2005-02-14 | 2011-09-07 | セイコーインスツル株式会社 | Blood rheology measurement device and blood rheology measurement method |
| US20090118612A1 (en) | 2005-05-06 | 2009-05-07 | Sorin Grunwald | Apparatus and Method for Vascular Access |
| US20070016069A1 (en) | 2005-05-06 | 2007-01-18 | Sorin Grunwald | Ultrasound sensor |
| CN100577092C (en) * | 2005-05-24 | 2010-01-06 | 北京新兴阳升科技有限公司 | Method for obtaining and processing auscultatory delay time related to arterial blood information |
| US9389203B2 (en) * | 2005-06-17 | 2016-07-12 | Wisconsin Alumni Research Foundation | Automated ultrasonic elasticity image formation with quality measure |
| US7742815B2 (en) | 2005-09-09 | 2010-06-22 | Cardiac Pacemakers, Inc. | Using implanted sensors for feedback control of implanted medical devices |
| US7420472B2 (en) * | 2005-10-16 | 2008-09-02 | Bao Tran | Patient monitoring apparatus |
| US7733224B2 (en) | 2006-06-30 | 2010-06-08 | Bao Tran | Mesh network personal emergency response appliance |
| US20070112274A1 (en) * | 2005-11-14 | 2007-05-17 | Edwards Lifesciences Corporation | Wireless communication system for pressure monitoring |
| US7595723B2 (en) * | 2005-11-14 | 2009-09-29 | Edwards Lifesciences Corporation | Wireless communication protocol for a medical sensor system |
| US20070142727A1 (en) * | 2005-12-15 | 2007-06-21 | Cardiac Pacemakers, Inc. | System and method for analyzing cardiovascular pressure measurements made within a human body |
| JPWO2007080870A1 (en) * | 2006-01-11 | 2009-06-11 | パナソニック株式会社 | Ultrasonic diagnostic equipment |
| JP5048248B2 (en) * | 2006-01-25 | 2012-10-17 | 株式会社ユネクス | Biological artery lumen diameter measuring device |
| DE102006004415A1 (en) * | 2006-01-31 | 2007-08-09 | Up Management Gmbh & Co Med-Systems Kg | Apparatus for evaluating a hemodynamic condition of a patient using cardiopulmonary interaction |
| RU2309668C1 (en) | 2006-02-20 | 2007-11-10 | Александр Сергеевич Парфенов | Method and device for non-invasive measurement of function of endothelium |
| US8920343B2 (en) | 2006-03-23 | 2014-12-30 | Michael Edward Sabatino | Apparatus for acquiring and processing of physiological auditory signals |
| US8968195B2 (en) | 2006-05-12 | 2015-03-03 | Bao Tran | Health monitoring appliance |
| US7539532B2 (en) | 2006-05-12 | 2009-05-26 | Bao Tran | Cuffless blood pressure monitoring appliance |
| US8323189B2 (en) | 2006-05-12 | 2012-12-04 | Bao Tran | Health monitoring appliance |
| US9060683B2 (en) | 2006-05-12 | 2015-06-23 | Bao Tran | Mobile wireless appliance |
| US8500636B2 (en) | 2006-05-12 | 2013-08-06 | Bao Tran | Health monitoring appliance |
| US8684922B2 (en) | 2006-05-12 | 2014-04-01 | Bao Tran | Health monitoring system |
| US7558622B2 (en) * | 2006-05-24 | 2009-07-07 | Bao Tran | Mesh network stroke monitoring appliance |
| EP2020911A4 (en) | 2006-05-13 | 2011-07-27 | Tensys Medical Inc | Continuous positioning apparatus and methods |
| US7539533B2 (en) * | 2006-05-16 | 2009-05-26 | Bao Tran | Mesh network monitoring appliance |
| US8684900B2 (en) | 2006-05-16 | 2014-04-01 | Bao Tran | Health monitoring appliance |
| US8968204B2 (en) * | 2006-06-12 | 2015-03-03 | Transonic Systems, Inc. | System and method of perivascular pressure and flow measurement |
| US20080021334A1 (en) * | 2006-07-19 | 2008-01-24 | Finburgh Simon E | Apparatus and methods for non-invasively measuring hemodynamic parameters |
| US7955268B2 (en) | 2006-07-21 | 2011-06-07 | Cardiac Pacemakers, Inc. | Multiple sensor deployment |
| US8157733B2 (en) * | 2006-08-25 | 2012-04-17 | Daeyo Medi Co., Ltd. | Blood pressure measurement apparatus |
| US8231538B2 (en) * | 2007-02-20 | 2012-07-31 | University Of Louisville Research Foundation, Inc. | Perivascular pressure sensor and sensing system |
| US20080228026A1 (en) * | 2007-03-14 | 2008-09-18 | Applied Cardiac Systems, Inc. | Method and apparatus for image enhanced external counterpulsation |
| MX2009010337A (en) * | 2007-03-28 | 2009-10-19 | Kaz Inc | Arterial blood pressure monitor with a liquid filled cuff. |
| JP4945300B2 (en) * | 2007-04-25 | 2012-06-06 | 株式会社東芝 | Ultrasonic diagnostic equipment |
| US7884727B2 (en) * | 2007-05-24 | 2011-02-08 | Bao Tran | Wireless occupancy and day-light sensing |
| EP2170162B1 (en) | 2007-06-26 | 2017-08-23 | Vasonova, Inc. | Apparatus for endovascular device guiding and positioning using physiological parameters |
| US8777862B2 (en) | 2007-10-12 | 2014-07-15 | Tensys Medical, Inc. | Apparatus and methods for non-invasively measuring a patient's arterial blood pressure |
| US9521961B2 (en) | 2007-11-26 | 2016-12-20 | C. R. Bard, Inc. | Systems and methods for guiding a medical instrument |
| ES2651898T3 (en) | 2007-11-26 | 2018-01-30 | C.R. Bard Inc. | Integrated system for intravascular catheter placement |
| US8781555B2 (en) | 2007-11-26 | 2014-07-15 | C. R. Bard, Inc. | System for placement of a catheter including a signal-generating stylet |
| JP4879872B2 (en) * | 2007-12-20 | 2012-02-22 | 国立大学法人岐阜大学 | Image processing apparatus, image processing program, storage medium, and ultrasonic diagnostic apparatus |
| JP5158690B2 (en) * | 2007-12-20 | 2013-03-06 | 国立大学法人岐阜大学 | Image processing apparatus, image processing program, storage medium, and ultrasonic diagnostic apparatus |
| AU2009205311A1 (en) * | 2008-01-15 | 2009-07-23 | Benjamin Gavish | Determination of physiological parameters using repeated blood pressure measurements |
| US20090270739A1 (en) * | 2008-01-30 | 2009-10-29 | Edwards Lifesciences Corporation | Real-time detection of vascular conditions of a subject using arterial pressure waveform analysis |
| JP5211177B2 (en) | 2008-02-11 | 2013-06-12 | カーディアック ペースメイカーズ, インコーポレイテッド | Hemodynamic monitoring method for rhythm discrimination in the heart |
| WO2009102640A1 (en) | 2008-02-12 | 2009-08-20 | Cardiac Pacemakers, Inc. | Systems and methods for controlling wireless signal transfers between ultrasound-enabled medical devices |
| TWI359006B (en) * | 2008-04-18 | 2012-03-01 | Hsien Tsai Wu | A device and method for early blood vessel aging d |
| US8690786B2 (en) * | 2008-06-23 | 2014-04-08 | General Electric Company | System and method for a non-invasive blood pressure monitor |
| US8066672B2 (en) | 2008-10-10 | 2011-11-29 | Deka Products Limited Partnership | Infusion pump assembly with a backup power supply |
| US8016789B2 (en) | 2008-10-10 | 2011-09-13 | Deka Products Limited Partnership | Pump assembly with a removable cover assembly |
| JP5465252B2 (en) | 2008-10-10 | 2014-04-09 | カーディアック ペースメイカーズ, インコーポレイテッド | System and method for determining cardiac output using pulmonary artery pressure measurements |
| US8223028B2 (en) | 2008-10-10 | 2012-07-17 | Deka Products Limited Partnership | Occlusion detection system and method |
| US8262616B2 (en) | 2008-10-10 | 2012-09-11 | Deka Products Limited Partnership | Infusion pump assembly |
| US9180245B2 (en) | 2008-10-10 | 2015-11-10 | Deka Products Limited Partnership | System and method for administering an infusible fluid |
| US8267892B2 (en) * | 2008-10-10 | 2012-09-18 | Deka Products Limited Partnership | Multi-language / multi-processor infusion pump assembly |
| US8708376B2 (en) | 2008-10-10 | 2014-04-29 | Deka Products Limited Partnership | Medium connector |
| US8632470B2 (en) * | 2008-11-19 | 2014-01-21 | Cardiac Pacemakers, Inc. | Assessment of pulmonary vascular resistance via pulmonary artery pressure |
| GB2465787B (en) * | 2008-11-28 | 2011-04-06 | Royal United Hospital Bath Nhs Trust | Method of measuring blood pressure and apparatus for performing the same |
| US8057400B2 (en) * | 2009-05-12 | 2011-11-15 | Angiologix, Inc. | System and method of measuring changes in arterial volume of a limb segment |
| US20100312118A1 (en) * | 2009-06-03 | 2010-12-09 | Horzewski Michael J | Systems and Methods for Perfusion Enhanced Diagnostic Imaging |
| US9204857B2 (en) * | 2009-06-05 | 2015-12-08 | General Electric Company | System and method for monitoring hemodynamic state |
| US9532724B2 (en) | 2009-06-12 | 2017-01-03 | Bard Access Systems, Inc. | Apparatus and method for catheter navigation using endovascular energy mapping |
| JP2011025011A (en) * | 2009-06-26 | 2011-02-10 | Toshiba Corp | Ultrasonic diagnosis apparatus and ultrasonic diagnosis apparatus control program |
| US9585638B2 (en) | 2010-03-06 | 2017-03-07 | Russell Dewey | System for classifying palpable soft tissue masses using A-mode echographs |
| EP2912999B1 (en) | 2010-05-28 | 2022-06-29 | C. R. Bard, Inc. | Apparatus for use with needle insertion guidance system |
| EP2637568B1 (en) | 2010-11-08 | 2017-04-12 | Vasonova, Inc. | Endovascular navigation system |
| US8864670B2 (en) | 2011-01-28 | 2014-10-21 | Hospira, Inc. | Ultrasonic monitoring device for measuring physiological parameters of a mammal |
| US10186056B2 (en) * | 2011-03-21 | 2019-01-22 | General Electric Company | System and method for estimating vascular flow using CT imaging |
| KR101167614B1 (en) * | 2011-03-30 | 2012-07-20 | 한국과학기술원 | Apparatus and method for measuring blood flow |
| US9655530B2 (en) | 2011-04-29 | 2017-05-23 | Tensys Medical, Inc. | Apparatus and methods for non-invasively measuring physiologic parameters of one or more subjects |
| RU2470581C1 (en) * | 2011-06-21 | 2012-12-27 | Федеральное государственное бюджетное образовательное учреждение высшего профессионального образования "Рязанский государственный радиотехнический университет" | Method of registering patient's breathing and heartbeat rhythms and device for its realisation |
| KR102073221B1 (en) | 2011-07-25 | 2020-02-04 | 치타 메디컬, 인코퍼레이티드 | Method and system for monitoring hemodynamics |
| DE102011109037A1 (en) * | 2011-07-30 | 2013-01-31 | Universität Zu Lübeck | Method for finding the position of a transducer |
| WO2013019991A1 (en) * | 2011-08-04 | 2013-02-07 | Masimo Corporation | Occlusive non-inflatable blood pressure device |
| WO2013063465A1 (en) * | 2011-10-28 | 2013-05-02 | Ultrasound Medical Devices, Inc. | Method for obtaining a three-dimensional velocity measurement of a tissue |
| US10736519B2 (en) * | 2012-01-19 | 2020-08-11 | Philips Image Guided Therapy Corporation | Interface devices, systems, and methods for use with intravascular pressure monitoring devices |
| JP6185048B2 (en) | 2012-05-07 | 2017-08-23 | バソノバ・インコーポレイテッドVasonova, Inc. | System and method for detection of superior vena cava area and vena cava atrial junction |
| WO2013170144A1 (en) * | 2012-05-11 | 2013-11-14 | Volcano Corporation | Device, system, and method for flow imaging in the body using a swept transducer |
| US20130324842A1 (en) * | 2012-05-29 | 2013-12-05 | The Johns Hopkins University | Method for Estimating Pressure Gradients and Fractional Flow Reserve from Computed Tomography Angiography: Transluminal Attenuation Flow Encoding |
| US9265473B2 (en) | 2012-09-25 | 2016-02-23 | The Johns Hopkins University | Method for estimating flow rates and pressure gradients in arterial networks from patient specific computed tomography angiogram-based contrast distribution data |
| EP2900142B1 (en) | 2012-09-25 | 2019-09-04 | The Johns Hopkins University | A method for estimating flow rates, pressure gradients, coronary flow reserve, and fractional flow reserve from patient specific computed tomography angiogram-based contrast distribution data |
| US9865176B2 (en) | 2012-12-07 | 2018-01-09 | Koninklijke Philips N.V. | Health monitoring system |
| US20140309532A1 (en) * | 2013-03-12 | 2014-10-16 | Allison Bedell | Method for non-invasively detecting the narrowing of a lumen |
| US9949696B2 (en) | 2013-03-14 | 2018-04-24 | Tensys Medical, Inc. | Apparatus and methods for computing cardiac output of a living subject via applanation tonometry |
| US9345436B2 (en) | 2013-03-14 | 2016-05-24 | HighDim GmbH | Apparatus and methods for computing cardiac output of a living subject |
| JP6532857B2 (en) * | 2013-03-15 | 2019-06-19 | ボルケーノ コーポレイション | Interface device, system and method for use with an intravascular pressure monitoring device |
| US20140330087A1 (en) * | 2013-05-01 | 2014-11-06 | Medsensation, Inc. | Devices and methods for obtaining physiological data |
| EP3019075B1 (en) * | 2013-07-08 | 2020-03-25 | Edwards Lifesciences Corporation | Determination of a hemodynamic parameter |
| WO2015066445A1 (en) * | 2013-10-31 | 2015-05-07 | The General Hospital Corporation | System for measuring and monitoring blood pressure |
| US9931076B2 (en) * | 2014-06-18 | 2018-04-03 | Hong Kong Applied Science and Technology Research Institute Company Limited | Method and device for tonometric blood pressure measurement |
| US20160302672A1 (en) * | 2014-08-04 | 2016-10-20 | Yamil Kuri | System and Method for Determining Arterial Compliance and Stiffness |
| US9408541B2 (en) * | 2014-08-04 | 2016-08-09 | Yamil Kuri | System and method for determining arterial compliance and stiffness |
| GB201415649D0 (en) * | 2014-09-04 | 2014-10-22 | Univ Heriot Watt | A membrane sensor for dynamic instrumented palpatation of soft materials |
| CN107072538B (en) | 2014-09-08 | 2021-07-13 | 苹果公司 | Electrically coupling a Pulse Transit Time (PTT) measurement system to a heart for blood pressure measurement |
| CN107106054B (en) | 2014-09-08 | 2021-11-02 | 苹果公司 | Blood pressure monitoring using multifunctional wrist-worn device |
| US10517489B2 (en) | 2014-09-08 | 2019-12-31 | Apple Inc. | Wrist worn accelerometer for pulse transit time (PTT) measurements of blood pressure |
| US10702171B2 (en) | 2014-09-08 | 2020-07-07 | Apple Inc. | Systems, devices, and methods for measuring blood pressure of a user |
| US10327734B2 (en) | 2014-12-30 | 2019-06-25 | Biosense Webster (Israel) Ltd. | Measurement of tissue thickness using ultrasound and force measurements |
| US10881307B1 (en) * | 2015-09-29 | 2021-01-05 | Apple Inc. | Devices and systems for correcting errors in blood pressure measurements |
| JP6818492B2 (en) * | 2015-10-05 | 2021-01-20 | キヤノンメディカルシステムズ株式会社 | Image processing equipment, image processing methods, and programs |
| WO2017096487A1 (en) * | 2015-12-10 | 2017-06-15 | 1929803 Ontario Corp. D/B/A Ke2 Technologies | Systems and methods for automated fluid response measurement |
| US10987085B2 (en) | 2015-12-10 | 2021-04-27 | 1929803 Ontario Corp | Systems and methods for automated fluid response measurement |
| US10315222B2 (en) | 2016-05-04 | 2019-06-11 | Invensense, Inc. | Two-dimensional array of CMOS control elements |
| US10445547B2 (en) | 2016-05-04 | 2019-10-15 | Invensense, Inc. | Device mountable packaging of ultrasonic transducers |
| US10441975B2 (en) | 2016-05-10 | 2019-10-15 | Invensense, Inc. | Supplemental sensor modes and systems for ultrasonic transducers |
| US10706835B2 (en) | 2016-05-10 | 2020-07-07 | Invensense, Inc. | Transmit beamforming of a two-dimensional array of ultrasonic transducers |
| US10646197B2 (en) | 2016-07-06 | 2020-05-12 | Biosense Webster (Israel) Ltd. | Ascertaining tissue thickness |
| US11020563B2 (en) | 2016-07-14 | 2021-06-01 | C. R. Bard, Inc. | Automated catheter-to-vessel size comparison tool and related methods |
| KR101819833B1 (en) * | 2016-10-28 | 2018-01-17 | 한국 한의학 연구원 | Apparatus and method for measuring vein elasticity |
| IT201600121223A1 (en) * | 2016-11-30 | 2018-05-30 | St Microelectronics Srl | MULTI-TRANSDUCER MODULE, ELECTRONIC EQUIPMENT INCLUDING THE MULTI-TRANSDUCER MODULE AND MULTI-TRANSDUCER MODULE MANUFACTURING METHOD |
| US20180214033A1 (en) * | 2017-02-02 | 2018-08-02 | Edwards Lifesciences Corporation | Hemodynamic monitor providing enhanced cardiac output measurements |
| US11096654B2 (en) * | 2017-04-14 | 2021-08-24 | Massachusetts Institute Of Technology | Non-invasive assessment of anatomic vessels |
| CA3088170A1 (en) | 2018-01-11 | 2019-07-18 | Neural Analytics, Inc. | System and method for assessing signal quality |
| EP3762072A4 (en) | 2018-03-09 | 2021-11-17 | 1929803 Ontario Corp. D/B/A Flosonics Medical | Dynamically controllable patient fluid control device |
| TWI682169B (en) * | 2018-03-29 | 2020-01-11 | 佳世達科技股份有限公司 | Ultrasound imaging method |
| JP7314183B2 (en) * | 2018-06-15 | 2023-07-25 | パイ メディカル イメージング ビー ヴイ | Method and apparatus for quantitative hemodynamic flow analysis |
| US11109831B2 (en) | 2018-07-17 | 2021-09-07 | 1929803 Ontario Corp, (o/a FloSonics Medical) | Ultrasound patch for detecting fluid flow |
| WO2020081373A1 (en) | 2018-10-16 | 2020-04-23 | Bard Access Systems, Inc. | Safety-equipped connection systems and methods thereof for establishing electrical connections |
| CA3135000A1 (en) | 2019-05-01 | 2020-11-05 | Bard Access Systems, Inc. | Puncturing devices, puncturing systems including the puncturing devices, and methods thereof |
| US11176345B2 (en) | 2019-07-17 | 2021-11-16 | Invensense, Inc. | Ultrasonic fingerprint sensor with a contact layer of non-uniform thickness |
| CA3152545A1 (en) | 2019-09-20 | 2021-03-25 | Bard Access Systems, Inc. | Automatic vessel detection tools and methods |
| US11392789B2 (en) | 2019-10-21 | 2022-07-19 | Invensense, Inc. | Fingerprint authentication using a synthetic enrollment image |
| CN115551650A (en) | 2020-03-09 | 2022-12-30 | 应美盛公司 | Ultrasonic fingerprint sensor with contact layer of non-uniform thickness |
| CN111631700B (en) * | 2020-05-25 | 2021-08-10 | 华南理工大学 | System for regulating blood pressure according to optimal blood pressure target value |
| WO2022008970A1 (en) | 2020-07-06 | 2022-01-13 | 1929803 Ontario Corp. D/B/A Flosonics Medical | Ultrasound patch with integrated flexible transducer assembly |
| WO2022020351A1 (en) | 2020-07-21 | 2022-01-27 | Bard Access Systems, Inc. | System, method and apparatus for magnetic tracking of ultrasound probe and generation of 3d visualization thereof |
| WO2022051657A1 (en) | 2020-09-03 | 2022-03-10 | Bard Access Systems, Inc. | Portable ultrasound systems and methods |
| US11925505B2 (en) | 2020-09-25 | 2024-03-12 | Bard Access Systems, Inc. | Minimum catheter length tool |
Family Cites Families (117)
| Publication number | Priority date | Publication date | Assignee | Title |
|---|---|---|---|---|
| US3527197A (en) * | 1966-04-19 | 1970-09-08 | Southwest Res Inst | Indirect blood pressure measurement |
| US3601120A (en) | 1969-04-14 | 1971-08-24 | Hoffmann La Roche | Ultrasonic doppler body surface movement detector |
| US3617993A (en) | 1969-09-10 | 1971-11-02 | Hoffmann La Roche | Cw doppler transceiver system |
| US3663932A (en) | 1970-07-15 | 1972-05-16 | Hoffmann La Roche | Reconstruction of reflecting surface velocity and displacement from doppler signals |
| US3885551A (en) | 1971-04-01 | 1975-05-27 | Hoffmann La Roche | Artifact rejection for blood pressure monitoring |
| US3791378A (en) | 1971-04-01 | 1974-02-12 | Hoffmann La Roche | Blood pressure monitor with rate sensing artifact rejection processing circuitry |
| US4127114A (en) | 1976-08-30 | 1978-11-28 | Carba S.A. | Apparatus for the automatic measurement of the arterial pressure of a patient |
| US4109647A (en) | 1977-03-16 | 1978-08-29 | The United States Of America As Represented By The Secretary Of The Department Of Health, Education And Welfare | Method of and apparatus for measurement of blood flow using coherent light |
| US4154231A (en) | 1977-11-23 | 1979-05-15 | Russell Robert B | System for non-invasive cardiac diagnosis |
| US4349034A (en) | 1978-04-10 | 1982-09-14 | Johnson & Johnson | Automatic mean blood pressure reading device |
| JPS608819B2 (en) | 1978-04-24 | 1985-03-06 | 北海道大学長 | Optical measurement method for biological systems |
| US4239047A (en) | 1978-05-22 | 1980-12-16 | William L. Griggs, III | Method and apparatus for aurally determining presence or absence of pathological stenosis |
| SE419678B (en) | 1978-10-31 | 1981-08-17 | Gert Erik Nilsson | SET AND DEVICE FOR Saturation of flow fluxes in a fluid |
| US4249034A (en) * | 1978-11-27 | 1981-02-03 | General Electric Company | Semiconductor package having strengthening and sealing upper chamber |
| WO1984000290A1 (en) | 1982-07-19 | 1984-02-02 | Bomed Medical Mfg | Non-invasive real time blood pressure measurement system |
| DE3480233D1 (en) * | 1983-05-25 | 1989-11-23 | Aloka Co Ltd | Ultrasonic diagnostic apparatus |
| US4566462A (en) | 1983-11-21 | 1986-01-28 | School Of Medicine Texas Tech. Univ. Health Servcs. Ctr. | Venous pressure measuring method and apparatus |
| SE8400289D0 (en) | 1984-01-20 | 1984-01-20 | Perimed Kb | SET AND DEVICE FOR DETERMINATION OF THE BLOOD FLOOD IN THE EXTRA BLOCK CARTRIDGE OF A TISSUE |
| US4718428A (en) * | 1984-02-17 | 1988-01-12 | Cortronic Corporation | Method for determining diastolic arterial blood pressure in a subject |
| GB2156985B (en) * | 1984-04-02 | 1987-06-24 | Teltec Electronic Equip | Apparatus for measuring movable part-structures, eg blood vessels, within a living body |
| US4651747A (en) | 1984-06-20 | 1987-03-24 | Baxter Travenol Laboratories, Inc. | Waveform information obtaining techniques associated with an individual's blood pressure |
| US4596254A (en) | 1984-12-18 | 1986-06-24 | Tsi Research Associates Limited Partnership | Laser Doppler flow monitor |
| US4771792A (en) | 1985-02-19 | 1988-09-20 | Seale Joseph B | Non-invasive determination of mechanical characteristics in the body |
| US4719923A (en) | 1985-05-06 | 1988-01-19 | American Telephone And Telegraph Company, At&T Bell Laboratories | Non-invasive blood flow measurements utilizing autoregressive analysis with averaged reflection coefficients |
| US4754761A (en) | 1985-07-05 | 1988-07-05 | Critikon, Inc. | Automated mean arterial blood pressure monitor with data enhancement |
| US4721113A (en) * | 1985-09-20 | 1988-01-26 | Temple University Of The Commonwealth System Of Higher Education | Method of predicting the occurrence of deep vein thrombosis by non-invasive measurement of vessel diameter |
| DE3613957C1 (en) * | 1986-04-24 | 1987-06-25 | Bat Cigarettenfab Gmbh | Method and device for regulating at least two of the physical properties of a strand made of smokable material which are decisive for the quality of the finished product |
| JPS63241814A (en) | 1987-03-27 | 1988-10-07 | Sumitomo Electric Ind Ltd | Manufacture of superconducting wire rod |
| CS272057B1 (en) | 1987-03-27 | 1991-01-15 | Jan Doc Mudr Csc Penaz | Blood pressure automatic non-invasive meter |
| FR2617394B1 (en) | 1987-07-03 | 1994-07-29 | Boutin Gerard | DEVICE FOR MEASURING BLOOD PRESSURE IN A SURFACE ARTERY |
| IL86010A (en) | 1987-07-03 | 1993-02-21 | Hi Bridge Kk | Apparatus for measuring blood pressure |
| JPH0428562Y2 (en) | 1988-02-23 | 1992-07-10 | ||
| US4924871A (en) | 1988-02-26 | 1990-05-15 | Colin Electronics Co., Ltd. | Motion artifact detection for continuous blood pressure monitor transducer |
| US4880013A (en) | 1988-03-24 | 1989-11-14 | Chio Shiu Shin | Method and apparatus for determining blood pressure and cardiovascular condition |
| EP0342249B1 (en) | 1988-05-14 | 1991-01-09 | Hewlett-Packard GmbH | Blood pressure monitor |
| JP2798682B2 (en) | 1988-10-19 | 1998-09-17 | コーリン電子株式会社 | Pulse wave detector |
| US4960128A (en) | 1988-11-14 | 1990-10-02 | Paramed Technology Incorporated | Method and apparatus for continuously and non-invasively measuring the blood pressure of a patient |
| US5163438A (en) | 1988-11-14 | 1992-11-17 | Paramed Technology Incorporated | Method and apparatus for continuously and noninvasively measuring the blood pressure of a patient |
| CH678691A5 (en) * | 1989-03-08 | 1991-10-31 | Asulab Sa | |
| US5030956A (en) | 1989-04-25 | 1991-07-09 | Murphy Quentin M | Radar tomography |
| US5094244A (en) | 1989-08-25 | 1992-03-10 | Health Monitors, Inc. | Apparatus and process for determining systolic blood pressure, diastolic blood pressure, mean arterial blood pressure, pulse rate, pulse wave shape, respiratory pattern, and respiratory rate |
| JPH05506371A (en) * | 1990-01-25 | 1993-09-22 | コモンウエルス サイエンテイフイック アンド インダストリアル リサーチ オーガナイゼイション | Ultrasonic testing method and device for determining tubular body position and dimensions |
| JP2851900B2 (en) | 1990-03-01 | 1999-01-27 | コーリン電子株式会社 | Pulse wave detector |
| US5072733A (en) | 1990-03-14 | 1991-12-17 | Avner Spector | Shock wave lithotripter and method for using the same |
| JP2524278Y2 (en) | 1990-09-10 | 1997-01-29 | コーリン電子株式会社 | Pulse wave detector |
| JPH088920B2 (en) * | 1990-09-28 | 1996-01-31 | 富士通株式会社 | Blood scattering power calculator |
| US5241964A (en) | 1990-10-31 | 1993-09-07 | Medwave, Incorporated | Noninvasive, non-occlusive method and apparatus which provides a continuous indication of arterial pressure and a beat-by-beat characterization of the arterial system |
| US5158091A (en) | 1990-11-30 | 1992-10-27 | Ivac Corporation | Tonometry system for determining blood pressure |
| US5240007A (en) | 1991-05-14 | 1993-08-31 | Ivac Corporation | Apparatus and method for moving a tissue stress sensor for applanating an artery |
| US5273046A (en) | 1992-04-15 | 1993-12-28 | Ivac Corporation | Method of determining optimum artery applanation |
| US5409010A (en) * | 1992-05-19 | 1995-04-25 | Board Of Regents Of The University Of Washington | Vector doppler medical devices for blood velocity studies |
| DE4218319A1 (en) | 1992-06-03 | 1993-12-09 | Siemens Ag | Time and frequency distribution signal analysis arrangement - contains convolution device fed via mixers converting frequency range |
| DE69333503T2 (en) | 1992-09-21 | 2004-11-18 | Institut National De La Santé Et De La Recherche Médicale (Inserm) | INTRACORPORAL PROBE FOR DETERMINING THE SPEED OF A LIQUID, IN PARTICULAR THE FLOW THROUGH THE AORTA |
| US5327893A (en) * | 1992-10-19 | 1994-07-12 | Rensselaer Polytechnic Institute | Detection of cholesterol deposits in arteries |
| US5542688A (en) | 1992-10-27 | 1996-08-06 | Atlantic Research Corporation | Two-part igniter for gas generating compositions |
| US5261412A (en) | 1992-11-20 | 1993-11-16 | Ivac Corporation | Method of continuously monitoring blood pressure |
| US5566676A (en) | 1992-12-11 | 1996-10-22 | Siemens Medical Systems, Inc. | Pressure data acquisition device for a patient monitoring system |
| US5406952A (en) | 1993-02-11 | 1995-04-18 | Biosyss Corporation | Blood pressure monitoring system |
| US5494043A (en) | 1993-05-04 | 1996-02-27 | Vital Insite, Inc. | Arterial sensor |
| GB9312962D0 (en) | 1993-06-23 | 1993-08-04 | Akinyemi Samuel N O | An indirect pulse pressure manometer |
| US5368039A (en) | 1993-07-26 | 1994-11-29 | Moses; John A. | Method and apparatus for determining blood pressure |
| JP3342129B2 (en) | 1993-10-26 | 2002-11-05 | 日本コーリン株式会社 | Pressure pulse wave sensor |
| IL107540A0 (en) | 1993-11-08 | 1994-02-27 | Nevo Erez | Method and apparatus for assessing cardiovascular performance |
| US5941828A (en) * | 1993-11-09 | 1999-08-24 | Medwave, Inc. | Hand-held non-invasive blood pressure measurement device |
| US5797850A (en) * | 1993-11-09 | 1998-08-25 | Medwave, Inc. | Method and apparatus for calculating blood pressure of an artery |
| US5450852A (en) | 1993-11-09 | 1995-09-19 | Medwave, Inc. | Continuous non-invasive blood pressure monitoring system |
| US5439001A (en) | 1993-11-17 | 1995-08-08 | Ivac Corporation | Flexible diaphragm tonometer |
| US5836884A (en) | 1993-12-17 | 1998-11-17 | Pulse Metric, Inc. | Method for diagnosing, monitoring and treating hypertension and other cardiac problems |
| US5379770A (en) * | 1993-12-21 | 1995-01-10 | Nicolet Biomedical, Inc. | Method and apparatus for transcranial doppler sonography |
| US5533511A (en) | 1994-01-05 | 1996-07-09 | Vital Insite, Incorporated | Apparatus and method for noninvasive blood pressure measurement |
| US5363850A (en) * | 1994-01-26 | 1994-11-15 | Cardiovascular Imaging Systems, Inc. | Method for recognition and reduction of blood speckle in blood vessel imaging system |
| US6371921B1 (en) * | 1994-04-15 | 2002-04-16 | Masimo Corporation | System and method of determining whether to recalibrate a blood pressure monitor |
| US5590649A (en) | 1994-04-15 | 1997-01-07 | Vital Insite, Inc. | Apparatus and method for measuring an induced perturbation to determine blood pressure |
| US5904654A (en) * | 1995-10-20 | 1999-05-18 | Vital Insite, Inc. | Exciter-detector unit for measuring physiological parameters |
| JP3318727B2 (en) * | 1994-06-06 | 2002-08-26 | 日本光電工業株式会社 | Pulse wave transit time sphygmomanometer |
| US5551434A (en) * | 1994-06-22 | 1996-09-03 | Kabushiki Kaisha Toshiba | Ultrasonic imaging diagnosis apparatus |
| US5908027A (en) | 1994-08-22 | 1999-06-01 | Alaris Medical Systems, Inc. | Tonometry system for monitoring blood pressure |
| US5701898A (en) * | 1994-09-02 | 1997-12-30 | The United States Of America As Represented By The Department Of Health And Human Services | Method and system for Doppler ultrasound measurement of blood flow |
| WO1998053855A1 (en) * | 1997-05-30 | 1998-12-03 | Alliance Pharmaceutical Corp. | Methods and apparatus for monitoring and quantifying the movement of fluid |
| US5617867A (en) | 1994-11-23 | 1997-04-08 | Ivac Medical Systems, Inc. | Tonometer mounting device |
| US5495852A (en) * | 1995-01-27 | 1996-03-05 | Boston Heart Foundation | Method and apparatus for estimating diameter of an artery using B-mode ultrasonic images |
| US5832924A (en) * | 1995-02-16 | 1998-11-10 | Medwave, Inc. | Method of positioning a sensor for determining blood pressure of an artery |
| AUPN338395A0 (en) * | 1995-06-05 | 1995-06-29 | Pwv Medical Pty Ltd | Improved calibration for blood pressure pulses |
| JP3707882B2 (en) * | 1995-11-21 | 2005-10-19 | 株式会社東芝 | Ultrasonic diagnostic equipment |
| US6010457A (en) * | 1996-03-15 | 2000-01-04 | Pmv Medical Pty Ltd | Non-invasive determination of aortic flow velocity waveforms |
| US5642733A (en) | 1996-04-08 | 1997-07-01 | Medwave, Inc. | Blood pressure sensor locator |
| US5749364A (en) * | 1996-06-21 | 1998-05-12 | Acuson Corporation | Method and apparatus for mapping pressure and tissue properties |
| US6027452A (en) * | 1996-06-26 | 2000-02-22 | Vital Insite, Inc. | Rapid non-invasive blood pressure measuring device |
| US5762610A (en) | 1996-07-03 | 1998-06-09 | Colin Corporation | Pressure pulse wave detecting apparatus |
| US5738103A (en) * | 1996-07-31 | 1998-04-14 | Medwave, Inc. | Segmented estimation method |
| US5876346A (en) | 1996-10-07 | 1999-03-02 | Corso; Albert Mario | Artery locating device |
| US5848970A (en) | 1996-12-13 | 1998-12-15 | Vitalwave Corp. | Apparatus and method for non-invasively monitoring a subject's arterial blood pressure |
| US5855557A (en) * | 1996-12-30 | 1999-01-05 | Siemens Medical Systems, Inc. | Ultrasonic imaging system and method for generating and displaying velocity field information |
| US5895359A (en) | 1997-06-06 | 1999-04-20 | Southwest Research Institute | System and method for correcting a living subject's measured blood pressure |
| US5785564A (en) * | 1997-06-23 | 1998-07-28 | Von Ohain; Hans J. | Water craft with a hydrofoil-bladed wheel assembly |
| US5876343A (en) * | 1997-09-23 | 1999-03-02 | Scimed Life Systems, Inc. | Methods and apparatus for blood speckle detection in an intravascular ultrasound imaging system |
| US5916180A (en) | 1997-10-03 | 1999-06-29 | Uromed Corporation | Calibrating pressure sensors |
| US6213949B1 (en) * | 1999-05-10 | 2001-04-10 | Srs Medical Systems, Inc. | System for estimating bladder volume |
| US5964710A (en) * | 1998-03-13 | 1999-10-12 | Srs Medical, Inc. | System for estimating bladder volume |
| JP3250180B2 (en) | 1998-06-17 | 2002-01-28 | 住友重機械工業株式会社 | Depressurization method in plasticization / metering process of electric injection molding machine |
| US6056692A (en) * | 1998-07-08 | 2000-05-02 | Schwartz; John Q. | Apparatus and method for locating and marking blood vessels |
| US6176831B1 (en) | 1998-07-20 | 2001-01-23 | Tensys Medical, Inc. | Apparatus and method for non-invasively monitoring a subject's arterial blood pressure |
| US6228034B1 (en) | 1998-07-20 | 2001-05-08 | Tensys Medical, Inc. | Apparatus and method for non-invasively monitoring a subjects arterial blood pressure |
| US6132382A (en) * | 1998-10-16 | 2000-10-17 | Medwave, Inc. | Non-invasive blood pressure sensor with motion artifact reduction |
| US6159157A (en) * | 1999-04-23 | 2000-12-12 | Medwave, Inc. | Blood pressure measurement device with a sensor locator |
| US7399279B2 (en) * | 1999-05-28 | 2008-07-15 | Physiosonics, Inc | Transmitter patterns for multi beam reception |
| US7238158B2 (en) * | 1999-05-28 | 2007-07-03 | Allez Physionix, Ltd. | Pulse interleaving in doppler ultrasound imaging |
| US7534209B2 (en) * | 2000-05-26 | 2009-05-19 | Physiosonics, Inc. | Device and method for mapping and tracking blood flow and determining parameters of blood flow |
| US6267728B1 (en) * | 1999-06-23 | 2001-07-31 | Steven Mark Hayden | Method for evaluating atherosclerosis and its affect on the elasticity of arterial walls |
| US6471655B1 (en) * | 1999-06-29 | 2002-10-29 | Vitalwave Corporation | Method and apparatus for the noninvasive determination of arterial blood pressure |
| JP2001061840A (en) * | 1999-08-24 | 2001-03-13 | Matsushita Electric Ind Co Ltd | Ultrasonograph |
| US6200268B1 (en) * | 1999-09-10 | 2001-03-13 | The Cleveland Clinic Foundation | Vascular plaque characterization |
| US6554774B1 (en) * | 2000-03-23 | 2003-04-29 | Tensys Medical, Inc. | Method and apparatus for assessing hemodynamic properties within the circulatory system of a living subject |
| IL138073A0 (en) * | 2000-08-24 | 2001-10-31 | Glucon Inc | Photoacoustic assay and imaging system |
| US6692443B2 (en) * | 2000-09-29 | 2004-02-17 | New Health Sciences, Inc. | Systems and methods for investigating blood flow |
| EP1345527A4 (en) * | 2000-11-28 | 2007-09-19 | Allez Physionix Ltd | Systems and methods for making non-invasive physiological assessments |
| US6612989B1 (en) * | 2002-06-18 | 2003-09-02 | Koninklijke Philips Electronics N.V. | System and method for synchronized persistence with contrast agent imaging |
-
2000
- 2000-03-23 US US09/534,900 patent/US6554774B1/en not_active Expired - Lifetime
-
2001
- 2001-03-22 EP EP01920633A patent/EP1324788A2/en not_active Withdrawn
- 2001-03-22 US US09/815,080 patent/US7048691B2/en not_active Expired - Fee Related
- 2001-03-22 JP JP2001568497A patent/JP2004521660A/en active Pending
- 2001-03-22 CA CA002403728A patent/CA2403728A1/en not_active Abandoned
- 2001-03-22 WO PCT/US2001/009115 patent/WO2001070303A2/en active IP Right Grant
- 2001-03-22 AU AU4766501A patent/AU4766501A/en active Pending
-
2003
- 2003-01-17 US US10/346,939 patent/US20050038346A1/en not_active Abandoned
-
2006
- 2006-05-18 US US11/437,197 patent/US8328727B2/en not_active Expired - Fee Related
Cited By (6)
| Publication number | Priority date | Publication date | Assignee | Title |
|---|---|---|---|---|
| JP2007244835A (en) * | 2006-02-17 | 2007-09-27 | Aloka Co Ltd | Ultrasonic diagnostic apparatus |
| JP2014521452A (en) * | 2011-08-03 | 2014-08-28 | エコセンス | Method for determining in real time the probability that a biological tissue of interest is facing an ultrasonic transducer |
| JP2013144098A (en) * | 2011-12-14 | 2013-07-25 | Seiko Epson Corp | Blood pressure measuring apparatus and blood pressure measuring method |
| JP2017512104A (en) * | 2014-03-11 | 2017-05-18 | ザ・ジョンズ・ホプキンス・ユニバーシティ | A method for determining flow and pressure gradients in arterial networks from contrast distributions based on patient-specific computed tomography algorithms |
| WO2017085896A1 (en) * | 2015-11-20 | 2017-05-26 | 富士通株式会社 | Information processing device, information processing method, and information processing program |
| JPWO2017085896A1 (en) * | 2015-11-20 | 2018-07-26 | 富士通株式会社 | Information processing apparatus, information processing method, and information processing program |
Also Published As
| Publication number | Publication date |
|---|---|
| US20020062086A1 (en) | 2002-05-23 |
| US6554774B1 (en) | 2003-04-29 |
| US7048691B2 (en) | 2006-05-23 |
| US20060206032A1 (en) | 2006-09-14 |
| EP1324788A2 (en) | 2003-07-09 |
| US20050038346A1 (en) | 2005-02-17 |
| AU4766501A (en) | 2001-10-03 |
| WO2001070303A8 (en) | 2002-03-21 |
| CA2403728A1 (en) | 2001-09-27 |
| WO2001070303A2 (en) | 2001-09-27 |
| US8328727B2 (en) | 2012-12-11 |
Similar Documents
| Publication | Publication Date | Title |
|---|---|---|
| US7048691B2 (en) | Method and apparatus for assessing hemodynamic parameters within the circulatory system of a living subject | |
| US7503896B2 (en) | Method and apparatus for the noninvasive assessment of hemodynamic parameters including blood vessel location | |
| US9204857B2 (en) | System and method for monitoring hemodynamic state | |
| US6334849B1 (en) | Heart-function monitor apparatus | |
| US20170238906A1 (en) | Transthoracic Pulmonary Doppler Ultrasound for Evaluating the Heart or Lung Via Doppler Shift Power Spectrum | |
| JP6148620B2 (en) | Measurement of pulmonary blood pressure using transthoracic Doppler ultrasound | |
| US20060224070A1 (en) | System and method for non-invasive cardiovascular assessment from supra-systolic signals obtained with a wideband external pulse transducer in a blood pressure cuff | |
| JPH084576B2 (en) | Blood pressure determination device, mean arterial pressure determination device, cardiovascular condition determination device, and cardiac pacemaker adjustment support device | |
| WO2019011242A1 (en) | Multi-functional measuring device which may determine carotid artery blood pressure | |
| US8506497B2 (en) | Continuous positioning apparatus and methods | |
| EP3897363B1 (en) | Control unit for deriving a measure of arterial compliance | |
| JP2007501030A (en) | Apparatus and method for early detection of cardiovascular disease using vascular imaging | |
| JP2020512918A (en) | Device and method for non-invasive measurement of intracranial pressure | |
| JP3712418B2 (en) | Apparatus and method for measuring induced perturbations to determine the physical state of the human arterial system | |
| Seo et al. | Non-Invasive evaluation of a carotid arterial pressure waveform using motion-tolerant ultrasound measurements during the valsalva maneuver | |
| Scalise et al. | The measurement of blood pressure without contact: An LDV-based technique | |
| Uemura et al. | A novel minimally occlusive cuff method utilizing ultrasound vascular imaging for stress-free blood pressure measurement: A-proof-of-concept study | |
| Segers et al. | Principles of vascular physiology | |
| AU2006200992B2 (en) | Method and apparatus for assessing hemodynamic parameters and blood vessel location within the circulatory system of a living subject | |
| AU2001247665A1 (en) | Method and apparatus for assessing hemodynamic parameters and blood vessel location within the circulatory system of a living subject | |
| AU2001247665A2 (en) | Method and apparatus for assessing hemodynamic parameters and blood vessel location within the circulatory system of a living subject | |
| JP2021023615A (en) | Pulse pressure estimation device, pulse pressure estimation system, pulse pressure estimation method, and control program | |
| Xu et al. | Online continuous measurement of arterial pulse pressure and pressure waveform using ultrasound | |
| Földi | Continuous non-invasive blood pressure monitoring via 3D force sensor and its applications in diagnostics | |
| Serra | Analysis of breathing effect on vena cava |