JP2004362256A - Plant optimal operation system - Google Patents
Plant optimal operation system Download PDFInfo
- Publication number
- JP2004362256A JP2004362256A JP2003159769A JP2003159769A JP2004362256A JP 2004362256 A JP2004362256 A JP 2004362256A JP 2003159769 A JP2003159769 A JP 2003159769A JP 2003159769 A JP2003159769 A JP 2003159769A JP 2004362256 A JP2004362256 A JP 2004362256A
- Authority
- JP
- Japan
- Prior art keywords
- plant
- state value
- value
- past
- displayed
- Prior art date
- Legal status (The legal status is an assumption and is not a legal conclusion. Google has not performed a legal analysis and makes no representation as to the accuracy of the status listed.)
- Granted
Links
Images


Classifications
-
- Y—GENERAL TAGGING OF NEW TECHNOLOGICAL DEVELOPMENTS; GENERAL TAGGING OF CROSS-SECTIONAL TECHNOLOGIES SPANNING OVER SEVERAL SECTIONS OF THE IPC; TECHNICAL SUBJECTS COVERED BY FORMER USPC CROSS-REFERENCE ART COLLECTIONS [XRACs] AND DIGESTS
- Y02—TECHNOLOGIES OR APPLICATIONS FOR MITIGATION OR ADAPTATION AGAINST CLIMATE CHANGE
- Y02E—REDUCTION OF GREENHOUSE GAS [GHG] EMISSIONS, RELATED TO ENERGY GENERATION, TRANSMISSION OR DISTRIBUTION
- Y02E20/00—Combustion technologies with mitigation potential
- Y02E20/14—Combined heat and power generation [CHP]
-
- Y—GENERAL TAGGING OF NEW TECHNOLOGICAL DEVELOPMENTS; GENERAL TAGGING OF CROSS-SECTIONAL TECHNOLOGIES SPANNING OVER SEVERAL SECTIONS OF THE IPC; TECHNICAL SUBJECTS COVERED BY FORMER USPC CROSS-REFERENCE ART COLLECTIONS [XRACs] AND DIGESTS
- Y02—TECHNOLOGIES OR APPLICATIONS FOR MITIGATION OR ADAPTATION AGAINST CLIMATE CHANGE
- Y02P—CLIMATE CHANGE MITIGATION TECHNOLOGIES IN THE PRODUCTION OR PROCESSING OF GOODS
- Y02P80/00—Climate change mitigation technologies for sector-wide applications
- Y02P80/10—Efficient use of energy, e.g. using compressed air or pressurized fluid as energy carrier
- Y02P80/15—On-site combined power, heat or cool generation or distribution, e.g. combined heat and power [CHP] supply
Landscapes
- Testing And Monitoring For Control Systems (AREA)
Abstract
【課題】運転制約条件を満たしかつ最適状態を満たす運用を運転員に適切に提供できるプラント最適運用システムを提供することである。
【解決手段】プラントから入力したプロセスデータの現在値を格納するプラント現在状態値ファイルと、プラントの運転制約条件を格納した運転制約条件ファイルと、気象条件に基づいて算出された需要予測値およびプラントの運用計画値をプラント未来状態値として格納すると共にプラント過去状態値を格納するプラント過去・未来状態値ファイルとを有し、プラント状態値表示手段は、プラント現在状態値、プラント過去状態値、プラント未来状態値、運転制約条件を表示装置に表示する。
【選択図】 図1An object of the present invention is to provide a plant optimal operation system capable of appropriately providing an operator with an operation satisfying an operation constraint condition and satisfying an optimal state.
A plant current state value file storing current values of process data input from a plant, an operation constraint condition file storing plant operation constraint conditions, a demand forecast value calculated based on weather conditions, and a plant And a plant past / future state value file that stores the operation plan value of the plant as a plant future state value and stores the plant past state value. The plant state value display means includes a plant current state value, a plant past state value, and a plant The future state value and the driving constraint are displayed on the display device.
[Selection diagram] Fig. 1
Description
【0001】
【発明の属する技術分野】
本発明は、プラントを最適状態で運転するための情報を提供するプラント最適運用システムに関する。
【0002】
【従来の技術】
一般に、プラント最適運用システムは、発電プラントやコージェネレーションプラント、自家発電プラントなどのエネルギープラントにおけるプラント監視制御システムの一部として導入されている。そして、エネルギープラントを構成するボイラや蒸気タービン、ガスタービン、廃熱回収ボイラ、発電機、氷蓄熱、冷凍機などの多くの機器を、電力、冷温水、蒸気などの負荷が最適状態となるように運転している。すなわち、エネルギー需要を満足し、かつ省コスト、省エネルギー、省CO2を実現した状態(最適状態)となる運転を行う。
【0003】
このような最適状態を保った運転を行うためには、対象とするプラント全体の機器モデルと各機器の運転制約条件とを考慮して最適運転スケジュールを作成し、その最適運転スケジュールに従ってプラントを運転することになる。
【0004】
運転対象システムの最適運転を行うものとしては、運用コスト評価関数や消費エネルギー評価関数に加え、環境に及ぼす影響を表わした環境評価関数も算出し、
これらの評価関数を総合して、省エネ効果や運転コスト低減だけでなく環境負荷の低減化も実現するようにしたものがある(例えば、特許文献1参照)。
【0005】
また、需要計画に基づくと共に運転制約条件を満足して運用コストが最小となるようにコジェネユニットの運転台数並びに電力出力量や蒸気出力量からなる最適運用案を決定し、需要に応じつつ低い運用コストで供給を行い、プラント特有の運転制約条件をも満足させることができるようにしたものがある(例えば、特許文献2参照)。
【0006】
図7は従来のプラント最適運用システムの一例のブロック構成図である。気象情報入力手段11は気象情報を入力し、その気象情報に基づいて気象予報値を予測し需要予測値算出手段12に出力する。需要予測値算出手段12は気象予報値に基づいてエネルギー(例えば、電力、蒸気、温水、冷水等)の需要を予測し、その需要予測値を需要予測値ファイル13に保存する。
【0007】
プラントからのプロセスデータ(デジタル値やアナログ値)は、プラントデータ入力手段14により取り込まれ、プロセスデータ処理手段15によりプラントデータプロセス値に加工され、プラントプロセス値ファイル16に保存される。一方、プラントの各機器の運転制約条件は、入出力装置17の入力装置18により運転制約条件入力手段19により取り込まれ、運転制約条件ファイル20に保存される。
【0008】
最適運転スケジュール演算手段21は、需要予測値ファイル13に保存された需要予測値、プラントプロセス値ファイル16に保存されたプラントデータプロセス値、運転制約条件ファイル20に保存された運転制約条件を用いて、これらの運転制約条件を満足し、かつ最適な運転となる最適運転スケジュールを計算し、その最適運転スケジュールを最適運転スケジュールファイル22に保存する。そして、最適運転スケジュール表示手段23は、最適運転スケジュールファイル22に保存された最適運転スケジュールを最適運転計画表として入出力装置17の表示装置24に表示する。これにより、運転員は表示装置24に表示された最適運転計画表を監視しながらプラントを最適状態で運転することになる。
【0009】
【特許文献1】
特開2000−105603号公報
【0010】
【特許文献2】
特開2001−211696号公報
【0011】
【発明が解決しようとする課題】
ところが、最適運転スケジュール演算手段21において最適化計算を行う際に、容易に最適解を求められない場合が多々ある。これは、プラントには多数の構成機器があり、運転制約条件がそれぞれ異なることから、プラントを構成する機器の各制約条件が複雑に関係するためである。
【0012】
そのため、運転員は試行錯誤を繰り返し、運転制約条件を満たし、かつ最適状態を満たす解(最適解)が求まるまで計算を行うことになる。このようなことから、最適解が求まるまでに多くの時間を費やし、その最適解を求めるまでの間の運転状態が最適状態から外れるばかりでなく、その間は運転計画が立たないため運転に混乱を来たすことがある。
【0013】
本発明の目的は、運転制約条件を満たしかつ最適状態を満たす運用を運転員に適切に提供できるプラント最適運用システムを提供することである。
【0014】
【課題を解決するための手段】
本発明のプラント最適運用システムは、プラントから入力したプロセスデータの現在値を格納するプラント現在状態値ファイルと、プラントの運転制約条件を格納した運転制約条件ファイルと、気象条件に基づいて算出された需要予測値およびプラントの運用計画値をプラント未来状態値として格納すると共にプラント過去状態値を格納するプラント過去・未来状態値ファイルとを有し、プラント状態値表示手段は、プラント現在状態値、プラント過去状態値、プラント未来状態値、運転制約条件を表示装置に表示する。
【0015】
また、運転制約条件ファイルに格納されたプラントの運転制約条件に基づいて演算された運用可能範囲を格納する運用可能範囲ファイルを設け、プラント現在状態値、プラント過去状態値、プラント未来状態値を、運用可能範囲と共にレーダーチャートとして表示装置に表示する。これにより、運転制約条件を満たしかつ最適状態を満たす運用を運転員に適切に提供できる。
【0016】
【発明の実施の形態】
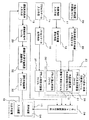
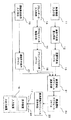
以下、本発明の実施の形態を説明する。図1は本発明の実施の形態に係わるプラント最適運用システムのブロック構成図である。この実施の形態ではプラントとして電力と蒸気とを発生すると共に水蓄熱槽を有し冷水や温水を供給するプラントに適用した場合について説明する。
【0017】
気象情報入力手段11は外部気象サイトから気象情報を入力し、その気象情報に基づいて気象予報値を予測し需要予測値算出手段12に出力する。需要予測値算出手段12は気象予報値に基づいてエネルギー(例えば、電力、蒸気、温水、冷水等)の需要を予測し、その需要予測値をプラント未来状態値として、プラント過去・未来状態値ファイル25のプラント未来状態値ファイル26の需要予測値ファイル13に保存する。
【0018】
プラントからのプロセスデータ(デジタル値やアナログ値)は、プラントデータ入力手段14により取り込まれ、プロセスデータ処理手段15によりプラントデータプロセス値に加工され、プラント現在状態値ファイル27に保存される。そして、新たにプラントデータプロセス値が入力されると更新保存し、今まで記憶していたプラントデータプロセス値は過去のプラントデータプロセス値としてプラント過去・未来状態値ファイル25のプラント過去状態値ファイル28に保存される。このようにして、プラント過去状態値ファイル28には過去の一定期間のプラントデータプロセス値が保存される。
【0019】
冷温水槽温度計画値ファイル29には水蓄熱槽の冷温水槽温度計画値が保存されており、この冷温水槽温度計画値は図示省略の冷温水槽温度最適化計算手段で所定の周期で最適化計算されて作成される。なお、冷温水槽温度計画値の最適化計算にあたっては気象情報入力手段11からの気象情報も参照して行われる。
【0020】
冷温水槽温度計画値入力設定手段30は、冷温水槽温度計画値ファイル29に保存されている冷温水槽温度計画値を入力し、その冷温水槽温度計画値をプラント未来状態値としてプラント過去・未来状態値ファイル25のプラント未来状態値ファイル26の冷温水槽温度未来状態値ファイル31に設定する。
【0021】
従って、プラント過去・未来状態値ファイル25のプラント未来状態値ファイル26には、気象条件に基づいて算出された需要予測値(電力、蒸気、温水、冷水の需要予測値)がプラント未来状態予測値として需要予測値ファイル13として格納され、また、冷温水槽温度計画値ファイル29に格納された冷温水槽温度計画値がプラント未来状態値として冷温水槽温度未来状態値ファイル31に保存される。一方、プラント過去・未来状態値ファイル25のプラント過去状態値ファイル28には、過去の一定期間のプラントデータプロセス値が保存される。
【0022】
一方、プラントの各機器の運転制約条件は、入出力装置17の入力装置18により運転制約条件入力手段19により取り込まれ、運転制約条件ファイル20に保存される。最適化計算可能範囲演算手段32は、運転制約条件ファイル20に保存された運転制約条件値に基づいて最適化計算可能範囲を求め、その最適化計算可能範囲を運用可能範囲として運用可能範囲ファイル33に保存する。
【0023】
次に、プラント状態値表示手段34は、プラント過去・未来状態値ファイル25からプラント未来状態値(需要予測値、冷温水槽温度計画値)およびプラント過去状態値(過去のプラントプロセスデータ値)、プラント現在状態値ファイル27からプラント現在状態値(現在のプラントプロセスデータ値)、運用可能範囲ファイル33から運用可能範囲をそれぞれ読み取り入出力装置17の表示装置24に表示する。
【0024】
図2は、本発明の実施の形態に係わるプラント最適運用システムの動作内容を示すフローチャートである。まず、気象情報を読み取り(S1)、エネルギーの需要予測値および冷温水槽温度計画値等のプラント状態計画値を作成し(S2)、プラント過去・未来状態値ファイル25のプラント未来状態値ファイル31に保存する(S3)。一方、プラントデータを読み込み(S4)、プラント状態値すなわち現在入力したプラントデータをプラント現在状態値とし過去に入力したプラントデータをプラント過去状態値として作成し(S5)、それぞれプラント現在状態値ファイル27やプラント過去状態値ファイル28に保存する(S6)。
【0025】
次に、運転制約条件を入力し(S7)、その運転制約条件に基づいて最適化計算を行い運用可能範囲を作成し(S8)、運用可能範囲ファイル33に保存する(S9)。そして、各ファイルに保存された内容を表示装置24に表示し(S10)、プラント状態値が運用可能範囲にあるか否かを判定し(S11)、プラント状態値が運用可能範囲にない場合にはステップS7に戻る。これは、プラント状態値が運用可能範囲にない場合には、運転員により運転制約条件が変更されるので、その変更された運転制約条件で運用可能範囲を満たすか否かを判断するためである。
【0026】
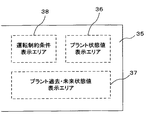
図3はプラント状態値表示手段34により表示装置24に表示される表示画面の説明図である。表示装置の表示画面は、表示エリアとして、プラント現在状態値が表示されるプラント状態値表示エリア36と、プラント過去状態値やプラント未来状態値が表示されるプラント過去・未来状態値表示エリア37と、運転制約条件が表示される運転制約条件表示エリア38とを有している。
【0027】
プラント状態値表示エリア36には、プラント現在状態値が運用可能範囲と共にレーダーチャート(現在グラフ)としてリアルタイムで表示される。プラント過去・未来状態値表示エリア37には、プラント過去状態値やプラント未来状態値の各正時毎のプラント状態値が運用可能範囲と共にレーダーチャート(正時グラフ)として表示される。また、運転制約条件表示エリア38にはプラント機器の運転制約条件が表示され、その起動可不可状態を設定できるようになっている。これらのプラント状態値表示エリア36、プラント過去・未来状態値表示エリア37、運転制約条件表示エリア38は、同時に表示しても良いし、個別に表示しても良い。
【0028】
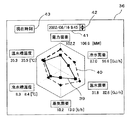
図4はプラント状態値表示エリア36の説明図である。プラント状態値表示エリア36には、複数個の表示項目からなるレーダーチャートが表示される。図4では、電力需要、冷水需要、温水需要、蒸気需要、冷水槽温度、温水槽温度の6個の表示項目である場合を示している。各表示項目の下にはそれぞれの状態値と運用可能値とが表示される。
【0029】
このレーダーチャートに、プラント状態値表示グラフ39と運用可能範囲表示グラフ40とを同時に表示する。通常状態では、プラント状態値表示グラフ39としてプラント現在状態値を表示し運用可能範囲表示グラフ40として現在の運用可能範囲を表示する。すなわち、プラント現在状態値および現在の運用可能範囲を表示した場合には、レーダーチャートには現在グラフが表示されることになる。そして、プラント状態値表示グラフ39の各表示項目が適用可能範囲表示グラフ40の範囲外にある場合には、プラント状態値表示手段34は各表示項目について警告表示をする。例えば、その表示項目を点滅表示(フリッカ表示)したり表示色を変更したりして最適化計算が不可である旨の警告を促す。
【0030】
また、プラント状態値表示エリア36の上部には、時刻設定部41が設けられており、通常は現在時刻が表示されている。また、時刻設定部41の横には時刻設定変更ボタン42が設けられており、時刻設定部41の時刻を変更できるようになっている。任意の時刻へ変更後に現在時刻表示ボタン43を操作することにより現在時刻へ戻ることができる。
【0031】
プラント状態値表示手段34は、時刻設定変更ボタン42が操作されて時刻が変更されたときは、変更された時刻を時刻設定部41に表示すると共に、その変更された時刻のプラント状態値表示グラフ39および運用可能範囲表示グラフ40を表示する。この場合、現在時刻より過去の時刻に時刻設定されたときは、プラント状態値はプラント過去状態値である過去の実績値が表示される。現在時刻より未来の時刻に時刻設定されたときは、プラント状態値はプラント未来状態値である計画値が表示される。なお、時刻設定変更ボタン42を設けたが、時刻設定部41に対して直接的に時刻を変更入力することで直接編集して時刻を変更するようにしても良い。
【0032】
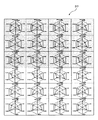
図5はプラント過去・未来状態値表示エリア37の説明図である。プラント過去・未来状態値表示エリア37には、過去の正時グラフおよび未来の正時グラフが表示される。正時グラフは、各正時におけるプラント過去状態値またはプラント未来状態値とその時の運用可能範囲とを、プラント状態値表示グラフ39および運用可能範囲表示グラフ40としてレーダーチャート上に同時に表示したものである。図5では、過去の正時グラフを網がけして表示している。
【0033】
各正時毎のレーダーチャートである正時グラフは、1日分(24個)並べて表示し、プラント状態値表示グラフ39の各項目が運用可能範囲外にある場合には、その時間の正時グラフを警告表示とする。例えば、正時グラフを点滅表示(フリッカ表示)または色変化表示し、最適化計算が不可である旨の警告を促す。
【0034】
ここで、図5では1日分のデータを各正時ごとに24個のレーダーチャートとして並べて表示しているが、表示個数はこれに限定されず、例えば24個をすべて表示する必要はなく、少なくとも2個以上のレーダーチャートである正時グラフを表示するようにしても良い。これにより、過去や未来分のプラント状態値とその時の運用可能範囲を表示し、過去や現在の運用状態を監視する。
【0035】
24個の正時グラフにそれぞれ表示されるプラント状態値表示グラフ39および運用可能範囲表示グラフ40は、現在時刻より過去分は過去の各正時における実績値であり、未来分は各正時における計画値である。現在時刻より過去分の正時グラフ実績値であり、今後変更されることがないため網がけして表示している。
【0036】
図6は運転制約条件表示エリア38の説明図である。運転制約条件表示エリア38には運転制約条件が一覧表示され、その一覧の横にはプラントを構成する各機器の起動停止条件を選択するための機器起動停止選択ボタン44が表示されている。機器起動停止選択ボタン44の操作により起動停止条件を選択し設定することになる。
【0037】
すなわち、機器起動停止選択ボタン44は各機器の名称の横に設けられており、機器起動停止選択ボタン44をクリックすることで、○と×とを反転する。機器起動停止選択ボタン44を○とすると機器が起動可能状態となり、×とすると起動不可状態となる。運転制約条件表示エリア38の上部には、運転制約条件の設定変更を確定する設定ボタン45が設けられており、ここで設定することで運転制約条件が入力される。これにより、運用可能範囲が作成され、プラント状態値表示エリア36およびプラント過去・未来状態値表示エリア37の運用可能範囲表示グラフ40が変更される。
【0038】
本発明の実施の形態によれば、プラント状態値は運用可能範囲と共にレーダーチャートに表示されるため、プラント状態値と運用可能範囲とを比較して確認することができ、また、運転制約条件をプラント状態値と同時に表示するので、プラント状態値が運用可能範囲を逸脱したとき運転制約条件を迅速に変更できる。また、過去または未来の各正時毎でのプラント過去状態値またはプラント未来状態値をレーダーチャートで表示できるので、過去の実績値を確認でき、また、未来のどの時刻で最適解が求まらないかを確認することができる。
【0039】
【発明の効果】
以上述べたように、本発明によれば、運用可能範囲と現在の実績あるいは計画値をレーダーチャートに重ねて表示するので、現在のプラント運転状態やこれから先の時間帯の最適化計算が可能であるか否かを判断できる。また、最適解が求められない場合は、現在の運転制約条件を変更し、運用可能範囲を変更することで、計算が可能となる条件を容易に探し出すことができる。このため、最適化計算を行う前に最適解が求められない原因を推定でき運転員がすぐに対応できる。これにより、プラントを常に最適な運転状態に保つことができ、最大限の省コストを実現することができる。
【図面の簡単な説明】
【図1】本発明の実施の形態に係わるプラント最適運用システムのブロック構成図。
【図2】本発明の実施の形態に係わるプラント最適運用システムの動作内容を示すフローチャート。
【図3】本発明の実施の形態におけるプラント状態値表示手段により表示装置に表示される表示画面の説明図。
【図4】本発明の実施の形態における表示装置に表示される表示画面のプラント状態値表示エリアの説明図。
【図5】本発明の実施の形態における表示装置に表示される表示画面のプラント過去・未来状態値表示エリアの説明図。
【図6】本発明の実施の形態における表示装置に表示される表示画面の運転制約条件表示エリアの説明図。
【図7】従来のプラント最適運用システムの一例のブロック構成図。
【符号の説明】
11…気象情報入力手段、12…需要予測値算出手段、13…需要予測値ファイル、14…プラントデータ入力手段、15…プロセスデータ処理手段、16…プラントプロセス値ファイル、17…入出力装置、18…入力装置、19…運転制約条件入力手段、20…運転制約条件ファイル、21…最適運転スケジュール演算手段、22…最適運転スケジュールファイル、23…最適運転スケジュール表示手段、24…表示装置、25…プラント過去・未来状態値ファイル、26…プラント未来状態値ファイル、27…プラント現在状態値ファイル、28…プラント過去状態値ファイル、29…冷温水槽温度計画値ファイル、30…冷温水槽温度計画値入力設定手段、31…冷温水槽温度未来状態値ファイル、32…最適化計算可能範囲演算手段、33…運用可能範囲ファイル、34…プラント状態値表示手段、36…プラント状態値表示エリア、37…プラント過去・未来状態値表示エリア、38…運転制約条件表示エリア、39…プラント状態値表示グラフ、40…運用可能範囲表示グラフ、41…時刻設定部、42…時刻設定変更ボタン、43…現在時刻表示ボタン、44…機器起動停止選択ボタン、45…設定ボタン[0001]
TECHNICAL FIELD OF THE INVENTION
The present invention relates to a plant optimal operation system that provides information for operating a plant in an optimal state.
[0002]
[Prior art]
Generally, a plant optimal operation system is introduced as a part of a plant monitoring control system in an energy plant such as a power plant, a cogeneration plant, and a private power plant. Many equipment such as boilers, steam turbines, gas turbines, waste heat recovery boilers, generators, ice heat storage, and refrigeration machines that make up an energy plant are designed to optimize the load of power, cold and hot water, steam, etc. You are driving to In other words, an operation is performed that satisfies energy demand and achieves a state (optimal state) in which cost saving, energy saving, and CO 2 saving are realized.
[0003]
In order to operate in such an optimal state, an optimal operation schedule is created in consideration of the equipment model of the entire target plant and the operation constraint conditions of each equipment, and the plant is operated according to the optimal operation schedule. Will do.
[0004]
In order to perform the optimal operation of the operation target system, in addition to the operation cost evaluation function and the energy consumption evaluation function, the environment evaluation function expressing the effect on the environment is calculated,
Some of these evaluation functions are combined to realize not only an energy saving effect and a reduction in operating cost, but also a reduction in environmental load (for example, see Patent Document 1).
[0005]
Also, based on the demand plan, determine the optimal operation plan consisting of the number of cogeneration units to be operated and the amount of power output and steam output so that the operation cost is minimized by satisfying the operation constraint conditions. There is a method in which supply is performed at a cost so that operation constraint conditions unique to a plant can be satisfied (for example, see Patent Document 2).
[0006]
FIG. 7 is a block diagram showing an example of a conventional plant optimal operation system. The weather
[0007]
Process data (digital value or analog value) from the plant is taken in by the plant data input means 14, processed into a plant data process value by the process data processing means 15, and stored in the plant
[0008]
The optimum operation schedule calculation means 21 uses the demand forecast value stored in the demand
[0009]
[Patent Document 1]
JP 2000-105603 A
[Patent Document 2]
JP 2001-21696 A
[Problems to be solved by the invention]
However, when performing the optimization calculation in the optimum operation schedule calculation means 21, there are many cases where the optimum solution cannot be easily obtained. This is because the plant has a large number of component devices, and the operation constraint conditions are different from each other, so that the constraint conditions of the devices constituting the plant are complicatedly related.
[0012]
Therefore, the operator repeats trial and error, and performs calculations until a solution (optimal solution) that satisfies the driving constraint conditions and satisfies the optimal state is obtained. For this reason, a lot of time is spent until the optimal solution is found, and not only does the operating state deviate from the optimal state until the optimal solution is found, but during that time there is no operation plan and confusion in driving May come.
[0013]
An object of the present invention is to provide a plant optimal operation system that can appropriately provide an operator with an operation that satisfies operation constraint conditions and satisfies an optimal state.
[0014]
[Means for Solving the Problems]
The plant optimal operation system of the present invention is calculated based on a plant current state value file storing current values of process data input from the plant, an operation constraint file storing operation constraint conditions of the plant, and weather conditions. A plant past / future state value file for storing demand forecast values and plant operation plan values as plant future state values and storing plant past state values; A past state value, a plant future state value, and an operation constraint condition are displayed on a display device.
[0015]
Further, an operable range file for storing the operable range calculated based on the operating constraint conditions of the plant stored in the operating constraint condition file is provided, and the plant current state value, the plant past state value, the plant future state value is It is displayed on the display device as a radar chart together with the operable range. As a result, an operation that satisfies the driving constraint conditions and satisfies the optimum state can be appropriately provided to the operator.
[0016]
BEST MODE FOR CARRYING OUT THE INVENTION
Hereinafter, embodiments of the present invention will be described. FIG. 1 is a block diagram of a plant optimal operation system according to an embodiment of the present invention. In this embodiment, a case where the present invention is applied to a plant that generates electric power and steam, has a water heat storage tank, and supplies cold water or hot water will be described.
[0017]
The weather
[0018]
Process data (digital values and analog values) from the plant is taken in by the plant data input means 14, processed into plant data process values by the process data processing means 15, and stored in the plant current
[0019]
The cold / hot water tank temperature
[0020]
The cold / hot water tank temperature planned value input setting means 30 inputs the cold / hot water tank temperature planned value stored in the cold / hot water tank temperature planned
[0021]
Therefore, in the plant future
[0022]
On the other hand, the operation constraint conditions of each device of the plant are taken in by the operation constraint condition input means 19 by the
[0023]
Next, the plant state value display means 34 reads the plant future state value (forecast demand value, planned temperature of the hot and cold water tank) and the plant past state value (past plant process data value) from the plant past / future
[0024]
FIG. 2 is a flowchart showing the operation of the plant optimal operation system according to the embodiment of the present invention. First, weather information is read (S1), and a plant state plan value such as an energy demand forecast value and a cold / hot water tank temperature plan value is created (S2). Save (S3). On the other hand, the plant data is read (S4), the plant state value, that is, the currently input plant data is set as the plant current state value, and the previously input plant data is created as the plant past state value (S5). And the plant past state value file 28 (S6).
[0025]
Next, the operation constraint conditions are input (S7), an optimization calculation is performed based on the operation constraint conditions, an operable range is created (S8), and the
[0026]
FIG. 3 is an explanatory diagram of a display screen displayed on the
[0027]
In the plant state
[0028]
FIG. 4 is an explanatory diagram of the plant state
[0029]
On this radar chart, the plant state
[0030]
A
[0031]
When the time is changed by operating the time setting
[0032]
FIG. 5 is an explanatory diagram of the plant past / future state
[0033]
The hourly graph, which is a radar chart for each hour, is displayed side by side for one day (24 pieces). If each item of the plant state
[0034]
Here, in FIG. 5, data for one day is displayed side by side as 24 radar charts for each hour, but the number of displayed data is not limited to this, and it is not necessary to display all 24 radar charts, for example. At least two or more hourly graphs, which are radar charts, may be displayed. As a result, the past and future plant state values and the operable range at that time are displayed, and the past and present operation states are monitored.
[0035]
The plant status
[0036]
FIG. 6 is an explanatory diagram of the driving constraint
[0037]
That is, the device start /
[0038]
According to the embodiment of the present invention, since the plant state value is displayed on the radar chart together with the operable range, the plant state value and the operable range can be compared and confirmed, and the operation constraint condition can be determined. Since the display is performed simultaneously with the plant state value, the operation constraint condition can be quickly changed when the plant state value deviates from the operable range. In addition, past or future plant values at each hour of the past can be displayed on a radar chart, so past performance values can be checked, and optimal solutions can be obtained at any time in the future. You can check if there is.
[0039]
【The invention's effect】
As described above, according to the present invention, the operable range and the current actual or planned value are displayed in a superimposed manner on the radar chart, so that the optimization calculation of the current plant operation state and the future time zone is possible. It can be determined whether or not there is. In addition, when the optimal solution cannot be obtained, it is possible to easily find a condition enabling calculation by changing the current operation constraint condition and changing the operable range. For this reason, the cause that the optimal solution cannot be obtained can be estimated before performing the optimization calculation, and the operator can immediately respond. As a result, the plant can always be kept in an optimal operation state, and maximum cost savings can be realized.
[Brief description of the drawings]
FIG. 1 is a block configuration diagram of a plant optimal operation system according to an embodiment of the present invention.
FIG. 2 is a flowchart showing the operation of the plant optimal operation system according to the embodiment of the present invention.
FIG. 3 is an explanatory diagram of a display screen displayed on a display device by a plant state value display unit according to the embodiment of the present invention.
FIG. 4 is an explanatory diagram of a plant state value display area on a display screen displayed on the display device according to the embodiment of the present invention.
FIG. 5 is an explanatory diagram of a plant past / future state value display area on a display screen displayed on the display device according to the embodiment of the present invention.
FIG. 6 is an explanatory diagram of a driving constraint condition display area on a display screen displayed on the display device according to the embodiment of the present invention.
FIG. 7 is a block diagram illustrating an example of a conventional plant optimal operation system.
[Explanation of symbols]
11 weather information input means, 12 demand demand calculation means, 13 demand demand file, 14 plant data input means, 15 process data processing means, 16 plant process value file, 17 input / output device, 18 ... input device, 19 ... operation restriction condition input means, 20 ... operation restriction condition file, 21 ... optimum operation schedule calculation means, 22 ... optimum operation schedule file, 23 ... optimum operation schedule display means, 24 ... display device, 25 ... plant Past / future state value file, 26: Plant future state value file, 27: Plant current state value file, 28: Plant past state value file, 29: Cold / hot water tank temperature planned value file, 30: Cold / hot water tank temperature planned value input setting means , 31 ... Cool and hot water tank temperature future state value file, 32 ... Optimization calculation possible range operator , 33 ... operable range file, 34 ... plant status value display means, 36 ... plant status value display area, 37 ... plant past / future status value display area, 38 ... operating constraint condition display area, 39 ... plant status value display graph , 40 ... operable range display graph, 41 ... time setting section, 42 ... time setting change button, 43 ... current time display button, 44 ... device start / stop selection button, 45 ... setting button
Claims (13)
Priority Applications (1)
| Application Number | Priority Date | Filing Date | Title |
|---|---|---|---|
| JP2003159769A JP4413534B2 (en) | 2003-06-04 | 2003-06-04 | Plant optimum operation system |
Applications Claiming Priority (1)
| Application Number | Priority Date | Filing Date | Title |
|---|---|---|---|
| JP2003159769A JP4413534B2 (en) | 2003-06-04 | 2003-06-04 | Plant optimum operation system |
Publications (2)
| Publication Number | Publication Date |
|---|---|
| JP2004362256A true JP2004362256A (en) | 2004-12-24 |
| JP4413534B2 JP4413534B2 (en) | 2010-02-10 |
Family
ID=34052749
Family Applications (1)
| Application Number | Title | Priority Date | Filing Date |
|---|---|---|---|
| JP2003159769A Expired - Fee Related JP4413534B2 (en) | 2003-06-04 | 2003-06-04 | Plant optimum operation system |
Country Status (1)
| Country | Link |
|---|---|
| JP (1) | JP4413534B2 (en) |
Cited By (3)
| Publication number | Priority date | Publication date | Assignee | Title |
|---|---|---|---|---|
| JP5985042B2 (en) * | 2013-03-06 | 2016-09-06 | 三菱電機株式会社 | Air conditioner and operation status display device |
| WO2020189210A1 (en) * | 2019-03-19 | 2020-09-24 | 日本電気株式会社 | Monitoring method, monitoring device, and program |
| EP4254283A1 (en) | 2022-03-30 | 2023-10-04 | Yokogawa Electric Corporation | Plant system, plant control method, and plant control program |
Families Citing this family (2)
| Publication number | Priority date | Publication date | Assignee | Title |
|---|---|---|---|---|
| US20150371418A1 (en) * | 2014-06-18 | 2015-12-24 | Honeywell International Inc. | Apparatus and method for visualization of optimum operating envelope |
| US10908562B2 (en) | 2017-10-23 | 2021-02-02 | Honeywell International Inc. | Apparatus and method for using advanced process control to define real-time or near real-time operating envelope |
Citations (8)
| Publication number | Priority date | Publication date | Assignee | Title |
|---|---|---|---|---|
| JPH04309101A (en) * | 1991-04-08 | 1992-10-30 | Toshiba Corp | Input device for model prediction control |
| JPH05164377A (en) * | 1991-12-16 | 1993-06-29 | Marunouchi Netsu Kiyoukiyuu Kk | Energy equipment driving support system |
| JPH08123539A (en) * | 1994-10-28 | 1996-05-17 | Toshiba Corp | Plant diagnostic equipment |
| JPH09179604A (en) * | 1995-09-13 | 1997-07-11 | Toshiba Corp | System and method for controlling operation of plant |
| JPH10115534A (en) * | 1996-10-11 | 1998-05-06 | Yamatake Honeywell Co Ltd | Sensor diagnostic method and device |
| JP2000075922A (en) * | 1998-08-31 | 2000-03-14 | Toshiba Corp | Plant operation status monitoring device |
| JP2001355457A (en) * | 2000-06-13 | 2001-12-26 | Toshiba Corp | Gas turbine monitoring device and storage medium |
| JP2003067045A (en) * | 2001-08-27 | 2003-03-07 | Toshiba Corp | Plant automatic controller |
-
2003
- 2003-06-04 JP JP2003159769A patent/JP4413534B2/en not_active Expired - Fee Related
Patent Citations (8)
| Publication number | Priority date | Publication date | Assignee | Title |
|---|---|---|---|---|
| JPH04309101A (en) * | 1991-04-08 | 1992-10-30 | Toshiba Corp | Input device for model prediction control |
| JPH05164377A (en) * | 1991-12-16 | 1993-06-29 | Marunouchi Netsu Kiyoukiyuu Kk | Energy equipment driving support system |
| JPH08123539A (en) * | 1994-10-28 | 1996-05-17 | Toshiba Corp | Plant diagnostic equipment |
| JPH09179604A (en) * | 1995-09-13 | 1997-07-11 | Toshiba Corp | System and method for controlling operation of plant |
| JPH10115534A (en) * | 1996-10-11 | 1998-05-06 | Yamatake Honeywell Co Ltd | Sensor diagnostic method and device |
| JP2000075922A (en) * | 1998-08-31 | 2000-03-14 | Toshiba Corp | Plant operation status monitoring device |
| JP2001355457A (en) * | 2000-06-13 | 2001-12-26 | Toshiba Corp | Gas turbine monitoring device and storage medium |
| JP2003067045A (en) * | 2001-08-27 | 2003-03-07 | Toshiba Corp | Plant automatic controller |
Cited By (5)
| Publication number | Priority date | Publication date | Assignee | Title |
|---|---|---|---|---|
| JP5985042B2 (en) * | 2013-03-06 | 2016-09-06 | 三菱電機株式会社 | Air conditioner and operation status display device |
| WO2020189210A1 (en) * | 2019-03-19 | 2020-09-24 | 日本電気株式会社 | Monitoring method, monitoring device, and program |
| JPWO2020189210A1 (en) * | 2019-03-19 | 2021-12-02 | 日本電気株式会社 | Monitoring method, monitoring device, program |
| JP7248100B2 (en) | 2019-03-19 | 2023-03-29 | 日本電気株式会社 | MONITORING METHOD, MONITORING DEVICE, AND PROGRAM |
| EP4254283A1 (en) | 2022-03-30 | 2023-10-04 | Yokogawa Electric Corporation | Plant system, plant control method, and plant control program |
Also Published As
| Publication number | Publication date |
|---|---|
| JP4413534B2 (en) | 2010-02-10 |
Similar Documents
| Publication | Publication Date | Title |
|---|---|---|
| US7177726B2 (en) | Operation-assisting system and operation-assisting computer program | |
| CN102156457B (en) | Industrial control energy object | |
| JP6109555B2 (en) | Energy management server, energy management method and program | |
| KR20040083514A (en) | Power source switching unit and power source management system comprising it | |
| JP5475546B2 (en) | Energy saving diagnostic system | |
| JP2013532094A (en) | Method and apparatus for controlling energy consumption in a ship | |
| JP2010166702A (en) | Power supply risk evaluation system of power facility | |
| JP2004317049A (en) | Heat source operation support control method, system and program | |
| JP2006349483A (en) | Electric power consumption monitoring system | |
| CN104049590A (en) | Extensible energy management architecture | |
| JP2004362256A (en) | Plant optimal operation system | |
| JP5033710B2 (en) | Plant operation planning device and program thereof | |
| Van Schijndel | Optimal operation of a hospital power plant | |
| US6965308B2 (en) | System and method for operating a plurality of power generation stations | |
| JP2008009466A (en) | Energy saving management system and energy saving management program | |
| JP2008109813A (en) | Demand control device and power consumption system | |
| JP3923815B2 (en) | Power switch and distributed power generator | |
| JP2012027676A (en) | Operation control device and operation control method using multivariable model prediction | |
| JP2005257097A (en) | System for starting and stopping heat source equipment | |
| JP2006350920A (en) | Energy demand forecasting system and demand forecasting method | |
| JPH06313605A (en) | Operation control method and apparatus for heat source device | |
| JP2006072536A (en) | Plant optimal operation support system and method, and program | |
| JP2004272340A (en) | Power load curve calculation program | |
| JP2003134664A (en) | Operation planning apparatus, operation planning method, operation planning program, and recording medium storing the program | |
| JP2011028416A (en) | Plant optimum operation planning device |
Legal Events
| Date | Code | Title | Description |
|---|---|---|---|
| A621 | Written request for application examination |
Free format text: JAPANESE INTERMEDIATE CODE: A621 Effective date: 20060125 |
|
| A977 | Report on retrieval |
Free format text: JAPANESE INTERMEDIATE CODE: A971007 Effective date: 20081002 |
|
| A131 | Notification of reasons for refusal |
Free format text: JAPANESE INTERMEDIATE CODE: A131 Effective date: 20081007 |
|
| A521 | Written amendment |
Free format text: JAPANESE INTERMEDIATE CODE: A523 Effective date: 20081208 |
|
| A131 | Notification of reasons for refusal |
Free format text: JAPANESE INTERMEDIATE CODE: A131 Effective date: 20090519 |
|
| A521 | Written amendment |
Free format text: JAPANESE INTERMEDIATE CODE: A523 Effective date: 20090601 |
|
| TRDD | Decision of grant or rejection written | ||
| A01 | Written decision to grant a patent or to grant a registration (utility model) |
Free format text: JAPANESE INTERMEDIATE CODE: A01 Effective date: 20091027 |
|
| A01 | Written decision to grant a patent or to grant a registration (utility model) |
Free format text: JAPANESE INTERMEDIATE CODE: A01 |
|
| A61 | First payment of annual fees (during grant procedure) |
Free format text: JAPANESE INTERMEDIATE CODE: A61 Effective date: 20091118 |
|
| FPAY | Renewal fee payment (event date is renewal date of database) |
Free format text: PAYMENT UNTIL: 20121127 Year of fee payment: 3 |
|
| FPAY | Renewal fee payment (event date is renewal date of database) |
Free format text: PAYMENT UNTIL: 20131127 Year of fee payment: 4 |
|
| LAPS | Cancellation because of no payment of annual fees |