ES2955019T3 - Novel iron compositions and methods for preparing and using the same - Google Patents
Novel iron compositions and methods for preparing and using the same Download PDFInfo
- Publication number
- ES2955019T3 ES2955019T3 ES20717359T ES20717359T ES2955019T3 ES 2955019 T3 ES2955019 T3 ES 2955019T3 ES 20717359 T ES20717359 T ES 20717359T ES 20717359 T ES20717359 T ES 20717359T ES 2955019 T3 ES2955019 T3 ES 2955019T3
- Authority
- ES
- Spain
- Prior art keywords
- iron
- composition
- aqueous
- sucrose
- samples
- Prior art date
- Legal status (The legal status is an assumption and is not a legal conclusion. Google has not performed a legal analysis and makes no representation as to the accuracy of the status listed.)
- Active
Links
- XEEYBQQBJWHFJM-UHFFFAOYSA-N Iron Chemical compound [Fe] XEEYBQQBJWHFJM-UHFFFAOYSA-N 0.000 title claims abstract description 108
- 239000000203 mixture Substances 0.000 title claims abstract description 70
- 229910052742 iron Inorganic materials 0.000 title claims abstract description 52
- 238000000034 method Methods 0.000 title claims description 27
- 230000001681 protective effect Effects 0.000 claims abstract description 7
- FWZTTZUKDVJDCM-CEJAUHOTSA-M disodium;(2r,3r,4s,5s,6r)-2-[(2s,3s,4s,5r)-3,4-dihydroxy-2,5-bis(hydroxymethyl)oxolan-2-yl]oxy-6-(hydroxymethyl)oxane-3,4,5-triol;iron(3+);oxygen(2-);hydroxide;trihydrate Chemical compound O.O.O.[OH-].[O-2].[O-2].[O-2].[O-2].[O-2].[O-2].[O-2].[O-2].[Na+].[Na+].[Fe+3].[Fe+3].[Fe+3].[Fe+3].[Fe+3].O[C@H]1[C@H](O)[C@@H](CO)O[C@@]1(CO)O[C@@H]1[C@H](O)[C@@H](O)[C@H](O)[C@@H](CO)O1 FWZTTZUKDVJDCM-CEJAUHOTSA-M 0.000 claims description 28
- 229940032961 iron sucrose Drugs 0.000 claims description 28
- 210000003734 kidney Anatomy 0.000 claims description 12
- UIIMBOGNXHQVGW-UHFFFAOYSA-M Sodium bicarbonate Chemical compound [Na+].OC([O-])=O UIIMBOGNXHQVGW-UHFFFAOYSA-M 0.000 claims description 9
- CWYNVVGOOAEACU-UHFFFAOYSA-N Fe2+ Chemical compound [Fe+2] CWYNVVGOOAEACU-UHFFFAOYSA-N 0.000 claims description 8
- BVKZGUZCCUSVTD-UHFFFAOYSA-M Bicarbonate Chemical compound OC([O-])=O BVKZGUZCCUSVTD-UHFFFAOYSA-M 0.000 claims description 7
- KSFOVUSSGSKXFI-GAQDCDSVSA-N CC1=C/2NC(\C=C3/N=C(/C=C4\N\C(=C/C5=N/C(=C\2)/C(C=C)=C5C)C(C=C)=C4C)C(C)=C3CCC(O)=O)=C1CCC(O)=O Chemical compound CC1=C/2NC(\C=C3/N=C(/C=C4\N\C(=C/C5=N/C(=C\2)/C(C=C)=C5C)C(C=C)=C4C)C(C)=C3CCC(O)=O)=C1CCC(O)=O KSFOVUSSGSKXFI-GAQDCDSVSA-N 0.000 claims description 7
- 229950003776 protoporphyrin Drugs 0.000 claims description 7
- ATJFFYVFTNAWJD-UHFFFAOYSA-N Tin Chemical compound [Sn] ATJFFYVFTNAWJD-UHFFFAOYSA-N 0.000 claims description 6
- 210000000056 organ Anatomy 0.000 claims description 6
- 235000017557 sodium bicarbonate Nutrition 0.000 claims description 4
- 229910000030 sodium bicarbonate Inorganic materials 0.000 claims description 4
- 239000008194 pharmaceutical composition Substances 0.000 claims description 3
- 239000008365 aqueous carrier Substances 0.000 claims description 2
- 208000020832 chronic kidney disease Diseases 0.000 claims description 2
- 208000017169 kidney disease Diseases 0.000 claims description 2
- 230000002265 prevention Effects 0.000 claims description 2
- 208000037265 diseases, disorders, signs and symptoms Diseases 0.000 claims 4
- 201000010099 disease Diseases 0.000 claims 2
- 208000035475 disorder Diseases 0.000 claims 2
- 230000005484 gravity Effects 0.000 claims 2
- 206010052779 Transplant rejections Diseases 0.000 claims 1
- CZMRCDWAGMRECN-UGDNZRGBSA-N Sucrose Chemical compound O[C@H]1[C@H](O)[C@@H](CO)O[C@@]1(CO)O[C@@H]1[C@H](O)[C@@H](O)[C@H](O)[C@@H](CO)O1 CZMRCDWAGMRECN-UGDNZRGBSA-N 0.000 abstract description 19
- 229930006000 Sucrose Natural products 0.000 abstract description 19
- 239000005720 sucrose Substances 0.000 abstract description 19
- DKIDFDYBDZCAAU-UHFFFAOYSA-L carbonic acid;iron(2+);carbonate Chemical compound [Fe+2].OC([O-])=O.OC([O-])=O DKIDFDYBDZCAAU-UHFFFAOYSA-L 0.000 abstract description 4
- 239000000523 sample Substances 0.000 description 39
- 238000009826 distribution Methods 0.000 description 22
- 239000000463 material Substances 0.000 description 18
- 238000004458 analytical method Methods 0.000 description 17
- 238000005227 gel permeation chromatography Methods 0.000 description 16
- 239000002245 particle Substances 0.000 description 14
- 239000000243 solution Substances 0.000 description 14
- 238000002360 preparation method Methods 0.000 description 13
- HEMHJVSKTPXQMS-UHFFFAOYSA-M Sodium hydroxide Chemical compound [OH-].[Na+] HEMHJVSKTPXQMS-UHFFFAOYSA-M 0.000 description 12
- 239000000126 substance Substances 0.000 description 12
- 238000005259 measurement Methods 0.000 description 11
- 229920000642 polymer Polymers 0.000 description 11
- XLYOFNOQVPJJNP-UHFFFAOYSA-N water Chemical compound O XLYOFNOQVPJJNP-UHFFFAOYSA-N 0.000 description 11
- XLYOFNOQVPJJNP-ZSJDYOACSA-N Heavy water Chemical compound [2H]O[2H] XLYOFNOQVPJJNP-ZSJDYOACSA-N 0.000 description 10
- OKTJSMMVPCPJKN-UHFFFAOYSA-N Carbon Chemical compound [C] OKTJSMMVPCPJKN-UHFFFAOYSA-N 0.000 description 8
- FAPWRFPIFSIZLT-UHFFFAOYSA-M Sodium chloride Chemical compound [Na+].[Cl-] FAPWRFPIFSIZLT-UHFFFAOYSA-M 0.000 description 8
- 238000002441 X-ray diffraction Methods 0.000 description 8
- 229910052799 carbon Inorganic materials 0.000 description 8
- 229940035081 venofer Drugs 0.000 description 8
- IEECXTSVVFWGSE-UHFFFAOYSA-M iron(3+);oxygen(2-);hydroxide Chemical compound [OH-].[O-2].[Fe+3] IEECXTSVVFWGSE-UHFFFAOYSA-M 0.000 description 7
- IJGRMHOSHXDMSA-UHFFFAOYSA-N Atomic nitrogen Chemical compound N#N IJGRMHOSHXDMSA-UHFFFAOYSA-N 0.000 description 6
- 229920002307 Dextran Polymers 0.000 description 6
- 235000014633 carbohydrates Nutrition 0.000 description 6
- 150000001875 compounds Chemical class 0.000 description 6
- 238000002296 dynamic light scattering Methods 0.000 description 6
- 238000001157 Fourier transform infrared spectrum Methods 0.000 description 5
- 238000005481 NMR spectroscopy Methods 0.000 description 5
- 238000004364 calculation method Methods 0.000 description 5
- 238000009616 inductively coupled plasma Methods 0.000 description 5
- MVZXTUSAYBWAAM-UHFFFAOYSA-N iron;sulfuric acid Chemical compound [Fe].OS(O)(=O)=O MVZXTUSAYBWAAM-UHFFFAOYSA-N 0.000 description 5
- 238000002411 thermogravimetry Methods 0.000 description 5
- 238000003221 volumetric titration Methods 0.000 description 5
- 238000005160 1H NMR spectroscopy Methods 0.000 description 4
- VTLYFUHAOXGGBS-UHFFFAOYSA-N Fe3+ Chemical compound [Fe+3] VTLYFUHAOXGGBS-UHFFFAOYSA-N 0.000 description 4
- 238000005033 Fourier transform infrared spectroscopy Methods 0.000 description 4
- 102000002737 Heme Oxygenase-1 Human genes 0.000 description 4
- 108010018924 Heme Oxygenase-1 Proteins 0.000 description 4
- -1 Iron carbohydrate Chemical class 0.000 description 4
- 239000003795 chemical substances by application Substances 0.000 description 4
- XLYOFNOQVPJJNP-UHFFFAOYSA-M hydroxide Chemical compound [OH-] XLYOFNOQVPJJNP-UHFFFAOYSA-M 0.000 description 4
- 238000001990 intravenous administration Methods 0.000 description 4
- 229910021519 iron(III) oxide-hydroxide Inorganic materials 0.000 description 4
- 238000000655 nuclear magnetic resonance spectrum Methods 0.000 description 4
- 238000000425 proton nuclear magnetic resonance spectrum Methods 0.000 description 4
- 238000010926 purge Methods 0.000 description 4
- 238000012764 semi-quantitative analysis Methods 0.000 description 4
- 239000011780 sodium chloride Substances 0.000 description 4
- 238000001228 spectrum Methods 0.000 description 4
- 238000001644 13C nuclear magnetic resonance spectroscopy Methods 0.000 description 3
- PEDCQBHIVMGVHV-UHFFFAOYSA-N Glycerine Chemical compound OCC(O)CO PEDCQBHIVMGVHV-UHFFFAOYSA-N 0.000 description 3
- VEXZGXHMUGYJMC-UHFFFAOYSA-N Hydrochloric acid Chemical compound Cl VEXZGXHMUGYJMC-UHFFFAOYSA-N 0.000 description 3
- OKKJLVBELUTLKV-UHFFFAOYSA-N Methanol Chemical compound OC OKKJLVBELUTLKV-UHFFFAOYSA-N 0.000 description 3
- 238000003991 Rietveld refinement Methods 0.000 description 3
- 238000010521 absorption reaction Methods 0.000 description 3
- 125000004429 atom Chemical group 0.000 description 3
- 238000001460 carbon-13 nuclear magnetic resonance spectrum Methods 0.000 description 3
- 239000013078 crystal Substances 0.000 description 3
- 238000000113 differential scanning calorimetry Methods 0.000 description 3
- 238000010790 dilution Methods 0.000 description 3
- 239000012895 dilution Substances 0.000 description 3
- 238000002347 injection Methods 0.000 description 3
- 229940090044 injection Drugs 0.000 description 3
- 239000007924 injection Substances 0.000 description 3
- 238000010253 intravenous injection Methods 0.000 description 3
- 230000005291 magnetic effect Effects 0.000 description 3
- 229910052757 nitrogen Inorganic materials 0.000 description 3
- 238000003921 particle size analysis Methods 0.000 description 3
- 230000008569 process Effects 0.000 description 3
- 239000003223 protective agent Substances 0.000 description 3
- 230000004044 response Effects 0.000 description 3
- 150000003384 small molecules Chemical class 0.000 description 3
- 239000000725 suspension Substances 0.000 description 3
- 239000008215 water for injection Substances 0.000 description 3
- 238000001262 western blot Methods 0.000 description 3
- MFBBZTDYOYZJGB-HAONTEFVSA-L (2s,3s,4s,5r)-4-[(2r,3r,4r,5s,6r)-5-[(2r,3r,4r,5s,6r)-3,4-dihydroxy-6-(hydroxymethyl)-5-[(2r,3r,4s,5s,6r)-3,4,5-trihydroxy-6-(hydroxymethyl)oxan-2-yl]oxyoxan-2-yl]oxy-3,4-dihydroxy-6-(hydroxymethyl)oxan-2-yl]oxy-2,3,5,6-tetrahydroxyhexanoate;iron(3+);oxyg Chemical compound O.[OH-].[O-2].[Fe+3].O[C@@H]1[C@@H](O)[C@@H](O[C@@H]([C@H](O)CO)[C@@H](O)[C@H](O)C([O-])=O)O[C@H](CO)[C@H]1O[C@@H]1[C@H](O)[C@@H](O)[C@H](O[C@@H]2[C@@H]([C@@H](O)[C@H](O)[C@@H](CO)O2)O)[C@@H](CO)O1 MFBBZTDYOYZJGB-HAONTEFVSA-L 0.000 description 2
- XKRFYHLGVUSROY-UHFFFAOYSA-N Argon Chemical compound [Ar] XKRFYHLGVUSROY-UHFFFAOYSA-N 0.000 description 2
- 102000008015 Hemeproteins Human genes 0.000 description 2
- 108010089792 Hemeproteins Proteins 0.000 description 2
- UFHFLCQGNIYNRP-UHFFFAOYSA-N Hydrogen Chemical compound [H][H] UFHFLCQGNIYNRP-UHFFFAOYSA-N 0.000 description 2
- DGAQECJNVWCQMB-PUAWFVPOSA-M Ilexoside XXIX Chemical compound C[C@@H]1CC[C@@]2(CC[C@@]3(C(=CC[C@H]4[C@]3(CC[C@@H]5[C@@]4(CC[C@@H](C5(C)C)OS(=O)(=O)[O-])C)C)[C@@H]2[C@]1(C)O)C)C(=O)O[C@H]6[C@@H]([C@H]([C@@H]([C@H](O6)CO)O)O)O.[Na+] DGAQECJNVWCQMB-PUAWFVPOSA-M 0.000 description 2
- 206010022971 Iron Deficiencies Diseases 0.000 description 2
- UQSXHKLRYXJYBZ-UHFFFAOYSA-N Iron oxide Chemical compound [Fe]=O UQSXHKLRYXJYBZ-UHFFFAOYSA-N 0.000 description 2
- 229910019142 PO4 Inorganic materials 0.000 description 2
- 208000027418 Wounds and injury Diseases 0.000 description 2
- CUPCBVUMRUSXIU-UHFFFAOYSA-N [Fe].OOO Chemical compound [Fe].OOO CUPCBVUMRUSXIU-UHFFFAOYSA-N 0.000 description 2
- 239000003463 adsorbent Substances 0.000 description 2
- 239000000443 aerosol Substances 0.000 description 2
- 238000001636 atomic emission spectroscopy Methods 0.000 description 2
- 230000008901 benefit Effects 0.000 description 2
- 238000011088 calibration curve Methods 0.000 description 2
- 150000001720 carbohydrates Chemical class 0.000 description 2
- 230000008859 change Effects 0.000 description 2
- 238000012512 characterization method Methods 0.000 description 2
- 230000000052 comparative effect Effects 0.000 description 2
- DDRJAANPRJIHGJ-UHFFFAOYSA-N creatinine Chemical compound CN1CC(=O)NC1=N DDRJAANPRJIHGJ-UHFFFAOYSA-N 0.000 description 2
- 230000006378 damage Effects 0.000 description 2
- 238000001938 differential scanning calorimetry curve Methods 0.000 description 2
- 239000006185 dispersion Substances 0.000 description 2
- 229960004131 ferric carboxymaltose Drugs 0.000 description 2
- 238000009472 formulation Methods 0.000 description 2
- 125000000524 functional group Chemical group 0.000 description 2
- 229910052598 goethite Inorganic materials 0.000 description 2
- 229910052739 hydrogen Inorganic materials 0.000 description 2
- 239000001257 hydrogen Substances 0.000 description 2
- AEIXRCIKZIZYPM-UHFFFAOYSA-M hydroxy(oxo)iron Chemical compound [O][Fe]O AEIXRCIKZIZYPM-UHFFFAOYSA-M 0.000 description 2
- 230000001939 inductive effect Effects 0.000 description 2
- 238000001095 inductively coupled plasma mass spectrometry Methods 0.000 description 2
- 229940090441 infed Drugs 0.000 description 2
- 208000014674 injury Diseases 0.000 description 2
- 150000002505 iron Chemical class 0.000 description 2
- 229940097452 iron sucrose injection Drugs 0.000 description 2
- 239000007788 liquid Substances 0.000 description 2
- 238000004519 manufacturing process Methods 0.000 description 2
- 210000000865 mononuclear phagocyte system Anatomy 0.000 description 2
- 239000002086 nanomaterial Substances 0.000 description 2
- 239000002105 nanoparticle Substances 0.000 description 2
- 235000015097 nutrients Nutrition 0.000 description 2
- NBIIXXVUZAFLBC-UHFFFAOYSA-K phosphate Chemical compound [O-]P([O-])([O-])=O NBIIXXVUZAFLBC-UHFFFAOYSA-K 0.000 description 2
- 239000010452 phosphate Substances 0.000 description 2
- 238000004062 sedimentation Methods 0.000 description 2
- 238000001998 small-angle neutron scattering Methods 0.000 description 2
- 229910052708 sodium Inorganic materials 0.000 description 2
- 239000011734 sodium Substances 0.000 description 2
- 239000002904 solvent Substances 0.000 description 2
- 238000004611 spectroscopical analysis Methods 0.000 description 2
- 238000012360 testing method Methods 0.000 description 2
- 238000001757 thermogravimetry curve Methods 0.000 description 2
- 238000012546 transfer Methods 0.000 description 2
- 238000002054 transplantation Methods 0.000 description 2
- QJZYHAIUNVAGQP-UHFFFAOYSA-N 3-nitrobicyclo[2.2.1]hept-5-ene-2,3-dicarboxylic acid Chemical compound C1C2C=CC1C(C(=O)O)C2(C(O)=O)[N+]([O-])=O QJZYHAIUNVAGQP-UHFFFAOYSA-N 0.000 description 1
- 230000005653 Brownian motion process Effects 0.000 description 1
- 229910002588 FeOOH Inorganic materials 0.000 description 1
- 102000008857 Ferritin Human genes 0.000 description 1
- 108050000784 Ferritin Proteins 0.000 description 1
- 238000008416 Ferritin Methods 0.000 description 1
- HSRJKNPTNIJEKV-UHFFFAOYSA-N Guaifenesin Chemical compound COC1=CC=CC=C1OCC(O)CO HSRJKNPTNIJEKV-UHFFFAOYSA-N 0.000 description 1
- 239000004793 Polystyrene Substances 0.000 description 1
- UIIMBOGNXHQVGW-DEQYMQKBSA-M Sodium bicarbonate-14C Chemical compound [Na+].O[14C]([O-])=O UIIMBOGNXHQVGW-DEQYMQKBSA-M 0.000 description 1
- 238000003070 Statistical process control Methods 0.000 description 1
- 102000004338 Transferrin Human genes 0.000 description 1
- 108090000901 Transferrin Proteins 0.000 description 1
- 229930003779 Vitamin B12 Natural products 0.000 description 1
- 239000002253 acid Substances 0.000 description 1
- 230000002730 additional effect Effects 0.000 description 1
- 238000004164 analytical calibration Methods 0.000 description 1
- 239000012736 aqueous medium Substances 0.000 description 1
- 239000007864 aqueous solution Substances 0.000 description 1
- 229910052786 argon Inorganic materials 0.000 description 1
- 238000000149 argon plasma sintering Methods 0.000 description 1
- 238000004630 atomic force microscopy Methods 0.000 description 1
- 238000005102 attenuated total reflection Methods 0.000 description 1
- 230000009286 beneficial effect Effects 0.000 description 1
- 210000001124 body fluid Anatomy 0.000 description 1
- 239000010839 body fluid Substances 0.000 description 1
- 238000005537 brownian motion Methods 0.000 description 1
- 239000000872 buffer Substances 0.000 description 1
- 230000003139 buffering effect Effects 0.000 description 1
- 230000015556 catabolic process Effects 0.000 description 1
- 210000004027 cell Anatomy 0.000 description 1
- 238000005119 centrifugation Methods 0.000 description 1
- AGVAZMGAQJOSFJ-WZHZPDAFSA-M cobalt(2+);[(2r,3s,4r,5s)-5-(5,6-dimethylbenzimidazol-1-yl)-4-hydroxy-2-(hydroxymethyl)oxolan-3-yl] [(2r)-1-[3-[(1r,2r,3r,4z,7s,9z,12s,13s,14z,17s,18s,19r)-2,13,18-tris(2-amino-2-oxoethyl)-7,12,17-tris(3-amino-3-oxopropyl)-3,5,8,8,13,15,18,19-octamethyl-2 Chemical compound [Co+2].N#[C-].[N-]([C@@H]1[C@H](CC(N)=O)[C@@]2(C)CCC(=O)NC[C@@H](C)OP(O)(=O)O[C@H]3[C@H]([C@H](O[C@@H]3CO)N3C4=CC(C)=C(C)C=C4N=C3)O)\C2=C(C)/C([C@H](C\2(C)C)CCC(N)=O)=N/C/2=C\C([C@H]([C@@]/2(CC(N)=O)C)CCC(N)=O)=N\C\2=C(C)/C2=N[C@]1(C)[C@@](C)(CC(N)=O)[C@@H]2CCC(N)=O AGVAZMGAQJOSFJ-WZHZPDAFSA-M 0.000 description 1
- 239000000084 colloidal system Substances 0.000 description 1
- 239000003086 colorant Substances 0.000 description 1
- 238000002485 combustion reaction Methods 0.000 description 1
- 238000004320 controlled atmosphere Methods 0.000 description 1
- 230000002596 correlated effect Effects 0.000 description 1
- 230000008878 coupling Effects 0.000 description 1
- 238000010168 coupling process Methods 0.000 description 1
- 238000005859 coupling reaction Methods 0.000 description 1
- 229940109239 creatinine Drugs 0.000 description 1
- 238000006731 degradation reaction Methods 0.000 description 1
- 238000004455 differential thermal analysis Methods 0.000 description 1
- 238000009792 diffusion process Methods 0.000 description 1
- 238000007865 diluting Methods 0.000 description 1
- 238000006471 dimerization reaction Methods 0.000 description 1
- 238000006073 displacement reaction Methods 0.000 description 1
- 238000000921 elemental analysis Methods 0.000 description 1
- 230000012202 endocytosis Effects 0.000 description 1
- MSNWSDPPULHLDL-UHFFFAOYSA-K ferric hydroxide Chemical group [OH-].[OH-].[OH-].[Fe+3] MSNWSDPPULHLDL-UHFFFAOYSA-K 0.000 description 1
- 229940042644 ferrlecit Drugs 0.000 description 1
- 229940102709 ferumoxytol Drugs 0.000 description 1
- 230000004907 flux Effects 0.000 description 1
- 238000010438 heat treatment Methods 0.000 description 1
- 239000004021 humic acid Substances 0.000 description 1
- 125000004435 hydrogen atom Chemical group [H]* 0.000 description 1
- UCNNJGDEJXIUCC-UHFFFAOYSA-L hydroxy(oxo)iron;iron Chemical compound [Fe].O[Fe]=O.O[Fe]=O UCNNJGDEJXIUCC-UHFFFAOYSA-L 0.000 description 1
- 238000002354 inductively-coupled plasma atomic emission spectroscopy Methods 0.000 description 1
- 239000011261 inert gas Substances 0.000 description 1
- 239000004615 ingredient Substances 0.000 description 1
- 229940019742 injectafer Drugs 0.000 description 1
- 239000011256 inorganic filler Substances 0.000 description 1
- 229910003475 inorganic filler Inorganic materials 0.000 description 1
- 229910052500 inorganic mineral Inorganic materials 0.000 description 1
- 230000003993 interaction Effects 0.000 description 1
- 150000002500 ions Chemical class 0.000 description 1
- JEIPFZHSYJVQDO-UHFFFAOYSA-N iron(III) oxide Inorganic materials O=[Fe]O[Fe]=O JEIPFZHSYJVQDO-UHFFFAOYSA-N 0.000 description 1
- 239000003446 ligand Substances 0.000 description 1
- 230000031700 light absorption Effects 0.000 description 1
- 210000004185 liver Anatomy 0.000 description 1
- 210000002540 macrophage Anatomy 0.000 description 1
- 230000014759 maintenance of location Effects 0.000 description 1
- 238000004949 mass spectrometry Methods 0.000 description 1
- 230000007246 mechanism Effects 0.000 description 1
- 230000004060 metabolic process Effects 0.000 description 1
- 229910052751 metal Inorganic materials 0.000 description 1
- 239000002184 metal Substances 0.000 description 1
- 150000002739 metals Chemical class 0.000 description 1
- 239000010445 mica Substances 0.000 description 1
- 229910052618 mica group Inorganic materials 0.000 description 1
- 235000010755 mineral Nutrition 0.000 description 1
- 239000011707 mineral Substances 0.000 description 1
- 239000004570 mortar (masonry) Substances 0.000 description 1
- 239000002707 nanocrystalline material Substances 0.000 description 1
- 230000036542 oxidative stress Effects 0.000 description 1
- 230000005298 paramagnetic effect Effects 0.000 description 1
- 239000000546 pharmaceutical excipient Substances 0.000 description 1
- 239000000825 pharmaceutical preparation Substances 0.000 description 1
- 229940127557 pharmaceutical product Drugs 0.000 description 1
- 239000008363 phosphate buffer Substances 0.000 description 1
- 238000006116 polymerization reaction Methods 0.000 description 1
- 229920002223 polystyrene Polymers 0.000 description 1
- 239000003755 preservative agent Substances 0.000 description 1
- 239000000651 prodrug Substances 0.000 description 1
- 229940002612 prodrug Drugs 0.000 description 1
- 230000005855 radiation Effects 0.000 description 1
- 230000009257 reactivity Effects 0.000 description 1
- 230000001105 regulatory effect Effects 0.000 description 1
- 238000005464 sample preparation method Methods 0.000 description 1
- 229920006395 saturated elastomer Polymers 0.000 description 1
- 238000009738 saturating Methods 0.000 description 1
- 229940062350 sodium ferric gluconate complex Drugs 0.000 description 1
- UDJMEHOEDIAPCK-UHFFFAOYSA-N sodium iron(2+) oxygen(2-) Chemical compound [O-2].[Fe+2].[Na+] UDJMEHOEDIAPCK-UHFFFAOYSA-N 0.000 description 1
- MQBDAEHWGRMADS-XNHLMZCASA-M sodium;(2r,3r,4s,5s,6r)-2-[(2s,3s,4s,5r)-3,4-dihydroxy-2,5-bis(hydroxymethyl)oxolan-2-yl]oxy-6-(hydroxymethyl)oxane-3,4,5-triol;iron(3+);oxygen(2-);(2r,3s,4r,5r)-2,3,4,5,6-pentahydroxyhexanoate Chemical compound [O-2].[O-2].[O-2].[Na+].[Fe+3].[Fe+3].OC[C@@H](O)[C@@H](O)[C@H](O)[C@@H](O)C([O-])=O.O[C@H]1[C@H](O)[C@@H](CO)O[C@@]1(CO)O[C@@H]1[C@H](O)[C@@H](O)[C@H](O)[C@@H](CO)O1.O[C@H]1[C@H](O)[C@@H](CO)O[C@@]1(CO)O[C@@H]1[C@H](O)[C@@H](O)[C@H](O)[C@@H](CO)O1.O[C@H]1[C@H](O)[C@@H](CO)O[C@@]1(CO)O[C@@H]1[C@H](O)[C@@H](O)[C@H](O)[C@@H](CO)O1.O[C@H]1[C@H](O)[C@@H](CO)O[C@@]1(CO)O[C@@H]1[C@H](O)[C@@H](O)[C@H](O)[C@@H](CO)O1.O[C@H]1[C@H](O)[C@@H](CO)O[C@@]1(CO)O[C@@H]1[C@H](O)[C@@H](O)[C@H](O)[C@@H](CO)O1 MQBDAEHWGRMADS-XNHLMZCASA-M 0.000 description 1
- 230000003595 spectral effect Effects 0.000 description 1
- 238000012306 spectroscopic technique Methods 0.000 description 1
- 238000003860 storage Methods 0.000 description 1
- 150000003445 sucroses Chemical class 0.000 description 1
- 235000000346 sugar Nutrition 0.000 description 1
- 150000008163 sugars Chemical class 0.000 description 1
- 230000002194 synthesizing effect Effects 0.000 description 1
- 229920001059 synthetic polymer Polymers 0.000 description 1
- 238000005979 thermal decomposition reaction Methods 0.000 description 1
- 239000011573 trace mineral Substances 0.000 description 1
- 235000013619 trace mineral Nutrition 0.000 description 1
- 239000012581 transferrin Substances 0.000 description 1
- 230000007704 transition Effects 0.000 description 1
- 238000000870 ultraviolet spectroscopy Methods 0.000 description 1
- 230000003827 upregulation Effects 0.000 description 1
- 238000012795 verification Methods 0.000 description 1
- 239000011715 vitamin B12 Substances 0.000 description 1
- 235000019163 vitamin B12 Nutrition 0.000 description 1
- 238000000733 zeta-potential measurement Methods 0.000 description 1
Classifications
-
- C—CHEMISTRY; METALLURGY
- C07—ORGANIC CHEMISTRY
- C07H—SUGARS; DERIVATIVES THEREOF; NUCLEOSIDES; NUCLEOTIDES; NUCLEIC ACIDS
- C07H23/00—Compounds containing boron, silicon or a metal, e.g. chelates or vitamin B12
-
- A—HUMAN NECESSITIES
- A61—MEDICAL OR VETERINARY SCIENCE; HYGIENE
- A61K—PREPARATIONS FOR MEDICAL, DENTAL OR TOILETRY PURPOSES
- A61K9/00—Medicinal preparations characterised by special physical form
- A61K9/0012—Galenical forms characterised by the site of application
- A61K9/0019—Injectable compositions; Intramuscular, intravenous, arterial, subcutaneous administration; Compositions to be administered through the skin in an invasive manner
-
- A—HUMAN NECESSITIES
- A61—MEDICAL OR VETERINARY SCIENCE; HYGIENE
- A61K—PREPARATIONS FOR MEDICAL, DENTAL OR TOILETRY PURPOSES
- A61K9/00—Medicinal preparations characterised by special physical form
- A61K9/08—Solutions
-
- A—HUMAN NECESSITIES
- A61—MEDICAL OR VETERINARY SCIENCE; HYGIENE
- A61K—PREPARATIONS FOR MEDICAL, DENTAL OR TOILETRY PURPOSES
- A61K31/00—Medicinal preparations containing organic active ingredients
- A61K31/33—Heterocyclic compounds
- A61K31/395—Heterocyclic compounds having nitrogen as a ring hetero atom, e.g. guanethidine or rifamycins
- A61K31/40—Heterocyclic compounds having nitrogen as a ring hetero atom, e.g. guanethidine or rifamycins having five-membered rings with one nitrogen as the only ring hetero atom, e.g. sulpiride, succinimide, tolmetin, buflomedil
- A61K31/409—Heterocyclic compounds having nitrogen as a ring hetero atom, e.g. guanethidine or rifamycins having five-membered rings with one nitrogen as the only ring hetero atom, e.g. sulpiride, succinimide, tolmetin, buflomedil having four such rings, e.g. porphine derivatives, bilirubin, biliverdine
-
- A—HUMAN NECESSITIES
- A61—MEDICAL OR VETERINARY SCIENCE; HYGIENE
- A61K—PREPARATIONS FOR MEDICAL, DENTAL OR TOILETRY PURPOSES
- A61K33/00—Medicinal preparations containing inorganic active ingredients
- A61K33/24—Heavy metals; Compounds thereof
- A61K33/26—Iron; Compounds thereof
-
- A—HUMAN NECESSITIES
- A61—MEDICAL OR VETERINARY SCIENCE; HYGIENE
- A61K—PREPARATIONS FOR MEDICAL, DENTAL OR TOILETRY PURPOSES
- A61K47/00—Medicinal preparations characterised by the non-active ingredients used, e.g. carriers or inert additives; Targeting or modifying agents chemically bound to the active ingredient
- A61K47/02—Inorganic compounds
-
- A—HUMAN NECESSITIES
- A61—MEDICAL OR VETERINARY SCIENCE; HYGIENE
- A61K—PREPARATIONS FOR MEDICAL, DENTAL OR TOILETRY PURPOSES
- A61K9/00—Medicinal preparations characterised by special physical form
- A61K9/06—Ointments; Bases therefor; Other semi-solid forms, e.g. creams, sticks, gels
-
- A—HUMAN NECESSITIES
- A61—MEDICAL OR VETERINARY SCIENCE; HYGIENE
- A61P—SPECIFIC THERAPEUTIC ACTIVITY OF CHEMICAL COMPOUNDS OR MEDICINAL PREPARATIONS
- A61P13/00—Drugs for disorders of the urinary system
- A61P13/12—Drugs for disorders of the urinary system of the kidneys
-
- A—HUMAN NECESSITIES
- A61—MEDICAL OR VETERINARY SCIENCE; HYGIENE
- A61P—SPECIFIC THERAPEUTIC ACTIVITY OF CHEMICAL COMPOUNDS OR MEDICINAL PREPARATIONS
- A61P7/00—Drugs for disorders of the blood or the extracellular fluid
- A61P7/08—Plasma substitutes; Perfusion solutions; Dialytics or haemodialytics; Drugs for electrolytic or acid-base disorders, e.g. hypovolemic shock
Landscapes
- Health & Medical Sciences (AREA)
- Chemical & Material Sciences (AREA)
- General Health & Medical Sciences (AREA)
- Life Sciences & Earth Sciences (AREA)
- Public Health (AREA)
- Veterinary Medicine (AREA)
- Animal Behavior & Ethology (AREA)
- Medicinal Chemistry (AREA)
- Pharmacology & Pharmacy (AREA)
- Epidemiology (AREA)
- Organic Chemistry (AREA)
- Engineering & Computer Science (AREA)
- Inorganic Chemistry (AREA)
- Bioinformatics & Cheminformatics (AREA)
- General Chemical & Material Sciences (AREA)
- Chemical Kinetics & Catalysis (AREA)
- Nuclear Medicine, Radiotherapy & Molecular Imaging (AREA)
- Dermatology (AREA)
- Urology & Nephrology (AREA)
- Biotechnology (AREA)
- Biochemistry (AREA)
- Genetics & Genomics (AREA)
- Molecular Biology (AREA)
- Diabetes (AREA)
- Hematology (AREA)
- Gastroenterology & Hepatology (AREA)
- Pharmaceuticals Containing Other Organic And Inorganic Compounds (AREA)
- Medicinal Preparation (AREA)
Abstract
La presente invención implica una nueva composición acuosa de hierro. La composición acuosa de hierro incluye sacarosa y bicarbonato de hierro. La composición acuosa de hierro de la invención exhibe efectos protectores renales mejorados con respecto a las composiciones convencionales de hierro y sacarosa. (Traducción automática con Google Translate, sin valor legal)The present invention involves a new aqueous iron composition. The aqueous iron composition includes sucrose and iron bicarbonate. The aqueous iron composition of the invention exhibits improved renal protective effects over conventional iron and sucrose compositions. (Automatic translation with Google Translate, without legal value)
Description
DESCRIPCIÓNDESCRIPTION
Composiciones de hierro novedosas y métodos para preparar y utilizar las mismasNovel iron compositions and methods for preparing and using the same
Esta solicitud reivindica la prioridad a la solicitud provisional n°. 62/812.028, presentada el 28 de febrero de 2019, titulada Novel Iron Compositions and Methods of Marking and Using the Same.This application claims priority to provisional application no. 62/812,028, filed February 28, 2019, titled Novel Iron Compositions and Methods of Marking and Using the Same.
Antecedentes de la invenciónBackground of the invention
Los agentes de hierro intravenoso (IV) son coloides que consisten en nanopartículas de hierro-hidrato de carbono esferoidales como se muestra en la Figura 1. En el núcleo de cada partícula hay un gel de hierro-oxihidróxido y el núcleo está rodeado por una cáscara de hidrato de carbono que estabiliza el hierro-oxihidróxido (la función principal del ligando es estabilizar el complejo y protegerlo contra una mayor polinuclearización).Intravenous (IV) iron agents are colloids consisting of spheroidal iron-carbohydrate nanoparticles as shown in Figure 1. In the core of each particle is an iron-oxyhydroxide gel and the core is surrounded by a shell. of carbohydrate that stabilizes the iron-oxyhydroxide (the main function of the ligand is to stabilize the complex and protect it against further polynuclearization).
Los complejos de carbohidratos de hierro se comportan como profármacos, ya que el hierro debe liberarse del núcleo de hidróxido de hierro (III). Según el mecanismo propuesto, tras la administración, los complejos estables (Tipo 1) como la carboximaltosa férrica y el dextrano de hierro son captados por endocitosis por los macrófagos del sistema reticuloendotelial (RES). Véase Danielson, J. Structure, chemistry, and pharmacokinetics of intravenous iron agents. Am. Soc. Nephrol. 2004, 15, S93-S98.Iron carbohydrate complexes behave as prodrugs, since iron must be released from the iron(III) hydroxide core. According to the proposed mechanism, after administration, stable complexes (Type 1) such as ferric carboxymaltose and iron dextran are taken up by endocytosis by macrophages of the reticuloendothelial system (RES). See Danielson, J. Structure, chemistry, and pharmacokinetics of intravenous iron agents. Am. Soc. Nephrol. 2004, 15, S93-S98.
En el caso de carbohidratos de hierro (III) menos estables (Tipo 2), pueden liberarse cantidades significativas de hierro lábil del complejo y provocar la saturación de transferrina y, por lo tanto, a cantidades significativas de hierro no ligado (NTBI), particularmente si se administran dosis altas. Este Fe3+ débilmente unido se absorbe fácilmente de una manera no regulada por las células y puede inducir estrés oxidativo. Evans, R.W.; Rafique, R.; Zarea, A.; Rapisarda, C.; Cammack, R.; Evans, P.J.; Porter, J.B.; Hider, R.C. Nature of non-transferrin-bound iron: studies on iron citrate complexes and the thalassemic era. J. Biol. Inorg. Chem. 2008, 13, 57-74.In the case of less stable iron(III) carbohydrates (Type 2), significant amounts of labile iron can be released from the complex and lead to transferrin saturation and thus significant amounts of unbound iron (NTBI), particularly if high doses are administered. This weakly bound Fe3+ is easily absorbed in an unregulated manner by cells and can induce oxidative stress. Evans, R.W.; Rafique, R.; Zarea, A.; Rapisarda, C.; Cammack, R.; Evans, P.J.; Porter, J.B.; Hider, R.C. Nature of non-transferrin-bound iron: studies on iron citrate complexes and the thalassemic era. J. Biol. Inorg. Chem. 2008, 13, 57-74.
Existen cinco tipos de productos inyectables de hierro-carbohidratos aprobados actualmente por la FDA (1) INFeD®/ Dexferum® (hierro dextrano), Ferahem® (ferumoxitol), Injectafer® (carboximaltosa férrico), Venofer® (sacarosa de hierro), Ferrlecit® (complejo de gluconato férrico de sodio). La sacarosa de hierro, comercializada con el nombre Venofer®, se formula como una suspensión coloidal que tiene un peso molecular (Mw) de aproximadamente 34.000 60.000 dáltones y una fórmula molecular de la siguiente manera:There are five types of injectable iron-carbohydrate products currently approved by the FDA (1) INFeD®/ Dexferum® (iron dextran), Ferahem® (ferumoxytol), Injectafer® (ferric carboxymaltose), Venofer® (iron sucrose), Ferrlecit ® (sodium ferric gluconate complex). Iron sucrose, marketed under the name Venofer®, is formulated as a colloidal suspension having a molecular weight (Mw) of approximately 34,000 60,000 Daltons and a molecular formula as follows:

donde n es el grado de polimerización de hierro y m es el número de moléculas de sacarosa (C.sub.12 H.sub.22 O.sub.11) en complejo con el núcleo de hierro polimerizado polinuclear:where n is the degree of iron polymerization and m is the number of sucrose molecules (C.sub.12 H.sub.22 O.sub.11) in complex with the polynuclear polymerized iron nucleus:

Cada ml contiene 20 mg de hierro elemental como sacarosa de hierro en agua para inyección. El Venofador® está disponible en viales de dosis única de 5 ml (100 mg de hierro elemental por 5 ml) y viales de dosis única de 10 ml (200 mg de hierro elemental por 10 ml). El producto farmacéutico contiene aproximadamente 30 % de sacarosa p/v (300 mg/ml) y tiene un pH de 10,5-11,1. El producto no contiene conservantes. La osmolaridad de la inyección es de 1.250 mOsmol/l.Each ml contains 20 mg of elemental iron as iron sucrose in water for injection. Venofador® is available in 5 mL single-dose vials (100 mg elemental iron per 5 mL) and 10 mL single-dose vials (200 mg elemental iron per 10 mL). The pharmaceutical product contains approximately 30% w/v sucrose (300 mg/ml) and has a pH of 10.5-11.1. The product does not contain preservatives. The osmolarity of the injection is 1,250 mOsmol/l.
Los métodos para sintetizar carbohidratos de hierro se describen en la patente WO 97/11711 (1997) por Lawrence y col., que describen composiciones de oxihidróxido-dextrano fermentadas para tratar la deficiencia de hierro que tiene partículas elipsoidales con un rango de peso molecular preferido de aproximadamente 250.000 a 300.000 dáltones. Recientemente, se ha utilizado hierro sacarosa en combinación con protoporfirina de estaño (SnPP) para inducir la citorresistencia adquirida sin causar lesiones en el órgano. Véase la patente US- 9.844.563 de Zager y col. Los presentes inventores han descubierto la necesidad de una formulación de sacarosa de hierro que pueda combinarse fácilmente con protoporfirina de estaño (SnPP), que sea estable y pueda inyectarse en un paciente para tratar la deficiencia de hierro o por sus efectos protectores renales, ya sea sola o en combinación con otro agente como la SnPP.Methods for synthesizing iron carbohydrates are described in WO 97/11711 (1997) by Lawrence et al., which describe fermented oxyhydroxide-dextran compositions for treating iron deficiency having ellipsoidal particles with a preferred molecular weight range. approximately 250,000 to 300,000 daltons. Recently, iron sucrose has been used in combination with tin protoporphyrin (SnPP) to induce acquired cytoresistance without causing organ injury. See US Patent 9,844,563 to Zager et al. The present inventors have discovered the need for an iron sucrose formulation that can be easily combined with tin protoporphyrin (SnPP), that is stable and can be injected into a patient to treat iron deficiency or for its renal protective effects, either alone or in combination with another agent such as SnPP.
La patente alemana número DE862482 describe un proceso para preparar soluciones inyectables estables de sal de hierro trivalente. La publicación de solicitud de patente de Estados Unidos número US-2005/309187 describe un proceso para preparar un complejo de sacarosa de hierro, sustancialmente libre de excipientes, para proporcionar un complejo de sacarosa de hierro coprecipitado con sacarosa, y para proporcionar complejos de sacarosa de hierro en solución acuosa. La patente alemana número DE19547356 describe un adsorbente para fosfato de un medio acuoso, en particular para fosfato inorgánico o unido a nutrientes de fluidos corporales o nutrientes. El adsorbente contiene hidróxido de beta-hierro polinuclear estabilizado por carbohidratos y/o ácido húmico. El número de publicación PCT de la patente WO2018148217A1 describe composiciones, kits y métodos para proteger a los órganos mediante la inducción de la citorresistencia adquirida sin causar lesiones en el órgano. Las composiciones, kits y métodos utilizan complejos de Me-porfirina, proteínas hemo, moléculas que contienen hierro y/o vitamina B12 y, opcionalmente, agentes que inciden en el metabolismo de las proteínas hemo.German patent number DE862482 describes a process for preparing stable injectable solutions of trivalent iron salt. United States Patent Application Publication Number US-2005/309187 describes a process for preparing an iron sucrose complex, substantially free of excipients, to provide an iron sucrose complex coprecipitated with sucrose, and to provide sucrose complexes of iron in aqueous solution. German patent number DE19547356 describes an adsorbent for phosphate from an aqueous medium, in particular for inorganic or nutrient-bound phosphate from body fluids or nutrients. The adsorbent contains polynuclear beta-iron hydroxide stabilized by carbohydrates and/or humic acid. PCT patent publication number WO2018148217A1 describes compositions, kits and methods for protecting organs by inducing acquired cytoresistance without causing injury to the organ. The compositions, Kits and methods use Me-porphyrin complexes, heme proteins, molecules containing iron and/or vitamin B12 and, optionally, agents that affect the metabolism of heme proteins.
Resumen de la invenciónSummary of the invention
La descripción se refiere a composiciones acuosas de sacarosa de hierro que tienen propiedades deseables. En un aspecto de la descripción, la composición acuosa de sacarosa de iones comprende sacarosa de hierro y bicarbonato. En un aspecto, la invención se refiere a una composición farmacéutica de hierro acuosa que comprende: sacarosa; bicarbonato; y un portador acuoso farmacéuticamente aceptable. En otro aspecto, la invención se refiere a una composición de hierro acuosa que comprende sacarosa de hierro y bicarbonato para usar en un método para la prevención o el tratamiento de una enfermedad o trastorno renal que comprende administrar por vía intravenosa una composición de hierro acuosa en una cantidad terapéuticamente eficaz, en donde la composición de hierro acuosa comprende sacarosa de hierro y bicarbonato.The description relates to aqueous iron sucrose compositions having desirable properties. In one aspect of the disclosure, the aqueous ion sucrose composition comprises iron sucrose and bicarbonate. In one aspect, the invention relates to an aqueous iron pharmaceutical composition comprising: sucrose; baking soda; and a pharmaceutically acceptable aqueous carrier. In another aspect, the invention relates to an aqueous iron composition comprising iron sucrose and bicarbonate for use in a method for the prevention or treatment of a kidney disease or disorder comprising intravenously administering an aqueous iron composition in a therapeutically effective amount, wherein the aqueous iron composition comprises iron sucrose and bicarbonate.
Descripción de las figurasDescription of the figures
La Figura 1 muestra la estructura de un carbohidrato de hierro.Figure 1 shows the structure of an iron carbohydrate.
La Figura 2 es una transferencia Western de riñón a las 18 horas después de la administración de composiciones acuosas de hierro.Figure 2 is a Western blot of kidney at 18 hours after administration of aqueous iron compositions.
La Figura 3 muestra cromatogramas de GPC de tres preparaciones S1.Figure 3 shows GPC chromatograms of three S1 preparations.
La Figura 4 muestra una vista ampliada de la Figura 3.Figure 4 shows an enlarged view of Figure 3.
La Figura 5 muestra cromatogramas de GPC de tres preparaciones S1.Figure 5 shows GPC chromatograms of three S1 preparations.
La Figura 6 muestra una vista ampliada de la Figura 5.Figure 6 shows an enlarged view of Figure 5.
La Figura 7 muestra cromatogramas de GPC de tres preparaciones S1.Figure 7 shows GPC chromatograms of three S1 preparations.
La Figura 8 muestra una vista ampliada de la Figura 7Figure 8 shows an enlarged view of Figure 7
La Figura 9 muestra una comparación de GPC para S1, S2 y S3.Figure 9 shows a comparison of GPC for S1, S2 and S3.
La Figura 10 muestra una vista superior y lateral de AFM para S1.Figure 10 shows a top and side view of AFM for S1.
La Figura 11 muestra el análisis de tamaño de partículas S1 en la ubicación 1.Figure 11 shows the S1 particle size analysis at location 1.
La Figura 12 muestra el análisis de sección manual S1 de tres partículas.Figure 12 shows S1 hand section analysis of three particles.
La Figura 13 muestra los espectros de FTIR de S1 y la mejor coincid lean bciibalioteca, d lea sacarosa.Figure 13 shows the FTIR spectra of S1 and the best match lean bciibalioteca, d lean sucrose.
La Figura 14 muestra los espectros de FTIR de S2 y la mejor coincid lean bciibalioteca, d lea sacarosa.Figure 14 shows the FTIR spectra of S2 and the best match lean bciibalioteca, d lean sucrose.
La Figura 15 muestra los espectros de FTIR de S3 y la mejor coincid lean bciibalioteca, de l dextrano.Figure 15 shows the FTIR spectra of S3 and the best match of dextran.
La Figura 16 muestra los espectros de RMN 1H de la preparación S1 1Figure 16 shows the 1H NMR spectra of preparation S1 1
La Figura 17 muestra los espectros de RMN 1H de la preparación S21Figure 17 shows the 1H NMR spectra of preparation S21
La Figura 18 muestra los espectros de RMN 1H de la preparación S31Figure 18 shows the 1H NMR spectra of preparation S31
La Figura 19 muestra los espectros de RMN 13C de la preparación S1 1Figure 19 shows the 13C NMR spectra of preparation S1 1
La Figura 20 muestra los espectros de RMN 13C de la preparación S2 1Figure 20 shows the 13C NMR spectra of preparation S2 1
La Figura 21 muestra los espectros de RMN 13C de la preparación S3 1Figure 21 shows the 13C NMR spectra of preparation S3 1
La Figura 22 muestra la comparación de datos sin procesar para las tres muestras (liofilizadas)Figure 22 shows the comparison of raw data for the three samples (lyophilized)
La Figura 23 muestra la superposición de desplazamiento de los datos de las tres muestras (dos repeticiones para S3)Figure 23 shows the displacement overlay of the data from the three samples (two replicates for S3)
La Figura 24 muestra el termograma de TGA de S1, S2 y S3 en condiciones de purga de nitrógeno. Figure 24 shows the TGA thermogram of S1, S2 and S3 under nitrogen purge conditions.
La Figura 25 muestra termogramas de DSC de S1, S2 y S3.Figure 25 shows DSC thermograms of S1, S2 and S3.
Descripción detallada de la invenciónDetailed description of the invention
En un aspecto, la presente descripción implica una composición acuosa de sacarosa de hierro (FeS) y bicarbonato (FeS-bicarbonato). Los presentes inventores han descubierto que esta composición tiene propiedades beneficiosas. En un aspecto, la composición de FeS-bicarbonato de la presente descripción puede utilizarse como un agente protector renal. Los inventores han descubierto que la composición de FeS-bicarbonato según aspectos de la descripción se absorbe preferiblemente en el riñón en comparación con las formas disponibles comercialmente de FeS. Además, los inventores han descubierto que FeS-bicarbonato da como resultado una regulación positiva preferencial de la(s) molécula(s) protectora(s) del riñón en relación con el FeS solo. En otro aspecto, la composición de FeS-bicarbonato de la presente descripción puede combinarse de forma ventajosa con otros agentes protectores renales tales como la protoporfirina de estaño (SnPP) para formar fácilmente agentes protectores renales inyectables.In one aspect, the present disclosure involves an aqueous composition of iron sucrose (FeS) and bicarbonate (FeS-bicarbonate). The present inventors have discovered that this composition has beneficial properties. In one aspect, the FeS-bicarbonate composition of the present disclosure can be used as a kidney protective agent. The inventors have discovered that the FeS-bicarbonate composition according to aspects of the disclosure is preferentially absorbed in the kidney compared to commercially available forms of FeS. Furthermore, the inventors have discovered that FeS-bicarbonate results in preferential upregulation of kidney protective molecule(s) relative to FeS alone. In another aspect, the FeS-bicarbonate composition of the present disclosure can be advantageously combined with other kidney protective agents such as tin protoporphyrin (SnPP) to easily form injectable kidney protective agents.
Una ventaja de utilizar el FeS-bicarbonato es que esta composición da como resultado efectos de protección renal elevados. Específicamente, los inventores encontraron que FeS-bicarbonato se reguló de forma preferencial por las moléculas protectoras renales con respecto a FeS solo. Sin pretender imponer ninguna teoría, los presentes inventores han propuesto que el bicarbonato añadido al FeS puede alterar los niveles relativos de Fe (lll) y Fe (ll) presentes. Debido al enrojecimiento observado en el producto FeS-bicarbonato, los inventores han propuesto que las composiciones de la descripción pueden incluir niveles elevados de Fe (ll). Esto podría explicar los efectos protectores renales elevados, dada la mayor reactividad de Fe (ll) con respecto a Fe (lll).An advantage of using FeS-bicarbonate is that this composition results in high kidney protective effects. Specifically, the inventors found that FeS-bicarbonate was preferentially regulated by renal protective molecules relative to FeS alone. Without wishing to impose any theory, the present inventors have proposed that bicarbonate added to FeS can alter the relative levels of Fe(lll) and Fe(ll) present. Due to the redness observed in the FeS-bicarbonate product, the inventors have proposed that the compositions of the disclosure may include elevated levels of Fe(ll). This could explain the elevated renal protective effects, given the greater reactivity of Fe(ll) with respect to Fe(lll).
Una ventaja de utilizar el FeS-bicarbonato es que el bicarbonato tiene un efecto tamponador. Cuando se utiliza una composición de protoporfirina de estaño, esto puede ser ventajoso, ya que la SnPP se almacena mejor a pH bajo para evitar la dimerización no deseada durante el almacenamiento. Según la presente descripción, la composición de SnPP puede combinarse con la composición de FeS-bicarb en una relación inferior que o igual a aproximadamente 1:1 SnPP:FeS, tal como aproximadamente 1:2, aproximadamente 1:4, aproximadamente 1:8, aproximadamente 1:10, aproximadamente 1:20, aproximadamente 1:50, aproximadamente 1:100, aproximadamente 1:1000, aproximadamente 1:10.000, aproximadamente 1:100.000, aproximadamente 1:1.000.000.An advantage of using FeS-bicarbonate is that the bicarbonate has a buffering effect. When using a tin protoporphyrin composition, this can be advantageous as SnPP is best stored at low pH to avoid unwanted dimerization during storage. According to the present disclosure, the SnPP composition may be combined with the FeS-bicarb composition in a ratio less than or equal to about 1:1 SnPP:FeS, such as about 1:2, about 1:4, about 1:8 , approximately 1:10, approximately 1:20, approximately 1:50, approximately 1:100, approximately 1:1000, approximately 1:10,000, approximately 1:100,000, approximately 1:1,000,000.
En un aspecto, la composición tiene un peso molecular medido mediante la utilización de GPC como se describe en el Ejemplo 1. El PM está preferiblemente dentro del rango de entre 25.000 y 35.000 dáltones, más preferiblemente entre 28.000 y 32.000 dáltones, y con máxima preferencia aproximadamente 29.000 dáltones. El PM está preferiblemente dentro del rango de entre 25.000 y 45.000 dáltones, más preferiblemente entre 30.000 y 40.000 dáltones, aún más preferiblemente entre 33.000 y 38.000 dáltones, y con máxima preferencia aproximadamente 34.000 dáltones. La M está preferiblemente dentro del rango de entre 15.000 y 30.000 dáltones, más preferiblemente entre 20.000 y 25.000 dáltones, y con máxima preferencia aproximadamente 24.000 dáltones. La polidispersidad (PDI) está preferiblemente dentro del rango de 1,35 a 1,60, más preferiblemente dentro del rango de 1,38 a 1,5, aún más preferiblemente dentro del rango de 1,40 a 1,48, y con máxima preferencia aproximadamente 1,4.In one aspect, the composition has a molecular weight measured using GPC as described in Example 1. The MW is preferably within the range of between 25,000 and 35,000 Daltons, more preferably between 28,000 and 32,000 Daltons, and most preferably approximately 29,000 daltons. The MP is preferably within the range of between 25,000 and 45,000 Daltons, more preferably between 30,000 and 40,000 Daltons, even more preferably between 33,000 and 38,000 Daltons, and most preferably about 34,000 Daltons. The M is preferably within the range of between 15,000 and 30,000 Daltons, more preferably between 20,000 and 25,000 Daltons, and most preferably about 24,000 Daltons. The polydispersity (PDI) is preferably within the range of 1.35 to 1.60, more preferably within the range of 1.38 to 1.5, even more preferably within the range of 1.40 to 1.48, and with maximum preference approximately 1.4.
En un aspecto, la composición tiene un potencial zeta estable de -3,0 mV o menos, más preferiblemente -7,0 mV o menos, y con máxima preferencia aproximadamente -10mV. En un aspecto, la composición tiene un carbono orgánico total inferior a 8,5 %, preferiblemente inferior a 8,0 % y, con máxima preferencia, aproximadamente 7,7 %. En un aspecto, la osmolalidad medida según el Ejemplo 1 está dentro del rango de 550 a 1600 m0sm/kg, dentro del rango de 1500 a 1580 mOsm/kg, y con máxima preferencia aproximadamente 1540 m0sm/kg.In one aspect, the composition has a stable zeta potential of -3.0 mV or less, more preferably -7.0 mV or less, and most preferably about -10 mV. In one aspect, the composition has a total organic carbon of less than 8.5%, preferably less than 8.0%, and most preferably about 7.7%. In one aspect, the osmolality measured according to Example 1 is within the range of 550 to 1600 m0sm/kg, within the range of 1500 to 1580 mOsm/kg, and most preferably about 1540 m0sm/kg.
Cualquier ejemplo que quede fuera del alcance de las reivindicaciones se proporciona únicamente con fines comparativos.Any examples outside the scope of the claims are provided for comparative purposes only.
Ejemplo 1Example 1
La presente descripción implica una composición que se prepara disolviendo suficiente complejo de sacarosa de hierro en agua (aproximadamente 3,5 l) para dar una solución de 12 mg/ml (expresada como hierro) cuando se diluye a 6,0 l. La cantidad de sacarosa de hierro necesaria se calculó para el volumen final de líquido, 6100 ml (6,1 l) de modo que la concentración final es 12 mg/ml. Esto requiere 73,2 g de hierro. La potencia de utilización de la sacarosa de hierro es 0,0550. Por lo tanto, se necesita 73,2 g/0,0550 o 1331 g ±1 g de sacarosa de hierro. Se pesó sacarosa de hierro, 1331 g ±1 g directamente en un matraz Erlenmeyer de 6,0 l. Aproximadamente 3-3,5 l de agua se añaden al frasco Erlenmeyer, y el contenido del frasco se agita.The present disclosure involves a composition that is prepared by dissolving sufficient iron sucrose complex in water (approximately 3.5 L) to give a 12 mg/mL solution (expressed as iron) when diluted to 6.0 L. The amount of iron sucrose needed was calculated for the final volume of liquid, 6100 mL (6.1 L) so that the final concentration is 12 mg/mL. This requires 73.2 g of iron. The utilization power of iron sucrose is 0.0550. Therefore, 73.2 g/0.0550 or 1331 g ±1 g of iron sucrose is needed. Iron sucrose, 1331 g ±1 g, was weighed directly into a 6.0 L Erlenmeyer flask. Approximately 3-3.5 l of water is added to the Erlenmeyer flask, and the contents of the flask are shaken.
Se añade bicarbonato de sodio en una cantidad tal que la concentración final de bicarbonato de sodio es 10 mg/ml cuando se diluye a 6,0 l. Se pesa bicarbonato de sodio, 109,8 ± 0,1 g, y se añade al frasco de 6,0 l. Sodium bicarbonate is added in an amount such that the final concentration of sodium bicarbonate is 10 mg/ml when diluted to 6.0 L. Weigh sodium bicarbonate, 109.8 ± 0.1 g, and add it to the 6.0 L flask.
Se añade cloruro de sodio en una cantidad tal que la concentración final de cloruro de sodio es de 9,0 mg/ml tras la dilución. Se pesa cloruro de sodio, 54,9 ± 0,1, y se añade al frasco de 6,0 l. La suspensión se agita durante 30-120 minutos para dar una solución opaca negra.Sodium chloride is added in an amount such that the final concentration of sodium chloride is 9.0 mg/ml after dilution. Weigh sodium chloride, 54.9 ± 0.1, and add it to the 6.0 L flask. The suspension is stirred for 30-120 minutes to give a black opaque solution.
El pH de la solución se controla con un medidor de pH mientras se añade hidróxido de sodio 1M en pequeñas porciones hasta que se alcanza el pH 10,30 y permanece estable. Se añadió hidróxido de sodio, 40,0 ± 0,1 g, a un frasco Erlenmeyer de 1,0 l. Se añade 1,0 ± 0,1 l de agua al frasco Erlenmeyer de 1,0 l y se agita hasta que se disuelve todo el hidróxido de sodio. Se fija una sonda de pH para controlar el pH del frasco Erlenmeyer de 6,0 l y se añade el hidróxido de sodio en<porciones de 100 ml hasta el pH = 10,3 ± 0,1. Después, la solución se agita durante 10 minutos. El pH se comprueba de nuevo transcurridos 10 minutos y, si es necesario, se ajusta a un pH = 10,3 ± 0,1.The pH of the solution is monitored with a pH meter while 1M sodium hydroxide is added in small portions until pH 10.30 is reached and remains stable. Sodium hydroxide, 40.0 ± 0.1 g, was added to a 1.0 L Erlenmeyer flask. Add 1.0 ± 0.1 L of water to the 1.0 L Erlenmeyer flask and shake until all of the sodium hydroxide is dissolved. A pH probe is attached to monitor the pH of the 6.0 L Erlenmeyer flask and sodium hydroxide is added in 100 ml portions until pH = 10.3 ± 0.1. The solution is then stirred for 10 minutes. The pH is checked again after 10 minutes and, if necessary, adjusted to pH = 10.3 ± 0.1.
Después, la solución se transfiere a un frasco preciso volumétricamente y se diluye a 6,1 l con agua. Se utiliza un frasco volumétrico de 2 l dos veces para transferir exactamente 4 l de la solución de pH 10,3 a un frasco Erlenmeyer de 6 l. La solución restante de pH de 10,3 se diluye a 2 l en un frasco volumétrico y se añade al frasco Erlenmeyer de 6 l. Se utiliza el cilindro graduado de 100 ml para añadir 100 ±0,1 ml al frasco Erlenmeyer de 6,0 l, y la solución resultante se agita durante 10 minutos.The solution is then transferred to a volumetrically accurate flask and diluted to 6.1 L with water. A 2 L volumetric flask is used twice to transfer exactly 4 L of the pH 10.3 solution to a 6 L Erlenmeyer flask. The remaining pH 10.3 solution is diluted to 2 L in a volumetric flask and added to the 6 L Erlenmeyer flask. The 100 ml graduated cylinder is used to add 100 ±0.1 ml to the 6.0 L Erlenmeyer flask, and the resulting solution is shaken for 10 minutes.
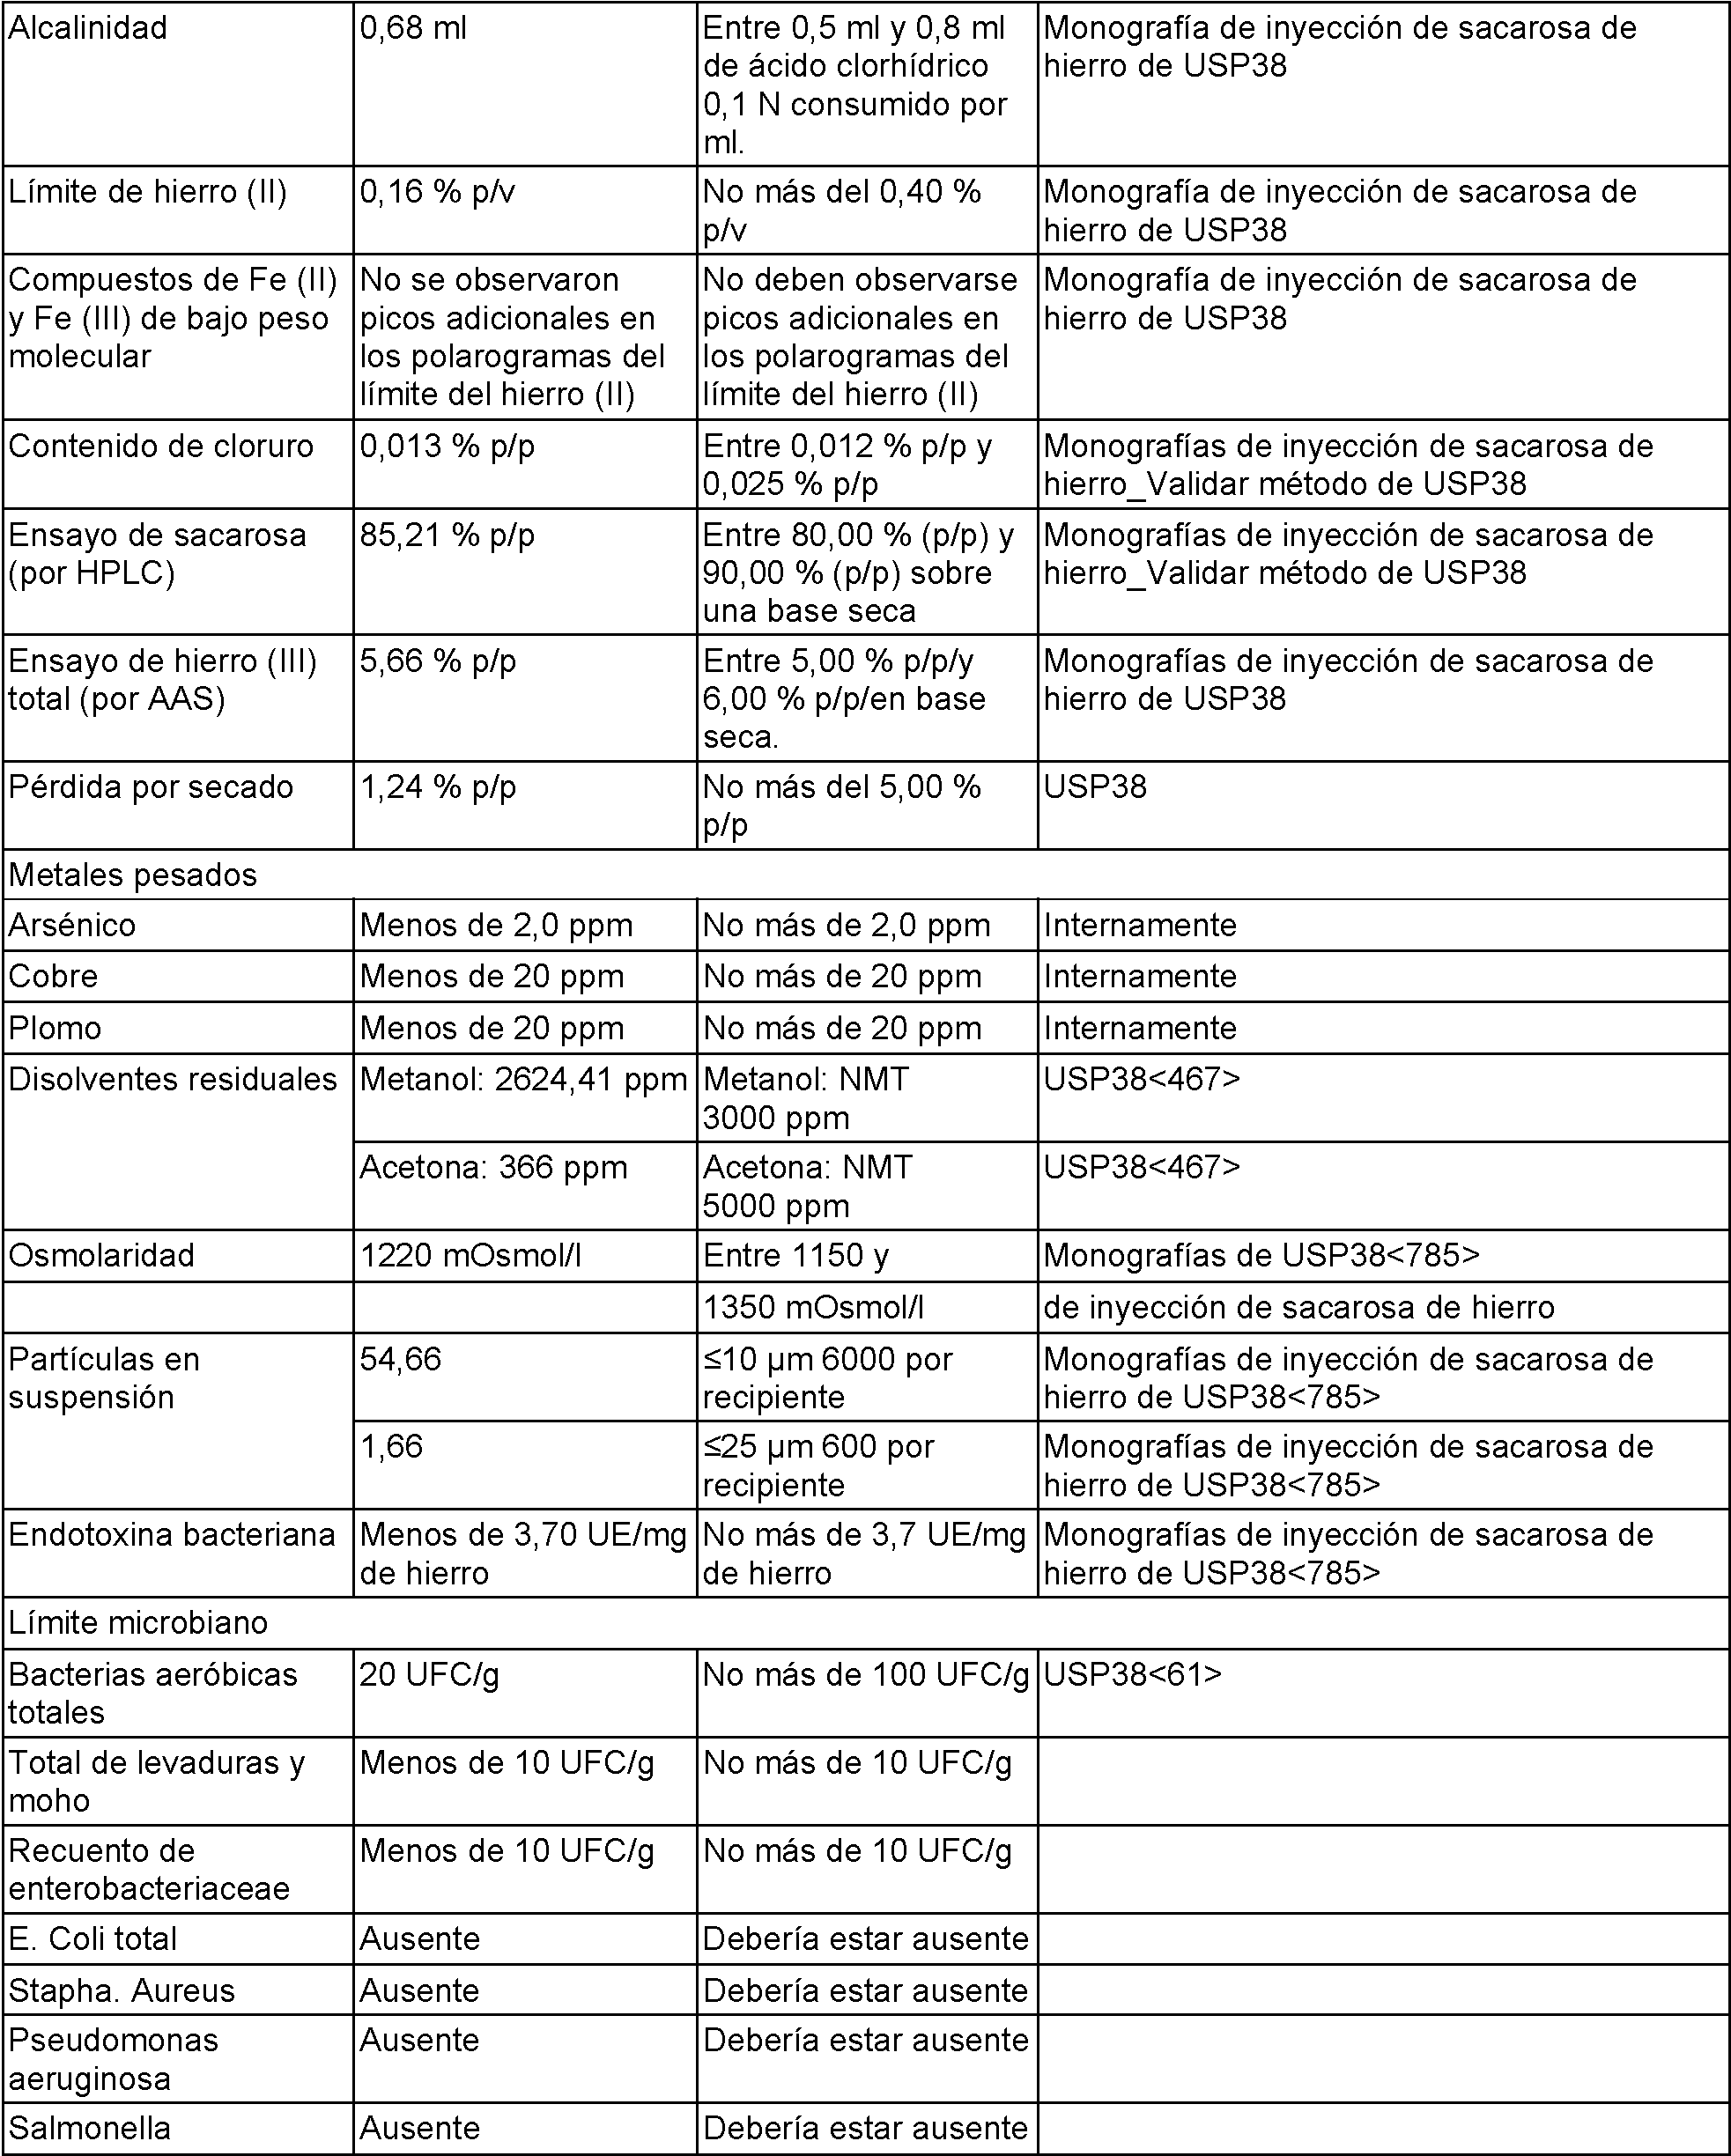
La solución de producto resultante parece de rojo oscuro a marrón. Dos isótopos de hierro están presentes en la preparación de la muestra en una relación consistente con la de la preparación estándar. El material resultante tenía un pH de 10,3, que está dentro de los límites preferidos de 10,1-10,4. El material resultante tenía 11,5/11,6 partes por mil (mg/ml) de hierro según SOP 174472, que determina el hierro a través de espectroscopía de masas con plasma acoplado inductivamente.The resulting product solution appears dark red to brown. Two isotopes of iron are present in the sample preparation in a ratio consistent with that of the standard preparation. The resulting material had a pH of 10.3, which is within the preferred range of 10.1-10.4. The resulting material had 11.5/11.6 parts per thousand (mg/ml) iron per SOP 174472, which determines iron via inductively coupled plasma mass spectroscopy.
Las propiedades adicionales de la composición resultante se encuentran en la Tabla 1 a continuación:Additional properties of the resulting composition are found in Table 1 below:

(continuación)(continuation)
La composición de FeS-bicarbonato resultante tiene la siguiente estequiometría y constantes físicas se muestran en la Tabla 2 a continuación:The resulting FeS-bicarbonate composition has the following stoichiometry and physical constants are shown in Table 2 below:


Ejemplo 2Example 2
La administración intravenosa de la composición de bicarbonato de hierro de hierro (FeS) del Ejemplo 1 se realizó durante 4 horas y dio como resultado una elevada hemo oxigenasa renal 1 (HO-1) en relación con la composición de sacarosa de hierro (FeS) comercializada con la marca, Venofer®. Los resultados se muestran en la Tabla 3 a continuación.Intravenous administration of the iron sucrose (FeS) composition of Example 1 was performed over 4 hours and resulted in elevated renal heme oxygenase 1 (HO-1) relative to the iron sucrose (FeS) composition. marketed under the brand, Venofer®. The results are shown in Table 3 below.

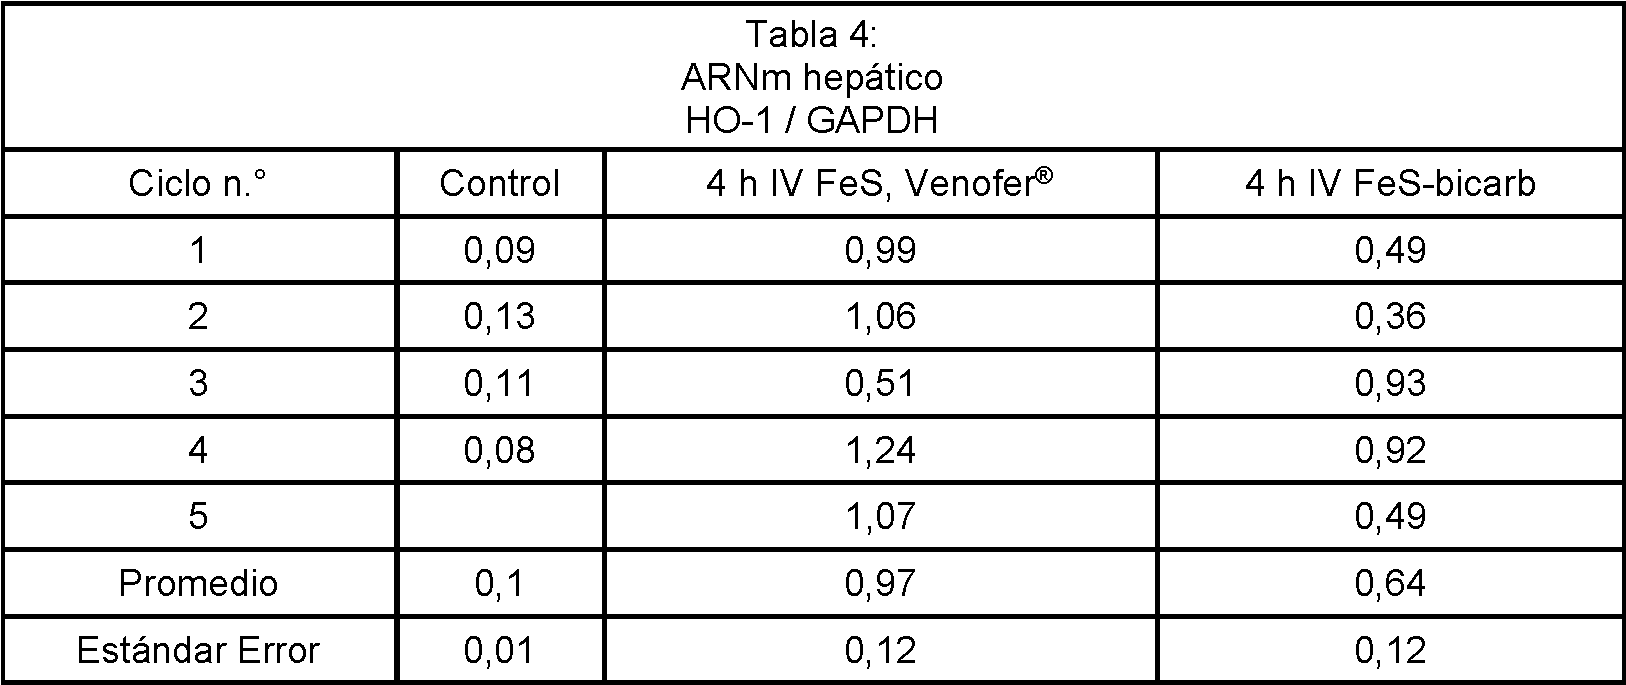
El nivel elevado de HO-1 observado en el riñón no se observó en el hígado. En cambio, no se observó que el nivel de HO-1 aumentara para el FeS-bicarbonato en relación con lo que se observó para Venofer®. Los resultados se muestran en la Tabla 4 a continuación.The elevated HO-1 level observed in the kidney was not observed in the liver. In contrast, the HO-1 level was not observed to increase for FeS-bicarbonate relative to what was observed for Venofer®. The results are shown in Table 4 below.
El BUN y la creatinina en plasma fueron similares para FeS, Venofer® y FeS-bicarbonato como se muestra en las Tablas 5 y 6 más a continuación.Plasma BUN and creatinine were similar for FeS, Venofer® and FeS-bicarbonate as shown in Tables 5 and 6 below.


Ejemplo 3Example 3
La composición de FeS-bicarbonato del Ejemplo 1 se filtró y se colocó en un vial y tenía una concentración de FeS de 12 mg/ml (CoreRx, lote n.° 111002-18011). La osmolaridad de esta solución de 12 mg/ml fue de 831 mOsm. Para la inyección de sacarosa de 20 mg/ml de Venofer®, American Regent, Lote núm. 8243A, la osmolaridad fue de 1742 mOsm. Estas mediciones de osmolaridad se realizaron sin dilución.The FeS-bicarbonate composition of Example 1 was filtered and placed in a vial and had an FeS concentration of 12 mg/ml (CoreRx, lot # 111002-18011). The osmolarity of this 12 mg/ml solution was 831 mOsm. For Venofer® 20 mg/ml sucrose injection, American Regent, Lot no. 8243A, the osmolarity was 1742 mOsm. These osmolarity measurements were performed without dilution.
Ejemplo 4Example 4
En la Figura 2 y la Tabla 7 se muestra una transferencia Western de riñón a las 18 horas después de la administración de composiciones acuosas de hierro:A Western blot of kidney at 18 hours after administration of aqueous iron compositions is shown in Figure 2 and Table 7:
Tabla 7Table 7

(continuación)(continuation)

A la izquierda, hay una transferencia Western específica de cadena pesada de riñón a las 18 h después de SnPP, FeS (Venofer) o Fe+ SnPP. N = control normal. Glyc es glicerol, utilizado como control de ferritina de cadena H positiva. N= muestras normales (controles). Como es evidente, el Fe induce un aumento de la cadena pesada en el riñón.On the left, there is a kidney heavy chain-specific Western blot at 18 h after SnPP, FeS (Venofer), or Fe+ SnPP. N = normal control. Glyc is glycerol, used as a control for H-positive chain ferritin. N= normal samples (controls). As is evident, Fe induces an increase in the heavy chain in the kidney.
Ejemplo 5Example 5
Un paciente que padece enfermedad renal crónica se trata mediante inyección intravenosa utilizando la composición de hierro acuosa de sacarosa de hierro y bicarbonato del ejemplo 1.A patient suffering from chronic kidney disease is treated by intravenous injection using the aqueous iron sucrose and bicarbonate iron composition of Example 1.
Ejemplo 6Example 6
Un paciente sometido a trasplante de órganos se trata mediante inyección intravenosa utilizando la composición de hierro acuosa de sacarosa de hierro y bicarbonato del ejemplo 1.A patient undergoing organ transplantation is treated by intravenous injection using the aqueous iron sucrose and bicarbonate iron composition of Example 1.
Ejemplo 7Example 7
Un paciente sometido A trasplante de órganos se trata mediante inyección intravenosa utilizando la composición de hierro acuosa de sacarosa de hierro y bicarbonato del ejemplo 1, en combinación con protoporfirina de estaño. Ejemplo 8A patient undergoing organ transplantation is treated by intravenous injection using the aqueous iron sucrose iron bicarbonate composition of Example 1, in combination with tin protoporphyrin. Example 8
Se caracterizaron tres muestras de hierro-sacarosa (S1, S2) e hierro-dextrano (S3) mediante una variedad de técnicas analíticas. S1 se preparó según el Ejemplo 1 anterior. S2 es el producto disponible comercialmente, Venofer® (inyección de sacarosa de hierro). S3 es el producto disponible comercialmente INFeD® (Inyección de dextrano de hierro). Los resultados se resumen en la Tabla 8 a continuación.Three samples of iron-sucrose (S1, S2) and iron-dextran (S3) were characterized using a variety of analytical techniques. S1 was prepared according to Example 1 above. S2 is the commercially available product, Venofer® (iron sucrose injection). S3 is the commercially available product INFeD® (Iron Dextran Injection). The results are summarized in Table 8 below.

connuac nconnuac n


Finalmente, la muestra recibida S1 se tituló por triplicado con HCl diluido para determinar el valor de hidróxido en solución inyectable de hierro-sacarosa. Los puntos finales de las valoraciones volumétricas tuvieron pH = 7,0. Partiendo del supuesto de que todas las especies básicas valoradas volumétricamente procedían del hidróxido asociado a los núcleos de oxihidróxido férrico, se supuso que el número total de moles de H+ utilizados en la valoración volumétrica era igual al número de moles de OH-. Considerando el TOC, y el PM (o M) por GPC, la fórmula molecular de la sacarosa de hierro en S1 se calculó como sigue:Finally, the received sample S1 was titrated in triplicate with diluted HCl to determine the hydroxide value in iron-sucrose injection solution. The end points of the volumetric titrations had pH = 7.0. Starting from the assumption that all the basic species titrated volumetrically came from the hydroxide associated with the ferric oxyhydroxide nuclei, it was assumed that the total number of moles of H+ used in the volumetric titration was equal to the number of moles of OH-. Considering the TOC, and the MW (or M) by GPC, the molecular formula of iron sucrose in S1 was calculated as follows:
Cálculo basado en PM: [Na6Fe5O8(OH)5 ■ 3H2O]13 ■ 73(C12H22O11) Cálculo basado en Mn: [Na6Fe5O8(OH)5 ■ 3H2O]9 ■ 51(C12H22Oll). La Tabla 9 a continuación muestra detalles de la preparación e identificación de muestras.Calculation based on MW: [Na6Fe5O8(OH)5 ■ 3H2O]13 ■ 73(C12H22O11) Calculation based on Mn: [Na6Fe5O8(OH)5 ■ 3H 2 O]9 ■ 51(C12H22Oll). Table 9 below shows details of sample preparation and identification.

Preparación de muestras: Las muestras se liofilizaron hasta un residuo seco antes del análisis a menos que se indique lo contrario.Sample Preparation: Samples were lyophilized to a dry residue before analysis unless otherwise indicated.
Cromatografía de permeación en Gel (GPC): LA GPC se utiliza para determinar la distribución de peso molecular de los polímeros. En el análisis de GPC, una solución del polímero se pasa a través de una columna compactada con un gel poroso. La muestra se separa en función del tamaño molecular con moléculas más grandes que eluyen más rápidamente que las moléculas más pequeñas. El tiempo de retención de cada componente se detecta y se compara con una curva de calibración, y los datos resultantes se usan entonces para calcular la distribución de peso molecular para la muestra.Gel Permeation Chromatography (GPC): GPC is used to determine the molecular weight distribution of polymers. In GPC analysis, a solution of the polymer is passed through a column packed with a porous gel. The sample is separated based on molecular size with larger molecules eluting more quickly than smaller molecules. The retention time of each component is detected and is compared to a calibration curve, and the resulting data is then used to calculate the molecular weight distribution for the sample.
Una distribución de pesos moleculares en lugar de un peso molecular único es característica de todos los tipos de polímeros sintéticos. Para caracterizar esta distribución, se utilizan promedios estadísticos. El más común de estos promedios es el “ peso molecular promedio en número” (M) y el “ peso molecular promedio en peso” (PM).A molecular weight distribution rather than a single molecular weight is characteristic of all types of synthetic polymers. To characterize this distribution, statistical averages are used. The most common of these averages are the “number average molecular weight” (M) and the “weight average molecular weight” (WW).
El peso molecular promedio en número es similar a la media aritmética estándar asociada a un grupo de números. Cuando se aplica a polímeros, el peso molecular promedio en número se refiere al peso molecular promedio de las moléculas en el polímero. El peso molecular promedio en número se establece dando la misma cantidad de significancia a cada molécula independientemente de su peso molecular individual. El peso molecular promedio en número se establece mediante la siguiente fórmula donde Ni es el número de moléculas con una masa molar igual a Mi.The number average molecular weight is similar to the standard arithmetic mean associated with a group of numbers. When applied to polymers, number average molecular weight refers to the average molecular weight of the molecules in the polymer. The number average molecular weight is established by giving the same amount of significance to each molecule regardless of its individual molecular weight. The number average molecular weight is established by the following formula where Ni is the number of molecules with a molar mass equal to Mi.

Un cálculo ligeramente diferente y un significado mucho diferente es el peso molecular promedio en peso, PM. El peso molecular promedio en peso es otro descriptor estadístico de la distribución de peso molecular que proporciona más importancia a las moléculas más grandes que a las moléculas más pequeñas de la distribución. La siguiente fórmula muestra el cálculo estadístico del peso molecular promedio en peso.A slightly different calculation and much different meaning is weight average molecular weight, MW. Weight average molecular weight is another statistical descriptor of the molecular weight distribution that gives more weight to larger molecules than to smaller molecules in the distribution. The following formula shows the statistical calculation of the weight average molecular weight.

Para GPC, las muestras se prepararon diluyendo en tampón fosfato (según el método de la monografía de la USP) y se analizaron para determinar las distribuciones de peso molecular en cada muestra. Los resultados se resumen a continuación en las Tablas 10-12. Los cromatogramas representativos del análisis se presentan en las Figuras 3-9. Existen dos razones generales para el peso molecular promedio en peso. En primer lugar, si se compara, por ejemplo, la tenacidad, las moléculas más largas influyen en la tenacidad de la distribución del polímero más de las moléculas más cortas realizadas. El cálculo del peso molecular promedio en peso da énfasis a estas moléculas más largas, y proporciona un número comparativo que puede describir la contribución relativa de las moléculas largas presentes en una distribución de peso molecular. El peso molecular promedio en peso también es un número que está directamente correlacionado con la determinación del peso molecular de los polímeros mediante dispersión de luz, dispersión de neutrones de ángulo pequeño (SANS) y velocidad de sedimentación.For GPC, samples were prepared by diluting in phosphate buffer (according to the USP monograph method) and analyzed to determine molecular weight distributions in each sample. The results are summarized below in Tables 10-12. Representative chromatograms of the analysis are presented in Figures 3-9. There are two general ratios for the weight average molecular weight. Firstly, if you compare, for example, toughness, longer molecules influence the toughness of the polymer distribution more than shorter molecules made. Calculating the weight average molecular weight gives emphasis to these longer molecules, and provides a comparative number that can describe the relative contribution of the long molecules present in a molecular weight distribution. The weight average molecular weight is also a number that is directly correlated to the determination of the molecular weight of polymers by light scattering, small angle neutron scattering (SANS), and sedimentation velocity.
En segundo lugar, el peso molecular promedio en peso proporciona información de la forma de una distribución de peso molecular. Este valor, en relación con el peso molecular promedio en número, proporciona una determinación de la relación de la ampliación de la distribución de peso molecular denominada como el índice de polidispersidad o PI. El PI se define como la relación de PM/M. Cuanto mayor sea el PI, más dispersa es la distribución. El valor más bajo de PI puede ser 1. Esto representa una muestra monodispersa, un polímero con todas las moléculas en la distribución que es el mismo peso molecular.Second, the weight average molecular weight provides information on the shape of a molecular weight distribution. This value, relative to the number average molecular weight, provides a determination of the ratio of the broadening of the molecular weight distribution referred to as the polydispersity index or PI. The PI is defined as the PM/M ratio. The larger the PI, the more dispersed the distribution. The lowest PI value can be 1. This represents a monodisperse sample, a polymer with all molecules in the distribution being the same molecular weight.
El “ peso molecular promedio z” (Mz) no es tan común, pero también se proporciona. Este promedio del peso molecular es un valor que describe aún más la distribución del peso molecular. Este valor puede determinarse fácilmente a partir del equilibrio de sedimentación.The “z-average molecular weight” (Mz) is not as common, but is also given. This average molecular weight is a value that further describes the molecular weight distribution. This value can be easily determined from the sedimentation equilibrium.
También se incluye a veces el peso molecular máximo, Mp. El valor del peso molecular máximo se define como el modo de distribución del peso molecular. Indica el peso molecular que es más abundante en la distribución. Este valor también proporciona información de la distribución del peso molecular.The maximum molecular weight, Mp, is also sometimes included. The maximum molecular weight value is defined as the mode of molecular weight distribution. Indicates the molecular weight that is most abundant in the distribution. This value also provides information on the molecular weight distribution.
La mayoría de las mediciones de GPC se realizan en relación con un patrón de polímero diferente (normalmente poliestireno). La precisión de los resultados depende de lo estrechamente que las características del polímero que se analizan coincidan con las de la norma usada. El error esperado en reproducibilidad entre diferentes series de determinaciones, calibrado por separado, es aproximadamente un 5-10 % y es característico de la precisión limitada de las determinaciones de GPC. Por lo tanto, los resultados de GPC son más útiles cuando se realiza una comparación entre la distribución de peso molecular de diferentes muestras durante la misma serie de determinaciones. Most GPC measurements are made relative to a different polymer standard (typically polystyrene). The precision of the results depends on how closely the characteristics of the polymer being analyzed match those of the standard used. The expected error in reproducibility between different series of determinations, calibrated separately, is approximately 5-10% and is characteristic of the limited precision of GPC determinations. Therefore, GPC results are most useful when a comparison is made between the molecular weight distribution of different samples during the same series of determinations.
Las precisiones y sesgo de GPC se basan en datos estadísticos tales como un promedio de mediciones, desviación estándar, diferencia de porcentaje relativa y/o porcentaje de desviación estándar relativa. Para los análisis cuantitativos, las cantidades enumeradas en las tablas anteriores se referenciaron a una cantidad conocida de estándar y son cuantitativas. Se prepararon curvas de calibración y se hace referencia a la desviación estándar relativa y la información de diferencia porcentual relativa en el informe anterior. Para la reproducibilidad típica semicuantitativa, según lo determinado por el control del proceso estadístico del sistema de medición se estima en aproximadamente el 10 % (con un nivel de confianza del 95 %, k ~2). Esta reproducibilidad es una estimación de la incertidumbre de una única medición estándar a lo largo del tiempo, y la incertidumbre en una medición específica debe determinarse caso por caso. Para los análisis cualitativos, los estándares de referencia analítica no se analizaron para confirmar la presencia de los componentes individuales. En tales casos, no es posible asignar un valor numérico a la “ incertidumbre” de las coincidencias proporcionadas.GPC accuracies and bias are based on statistical data such as an average of measurements, standard deviation, relative percentage difference, and/or relative standard deviation percentage. For quantitative analyses, the quantities listed in the tables above were referenced to a known quantity of standard and are quantitative. Calibration curves were prepared and reference is made to the relative standard deviation and relative percentage difference information in the previous report. For typical semiquantitative reproducibility, as determined by statistical process control of the measurement system, it is estimated to be approximately 10% (at a 95% confidence level, k ~2). This reproducibility is an estimate of the uncertainty of a single standard measurement over time, and the uncertainty in a specific measurement must be determined on a case-by-case basis. For qualitative analyses, analytical reference standards were not analyzed to confirm the presence of individual components. In such cases, it is not possible to assign a numerical value to the “uncertainty” of the matches provided.
Obsérvese que las muestras S1 y S2 contenían dos picos con distribuciones de peso molecular únicas mientras que la muestra S3 contenía tres picos. Obsérvese también que un Mp no pudo calcularse para el “ Pico 2” (pico de molécula pequeña, probablemente sacarosa) porque el pico saturó el detector; las muestras se analizaron a una concentración que fue apropiada para la caracterización de las especies de mayor peso molecular, con el gasto de saturación del detector con las especies de menor peso molecular de menor interés.Note that samples S1 and S2 contained two peaks with unique molecular weight distributions while sample S3 contained three peaks. Note also that an Mp could not be calculated for “Peak 2” (small molecule peak, probably sucrose) because the peak saturated the detector; Samples were analyzed at a concentration that was appropriate for characterization of the higher molecular weight species, with the detector saturating the lower molecular weight species of less interest.


connuac nconnuac n


Dispersión dinámica de la luzDynamic light dispersion
El análisis PSD se realizó con un difractar láser. La medición calcula una distribución de volumen a partir del patrón de difracción láser de una nube de partículas. A continuación, estos datos de dispersión sin procesar se procesan con un algoritmo y se presentan sobre la base del diámetro esférico equivalente. Los resultados se han resumido en una base de volumen (masa) en un histograma que proporciona el porcentaje de volumen diferencial menor y mayor que el tamaño indicado.PSD analysis was performed with a laser diffraction. The measurement calculates a volume distribution from the laser diffraction pattern of a particle cloud. This raw scattering data is then processed with an algorithm and presented on the basis of equivalent spherical diameter. The results have been summarized on a volume (mass) basis in a histogram that provides the percentage of differential volume smaller and larger than the indicated size.
El análisis del tamaño de las partículas se realizó en un instrumento de dispersión dinámica de la luz (DLS) Malvern® Zetasizer Nano ZS. d Ls es una técnica de conjunto que analiza la luz dispersada por partículas que se mueven en movimiento browniano y genera una distribución de tamaño de partícula basada en la velocidad de difusión de la partícula. Los datos de dispersión sin procesar se procesan utilizando un algoritmo complejo y se presentan sobre la base de un diámetro hidrodinámico ponderado por intensidad. La técnica analítica se resume en la ISO 22412:2008 Particle Size Analysis - Dynamic Light Scattering (DLS), así como en la ASTM E2490-09(2015) Standard Guide for Measurement of Particle Size Distribution of Nanomaterials in Suspension by Photon Correlation Spectroscopy (PCS).Particle size analysis was performed on a Malvern® Zetasizer Nano ZS dynamic light scattering (DLS) instrument. d Ls is an ensemble technique that analyzes light scattered by particles moving in Brownian motion and generates a particle size distribution based on the diffusion rate of the particle. The raw dispersion data are processed using a complex algorithm and presented on the basis of an intensity-weighted hydrodynamic diameter. The analytical technique is summarized in ISO 22412:2008 Particle Size Analysis - Dynamic Light Scattering (DLS), as well as in ASTM E2490-09(2015) Standard Guide for Measurement of Particle Size Distribution of Nanomaterials in Suspension by Photon Correlation Spectroscopy ( PCS).
Las muestras recibidas fueron agua para inyección (WFI) y se analizaron mediante DLS para dar la dimensión física global de las partículas. Los resultados ponderados de intensidad y volumen del análisis se presentan en la Tabla 13 y la Tabla 14, respectivamente.The samples received were water for injection (WFI) and were analyzed by DLS to give the overall physical dimension of the particles. The weighted intensity and volume results of the analysis are presented in Table 13 and Table 14, respectively.


Potencial zetaZeta potential
Las muestras se prepararon para el potencial zeta mediante dilución en tampón (el instrumento no pudo lograr lecturas estables cuando se diluyó en NaCl 10 nm por nanomateriales 2018, 8, 25). El pH y la temperatura se registraron en el momento del análisis de potencial zeta. Los resultados se resumen de la Tabla 6 a la Tabla 8 a continuación. No se pudo obtener una lectura estable de S2. Los resultados del ensayo de potencial zeta se presentan en las Tablas 15-17.Samples were prepared for zeta potential by dilution in buffer (the instrument was unable to achieve stable readings when diluted in 10 nm NaCl by nanomaterials 2018, 8, 25). pH and temperature were recorded at the time of zeta potential analysis. The results are summarized from Table 6 to Table 8 below. Could not obtain a stable reading of S2. The results of the zeta potential test are presented in Tables 15-17.


Microscopía de fuerza atómica (afm)Atomic force microscopy (afm)
Las muestras tal como se recibieron se diluyeron 50x utilizando agua filtrada MilliQ (18,2 MQ/cm, 4ppb T0C). Aproximadamente 10 j l de estas soluciones diluidas se depositaron sobre piezas recién cortadas de mica y se dejaron incubar durante aproximadamente un minuto. A continuación, las muestras se enjuagaron 5x con agua MilliQ y se secaron con nitrógeno. Se obtuvieron imágenes de dos áreas de 1 jm x 1 jm en cada muestra. Las diferencias topográficas de estas imágenes se presentan en colores donde el color marrón es bajo y el blanco es alto. Los rangos z se indican en la barra de escala vertical a la derecha de las imágenes. También se incluyen vistas en perspectiva (3-D) de estas superficies con exageraciones verticales señaladas en los pies de foto.As-received samples were diluted 50x using MilliQ filtered water (18.2 MQ/cm, 4ppb T0C). Approximately 10 μl of these diluted solutions were deposited on freshly cut pieces of mica and allowed to incubate for approximately one minute. The samples were then rinsed 5x with MilliQ water and dried with nitrogen. Images were obtained from two 1 jm x 1 jm areas in each sample. The topographical differences in these images are presented in colors where brown is low and white is high. Z ranges are indicated on the vertical scale bar to the right of the images. Also included are perspective (3-D) views of these surfaces with vertical exaggerations noted in the photo captions.
Se realizaron análisis del tamaño de partícula para caracterizar las alturas de las partículas presentes dentro de cada área. Se utilizó un umbral de altura de 0,5 nm para identificar las partículas de interés mientras se excluye las características no representativas. La altura máxima, la altura mínima y los resultados de la altura media se resumen en la Tabla 18.Particle size analyzes were performed to characterize the heights of particles present within each area. A height threshold of 0.5 nm was used to identify particles of interest while excluding non-representative features. The maximum height, minimum height and average height results are summarized in Table 18.
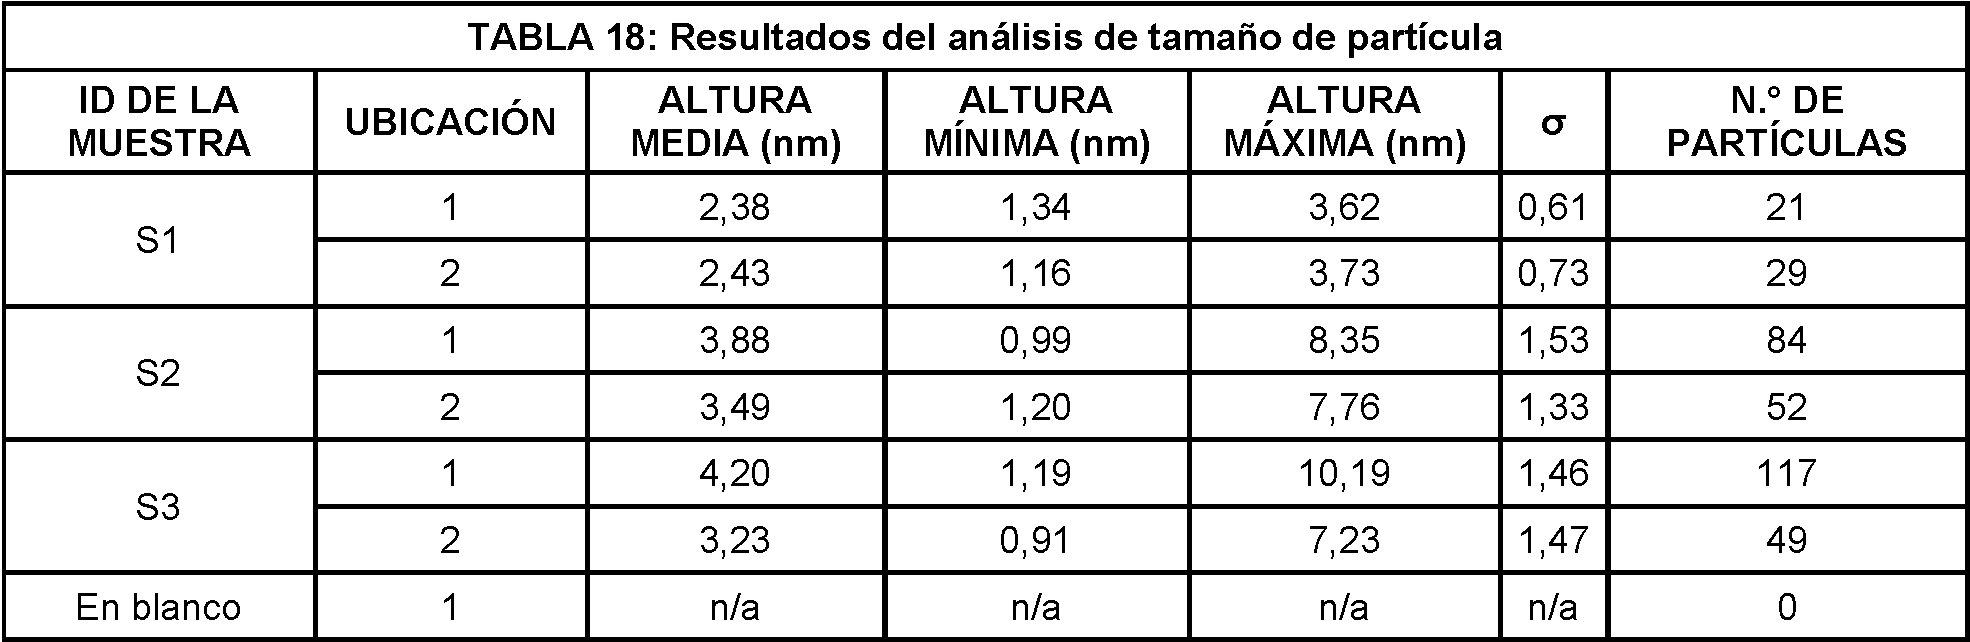
Se realizaron análisis de sección para medir manualmente las alturas de las partículas representativas. El análisis seccional para S1 en la ubicación 1 se muestra en las Figuras 10, 11 y 12. Los resultados se resumen en la Tabla 19 para cada uno de S1, S2, un S3.Section analyzes were performed to manually measure the heights of representative particles. The sectional analysis for S1 at location 1 is shown in Figures 10, 11 and 12. The results are summarized in Table 19 for each of S1, S2, and S3.


Carbón orgánico total (toc)Total organic carbon (toc)
El carbono orgánico total (TOC) en las muestras se calculó restando el carbono inorgánico del carbono total (determinado mediante la utilización del analizador de carbono de combustión). Los resultados se resumen en la Tabla 20 a continuación.Total organic carbon (TOC) in the samples was calculated by subtracting inorganic carbon from total carbon (determined by using the combustion carbon analyzer). The results are summarized in Table 20 below.

OsmolalidadOsmolality
La osmolalidad de las muestras se midió utilizando el método de presión de vapor. El método de presión de vapor determina la osmolalidad a temperatura ambiente con la muestra en equilibrio natural. Los resultados de la prueba de osmolalidad se resumen en la Tabla 21.The osmolality of the samples was measured using the vapor pressure method. The vapor pressure method determines the osmolality at room temperature with the sample in natural equilibrium. The results of the osmolality test are summarized in Table 21.

Fe+3 vs. Fe+2 Fe+3 vs. Fe+2
Una alícuota de cada muestra se diluyó en ácido clorhídrico concentrado según la referencia del método proporcionada por el cliente, Gupta y col.1 Las muestras se analizaron según el método descrito por Stookey.2 Los resultados se muestran en la Tabla 22.An aliquot of each sample was diluted in concentrated hydrochloric acid according to the method reference provided by the client, Gupta et al.1 The samples were analyzed according to the method described by Stookey.2 The results are shown in Table 22.

Análisis elemental por espectrometría de masas/plasma acoplado inductivamente (icp/ms) y contenido total de hierro y sodio por espectroscopia de emisión óptica/plasma acoplado inductivamente (icp/oes)Elemental analysis by inductively coupled plasma/mass spectrometry (icp/ms) and total iron and sodium content by optical emission spectroscopy/inductively coupled plasma (icp/oes)
ICP/OES es una técnica espectroscópica utilizada para identificar y cuantificar componentes por elementos. En ICP, el acoplamiento inductivo transfiere energía de alta frecuencia a un flujo de gas inerte, que contiene la muestra como aerosol. La energía hace que el aerosol se vaporice, mientras que excita los átomos libres resultantes para que emitan luz. La intensidad de esta luz se relaciona entonces con la concentración de los átomos emisores. Esta técnica requiere la calibración del instrumento y una verificación de calibración de segunda fuente antes, durante y después de la finalización de la secuencia de ejecución analítica. Además, los instrumentos en blanco siguen cada estándar de verificación. Esto asegura que no se lleve a cabo durante la secuencia analítica. Las mediciones de concentración de los elementos principales realizados por ICP tienen una incertidumbre típicamente en el intervalo del 3 al 5 % (con un nivel de confianza del 95 %). La incertidumbre en las concentraciones de oligoelementos podría ser significativamente mayor.ICP/OES is a spectroscopic technique used to identify and quantify components by elements. In ICP, inductive coupling transfers high-frequency energy to a flow of inert gas, which contains the sample as an aerosol. The energy causes the aerosol to vaporize, while exciting the resulting free atoms to emit light. The intensity of this light is then related to the concentration of the emitting atoms. This technique requires instrument calibration and a second source calibration check before, during, and after completion of the analytical run sequence. Furthermore, blank instruments follow each verification standard. This ensures that it is not carried out during the analytical sequence. Concentration measurements of major elements made by ICP have an uncertainty typically in the range of 3 to 5% (at a 95% confidence level). The uncertainty in trace element concentrations could be significantly higher.
Las muestras S1 a S3 se analizaron mediante ICP-MS para metales y/u otros elementos. Las muestras también se analizaron por ICP-OES para determinar el contenido total de hierro y sodio. Las muestras se analizaron tal como se recibieron por triplicado. Los resultados se resumen en las Tablas 23-25.Samples S1 to S3 were analyzed by ICP-MS for metals and/or other elements. Samples were also analyzed by ICP-OES to determine total iron and sodium content. Samples were analyzed as received in triplicate. The results are summarized in Tables 23-25.


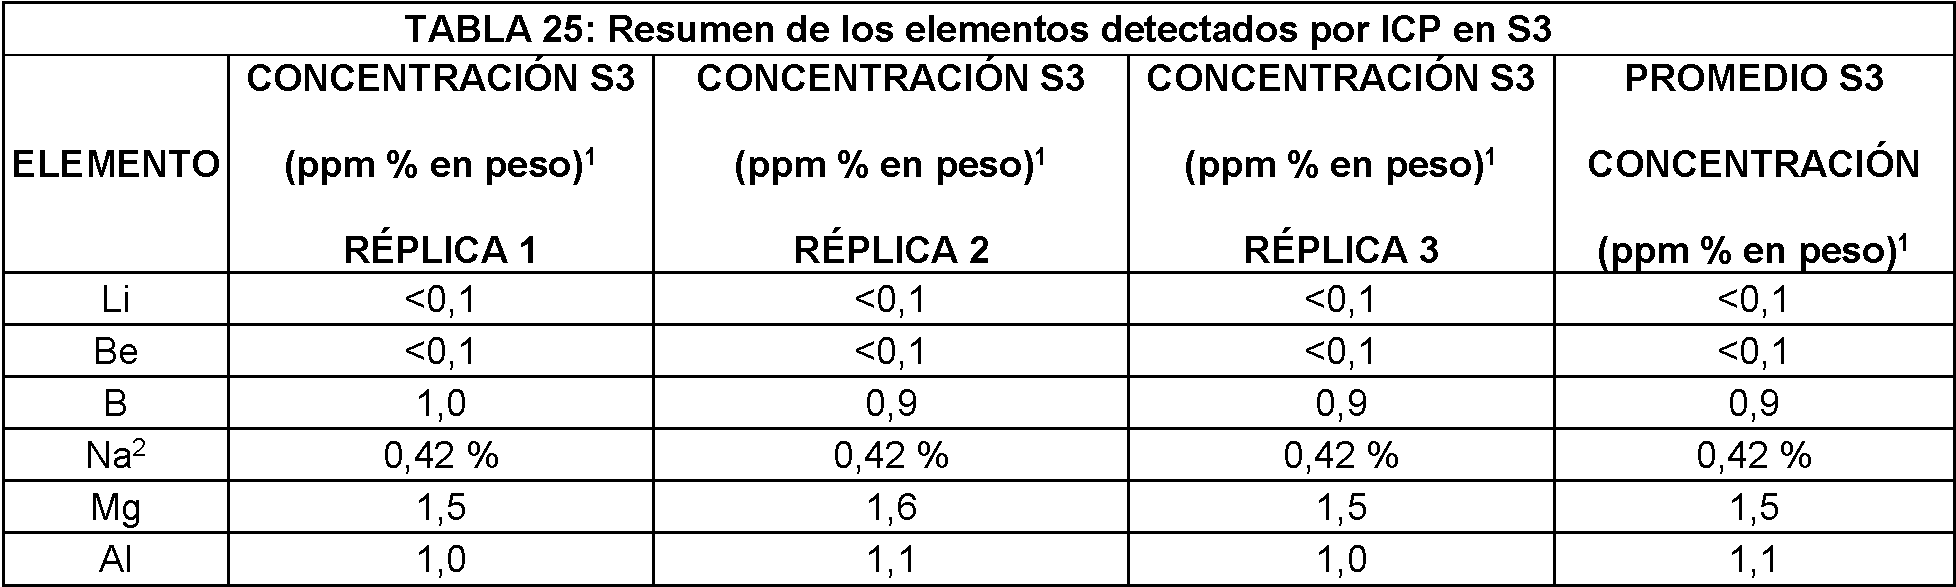


Espectroscopia infrarroja por transformada de fourier (ft-ir)Fourier transform infrared spectroscopy (ft-ir)
La espectroscopía infrarroja por transformada de Fourier (FT-IR) es una herramienta de elección para la identificación de materiales. En FT-IR, las bandas de absorción de infrarrojos se asignan a grupos funcionales característicos. Basándose en la presencia de varias de tales bandas, puede identificarse el material en cuestión. La disponibilidad de espectros de compuestos conocidos aumenta la probabilidad de realizar una identificación positiva. Las muestras liofilizadas se analizaron mediante reflectancia total atenuada horizontal (HATR), basada en la reflexión interna de la radiación infrarroja (IR). El espectro FT-IR de S1 con una coincidencia espectral de biblioteca se presenta en la Figura 13 a continuación. Los datos sugieren que el material es consistente con la sacarosa. Los espectros de FT-IR de S2 y S3 se presentan en la Figura 14 y la Figura 15. La asignación de la absorción frente a los grupos funcionales se muestra en la Tabla 26 -Tabla 28.Fourier transform infrared spectroscopy (FT-IR) is a tool of choice for materials identification. In FT-IR, infrared absorption bands are assigned to characteristic functional groups. Based on the presence of several such bands, the material in question can be identified. The availability of spectra of known compounds increases the probability of making a positive identification. The freeze-dried samples were analyzed by horizontal attenuated total reflectance (HATR), based on the internal reflection of infrared (IR) radiation. The FT-IR spectrum of S1 with a library spectral match is presented in Figure 13 below. The data suggest that the material is consistent with sucrose. The FT-IR spectra of S2 and S3 are presented in Figure 14 and Figure 15. The assignment of absorption versus functional groups is shown in Table 26 -Table 28.


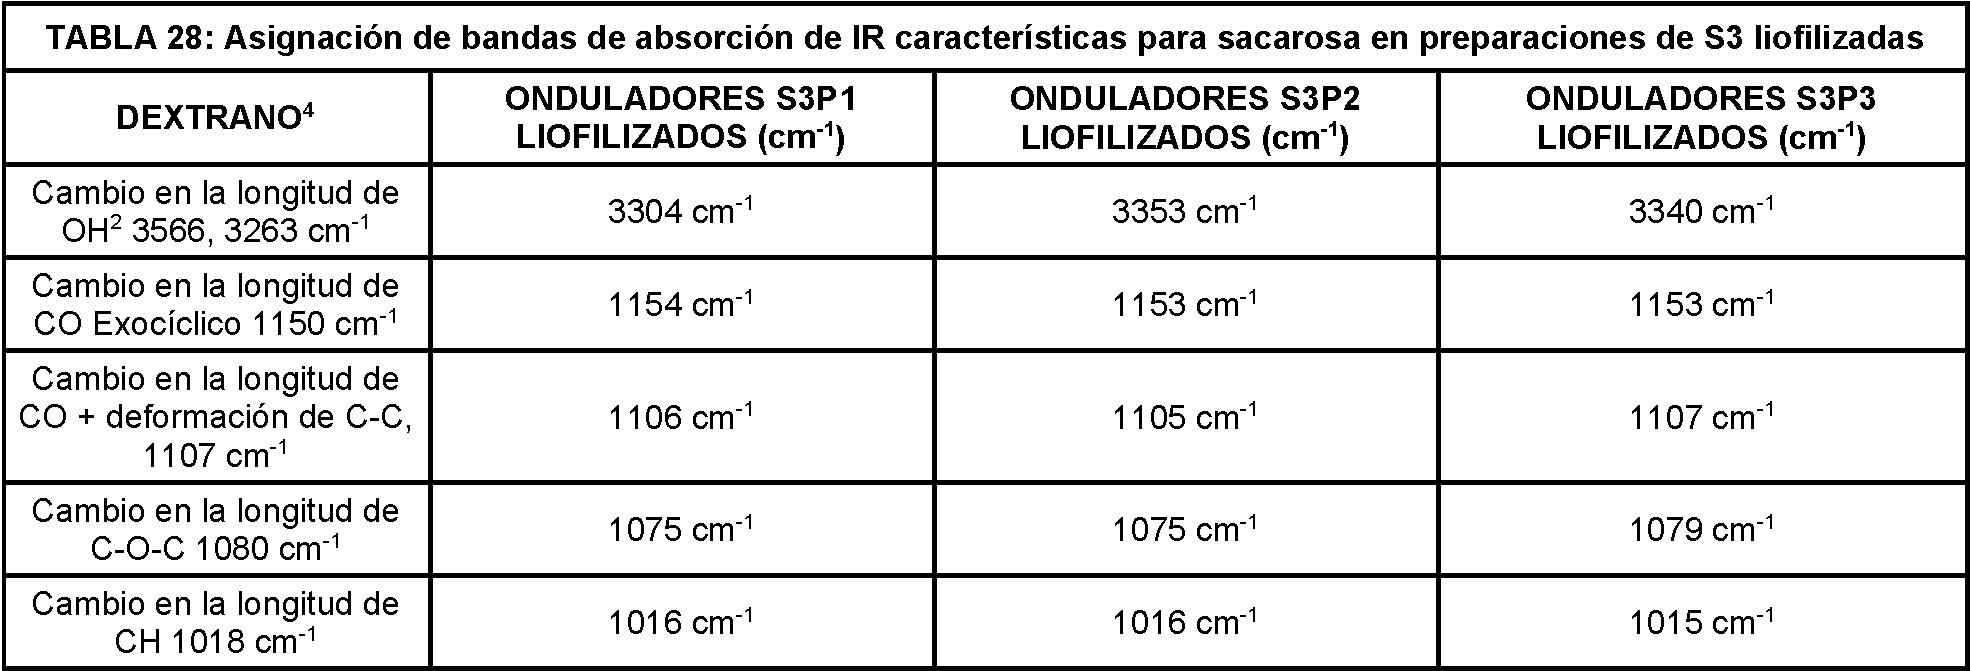
Espectroscopia de resonancia magnética nuclear 1h (rmn)1h Nuclear Magnetic Resonance Spectroscopy (NMR)
La espectroscopia de RMN es un método extremadamente útil para la caracterización de materiales. La RMN es un fenómeno físico basado en la propiedad magnética del núcleo de un átomo. La RMN estudia un núcleo magnético (normalmente el de un átomo de hidrógeno), alineándolo con un campo magnético externo muy potente y perturbando esta alineación mediante un impulso electromagnético. Se registra la respuesta a la perturbación, proporcionando cada núcleo individual una respuesta específica a su entorno químico, electrónico y espacial.NMR spectroscopy is an extremely useful method for materials characterization. NMR is a physical phenomenon based on the magnetic property of the nucleus of an atom. NMR studies a magnetic nucleus (usually that of a hydrogen atom), aligning it with a very powerful external magnetic field and disturbing this alignment using an electromagnetic pulse. The response to the perturbation is recorded, with each individual nucleus providing a specific response to its chemical, electronic and spatial environment.
Las muestras liofilizadas se reconstituyeron en óxido de deuterio (D2O) y se analizaron mediante espectroscopía de RMN 1H. Freeze-dried samples were reconstituted in deuterium oxide (D2O) and analyzed by 1H NMR spectroscopy.

La estructura para sacarosa se muestra anteriormente con la anotación de hidrógeno de la Fórmula (I). La RMN 1H para S1 se muestra en la Tabla 29 a continuación:The structure for sucrose is shown above with the hydrogen annotation of Formula (I). The 1H NMR for S1 is shown in Table 29 below:


Formula (II)Formula (II)
La estructura del dextrano se muestra más arriba con la anotación de hidrógeno de la Fórmula (II). La siguiente Tabla 30 muestra la RMN 1H para S3.The structure of dextran is shown above with the hydrogen annotation of Formula (II). The following Table 30 shows the 1H NMR for S3.

Los espectros de RMN de las muestras preparadas se presentan en las Figuras 16-18. Cuando sea posible, las asignaciones provisionales de los principales desplazamientos químicos observados en los espectros de RMN se basaron en los espectros de referencia de los compuestos relacionados disponibles en la bibliografía.The NMR spectra of the prepared samples are presented in Figures 16-18. Where possible, tentative assignments of the major chemical shifts observed in the NMR spectra were based on reference spectra of related compounds available in the literature.
Los datos indican que la sacarosa está presente en la muestra S1, y los desplazamientos químicos coinciden bien con los informados en la bibliografía. Sin embargo, no se observaron patrones de división de pico, que podrían deberse a múltiples razones tales como la presencia de nanopartículas o el propio hierro paramagnético.The data indicate that sucrose is present in sample S1, and the chemical shifts agree well with those reported in the literature. However, no peak splitting patterns were observed, which could be due to multiple reasons such as the presence of nanoparticles or paramagnetic iron itself.
Los espectros de RMN 1H para la muestra S2 muestran una cantidad significativa de ensanchamiento de los picos. Se desconoce si esto se debe a partículas que crean un mayor número de entornos químicos, o si la naturaleza del hierro en la muestra podría ser responsable de la falta de resolución. Debido a la extensión del ensanchamiento, no se podrían realizar asignaciones de picos. Sin embargo, las intensidades de pico generales y los desplazamientos químicos son consistentes con los observados para sacarosa, ya que se observó una gran respuesta amplia a partir del cambio químico 2,5-4,2 ppm, con un ligero hombro visible en el pico de disolvente cerca de 5,5 ppm.The 1H NMR spectra for sample S2 show a significant amount of peak broadening. It is unknown if this is due to particles creating a larger number of chemical environments, or if the nature of the iron in the sample could be responsible for the lack of resolution. Due to the extent of the broadening, peak assignments could not be made. However, the overall peak intensities and chemical shifts are consistent with those observed for sucrose, as a large broad response was observed from the 2.5-4.2 ppm chemical shift, with a slight shoulder visible in the peak. of solvent about 5.5 ppm.
Espectroscopía de resonancia magnética nuclear 13c (rmn)13c Nuclear Magnetic Resonance (NMR) Spectroscopy
Las muestras liofilizadas se reconstituyeron en óxido de deuterio (D2O) y se analizaron mediante espectroscopía de RMN 13C. Freeze-dried samples were reconstituted in deuterium oxide (D2O) and analyzed by 13C NMR spectroscopy.
Los resultados se resumen en las Tablas 28-30. Los espectros de RMN de las muestras preparadas se presentan en las Figuras 19-21. Cuando sea posible, las asignaciones provisionales de los principales desplazamientos químicos observados en los espectros de RMN se basaron en los espectros de referencia de los compuestos relacionados disponibles en la bibliografía.The results are summarized in Tables 28-30. The NMR spectra of the prepared samples are presented in Figures 19-21. Where possible, tentative assignments of the major chemical shifts observed in the NMR spectra were based on reference spectra of related compounds available in the literature.
Los datos indican que la sacarosa está presente en la muestra S1 y S2, y los desplazamientos químicos coinciden bien con los informados en la bibliografía. Obsérvese que, al igual que los espectros de protones, la muestra S2 parecía haber aumentado en un mayor grado que la muestra S1. Finalmente, los picos observados en la muestra S3 coinciden bien con los valores de la literatura para el dextrano, lo que indica que está presente en la muestra.The data indicate that sucrose is present in sample S1 and S2, and the chemical shifts agree well with those reported in the literature. Note that, like the proton spectra, sample S2 appeared to have increased to a greater degree than sample S1. Finally, the peaks observed in sample S3 match well with literature values for dextran, indicating that it is present in the sample.

La estructura de sacarosa se muestra anteriormente con la anotación de carbono. Los resultados de RMN 13C se muestran en las Tablas 31 a continuación:The structure of sucrose is shown above with carbon annotation. The 13C NMR results are shown in Tables 31 below:


(continuación)(continuation)


Fórmula (III)Formula (III)
La estructura del dextrano se muestra anteriormente con anotaciones de carbono de la Fórmula (III). La siguiente Tabla 33 muestra la RMN 13C para el dextrano de S3 en D2O:The structure of dextran is shown above with carbon annotations of Formula (III). The following Table 33 shows the 13C NMR for S3 dextran in D2O:

Análisis de difracción de rayos x (xrd) (material liofilizado)X-ray diffraction (xrd) analysis (lyophilized material)
El análisis XRD es un método mediante el cual una muestra inorgánica cristalina se irradia con rayos x monoenergéticos. La interacción de la estructura reticular de la muestra con estas rayos x se registra y proporciona información sobre la estructura cristalina que se irradia. La “ huella dactilar” característica resultante permite la identificación de los compuestos cristalinos presentes en la muestra. Mediante un análisis de ajuste de patrón completo (el refinado de Rietveld), es posible realizar análisis cuantitativos en muestras que contienen más de un compuesto cristalino.XRD analysis is a method by which a crystalline inorganic sample is irradiated with monoenergetic x-rays. The interaction of the lattice structure of the sample with these x-rays is recorded and provides information about the crystal structure that is irradiated. The resulting characteristic “fingerprint” allows the identification of the crystalline compounds present in the sample. Using a full standard fitting analysis (Rietveld refinement), it is possible to perform quantitative analyzes on samples containing more than one crystalline compound.
Las muestras liofilizadas se analizaron mediante XRD para caracterizar la estructura química y las fases presentes en las muestras. Los resultados del análisis se presentan en la Tabla 34. Obsérvese que este método de preparación de muestras dio como resultado muestras pegajosas para S1 y S2 específicamente (S3 era menos pegajosa). Para S1 y S2, se añadió una gota de metanol a la muestra y el material se extendió sobre el portamuestras. La muestra S3 se trituró en un mortero.The freeze-dried samples were analyzed by XRD to characterize the chemical structure and phases present in the samples. The analysis results are presented in Table 34. Note that this sample preparation method resulted in sticky samples for S1 and S2 specifically (S3 was less sticky). For S1 and S2, a drop of methanol was added to the sample and the material was spread on the sample holder. Sample S3 was crushed in a mortar.

La Figura 22 superpone los datos sin procesar de XRD de las tres muestras con pequeños desplazamientos para mayor claridad. La muestra S2 es diferente de las otras dos muestras en términos de intensidades generales, posiciones de pico, así como la forma de los picos. Las formas de los picos amplias en las muestras S1 y S3 indican que estas muestras consisten en una mezcla de materiales nanocristalinos y amorfos.Figure 22 overlays the raw XRD data of the three samples with small offsets for clarity. Sample S2 is different from the other two samples in terms of overall intensities, peak positions, as well as the shape of the peaks. The broad peak shapes in samples S1 and S3 indicate that these samples consist of a mixture of nanocrystalline and amorphous materials.
Utilizando mejores coincidencias obtenidas comparando los datos experimentales modelados de fondo con la base de datos de difracción ICDD/ICSD para la muestra S1, S2 y S3, respectivamente, se determinó que las muestras S1 y S3 contenían una mezcla de materiales amorfos y nanocristalinos. El patrón de referencia del óxido de hierro sódico se superpuso a estos datos experimentales. Los marcadores indican la ubicación de los picos de difracción esperados para cada fase y las alturas de los marcadores indican las intensidades relativas de los picos para un material de grano fino orientado aleatoriamente. A diferencia de las otras dos muestras, la muestra s 3 se compone principalmente de sacarosa y materiales amorfos.Using best matches obtained by comparing the background modeled experimental data to the ICDD/ICSD diffraction database for sample S1, S2, and S3, respectively, samples S1 and S3 were determined to contain a mixture of amorphous and nanocrystalline materials. The sodium iron oxide reference standard was superimposed on these experimental data. The markers indicate the location of the expected diffraction peaks for each phase and the heights of the markers indicate the relative intensities of the peaks for a randomly oriented fine-grained material. Unlike the other two samples, sample s 3 is mainly composed of sucrose and amorphous materials.
El análisis semicuantitativo se realizó mediante la utilización de WPF (ajuste de patrón completo), que es un subconjunto del refinado de Rietveld que representa todas las áreas por encima de la curva de fondo. Esta técnica requiere que los factores de estructura y las ubicaciones atómicas o la relación de intensidad de referencia (una forma de comparar la potencia difractante de diferentes fases) son conocidas para todas las fases identificadas. Durante este proceso, el factor estructural (que se relaciona con la concentración), los parámetros de red (que se relacionan con la posición máxima), la anchura pico y la forma de pico se refinan para cada fase para minimizar el valor R, una estimación del acuerdo entre el modelo y los datos experimentales sobre todo el patrón.Semiquantitative analysis was performed using WPF (full pattern fitting), which is a subset of Rietveld refinement that accounts for all areas above the background curve. This technique requires that the structure factors and atomic locations or reference intensity ratio (a way of comparing the diffracting power of different phases) are known for all identified phases. During this process, the structural factor (which is related to the concentration), the lattice parameters (which is related to the peak position), the peak width and the peak shape are refined for each phase to minimize the R value, a estimation of the agreement between the model and the experimental data over the entire pattern.
Para obtener resultados cuantitativos de la muestra que contiene cantidades medibles de material amorfo, la densidad de la amorfa debe asignarse para determinar cuánto material amorfo está presente. Como resultado, la concentración de material amorfo es incierta. Se supone que las ubicaciones de los picos amorfos en estas muestras son de la sacarosa amorfa que tiene una densidad de aproximadamente 1,59 g/cm3. Dado que WPF intenta tener en cuenta todo en la muestra, cualquier error en la concentración amorfa dará como resultado errores en las fases cristalinas también. Esto significa que las concentraciones relativas de las fases cristalinas son correctas, pero los valores absolutos serán en error por cantidades proporcionales al error en la concentración amorfa.To obtain quantitative results from the sample containing measurable amounts of amorphous material, the density of the amorphous must be assigned to determine how much amorphous material is present. As a result, the concentration of amorphous material is uncertain. The locations of the amorphous peaks in these samples are assumed to be from amorphous sucrose which has a density of approximately 1.59 g/cm3. Since WPF tries to account for everything in the sample, any errors in the amorphous concentration will result in errors in the phases crystal clear too. This means that the relative concentrations of the crystalline phases are correct, but the absolute values will be in error by amounts proportional to the error in the amorphous concentration.
Análisis de difracción de rayos x (xrd) (material sin azúcar)X-ray diffraction (xrd) analysis (sugar-free material)
Las muestras recibidas se diluyeron en agua y se colocaron en un filtro de corte de peso molecular (MWCO) de 10000 Da y se centrifugaron para eliminar las moléculas pequeñas en la formulación (azúcares) que produjo material amorfo en el análisis de XRD anterior. A continuación, las muestras se lavaron cinco veces más con agua para eliminar las moléculas pequeñas residuales. El material resultante (en capacidad para pasar a través del filtro) se liofilizó y se analizó mediante XRD para caracterizar la estructura química y las fases presentes en las muestras. Obsérvese que la muestra S3 contenía dos capas distintas después de la centrifugación, una capa viscosa espesa y una capa superior más delgada. Estas capas se separaron y se liofilizaron por separado y se analizaron como dos muestras. Los resultados se promediaron para proporcionar los valores observados en la Tabla 35, pero las réplicas individuales de cada capa se presentan en las figuras siguientes. Los resultados del análisis se presentan en la Tabla 35.The received samples were diluted in water and placed on a 10000 Da molecular weight cutoff (MWCO) filter and centrifuged to remove small molecules in the formulation (sugars) that produced amorphous material in the above XRD analysis. The samples were then washed five more times with water to remove residual small molecules. The resulting material (capable of passing through the filter) was lyophilized and analyzed by XRD to characterize the chemical structure and phases present in the samples. Note that sample S3 contained two distinct layers after centrifugation, a thick viscous layer and a thinner top layer. These layers were separated and lyophilized separately and analyzed as two samples. The results were averaged to provide the observed values in Table 35, but individual replicates of each layer are presented in the figures below. The results of the analysis are presented in Table 35.

En la Figura 23 se muestra una superposición de los patrones XRD de las cuatro muestras (dos réplicas de S3). Los patrones están desplazados para mayor claridad. La identificación de la fase se realizó comparando las mejores coincidencias entre los datos experimentales de XRD modelados en segundo plano y la base de datos de difracción ICDD/ICSD de la muestra Los marcadores de referencia para la fase muestran donde en dos theta los picos experimentales esperados deben ubicarse y la altura de los marcadores indica la intensidad esperada de los picos experimentales, si la muestra está fina y orientada aleatoriamente. Obsérvese que XRD es sensible a la estructura cristalina pero relativamente insensible a la composición de estado elemental o químico. La identificación de fase para estas muestras fue difícil debido a la naturaleza nanocristalina de las muestras que ensanchan significativamente el pico en los patrones de XRD. An overlay of the XRD patterns of the four samples (two replicates of S3) is shown in Figure 23. Patterns are offset for clarity. Phase identification was performed by comparing the best matches between the background modeled experimental XRD data and the sample ICDD/ICSD diffraction database Reference markers for the phase show where at two theta the expected experimental peaks should be located and the height of the markers indicates the expected intensity of the experimental peaks, if the sample is thin and randomly oriented. Note that XRD is sensitive to crystal structure but relatively insensitive to elemental or chemical state composition. Phase identification for these samples was difficult due to the nanocrystalline nature of the samples which significantly broadens the peak in the XRD patterns.
Las mejores coincidencias con los picos presentes en las cuatro muestras son una fase de óxido de hierro conocida como maghemita y una fase de hidróxido de óxido de hierro. La fase de hidróxido de óxido de hierro es atípica ya que se forma a partir del calentamiento del hidróxido de óxido de hierro en fase beta a aproximadamente 300 °C. Desafortunadamente, esta tarjeta de referencia no tiene la relación de intensidad de referencia (RIR) incluida la que se necesita para el análisis semicuantitativo. Pero como la simetría y las composiciones son similares a las del goetita mineral de hidróxido de óxido de hierro (alfa - FeOOH), el RIR promedio de goetita se usó para el hidróxido de óxido de hierro para el análisis semicuantitativo.The best matches to the peaks present in all four samples are an iron oxide phase known as maghemite and an iron oxide hydroxide phase. The iron oxide hydroxide phase is atypical in that it is formed from heating beta-phase iron oxide hydroxide to approximately 300 °C. Unfortunately, this reference card does not have the reference intensity ratio (RIR) included that is needed for semiquantitative analysis. But since the symmetry and compositions are similar to those of the iron oxide hydroxide mineral goethite (alpha - FeOOH), the average RIR of goethite was used for iron oxide hydroxide for semiquantitative analysis.
El análisis semicuantitativo se realizó mediante la utilización de WPF (ajuste de patrón completo), que es un subconjunto del refinado de Rietveld que representa toda la intensidad por encima de la curva de fondo. Esta técnica requiere que los factores de estructura y las ubicaciones atómicas o la relación de intensidad de referencia (una forma de comparar la potencia difractante de diferentes fases) son conocidas para todas las fases identificadas. Durante este proceso, el factor estructural (que se relaciona con la concentración), los parámetros de red (que se relacionan con la posición máxima), la anchura pico y la forma de pico se refinan para cada fase para minimizar el valor R, una estimación del acuerdo entre el modelo y los datos experimentales sobre todo el patrón.Semiquantitative analysis was performed using WPF (full pattern fitting), which is a subset of Rietveld refinement that accounts for all intensity above the background curve. This technique requires that the structure factors and atomic locations or reference intensity ratio (a way of comparing the diffracting power of different phases) are known for all identified phases. During this process, the structural factor (which is related to the concentration), the lattice parameters (which is related to the peak position), the peak width and the peak shape are refined for each phase to minimize the R value, a estimation of the agreement between the model and the experimental data over the entire pattern.
Degradación ácida del hierro (iii) lábil mediante espectroscopia uv-visibleAcid labile iron(III) degradation using UV-visible spectroscopy
La espectroscopia UV/Vis se utiliza para determinar la concentración de analitos, ya sea de una sola vez o con frecuencia a lo largo de un período de tiempo deseado. La técnica mide la absorción de luz a través de las longitudes de onda de luz ultravioleta y visible a través de una muestra líquida. Las muestras se dispensan en un vial pequeño y se colocan entre la trayectoria de una luz UV/Vis y un detector. Según la ley de Beer-Lambert, con una longitud de trayectoria de luz constante y un coeficiente de absorción conocido dependiendo de la longitud de onda, la concentración de un compuesto en cuestión puede determinarse a partir de la luz absorbida por la muestra a esa longitud de onda.UV/Vis spectroscopy is used to determine the concentration of analytes, either all at once or frequently over a desired period of time. The technique measures the absorption of light across the ultraviolet and visible wavelengths of light through a liquid sample. Samples are dispensed into a small vial and placed between the path of a UV/Vis light and a detector. According to the Beer-Lambert law, with a constant light path length and a known absorption coefficient depending on the wavelength, the concentration of a compound in question can be determined from the light absorbed by the sample at that length. cool.
Las muestras se analizaron mediante el método adaptado de B. S. Barot y col. (2014) que determina la cantidad de hierro lábil (III) en las muestras utilizando espectroscopía UV-Visible. Los resultados se resumen en la Tabla 36 a continuación.The samples were analyzed using the method adapted from B. S. Barot et al. (2014) which determined the amount of labile iron (III) in the samples using UV-Visible spectroscopy. The results are summarized in Table 36 below.

Análisis termogravimétrico (tga)Thermogravimetric analysis (tga)
El TGA consiste en medir el cambio de peso de un material en función de la temperatura en una atmósfera controlada. La técnica requiere mediciones precisas de peso, temperatura y cambio de temperatura. El termograma resultante generado a partir del análisis puede determinar el contenido de clases de ingredientes (por ejemplo, disolventes, polímeros, cargas inorgánicas, etc.) y estabilidad térmica de los polímeros. La precisión y el sesgo típicos de las mediciones de TGA se analizan en ASTM E2040.TGA consists of measuring the change in weight of a material as a function of temperature in a controlled atmosphere. The technique requires precise measurements of weight, temperature and temperature change. The resulting thermogram generated from the analysis can determine the content of ingredient classes (e.g., solvents, polymers, inorganic fillers, etc.) and thermal stability of the polymers. Typical precision and bias of TGA measurements are discussed in ASTM E2040.
Las muestras liofilizadas se analizaron por análisis termogravimétrico (TGA) bajo purga de nitrógeno y purga de aire. La descomposición térmica de las muestras se produce en tres etapas distintas como se muestra en la Figura 24. Los resultados de estas etapas se resumen en la Tabla 37.The freeze-dried samples were analyzed by thermogravimetric analysis (TGA) under nitrogen purge and air purge. The thermal decomposition of the samples occurs in three distinct stages as shown in Figure 24. The results of these stages are summarized in Table 37.


Calorimetría diferencial de barrido (dsc) y análisis térmico diferencial (dta)Differential scanning calorimetry (dsc) and differential thermal analysis (dta)
Las muestras liofilizadas se analizaron mediante calorimetría diferencial de barrido (DSC) bajo purga de argón. La calorimetría diferencial de barrido (DSC) mide la diferencia en los flujos de calor asociados a las transiciones entre una muestra y una referencia inerte en función de la temperatura y el tiempo. Dichas mediciones proporcionan información cuantitativa y cualitativa sobre cambios físicos y químicos que implican procesos endotérmicos o exotérmicos, o cambios en la capacidad calorífica. Véanse los termogramas DSC en la Figura 25. El resumen del DTA se presenta en la Tabla 38 a continuación.The freeze-dried samples were analyzed by differential scanning calorimetry (DSC) under argon purge. Differential scanning calorimetry (DSC) measures the difference in heat fluxes associated with transitions between a sample and an inert reference as a function of temperature and time. Such measurements provide quantitative and qualitative information on physical and chemical changes involving endothermic or exothermic processes, or changes in heat capacity. See DSC thermograms in Figure 25. The DTA summary is presented in Table 38 below.


Valor de hidróxido por valoración volumétrica y determinación de la fórmula molecularHydroxide value by volumetric titration and determination of molecular formula
Los puntos finales de las valoraciones volumétricas tuvieron pH = 7,0. La Tabla 39 resume los resultados de esta valoración volumétrica en S1.The end points of the volumetric titrations had pH = 7.0. Table 39 summarizes the results of this volumetric assessment in S1.
Partiendo del supuesto de que todas las especies básicas valoradas volumétricamente procedían del hidróxido asociado a los núcleos de oxihidróxido férrico, se supuso que el número total de moles de H+ utilizados en la valoración volumétrica era igual al número de moles de OH-. Considerando TOC y PM por GPC, la fórmula molecular de la sacarosa de hierro en S1 se calculó como sigue:Starting from the assumption that all the basic species titrated volumetrically came from the hydroxide associated with the ferric oxyhydroxide nuclei, it was assumed that the total number of moles of H+ used in the volumetric titration was equal to the number of moles of OH-. Considering TOC and PM by GPC, the molecular formula of iron sucrose in S1 was calculated as follows:
[Na6Fe5O8(OH)5 ■ 3H2O]13 ■ 73(C12H22O11)[Na6Fe5O8(OH)5 ■ 3H2O ] 13 ■ 73(C12H22O11)
Si se considera M para este cálculo, la fórmula molecular es:If M is considered for this calculation, the molecular formula is:
[Na6Fe5O8(OH)5 ■ 3H2O]9 ■ 51(C12H22O11)[Na6Fe5O8(OH)5 ■ 3H2O]9 ■ 51(C12H22O11)

0tras realizaciones de la invención serán evidentes para los expertos en la técnica a partir de la consideración de la descripción y la práctica de la invención descrita en la presente memoria. Other embodiments of the invention will be apparent to those skilled in the art from consideration of the description and practice of the invention described herein.
Claims (15)
Applications Claiming Priority (2)
| Application Number | Priority Date | Filing Date | Title |
|---|---|---|---|
| US201962812028P | 2019-02-28 | 2019-02-28 | |
| PCT/US2020/020517 WO2020176894A1 (en) | 2019-02-28 | 2020-02-28 | Novel iron compositions and methods of making and using the same |
Publications (1)
| Publication Number | Publication Date |
|---|---|
| ES2955019T3 true ES2955019T3 (en) | 2023-11-28 |
Family
ID=70190086
Family Applications (1)
| Application Number | Title | Priority Date | Filing Date |
|---|---|---|---|
| ES20717359T Active ES2955019T3 (en) | 2019-02-28 | 2020-02-28 | Novel iron compositions and methods for preparing and using the same |
Country Status (20)
| Country | Link |
|---|---|
| US (4) | US11292813B2 (en) |
| EP (2) | EP4234020A3 (en) |
| JP (3) | JP7320611B2 (en) |
| KR (1) | KR20210133243A (en) |
| CN (2) | CN119488480A (en) |
| AU (2) | AU2020229381A1 (en) |
| CA (1) | CA3131596A1 (en) |
| DK (1) | DK3930686T3 (en) |
| ES (1) | ES2955019T3 (en) |
| FI (1) | FI3930686T3 (en) |
| HR (1) | HRP20230989T1 (en) |
| HU (1) | HUE063182T2 (en) |
| LT (1) | LT3930686T (en) |
| PL (1) | PL3930686T3 (en) |
| PT (1) | PT3930686T (en) |
| RS (1) | RS64652B1 (en) |
| SG (1) | SG11202109323UA (en) |
| SI (1) | SI3930686T1 (en) |
| SM (1) | SMT202300276T1 (en) |
| WO (1) | WO2020176894A1 (en) |
Families Citing this family (3)
| Publication number | Priority date | Publication date | Assignee | Title |
|---|---|---|---|---|
| CA3192411A1 (en) * | 2020-09-11 | 2022-03-17 | Donald Keyser | Method for treating cancer with kidney protection |
| WO2024069644A1 (en) * | 2022-09-30 | 2024-04-04 | West Bengal Chemical Industries Limited | A pharmaceutically acceptable ferric carboxymaltose and preparation thereof |
| CN115969714B (en) * | 2022-11-03 | 2025-03-11 | 华熙生物科技股份有限公司 | Sunscreen composition with spectral selectivity and application thereof |
Family Cites Families (34)
| Publication number | Priority date | Publication date | Assignee | Title |
|---|---|---|---|---|
| DE862482C (en) * | 1950-05-14 | 1953-01-12 | Merck Chem Fab E | Process for the preparation of durable, injectable solutions of salts of trivalent iron |
| US5624668A (en) | 1995-09-29 | 1997-04-29 | Luitpold Pharmaceuticals, Inc. | Iron dextran formulations |
| DE19547356A1 (en) | 1995-12-19 | 1997-06-26 | Vifor Int Ag | Adsorbent for phosphate from aqueous medium, its preparation and use |
| AU2002226209A1 (en) * | 2000-12-20 | 2002-07-01 | Dialysis Solutions Inc. | Sterile low bicarbonate dialysis concentrate solutions |
| EP1540338B1 (en) * | 2002-08-26 | 2008-10-08 | Vifor (International) Ag | Bioequivalence test for iron-containing formulations |
| WO2005094202A2 (en) * | 2004-03-16 | 2005-10-13 | Navinta, Llc | Iron sucrose complexes and method of manufacture thereof |
| WO2006061685A1 (en) | 2004-12-06 | 2006-06-15 | Emcure Pharmaceuticals Limited | A cost-effective process for preparation of manufacture of iron sucrose |
| ITMO20050056A1 (en) | 2005-03-15 | 2006-09-16 | Biofer Spa | PROCESS FOR THE PREPARATION OF TRIVALENT IRON COMPLEXES WITH MONO-, DI- AND POLISACCARIDI SUGARS. |
| CN100528237C (en) | 2005-04-26 | 2009-08-19 | 重庆医药工业研究院有限责任公司 | Preparation of polynuclear iron hydroxide-sugar composite |
| EP1757299A1 (en) | 2005-08-25 | 2007-02-28 | Vifor (International) Ag | Complexes of iron III for treating iron deficiencies in patients with inflammatory bowel disease |
| EA030262B1 (en) | 2006-10-04 | 2018-07-31 | Инфакэар Фармасьютикал Корпорейшн | Method for introducing tin into a porphyrin compound |
| EP1947120A1 (en) | 2007-01-19 | 2008-07-23 | Vifor (International) Ag | Iron-carbohydrate complex compounds |
| IN269965B (en) | 2007-06-25 | 2015-11-27 | Claris Lifescienses Ltd | |
| TWI468167B (en) | 2007-11-16 | 2015-01-11 | 威佛(國際)股份有限公司 | Pharmaceutical composition |
| AR076070A1 (en) | 2009-03-02 | 2011-05-18 | Vifor Int Ag | PHOSPHATE ABSORBENT FOR THE TREATMENT OF HYPERPHOSPHATEMIA |
| CN102451185A (en) | 2010-10-19 | 2012-05-16 | 长春纳米生技公司 | Metal ion nanocluster composition |
| EP2548562A1 (en) | 2011-07-18 | 2013-01-23 | SeBo GmbH | Combination therapy with iron-based phosphate absorbers |
| EP2647389A1 (en) * | 2012-04-04 | 2013-10-09 | Charité - Universitätsmedizin Berlin | Magnetic nanoparticle dispersion, its preparation and diagnostic and therapeutic use |
| CN103340827B (en) * | 2013-07-16 | 2014-12-10 | 成都天台山制药有限公司 | Iron sucrose injection and preparation method thereof |
| CN104558064A (en) * | 2013-10-29 | 2015-04-29 | 北京京卫信康医药科技发展有限公司 | Preparation method of iron sucrose |
| IN2013CH05383A (en) | 2013-11-21 | 2015-08-28 | Reddy’S Lab Ltd Dr | |
| CN104098616B (en) | 2014-05-27 | 2016-04-20 | 广西壮族自治区化工研究院 | A kind of preparation method of iron sucrose |
| RS65182B1 (en) | 2014-09-29 | 2024-03-29 | Fred Hutchinson Cancer Center | Compositions, kits, and methods to induce acquired cytoresistance using stress protein inducers |
| WO2017165692A1 (en) * | 2016-03-23 | 2017-09-28 | Fred Hutchinson Cancer Research Center | Compounds linked with a saccharide metal complex and uses thereof |
| US20190358242A1 (en) * | 2017-02-08 | 2019-11-28 | Fred Hutchinson Cancer Research Center | Compositions, kits, and methods to induce acquired cytoresistance using stress protein inducers |
| AU2018328052C1 (en) | 2017-09-11 | 2025-12-18 | Pharmacosmos Holding A/S | Iron complex compounds for therapeutic use |
| CN109912675B (en) | 2017-12-13 | 2020-09-15 | 北京市林业果树科学研究院 | Ferrous sucrose and preparation method thereof |
| CN110063965A (en) | 2019-06-04 | 2019-07-30 | 吉林省富生医疗器械有限公司 | A kind of haemodialysis concentrate |
| CN112315902B (en) | 2019-08-05 | 2022-05-13 | 南京恒生制药有限公司 | Preparation method of iron sucrose injection with low content of volatile iron |
| CN112156109A (en) | 2020-09-29 | 2021-01-01 | 神奈纳米医药技术(珠海)有限公司 | Preparation method and application of ferric hydroxide-sugar complex |
| CN112168844A (en) | 2020-09-29 | 2021-01-05 | 神奈纳米医药技术(珠海)有限公司 | Preparation method of iron hydroxide carbohydrate compound |
| BR112023004388A2 (en) | 2020-09-29 | 2023-04-04 | Lg Bionano Llc | METHOD FOR PREPARING AN IRON HYDROXIDE PRODUCT AND IRON HYDROXIDE PRODUCT |
| CN115531414A (en) | 2021-06-30 | 2022-12-30 | 南京恒生制药有限公司 | Novel iron sucrose compound and preparation method thereof |
| US12239657B2 (en) | 2021-08-27 | 2025-03-04 | Vifor (International) Ag | Iron compositions and methods of making and using them |
-
2020
- 2020-02-28 CN CN202411305791.9A patent/CN119488480A/en active Pending
- 2020-02-28 DK DK20717359.2T patent/DK3930686T3/en active
- 2020-02-28 CA CA3131596A patent/CA3131596A1/en active Pending
- 2020-02-28 SG SG11202109323UA patent/SG11202109323UA/en unknown
- 2020-02-28 HR HRP20230989TT patent/HRP20230989T1/en unknown
- 2020-02-28 LT LTEPPCT/US2020/020517T patent/LT3930686T/en unknown
- 2020-02-28 FI FIEP20717359.2T patent/FI3930686T3/en active
- 2020-02-28 SI SI202030257T patent/SI3930686T1/en unknown
- 2020-02-28 RS RS20230725A patent/RS64652B1/en unknown
- 2020-02-28 US US16/805,223 patent/US11292813B2/en active Active
- 2020-02-28 EP EP23176202.2A patent/EP4234020A3/en active Pending
- 2020-02-28 ES ES20717359T patent/ES2955019T3/en active Active
- 2020-02-28 HU HUE20717359A patent/HUE063182T2/en unknown
- 2020-02-28 PL PL20717359.2T patent/PL3930686T3/en unknown
- 2020-02-28 EP EP20717359.2A patent/EP3930686B1/en active Active
- 2020-02-28 JP JP2021550178A patent/JP7320611B2/en active Active
- 2020-02-28 CN CN202080031484.XA patent/CN113825496B/en active Active
- 2020-02-28 PT PT207173592T patent/PT3930686T/en unknown
- 2020-02-28 AU AU2020229381A patent/AU2020229381A1/en not_active Abandoned
- 2020-02-28 KR KR1020217030370A patent/KR20210133243A/en active Pending
- 2020-02-28 WO PCT/US2020/020517 patent/WO2020176894A1/en not_active Ceased
- 2020-02-28 SM SM20230276T patent/SMT202300276T1/en unknown
-
2022
- 2022-02-15 US US17/672,072 patent/US11840552B2/en active Active
- 2022-11-02 US US17/979,490 patent/US11834471B2/en active Active
-
2023
- 2023-07-21 JP JP2023118851A patent/JP7646750B2/en active Active
- 2023-09-07 US US18/243,584 patent/US20240002427A1/en active Pending
-
2025
- 2025-03-04 JP JP2025033475A patent/JP2025084949A/en active Pending
- 2025-09-10 AU AU2025230678A patent/AU2025230678A1/en active Pending
Also Published As
Similar Documents
| Publication | Publication Date | Title |
|---|---|---|
| US20240002427A1 (en) | Novel iron compositions and methods of making and using the same | |
| Jahn et al. | A comparative study of the physicochemical properties of iron isomaltoside 1000 (Monofer®), a new intravenous iron preparation and its clinical implications | |
| Tarres et al. | Aqueous self‐assembly and cation selectivity of cobaltabisdicarbollide dianionic dumbbells | |
| CN104880428B (en) | A kind of colloidal bismmth pectin or containing the assay method of bi content in colloid pectin bismuth preparation | |
| Alanazi et al. | Selective and reliable fluorometric quantitation of anti-cancer drug in real plasma samples using nitrogen-doped carbon dots after MMIPs solid phase microextraction: Monitoring methotrexate plasma level | |
| Åberg et al. | 17O and 1H NMR study of the tetranuclear hydroxo zirconium complex in aqueous solution | |
| Cappellari et al. | Synthesis of ultra-small cysteine-capped gold nanoparticles by pH switching of the Au (I)–cysteine polymer | |
| Raval et al. | Preparation, characterization, and in-vitro assessment of calixarene nanovesicles: a supramolecular based nano-carrier for paclitaxel drug delivery | |
| Kästele et al. | 13C NMR spectroscopy as a tool for the in situ characterisation of iron-supplementing preparations | |
| HK40066891B (en) | Novel iron compositions and methods of making and using the same | |
| HK40066891A (en) | Novel iron compositions and methods of making and using the same | |
| HK40098133A (en) | Novel iron compositions and methods of making and using the same | |
| HK40066204A (en) | Novel iron compositions and methods of making and using the same | |
| HK40066204B (en) | Novel iron compositions and methods of making and using the same | |
| Uchman et al. | Micelle-like nanoparticles of block copolymer poly (ethylene oxide)-block-poly (methacrylic acid) incorporating fluorescently substituted metallacarboranes designed as HIV protease inhibitor interaction probes | |
| Barui et al. | Dual drug loaded nanotheranostic platforms as a novel synergistic approach to improve pancreatic cancer treatment | |
| Barot et al. | Physicochemical and toxicological characterization of sucrose-bound polynuclear iron oxyhydroxide formulations | |
| Lian et al. | The revolutionizing osteosarcoma therapy of carbon monoxide and doxorubicin synergy via mesoporous silica nanoparticles | |
| Jackson et al. | Solution equilibria and the X-ray structure of Cu (II) complexation with 3-amino-N-(pyridin-2-ylmethyl) propanamide, a pseudo-mimic of human serum albumin | |
| Yang et al. | Analysis on the interaction of coumarin isomers with human serum albumin in the presence of cisplatin | |
| Chang et al. | Spectrophotometric determination of the optimal wavelength for a polymer-gel dosimeter | |
| Marcinkowska et al. | Cisplatin Derivatives and Their Complexes with PAMAM Dendrimers—A Way to Improve the Efficacy of Anticancer Drugs | |
| Zhang et al. | Self-assembly of a surfactant-encapsulated polyoxometalate mediated by coordination of metal ions | |
| Mejias | Characterization of titanium (IV)-transferrin binding interactions | |
| Cardona Mejías | Characterization of Ti (IV)-transferring binding interactions |