EP4404113A1 - Anzeigevorrichtung für vorhersagedaten, anzeigeverfahren für vorhersagedaten und anzeigeprogramm für vorhersagedaten - Google Patents
Anzeigevorrichtung für vorhersagedaten, anzeigeverfahren für vorhersagedaten und anzeigeprogramm für vorhersagedaten Download PDFInfo
- Publication number
- EP4404113A1 EP4404113A1 EP22869937.7A EP22869937A EP4404113A1 EP 4404113 A1 EP4404113 A1 EP 4404113A1 EP 22869937 A EP22869937 A EP 22869937A EP 4404113 A1 EP4404113 A1 EP 4404113A1
- Authority
- EP
- European Patent Office
- Prior art keywords
- characteristic data
- data
- consumable
- prediction
- information
- Prior art date
- Legal status (The legal status is an assumption and is not a legal conclusion. Google has not performed a legal analysis and makes no representation as to the accuracy of the status listed.)
- Pending
Links
Images







Classifications
-
- G—PHYSICS
- G06—COMPUTING OR CALCULATING; COUNTING
- G06Q—INFORMATION AND COMMUNICATION TECHNOLOGY [ICT] SPECIALLY ADAPTED FOR ADMINISTRATIVE, COMMERCIAL, FINANCIAL, MANAGERIAL OR SUPERVISORY PURPOSES; SYSTEMS OR METHODS SPECIALLY ADAPTED FOR ADMINISTRATIVE, COMMERCIAL, FINANCIAL, MANAGERIAL OR SUPERVISORY PURPOSES, NOT OTHERWISE PROVIDED FOR
- G06Q10/00—Administration; Management
- G06Q10/04—Forecasting or optimisation specially adapted for administrative or management purposes, e.g. linear programming or "cutting stock problem"
-
- G—PHYSICS
- G01—MEASURING; TESTING
- G01R—MEASURING ELECTRIC VARIABLES; MEASURING MAGNETIC VARIABLES
- G01R31/00—Arrangements for testing electric properties; Arrangements for locating electric faults; Arrangements for electrical testing characterised by what is being tested not provided for elsewhere
- G01R31/36—Arrangements for testing, measuring or monitoring the electrical condition of accumulators or electric batteries, e.g. capacity or state of charge [SoC]
- G01R31/392—Determining battery ageing or deterioration, e.g. state of health
-
- G—PHYSICS
- G01—MEASURING; TESTING
- G01R—MEASURING ELECTRIC VARIABLES; MEASURING MAGNETIC VARIABLES
- G01R31/00—Arrangements for testing electric properties; Arrangements for locating electric faults; Arrangements for electrical testing characterised by what is being tested not provided for elsewhere
- G01R31/36—Arrangements for testing, measuring or monitoring the electrical condition of accumulators or electric batteries, e.g. capacity or state of charge [SoC]
- G01R31/3644—Constructional arrangements
- G01R31/3648—Constructional arrangements comprising digital calculation means, e.g. for performing an algorithm
-
- G—PHYSICS
- G01—MEASURING; TESTING
- G01R—MEASURING ELECTRIC VARIABLES; MEASURING MAGNETIC VARIABLES
- G01R31/00—Arrangements for testing electric properties; Arrangements for locating electric faults; Arrangements for electrical testing characterised by what is being tested not provided for elsewhere
- G01R31/36—Arrangements for testing, measuring or monitoring the electrical condition of accumulators or electric batteries, e.g. capacity or state of charge [SoC]
- G01R31/367—Software therefor, e.g. for battery testing using modelling or look-up tables
-
- G—PHYSICS
- G06—COMPUTING OR CALCULATING; COUNTING
- G06N—COMPUTING ARRANGEMENTS BASED ON SPECIFIC COMPUTATIONAL MODELS
- G06N20/00—Machine learning
- G06N20/10—Machine learning using kernel methods, e.g. support vector machines [SVM]
-
- H—ELECTRICITY
- H01—ELECTRIC ELEMENTS
- H01M—PROCESSES OR MEANS, e.g. BATTERIES, FOR THE DIRECT CONVERSION OF CHEMICAL ENERGY INTO ELECTRICAL ENERGY
- H01M10/00—Secondary cells; Manufacture thereof
- H01M10/42—Methods or arrangements for servicing or maintenance of secondary cells or secondary half-cells
- H01M10/48—Accumulators combined with arrangements for measuring, testing or indicating the condition of cells, e.g. the level or density of the electrolyte
Definitions
- the present disclosure relates to a prediction data display device, a prediction data display method, and a prediction data display program.
- a prediction technique for predicting a degree of deterioration of a consumable such as a battery using a machine learning model has been known.
- characteristic data after deterioration of a consumable to be predicted can be predicted from characteristic data before the deterioration of the consumable to be predicted by acquiring characteristic data indicating a degree of deterioration of the consumable for a certain period of time and training a relationship between characteristic data before deterioration and characteristic data after deterioration.
- the present disclosure enables to more easily determine whether or not prediction data is correct when a degree of deterioration of a consumable is predicted using a machine learning model.
- a prediction data display device includes:
- the display part is configured to display the graph of the second characteristic data combined with a graph of the third characteristic data.
- the information on the second characteristic data is an attenuation factor of the second characteristic data in a case where characteristic data indicating a degree of deterioration of the first consumable at an end of the first period is used as a reference.
- the display part is configured to display the graph of the second characteristic data generated by multiplying characteristic data indicating a degree of deterioration of the second consumable to be predicted at the end of the first period by the attenuation factor of the second characteristic data.
- the information on the fourth characteristic data is an attenuation factor of the fourth characteristic data in a case where characteristic data indicating a degree of deterioration of the second consumable to be predicted at an end of the first period is used as a reference.
- the display part is configured to display the graph of the fourth characteristic data generated by multiplying the characteristic data indicating the degree of deterioration of the second consumable to be predicted at the end of the first period by the attenuation factor of the fourth characteristic data.
- the display part is configured to display the graph of the second characteristic data in a display color determined in accordance with the similarity.
- the display part is configured to display information on a confidence interval calculated by the prediction part together with displaying the graph of the fourth characteristic data.
- the display part is configured to display information indicating a type of the first consumable and information indicating a manufacturing condition of the first consumable, in association with the similarity, in a text.
- the display part is configured to calculate a level of normality of the fourth characteristic data by comparing a width of a confidence interval calculated by the prediction part with a minimum width and a maximum width of a confidence interval calculated by performing the training process on the model with the training data, and display the level.
- the model is a Gaussian process regression model.
- the first second consumables are batteries
- the information on the first and third characteristic data is a feature measured in a test in which charging and discharging of batteries are repeated.
- the first and third characteristic data is a discharge capacity retention rate in each cycle.
- a method of displaying prediction data according to a fourteenth aspect of the present disclosure includes steps of:
- a program of displaying prediction data according to a fifteenth aspect of the present disclosure the program causing a computer to execute steps of:
- the present disclosure enables to more easily determine whether or not prediction data of a degree of deterioration of a consumable is correct when the degree is predicted using a machine learning model.
- FIG. 1 is a diagram illustrating a system configuration example of the prediction data display system and a functional configuration example of the training device in the training phase.
- a prediction data display system 100 in the training phase includes a characteristic measuring device 110, a training data generating device 120, and a training device 130.
- the characteristic measuring device 110 measures a feature as information on characteristic data indicating a degree of deterioration of a consumable to generate the characteristic data based on the measured feature.
- the consumable refers to an article whose performance deteriorates due to repetitive use, and includes, for example, a battery.
- the characteristic data indicating a degree of deterioration refers to, for example, a discharge capacity retention rate in each cycle in a test in which charging and discharging of the battery are repeated.
- a feature which is the information on the characteristic data, refers to current data, voltage data, or the like measured in each cycle.
- the battery referred to herein includes various batteries, and a lithium ion secondary battery is given as an example.
- the lithium ion secondary battery includes those manufactured under different manufacturing conditions from the viewpoints of material development and cell design. More specifically, the lithium ion secondary battery includes batteries manufactured by variously comparing and changing constituent members such as a positive electrode material, a negative electrode material, and an electrolytic material constituting the lithium ion secondary battery, and batteries manufactured by variously comparing and changing conditions such as activation and aging after completion of battery assembly.
- the characteristic measuring device 110 acquires characteristic data for various types of consumables (an example of a first consumable, for example, a battery).
- the example in FIG. 1 illustrates a state in which characteristic data I, II, III, ... are generated by measuring features I, II, III, ... for consumables I, II, III, ... of different types, respectively.
- the generated characteristic data I, II, III, ... are input to the training data generating device 120 together with the features I, II, III, ... and manufacturing conditions i, ii, iii, ... of the respective consumables.
- the training data generating device 120 generates training data 121 used for a training process by the training device 130.
- the training data 121 includes "ID”, “Reference data”, “Input data”, and “Ground-truth data” as information items.
- the following contents are input as the respective information items:
- the reference time refers to, in a period from the start to the end of the characteristic measuring device 110 measuring a feature as information on characteristic data indicating a degree of deterioration of a consumable, a time at which a predetermined period (first period) is elapsed since the start of the measurement. Note that, in the period from the start to the end of the measurement, a period from the reference time to the end of the measurement is referred to as a second period.
- a reference time refers to a number of cycles in which a number of cycles from the measurement start time becomes a predetermined value.
- the training data 121 generated by the training data generating device 120 is stored in a training data storage part 133 of the training device 130.
- a training program is installed in the training device 130, and the training device 130 works as a Gaussian process regression model 131 and a comparison/change part 132 when the program is executed.
- the Gaussian process regression model 131 is a nonparametric probability model, and also is a model capable of outputting prediction data (a predicted attenuation factor after a reference time in the present embodiment) and a variance of the prediction data (a width of a 95% confidence interval in the present embodiment).
- the Gaussian process regression model 131 outputs output data (the predicted attenuation factor after the reference time) when input data (a feature measured from the measurement start time to the reference time) of the training data 121 is input.
- the comparison/change part 132 updates a model parameter for the Gaussian process regression model 131 so that the output data matches the ground-truth data (an attenuation factor of the characteristic data after the reference time with reference to the characteristic data at the reference time) of the training data 121.
- the updated model parameter is held in a trained Gaussian process regression model 332 (described in detail later) and used in a prediction phase.
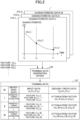
- FIG. 2 is a diagram illustrating a specific example of the processing of the training data generating device.
- reference numerals 210_1, 210_2, 210_3, ... illustrate specific examples of the characteristic data I, II, III, ..., respectively.
- the horizontal axis represents a time t
- the vertical axis represents characteristic data y(t) at the time t.
- a feature 1(t X ), a feature 2(t X ), a feature 3(t X ), ... each represent a feature used for generating the characteristic data y(t X )_I and the like at a time t X (where t 0 ⁇ t X ⁇ t T ).
- the training data generating device 120 generates training data 121' based on the following:
- FIG. 3 is a diagram illustrating a system configuration example of the prediction data display system and a functional configuration example of the prediction data display device in the prediction phase.
- a prediction data display system 300 in the prediction phase includes the characteristic measuring device 110, a predictive data generating device 320, and a prediction data display device 330.
- the characteristic measuring device 110 has been described with reference to FIG. 1 , thus the description thereof is omitted here. Note that, in the prediction phase, the characteristic measuring device 110 measures a feature N as information on characteristic data N for a consumable N to be predicted (an example of a second consumable, for example, a battery manufactured under a manufacturing condition m). The characteristic measuring device 110 also generates the characteristic data N based on the measured feature N. More specifically, as the battery manufactured under the manufacturing condition m, which is an example of the consumable, a lithium ion secondary battery that is the same type of the battery used in the generation of the training data described above and that is manufactured under the manufacturing condition m is exemplified.
- the predictive data generating device 320 generates predictive data 321 used for a prediction data display process by the prediction data display device 330.
- the predictive data 321 includes "ID”, “Reference data”, “Data for scale conversion”, “Input data”, and “Display data” as information items, and the following contents are input as the respective information items: ⁇ “ID”: types of consumable to be predicted; ⁇ “Reference data”: manufacturing conditions of the consumable to be predicted; ⁇ “Data for scale conversion”: characteristic data at the reference time; ⁇ "Input data”: features measured from the measurement start time to the reference time; and ⁇ “Display data”: characteristic data from the measurement start time to the reference time.
- the predictive data 321 generated by the predictive data generating device 320 is notified to the prediction data display device 330.
- a prediction data display program is installed in the prediction data display device 330, and when the prediction data display program is executed, the prediction data display device 330 works as follows:
- the first scale converter 331 calculates the characteristic data (scale-converted characteristic data) after the reference time for each consumable (consumable I, II, III, ...), based on the following:
- the first scale converter 331 also determines a display appearance with which the characteristic data after the reference time for each consumable is displayed based on a similarity of the consumable notified from the trained Gaussian process regression model 332.
- the first scale converter 331 also notifies the display screen generating part 334 of the characteristic data after the reference time for each consumable for which the display appearance has been determined, together with notifying the similarity.
- the trained Gaussian process regression model 332 is an example of a prediction part, and holds the model parameter updated by performing the training process on the Gaussian process regression model 131 in the training phase.
- the Gaussian process regression model is used as an example of the regression model.
- the present embodiment is, however, not limited thereto.
- another regression model such as a Poisson process regression model may be used as long as the model can output prediction data and a 95% confidence interval of the prediction data.
- the trained Gaussian process regression model 332 When the feature measured from the measurement start time to the reference time included in "Input data" in the predictive data 321 is input, the trained Gaussian process regression model 332 performs the following:
- the second scale converter 333 predicts characteristic data (prediction data) after the reference time for the consumable to be predicted, based on the following:
- the second scale converter 333 also calculates a 95% confidence interval converted into the characteristic data based on the characteristic data at the reference time included in "Data for scale conversion" in the predictive data 321 and the 95% confidence interval notified from the trained Gaussian process regression model 332.
- the second scale converter 333 also notifies the display screen generating part 334 of the predicted characteristic data (the prediction data) after the reference time for the consumable to be predicted and the calculated 95% confidence interval (converted into the characteristic data).
- the display screen generating part 334 is an example of a display part, and generates a display screen. At least the following are displayed on the display screen generated by the display screen generating part 334:
- the display screen generating part 334 displays the characteristic data after the reference time notified from the first scale converter 331 in the display appearance determined by the first scale converter 331.
- the prediction data display device 330 displays the prediction data predicted using the machine learning model for the consumable to be predicted
- the characteristic data generated based on the training data used in the training process of the machine learning model is also displayed.
- the prediction data display device 330 displays the characteristic data generated based on the training data with the display appearance determined in accordance with the similarity of the feature. This allows the user to compare the prediction data for the consumable to be predicted with the past characteristic data whose display appearance has been changed in accordance with the similarity. As a result, the user can more easily determine whether the prediction data is correct or not.
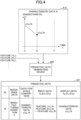
- FIG. 4 is a diagram illustrating a specific example of the processing of the predictive data generating device.
- a reference numeral 410 illustrates a specific example of the characteristic data N.
- the horizontal axis represents the time t
- the vertical axis represents the characteristic data y(t) for the consumable N to be predicted at the time t.
- the feature 1(t X ), the feature 2(t X ), the feature 3 (t X ), ... each represent the feature used to generate characteristic data y(t X )_N at the time t X (where t 0 ⁇ t X ⁇ t B ).
- the predictive data generating device 320 generates predictive data 321' based on the characteristic data N illustrated in the reference numeral 410 and the feature 1(t X ), the feature 2(t X ), the feature 3(t X ), ....
- the training device 130 constituting the prediction data display system 100 in the training phase and the prediction data display device 330 constituting the prediction data display system 300 in the prediction phase will be described in detail.
- FIG. 5 is a diagram illustrating a hardware configuration example of the training device and the prediction data display device.
- the training device 130 and the prediction data display device 330 have the same hardware configuration, and thus will be collectively described with reference to FIG. 5 .
- the training device 130 and the prediction data display device 330 include a processor 501, a memory 502, an auxiliary storage device 503, an interface (I/F) device 504, a communication device 505, and a drive device 506.
- the hardware components of each of the training device 130 and the prediction data display device 330 are connected to each other via a bus 507.
- the processor 501 includes various computing devices such as a central processing unit (CPU) and a graphics processing unit (GPU).
- the processor 501 reads various programs (for example, a training program, a prediction data display program, and the like) on the memory 502 and executes the programs.
- programs for example, a training program, a prediction data display program, and the like
- the memory 502 includes a main storage device such as a read only memory (ROM) and a random access memory (RAM).
- ROM read only memory
- RAM random access memory
- the processor 501 and the memory 502 form what is known as a computer, and the computer implements various functions by the processor 501 executing various programs read out on the memory 502.
- the auxiliary storage device 503 stores various programs and various types of data used when the various programs are executed by the processor 501.
- the training data storage part 133 described above is achieved in the auxiliary storage device 503.
- the I/F device 504 is a connection device connected to a display device 510 and an operation device 520, which are external devices.
- the communication device 505 is a communication device for communicating with an external device (for example, the training data generating device 120 or the predictive data generating device 320) via a network.
- the drive device 506 is a device for setting a recording medium 530.
- the recording medium 530 includes a medium for optically, electrically, or magnetically recording information, such as a CD-ROM, a flexible disk, or a magneto-optical disk.
- the recording medium 530 may include a semiconductor memory or the like that electrically records information, such as a ROM or a flash memory.
- the various programs installed in the auxiliary storage device 503 are installed by, for example, setting the distributed recording medium 530 in the drive device 506 and reading out the various programs recorded in the recording medium 530 by the drive device 506.
- the various programs installed in the auxiliary storage device 503 may be installed by being downloaded over a network via the communication device 505.
- FIG. 6 is a diagram illustrating a specific example of the processing of the first scale converter of the prediction data display device.
- the first scale converter 331 includes an attenuation factor calculation part 601 and a display appearance change part 602.
- the attenuation factor calculation part 601 acquires the characteristic data y(t B )_N as the characteristic data at the reference time, and multiplies the acquired characteristic data by the attenuation factor after the reference time for each consumable (consumable I, II, III, ...) to obtain the characteristic data after the reference time for each consumable.
- the example of FIG. 6 illustrates a state in which the characteristic data after the reference time is calculated for each consumable by multiplying the characteristic data at the reference time by the respective attenuation factors.
- the attenuation factors for consumables I, II, III, ... are represented as follows:
- the display appearance change part 602 determines a display appearance with which the characteristic data after the reference time for each consumable (consumable I, II, III, ...) is displayed based on a similarity of the consumable notified from the trained Gaussian process regression model 332.
- the example of FIG. 6 illustrates a state in which a similarity I, a similarity II, a similarity III, ... are notified from the trained Gaussian process regression model 332 as the similarities for the consumables I, II, III, ..., respectively.
- FIG. 6 also illustrates that, in a case where the similarity for the consumable notified from the trained Gaussian process regression model 332 is "1", the display appearance change part 602 determines the display color for the graph of the corresponding characteristic data after the reference time to be blue.
- FIG. 6 illustrates that, in a case where the similarity for the consumable notified from the trained Gaussian process regression model 332 is "0", the display appearance change part 602 determines the display color for the graph of the corresponding characteristic data after the reference time to be gray.
- the display appearance change part 602 determines the display color for the graph of the corresponding characteristic data after the reference time to be an intermediate color between gray and blue.
- the display appearance change part 602 determines the display color for the graph of the corresponding characteristic data after the reference time to be a color close to gray among the colors in the gray to blue gradation. In a case where the similarity is close to "1", the display appearance change part 602 determines the display color for the graph of the corresponding characteristic data after the reference time to be a color close to blue among the colors in the gray to blue gradation.
- the method of determining the display color by the display appearance change part 602 is, however, not limited thereto.
- the display color may be determined to be gray in a case where the similarity is less than a predetermined threshold value, and may be determined to be blue in a case where the similarity is equal to or greater than the predetermined threshold value.
- FIG. 7 is a diagram illustrating a specific example of the processing of the trained Gaussian process regression model of the prediction data display device.
- the trained Gaussian process regression model 332 includes a similarity calculation part 701, a confidence interval calculation part 702, an attenuation factor prediction part 703, and a model parameter holding part 704.
- the similarity calculation part 701 receives the features measured from the measurement start time to the reference time and included in "Input data” in the predictive data 321 and the features measured from the measurement start time to the reference time and included in "Input data” in the training data 121.
- FIG. 7 illustrates a state in which the features measured from the measurement start time to the reference time and included in "Input data" in the predictive data 321 as follows are input:
- FIG. 7 also illustrates a state in which the features measured from the measurement start time to the reference time and included in "Input data" in the training data 121 as follows are input:
- the similarity calculation part 701 also calculates the similarity for each consumable (consumable I, II, III, ...) with the following Equation 1 based on the input feature F x and feature F y .
- Similarity e x p ⁇ ⁇ ⁇ F x ⁇ F y ⁇ 2
- ⁇ is a model parameter calculated when the training process is performed in the training phase and held in the model parameter holding part 704.
- the similarity calculation part 701 notifies the first scale converter 331 of the calculated similarity for each consumable.
- the example of FIG. 7 illustrates a state in which the first scale converter 331 is notified of the similarity I as the similarity for the consumable I, the similarity II as the similarity for the consumable II, and the similarity III as the similarity for the consumable III.
- the confidence interval calculation part 702 calculates a 95% confidence interval for the predicted attenuation factor to be calculated by the attenuation factor prediction part 703 using the similarity calculated for each consumable (consumable I, II, III, ...) by the similarity calculation part 701.
- the example of FIG. 7 illustrates a state in which (Max_r'(t X )_N, Min_r'(t X )_N) is calculated as the 95% confidence interval.
- the attenuation factor prediction part 703 calculates the predicted attenuation factor after the reference time for the consumable N to be predicted by using the similarity calculated for each consumable (consumable I, II, III, ...) by the similarity calculation part 701.
- the example of FIG. 7 illustrates a state in which a predicted attenuation factor r'(t X )_N is calculated as the predicted attenuation factor after the reference time for the consumable N to be predicted.
- the attenuation factor prediction part 703 calculates the predicted attenuation factor r'(t X )_N by calculating a kernel expressed by the following Equation 2, for example. [Math.
- Kernel K F x , F y C v a r ⁇ e x p ⁇ ⁇ ⁇ F x ⁇ F y ⁇ 2 + C b i a s + ⁇ ⁇ ⁇ x y
- C var , C bias , and ⁇ are model parameters calculated when the training process is performed in the training phase and held in the model parameter holding part 704.
- the model parameter holding part 704 holds the model parameters calculated when the training process is performed in the training phase.
- the example of FIG. 7 illustrates that the model parameter holding part 704 holds at least C var , ⁇ , C bias , and ⁇ as the model parameters.
- the features to be input as the features F x and F y may be converted and used.
- values obtained by performing a dimension compression process such as principal component analysis, independent component analysis, or Kernel PCA may be used.
- FIG. 8 is a diagram illustrating a specific example of the processing of the second scale converter of the prediction data display device.
- the second scale converter 333 includes a prediction data calculation part 801 and a confidence interval calculation part 802.
- the prediction data calculation part 801 acquires the characteristic data y(t B )_N as the characteristic data at the reference time, and multiplies the acquired characteristic data y(t B )_N by the predicted attenuation factor for the consumable N to be predicted, thereby predicting the prediction data after the reference time for the consumable N to be predicted.
- the example of FIG. 8 illustrates a state in which the prediction data after the reference time is predicted by multiplying the acquired characteristic data by r'(t X )_N as the predicted attenuation factor for the consumable N to be predicted.
- the prediction data is predicted as follows:
- the confidence interval calculation part 802 acquires the characteristic data y(t B )_N as the characteristic data at the reference time, and multiplies the acquired characteristic data by the 95% confidence interval for the predicted attenuation factor to calculate the 95% confidence interval converted into the characteristic data.
- the example of FIG. 8 illustrates a state in which the 95% confidence interval converted into the characteristic data is calculated by multiplying the acquired characteristic data by the 95% confidence interval for the predicted attenuation factor.
- the 95% confidence interval for the predicted attenuation factor is expressed as follows:
- FIG. 9 is a diagram illustrating examples of a graph of the prediction data and the 95% confidence interval.
- the characteristic data y(t X )_N (where t 0 ⁇ _ t X ⁇ _ t B ), which is the display data, is also illustrated (see the red colored line in FIG. 9 ).
- a graph 910 is a line graph illustrating only three predicted times plotted as the prediction data after the reference time and a dotted line connecting the respective plots.
- a graph 920 is a box plot graph in which only three predicted times are plotted as the prediction data after the reference time, together with the respective 95% confidence intervals (see green colored box plots in FIG. 9 ).
- a graph 930 is a curved graph illustrating the prediction data after the reference time, which is predicted every hour, together with the respective 95% confidence intervals (see green colored dotted lines in FIG. 9 ) .
- the graphs 910 to 930 are examples of graphing, and a graph may be created by methods other than the methods used for the graphs 910 to 930.
- FIG. 10 is a first diagram illustrating a specific example of the processing of the display screen generating part of the prediction data display device.
- reference numerals 1010_1, 1010_2, 1010_3, ... each illustrates a graph of the characteristic data after the reference time for the respective consumables notified from the first scale converter 331 in the determined display color.
- the characteristic data for each consumable is as follows:
- a reference numeral 920 is a graph of the following for the consumable N to be predicted:
- the display screen generating part 334 includes a text data generating part 1001 and a graph combining part 1002.
- the text data generating part 1001 reads "ID” and "Reference data” in the training data 121 stored in the training data storage part 133.
- the text data generating part 1001 also acquires the similarities (similarity I, II, III, %) for the respective consumables (consumable I, II, III, %) from the first scale converter 331.
- the text data generating part 1001 generates a text table 1021 in which the read "ID” and “Reference data” are associated with the acquired similarity, and displays the table on a display screen 1020.
- the graph combining part 1002 acquires the graph of the characteristic data from the measurement start time to the reference time for the consumable N to be predicted from "Display data" in the predictive data 321.
- the graph combining part 1002 also acquires the graph (reference numeral 920) of the prediction data and the respective 95% confidence intervals for the consumable N to be predicted from the second scale converter 333.
- the graph combining part 1002 also acquires the graphs (reference numerals 1010_1, 1010_2, 1010_3, ...) of the characteristic data after the reference time for respective consumables (consumables I, II, III, ...) from the first scale converter 331.
- the graph combining part 1002 generates a combined graph 1022 by combining the acquired graphs, and displays the combined graph on the display screen 1020.
- a red line represents the graph of the characteristic data from the measurement start time to the reference time for the consumable N to be predicted.
- a green box plot graph is the graph of the prediction data and the respective 95% confidence intervals for the consumable N to be predicted (reference numeral 920).
- blue to gray lines represent the graph (reference numeral 1010_1, 1010_2, 1010_3, ...) of the characteristic data for the respective consumables (consumable I, II, III, %) after the reference time, respectively.
- a color bar 1023 represents the relationship between the display color of the characteristic data after the reference time for each consumable and the similarity for each consumable (for each color, see the colored FIG. 10 ).
- the graph (green box plot graph) of the prediction data when the graph (green box plot graph) of the prediction data is displayed, the graphs (blue to gray lines) of the characteristic data for the respective consumables generated based on the training data used in the training process of the Gaussian process regression model are also displayed.
- the graph after the reference time is displayed after being subjected to scale conversion according to the characteristic data at the reference time. This allows the user to compare the data for the consumable to be predicted with the past characteristic data that is color-coded according to the similarity. As a result, the user can easily determine whether the prediction data is correct or not.
- the graph of the prediction data (green box plot graph) is in a range that substantially overlaps the graph of the blue characteristic data among the graphs of the characteristic data for each consumable, and the user can therefore determine that the prediction data is correct.
- FIG. 11 is a second diagram illustrating a specific example of the processing of the display screen generating part of the prediction data display device.
- the similarity between the feature for the consumable N to be predicted and the feature for each consumable are low. Therefore, in a combined graph 1122, the graph of the prediction data (green box plot graph) is within the range of the graph of the gray characteristic data. As a result, the user can determine that the prediction data is highly likely to be incorrect.
- Such a determination of whether the prediction data is correct or not is particularly effective in a case where a new consumable is a prediction target.
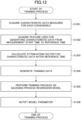
- FIG. 12 is a flowchart illustrating the flow of the training process.
- step S1201 the characteristic measuring device 110 acquires characteristic data generated for each consumable.
- step S1202 the training data generating device 120 acquires a feature used for generating the characteristic data from the measurement start time to the reference time for each consumable.
- step S1203 the training data generating device 120 calculates an attenuation factor for the characteristic data after the reference time for each consumable.
- step S1204 the training data generating device 120 generates training data.
- step S1205 the training device 130 performs a training process on the Gaussian process regression model with the training data.
- step S1206 the training device 130 notifies the prediction data display device 330 of (model parameters of) the trained Gaussian process regression model generated by performing the training process.
- FIG. 13 is a first flowchart illustrating the flow of the prediction data display process.
- step S1301 the predictive data generating device 320 acquires the characteristic data from the measurement start time to the reference time, which has been generated by the characteristic measuring device 110 for a consumable to be predicted.
- step S1302 the predictive data generating device 320 acquires the feature used when the characteristic measuring device 110 generates the characteristic data from the measurement start time to the reference time for the consumable to be predicted.
- step S1303 the predictive data generating device 320 generates predictive data.
- step S1304 the prediction data display device 330 calculates a similarity between the feature for each consumable stored as the training data and the feature for the consumable to be predicted stored as the predictive data.
- step S1305 the prediction data display device 330 converts the scale of the characteristic data after the reference time for each consumable, the characteristic data having been stored as the training data.
- step S1306 the prediction data display device 330 determines a display appearance with which the characteristic data after the reference time for each consumable, on which the scale conversion has been performed, is displayed based on the corresponding similarity.
- step S1307 the prediction data display device 330 inputs the feature from the measurement start time to the reference time for the consumable to be predicted to the trained Gaussian process regression model.
- step S1308 the prediction data display device 330 acquires a predicted attenuation factor and a 95% confidence interval thereof.
- step S1309 the prediction data display device 330 converts the scales of the acquired predicted attenuation factor and 95% confidence interval to obtain prediction data and a 95% confidence interval (converted into the characteristic data).
- step S1310 the prediction data display device 330 generates a combined graph combining the following:
- step S1311 the prediction data display device 330 generates a text table in which the similarity is associated with the consumable type and the manufacturing condition.
- step S1312 the prediction data display device 330 generates a display screen including the combined graph and the text table, and displays the screen.
- the prediction data display system includes:
- the present embodiment enables to more easily determine whether or not prediction data is correct.
- the user compares the prediction data for the consumable to be predicted with the characteristic data for each consumable included in the training data in a graph form, thereby easily determining whether the prediction data is correct.
- the prediction data for the consumable to be predicted and the characteristic data for each consumable included in training data are quantified using a 95% confidence interval and compared. The second embodiment will be described below, focusing on the differences from the first embodiment.
- FIG. 14 is a third diagram illustrating a specific example of the processing of the display screen generating part of the prediction data display device. The difference from the specific example described with reference to FIG. 10 is that a display screen generating part 1410 of FIG. 14 includes a level calculation part 1411.
- the level calculation part 1411 acquires the 95% confidence interval (converted into the characteristic data) for the prediction data from the second scale converter 333, and calculates a width (converted into the characteristic data) of the 95% confidence interval for the prediction data.
- the level calculation part 1411 also acquires, as a worst value and a best value, a maximum width and a minimum width (converted into the characteristic data) of the 95% confidence interval calculated when the training process is performed on the Gaussian process regression model 131 with the training data 121, from the training device 130.
- the level calculation part 1411 then compares the width (converted into the characteristic data) of the 95% confidence interval for the prediction data with the worst value and the best value acquired from the training device 130. Accordingly, the level calculation part 1411 calculates a level of normality of the width (converted into the characteristic data) of the 95% confidence interval for the prediction data.
- a data table 1421 is an example of a table containing the level calculated by the level calculation part 1411.
- "Best value” is the minimum width (converted into the characteristic data) of the 95% confidence interval acquired from the training device 130, and is "0.016" in the example of FIG. 14 .
- "Worst value” is the maximum width (converted into the characteristic data) of the 95% confidence interval acquired from the training device 130, and is "0.298" in the example of FIG. 14 .
- Prediction value is the width (converted into the characteristic data) of the 95% confidence interval for the prediction data, and is "0.083" in the example of FIG. 14 .
- Level is the level of the degree of normality of the width (converted into the characteristic data) of the 95% confidence interval for the prediction data.
- FIG. 15 is a second flowchart illustrating the flow of the prediction data display process. The difference from the flowchart described with reference to FIG. 13 is steps S1501 and S1502 to S1504.
- step S1501 the prediction data display device 330 acquires, as a worst value and a best value, a maximum width and a minimum width (converted into the characteristic data) of the 95% confidence interval calculated when the training process is performed on the Gaussian process regression model in the training phase.
- step S1502 the prediction data display device 330 compares the 95% confidence interval (converted into the characteristic data) acquired in step S1309 with the worst value and the best value acquired in step S1501. Thus, the prediction data display device 330 calculates a level of normality of the width (converted into the characteristic data) of the 95% confidence interval for the prediction data.
- step S1503 the prediction data display device 330 generates a text table in which the similarity is associated with the consumable type and the manufacturing condition.
- the prediction data display device 330 also generates a data table containing the calculated level.
- step S1504 the prediction data display device 330 generates a display screen including the combined graph, the text table, and the data table, and displays the screen.
- the prediction data display system includes:
- the level of the degree of normality of the calculated prediction data can be quantified. As a result, the user can more easily determine whether the prediction data is correct or not.
- the present embodiment enables to more easily determine whether or not prediction data is correct.
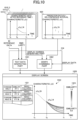
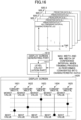
- FIG. 16 is a fourth diagram illustrating a specific example of the processing of the display screen generating part of the prediction data display device.
- a display screen generating part 1610 includes the level calculation part 1411.
- the function of the level calculation part 1411 has been described in the second embodiment with reference to FIG. 14 , and the description thereof will be omitted.
- the level calculation part 1411 illustrated in FIG. 16 there are a plurality of consumables to be predicted (five in the example of FIG. 16 ), and a plurality of 95% confidence intervals (converted into the characteristic data) is acquired from the second scale converter 333.
- a width (converted into the characteristic data) of the 95% confidence interval is calculated for each of the plurality of acquired 95% confidence intervals (converted into the characteristic data).
- a level of the degree of normality is calculated by comparing each of the calculated widths (converted into the characteristic data) of the plurality of 95% confidence intervals with the worst value and the best value thereof.
- box plots are generated based on each of the calculated levels, the worst values, and best values, and are displayed on a display screen 1620.
- a box plot 1621 represents a level calculated based on the width (converted into the characteristic data) of a 95% confidence interval when the prediction data for a consumable N 1 to be predicted is predicted.
- box plots 1622 to 1625 represent levels calculated based on the widths (converted into the characteristic data) of 95% confidence intervals when the prediction data for a consumable N 2 to be predicted to a consumable N 5 to be predicted is predicted.
- the prediction data display system includes:
- the user can visually recognize the calculated levels of the degrees of normality of the plurality of prediction data, and can easily determine whether the plurality of prediction data is correct.
- the present embodiment enables to more easily determine whether a plurality of prediction data is correct.
- the training device and the prediction device are described as separate devices. However, the training device and the prediction device may be configured as an integrated device. Furthermore, in the above embodiments, the training data generating device and the training device are described as separate devices. However, the training data generating device and the training device may be configured as an integrated device. Similarly, in the above embodiments, the predictive data generating device and the prediction data display device are described as separate devices. However, the predictive data generating device and the prediction data display device may be configured as an integrated device.
- the similarity calculation part is described as a part of the functions of the trained Gaussian process regression model, but may be implemented as a function part different from the trained Gaussian process regression model.
- the similarity calculation part may calculate a similarity by any method, and any function may be used as long as the function increases a similarity when the difference value between the features is small.
- the discharge capacity retention rate of the battery is exemplified as the characteristic data indicating the degree of deterioration of the consumable.
- the characteristic data indicating the degree of deterioration of the consumable may be characteristic data other than the discharge capacity retention rate of the battery.
- the battery is exemplified as a consumable, but a consumable may be an article other than the battery.
- r X y(t X )/y(t B ) is calculated as an attenuation factor, but the method of calculating the attenuation factor is not limited thereto.
- an attenuation factor obtained by converting r X by the following Equation 3 may be used.
- Attenuation factor after conversion l o g r X / 1 ⁇ r X
- the attenuation factor before the conversion can be calculated by the following Equation 4 for the attenuation factor after the conversion output from the trained Gaussian process regression model.
- the calculated attenuation factor is 0 ⁇ r X ⁇ 1.
- the prediction data for a consumable to be predicted may be used for the manufacturing condition of the consumable to be predicted.
- the consumable to be predicted is a battery (for example, a lithium ion secondary battery)
- the conditions for activation, aging, and the like after completion of battery assembly may be determined based on the prediction data.
Landscapes
- Engineering & Computer Science (AREA)
- General Physics & Mathematics (AREA)
- Physics & Mathematics (AREA)
- Business, Economics & Management (AREA)
- Theoretical Computer Science (AREA)
- Software Systems (AREA)
- Strategic Management (AREA)
- Human Resources & Organizations (AREA)
- Economics (AREA)
- Mathematical Physics (AREA)
- Chemical Kinetics & Catalysis (AREA)
- Evolutionary Computation (AREA)
- Medical Informatics (AREA)
- Computer Vision & Pattern Recognition (AREA)
- Computing Systems (AREA)
- General Engineering & Computer Science (AREA)
- Artificial Intelligence (AREA)
- General Chemical & Material Sciences (AREA)
- Electrochemistry (AREA)
- Development Economics (AREA)
- Data Mining & Analysis (AREA)
- Game Theory and Decision Science (AREA)
- Chemical & Material Sciences (AREA)
- Manufacturing & Machinery (AREA)
- Entrepreneurship & Innovation (AREA)
- Marketing (AREA)
- Operations Research (AREA)
- Quality & Reliability (AREA)
- Tourism & Hospitality (AREA)
- General Business, Economics & Management (AREA)
- Management, Administration, Business Operations System, And Electronic Commerce (AREA)
- Tests Of Electric Status Of Batteries (AREA)
- Testing And Monitoring For Control Systems (AREA)
Applications Claiming Priority (2)
| Application Number | Priority Date | Filing Date | Title |
|---|---|---|---|
| JP2021150217 | 2021-09-15 | ||
| PCT/JP2022/034046 WO2023042790A1 (ja) | 2021-09-15 | 2022-09-12 | 予測データ表示装置、予測データ表示方法及び予測データ表示プログラム |
Publications (2)
| Publication Number | Publication Date |
|---|---|
| EP4404113A1 true EP4404113A1 (de) | 2024-07-24 |
| EP4404113A4 EP4404113A4 (de) | 2025-09-17 |
Family
ID=85602879
Family Applications (1)
| Application Number | Title | Priority Date | Filing Date |
|---|---|---|---|
| EP22869937.7A Pending EP4404113A4 (de) | 2021-09-15 | 2022-09-12 | Anzeigevorrichtung für vorhersagedaten, anzeigeverfahren für vorhersagedaten und anzeigeprogramm für vorhersagedaten |
Country Status (5)
| Country | Link |
|---|---|
| US (1) | US20240377468A1 (de) |
| EP (1) | EP4404113A4 (de) |
| JP (2) | JP7380956B2 (de) |
| CN (1) | CN117980928A (de) |
| WO (1) | WO2023042790A1 (de) |
Family Cites Families (8)
| Publication number | Priority date | Publication date | Assignee | Title |
|---|---|---|---|---|
| US9316699B2 (en) | 2012-04-05 | 2016-04-19 | Samsung Sdi Co., Ltd. | System for predicting lifetime of battery |
| US10191116B2 (en) * | 2015-10-15 | 2019-01-29 | Johnson Controls Technology Company | Battery test system for predicting battery test results |
| US11226374B2 (en) | 2017-10-17 | 2022-01-18 | The Board Of Trustees Of The Leland Stanford Junior University | Data-driven model for lithium-ion battery capacity fade and lifetime prediction |
| US11340306B2 (en) * | 2017-11-16 | 2022-05-24 | Semiconductor Energy Laboratory Co., Ltd. | Lifetime estimation device, lifetime estimation method, and abnormality detection method of secondary battery |
| US11243262B2 (en) * | 2018-03-20 | 2022-02-08 | Gs Yuasa International Ltd. | Degradation estimation apparatus, computer program, and degradation estimation method |
| JP7413806B2 (ja) * | 2020-02-06 | 2024-01-16 | トヨタ自動車株式会社 | バッテリ劣化判定装置、バッテリ劣化判定方法、及びバッテリ劣化判定プログラム |
| JP7156328B2 (ja) | 2020-03-23 | 2022-10-19 | トヨタ自動車株式会社 | 燃料電池用触媒層の製造方法 |
| CN111413619B (zh) * | 2020-03-30 | 2021-01-22 | 上海交通大学 | 基于高斯过程回归的多工况电池剩余容量预测方法及系统 |
-
2022
- 2022-09-12 EP EP22869937.7A patent/EP4404113A4/de active Pending
- 2022-09-12 US US18/689,585 patent/US20240377468A1/en active Pending
- 2022-09-12 JP JP2023533588A patent/JP7380956B2/ja active Active
- 2022-09-12 WO PCT/JP2022/034046 patent/WO2023042790A1/ja not_active Ceased
- 2022-09-12 CN CN202280061127.7A patent/CN117980928A/zh active Pending
-
2023
- 2023-10-11 JP JP2023176092A patent/JP2023182763A/ja active Pending
Also Published As
| Publication number | Publication date |
|---|---|
| US20240377468A1 (en) | 2024-11-14 |
| WO2023042790A1 (ja) | 2023-03-23 |
| JP2023182763A (ja) | 2023-12-26 |
| CN117980928A (zh) | 2024-05-03 |
| EP4404113A4 (de) | 2025-09-17 |
| JP7380956B2 (ja) | 2023-11-15 |
| JPWO2023042790A1 (de) | 2023-03-23 |
Similar Documents
| Publication | Publication Date | Title |
|---|---|---|
| US11637330B2 (en) | Battery charging method and apparatus | |
| Khaleghi et al. | Online health diagnosis of lithium-ion batteries based on nonlinear autoregressive neural network | |
| US10718815B2 (en) | Method and apparatus for estimating state of battery based on error correction | |
| EP3413067B1 (de) | Verfahren und vorrichtung zur schätzung des gesundheitszustandes eines batteriepacks | |
| CN101809456B (zh) | 用于估计电池的长期特性的系统和方法 | |
| EP4160784A1 (de) | Verschlechterungsschätzvorrichtung, modellerzeugungsvorrichtung, verschlechterungsschätzverfahren, modellerzeugungsverfahren und programm | |
| US20150316618A1 (en) | Methods and apparatus for battery power and energy availability prediction | |
| EP2206191A2 (de) | System und verfahren zur schätzung von langzeiteigenschaften einer batterie | |
| Stadler et al. | Investigation and modeling of cyclic aging using a design of experiment with automotive grade lithium-ion cells | |
| EP3913727B1 (de) | Batterierestwertbestimmungssystem | |
| EP4007040A1 (de) | Zellenstabilisierungsverfahren und -system eines energiespeichersystems (ess) | |
| Steininger et al. | Automated feature extraction to integrate field and laboratory data for aging diagnosis of automotive lithium-ion batteries | |
| CN115840151B (zh) | 电池容量一致性的分析方法、装置和计算机设备 | |
| KR20190015991A (ko) | 배터리 상태를 예측하기 위한 배터리 관리 방법 및 시스템 | |
| US20240426934A1 (en) | Electronic apparatus and method with battery state estimation | |
| EP4498560A1 (de) | Informationsverarbeitungsvorrichtung, informationsverarbeitungsverfahren, informationsverarbeitungssystem und computerprogramm | |
| EP4404113A1 (de) | Anzeigevorrichtung für vorhersagedaten, anzeigeverfahren für vorhersagedaten und anzeigeprogramm für vorhersagedaten | |
| US12443152B2 (en) | Remaining capacity estimation apparatus, model generation apparatus, and non-transitory computer-readable medium | |
| EP4170560A1 (de) | Maschinenlerntrainingsvorrichtung und betriebsverfahren dafür | |
| EP4592695A1 (de) | Vorrichtung zur vorhersage des verschleisses einer sekundärbatterie und verfahren zur vorhersage des verschleisses für eine sekundärbatterie | |
| Shen et al. | MambaSOH: Dual-stream Mamba network with nonuniform feature fusion for lithium-ion battery state-of-health estimation | |
| US20250208219A1 (en) | Secondary battery characteristic acquisition system and secondary battery characteristic acquisition method | |
| CN113219355B (zh) | 电池选型方法、装置、设备及存储介质 | |
| US20230316073A1 (en) | Data processing system, model generation device, data processing method, model generation method, and program | |
| EP4729960A1 (de) | Elektrische vorrichtung und verfahren zum betrieb einer elektrischen vorrichtung zur berechnung des integrierten ladezustands für ein batteriepack |
Legal Events
| Date | Code | Title | Description |
|---|---|---|---|
| STAA | Information on the status of an ep patent application or granted ep patent |
Free format text: STATUS: THE INTERNATIONAL PUBLICATION HAS BEEN MADE |
|
| PUAI | Public reference made under article 153(3) epc to a published international application that has entered the european phase |
Free format text: ORIGINAL CODE: 0009012 |
|
| STAA | Information on the status of an ep patent application or granted ep patent |
Free format text: STATUS: REQUEST FOR EXAMINATION WAS MADE |
|
| 17P | Request for examination filed |
Effective date: 20240329 |
|
| AK | Designated contracting states |
Kind code of ref document: A1 Designated state(s): AL AT BE BG CH CY CZ DE DK EE ES FI FR GB GR HR HU IE IS IT LI LT LU LV MC MK MT NL NO PL PT RO RS SE SI SK SM TR |
|
| DAV | Request for validation of the european patent (deleted) | ||
| DAX | Request for extension of the european patent (deleted) | ||
| A4 | Supplementary search report drawn up and despatched |
Effective date: 20250819 |
|
| RIC1 | Information provided on ipc code assigned before grant |
Ipc: G06Q 10/04 20230101AFI20250812BHEP Ipc: G01R 31/392 20190101ALI20250812BHEP Ipc: G06N 20/10 20190101ALI20250812BHEP Ipc: H01M 10/48 20060101ALI20250812BHEP |
|
| STAA | Information on the status of an ep patent application or granted ep patent |
Free format text: STATUS: EXAMINATION IS IN PROGRESS |
|
| 17Q | First examination report despatched |
Effective date: 20251218 |
|
| REG | Reference to a national code |
Ref country code: DE Ref legal event code: R079 Free format text: PREVIOUS MAIN CLASS: G06Q0010040000 Ipc: G06N0020100000 |
|
| GRAP | Despatch of communication of intention to grant a patent |
Free format text: ORIGINAL CODE: EPIDOSNIGR1 |
|
| RIC1 | Information provided on ipc code assigned before grant |
Ipc: G06N 20/10 20190101AFI20260305BHEP Ipc: G06Q 10/04 20230101ALI20260305BHEP Ipc: H01M 10/48 20060101ALI20260305BHEP Ipc: G01R 31/392 20190101ALI20260305BHEP Ipc: G01R 31/367 20190101ALI20260305BHEP |
|
| STAA | Information on the status of an ep patent application or granted ep patent |
Free format text: STATUS: GRANT OF PATENT IS INTENDED |