EP4358097A1 - Procédés de détermination de types de tissus et/ou de cellules permettant d'obtenir de l'adn sans cellules, et procédés d'identification d'une maladie ou d'un trouble les employant - Google Patents
Procédés de détermination de types de tissus et/ou de cellules permettant d'obtenir de l'adn sans cellules, et procédés d'identification d'une maladie ou d'un trouble les employant Download PDFInfo
- Publication number
- EP4358097A1 EP4358097A1 EP23197187.0A EP23197187A EP4358097A1 EP 4358097 A1 EP4358097 A1 EP 4358097A1 EP 23197187 A EP23197187 A EP 23197187A EP 4358097 A1 EP4358097 A1 EP 4358097A1
- Authority
- EP
- European Patent Office
- Prior art keywords
- cfdna
- nucleosome
- cell
- biological sample
- fragment
- Prior art date
- Legal status (The legal status is an assumption and is not a legal conclusion. Google has not performed a legal analysis and makes no representation as to the accuracy of the status listed.)
- Pending
Links
- 238000000034 method Methods 0.000 title claims abstract description 332
- 208000037265 diseases, disorders, signs and symptoms Diseases 0.000 title abstract description 128
- 201000010099 disease Diseases 0.000 title abstract description 73
- 208000035475 disorder Diseases 0.000 title abstract description 55
- 239000012472 biological sample Substances 0.000 claims abstract description 129
- 239000012634 fragment Substances 0.000 claims description 312
- 108010047956 Nucleosomes Proteins 0.000 claims description 307
- 210000001623 nucleosome Anatomy 0.000 claims description 307
- 210000001519 tissue Anatomy 0.000 claims description 278
- 210000004027 cell Anatomy 0.000 claims description 244
- 238000009826 distribution Methods 0.000 claims description 159
- 238000012163 sequencing technique Methods 0.000 claims description 107
- 108020004414 DNA Proteins 0.000 claims description 102
- 230000009466 transformation Effects 0.000 claims description 87
- 206010028980 Neoplasm Diseases 0.000 claims description 86
- 108090000623 proteins and genes Proteins 0.000 claims description 79
- 230000014509 gene expression Effects 0.000 claims description 67
- 239000000523 sample Substances 0.000 claims description 65
- 108010077544 Chromatin Proteins 0.000 claims description 53
- 210000003483 chromatin Anatomy 0.000 claims description 53
- 201000011510 cancer Diseases 0.000 claims description 50
- 239000000203 mixture Substances 0.000 claims description 47
- 210000002381 plasma Anatomy 0.000 claims description 45
- 101710163270 Nuclease Proteins 0.000 claims description 36
- 206010020751 Hypersensitivity Diseases 0.000 claims description 33
- 238000004458 analytical method Methods 0.000 claims description 33
- 238000010276 construction Methods 0.000 claims description 32
- 238000003776 cleavage reaction Methods 0.000 claims description 31
- 230000007017 scission Effects 0.000 claims description 31
- 102000004169 proteins and genes Human genes 0.000 claims description 29
- 230000029087 digestion Effects 0.000 claims description 21
- 230000004568 DNA-binding Effects 0.000 claims description 19
- 210000004369 blood Anatomy 0.000 claims description 13
- 239000008280 blood Substances 0.000 claims description 13
- 239000011886 peripheral blood Substances 0.000 claims description 13
- 210000005259 peripheral blood Anatomy 0.000 claims description 13
- 208000026935 allergic disease Diseases 0.000 claims description 10
- 230000009610 hypersensitivity Effects 0.000 claims description 10
- 108010033040 Histones Proteins 0.000 claims description 8
- 238000012408 PCR amplification Methods 0.000 claims description 8
- 238000002487 chromatin immunoprecipitation Methods 0.000 claims description 7
- 238000012545 processing Methods 0.000 claims description 7
- 210000002700 urine Anatomy 0.000 claims description 7
- 210000001175 cerebrospinal fluid Anatomy 0.000 claims description 6
- 230000008859 change Effects 0.000 claims description 3
- 102000040945 Transcription factor Human genes 0.000 description 91
- 108091023040 Transcription factor Proteins 0.000 description 91
- 230000027455 binding Effects 0.000 description 79
- 108010059724 Micrococcal Nuclease Proteins 0.000 description 64
- 102000016897 CCCTC-Binding Factor Human genes 0.000 description 46
- 108010014064 CCCTC-Binding Factor Proteins 0.000 description 46
- 230000035935 pregnancy Effects 0.000 description 32
- 230000000875 corresponding effect Effects 0.000 description 26
- 238000011316 allogeneic transplantation Methods 0.000 description 24
- 108700009124 Transcription Initiation Site Proteins 0.000 description 23
- 210000000349 chromosome Anatomy 0.000 description 22
- 108010008532 Deoxyribonuclease I Proteins 0.000 description 21
- 102000007260 Deoxyribonuclease I Human genes 0.000 description 21
- 238000002360 preparation method Methods 0.000 description 21
- 238000013467 fragmentation Methods 0.000 description 20
- 238000006062 fragmentation reaction Methods 0.000 description 20
- 230000000451 tissue damage Effects 0.000 description 18
- 231100000827 tissue damage Toxicity 0.000 description 18
- 208000023275 Autoimmune disease Diseases 0.000 description 15
- 208000036878 aneuploidy Diseases 0.000 description 15
- 239000011324 bead Substances 0.000 description 15
- 208000010125 myocardial infarction Diseases 0.000 description 15
- FAPWRFPIFSIZLT-UHFFFAOYSA-M Sodium chloride Chemical compound [Na+].[Cl-] FAPWRFPIFSIZLT-UHFFFAOYSA-M 0.000 description 14
- 230000000694 effects Effects 0.000 description 14
- 238000011144 upstream manufacturing Methods 0.000 description 13
- 108091032973 (ribonucleotides)n+m Proteins 0.000 description 12
- 206010061452 Complication of pregnancy Diseases 0.000 description 12
- 108010053770 Deoxyribonucleases Proteins 0.000 description 12
- 102000016911 Deoxyribonucleases Human genes 0.000 description 12
- 208000022559 Inflammatory bowel disease Diseases 0.000 description 12
- 208000018359 Systemic autoimmune disease Diseases 0.000 description 12
- 230000003322 aneuploid effect Effects 0.000 description 12
- 238000013518 transcription Methods 0.000 description 12
- 230000035897 transcription Effects 0.000 description 12
- 210000001124 body fluid Anatomy 0.000 description 11
- 230000002596 correlated effect Effects 0.000 description 11
- 210000005260 human cell Anatomy 0.000 description 11
- 238000004088 simulation Methods 0.000 description 11
- KCXVZYZYPLLWCC-UHFFFAOYSA-N EDTA Chemical compound OC(=O)CN(CC(O)=O)CCN(CC(O)=O)CC(O)=O KCXVZYZYPLLWCC-UHFFFAOYSA-N 0.000 description 10
- 239000000872 buffer Substances 0.000 description 9
- 238000001727 in vivo Methods 0.000 description 9
- 230000003394 haemopoietic effect Effects 0.000 description 8
- 206010073071 hepatocellular carcinoma Diseases 0.000 description 8
- 238000003199 nucleic acid amplification method Methods 0.000 description 8
- 102000004190 Enzymes Human genes 0.000 description 7
- 108090000790 Enzymes Proteins 0.000 description 7
- 238000005516 engineering process Methods 0.000 description 7
- 238000002474 experimental method Methods 0.000 description 7
- 231100000844 hepatocellular carcinoma Toxicity 0.000 description 7
- 238000000513 principal component analysis Methods 0.000 description 7
- 239000011780 sodium chloride Substances 0.000 description 7
- 230000002103 transcriptional effect Effects 0.000 description 7
- QKNYBSVHEMOAJP-UHFFFAOYSA-N 2-amino-2-(hydroxymethyl)propane-1,3-diol;hydron;chloride Chemical compound Cl.OCC(N)(CO)CO QKNYBSVHEMOAJP-UHFFFAOYSA-N 0.000 description 6
- 229920001213 Polysorbate 20 Polymers 0.000 description 6
- 206010041067 Small cell lung cancer Diseases 0.000 description 6
- 206010052779 Transplant rejections Diseases 0.000 description 6
- 238000013459 approach Methods 0.000 description 6
- 238000001574 biopsy Methods 0.000 description 6
- 238000006243 chemical reaction Methods 0.000 description 6
- 210000004698 lymphocyte Anatomy 0.000 description 6
- 238000013507 mapping Methods 0.000 description 6
- 210000000066 myeloid cell Anatomy 0.000 description 6
- 210000004940 nucleus Anatomy 0.000 description 6
- 239000000256 polyoxyethylene sorbitan monolaurate Substances 0.000 description 6
- 235000010486 polyoxyethylene sorbitan monolaurate Nutrition 0.000 description 6
- 230000017105 transposition Effects 0.000 description 6
- 206010006187 Breast cancer Diseases 0.000 description 5
- 241001465754 Metazoa Species 0.000 description 5
- 229940124158 Protease/peptidase inhibitor Drugs 0.000 description 5
- 102000008579 Transposases Human genes 0.000 description 5
- 108010020764 Transposases Proteins 0.000 description 5
- 230000004931 aggregating effect Effects 0.000 description 5
- 230000003321 amplification Effects 0.000 description 5
- 238000005119 centrifugation Methods 0.000 description 5
- 238000001514 detection method Methods 0.000 description 5
- 230000036210 malignancy Effects 0.000 description 5
- 238000012544 monitoring process Methods 0.000 description 5
- 239000000137 peptide hydrolase inhibitor Substances 0.000 description 5
- 230000008569 process Effects 0.000 description 5
- 208000000587 small cell lung carcinoma Diseases 0.000 description 5
- 238000012360 testing method Methods 0.000 description 5
- YBJHBAHKTGYVGT-ZKWXMUAHSA-N (+)-Biotin Chemical compound N1C(=O)N[C@@H]2[C@H](CCCCC(=O)O)SC[C@@H]21 YBJHBAHKTGYVGT-ZKWXMUAHSA-N 0.000 description 4
- 108700028369 Alleles Proteins 0.000 description 4
- 206010052360 Colorectal adenocarcinoma Diseases 0.000 description 4
- 102000053602 DNA Human genes 0.000 description 4
- 101001050288 Homo sapiens Transcription factor Jun Proteins 0.000 description 4
- TWRXJAOTZQYOKJ-UHFFFAOYSA-L Magnesium chloride Chemical compound [Mg+2].[Cl-].[Cl-] TWRXJAOTZQYOKJ-UHFFFAOYSA-L 0.000 description 4
- AYCPARAPKDAOEN-LJQANCHMSA-N N-[(1S)-2-(dimethylamino)-1-phenylethyl]-6,6-dimethyl-3-[(2-methyl-4-thieno[3,2-d]pyrimidinyl)amino]-1,4-dihydropyrrolo[3,4-c]pyrazole-5-carboxamide Chemical compound C1([C@H](NC(=O)N2C(C=3NN=C(NC=4C=5SC=CC=5N=C(C)N=4)C=3C2)(C)C)CN(C)C)=CC=CC=C1 AYCPARAPKDAOEN-LJQANCHMSA-N 0.000 description 4
- 108020005067 RNA Splice Sites Proteins 0.000 description 4
- 102100023132 Transcription factor Jun Human genes 0.000 description 4
- 230000006907 apoptotic process Effects 0.000 description 4
- 238000003759 clinical diagnosis Methods 0.000 description 4
- 238000002405 diagnostic procedure Methods 0.000 description 4
- 230000001605 fetal effect Effects 0.000 description 4
- 230000000670 limiting effect Effects 0.000 description 4
- 201000005243 lung squamous cell carcinoma Diseases 0.000 description 4
- 230000008774 maternal effect Effects 0.000 description 4
- 230000008520 organization Effects 0.000 description 4
- 230000000737 periodic effect Effects 0.000 description 4
- 239000002096 quantum dot Substances 0.000 description 4
- ATHGHQPFGPMSJY-UHFFFAOYSA-N spermidine Chemical compound NCCCCNCCCN ATHGHQPFGPMSJY-UHFFFAOYSA-N 0.000 description 4
- 238000011285 therapeutic regimen Methods 0.000 description 4
- 241000576133 Alphasatellites Species 0.000 description 3
- 108091023043 Alu Element Proteins 0.000 description 3
- 208000031404 Chromosome Aberrations Diseases 0.000 description 3
- 230000005778 DNA damage Effects 0.000 description 3
- 231100000277 DNA damage Toxicity 0.000 description 3
- PEDCQBHIVMGVHV-UHFFFAOYSA-N Glycerine Chemical compound OCC(O)CO PEDCQBHIVMGVHV-UHFFFAOYSA-N 0.000 description 3
- 101150009243 HAP1 gene Proteins 0.000 description 3
- 238000011529 RT qPCR Methods 0.000 description 3
- 102100039190 Transcription factor MafK Human genes 0.000 description 3
- 208000037280 Trisomy Diseases 0.000 description 3
- 230000009692 acute damage Effects 0.000 description 3
- 231100001075 aneuploidy Toxicity 0.000 description 3
- 238000003556 assay Methods 0.000 description 3
- 230000008901 benefit Effects 0.000 description 3
- 210000001185 bone marrow Anatomy 0.000 description 3
- 201000008274 breast adenocarcinoma Diseases 0.000 description 3
- 230000002759 chromosomal effect Effects 0.000 description 3
- 231100000005 chromosome aberration Toxicity 0.000 description 3
- 230000009693 chronic damage Effects 0.000 description 3
- 239000003814 drug Substances 0.000 description 3
- 230000001973 epigenetic effect Effects 0.000 description 3
- 210000005003 heart tissue Anatomy 0.000 description 3
- 230000001394 metastastic effect Effects 0.000 description 3
- 206010061289 metastatic neoplasm Diseases 0.000 description 3
- 102000039446 nucleic acids Human genes 0.000 description 3
- 108020004707 nucleic acids Proteins 0.000 description 3
- 150000007523 nucleic acids Chemical class 0.000 description 3
- 239000002773 nucleotide Substances 0.000 description 3
- 125000003729 nucleotide group Chemical group 0.000 description 3
- 238000003753 real-time PCR Methods 0.000 description 3
- 230000001105 regulatory effect Effects 0.000 description 3
- 230000000717 retained effect Effects 0.000 description 3
- 102000005969 steroid hormone receptors Human genes 0.000 description 3
- 108020003113 steroid hormone receptors Proteins 0.000 description 3
- 239000006228 supernatant Substances 0.000 description 3
- 230000008685 targeting Effects 0.000 description 3
- 238000000844 transformation Methods 0.000 description 3
- 239000011534 wash buffer Substances 0.000 description 3
- 208000031261 Acute myeloid leukaemia Diseases 0.000 description 2
- 108020000992 Ancient DNA Proteins 0.000 description 2
- 238000012935 Averaging Methods 0.000 description 2
- 208000026310 Breast neoplasm Diseases 0.000 description 2
- HEDRZPFGACZZDS-UHFFFAOYSA-N Chloroform Chemical compound ClC(Cl)Cl HEDRZPFGACZZDS-UHFFFAOYSA-N 0.000 description 2
- 102000016928 DNA-directed DNA polymerase Human genes 0.000 description 2
- 108010014303 DNA-directed DNA polymerase Proteins 0.000 description 2
- -1 ETS Proteins 0.000 description 2
- 102000043138 IRF family Human genes 0.000 description 2
- 208000037396 Intraductal Noninfiltrating Carcinoma Diseases 0.000 description 2
- 206010073094 Intraductal proliferative breast lesion Diseases 0.000 description 2
- 101150117406 Mafk gene Proteins 0.000 description 2
- 102100022201 Nuclear transcription factor Y subunit beta Human genes 0.000 description 2
- 101710205449 Nuclear transcription factor Y subunit beta Proteins 0.000 description 2
- 239000008118 PEG 6000 Substances 0.000 description 2
- 208000037273 Pathologic Processes Diseases 0.000 description 2
- 229920002584 Polyethylene Glycol 6000 Polymers 0.000 description 2
- 102100030852 Run domain Beclin-1-interacting and cysteine-rich domain-containing protein Human genes 0.000 description 2
- 101710179516 Run domain Beclin-1-interacting and cysteine-rich domain-containing protein Proteins 0.000 description 2
- 108091081024 Start codon Proteins 0.000 description 2
- 238000003491 array Methods 0.000 description 2
- 229960002685 biotin Drugs 0.000 description 2
- 235000020958 biotin Nutrition 0.000 description 2
- 239000011616 biotin Substances 0.000 description 2
- 210000000601 blood cell Anatomy 0.000 description 2
- 238000004422 calculation algorithm Methods 0.000 description 2
- 230000030833 cell death Effects 0.000 description 2
- 108091092240 circulating cell-free DNA Proteins 0.000 description 2
- 239000007771 core particle Substances 0.000 description 2
- 230000003247 decreasing effect Effects 0.000 description 2
- 238000012350 deep sequencing Methods 0.000 description 2
- 208000037765 diseases and disorders Diseases 0.000 description 2
- 208000028715 ductal breast carcinoma in situ Diseases 0.000 description 2
- 201000007273 ductal carcinoma in situ Diseases 0.000 description 2
- 230000002255 enzymatic effect Effects 0.000 description 2
- 238000000605 extraction Methods 0.000 description 2
- 210000003754 fetus Anatomy 0.000 description 2
- 239000000499 gel Substances 0.000 description 2
- 230000036541 health Effects 0.000 description 2
- 238000010438 heat treatment Methods 0.000 description 2
- 210000003958 hematopoietic stem cell Anatomy 0.000 description 2
- 210000003917 human chromosome Anatomy 0.000 description 2
- 238000000338 in vitro Methods 0.000 description 2
- 230000003993 interaction Effects 0.000 description 2
- PHTQWCKDNZKARW-UHFFFAOYSA-N isoamylol Chemical compound CC(C)CCO PHTQWCKDNZKARW-UHFFFAOYSA-N 0.000 description 2
- 238000002955 isolation Methods 0.000 description 2
- 229910001629 magnesium chloride Inorganic materials 0.000 description 2
- 230000001404 mediated effect Effects 0.000 description 2
- 239000002609 medium Substances 0.000 description 2
- 230000009054 pathological process Effects 0.000 description 2
- 230000007170 pathology Effects 0.000 description 2
- 239000013610 patient sample Substances 0.000 description 2
- 239000008188 pellet Substances 0.000 description 2
- 238000003908 quality control method Methods 0.000 description 2
- 238000007634 remodeling Methods 0.000 description 2
- 238000011160 research Methods 0.000 description 2
- 230000002441 reversible effect Effects 0.000 description 2
- 238000005070 sampling Methods 0.000 description 2
- 230000011218 segmentation Effects 0.000 description 2
- 230000035945 sensitivity Effects 0.000 description 2
- 238000000926 separation method Methods 0.000 description 2
- 238000002864 sequence alignment Methods 0.000 description 2
- 238000000638 solvent extraction Methods 0.000 description 2
- 229940063673 spermidine Drugs 0.000 description 2
- 238000010561 standard procedure Methods 0.000 description 2
- 210000000130 stem cell Anatomy 0.000 description 2
- 201000000596 systemic lupus erythematosus Diseases 0.000 description 2
- 230000001225 therapeutic effect Effects 0.000 description 2
- 238000009966 trimming Methods 0.000 description 2
- VCGRFBXVSFAGGA-UHFFFAOYSA-N (1,1-dioxo-1,4-thiazinan-4-yl)-[6-[[3-(4-fluorophenyl)-5-methyl-1,2-oxazol-4-yl]methoxy]pyridin-3-yl]methanone Chemical compound CC=1ON=C(C=2C=CC(F)=CC=2)C=1COC(N=C1)=CC=C1C(=O)N1CCS(=O)(=O)CC1 VCGRFBXVSFAGGA-UHFFFAOYSA-N 0.000 description 1
- JKMHFZQWWAIEOD-UHFFFAOYSA-N 2-[4-(2-hydroxyethyl)piperazin-1-yl]ethanesulfonic acid Chemical compound OCC[NH+]1CCN(CCS([O-])(=O)=O)CC1 JKMHFZQWWAIEOD-UHFFFAOYSA-N 0.000 description 1
- KVCQTKNUUQOELD-UHFFFAOYSA-N 4-amino-n-[1-(3-chloro-2-fluoroanilino)-6-methylisoquinolin-5-yl]thieno[3,2-d]pyrimidine-7-carboxamide Chemical compound N=1C=CC2=C(NC(=O)C=3C4=NC=NC(N)=C4SC=3)C(C)=CC=C2C=1NC1=CC=CC(Cl)=C1F KVCQTKNUUQOELD-UHFFFAOYSA-N 0.000 description 1
- CYJRNFFLTBEQSQ-UHFFFAOYSA-N 8-(3-methyl-1-benzothiophen-5-yl)-N-(4-methylsulfonylpyridin-3-yl)quinoxalin-6-amine Chemical compound CS(=O)(=O)C1=C(C=NC=C1)NC=1C=C2N=CC=NC2=C(C=1)C=1C=CC2=C(C(=CS2)C)C=1 CYJRNFFLTBEQSQ-UHFFFAOYSA-N 0.000 description 1
- 208000036762 Acute promyelocytic leukaemia Diseases 0.000 description 1
- 102000002260 Alkaline Phosphatase Human genes 0.000 description 1
- 108020004774 Alkaline Phosphatase Proteins 0.000 description 1
- 102000014914 Carrier Proteins Human genes 0.000 description 1
- 102000015775 Core Binding Factor Alpha 1 Subunit Human genes 0.000 description 1
- 108010024682 Core Binding Factor Alpha 1 Subunit Proteins 0.000 description 1
- 102000012410 DNA Ligases Human genes 0.000 description 1
- 108010061982 DNA Ligases Proteins 0.000 description 1
- 230000007018 DNA scission Effects 0.000 description 1
- 102100038595 Estrogen receptor Human genes 0.000 description 1
- 208000032612 Glial tumor Diseases 0.000 description 1
- 201000010915 Glioblastoma multiforme Diseases 0.000 description 1
- 206010018338 Glioma Diseases 0.000 description 1
- 239000007995 HEPES buffer Substances 0.000 description 1
- 102000006947 Histones Human genes 0.000 description 1
- 241000282412 Homo Species 0.000 description 1
- 101000882584 Homo sapiens Estrogen receptor Proteins 0.000 description 1
- 101000909637 Homo sapiens Transcription factor COE1 Proteins 0.000 description 1
- 108091054729 IRF family Proteins 0.000 description 1
- 108010032038 Interferon Regulatory Factor-3 Proteins 0.000 description 1
- 102100029838 Interferon regulatory factor 2 Human genes 0.000 description 1
- 108090000908 Interferon regulatory factor 2 Proteins 0.000 description 1
- 102100029843 Interferon regulatory factor 3 Human genes 0.000 description 1
- 108091092195 Intron Proteins 0.000 description 1
- 206010024796 Logorrhoea Diseases 0.000 description 1
- 108010018650 MEF2 Transcription Factors Proteins 0.000 description 1
- 229910021380 Manganese Chloride Inorganic materials 0.000 description 1
- GLFNIEUTAYBVOC-UHFFFAOYSA-L Manganese chloride Chemical compound Cl[Mn]Cl GLFNIEUTAYBVOC-UHFFFAOYSA-L 0.000 description 1
- 102100021148 Myocyte-specific enhancer factor 2A Human genes 0.000 description 1
- WGZDBVOTUVNQFP-UHFFFAOYSA-N N-(1-phthalazinylamino)carbamic acid ethyl ester Chemical compound C1=CC=C2C(NNC(=O)OCC)=NN=CC2=C1 WGZDBVOTUVNQFP-UHFFFAOYSA-N 0.000 description 1
- 108091061960 Naked DNA Proteins 0.000 description 1
- 102000035195 Peptidases Human genes 0.000 description 1
- 108091005804 Peptidases Proteins 0.000 description 1
- ISWSIDIOOBJBQZ-UHFFFAOYSA-N Phenol Chemical compound OC1=CC=CC=C1 ISWSIDIOOBJBQZ-UHFFFAOYSA-N 0.000 description 1
- 208000033826 Promyelocytic Acute Leukemia Diseases 0.000 description 1
- 108010090804 Streptavidin Proteins 0.000 description 1
- 102100024207 Transcription factor COE1 Human genes 0.000 description 1
- 108050003949 Transcription factor MafK Proteins 0.000 description 1
- 230000005856 abnormality Effects 0.000 description 1
- 230000001154 acute effect Effects 0.000 description 1
- 238000000246 agarose gel electrophoresis Methods 0.000 description 1
- 210000000677 aggregate cell Anatomy 0.000 description 1
- 238000003782 apoptosis assay Methods 0.000 description 1
- 230000002902 bimodal effect Effects 0.000 description 1
- 239000012148 binding buffer Substances 0.000 description 1
- 108091008324 binding proteins Proteins 0.000 description 1
- 230000033228 biological regulation Effects 0.000 description 1
- 230000015572 biosynthetic process Effects 0.000 description 1
- 210000004556 brain Anatomy 0.000 description 1
- 208000014581 breast ductal adenocarcinoma Diseases 0.000 description 1
- 201000010983 breast ductal carcinoma Diseases 0.000 description 1
- 238000004364 calculation method Methods 0.000 description 1
- 230000015556 catabolic process Effects 0.000 description 1
- 230000001684 chronic effect Effects 0.000 description 1
- 238000011109 contamination Methods 0.000 description 1
- 238000013481 data capture Methods 0.000 description 1
- 230000034994 death Effects 0.000 description 1
- 238000006731 degradation reaction Methods 0.000 description 1
- 230000001419 dependent effect Effects 0.000 description 1
- 238000003745 diagnosis Methods 0.000 description 1
- 238000010790 dilution Methods 0.000 description 1
- 239000012895 dilution Substances 0.000 description 1
- 239000000539 dimer Substances 0.000 description 1
- 229940079593 drug Drugs 0.000 description 1
- 230000002708 enhancing effect Effects 0.000 description 1
- 230000006718 epigenetic regulation Effects 0.000 description 1
- 238000010195 expression analysis Methods 0.000 description 1
- 102000034356 gene-regulatory proteins Human genes 0.000 description 1
- 108091006104 gene-regulatory proteins Proteins 0.000 description 1
- 238000007429 general method Methods 0.000 description 1
- 230000002068 genetic effect Effects 0.000 description 1
- 208000005017 glioblastoma Diseases 0.000 description 1
- 238000009499 grossing Methods 0.000 description 1
- 239000001963 growth medium Substances 0.000 description 1
- 201000005787 hematologic cancer Diseases 0.000 description 1
- 208000024200 hematopoietic and lymphoid system neoplasm Diseases 0.000 description 1
- 230000011132 hemopoiesis Effects 0.000 description 1
- 210000000987 immune system Anatomy 0.000 description 1
- 238000011065 in-situ storage Methods 0.000 description 1
- 238000011534 incubation Methods 0.000 description 1
- 230000004054 inflammatory process Effects 0.000 description 1
- 230000000977 initiatory effect Effects 0.000 description 1
- 239000012212 insulator Substances 0.000 description 1
- 238000007917 intracranial administration Methods 0.000 description 1
- 206010073095 invasive ductal breast carcinoma Diseases 0.000 description 1
- 238000011901 isothermal amplification Methods 0.000 description 1
- 239000011565 manganese chloride Substances 0.000 description 1
- 239000000463 material Substances 0.000 description 1
- 238000005259 measurement Methods 0.000 description 1
- 230000007246 mechanism Effects 0.000 description 1
- 238000012986 modification Methods 0.000 description 1
- 230000004048 modification Effects 0.000 description 1
- 239000000178 monomer Substances 0.000 description 1
- 230000017074 necrotic cell death Effects 0.000 description 1
- 210000000056 organ Anatomy 0.000 description 1
- 230000035790 physiological processes and functions Effects 0.000 description 1
- 102000054765 polymorphisms of proteins Human genes 0.000 description 1
- 238000003672 processing method Methods 0.000 description 1
- 239000000047 product Substances 0.000 description 1
- 230000005522 programmed cell death Effects 0.000 description 1
- 235000019833 protease Nutrition 0.000 description 1
- 238000000746 purification Methods 0.000 description 1
- 230000002829 reductive effect Effects 0.000 description 1
- 230000001850 reproductive effect Effects 0.000 description 1
- 229920006395 saturated elastomer Polymers 0.000 description 1
- XGVXKJKTISMIOW-ZDUSSCGKSA-N simurosertib Chemical compound N1N=CC(C=2SC=3C(=O)NC(=NC=3C=2)[C@H]2N3CCC(CC3)C2)=C1C XGVXKJKTISMIOW-ZDUSSCGKSA-N 0.000 description 1
- 238000006467 substitution reaction Methods 0.000 description 1
- 238000001356 surgical procedure Methods 0.000 description 1
- 238000003786 synthesis reaction Methods 0.000 description 1
- 230000037426 transcriptional repression Effects 0.000 description 1
- 238000013519 translation Methods 0.000 description 1
- 239000013598 vector Substances 0.000 description 1
- 108700026220 vif Genes Proteins 0.000 description 1
- 238000012800 visualization Methods 0.000 description 1
Images


Classifications
-
- C—CHEMISTRY; METALLURGY
- C12—BIOCHEMISTRY; BEER; SPIRITS; WINE; VINEGAR; MICROBIOLOGY; ENZYMOLOGY; MUTATION OR GENETIC ENGINEERING
- C12Q—MEASURING OR TESTING PROCESSES INVOLVING ENZYMES, NUCLEIC ACIDS OR MICROORGANISMS; COMPOSITIONS OR TEST PAPERS THEREFOR; PROCESSES OF PREPARING SUCH COMPOSITIONS; CONDITION-RESPONSIVE CONTROL IN MICROBIOLOGICAL OR ENZYMOLOGICAL PROCESSES
- C12Q1/00—Measuring or testing processes involving enzymes, nucleic acids or microorganisms; Compositions therefor; Processes of preparing such compositions
- C12Q1/68—Measuring or testing processes involving enzymes, nucleic acids or microorganisms; Compositions therefor; Processes of preparing such compositions involving nucleic acids
- C12Q1/6876—Nucleic acid products used in the analysis of nucleic acids, e.g. primers or probes
- C12Q1/6881—Nucleic acid products used in the analysis of nucleic acids, e.g. primers or probes for tissue or cell typing, e.g. human leukocyte antigen [HLA] probes
-
- C—CHEMISTRY; METALLURGY
- C12—BIOCHEMISTRY; BEER; SPIRITS; WINE; VINEGAR; MICROBIOLOGY; ENZYMOLOGY; MUTATION OR GENETIC ENGINEERING
- C12Q—MEASURING OR TESTING PROCESSES INVOLVING ENZYMES, NUCLEIC ACIDS OR MICROORGANISMS; COMPOSITIONS OR TEST PAPERS THEREFOR; PROCESSES OF PREPARING SUCH COMPOSITIONS; CONDITION-RESPONSIVE CONTROL IN MICROBIOLOGICAL OR ENZYMOLOGICAL PROCESSES
- C12Q1/00—Measuring or testing processes involving enzymes, nucleic acids or microorganisms; Compositions therefor; Processes of preparing such compositions
- C12Q1/68—Measuring or testing processes involving enzymes, nucleic acids or microorganisms; Compositions therefor; Processes of preparing such compositions involving nucleic acids
- C12Q1/6869—Methods for sequencing
-
- C—CHEMISTRY; METALLURGY
- C12—BIOCHEMISTRY; BEER; SPIRITS; WINE; VINEGAR; MICROBIOLOGY; ENZYMOLOGY; MUTATION OR GENETIC ENGINEERING
- C12Q—MEASURING OR TESTING PROCESSES INVOLVING ENZYMES, NUCLEIC ACIDS OR MICROORGANISMS; COMPOSITIONS OR TEST PAPERS THEREFOR; PROCESSES OF PREPARING SUCH COMPOSITIONS; CONDITION-RESPONSIVE CONTROL IN MICROBIOLOGICAL OR ENZYMOLOGICAL PROCESSES
- C12Q1/00—Measuring or testing processes involving enzymes, nucleic acids or microorganisms; Compositions therefor; Processes of preparing such compositions
- C12Q1/68—Measuring or testing processes involving enzymes, nucleic acids or microorganisms; Compositions therefor; Processes of preparing such compositions involving nucleic acids
- C12Q1/6876—Nucleic acid products used in the analysis of nucleic acids, e.g. primers or probes
- C12Q1/6883—Nucleic acid products used in the analysis of nucleic acids, e.g. primers or probes for diseases caused by alterations of genetic material
- C12Q1/6886—Nucleic acid products used in the analysis of nucleic acids, e.g. primers or probes for diseases caused by alterations of genetic material for cancer
-
- G—PHYSICS
- G16—INFORMATION AND COMMUNICATION TECHNOLOGY [ICT] SPECIALLY ADAPTED FOR SPECIFIC APPLICATION FIELDS
- G16B—BIOINFORMATICS, i.e. INFORMATION AND COMMUNICATION TECHNOLOGY [ICT] SPECIALLY ADAPTED FOR GENETIC OR PROTEIN-RELATED DATA PROCESSING IN COMPUTATIONAL MOLECULAR BIOLOGY
- G16B20/00—ICT specially adapted for functional genomics or proteomics, e.g. genotype-phenotype associations
- G16B20/10—Ploidy or copy number detection
-
- G—PHYSICS
- G16—INFORMATION AND COMMUNICATION TECHNOLOGY [ICT] SPECIALLY ADAPTED FOR SPECIFIC APPLICATION FIELDS
- G16B—BIOINFORMATICS, i.e. INFORMATION AND COMMUNICATION TECHNOLOGY [ICT] SPECIALLY ADAPTED FOR GENETIC OR PROTEIN-RELATED DATA PROCESSING IN COMPUTATIONAL MOLECULAR BIOLOGY
- G16B20/00—ICT specially adapted for functional genomics or proteomics, e.g. genotype-phenotype associations
- G16B20/20—Allele or variant detection, e.g. single nucleotide polymorphism [SNP] detection
-
- G—PHYSICS
- G16—INFORMATION AND COMMUNICATION TECHNOLOGY [ICT] SPECIALLY ADAPTED FOR SPECIFIC APPLICATION FIELDS
- G16B—BIOINFORMATICS, i.e. INFORMATION AND COMMUNICATION TECHNOLOGY [ICT] SPECIALLY ADAPTED FOR GENETIC OR PROTEIN-RELATED DATA PROCESSING IN COMPUTATIONAL MOLECULAR BIOLOGY
- G16B20/00—ICT specially adapted for functional genomics or proteomics, e.g. genotype-phenotype associations
- G16B20/30—Detection of binding sites or motifs
-
- G—PHYSICS
- G16—INFORMATION AND COMMUNICATION TECHNOLOGY [ICT] SPECIALLY ADAPTED FOR SPECIFIC APPLICATION FIELDS
- G16B—BIOINFORMATICS, i.e. INFORMATION AND COMMUNICATION TECHNOLOGY [ICT] SPECIALLY ADAPTED FOR GENETIC OR PROTEIN-RELATED DATA PROCESSING IN COMPUTATIONAL MOLECULAR BIOLOGY
- G16B30/00—ICT specially adapted for sequence analysis involving nucleotides or amino acids
- G16B30/10—Sequence alignment; Homology search
-
- G—PHYSICS
- G16—INFORMATION AND COMMUNICATION TECHNOLOGY [ICT] SPECIALLY ADAPTED FOR SPECIFIC APPLICATION FIELDS
- G16B—BIOINFORMATICS, i.e. INFORMATION AND COMMUNICATION TECHNOLOGY [ICT] SPECIALLY ADAPTED FOR GENETIC OR PROTEIN-RELATED DATA PROCESSING IN COMPUTATIONAL MOLECULAR BIOLOGY
- G16B40/00—ICT specially adapted for biostatistics; ICT specially adapted for bioinformatics-related machine learning or data mining, e.g. knowledge discovery or pattern finding
- G16B40/10—Signal processing, e.g. from mass spectrometry [MS] or from PCR
-
- G—PHYSICS
- G16—INFORMATION AND COMMUNICATION TECHNOLOGY [ICT] SPECIALLY ADAPTED FOR SPECIFIC APPLICATION FIELDS
- G16B—BIOINFORMATICS, i.e. INFORMATION AND COMMUNICATION TECHNOLOGY [ICT] SPECIALLY ADAPTED FOR GENETIC OR PROTEIN-RELATED DATA PROCESSING IN COMPUTATIONAL MOLECULAR BIOLOGY
- G16B45/00—ICT specially adapted for bioinformatics-related data visualisation, e.g. displaying of maps or networks
-
- G—PHYSICS
- G16—INFORMATION AND COMMUNICATION TECHNOLOGY [ICT] SPECIALLY ADAPTED FOR SPECIFIC APPLICATION FIELDS
- G16H—HEALTHCARE INFORMATICS, i.e. INFORMATION AND COMMUNICATION TECHNOLOGY [ICT] SPECIALLY ADAPTED FOR THE HANDLING OR PROCESSING OF MEDICAL OR HEALTHCARE DATA
- G16H50/00—ICT specially adapted for medical diagnosis, medical simulation or medical data mining; ICT specially adapted for detecting, monitoring or modelling epidemics or pandemics
- G16H50/20—ICT specially adapted for medical diagnosis, medical simulation or medical data mining; ICT specially adapted for detecting, monitoring or modelling epidemics or pandemics for computer-aided diagnosis, e.g. based on medical expert systems
-
- C—CHEMISTRY; METALLURGY
- C12—BIOCHEMISTRY; BEER; SPIRITS; WINE; VINEGAR; MICROBIOLOGY; ENZYMOLOGY; MUTATION OR GENETIC ENGINEERING
- C12Q—MEASURING OR TESTING PROCESSES INVOLVING ENZYMES, NUCLEIC ACIDS OR MICROORGANISMS; COMPOSITIONS OR TEST PAPERS THEREFOR; PROCESSES OF PREPARING SUCH COMPOSITIONS; CONDITION-RESPONSIVE CONTROL IN MICROBIOLOGICAL OR ENZYMOLOGICAL PROCESSES
- C12Q2535/00—Reactions characterised by the assay type for determining the identity of a nucleotide base or a sequence of oligonucleotides
- C12Q2535/122—Massive parallel sequencing
-
- C—CHEMISTRY; METALLURGY
- C12—BIOCHEMISTRY; BEER; SPIRITS; WINE; VINEGAR; MICROBIOLOGY; ENZYMOLOGY; MUTATION OR GENETIC ENGINEERING
- C12Q—MEASURING OR TESTING PROCESSES INVOLVING ENZYMES, NUCLEIC ACIDS OR MICROORGANISMS; COMPOSITIONS OR TEST PAPERS THEREFOR; PROCESSES OF PREPARING SUCH COMPOSITIONS; CONDITION-RESPONSIVE CONTROL IN MICROBIOLOGICAL OR ENZYMOLOGICAL PROCESSES
- C12Q2537/00—Reactions characterised by the reaction format or use of a specific feature
- C12Q2537/10—Reactions characterised by the reaction format or use of a specific feature the purpose or use of
- C12Q2537/165—Mathematical modelling, e.g. logarithm, ratio
Definitions
- the present disclosure relates to methods of determining one or more tissues and/or cell-types giving rise to cell-free DNA.
- the present disclosure provides a method of identifying a disease or disorder in a subject as a function of one or more determined tissues and/or cell-types associated with cell-free DNA in a biological sample from the subject.
- cfDNA Cell-free DNA
- the cfDNA comprises double-stranded DNA fragments that are relatively short (primarily less than 200 base-pairs) and are normally at a low concentration (e.g. 1-100 ng/mL in plasma).
- cfDNA is believed to primarily derive from apoptosis of blood cells (i.e., normal cells of the hematopoietic lineage).
- other tissues can contribute substantially to the composition of cfDNA in bodily fluids such as circulating plasma.
- cfDNA has been used in certain specialties (e.g., reproductive medicine, cancer diagnostics, and transplant medicine)
- existing tests based on cfDNA rely on differences in genotypes (e.g., primary sequence or copy number representation of a particular sequence) between two or more cell populations (e.g., maternal genome vs. fetal genome; normal genome vs. cancer genome; transplant recipient genome vs. donor genome, etc.).
- genotypes e.g., primary sequence or copy number representation of a particular sequence
- cell populations e.g., maternal genome vs. fetal genome; normal genome vs. cancer genome; transplant recipient genome vs. donor genome, etc.
- the present disclosure provides methods of determining one or more tissues and/or cell-types giving rise to cell-free DNA ("cfDNA") in a biological sample of a subject.
- the present disclosure provides a method of identifying a disease or disorder in a subject as a function of one or more determined tissues and/or cell-types associated with cfDNA in a biological sample from the subject.
- the present disclosure provides a method of determining tissues and/or cell types giving rise to cell-free DNA (cfDNA) in a subject, the method comprising isolating cfDNA from a biological sample from the subject, the isolated cfDNA comprising a plurality of cfDNA fragments; determining a sequence associated with at least a portion of the plurality of cfDNA fragments; determining a genomic location within a reference genome for at least some cfDNA fragment endpoints of the plurality of cfDNA fragments as a function of the cfDNA fragment sequences; and determining at least some of the tissues and/or cell types giving rise to the cfDNA fragments as a function of the genomic locations of at least some of the cfDNA fragment endpoints.
- cfDNA cell-free DNA
- the present disclosure provides a method of identifying a disease or disorder in a subject, the method comprising isolating cell-free DNA (cfDNA) from a biological sample from the subject, the isolated cfDNA comprising a plurality of cfDNA fragments; determining a sequence associated with at least a portion of the plurality of cfDNA fragments; determining a genomic location within a reference genome for at least some cfDNA fragment endpoints of the plurality of cfDNA fragments as a function of the cfDNA fragment sequences; determining at least some of the tissues and/or cell types giving rise to the cfDNA as a function of the genomic locations of at least some of the cfDNA fragment endpoints; and identifying the disease or disorder as a function of the determined tissues and/or cell types giving rise to the cfDNA.
- cfDNA cell-free DNA
- the present disclosure provides a method for determining tissues and/or cell types giving rise to cell-free DNA (cfDNA) in a subject, the method comprising: (i) generating a nucleosome map by obtaining a biological sample from the subject, isolating the cfDNA from the biological sample, and measuring distributions (a), (b) and/or (c) by library construction and massively parallel sequencing of cfDNA; (ii) generating a reference set of nucleosome maps by obtaining a biological sample from control subjects or subjects with known disease, isolating the cfDNA from the biological sample, measuring distributions (a), (b) and/or (c) by library construction and massively parallel sequencing of cfDNA; and (iii) determining tissues and/or cell types giving rise to the cfDNA from the biological sample by comparing the nucleosome map derived from the cfDNA from the biological sample to the reference set of nucleosome maps; wherein (a), (b) and (c)
- the present disclosure provides a method for determining tissues and/or cell types giving rise to cfDNA in a subject, the method comprising: (i) generating a nucleosome map by obtaining a biological sample from the subject, isolating the cfDNA from the biological sample, and measuring distributions (a), (b) and/or (c) by library construction and massively parallel sequencing of cfDNA; (ii) generating a reference set of nucleosome maps by obtaining a biological sample from control subjects or subjects with known disease, isolating the cfDNA from the biological sample, measuring distributions (a), (b) and/or (c) by library construction and massively parallel sequencing of DNA derived from fragmentation of chromatin with an enzyme such as micrococcal nuclease, DNase, or transposase; and (iii) determining tissues and/or cell types giving rise to the cfDNA from the biological sample by comparing the nucleosome map derived from the cfDNA from
- the present disclosure provides a method for diagnosing a clinical condition in a subject, the method comprising: (i) generating a nucleosome map by obtaining a biological sample from the subject, isolating cfDNA from the biological sample, and measuring distributions (a), (b) and/or (c) by library construction and massively parallel sequencing of cfDNA; (ii) generating a reference set of nucleosome maps by obtaining a biological sample from control subjects or subjects with known disease, isolating the cfDNA from the biological sample, measuring distributions (a), (b) and/or (c) by library construction and massively parallel sequencing of cfDNA; and (iii) determining the clinical condition by comparing the nucleosome map derived from the cfDNA from the biological sample to the reference set of nucleosome maps; wherein (a), (b) and (c) are: (a) the distribution of likelihoods any specific base-pair in a human genome will appear at a terminus of
- the present disclosure provides a method for diagnosing a clinical condition in a subject, the method comprising (i) generating a nucleosome map by obtaining a biological sample from the subject, isolating cfDNA from the biological sample, and measuring distributions (a), (b) and/or (c) by library construction and massively parallel sequencing of cfDNA; (ii) generating a reference set of nucleosome maps by obtaining a biological sample from control subjects or subjects with known disease, isolating the cfDNA from the biological sample, measuring distributions (a), (b) and/or (c) by library construction and massively parallel sequencing of DNA derived from fragmentation of chromatin with an enzyme such as micrococcal nuclease (MNase), DNase, or transposase; and (iii) determining the tissue-of-origin composition of the cfDNA from the biological sample by comparing the nucleosome map derived from the cfDNA from the biological sample to the reference set of
- MNase
- the present disclosure provides methods of determining one or more tissues and/or cell-types giving rise to cell-free DNA in a subject's biological sample. In some embodiments, the present disclosure provides a method of identifying a disease or disorder in a subject as a function of one or more determined tissues and/or cell-types associated with cfDNA in a biological sample from the subject.
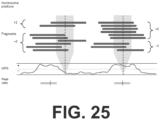
- the present disclosure is based on a prediction that cfDNA molecules originating from different cell types or tissues differ with respect to: (a) the distribution of likelihoods any specific base-pair in a human genome will appear at a terminus of a cfDNA fragment (i.e. points of fragmentation); (b) the distribution of likelihoods that any pair of base-pairs of a human genome will appear as a pair of termini of a cfDNA fragment (i.e. consecutive pairs of fragmentation points that give rise to an individual cfDNA molecule); and (c) the distribution of likelihoods that any specific base-pair in a human genome will appear in a cfDNA fragment (i.e. relative coverage) as a consequence of differential nucleosome occupancy.
- nucleosome maps might also be measured through the sequencing of fragments derived from the fragmentation of chromatin with an enzyme such as micrococcal nuclease (MNase), DNase, or transposase, or equivalent procedures that preferentially fragment genomic DNA between or at the boundaries of nucleosomes or chromatosomes.
- MNase micrococcal nuclease
- DNase DNase
- transposase or equivalent procedures that preferentially fragment genomic DNA between or at the boundaries of nucleosomes or chromatosomes.
- cfDNA In healthy individuals, cfDNA overwhelmingly derives from apoptosis of blood cells, i.e. cells of the hematopoietic lineage. As these cells undergo programmed cell death, their genomic DNA is cleaved and released into circulation, where it continues to be degraded by nucleases.
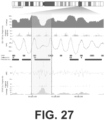
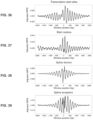
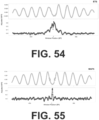
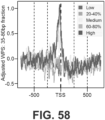
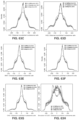
- the length distribution of cfDNA oscillates with a period of approximately 10.5 base-pairs (bp), corresponding to the helical pitch of DNA coiled around the nucleosome, and has a marked peak around 167 bp, corresponding to the length of DNA associated with a linker-associated mononucleosome ( FIG. 2 ).
- the present disclosure defines a nucleosome map as the measurement of distributions (a), (b) and/or (c) by library construction and massively parallel sequencing of either cfDNA from a bodily fluid or DNA derived from the fragmentation of chromatin with an enzyme such as micrococcal nuclease (MNase), DNase, or transposase, or equivalent procedures that preferentially fragment genomic DNA between or at the boundaries of nucleosomes or chromatosomes.
- MNase micrococcal nuclease
- DNase DNase
- transposase transposase
- tissue-specific data For example, one could aggregate or summarize signal in the vicinity of tissue-specific DNase I hypersensitive sites.
- the present disclosure provides a dense, genome-wide map of in vivo nucleosome protection inferred from plasma-borne cfDNA fragments.
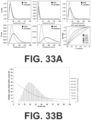
- the CH01 map derived from cfDNA of healthy individuals, comprises nearly 13M uniformly spaced local maxima of nucleosome protection that span the vast majority of the mappable human reference genome. Although the number of peaks is essentially saturated in CH01, other metrics of quality continued to be a function of sequencing depth ( FIGs. 33A-B ).
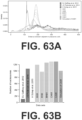
- the dense, genome-wide map of nucleosome protection disclosed herein approaches saturation of the mappable portion of the human reference genome, with peak-to-peak spacing that is considerably more uniform and consistent with the expected nucleosome repeat length than previous efforts to generate human genome-wide maps of nucleosome positioning or protection ( FIGs. 63A-H ).
- the fragments that observed herein are generated by endogenous physiological processes, and are therefore less likely to be subject to the technical variation associated with in vitro micrococcal nuclease digestion.
- the cell types that give rise to cfDNA considered in this reference map are inevitably heterogeneous (e.g. a mixture of lymphoid and myeloid cell types in healthy individuals). Nonetheless, the map's relative completeness may facilitate a deeper understanding of the processes that dictate nucleosome positioning and spacing in human cells, as well as the interplay of nucleosomes with epigenetic regulation, transcriptional output, and nuclear architecture.
- the present technology may be used to determine (e.g., predict) the tissue(s) and/or cell type(s) which contribute to the cfDNA in a subject's biological sample.
- the present disclosure provides a method of determining tissues and/or cell-types giving rise to cell-free DNA (cfDNA) in a subject, the method comprising isolating cfDNA from a biological sample from the subject, the isolated cfDNA comprising a plurality of cfDNA fragments; determining a sequence associated with at least a portion of the plurality of cfDNA fragments; determining a genomic location within a reference genome for at least some cfDNA fragment endpoints of the plurality of cfDNA fragments as a function of the cfDNA fragment sequences; and determining at least some of the tissues and/or cell types giving rise to the cfDNA fragments as a function of the genomic locations of at least some of the cfDNA fragment endpoints.
- cfDNA cell-free DNA
- the biological sample comprises, consists essentially of, or consists of whole blood, peripheral blood plasma, urine, or cerebral spinal fluid.
- the step of determining at least some of the tissues and/or cell-types giving rise to the cfDNA fragments comprises comparing the genomic locations of at least some of the cfDNA fragment endpoints, or mathematical transformations of their distribution, to one or more reference maps.
- reference map refers to any type or form of data which can be correlated or compared to an attribute of the cfDNA in the subject's biological sample as a function of the coordinate within the genome to which cfDNA sequences are aligned (e.g., the reference genome).
- the reference map may be correlated or compared to an attribute of the cfDNA in the subject's biological sample by any suitable means.
- the correlation or comparison may be accomplished by analyzing frequencies of cfDNA endpoints, either directly or after performing a mathematical transformation on their distribution across windows within the reference genome, in the subject's biological sample in view of numerical values or any other states defined for equivalent coordinates of the reference genome by the reference map.
- the correlation or comparison may be accomplished by analyzing the determined nucleosome spacing(s) based on the cfDNA of the subject's biological sample in view of the determined nucleosome spacing(s), or another property that correlates with nucleosome spacing(s), in the reference map.
- the reference map(s) may be sourced or derived from any suitable data source including, for example, public databases of genomic information, published data, or data generated for a specific population of reference subjects which may each have a common attribute (e.g., disease status).
- the reference map comprises a DNase I hypersensitivity dataset.
- the reference map comprises an RNA expression dataset.
- the reference map comprises a chromosome conformation map.
- the reference map comprises a chromatin accessibility map.
- the reference map comprises data that is generated from at least one tissue or cell-type that is associated with a disease or a disorder.
- the reference map comprises positions of nucleosomes and/or chromatosomes in a tissue or cell type.
- the reference map is generated by a procedure that includes digesting chromatin with an exogenous nuclease (e.g., micrococcal nuclease).
- the reference map comprises chromatin accessibility data determined by a transposition-based method (e.g., ATAC-seq).
- the reference map comprises data associated with positions of a DNA binding and/or DNA occupying protein for a tissue or cell type.
- the DNA binding and/or DNA occupying protein is a transcription factor.
- the positions are determined by a procedure that includes chromatin immunoprecipitation of a crosslinked DNA-protein complex. In some embodiments, the positions are determined by a procedure that includes treating DNA associated with the tissue or cell type with a nuclease (e.g., DNase-I).
- the reference map is generated by sequencing of cfDNA fragments from a biological sample from one or more individuals with a known disease. In some embodiments, this biological sample from which the reference map is generated is collected from an animal to which human cells or tissues have been xenografted.
- the reference map comprises a biological feature corresponding to positions of a DNA binding or DNA occupying protein for a tissue or cell type. In some embodiments, the reference map comprises a biological feature corresponding to quantitative RNA expression of one or more genes. In some embodiments, the reference map comprises a biological feature corresponding to the presence or absence of one or more histone marks. In some embodiments, the reference map comprises a biological feature corresponding to hypersensitivity to nuclease cleavage.
- the step of comparing the genomic locations of at least some of the cfDNA fragment endpoints to one or more reference maps may be accomplished in a variety of ways.
- the cfDNA data generated from the biological sample e.g., the genomic locations of the cfDNA fragments, their endpoints, the frequencies of their endpoints, and/or nucleosome spacing(s) inferred from their distribution
- the tissues or cell-types associated with the reference maps which correlate most highly with the cfDNA data in the biological sample are deemed to be contributing.
- the reference map(s) having the most similar list of cfDNA endpoints and their locations within the reference genome may be deemed to be contributing.
- the reference map(s) having the most correlation (or increased correlation, relative to cfDNA from a healthy subject) with a mathematical transformation of the distribution of cfDNA fragment endpoints from the biological sample may be deemed to be contributing.
- the tissue types and/or cell types which correspond to those reference maps deemed to be contributing are then considered as potential sources of the cfDNA isolated from the biological sample.
- the step of determining at least some of the tissues and/or cell types giving rise to the cfDNA fragments comprises performing a mathematical transformation on a distribution of the genomic locations of at least some of the cfDNA fragment endpoints.
- a mathematical transformation suitable for use in connection with the present technology is a Fourier transformation, such as a fast Fourier transformation ("FFT").
- the method further comprises determining a score for each of at least some coordinates of the reference genome, wherein the score is determined as a function of at least the plurality of cfDNA fragment endpoints and their genomic locations, and wherein the step of determining at least some of the tissues and/or cell types giving rise to the observed cfDNA fragments comprises comparing the scores to one or more reference map.
- the score may be any metric (e.g., a numerical ranking or probability) which may be used to assign relative or absolute values to a coordinate of the reference genome.
- the score may consist of, or be related to a probability, such as a probability that the coordinate represents a location of a cfDNA fragment endpoint, or a probability that the coordinate represents a location of the genome that is preferentially protected from nuclease cleavage by nucleosome or protein binding.
- the score may relate to nucleosome spacing in particular regions of the genome, as determined by a mathematical transformation of the distribution of cfDNA fragment endpoints within that region.
- scores may be assigned to the coordinate by any suitable means including, for example, by counting absolute or relative events (e.g., the number of cfDNA fragment endpoints) associated with that particular coordinate, or performing a mathematical transformation on the values of such counts in the region or a genomic coordinate.
- the score for a coordinate is related to the probability that the coordinate is a location of a cfDNA fragment endpoint. In other embodiments, the score for a coordinate is related to the probability that the coordinate represents a location of the genome that is preferentially protected from nuclease cleavage by nucleosome or protein binding. In some embodiments, the score is related to nucleosome spacing in the genomic region of the coordinate.
- tissue(s) and/or cell-type(s) referred to in the methods described herein may be any tissue or cell-type which gives rise to cfDNA.
- the tissue or cell-type is a primary tissue from a subject having a disease or disorder.
- the disease or disorder is selected from the group consisting of: cancer, normal pregnancy, a complication of pregnancy (e.g., aneuploid pregnancy), myocardial infarction, inflammatory bowel disease, systemic autoimmune disease, localized autoimmune disease, allotransplantation with rejection, allotransplantation without rejection, stroke, and localized tissue damage.
- the tissue or cell type is a primary tissue from a healthy subject.
- the tissue or cell type is an immortalized cell line.
- the tissue or cell type is a biopsy from a tumor.
- the reference map is based on sequence data obtained from samples obtained from at least one reference subject.
- this sequence data defines positions of cfDNA fragment endpoints within a reference genome - for example, if the reference map is generated by sequencing of cfDNA from subject(s) with known disease.
- this sequence data on which the reference map is based may comprise any one or more of: a DNase I hypersensitive site dataset, an RNA expression dataset, a chromosome conformation map, or a chromatin accessibility map, or nucleosome positioning map generated by digestion of chromatin with micrococcal nuclease.
- the reference subject is healthy.
- the reference subject has a disease or disorder, optionally selected from the group consisting of: cancer, normal pregnancy, a complication of pregnancy (e.g., aneuploid pregnancy), myocardial infarction, inflammatory bowel disease, systemic autoimmune disease, localized autoimmune disease, allotransplantation with rejection, allotransplantation without rejection, stroke, and localized tissue damage.
- a disease or disorder optionally selected from the group consisting of: cancer, normal pregnancy, a complication of pregnancy (e.g., aneuploid pregnancy), myocardial infarction, inflammatory bowel disease, systemic autoimmune disease, localized autoimmune disease, allotransplantation with rejection, allotransplantation without rejection, stroke, and localized tissue damage.
- the reference map comprises scores for at least a portion of coordinates of the reference genome associated with the tissue or cell type. In some embodiments, the reference map comprises a mathematical transformation of the scores, such as a Fourier transformation of the scores. In some embodiments, the scores are based on annotations of reference genomic coordinates for the tissue or cell type. In some embodiments, the scores are based on positions of nucleosomes and/or chromatosomes. In some embodiments, the scores are based on transcription start sites and/or transcription end sites. In some embodiments, the scores are based on predicted binding sites of at least one transcription factor. In some embodiments, the scores are based on predicted nuclease hypersensitive sites. In some embodiments, the scores are based on predicted nucleosome spacing.
- the scores are associated with at least one orthogonal biological feature.
- the orthogonal biological feature is associated with highly expressed genes. In some embodiments, the orthogonal biological feature is associated with lowly expression genes.
- the threshold value is determined before determining the tissue(s) and/or the cell type(s) giving rise to the cfDNA. In other embodiments, the threshold value is determined after determining the tissue(s) and/or the cell type(s) giving rise to the cfDNA.
- the step of determining the tissues and/or cell types giving rise to the cfDNA as a function of a plurality of the genomic locations of at least some of the cfDNA fragment endpoints comprises comparing a mathematical transformation of the distribution of the genomic locations of at least some of the cfDNA fragment endpoints of the sample with one or more features of one or more reference maps.
- a mathematical transformation suitable for this purpose is a Fourier transformation, such as a fast Fourier transformation ("FFT").
- the method may further comprise generating a report comprising a list of the determined tissues and/or cell-types giving rise to the isolated cfDNA.
- the report may optionally further include any other information about the sample and/or the subject, the type of biological sample, the date the biological sample was obtained from the subject, the date the cfDNA isolation step was performed and/or tissue(s) and/or cell-type(s) which likely did not give rise to any cfDNA isolated from the biological sample.
- the report further includes a recommended treatment protocol including, for example and without limitation, a suggestion to obtain an additional diagnostic test from the subject, a suggestion to begin a therapeutic regimen, a suggestion to modify an existing therapeutic regimen with the subject, and/or a suggestion to suspend or stop an existing therapeutic regiment.
- a recommended treatment protocol including, for example and without limitation, a suggestion to obtain an additional diagnostic test from the subject, a suggestion to begin a therapeutic regimen, a suggestion to modify an existing therapeutic regimen with the subject, and/or a suggestion to suspend or stop an existing therapeutic regiment.
- the present technology may be used to determine (e.g., predict) a disease or disorder, or the absence of a disease or a disorder, based at least in part on the tissue(s) and/or cell type(s) which contribute to cfDNA in a subject's biological sample.
- the present disclosure provides a method of identifying a disease or disorder in a subject, the method comprising isolating cell free DNA (cfDNA) from a biological sample from the subject, the isolated cfDNA comprising a plurality of cfDNA fragments; determining a sequence associated with at least a portion of the plurality of cfDNA fragments; determining a genomic location within a reference genome for at least some cfDNA fragment endpoints of the plurality of cfDNA fragments as a function of the cfDNA fragment sequences; determining at least some of the tissues and/or cell types giving rise to the cfDNA as a function of the genomic locations of at least some of the cfDNA fragment endpoints; and identifying the disease or disorder as a function of the determined tissues and/or cell types giving rise to the cfDNA.
- cfDNA cell free DNA
- the biological sample comprises, consists essentially of, or consists of whole blood, peripheral blood plasma, urine, or cerebral spinal fluid.
- the step of determining the tissues and/or cell-types giving rise to the cfDNA comprises comparing the genomic locations of at least some of the cfDNA fragment endpoints, or mathematical transformations of their distribution, to one or more reference maps.
- reference map as used in connection with these embodiments may have the same meaning described above with respect to methods of determining tissue(s) and/or cell type(s) giving rise to cfDNA in a subject's biological sample.
- the reference map may comprise any one or more of: a DNase I hypersensitive site dataset, an RNA expression dataset, a chromosome conformation map, a chromatin accessibility map, sequence data that is generated from samples obtained from at least one reference subject, enzyme-mediated fragmentation data corresponding to at least one tissue that is associated with a disease or a disorder, and/or positions of nucleosomes and/or chromatosomes in a tissue or cell type.
- the reference map is generated by sequencing of cfDNA fragments from a biological sample from one or more individuals with a known disease. In some embodiments, this biological sample from which the reference map is generated is collected from an animal to which human cells or tissues have been xenografted.
- the reference map is generated by digesting chromatin with an exogenous nuclease (e.g., micrococcal nuclease).
- the reference maps comprise chromatin accessibility data determined by a transposition-based method (e.g., ATAC-seq).
- the reference maps comprise data associated with positions of a DNA binding and/or DNA occupying protein for a tissue or cell type.
- the DNA binding and/or DNA occupying protein is a transcription factor.
- the positions are determined chromatin immunoprecipitation of a crosslinked DNA-protein complex.
- the positions are determined by treating DNA associated with the tissue or cell type with a nuclease (e.g., DNase-I).
- the reference map comprises a biological feature corresponding to positions of a DNA binding or DNA occupying protein for a tissue or cell type. In some embodiments, the reference map comprises a biological feature corresponding to quantitative expression of one or more genes. In some embodiments, the reference map comprises a biological feature corresponding to the presence or absence of one or more histone marks. In some embodiments, the reference map comprises a biological feature corresponding to hypersensitivity to nuclease cleavage.
- the step of determining the tissues and/or cell types giving rise to the cfDNA comprises performing a mathematical transformation on a distribution of the genomic locations of at least some of the plurality of the cfDNA fragment endpoints.
- the mathematical transformation includes a Fourier transformation.
- the method further comprises determining a score for each of at least some coordinates of the reference genome, wherein the score is determined as a function of at least the plurality of cfDNA fragment endpoints and their genomic locations, and wherein the step of determining at least some of the tissues and/or cell types giving rise to the observed cfDNA fragments comprises comparing the scores to one or more reference maps.
- the score may be any metric (e.g., a numerical ranking or probability) which may be used to assign relative or absolute values to a coordinate of the reference genome.
- the score may consist of, or be related to a probability, such as a probability that the coordinate represents a location of a cfDNA fragment endpoint, or a probability that the coordinate represents a location of the genome that is preferentially protected from nuclease cleavage by nucleosome or protein binding.
- the score may relate to nucleosome spacing in particular regions of the genome, as determined by a mathematical transformation of the distribution of cfDNA fragment endpoints within that region.
- scores may be assigned to the coordinate by any suitable means including, for example, by counting absolute or relative events (e.g., the number of cfDNA fragment endpoints) associated with that particular coordinate, or performing a mathematical transformation on the values of such counts in the region or a genomic coordinate.
- the score for a coordinate is related to the probability that the coordinate is a location of a cfDNA fragment endpoint. In other embodiments, the score for a coordinate is related to the probability that the coordinate represents a location of the genome that is preferentially protected from nuclease cleavage by nucleosome or protein binding. In some embodiments, the score is related to nucleosome spacing in the genomic region of the coordinate.
- the score for a coordinate is related to the probability that the coordinate is a location of a cfDNA fragment endpoint. In other embodiments, the score for a coordinate is related to the probability that the coordinate represents a location of the genome that is preferentially protected from nuclease cleavage by nucleosome or protein binding. In some embodiments, the score is related to nucleosome spacing in the genomic region of the coordinate.
- the tissue or cell-type used for generating a reference map is a primary tissue from a subject having a disease or disorder.
- the disease or disorder is selected from the group consisting of: cancer, normal pregnancy, a complication of pregnancy (e.g., aneuploid pregnancy), myocardial infarction, systemic autoimmune disease, localized autoimmune disease, inflammatory bowel disease, allotransplantation with rejection, allotransplantation without rejection, stroke, and localized tissue damage.
- the tissue or cell type is a primary tissue from a healthy subject.
- the tissue or cell type is an immortalized cell line.
- the tissue or cell type is a biopsy from a tumor.
- the reference map is based on sequence data obtained from samples obtained from at least one reference subject.
- this sequence data defines positions of cfDNA fragment endpoints within a reference genome - for example, if the reference map is generated by sequencing of cfDNA from subject(s) with known disease.
- this sequence data on which the reference map is based may comprise any one or more of: a DNase I hypersensitive site dataset, an RNA expression dataset, a chromosome conformation map, or a chromatin accessibility map, or nucleosome positioning map generated by digestion with micrococcal nuclease.
- the reference subject is healthy.
- the reference subject has a disease or disorder.
- the disease or disorder is selected from the group consisting of: cancer, normal pregnancy, a complication of pregnancy (e.g., aneuploid pregnancy), myocardial infarction, systemic autoimmune disease, inflammatory bowel disease, localized autoimmune disease, allotransplantation with rejection, allotransplantation without rejection, stroke, and localized tissue damage.
- the reference map comprises cfDNA fragment endpoint probabilities, or a quantity that correlates with such probabilities, for at least a portion of the reference genome associated with the tissue or cell type. In some embodiments, the reference map comprises a mathematical transformation of the cfDNA fragment endpoint probabilities, or a quantity that correlates with such probabilities.
- the reference map comprises scores for at least a portion of coordinates of the reference genome associated with the tissue or cell type. In some embodiments, the reference map comprises a mathematical transformation of the scores, such as a Fourier transformation of the scores. In some embodiments, the scores are based on annotations of reference genomic coordinates for the tissue or cell type. In some embodiments, the scores are based on positions of nucleosomes and/or chromatosomes. In some embodiments, the scores are based on transcription start sites and/or transcription end sites. In some embodiments, the scores are based on predicted binding sites of at least one transcription factor. In some embodiments, the scores are based on predicted nuclease hypersensitive sites.
- the scores are associated with at least one orthogonal biological feature.
- the orthogonal biological feature is associated with highly expressed genes. In some embodiments, the orthogonal biological feature is associated with lowly expression genes.
- the threshold value is determined before determining the tissue(s) and/or the cell type(s) giving rise to the cfDNA. In other embodiments, the threshold value is determined after determining the tissue(s) and/or the cell type(s) giving rise to the cfDNA.
- the step of determining the tissues and/or cell types giving rise to the cfDNA as a function of a plurality of the genomic locations of at least some of the cfDNA fragment endpoints comprises a mathematical transformation of the distribution of the genomic locations of at least some of the cfDNA fragment endpoints of the sample with one or more features of one or more reference maps.
- this mathematical transformation includes a Fourier transformation.
- the reference map comprises enzyme-mediated fragmentation data corresponding to at least one tissue that is associated with the disease or disorder.
- the reference genome is associated with a human.
- the methods described herein are used for detection, monitoring and tissue(s) and/or cell-type(s)-of-origin assessment of malignancies from analysis of cfDNA in bodily fluids. It is now well documented that in patients with malignancies, a portion of cfDNA in bodily fluids such as circulating plasma can be derived from the tumor. The methods described here can potentially be used to detect and quantify this tumor derived portion. Furthermore, as nucleosome occupancy maps are cell-type specific, the methods described here can potentially be used to determine the tissue(s) and/or cell-type(s)-of-origin of a malignancy.
- the methods described above may enable cancer detection, monitoring, and/or tissue(s) and/or cell-type(s)-of-origin assignment based on signal from these other tissues rather than the cancer cells per se.
- the methods described herein are used for detection, monitoring and tissue(s) and/or cell-type(s)-of-origin assessment of tissue damage from analysis of cfDNA in bodily fluids. It is to be expected that many pathological processes will result in a portion of cfDNA in bodily fluids such as circulating plasma deriving from damaged tissues.
- the methods described here can potentially be used to detect and quantify cfDNA derived from tissue damage, including identifying the relevant tissues and/or cell-types of origin. This may enable diagnosis and/or monitoring of pathological processes including myocardial infarction (acute damage of heart tissue), autoimmune disease (chronic damage of diverse tissues), and many others involving either acute or chronic tissue damage.
- the methods described herein are used for estimating the fetal fraction of cfDNA in pregnancy and/or enhancing detection of chromosomal or other genetic abnormalities.
- Relatively shallow sequencing of the maternal plasma-borne DNA fragments, coupled with nucleosome maps described above, may allow a cost-effective and rapid estimation of fetal fraction in both male and female fetus pregnancies.
- these methods may also enhance the performance of tests directed at detecting chromosomal aberrations (e.g. trisomies) through analysis of cfDNA in maternal bodily fluids.
- the methods described herein are used for quantifying the contribution of a transplant (autologous or allograft) to cfDNA -
- Current methods for early and noninvasive detection of acute allograft rejection involve sequencing plasma-borne DNA and identifying increased concentrations of fragments derived from the donor genome. This approach relies on relatively deep sequencing of this pool of fragments to detect, for example, 5-10% donor fractions.
- An approach based instead on nucleosome maps of the donated organ may enable similar estimates with shallower sequencing, or more sensitive estimates with an equivalent amount of sequencing.
- Analogous to cancer it is also possible that cell types other than the transplant itself contribute to cfDNA composition during transplant rejection. To the extent that contributions from such other tissues to cfDNA are consistent between patients during transplant rejection, the methods described above may enable monitoring of transplant rejection based on signal from these other tissues rather than the transplant donor cells per se.
- the present disclosure also provides methods of diagnosing a disease or disorder using nucleosome reference map(s) generated from subjects having a known disease or disorder.
- the method comprises: (1) generating a reference set of nucleosome maps, wherein each nucleosome map is derived from either cfDNA from bodily fluids of individual(s) with defined clinical conditions (e.g.
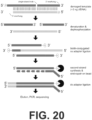
- STEP 1 Generating a reference set of nucleosome maps, and aggregating or summarizing signal from nucleosome positioning.
- a preferred method for generating a nucleosome map includes DNA purification, library construction (by adaptor ligation and possibly PCR amplification) and massively parallel sequencing of cfDNA from a bodily fluid.
- An alternative source for nucleosome maps which are useful in the context of this invention as reference points or for identifying principal components of variation, is DNA derived from digestion of chromatin with micrococcal nuclease (MNase), DNase treatment, ATAC-Seq or other related methods wherein information about nucleosome positioning is captured in distributions (a), (b) or (c). Descriptions of these distributions (a), (b) and (c) are provided above in [0078] and are shown graphically in FIG. 1 .
- nucleosome occupancy patterns can be summarized or aggregated across continuous or discontinuous regions of the genome.
- distribution i.e. distribution (a)
- kbp kilobase-pair
- Example 3 we quantify the distribution of sites in the reference human genome to which sequencing read start sites map, i.e. distribution (a), in the immediate vicinity of transcription factor binding sites (TFBS) of specific transcription factor (TF), which are often immediately flanked by nucleosomes when the TFBS is bound by the TF.
- distribution a
- TFBS transcription factor binding sites
- TF specific transcription factor
- nucleosome occupancy includes those generated from cfDNA samples associated with a known disease, as reference maps, i.e. without aggregating signal, for the purposes of comparison to an unknown cfDNA sample.
- this biological sample from which the reference map of nucleosome occupancy is generated is collected from an animal to which human cells or tissues have been xenografted.
- sequenced cfDNA fragments mapping to the human genome will exclusively derive from the xenografted cells or tissues, as opposed to representing a mixture of cfDNA derived from the cells/tissues of interest along with hematopoietic lineages.
- STEP 2 Predicting pathology(s), clinical condition(s) and/or tissue/cell-types-of-origin composition on the basis of comparing the cfDNA-derived nucleosome map of one or more new individuals/samples to the reference set of nucleosome maps either directly or after mathematical transformation of each map.
- Examples 1 & 2 we first summarize long-range nucleosome ordering within 10 kbp windows along the genome in a diverse set of samples, and then perform principal components analysis (PCA) to cluster samples (Example 1) or to estimate mixture proportions (Example 2).
- PCA principal components analysis
- any one of the samples could in principle have been the "unknown", and its behavior in the PCA analysis used to predict the presence/absence of a clinical condition or its tissue/cell-type-of-origin based on its behavior in the PCA analysis relative to all other nucleosome maps.
- the unknown sample does not necessarily need to be precisely matched to 1 + members of the reference set in a 1:1 manner. Rather, its similarities to each can be quantified (Example 1), or its nucleosome map can be modeled as a non-uniform mixture of 2+ samples from the reference set (Example 2).
- tissue/cell-type-of-origin composition of cfDNA in each sample need not be predicted or ultimately known for the method of the present invention to be successful. Rather, the method described herein relies on the consistency of tissue/cell-type-of-origin composition of cfDNA in the context of a particular pathology or clinical condition.
- tissue/cell-type-of-origin composition of cfDNA in the context of a particular pathology or clinical condition.
- by surveying the nucleosome maps of a large number of tissues and/or cell types directly by analysis of DNA derived from digestion of chromatin and adding these to the nucleosome map it would be possible to estimate the tissue(s) and/or cell-type(s) contributing to an unknown cfDNA-derived sample.
- the method may further comprise generating a report comprising a statement identifying the disease or disorder.
- the report may further comprise a list of the determined tissues and/or cell types giving rise to the isolated cfDNA.
- the report further comprises a list of diseases and/or disorders which are unlikely to be associated with the subject.
- the report may optionally further include any other information about the sample and/or the subject, the type of biological sample, the date the biological sample was obtained from the subject, the date the cfDNA isolation step was performed and/or tissue(s) and/or cell type(s) which likely did not give rise to any cfDNA isolated from the biological sample.
- the report further includes a recommended treatment protocol including, for example and without limitation, a suggestion to obtain an additional diagnostic test from the subject, a suggestion to begin a therapeutic regimen, a suggestion to modify an existing therapeutic regimen with the subject, and/or a suggestion to suspend or stop an existing therapeutic regiment.
- a recommended treatment protocol including, for example and without limitation, a suggestion to obtain an additional diagnostic test from the subject, a suggestion to begin a therapeutic regimen, a suggestion to modify an existing therapeutic regimen with the subject, and/or a suggestion to suspend or stop an existing therapeutic regiment.
- cfDNA samples human plasma containing contributions from an unknown number of healthy individuals; bulk.cfDNA
- MC2.cfDNA a cfDNA sample from single healthy male control individual
- four cfDNA samples from patients with intracranial tumors tumor.2349, tumor.2350, tumor.2351, tumor.2353
- six MNase digestion experiments from five different human cell lines (Hap1.MNase, HeLa.MNase, HEK.MNase, NA12878.MNase, HeLaS3, MCF.7) and seven cfDNA samples from different pregnant female individuals (gm1matplas, gm2matplas, im1matplas, fgs002, fgs003, fgs004, fgs005) were analyzed and contrasted with regular shotgun sequencing data set of DNA extracted from a
- Read start coordinates were extracted and periodograms were created using Fast Fourier Transformation (FFT) as described in the Methods section.
- FFT Fast Fourier Transformation
- FIGs. 4 and 5 explore visualizations of the periodogram intensities at 196 bp across contiguous, non-overlapping 10 kbp blocks tiling the full length of human autosomes (see Methods for details).
- FIG. 4 presents a Principal Component Analysis (PCA) of the data and the projections across the first three components.
- PCA Principal Component Analysis
- PC1 Principal component 1
- PC2 (9.7% of variance) captures the differences between MNase and cfDNA samples.
- PC3 (6.4% variance) captures differences between individual samples.
- FIG. 5 shows the hierarchical clustering dendogram of this data based on Euclidean distances of the intensity vectors. We note that the two HeLa S3 experiments tightly cluster in the PCA and dendogram, even though data was generated in different labs and following different experimental protocols. "Normal" cfDNA samples, tumor cfDNA samples and groups of cell line MNase samples also clustered.
- the three tumor samples originating from the same tumor type appear to cluster, separately from tumor.2351 sample which originates from a different tumor type (see Table 1).
- the GM1 and IM1 samples cluster separately from the other cfDNA samples obtained from pregnant women. This coincides with higher intensities observed for frequencies below the peak in these samples (i.e., a more pronounced left shoulder in FIG. 3 ). This might indicate subtle differences in the preparation of the cfDNA between the two sets of samples, or biological differences which were not controlled for (e.g., gestational age).
- FIGS. 6 and 7 show the results of equivalent analyses but based on the frequency range of 181 bp to 202 bp. Comparing these plots, the results are largely stable to a wider frequency range; however additional frequencies may improve sensitivity in more fine-scaled analyses.
- the cfDNA and MNase data sets were analyzed separately using PCA of intensities for this frequency range. In the following set of analyses, the five cfDNA samples from pregnant women, which show the pronounced left shoulder in FIG. 3 , were excluded.
- FIG. 8 shows the first 7 principal components of the cfDNA data and FIG. 9 all six principal components for the six MNase data sets.
- Example 1 basic clustering of samples that were generated or downloaded from public databases was studied. The analyses showed that read start coordinates in these data sets capture a strong signal of nucleosome positioning (across a range of sequencing depths obtained from 20 million sequences to more than a 1,000 million sequences) and that sample origin correlates with this signal. For the goals of this method, it would also be useful to be able to identify mixtures of known cell types and to some extent quantify the contributions of each cell type from this signal. For this purpose, this example explored synthetic mixtures (i.e., based on sequence reads) of two samples.
- FIG. 10 shows the average intensities for chromosome 11, equivalent to FIG. 3 but for these synthetic mixtures. It can be seen from FIG. 10 how the different sample contributions cause shifts in the global frequency intensity patterns. This signal can be exploited to infer the synthetic mixture proportions.
- FIG. 11 shows the first two principal components for the MNase data set mixtures and
- FIG. 12 shows the first two principal components for the cfDNA data set mixtures. In both cases, the first PC directly captures the composition of the mixed data set. It is therefore directly conceivable how mixture proportions for two and possibly more cell types could be estimated from transformation of the frequency intensity data given the appropriate reference sets and using for example regression models.
- FIG. 13 shows the dendogram of both data sets, confirming the overall similarities of mixture samples deriving from similar sample proportions as well as the separation of the cfDNA and MNase samples.
- EXAMPLE 3 Measuring Nucleosome Occupancy Relative to Transcription Factor Binding Sites with cfDNA Sequencing Data
- nucleosome positioning is influenced by nearby TF occupancy.
- the effect on local remodeling of chromatin, and thus on the stable positioning of nearby nucleosomes, is not uniform across the set of TFs; occupancy of a given TF may have local effects on nucleosome positioning that are preferentially 5' or 3' of the binding site and stretch for greater or lesser genomic distance in specific cell types.
- the set of TF binding sites occupied in vivo in a particular cell varies between tissues and cell types, such that if one were able to identify TF binding site occupancy maps for tissues or cell types of interest, and repeated this process for one or more TFs, one could identify components of the mixture of cell types and tissues contributing to a population of cfDNA by identifying enrichment or depletion of one or more cell type- or tissue-specific TF binding site occupancy profiles.
- TF ChlP-seq transcription factor
- the number of read-starts at each position within 500 bp of each candidate TF binding site was calculated in samples with at least 100 million sequences. Within each sample, all read-starts were summed at each position, yielding a total of 1,014 to 1,019 positions per sample per TF, depending on the length of the TF recognition sequence.
- FIG. 14 shows the distribution of read-starts around 24,666 CTCF binding sites in the human genome in a variety of different samples, centered around the binding site itself.
- CTCF is an insulator binding protein and plays a major role in transcriptional repression.
- Previous studies suggest that CTCF binding sites anchor local nucleosome positioning such that at least 20 nucleosomes are symmetrically and regularly spaced around a given binding site, with an approximate period of 185 bp.
- One striking feature common to nearly all of the samples in FIG. 14 is the clear periodicity of nucleosome positioning both upstream and downstream of the binding site, suggesting that the local and largely symmetrical effects of CTCF binding in vivo are recapitulated in a variety of cfDNA and MNase-digested samples.
- the periodicity of the upstream and downstream peaks is not uniform across the set of samples; the MNase-digested samples display slightly wider spacing of the peaks relative to the binding site, suggesting the utility of not only the intensity of the peaks, but also their period.
- FIG. 15 shows the distribution of read-starts around 5,644 c-Jun binding sites. While the familiar periodicity is again visually identifiable for several samples in this figure, the effect is not uniform. Of note, three of the MNase-digested samples (Hap1.MNase, HEK.MNase, and NA12878.MNase) have much flatter distributions, which may indicate that c-Jun binding sites are not heavily occupied in these cells, or that the effect of c-Jun binding on local chromatin remodeling is less pronounced in these cell types.
- FIG. 16 shows the distribution of read-starts around 4,417 NF-YB binding sites.
- the start site distributions in the neighborhood of these TF binding sites demonstrate a departure from symmetry: here, the downstream effects (to the right within each plot) appear to be stronger than the upstream effects, as evidenced by the slight upward trajectory in the cfDNA samples.
- the difference between the MNase-digested samples and the cfDNA samples show, on average, a flatter profile in which peaks are difficult to discern, whereas the latter have both more clearly discernable periodicity and more identifiable peaks.
- Whole blood was drawn from pregnant women fgs002, fgs003, fgs004, and fgs005 during routine third-trimester prenatal care and stored briefly in Vacutainer tubes containing EDTA (BD).
- Whole blood from pregnant women IM1, GM1, and GM2 was obtained at 18, 13, and 10 weeks gestation, respectively, and stored briefly in Vacutainer tubes containing EDTA (BD).
- Whole blood from glioma patients 2349, 2350, 2351, and 2353 was collected as part of brain surgical procedures and stored for less than three hours in Vacutainer tubes containing EDTA (BD).
- MC2 Male Control 2
- Plasma was separated from whole blood by centrifugation at 1,000 ⁇ g for 10 minutes at 4°C, after which the supernatant was collected and centrifuged again at 2,000 ⁇ g for 15 minutes at 4°C. Purified plasma was stored in 1 ml aliquots at -80°C until use.
- Circulating cfDNA was purified from 2 ml of each plasma sample with the QiaAMP Circulating Nucleic Acids kit (Qiagen, Venlo, Netherlands) as per the manufacturer's protocol. DNA was quantified with a Qubit fluorometer (Invitrogen, Carlsbad, California) and a custom qPCR assay targeting a human Alu sequence.
- GM12878, HeLa S3, HEK, Hap1 Approximately 50 million cells of each line (GM12878, HeLa S3, HEK, Hap1) were grown using standard methods. Growth media was aspirated and cells were washed with PBS. Cells were trypsinized and neutralized with 2x volume of CSS media, then pelleted in conical tubes by centrifugation for at 1,300 rpm for 5 minutes at 4°C. Cell pellets were resuspended in 12 ml ice-cold PBS with 1x protease inhibitor cocktail added, counted, and then pelleted by centrifugation for at 1,300 rpm for 5 minutes at 4°C.
- RSB buffer (10mM Tris-HCl, 10mM NaCl, 3mM MgCl 2 , 0.5mM spermidine, 0.02% NP-40, 1X protease inhibitor cocktail) to a concentration of 3 million cells per ml and incubated on ice for 10 minutes with gentle inversion. Nuclei were pelleted by centrifugation at 1,300 rpm for five minutes at 4°C.
- Pelleted nuclei were resuspended in NSB buffer (25% glycerol, 5mM MgAc 2 , 5mM HEPES, 0.08mM EDTA, 0.5mM spermidine, 1mM DTT, 1x protease inhibitor cocktail) to a final concentration of 15M per ml.
- Nuclei were again pelleted by centrifugation at 1,300 rpm for 5 minutes at 4°C, and resuspended in MN buffer (500mM Tris-HCl, 10mM NaCl, 3mM MgCl 2 , 1mM CaCl, 1x protease inhibitor cocktail) to a final concentration of 30M per ml.
- Nuclei were split into 200 ⁇ l aliquots and digested with 4U of micrococcal nuclease (Worthington Biochemical Corp., Lakewood, NJ, USA) for five minutes at 37°C. The reaction was quenched on ice with the addition of 85 ⁇ l of MNSTOP buffer (500mM NaCl, 50mM EDTA, 0.07% NP-40, 1x protease inhibitor), followed by a 90 minute incubation at 4°C with gentle inversion. DNA was purified using phenol:chloroform:isoamyl alcohol extraction. Mononucleosomal fragments were size selected with 2% agarose gel electrophoresis using standard methods and quantified with a Nanodrop spectrophotometer (Thermo Fisher Scientific Inc., Waltham, MA, USA).
- MNSTOP buffer 500mM NaCl, 50mM EDTA, 0.07% NP-40, 1x protease inhibitor
- Barcoded sequencing libraries for all samples were prepared with the ThruPLEX-FD or ThruPLEX DNA-seq 48D kits (Rubicon Genomics, Ann Arbor, Michigan), comprising a proprietary series of end-repair, ligation, and amplification reactions. Between 3.0 and 10.0 ng of DNA were used as input for all clinical sample libraries. Two bulk plasma cfDNA libraries were constructed with 30 ng of input to each library; each library was separately barcoded. Two libraries from MC2 were constructed with 2 ng of input to each library; each library was separately barcoded. Libraries for each of the MNase-digested cell lines were constructed with 20 ng of size-selected input DNA. Library amplification for all samples was monitored by real-time PCR to avoid over-amplification.
- One lane of sequencing was performed for each of samples 2349, 2350, 2351, and 2353, yielding approximately 2.0 ⁇ 10 8 read-pairs per sample.
- One lane of sequencing was performed for each of the four cell line MNase-digested libraries, yielding approximately 2.0 ⁇ 10 8 read-pairs per library.
- Four lanes of sequencing were performed for one of the two replicate MC2 libraries and three lanes for one of the two replicate bulk plasma libraries, yielding a total of 10.6x10 9 and 7.8 ⁇ 10 8 read-pairs per library, respectively.
- DNA insert sizes for both cfDNA and MNase libraries tend be short (majority of data between 80 bp and 240 bp); adapter sequence at the read ends of some molecules were therefore expected.
- Adapter sequences starting at read ends were trimmed, and forward and reverse read of paired end (“PE") data for short original molecules were collapsed into single reads ("SRs"); PE reads that overlap with at least 11 bp reads were collapsed to SRs.
- the SRs shorter than 30 bp or showing more than 5 bases with a quality score below 10 were discarded.
- the remaining PE and SR data were aligned to the human reference genome (GRCh37, 1000G release v2) using fast alignment tools (BWA-ALN or BWA-MEM).
- the resulting SAM (Sequence Alignment/Map) format was converted to sorted BAM (Binary Sequence Alignment/Map format) using SAMtools.
- PE data provides information about the two physical ends of DNA molecules used in sequencing library preparation. This information was extracted using the SAMtools application programming interface (API) from BAM files. Both outer alignment coordinates of PE data for which both reads aligned to the same chromosome and where reads have opposite orientations were used. For non-trimmed SR data, only one read end provides information about the physical end of the original DNA molecule. If a read was aligned to the plus strand of the reference genome, the left-most coordinate was used. If a read was aligned to the reverse strand, its right-most coordinate was used instead. In cases where PE data was converted to single read data by adapter trimming, both end coordinates were considered. Both end coordinates were also considered if at least five adapter bases were trimmed from a SR sequencing experiment.
- API application programming interface
- the ratio of read-starts and coverage was calculated for each non-empty block of each sample. If the coverage was 0, the ratio was set to 0. These ratios were used to calculate a periodogram of each block using Fast Fourier Transform (FFT, spec.pgram in the R statistical programming environment) with frequencies between 1/500 bases and 1/100 bases.
- FFT Fast Fourier Transform
- parameters to smooth 3bp Daniell smoother; moving average giving half weight to the end values
- detrend the data e.g., subtract the mean of the series and remove a linear trend
- PCA Principal component analysis
- Putative transcription factor binding sites obtained through analysis of ChlP-seq data generated across a number of cell types, was obtained from the ENCODE project.
- Chromosomal coordinates from both sets of predicted sites were intersected with bedtools v2.17.0. To preserve any asymmetry in the plots, only predicted binding sites on the "+" strand were used. Read-starts were tallied for each sample if they fell within 500 bp of either end of the predicted binding site, and summed within samples by position across all such sites. Only samples with at least 100 million total reads were used for this analysis.
- EXAMPLE 4 Determining normal/healthy tissue(s)-of-origin from cfDNA
- cfDNA was deeply sequenced to better understand the processes that give rise to it.
- the resulting data was used to build a genome-wide map of nucleosome occupancy that built on previous work by others, but is substantially more comprehensive.
- TFs transcription factors
- cfDNA fragments correspond to chromatosomes and contain substantial DNA damage
- sequencing-related statistics including the total number of fragments sequenced, read lengths, the percentage of such fragments aligning to the reference with and without a mapping quality threshold, mean coverage, duplication rate, and the proportion of sequenced fragments in two length bins, were tabulated.
- Fragment length was inferred from alignment of paired-end reads. Due to the short read lengths, coverage was calculated by assuming the entire fragment had been read. The estimated number of duplicate fragments was based on fragment endpoints, which may overestimate the true duplication rate in the presence of highly stereotyped cleavage.
- SSP single-stranded library preparation protocol.
- DSP double-stranded library preparation protocol.
- dsDNA short double stranded DNA
- a single-stranded sequencing library from plasma-borne cfDNA derived from an additional healthy individual was prepared using a protocol adapted from studies of ancient DNA by Gansauge, et al., where widespread DNA damage and nuclease cleavage around nucleosomes have been reported.
- cfDNA was denatured and a biotin-conjugated, single-stranded adaptor was ligated to the resulting fragments. The ligated fragments were then subjected to second-strand synthesis, end-repair and ligation of a second adaptor while the fragments were immobilized to streptavidin beads. Finally, minimal PCR amplification was performed to enrich for adaptor-bearing molecules while also appending a sample index ( FIG. 20 ; Table 2).
- the resulting library was sequenced to 30-fold coverage (779M fragments).
- the fragment length distribution again exhibited a dominant peak at -167 bp corresponding to the chromatosome, but was considerably enriched for shorter fragments relative to conventional library preparation ( FIGs. 21, 22 , 23A-B , 24A-B ).
- all libraries exhibit -10.4 bp periodicity, the fragment sizes are offset by 3 bp for the two methods, consistent with damaged or non-flush input molecules whose true endpoints are more faithfully represented in single-stranded libraries.
- WPS Windowed Protection Score
- the value of the WPS correlates with the locations of nucleosomes within strongly positioned arrays, as mapped by other groups with in vitro methods or ancient DNA ( FIG. 26 ). At other sites, the WPS correlates with genomic features such as DNase I hypersensitive (DHS) sites (e.g., consistent with the repositioning of nucleosomes flanking a distal regulatory element) ( FIG. 27 ).
- DHS DNase I hypersensitive
- fragment endpoints were also simulated, matching for the depth, size distribution and terminal dinucleotide frequencies of each sample. Genome-wide WPS were then calculated, and 10.3M, 10.2M, and 8.0M were called local maxima by the same heuristic, for simulated datasets matched to BH01, IH01 and IH02, respectively. Peaks from simulated datasets were associated with lower scores than peaks from real datasets ( FIGs. 33A-B ). Furthermore, the relatively reproducible locations of peaks called from real datasets ( FIG. 31 ; FIGs. 32A-C ) did not align well with the locations of peaks called from simulated datasets ( FIG. 31 ; FIGs. 34A-C ).
- the cfDNA sequencing data from BH01, IH01, and IH02 were pooled and reanalyzed for a combined 231 fold-coverage ('CH01'; 3.8B fragments; Table 1).
- the WPS was calculated and 12.9M peaks were called for this combined sample.
- This set of peak calls was associated with higher scores and approached saturation in terms of the number of peaks ( FIGs. 33A-B ).
- the CH01 peak set spans 2.53 gigabases (Gb) of the human reference genome.
- Nucleosomes are known to be well-positioned in relation to landmarks of gene regulation, for example transcriptional start sites and exon-intron boundaries. Consistent with that understanding, similar positioning was observed in this data as well, in relation to landmarks of transcription, translation and splicing ( FIGs. 36-40 ).
- the median peak-to-peak spacing within 100 kilobase (kb) windows that had been assigned to compartment A (enriched for open chromatin) or compartment B (enriched for closed chromatin) on the basis of long-range interactions ( in situ Hi-C) in a lymphoblastoid cell line was examined.
- Nucleosomes in compartment A exhibited tighter spacing than nucleosomes in compartment B (median 187 bp (A) vs. 190 bp (B)), with further differences between certain subcompartments ( FIG. 41 ).
- median nucleosome spacing dropped sharply in pericentromeric regions, driven by strong positioning across arrays of alpha satellites (171 bp monomer length; FIG. 42 ; FIG. 26 ).
- the long fraction WPS supports strong organization of nucleosomes in the vicinity of CTCF binding sites ( FIG. 43 ). However, a strong signal in the short fraction WPS is also observed that is coincident with the CTCF binding site itself ( FIGs. 44-45 ).
- CTCF binding sites were stratified based on a presumption that they are bound in vivo (all FIMO predictions vs. the subset intersecting with ENCODE ChlP-seq vs. the further subset intersecting with those that appear to be utilized across 19 cell lines).
- Nucleosome spacing varies between cell types, and as a function of chromatin state and gene expression. In general, open chromatin and transcription are associated with a shorter nucleosome repeat length, consistent with this Example's analyses of compartment A vs. B ( FIG. 41 ).
- FFT fast Fourier transformation
- EXAMPLE 5 Determining non-healthy tissue(s)-of-origin from cfDNA
- cfDNA samples obtained from five late-stage cancer patients were sequenced.
- the patterns of nucleosome spacing in these samples revealed additional contributions to cfDNA that correlated most strongly with non-hematopoietic tissues or cell lines, often matching the anatomical origin of the patient's cancer.
- Table 4 shows clinical and histological diagnoses for 48 patients from whom plasma-borne cfDNA was screened for evidence of high tumor burden, along with total cfDNA yield from 1.0 ml of plasma from each individual and relevant clinical covariates. Of these 48, 44 passed QC and had sufficient material. Of these 44, five were selected for deeper sequencing. cfDNA yield was determined by Qubit Fluorometer 2.0 (Life Technologies).
- Human peripheral blood plasma for 52 individuals with clinical diagnosis of Stage IV cancer was obtained from Conversant Bio or PlasmaLab International (Everett, Washington, USA) and stored in 0.5 ml or 1 ml aliquots at -80°C until use.
- Human peripheral blood plasma for four individuals with clinical diagnosis of systemic lupus erythematosus was obtained from Conversant Bio and stored in 0.5 ml aliquots at -80°C until use. Frozen plasma aliquots were thawed on the bench-top immediately before use.
- Circulating cell-free DNA was purified from 2 ml of each plasma sample with the QiaAMP Circulating Nucleic Acids kit (Qiagen) as per the manufacturer's protocol. DNA was quantified with a Qubit fluorometer (Invitrogen). To verify cfDNA yield in a subset of samples, purified DNA was further quantified with a custom qPCR assay targeting a multicopy human Alu sequence; the two estimates were found to be concordant.
- each sample was scored on two metrics of aneuploidy to identify a subset likely to contain a high proportion of tumor-derived cfDNA: first, the deviation from the expected proportion of reads derived from each chromosome ( FIG. 62A ); and second, the per-chromosome allele balance profile for a panel of common single nucleotide polymorphisms ( FIG. 62B ).
- single-stranded libraries derived from five individuals were sequenced to a depth similar to that of IH02 in Example 4 (Table 5; mean 30-fold coverage): SSP, single-stranded library preparation protocol. DSP, double-stranded library preparation protocol. ⁇ Sample has been previously published ( J.O. Kitzman et al., Science Translational Medicine (2012 )).
- Table 5 tabulates sequencing-related statistics, including the total number of fragments sequenced, read lengths, the percentage of such fragments aligning to the reference with and without a mapping quality threshold, mean coverage, duplication rate, and the proportion of sequenced fragments in two length bins, for each sample.
- Fragment length was inferred from alignment of paired-end reads. Due to the short read lengths, coverage was calculated by assuming the entire fragment had been read. The estimated number of duplicate fragments is based on fragment endpoints, which may overestimate the true duplication rate in the presence of highly stereotyped cleavage.
- FFT FFT was performed on the long fragment WPS values across gene bodies and correlated the average intensity in the 193-199 bp frequency range against the same 76 expression datasets for human cell lines and primary tissues.
- many of the most highly ranked cell lines or tissues represent non-hematopoietic lineages, in some cases aligning with the cancer type ( FIG. 61 ; Table 3).
- the top-ranked correlation was with HepG2, a hepatocellular carcinoma cell line.
- IC35 where the patient had a ductal carcinoma in situ breast cancer, the top-ranked correlation was with MCF7, a metastatic breast adenocarcinoma cell line.
- MCF7 a metastatic breast adenocarcinoma cell line.
- the largest change in correlation rank (-31) was for a small cell lung cancer cell line (SCLC-21H).
- IC20 a lung squamous cell carcinoma
- IC35 a colorectal adenocarcinoma
- a greedy, iterative approach was used to estimate the proportions of various cell-types and/or tissues contributing to cfDNA derived from the biological sample.
- the cell-type or tissue whose reference map (here, defined by the 76 RNA expression datasets) had the highest correlation with the average FFT intensity in the 193-199 bp frequency of the WPS long fragment values across gene bodies for a given cfDNA sample was identified.
- a series of "two tissue" linear mixture models were fitted, including the cell-type or tissue with the highest correlation as well as each of the other remaining cell-types or tissues from the full set of reference maps.
- the cell-type or tissue with the highest coefficient was retained as contributory, unless the coefficient was below 1% in which case the procedure was terminated and this last tissue or cell-type not included. This procedure was repeated, i.e. "three-tissue”, “four-tissue”, and so on, until termination based on the newly added tissue being estimated by the mixture model to contribute less than 1%.
- the mixture model takes the form: argmax_ a , b , c , ... cor Mean _ FFTintensity _ 193 ⁇ 199 , a * log 2 ExpTissue 1 + b * log 2 Tissue 2 + c * log 2 Tissue 3 + ... + 1 ⁇ a ⁇ b ⁇ c ⁇ ... * log 2 ExpTissueN .
- a cfDNA sample derived from a patient with advanced hepatocellular carcinoma predicted 9 contributory cell types, including Hep_G2 (28.6%), HMC.1 (14.3%), REH (14.0%), MCF7 (12.6%), AN3.CA (10.7%), THP.1 (7.4%), NB.4 (5.5%), U.266.84 (4.5%), and U.937 (2.4%).
- a cfDNA sample corresponding to a mixture of healthy individuals predicted 7 contributory cell types or tissues, including bone marrow (30.0%), NB.4 (19.6%), HMC.1 (13.9%), U.937 (13.4%), U.266.84 (12.5%), Karpas.707 (6.5%), and REH (4.2%).
- IC17 the sample derived from a cancer patient, the highest proportion of predicted contribution corresponds to a cell line that is closely associated with the cancer type that is present in the patient from whom this cfDNA was derived (Hep_G2 and hepatocellular carcinoma).
- this approach predicts contributions corresponding only to tissues or cell types that are primarily associated with hematopoiesis, the predominant source of plasma cfDNA in healthy individuals.
- Human peripheral blood plasma for 52 individuals with clinical diagnosis of Stage IV cancer was obtained from Conversant Bio or PlasmaLab International (Everett, Washington, USA) and stored in 0.5 ml or 1 ml aliquots at -80°C until use.
- Human peripheral blood plasma for four individuals with clinical diagnosis of systemic lupus erythematosus was obtained from Conversant Bio and stored in 0.5 ml aliquots at -80°C until use.
- Circulating cell-free DNA was purified from 2 ml of each plasma sample with the QiaAMP Circulating Nucleic Acids kit (Qiagen) as per the manufacturer's protocol. DNA was quantified with a Qubit fluorometer (Invitrogen). To verify cfDNA yield in a subset of samples, purified DNA was further quantified with a custom qPCR assay targeting a multicopy human Alu sequence; the two estimates were found to be concordant.
- Barcoded sequencing libraries were prepared with the ThruPLEX-FD or ThruPLEX DNA-seq 48D kits (Rubicon Genomics), comprising a proprietary series of end-repair, ligation, and amplification reactions. Between 0.5 ng and 30.0 ng of cfDNA were used as input for all clinical sample libraries. Library amplification for all samples was monitored by real-time PCR to avoid over-amplification, and was typically terminated after 4-6 cycles.
- Adapter 2 was prepared by combining 4.5 ⁇ l TE (pH 8), 0.5 ⁇ l 1M NaCl, 10 ⁇ l 500 uM oligo Adapter2.1, and 10 ⁇ l 500 ⁇ M oligo Adapter2.2, incubating at 95°C for 10 seconds, and decreasing the temperature to 14°C at a rate of 0.1°C/s.
- Purified cfDNA fragments were dephosphorylated by combining 2x CircLigase II buffer (Epicentre), 5 mM MnCl 2 , and 1U FastAP alkaline phosphatase (Thermo Fisher) with 0.5-10 ng fragments in a 20 ⁇ l reaction volume and incubating at 37°C for 30 minutes.
- Fragments were then denatured by heating to 95°C for 3 minutes, and were immediately transferred to an ice bath.
- the reaction was supplemented with biotin-conjugated adapter oligo CL78 (5 pmol), 20% PEG-6000 (w/v), and 200U CircLigase II (Epicentre) for a total volume of 40 ⁇ l, and was incubated overnight with rotation at 60°C, heated to 95°C for 3 minutes, and placed in an ice bath.
- BBB bead binding buffer
- Beads were washed once with 500 ul wash buffer A (WBA) (10 mM Tris-HCl [pH 8], 1 mM EDTA [pH 8], 0.05% Tween-20, 100 mM NaCl, 0.5% SDS) and once with 500 ⁇ l wash buffer B (WBB) (10 mM Tris-HCl [pH 8], 1 mM EDTA [pH 8], 0.05% Tween-20, 100 mM NaCl).
- WBA wash buffer A
- WBB wash buffer B
- Beads were combined with 1X Isothermal Amplification Buffer (NEB), 2.5 ⁇ M oligo CL9, 250 ⁇ M (each) dNTPs, and 24U Bst 2.0 DNA Polymerase (NEB) in a reaction volume of 50 ⁇ l, incubated with gentle shaking by ramping temperature from 15°C to 37°C at 1°C/minute, and held at 37°C for 10 minutes. After collection on a magnetic rack, beads were washed once with 200 ⁇ l WBA, resuspended in 200 ⁇ l of stringency wash buffer (SWB) (0.1X SSC, 0.1% SDS), and incubated at 45°C for 3 minutes. Beads were again collected and washed once with 200 ⁇ l WBB.
- SWB stringency wash buffer
- Beads were then combined with 1X CutSmart Buffer (NEB), 0.025% Tween-20, 100 ⁇ M (each) dNTPs, and 5U T4 DNA Polymerase (NEB) and incubated with gentle shaking for 30 minutes at room temperature. Beads were washed once with each of WBA, SWB, and WBB as described above. Beads were then mixed with 1X CutSmart Buffer (NEB), 5% PEG-6000, 0.025% Tween-20, 2 ⁇ M double-stranded adapter 2, and 10U T4 DNA Ligase (NEB), and incubated with gentle shaking for 2 hours at room temperature.
- Beads were washed once with each of WBA, SWB, and WBB as described above, and resuspended in 25 ⁇ l TET buffer (10 mM Tris-HCl [pH 8], 1 mM EDTA [pH 8], 0.05% Tween-20). Second strands were eluted from beads by heating to 95°C, collecting beads on a magnetic rack, and transferring the supernatant to a new tube. Library amplification for all samples was monitored by real-time PCR to avoid over-amplification, and required an average of 4 to 6 cycles per library.
- Barcoded paired end (PE) Illumina sequencing data was split allowing up to one substitution in the barcode sequence. Reads shorter or equal to read length were consensus called and adapter trimmed. Remaining consensus single end reads (SR) and the individual PE reads were aligned to the human reference genome sequence (GRCh37, 1000 Genomes phase 2 technical reference downloaded from ftp://ftp.1 000genomes.ebi.ac.uk/vol1 /ftp/technical/reference/phase2_ reference_assembly_sequence/) using the ALN algorithm implemented in BWA v0.7.10.
- PE reads were further processed with BWA SAMPE to resolve ambiguous placement of read pairs or to rescue missing alignments by a more sensitive alignment step around the location of one placed read end.
- Aligned SR and PE data was directly converted to sorted BAM format using the SAMtools API. BAM files of the sample were merged across lanes and sequencing runs.
- Quality control was performed using FastQC (v0.11.2), obtaining a library complexity estimate (Picard tools v1.113), determining the proportion of adapter dimers, the analysis of the inferred library insert size, the nucleotide and dinucleotide frequencies at the outer reads ends as well as checking the mapping quality distributions of each library.
- Aligned sequencing data was simulated (SR if shorter than 45 bp, PE 45 bp otherwise) for all major chromosomes of the human reference (GRC37h). For this purpose, dinucleotide frequencies were determined from real data on both read ends and both strand orientations. Dinucleotide frequencies were also recorded for the reference genome on both strands. Further, the insert size distribution of the real data was extracted for the 1-500 bp range. Reads were simulated by iterating through the sequence of the major reference chromosomes.
- the strand is randomly chosen, (2) the ratio of the dinucleotide frequency in the real data over the frequency in the reference sequence is used to randomly decide whether the initiating dinucleotide is considered, (3) an insert size is sampled from the provided insert-size distribution and (4) the frequency ratio of the terminal dinucleotide is used to randomly decide whether the generated alignment is reported.
- the simulated coverage was matched to that of the original data after PCR duplicate removal.
- the data of the present disclosure provides information about the two physical ends of DNA molecules used in sequencing library preparation. We extract this information using the SAMtools application programming interface (API) from BAM files.
- SAMtools application programming interface API
- both end coordinates of the SR alignment we consider both end coordinates of the SR alignment as read starts.
- For coverage we consider all positions between the two (inferred) molecule ends, including these end positions.
- WPS windowed protection scores
- the identified region is 150-450 bp long, we apply the same above median contiguous window approach, but only report those windows that are between 50-150 bp in size. For score calculation of multiple windows derived from the 150-450 bp regions, we assume the neighboring minima within the region to be zero. We discard regions shorter than 50 bp and longer than 450 bp.
- Genomic features such as transcription start sites, transcription end sites, start codons, splice donor, and splice acceptor sites were obtained from Ensembl Build version 75. Adjusted WPS surrounding these features was calculated and plotted as described above for transcription factor binding sites.
- CTCF sites used for this analysis first included clustered FIMO predictions of CTCF binding sites (computationally predicted via motifs). We then created two additional subsets of this set: 1) intersection with the set of CTCF ChlP-seq peaks available through the ENCODE TfbsClusteredV3 (see above), and 2) intersection with a set of CTCF sites that are experimentally observed to be active across 19 tissues.
- the positions of 10 nucleosomes on either side of the binding site were extracted for each site.
- the distribution of -1 to +1 nucleosome spacing changed substantially, shifting to larger spacing, particularly in the 230-270 bp range. This suggested that truly active CTCF sites largely shift towards wider spacing between the -1 and +1 nucleosomes, and that a difference in WPS for both long and short read fractions might therefore be apparent. Therefore, the mean short and long fragment WPS at each position relative to the center of CTCF sites were additionally calculated.
- nucleosome spacing was taken within bins of -1 to +1 nucleosome spacing of less than 160, 160-200, 200-230, 230-270, 270-420, 420-460, and greater than 420 bp. These intervals approximately captured spacings of interest, such as the dominant peak and the emerging peak at 230-270 bp for more confidently active sites.
- DHS peaks for 349 primary tissue and cell line samples in BED format by Maurano et al. (Science, vol. 337(6099), pp. 1190-95 (2012 ); "all_fdr0.05_hot” file, last modified Feb. 13, 2012) were downloaded from the University of Washington Encode database.
- Samples derived from fetal tissues, comprising 233 of these peak sets, were removed from the analysis as they behaved inconsistently within tissue type, possibly because of unequal representation of multiple cell types within each tissue sample. 116 samples representing a variety of cell lineages were retained for analysis.
- the nearest upstream and downstream calls in the CH01 callset were identified, and the genomic distance between the centers of those two calls was calculated. The distribution of all such distances was visualized for each DHS peak callset using a smoothed density estimate calculated for distances between 0 and 500 bp.
- FPKM expression values measured for 20,344 Ensembl gene identifiers in 44 human cell lines and 32 primary tissues by the Human Protein Atlas ("ma.csv" file) were used in this study. For analyses across tissues, genes with less than 3 non-zero expression values were excluded (19,378 genes passing this filter). The expression data set was provided with one decimal precession for the FPKM values. Thus, a zero expression value (0.0) indicates expression between 0 and a value less than 0.05. Unless otherwise noted, the minimum expression value was set to 0.04 FPKM before log 2 -transformation of the expression values.
- the long fragment WPS was used to calculate periodograms of genomic regions using Fast Fourier Transform (FFT, spec.pgram in the R statistical programming environment) with frequencies between 1/500 bases and 1/100 bases.
- FFT Fast Fourier Transform
- Parameters to smooth (3 bp Daniell smoother; moving average giving half weight to the end values) and de-trend the data (i.e. subtract the mean of the series and remove a linear trend) are optionally additionally used.
- the recursive time series filter as implemented in the R statistical programming environment was used to remove high frequency variation from trajectories.
- 24 filter frequencies (1/seq(5,100,4)) were used, and the first 24 values of the trajectory as initial values were used. Adjustments for the 24-value shift in the resulting trajectories were made by repeating the last 24 values of the trajectory.
- the intensity values as determined from smooth periodograms (FFT) in the context of gene expression for the 120-280 bp range were analyzed.
- An S-shaped Pearson correlation between gene expression values and FFT intensities around the major inter-nucleosome distance peak was observed.
- a pronounced negative correlation was observed in the 193-199 bp range.
- the intensities in this frequency range were averaged correlated with log 2 -transformed expression values.
- Example 7 A method of determining tissues and/or cell types giving rise to cell free DNA (cfDNA) in a subject, the method comprising:
- Example 8 The method of Example 7 wherein the step of determining at least some of the tissues and/or cell types giving rise to the cfDNA fragments comprises comparing the genomic locations of at least some of the cfDNA fragment endpoints to one or more reference maps.
- Example 9 The method of Example 7 or Example 8 wherein the step of determining at least some of the tissues and/or cell types giving rise to the cfDNA fragments comprises performing a mathematical transformation on a distribution of the genomic locations of at least some of the cfDNA fragment endpoints.
- Example 10 The method of Example 9 wherein the mathematical transformation includes a Fourier transformation.
- Example 11 The method of any preceding Example further comprising determining a score for each of at least some coordinates of the reference genome, wherein the score is determined as a function of at least the plurality of cfDNA fragment endpoints and their genomic locations, and wherein the step of determining at least some of the tissues and/or cell types giving rise to the observed cfDNA fragments comprises comparing the scores to one or more reference map.
- Example 12 The method of Example 11, wherein the score for a coordinate represents or is related to the probability that the coordinate is a location of a cfDNA fragment endpoint.
- Example 13 The method of any one of Examples 8 to 12 wherein the reference map comprises a DNase I hypersensitive site map generated from at least one cell-type or tissue.
- Example 14 The method of any one of Examples 8 to 13 wherein the reference map comprises an RNA expression map generated from at least one cell-type or tissue.
- Example 15 The method of any one of Examples 8 to 14 wherein the reference map is generated from cfDNA from an animal to which human tissues or cells that have been xenografted.
- Example 16 The method of any one of Examples 8 to 15 wherein the reference map comprises a chromosome conformation map generated from at least one cell-type or tissue.
- Example 17 The method of any one of Examples 8 to 16 wherein the reference map comprises a chromatin accessibility map generated from at least one cell-type or tissue.
- Example 18 The method of any one of Examples 8 to 17 wherein the reference map comprises sequence data obtained from samples obtained from at least one reference subject.
- Example 19 The method of any one of Examples 8 to 18 wherein the reference map corresponds to at least one cell-type or tissue that is associated with a disease or a disorder.
- Example 20 The method of any one of Examples 8 to 19 wherein the reference map comprises positions or spacing of nucleosomes and/or chromatosomes in a tissue or cell type.
- Example 21 The method of any one of Examples 8 to 20 wherein the reference map is generated by digesting chromatin obtained from at least one cell-type or tissue with an exogenous nuclease (e.g., micrococcal nuclease).
- an exogenous nuclease e.g., micrococcal nuclease
- Example 22 The method of any one of Examples 8 to 21, wherein the reference maps comprise chromatin accessibility data determined by a transposition-based method (e.g., ATAC-seq) from at least one cell-type or tissue.
- a transposition-based method e.g., ATAC-seq
- Example 23 The method of any one of Examples 8 to 22 wherein the reference maps comprise data associated with positions of a DNA binding and/or DNA occupying protein for a tissue or cell type.
- Example 24 The method of Example 23 wherein the DNA binding and/or DNA occupying protein is a transcription factor.
- Example 25 The method of Example 23 or Example 24 wherein the positions are determined by chromatin immunoprecipitation of a crosslinked DNA-protein complex.
- Example 26 The method of Example 23 or Example 24 wherein the positions are determined by treating DNA associated with the tissue or cell type with a nuclease (e.g., DNase-I).
- a nuclease e.g., DNase-I
- Example 27 The method of any one of Examples 8 to 26 wherein the reference map comprises a biological feature related to the positions or spacing of nucleosomes, chromatosomes, or other DNA binding or DNA occupying proteins within a tissue or cell type.
- Example 28 The method of Example 27 wherein the biological feature is quantitative expression of one or more genes.
- Example 29 The method of Example 27 or Example 28 wherein the biological feature is presence or absence of one or more histone marks.
- Example 30 The method of any one of Examples 27 to 29 wherein the biological feature is hypersensitivity to nuclease cleavage.
- Example 31 The method of any one of Examples 8 to 30 wherein the tissue or cell type used to generate a reference map is a primary tissue from a subject having a disease or disorder.
- Example 32 The method of Example 31 wherein the disease or disorder is selected from the group consisting of: cancer, normal pregnancy, a complication of pregnancy (e.g., aneuploid pregnancy), myocardial infarction, inflammatory bowel disease, systemic autoimmune disease, localized autoimmune disease, allotransplantation with rejection, allotransplantation without rejection, stroke, and localized tissue damage.
- the disease or disorder is selected from the group consisting of: cancer, normal pregnancy, a complication of pregnancy (e.g., aneuploid pregnancy), myocardial infarction, inflammatory bowel disease, systemic autoimmune disease, localized autoimmune disease, allotransplantation with rejection, allotransplantation without rejection, stroke, and localized tissue damage.
- Example 33 The method of any one of Examples 8 to 30 wherein the tissue or cell type used to generate a reference map is a primary tissue from a healthy subject.
- Example 34 The method of any one of Examples 8 to 30 wherein the tissue or cell type used to generate a reference map is an immortalized cell line.
- Example 35 The method of any one of Examples 8 to 30 wherein the tissue or cell type used to generate a reference map is a biopsy from a tumor.
- Example 36 The method of Example 18 wherein the sequence data comprises positions of cfDNA fragment endpoints.
- Example 37 The method of Example 36 wherein the reference subject is healthy.
- Example 38 The method of Example 36 wherein the reference subject has a disease or disorder.
- Example 39 The method of Example 38 wherein the disease or disorder is selected from the group consisting of: cancer, normal pregnancy, a complication of pregnancy (e.g., aneuploid pregnancy), myocardial infarction, inflammatory bowel disease, systemic autoimmune disease, localized autoimmune disease, allotransplantation with rejection, allotransplantation without rejection, stroke, and localized tissue damage.
- the disease or disorder is selected from the group consisting of: cancer, normal pregnancy, a complication of pregnancy (e.g., aneuploid pregnancy), myocardial infarction, inflammatory bowel disease, systemic autoimmune disease, localized autoimmune disease, allotransplantation with rejection, allotransplantation without rejection, stroke, and localized tissue damage.
- Example 40 The method of any one of Examples 19 to 39 wherein the reference map comprises reference scores for at least a portion of coordinates of the reference genome associated with the tissue or cell type.
- Example 41 The method of Example 40 wherein the reference map comprises a mathematical transformation of the scores.
- Example 42 The method of Example 40 wherein the scores represent a subset of all reference genomic coordinates for the tissue or cell type.
- Example 43 The method of Example 42 wherein the subset is associated with positions or spacing of nucleosomes and/or chromatosomes.
- Example 44 The method of Example 42 or Example 43 wherein the subset is associated with transcription start sites and/or transcription end sites.
- Example 45 The method of any one of Examples 42 to 44 wherein the subset is associated with binding sites of at least one transcription factor.
- Example 46 The method of any one of Examples 42 to 45 wherein the subset is associated with nuclease hypersensitive sites.
- Example 47 The method of any one of Examples 40 to 46 wherein the subset is additionally associated with at least one orthogonal biological feature.
- Example 48 The method of Example 47 wherein the orthogonal biological feature is associated with high expression genes.
- Example 49 The method of Example 47 wherein the orthogonal biological feature is associated with low expression genes.
- Example 50 The method of any one of Examples 41 to 49 wherein the mathematical transformation includes a Fourier transformation.
- Example 51 The method of any one of Examples 11 to 50 wherein at least a subset of the plurality of the scores has a score above a threshold value.
- Example 52 The method of any one of Examples 7 to 51 wherein the step of determining the tissues and/or cell types giving rise to the cfDNA as a function of a plurality of the genomic locations of at least some of the cfDNA fragment endpoints comprises comparing a Fourier transform of the plurality of the genomic locations of at least some of the cfDNA fragment endpoints, or a mathematical transformation thereof, with a reference map.
- Example 53 The method of any preceding Example further comprising generating a report comprising a list of the determined tissues and/or cell types giving rise to the isolated cfDNA.
- Example 54 A method of identifying a disease or disorder in a subject, the method comprising:
- Example 55 The method of Example 54 wherein the step of determining the tissues and/or cell types giving rise to the cfDNA comprises comparing the genomic locations of at least some of the cfDNA fragment endpoints to one or more reference maps.
- Example 56 The method of Example 54 or Example 55 wherein the step of determining the tissues and/or cell types giving rise to the cfDNA comprises performing a mathematical transformation on a distribution of the genomic locations of at least some of the plurality of the cfDNA fragment endpoints.
- Example 57 The method of Example 56 wherein the mathematical transformation includes a Fourier transformation.
- Example 58 The method of any one of Examples 54 to 57 further comprising determining a score for each of at least some coordinates of the reference genome, wherein the score is determined as a function of at least the plurality of cfDNA fragment endpoints and their genomic locations, and wherein the step of determining at least some of the tissues and/or cell types giving rise to the observed cfDNA fragments comprises comparing the scores to one or more reference map.
- Example 59 The method of Example 58, wherein the score for a coordinate represents or is related to the probability that the coordinate is a location of a cfDNA fragment endpoint.
- Example 60 The method of any one of Examples 55 to 59 wherein the reference map comprises a DNase I hypersensitive site map, an RNA expression map, expression data, a chromosome conformation map, a chromatin accessibility map, chromatin fragmentation map, or sequence data obtained from samples obtained from at least one reference subject, and corresponding to at least one cell type or tissue that is associated with a disease or a disorder, and/or positions or spacing of nucleosomes and/or chromatosomes in a tissue or cell type.
- the reference map comprises a DNase I hypersensitive site map, an RNA expression map, expression data, a chromosome conformation map, a chromatin accessibility map, chromatin fragmentation map, or sequence data obtained from samples obtained from at least one reference subject, and corresponding to at least one cell type or tissue that is associated with a disease or a disorder, and/or positions or spacing of nucleosomes and/or chromatosomes in a tissue or cell type.
- Example 61 The method of any one of Examples 55 to 60 wherein the reference map is generated by digesting chromatin from at least one cell-type or tissue with an exogenous nuclease (e.g., micrococcal nuclease).
- an exogenous nuclease e.g., micrococcal nuclease
- Example 62 The method of Example 60 or Example 61, wherein the reference maps comprise chromatin accessibility data determined by applying a transposition-based method (e.g., ATAC-seq) to nuclei or chromatin from at least one cell-type or tissue.
- a transposition-based method e.g., ATAC-seq
- Example 63 The method of any one of Examples 55 to 62 wherein the reference maps comprise data associated with positions of a DNA binding and/or DNA occupying protein for a tissue or cell type.
- Example 64 The method of Example 63 wherein the DNA binding and/or DNA occupying protein is a transcription factor.
- Example 65 The method of Example 63 or Example 64 wherein the positions are determined by applying chromatin immunoprecipitation of a crosslinked DNA-protein complex to at least one cell-type or tissue.
- Example 66 The method of Example 63 or Example 64 wherein the positions are determined by treating DNA associated with the tissue or cell type with a nuclease (e.g., DNase-I).
- a nuclease e.g., DNase-I
- Example 67 The method of any one of Examples 54 to 66 wherein the reference map comprises a biological feature related to the positions or spacing of nucleosomes, chromatosomes, or other DNA binding or DNA occupying proteins within a tissue or cell type.
- Example 68 The method of Example 67 wherein the biological feature is quantitative expression of one or more genes.
- Example 69 The method of Example 67 or Example 68 wherein the biological feature is presence or absence of one or more histone marks.
- Example 70 The method of Example any one of Examples 67 to 69 wherein the biological feature is hypersensitivity to nuclease cleavage.
- Example 71 The method of any one of Examples 55 to 70 wherein the tissue or cell type used to generate a reference map is a primary tissue from a subject having a disease or disorder.
- Example 72 The method of Example 71 wherein the disease or disorder is selected from the group consisting of: cancer, normal pregnancy, a complication of pregnancy (e.g., aneuploid pregnancy), myocardial infarction, inflammatory bowel disease, systemic autoimmune disease, localized autoimmune disease, allotransplantation with rejection, allotransplantation without rejection, stroke, and localized tissue damage.
- the disease or disorder is selected from the group consisting of: cancer, normal pregnancy, a complication of pregnancy (e.g., aneuploid pregnancy), myocardial infarction, inflammatory bowel disease, systemic autoimmune disease, localized autoimmune disease, allotransplantation with rejection, allotransplantation without rejection, stroke, and localized tissue damage.
- Example 73 The method of any one of Examples 55 to 70 wherein the tissue or cell type used to generate a reference map is a primary tissue from a healthy subject.
- Example 74 The method of any one of Examples 55 to 70 wherein the tissue or cell type used to generate a reference map is an immortalized cell line.
- Example 75 The method of any one of Examples 55 to 70 wherein the tissue or cell type used to generate a reference map is a biopsy from a tumor.
- Example 76 The method of Example 60 wherein the sequence data obtained from samples obtained from at least one reference subject comprises positions of cfDNA fragment endpoint probabilities.
- Example 77 The method of Example 76 wherein the reference subject is healthy.
- Example 78 The method of Example 76 wherein the reference subject has a disease or disorder.
- Example 79 The method of Example 78 wherein the disease or disorder is selected from the group consisting of: cancer, normal pregnancy, a complication of pregnancy (e.g., aneuploid pregnancy), myocardial infarction, inflammatory bowel disease, systemic autoimmune disease, localized autoimmune disease, allotransplantation with rejection, allotransplantation without rejection, stroke, and localized tissue damage.
- the disease or disorder is selected from the group consisting of: cancer, normal pregnancy, a complication of pregnancy (e.g., aneuploid pregnancy), myocardial infarction, inflammatory bowel disease, systemic autoimmune disease, localized autoimmune disease, allotransplantation with rejection, allotransplantation without rejection, stroke, and localized tissue damage.
- Example 80 The method of any one of Examples 60 to 79 wherein the reference map comprises cfDNA fragment endpoint probabilities for at least a portion of the reference genome associated with the tissue or cell type.
- Example 81 The method of Example 80 wherein the reference map comprises a mathematical transformation of the cfDNA fragment endpoint probabilities.
- Example 82 The method of Example 80 wherein the cfDNA fragment endpoint probabilities represent a subset of all reference genomic coordinates for the tissue or cell type.
- Example 83 The method of Example 82 wherein the subset is associated with positions or spacing of nucleosomes and/or chromatosomes.
- Example 84 The method of Example 82 or Example 83 wherein the subset is associated with transcription start sites and/or transcription end sites.
- Example 85 The method of any one of Examples 82 to 84 wherein the subset is associated with binding sites of at least one transcription factor.
- Example 86 The method of any one of Examples 82 to 85 wherein the subset is associated with nuclease hypersensitive sites.
- Example 87 The method of any one of Examples 82 to 86 wherein the subset is additionally associated with at least one orthogonal biological feature.
- Example 88 The method of Example 87 wherein the orthogonal biological feature is associated with high expression genes.
- Example 89 The method of Example 87 wherein the orthogonal biological feature is associated with low expression genes.
- Example 90 The method of any one of Examples 81 to 89 wherein the mathematical transformation includes a Fourier transformation.
- Example 91 The method of any one of Examples 58 to 90 wherein at least a subset of the plurality of the cfDNA fragment endpoint scores each has a score above a threshold value.
- Example 92 The method of any one of Examples 54 to 91 wherein the step of determining the tissue(s) and/or cell type(s) of the cfDNA as a function of a plurality of the genomic locations of at least some of the cfDNA fragment endpoints comprises comparing a Fourier transform of the plurality of the genomic locations of at least some of the cfDNA fragment endpoints, or a mathematical transformation thereof, with a reference map.
- Example 93 The method of any one of Examples 54 to 92 wherein the reference map comprises DNA or chromatin fragmentation data corresponding to at least one tissue that is associated with the disease or disorder.
- Example 94 The method of any one of Examples 54 to 93 wherein the reference genome is associated with a human.
- Example 95 The method of any one of Examples 54 to 94 further comprising generating a report comprising a statement identifying the disease or disorder.
- Example 96 The method of Example 95 wherein the report further comprises a list of the determined tissue(s) and/or cell type(s) of the isolated cfDNA.
- Example 97 The method of any preceding Example wherein the biological sample comprises, consists essentially of, or consists of whole blood, peripheral blood plasma, urine, or cerebral spinal fluid.
- Example 98 A method for determining tissues and/or cell types giving rise to cell-free DNA (cfDNA) in a subject, comprising:
- Example 99 A method for determining tissues and/or cell types giving rise to cell-free DNA in a subject, comprising:
- Example 100 A method for diagnosing a clinical condition in a subject, comprising:
- Example 101 A method for diagnosing a clinical condition in a subject, comprising
- Example 102 The method of any one of Examples 98-101, wherein the nucleosome map is generated by:
- Example 103 The method of any one of Examples 98-101, wherein the reference set of nucleosome maps are generated by:
- Example 104 The method of any one of Examples 98-101, wherein distribution (a), (b) or (c), or a mathematical transformation of one of these distributions, is subjected to Fourier transformation in contiguous windows, followed by quantitation of intensities for frequency ranges that are associated with nucleosome occupancy, in order to summarize the extent to which nucleosomes exhibit structured positioning within each contiguous window.
- Example 105 The method of any one of Examples 98-101, wherein in distribution (a), (b) or (c), or a mathematical transformation of one of these distributions, we quantify the distribution of sites in the reference human genome to which sequencing read start sites map in the immediate vicinity of transcription factor binding sites (TFBS) of specific transcription factor (TF), which are often immediately flanked by nucleosomes when the TFBS is bound by the TF, in order to summarize nucleosome positioning as a consequence of TF activity in the cell type(s) contributing to cfDNA.
- TFBS transcription factor binding sites
- TF specific transcription factor
- Example 106 The method of any one of Examples 98-101, wherein the nucleosome occupancy signals are summarized in accordance with any one of aggregating signal from distributions (a), (b), and/or (c), or a mathematical transformation of one of these distributions, around other genomic landmarks such as DNasel hypersensitive sites, transcription start sites, topological domains, other epigenetic marks or subsets of all such sites defined by correlated behavior in other datasets (e.g. gene expression, etc.).
- genomic landmarks such as DNasel hypersensitive sites, transcription start sites, topological domains, other epigenetic marks or subsets of all such sites defined by correlated behavior in other datasets (e.g. gene expression, etc.).
- Example 107 The method of any one of Examples 98-101, wherein the distributions are transformed in order to aggregate or summarize the periodic signal of nucleosome positioning within various subsets of the genome, e.g. quantifying periodicity in contiguous windows or, alternatively, in discontiguous subsets of the genome defined by transcription factor binding sites, gene model features (e.g. transcription start sites), tissue expression data or other correlates of nucleosome positioning.
- Example 108 The method of any one of Examples 98-101, wherein the distributions are defined by tissue-specific data, i.e. aggregate signal in the vicinity of tissue-specific DNase I hypersensitive sites.
- Example 109 The method of any one of Examples 98-101, further comprising step of statistical signal processing for comparing additional nucleosome map(s) to the reference set.
- Example 110 The method of Example 109, wherein we first summarize long-range nucleosome ordering within contiguous windows along the genome in a diverse set of samples, and then perform principal components analysis (PCA) to cluster samples or to estimate mixture proportions.
- PCA principal components analysis
- Example 111 The method of Example 100 or Example 101, wherein the clinical condition is cancer, i.e. malignancies.
- Example 112 The method of Example 111, wherein the biological sample is circulating plasma containing cfDNA, some portion of which is derived from a tumor.
- Example 113 The method of Example 100 or Example 101, wherein the clinical condition is selected from tissue damage, myocardial infarction (acute damage of heart tissue), autoimmune disease (chronic damage of diverse tissues), pregnancy, chromosomal aberrations (e.g. trisomies), and transplant rejection.
- tissue damage myocardial infarction (acute damage of heart tissue), autoimmune disease (chronic damage of diverse tissues), pregnancy, chromosomal aberrations (e.g. trisomies), and transplant rejection.
- Example 114 The method of any preceding Example further comprising assigning a proportion to each of the one or more tissues or cell types determined to be contributing to cfDNA.
- Example 115 The method of Example 114 wherein the proportion assigned to each of the one or more determined tissues or cell types is based at least in part on a degree of correlation or of increased correlation, relative to cfDNA from a healthy subject or subjects.
- Example 116 The method of Example 114 or Example 115, wherein the degree of correlation is based at least in part on a comparison of a mathematical transformation of the distribution of cfDNA fragment endpoints from the biological sample with the reference map associated with the determined tissue or cell type.
- Example 117 The method of Example 114 to 116, wherein the proportion assigned to each of the one or more determined tissues or cell types is based on a mixture model.
Landscapes
- Life Sciences & Earth Sciences (AREA)
- Health & Medical Sciences (AREA)
- Engineering & Computer Science (AREA)
- Chemical & Material Sciences (AREA)
- Physics & Mathematics (AREA)
- Bioinformatics & Cheminformatics (AREA)
- Proteomics, Peptides & Aminoacids (AREA)
- Medical Informatics (AREA)
- General Health & Medical Sciences (AREA)
- Biophysics (AREA)
- Biotechnology (AREA)
- Analytical Chemistry (AREA)
- Organic Chemistry (AREA)
- Spectroscopy & Molecular Physics (AREA)
- Evolutionary Biology (AREA)
- Bioinformatics & Computational Biology (AREA)
- Theoretical Computer Science (AREA)
- Genetics & Genomics (AREA)
- Molecular Biology (AREA)
- Zoology (AREA)
- Wood Science & Technology (AREA)
- Public Health (AREA)
- Immunology (AREA)
- Data Mining & Analysis (AREA)
- Epidemiology (AREA)
- Databases & Information Systems (AREA)
- Microbiology (AREA)
- General Engineering & Computer Science (AREA)
- Biochemistry (AREA)
- Pathology (AREA)
- Biomedical Technology (AREA)
- Software Systems (AREA)
- Evolutionary Computation (AREA)
- Computer Vision & Pattern Recognition (AREA)
- Artificial Intelligence (AREA)
- Bioethics (AREA)
- Cell Biology (AREA)
- Primary Health Care (AREA)
- Signal Processing (AREA)
- Hospice & Palliative Care (AREA)
Applications Claiming Priority (4)
| Application Number | Priority Date | Filing Date | Title |
|---|---|---|---|
| US201462029178P | 2014-07-25 | 2014-07-25 | |
| US201462087619P | 2014-12-04 | 2014-12-04 | |
| EP15824425.1A EP3172341A4 (fr) | 2014-07-25 | 2015-07-27 | Procédés de détermination de types de tissus et/ou de cellules permettant d'obtenir de l'adn sans cellules, et procédés d'identification d'une maladie ou d'un trouble les employant |
| PCT/US2015/042310 WO2016015058A2 (fr) | 2014-07-25 | 2015-07-27 | Procédés de détermination de types de tissus et/ou de cellules permettant d'obtenir de l'adn sans cellules, et procédés d'identification d'une maladie ou d'un trouble les employant |
Related Parent Applications (1)
| Application Number | Title | Priority Date | Filing Date |
|---|---|---|---|
| EP15824425.1A Division EP3172341A4 (fr) | 2014-07-25 | 2015-07-27 | Procédés de détermination de types de tissus et/ou de cellules permettant d'obtenir de l'adn sans cellules, et procédés d'identification d'une maladie ou d'un trouble les employant |
Publications (1)
| Publication Number | Publication Date |
|---|---|
| EP4358097A1 true EP4358097A1 (fr) | 2024-04-24 |
Family
ID=55163988
Family Applications (2)
| Application Number | Title | Priority Date | Filing Date |
|---|---|---|---|
| EP23197187.0A Pending EP4358097A1 (fr) | 2014-07-25 | 2015-07-27 | Procédés de détermination de types de tissus et/ou de cellules permettant d'obtenir de l'adn sans cellules, et procédés d'identification d'une maladie ou d'un trouble les employant |
| EP15824425.1A Withdrawn EP3172341A4 (fr) | 2014-07-25 | 2015-07-27 | Procédés de détermination de types de tissus et/ou de cellules permettant d'obtenir de l'adn sans cellules, et procédés d'identification d'une maladie ou d'un trouble les employant |
Family Applications After (1)
| Application Number | Title | Priority Date | Filing Date |
|---|---|---|---|
| EP15824425.1A Withdrawn EP3172341A4 (fr) | 2014-07-25 | 2015-07-27 | Procédés de détermination de types de tissus et/ou de cellules permettant d'obtenir de l'adn sans cellules, et procédés d'identification d'une maladie ou d'un trouble les employant |
Country Status (8)
| Country | Link |
|---|---|
| US (4) | US20170211143A1 (fr) |
| EP (2) | EP4358097A1 (fr) |
| JP (3) | JP2017522908A (fr) |
| KR (2) | KR102441391B1 (fr) |
| CN (2) | CN107002122B (fr) |
| AU (2) | AU2015292311B2 (fr) |
| CA (1) | CA2956208A1 (fr) |
| WO (1) | WO2016015058A2 (fr) |
Families Citing this family (98)
| Publication number | Priority date | Publication date | Assignee | Title |
|---|---|---|---|---|
| WO2012129363A2 (fr) | 2011-03-24 | 2012-09-27 | President And Fellows Of Harvard College | Détection et analyse d'acide nucléique d'une cellule isolée |
| US9892230B2 (en) | 2012-03-08 | 2018-02-13 | The Chinese University Of Hong Kong | Size-based analysis of fetal or tumor DNA fraction in plasma |
| US11261494B2 (en) | 2012-06-21 | 2022-03-01 | The Chinese University Of Hong Kong | Method of measuring a fractional concentration of tumor DNA |
| US20160040229A1 (en) | 2013-08-16 | 2016-02-11 | Guardant Health, Inc. | Systems and methods to detect rare mutations and copy number variation |
| US11913065B2 (en) | 2012-09-04 | 2024-02-27 | Guardent Health, Inc. | Systems and methods to detect rare mutations and copy number variation |
| US10876152B2 (en) | 2012-09-04 | 2020-12-29 | Guardant Health, Inc. | Systems and methods to detect rare mutations and copy number variation |
| IL305303A (en) | 2012-09-04 | 2023-10-01 | Guardant Health Inc | Systems and methods for detecting rare mutations and changes in number of copies |
| JP6571665B2 (ja) | 2013-12-28 | 2019-09-04 | ガーダント ヘルス, インコーポレイテッド | 遺伝的バリアントを検出するための方法およびシステム |
| CN106795562B (zh) | 2014-07-18 | 2022-03-25 | 香港中文大学 | Dna混合物中的组织甲基化模式分析 |
| AU2015292311B2 (en) | 2014-07-25 | 2022-01-20 | University Of Washington | Methods of determining tissues and/or cell types giving rise to cell-free DNA, and methods of identifying a disease or disorder using same |
| US10364467B2 (en) | 2015-01-13 | 2019-07-30 | The Chinese University Of Hong Kong | Using size and number aberrations in plasma DNA for detecting cancer |
| WO2016123698A1 (fr) * | 2015-02-06 | 2016-08-11 | Uti Limited Partnership | Test diagnostique pour l'évaluation posttransplantation du rejet potentiel d'organes de donneurs |
| SG11201706529TA (en) | 2015-02-10 | 2017-09-28 | Univ Hong Kong Chinese | Detecting mutations for cancer screening and fetal analysis |
| HUE064231T2 (hu) | 2015-07-23 | 2024-02-28 | Univ Hong Kong Chinese | Sejtmentes DNS fragmentációs mintázatának elemzése |
| CN108603228B (zh) | 2015-12-17 | 2023-09-01 | 夸登特健康公司 | 通过分析无细胞dna确定肿瘤基因拷贝数的方法 |
| US11514289B1 (en) * | 2016-03-09 | 2022-11-29 | Freenome Holdings, Inc. | Generating machine learning models using genetic data |
| ES2967443T3 (es) * | 2016-07-06 | 2024-04-30 | Guardant Health Inc | Procedimientos de perfilado de fragmentoma de ácidos nucleicos sin células |
| WO2018013837A1 (fr) | 2016-07-15 | 2018-01-18 | The Regents Of The University Of California | Procédés de production de bibliothèques d'acides nucléiques |
| US11788135B2 (en) | 2016-08-05 | 2023-10-17 | The Broad Institute, Inc. | Methods for genome characterization |
| ES2840003T3 (es) | 2016-09-30 | 2021-07-06 | Guardant Health Inc | Métodos para análisis multi-resolución de ácidos nucleicos libres de células |
| US9850523B1 (en) | 2016-09-30 | 2017-12-26 | Guardant Health, Inc. | Methods for multi-resolution analysis of cell-free nucleic acids |
| US20200048711A1 (en) * | 2016-10-12 | 2020-02-13 | Bellwether Bio, Inc | Determining cell type origin of circulating cell-free dna with molecular counting |
| IL265769B2 (en) | 2016-10-19 | 2023-12-01 | Univ Hong Kong Chinese | Estimation of gestational age using methylation and size profile of maternal plasma DNA |
| WO2018081130A1 (fr) | 2016-10-24 | 2018-05-03 | The Chinese University Of Hong Kong | Méthodes et systèmes de détection d'une tumeur |
| KR20230062684A (ko) | 2016-11-30 | 2023-05-09 | 더 차이니즈 유니버시티 오브 홍콩 | 소변 및 기타 샘플에서의 무세포 dna의 분석 |
| EP3555311A4 (fr) | 2016-12-13 | 2020-08-12 | Bellwether Bio, Inc. | Détermination d'un état physiologique chez un individu par analyse de points d'extrémité de fragment d'adn acellulaire dans un échantillon biologique |
| IL302912A (en) | 2016-12-22 | 2023-07-01 | Guardant Health Inc | Methods and systems for analyzing nucleic acid molecules |
| US11821027B2 (en) | 2017-01-10 | 2023-11-21 | Juno Therapeutics, Inc. | Epigenetic analysis of cell therapy and related methods |
| TW202348802A (zh) | 2017-01-25 | 2023-12-16 | 香港中文大學 | 使用核酸片段之診斷應用 |
| US11535896B2 (en) | 2017-05-15 | 2022-12-27 | Katholieke Universiteit Leuven | Method for analysing cell-free nucleic acids |
| WO2018227202A1 (fr) | 2017-06-09 | 2018-12-13 | Bellwether Bio, Inc. | Détermination du type de cancer chez un sujet par modélisation probabiliste de points d'extrémité de fragment d'acide nucléique circulant |
| WO2018227211A1 (fr) * | 2017-06-09 | 2018-12-13 | Bellwether Bio, Inc. | Diagnostic du cancer ou d'autres états physiologiques à l'aide de points d'extrémité sentinelles de fragment d'acide nucléique circulant |
| US10636512B2 (en) | 2017-07-14 | 2020-04-28 | Cofactor Genomics, Inc. | Immuno-oncology applications using next generation sequencing |
| CN111213209A (zh) * | 2017-10-12 | 2020-05-29 | 南托米克斯有限责任公司 | 根据生物体液的评估用癌症评分和反应预测 |
| CN107545153B (zh) * | 2017-10-25 | 2021-06-11 | 桂林电子科技大学 | 一种基于卷积神经网络的核小体分类预测方法 |
| WO2019024341A1 (fr) * | 2017-11-27 | 2019-02-07 | 深圳华大生命科学研究院 | Procédé de construction d'une bibliothèque d'adn acellulaire dans des liquides corporels et application associée |
| CN108061794B (zh) * | 2017-12-25 | 2020-03-27 | 苏州大学 | 一种无染色、无探针、无损检测细胞或类细胞结构微生物的类型及其周期的方法 |
| AU2019207900A1 (en) | 2018-01-12 | 2020-07-09 | Claret Bioscience, Llc | Methods and compositions for analyzing nucleic acid |
| US11781183B2 (en) * | 2018-03-13 | 2023-10-10 | Yissum Research Development Company Of The Hebrew University Of Jerusalem Ltd. | Diagnostic use of cell free DNA chromatin immunoprecipitation |
| WO2019209884A1 (fr) * | 2018-04-23 | 2019-10-31 | Grail, Inc. | Méthodes et systèmes de dépistage d'affections |
| EP3794348A4 (fr) * | 2018-05-18 | 2022-03-09 | The Johns Hopkins University | Adn acellulaire pour évaluer et/ou traiter le cancer |
| US20190385700A1 (en) * | 2018-06-04 | 2019-12-19 | Guardant Health, Inc. | METHODS AND SYSTEMS FOR DETERMINING The CELLULAR ORIGIN OF CELL-FREE NUCLEIC ACIDS |
| WO2019236726A1 (fr) | 2018-06-06 | 2019-12-12 | The Regents Of The University Of California | Procédés de production de bibliothèques d'acides nucléiques et compositions et kits pour leur mise en œuvre |
| CN108796056A (zh) * | 2018-06-28 | 2018-11-13 | 元码基因科技(北京)股份有限公司 | 基于游离dna的目标基因捕获技术进行组织溯源的方法 |
| WO2020006369A1 (fr) * | 2018-06-29 | 2020-01-02 | Guardant Health, Inc. | Procédés et systèmes d'analyse de régions de liaison ctcf dans un adn acellulaire |
| CN108913682A (zh) * | 2018-07-05 | 2018-11-30 | 上海奥测医疗科技有限公司 | 一种制备cfDNA参考品的方法 |
| SG11202100564PA (en) * | 2018-07-23 | 2021-02-25 | Univ Hong Kong Chinese | Cell-free dna damage analysis and its clinical applications |
| CN109448783B (zh) * | 2018-08-07 | 2022-05-13 | 清华大学 | 一种染色质拓扑结构域边界的分析方法 |
| CA3111887A1 (fr) | 2018-09-27 | 2020-04-02 | Grail, Inc. | Marqueurs de methylation et panels de sondes de methylation ciblees |
| EP3815005A4 (fr) * | 2018-10-08 | 2022-03-30 | Freenome Holdings, Inc. | Profilage du facteur de transcription |
| CN111172263A (zh) * | 2018-11-12 | 2020-05-19 | 北京医院 | 一种应用于无创产前检测的参考物质及其制备方法 |
| US20200199685A1 (en) | 2018-12-17 | 2020-06-25 | Guardant Health, Inc. | Determination of a physiological condition with nucleic acid fragment endpoints |
| ES2968457T3 (es) * | 2018-12-19 | 2024-05-09 | Univ Hong Kong Chinese | Características de los extremos del ADN extracelular circulante |
| US11657897B2 (en) * | 2018-12-31 | 2023-05-23 | Nvidia Corporation | Denoising ATAC-seq data with deep learning |
| BR112020026133A2 (pt) * | 2019-01-24 | 2021-07-27 | Illumina, Inc. | métodos e sistemas para monitorar a saúde e as doenças dos órgãos |
| AU2020216438A1 (en) | 2019-01-31 | 2021-07-29 | Guardant Health, Inc. | Compositions and methods for isolating cell-free DNA |
| CN109841265B (zh) * | 2019-02-22 | 2021-09-21 | 清华大学 | 使用片段化模式确定血浆游离核酸分子组织来源的方法和系统及应用 |
| WO2020198942A1 (fr) * | 2019-03-29 | 2020-10-08 | 中国科学技术大学 | Procédé et système d'analyse de données de séquençage d'accessibilité de chromatine unicellulaire basés sur le regroupement de pics |
| WO2020243722A1 (fr) | 2019-05-31 | 2020-12-03 | Guardant Health, Inc. | Procédés et systèmes pour améliorer une surveillance de patient après une intervention chirurgicale |
| CN110272985B (zh) * | 2019-06-26 | 2021-08-17 | 广州市雄基生物信息技术有限公司 | 基于外周血血浆游离dna高通量测序技术的肿瘤筛查试剂盒及其系统与方法 |
| WO2021067484A1 (fr) | 2019-09-30 | 2021-04-08 | Guardant Health, Inc. | Compositions et procédés d'analyse d'adn acellulaire dans des dosages de partitionnement de méthylation |
| CN110739027B (zh) * | 2019-10-23 | 2023-04-18 | 深圳吉因加医学检验实验室 | 一种基于染色质区域覆盖深度的癌症组织定位方法及系统 |
| US20210214800A1 (en) | 2019-11-26 | 2021-07-15 | Guardant Health, Inc. | Methods, compositions and systems for improving the binding of methylated polynucleotides |
| US20210189494A1 (en) * | 2019-12-18 | 2021-06-24 | The Chinese University Of Hong Kong | Cell-free dna fragmentation and nucleases |
| WO2021126091A1 (fr) * | 2019-12-19 | 2021-06-24 | Agency For Science, Technology And Research | Procédé d'estimation d'une charge d'adn tumoral circulant et kits et procédés associés |
| US20230042332A1 (en) | 2019-12-24 | 2023-02-09 | Vib Vzw | Disease Detection in Liquid Biopsies |
| AU2021205853A1 (en) * | 2020-01-08 | 2023-11-23 | Grail, Inc. | Biterminal dna fragment types in cell-free samples and uses thereof |
| WO2021141220A1 (fr) * | 2020-01-09 | 2021-07-15 | 서울대학교 산학협력단 | Normalisation de données atac-seq et son procédé d'utilisation |
| CN111254194B (zh) * | 2020-01-13 | 2021-09-07 | 东南大学 | 基于cfDNA的测序及数据分析的癌症相关生物标记及其在cfDNA样品分类中的应用 |
| WO2021163630A1 (fr) * | 2020-02-13 | 2021-08-19 | 10X Genomics, Inc. | Systèmes et procédés de visualisation interactive conjointe de l'expression génique et de l'accessibilité à la chromatine d'adn |
| US11211147B2 (en) | 2020-02-18 | 2021-12-28 | Tempus Labs, Inc. | Estimation of circulating tumor fraction using off-target reads of targeted-panel sequencing |
| US11475981B2 (en) | 2020-02-18 | 2022-10-18 | Tempus Labs, Inc. | Methods and systems for dynamic variant thresholding in a liquid biopsy assay |
| US11211144B2 (en) | 2020-02-18 | 2021-12-28 | Tempus Labs, Inc. | Methods and systems for refining copy number variation in a liquid biopsy assay |
| EP4143338A1 (fr) | 2020-04-30 | 2023-03-08 | Guardant Health, Inc. | Procédés de détermination de séquence à l'aide d'acides nucléiques partitionnés |
| CN111724860B (zh) * | 2020-06-18 | 2021-03-16 | 深圳吉因加医学检验实验室 | 一种基于测序数据识别染色质开放区域的方法及装置 |
| WO2023282916A1 (fr) | 2021-07-09 | 2023-01-12 | Guardant Health, Inc. | Procédés de détection de réarrangements génomiques à l'aide d'acides nucléiques acellulaires |
| CN111881418B (zh) * | 2020-07-27 | 2023-05-16 | 中国农业科学院农业信息研究所 | 一种基于二分法的大豆气象产量预测方法及系统 |
| WO2022026761A1 (fr) | 2020-07-30 | 2022-02-03 | Guardant Health, Inc. | Compositions et méthodes pour isoler de l'adn acellulaire |
| CN112085067B (zh) * | 2020-08-17 | 2022-07-12 | 浙江大学 | 一种高通量筛选dna损伤反应抑制剂的方法 |
| EP4205126A1 (fr) | 2020-08-25 | 2023-07-05 | Guardant Health, Inc. | Méthodes et systèmes pour prédire l'origine d'un variant |
| EP4214329A1 (fr) * | 2020-09-17 | 2023-07-26 | The Regents of the University of Colorado, a body corporate | Signatures dans un adn libre circulant pour détecter une maladie, suivre une réponse de traitement et prévenir des décisions thérapeutiques |
| US20220154285A1 (en) | 2020-09-30 | 2022-05-19 | Guardant Health, Inc. | Analysis of methylated dna comprising methylation-sensitive or methylation-dependent restrictions |
| EP4232599A1 (fr) | 2020-10-23 | 2023-08-30 | Guardant Health, Inc. | Compositions et procédés d'analyse d'adn par division et conversion de base |
| EP4251765A1 (fr) | 2020-11-30 | 2023-10-04 | Guardant Health, Inc. | Compositions et méthodes d'enrichissement de polynucléotides méthylés |
| WO2022140629A1 (fr) | 2020-12-23 | 2022-06-30 | Guardant Health, Inc. | Procédés et systèmes d'analyse des polynucléotides méthylés |
| TW202242145A (zh) * | 2020-12-29 | 2022-11-01 | 比利時商比利時意志有限公司 | 核小體耗盡循環無細胞染色質片段之轉錄因子結合位點分析 |
| EP4291681A1 (fr) * | 2021-02-09 | 2023-12-20 | Illumina, Inc. | Méthodes et systèmes pour surveiller la santé des organes et l'apparition de maladies |
| EP4291679A1 (fr) | 2021-02-12 | 2023-12-20 | Guardant Health, Inc. | Procédés et compositions pour la détection de variants d'acide nucléique |
| EP4314329A1 (fr) | 2021-03-25 | 2024-02-07 | Guardant Health, Inc. | Procédés et compositions pour quantifier l'adn de cellules immunitaires |
| AU2022255198A1 (en) * | 2021-04-08 | 2023-11-23 | Fred Hutchinson Cancer Center | Cell-free dna sequence data analysis method to examine nucleosome protection and chromatin accessibility |
| IL307524A (en) * | 2021-04-08 | 2023-12-01 | Delfi Diagnostics Inc | A method for cancer detection using genome-wide CFDNA fragility profiles |
| WO2022271730A1 (fr) | 2021-06-21 | 2022-12-29 | Guardant Health, Inc. | Procédés et compositions pour l'analyse tissulaire d'origine informée par le numéro de copie |
| WO2023056065A1 (fr) | 2021-09-30 | 2023-04-06 | Guardant Health, Inc. | Compositions et procédés de synthèse et d'utilisation de sondes ciblant des réarrangements d'acides nucléiques |
| WO2023197004A1 (fr) | 2022-04-07 | 2023-10-12 | Guardant Health, Inc. | Détection de la présence d'une tumeur fondée sur l'état de méthylation des molécules d'acide nucléique acellulaire |
| GB202205710D0 (en) | 2022-04-19 | 2022-06-01 | Univ Of Essex Enterprises Limited | Cell-free DNA-based methods |
| WO2024006908A1 (fr) | 2022-06-30 | 2024-01-04 | Guardant Health, Inc. | Enrichissement d'adn méthylé de manière aberrante |
| WO2024056720A1 (fr) | 2022-09-13 | 2024-03-21 | Medizinische Universität Graz | Détermination de l'état de santé et surveillance de traitement avec de l'adn acellulaire |
| WO2024073508A2 (fr) | 2022-09-27 | 2024-04-04 | Guardant Health, Inc. | Procédés et compositions de quantification d'adn de cellules immunitaires |
Citations (2)
| Publication number | Priority date | Publication date | Assignee | Title |
|---|---|---|---|---|
| WO2013177086A1 (fr) * | 2012-05-21 | 2013-11-28 | Sequenom, Inc. | Procédés et méthodes d'évaluation non invasive de variations génétiques |
| WO2014039729A1 (fr) * | 2012-09-05 | 2014-03-13 | Stamatoyannopoulos John A | Procédés et compositions associés à la régulation des acides nucléiques |
Family Cites Families (54)
| Publication number | Priority date | Publication date | Assignee | Title |
|---|---|---|---|---|
| GB0016742D0 (en) * | 2000-07-10 | 2000-08-30 | Simeg Limited | Diagnostic method |
| JP2002272497A (ja) | 2001-03-15 | 2002-09-24 | Venture Link Co Ltd | 癌の診断方法、およびその診断用ベクター |
| US6927028B2 (en) | 2001-08-31 | 2005-08-09 | Chinese University Of Hong Kong | Non-invasive methods for detecting non-host DNA in a host using epigenetic differences between the host and non-host DNA |
| AU2004217872B2 (en) | 2003-03-05 | 2010-03-25 | Genetic Technologies Limited | Identification of fetal DNA and fetal cell markers in maternal plasma or serum |
| EP1524321B2 (fr) | 2003-10-16 | 2014-07-23 | Sequenom, Inc. | Détection non invasive de traits génétiques létaux |
| US20070122823A1 (en) | 2005-09-01 | 2007-05-31 | Bianchi Diana W | Amniotic fluid cell-free fetal DNA fragment size pattern for prenatal diagnosis |
| TR201910868T4 (tr) | 2006-02-02 | 2019-08-21 | Univ Leland Stanford Junior | Dijital analizle invazif olmayan fetal genetik tarama. |
| WO2007100911A2 (fr) | 2006-02-28 | 2007-09-07 | University Of Louisville Research Foundation | Détection d'anomalies chromosomiques à l'aide de polymorphismes mononucléotidiques tandem |
| TWI335354B (en) | 2006-09-27 | 2011-01-01 | Univ Hong Kong Chinese | Methods for the detection of the degree of the methylation of a target dna and kits |
| US7842482B2 (en) | 2007-02-26 | 2010-11-30 | The Chinese University Of Hong Kong | Methods and kits for diagnosis, prognosis or monitoring of Epstein-Barr virus (EBV)-associated cancer |
| US20100112590A1 (en) | 2007-07-23 | 2010-05-06 | The Chinese University Of Hong Kong | Diagnosing Fetal Chromosomal Aneuploidy Using Genomic Sequencing With Enrichment |
| CA3176319A1 (fr) | 2007-07-23 | 2009-01-29 | The Chinese University Of Hong Kong | Analyse d'adn tumoral dans un echantillon acellulaire |
| US20090053719A1 (en) | 2007-08-03 | 2009-02-26 | The Chinese University Of Hong Kong | Analysis of nucleic acids by digital pcr |
| US8748100B2 (en) | 2007-08-30 | 2014-06-10 | The Chinese University Of Hong Kong | Methods and kits for selectively amplifying, detecting or quantifying target DNA with specific end sequences |
| WO2009051842A2 (fr) | 2007-10-18 | 2009-04-23 | The Johns Hopkins University | Détection d'un cancer par mesure du nombre de copies génomiques et de la longueur des brins dans de l'adn exempt de cellules |
| US20100041048A1 (en) | 2008-07-31 | 2010-02-18 | The Johns Hopkins University | Circulating Mutant DNA to Assess Tumor Dynamics |
| US8476013B2 (en) * | 2008-09-16 | 2013-07-02 | Sequenom, Inc. | Processes and compositions for methylation-based acid enrichment of fetal nucleic acid from a maternal sample useful for non-invasive prenatal diagnoses |
| EP2334812B1 (fr) | 2008-09-20 | 2016-12-21 | The Board of Trustees of The Leland Stanford Junior University | Diagnostic non invasif d'aneuploïdie foetale par sequençage |
| US8835110B2 (en) | 2008-11-04 | 2014-09-16 | The Johns Hopkins University | DNA integrity assay (DIA) for cancer diagnostics, using confocal fluorescence spectroscopy |
| SG174401A1 (en) | 2009-03-31 | 2011-11-28 | Oridis Biomarkers Gmbh | Method for diagnosis of cancer and monitoring of cancer treatments |
| WO2011053790A2 (fr) | 2009-10-30 | 2011-05-05 | Fluidigm Corporation | Dosage de cibles étroitement liées en diagnostic foetal et dosage de détection de coïncidence pour l'analyse génétique |
| HUE034854T2 (en) | 2009-11-05 | 2018-03-28 | Univ Hong Kong Chinese | Fetal genomic analysis from maternal biological samples |
| EP3406737B1 (fr) | 2009-11-06 | 2023-05-31 | The Chinese University of Hong Kong | Analyse génomique bassé sur la taille |
| US20120010085A1 (en) | 2010-01-19 | 2012-01-12 | Rava Richard P | Methods for determining fraction of fetal nucleic acids in maternal samples |
| US9260745B2 (en) | 2010-01-19 | 2016-02-16 | Verinata Health, Inc. | Detecting and classifying copy number variation |
| US20130210645A1 (en) * | 2010-02-18 | 2013-08-15 | The Johns Hopkins University | Personalized tumor biomarkers |
| CN103370456A (zh) * | 2010-08-24 | 2013-10-23 | 比奥Dx股份有限公司 | 限定母体循环血液中保守的游离浮动胎儿dna的诊断性和治疗性靶物 |
| EP2426217A1 (fr) | 2010-09-03 | 2012-03-07 | Centre National de la Recherche Scientifique (CNRS) | Procédés analytiques pour acides nucléiques libres dans les cellules et applications |
| NZ611599A (en) | 2010-11-30 | 2015-05-29 | Univ Hong Kong Chinese | Detection of genetic or molecular aberrations associated with cancer |
| WO2013043922A1 (fr) | 2011-09-22 | 2013-03-28 | ImmuMetrix, LLC | Compositions et procédés pour analyser des échantillons hétérogènes |
| US10196681B2 (en) | 2011-10-06 | 2019-02-05 | Sequenom, Inc. | Methods and processes for non-invasive assessment of genetic variations |
| EP2771483A1 (fr) | 2011-10-25 | 2014-09-03 | ONCOTYROL - Center for Personalized Cancer Medicine GmbH | Méthode pour diagnostiquer une maladie basée sur la distribution de l'adn plasmatique |
| US9757458B2 (en) | 2011-12-05 | 2017-09-12 | Immunomedics, Inc. | Crosslinking of CD22 by epratuzumab triggers BCR signaling and caspase-dependent apoptosis in hematopoietic cancer cells |
| CN104334742A (zh) | 2012-01-27 | 2015-02-04 | 利兰斯坦福青年大学董事会 | 解析和定量无细胞rna的方法 |
| EP3401399B1 (fr) * | 2012-03-02 | 2020-04-22 | Sequenom, Inc. | Méthodes et procédés d'évaluation non invasive de variations génétiques |
| US9892230B2 (en) | 2012-03-08 | 2018-02-13 | The Chinese University Of Hong Kong | Size-based analysis of fetal or tumor DNA fraction in plasma |
| EP3573066B1 (fr) | 2012-03-13 | 2023-09-27 | The Chinese University Of Hong Kong | Procédés d'analyse de données de séquençage massivement parallèles pour diagnostic prénatal non invasif |
| US20150105267A1 (en) * | 2012-05-24 | 2015-04-16 | University Of Washington Through Its Center For Commercialization | Whole genome sequencing of a human fetus |
| US11261494B2 (en) * | 2012-06-21 | 2022-03-01 | The Chinese University Of Hong Kong | Method of measuring a fractional concentration of tumor DNA |
| IL305303A (en) | 2012-09-04 | 2023-10-01 | Guardant Health Inc | Systems and methods for detecting rare mutations and changes in number of copies |
| US9732390B2 (en) | 2012-09-20 | 2017-08-15 | The Chinese University Of Hong Kong | Non-invasive determination of methylome of fetus or tumor from plasma |
| EP3354747B1 (fr) | 2012-09-20 | 2021-02-17 | The Chinese University Of Hong Kong | Détermination non invasive d'un méthylome d'une tumeur à partir du plasma |
| AU2014268377B2 (en) * | 2013-05-24 | 2020-10-08 | Sequenom, Inc. | Methods and processes for non-invasive assessment of genetic variations |
| LT3004388T (lt) * | 2013-05-29 | 2019-01-25 | Chronix Biomedical | Donoro ne ląstelinės dnr aptikimas ir jos kiekio nustatymas organo transplantanto recipientų apytakoje |
| US10262755B2 (en) | 2014-04-21 | 2019-04-16 | Natera, Inc. | Detecting cancer mutations and aneuploidy in chromosomal segments |
| CN106460070B (zh) * | 2014-04-21 | 2021-10-08 | 纳特拉公司 | 检测染色体片段中的突变和倍性 |
| CA2950596C (fr) * | 2014-05-30 | 2023-10-31 | Verinata Health, Inc. | Detection des aneuploidies foetales sous-chromosomique et des variationsdu nombre de copies |
| CN106795562B (zh) | 2014-07-18 | 2022-03-25 | 香港中文大学 | Dna混合物中的组织甲基化模式分析 |
| AU2015292311B2 (en) | 2014-07-25 | 2022-01-20 | University Of Washington | Methods of determining tissues and/or cell types giving rise to cell-free DNA, and methods of identifying a disease or disorder using same |
| US10364467B2 (en) | 2015-01-13 | 2019-07-30 | The Chinese University Of Hong Kong | Using size and number aberrations in plasma DNA for detecting cancer |
| US11242559B2 (en) | 2015-01-13 | 2022-02-08 | The Chinese University Of Hong Kong | Method of nuclear DNA and mitochondrial DNA analysis |
| US10319463B2 (en) | 2015-01-23 | 2019-06-11 | The Chinese University Of Hong Kong | Combined size- and count-based analysis of maternal plasma for detection of fetal subchromosomal aberrations |
| SG11201706529TA (en) | 2015-02-10 | 2017-09-28 | Univ Hong Kong Chinese | Detecting mutations for cancer screening and fetal analysis |
| HUE064231T2 (hu) | 2015-07-23 | 2024-02-28 | Univ Hong Kong Chinese | Sejtmentes DNS fragmentációs mintázatának elemzése |
-
2015
- 2015-07-27 AU AU2015292311A patent/AU2015292311B2/en active Active
- 2015-07-27 CN CN201580052170.7A patent/CN107002122B/zh active Active
- 2015-07-27 US US15/329,228 patent/US20170211143A1/en not_active Abandoned
- 2015-07-27 EP EP23197187.0A patent/EP4358097A1/fr active Pending
- 2015-07-27 KR KR1020177004904A patent/KR102441391B1/ko active IP Right Grant
- 2015-07-27 CN CN202311109971.5A patent/CN117402950A/zh active Pending
- 2015-07-27 CA CA2956208A patent/CA2956208A1/fr active Pending
- 2015-07-27 JP JP2017525327A patent/JP2017522908A/ja active Pending
- 2015-07-27 EP EP15824425.1A patent/EP3172341A4/fr not_active Withdrawn
- 2015-07-27 WO PCT/US2015/042310 patent/WO2016015058A2/fr active Application Filing
- 2015-07-27 KR KR1020227030533A patent/KR20220127359A/ko active IP Right Grant
-
2018
- 2018-10-15 US US16/160,990 patent/US20190127794A1/en not_active Abandoned
-
2020
- 2020-05-21 US US16/880,884 patent/US11352670B2/en active Active
- 2020-12-08 JP JP2020203304A patent/JP2021045161A/ja active Pending
-
2022
- 2022-04-20 AU AU2022202587A patent/AU2022202587A1/en active Pending
- 2022-06-06 US US17/805,656 patent/US20230212672A1/en active Pending
-
2023
- 2023-05-19 JP JP2023082794A patent/JP2023123420A/ja active Pending
Patent Citations (2)
| Publication number | Priority date | Publication date | Assignee | Title |
|---|---|---|---|---|
| WO2013177086A1 (fr) * | 2012-05-21 | 2013-11-28 | Sequenom, Inc. | Procédés et méthodes d'évaluation non invasive de variations génétiques |
| WO2014039729A1 (fr) * | 2012-09-05 | 2014-03-13 | Stamatoyannopoulos John A | Procédés et compositions associés à la régulation des acides nucléiques |
Non-Patent Citations (4)
| Title |
|---|
| GAFFNEY ET AL., PLOS GENET., vol. 8, 2012, pages e1003036 |
| J.O. KITZMAN ET AL., SCIENCE TRANSLATIONAL MEDICINE, 2012 |
| JS PEDERSEN ET AL., GENOME RESEARCH, vol. 24, 2014, pages 454 - 466 |
| MAURANO ET AL., SCIENCE, vol. 337, no. 6099, 13 February 2012 (2012-02-13), pages 1190 - 95 |
Also Published As
| Publication number | Publication date |
|---|---|
| AU2022202587A1 (en) | 2022-05-26 |
| EP3172341A2 (fr) | 2017-05-31 |
| JP2023123420A (ja) | 2023-09-05 |
| WO2016015058A2 (fr) | 2016-01-28 |
| EP3172341A4 (fr) | 2018-03-28 |
| KR20170044660A (ko) | 2017-04-25 |
| JP2021045161A (ja) | 2021-03-25 |
| US20210010081A1 (en) | 2021-01-14 |
| US20230212672A1 (en) | 2023-07-06 |
| AU2015292311B2 (en) | 2022-01-20 |
| KR20220127359A (ko) | 2022-09-19 |
| CN107002122B (zh) | 2023-09-19 |
| CA2956208A1 (fr) | 2016-01-28 |
| CN117402950A (zh) | 2024-01-16 |
| CN107002122A (zh) | 2017-08-01 |
| JP2017522908A (ja) | 2017-08-17 |
| AU2015292311A1 (en) | 2017-03-09 |
| US20170211143A1 (en) | 2017-07-27 |
| US20190127794A1 (en) | 2019-05-02 |
| US11352670B2 (en) | 2022-06-07 |
| KR102441391B1 (ko) | 2022-09-07 |
| WO2016015058A3 (fr) | 2016-03-17 |
Similar Documents
| Publication | Publication Date | Title |
|---|---|---|
| US11352670B2 (en) | Methods of determining tissues and/or cell types giving rise to cell-free DNA, and methods of identifying a disease or disorder using same | |
| Snyder et al. | Cell-free DNA comprises an in vivo nucleosome footprint that informs its tissues-of-origin | |
| JP6829211B2 (ja) | 癌スクリーニング及び胎児分析のための変異検出 | |
| CN108026572B (zh) | 游离dna的片段化模式的分析 | |
| US10053729B2 (en) | Rapid aneuploidy detection | |
| JP5938484B2 (ja) | ゲノムのコピー数変異の有無を判断する方法、システム及びコンピューター読み取り可能な記憶媒体 | |
| Liu | At the dawn: cell-free DNA fragmentomics and gene regulation | |
| CN110800063A (zh) | 使用无细胞dna片段大小检测肿瘤相关变体 | |
| RU2018121254A (ru) | Высокоэффективное построение библиотек днк | |
| CN105793438B (zh) | 未知序列的双股线性核酸的全长扩增方法 | |
| US20190309374A1 (en) | Determining a physiological condition in an individual by analyzing cell-free dna fragment endpoints in a biological sample | |
| US20220403467A1 (en) | Determining cell type origin of circulating cell-free dna with molecular counting | |
| CN114752672A (zh) | 基于循环游离DNA突变进行滤泡性淋巴瘤预后评估的检测panel、试剂盒及应用 | |
| US20200255905A1 (en) | Diagnosis of cancer or other physiological condition using circulating nucleic acid fragment sentinel endpoints | |
| JP6980907B2 (ja) | 無細胞核酸から得られた配列分析データに係わる背景対立因子の頻度分布を生成する方法、及びそれを利用して無細胞核酸から変異を検出する方法 | |
| Zhou | Fragmentomic and Epigenetic Analyses for Cell-Free DNA Molecules | |
| TW202237856A (zh) | 使用尿液及其他dna特徵之方法 | |
| WO2024056722A1 (fr) | Détermination de l'état de santé avec de l'adn libre circulant à l'aide d'éléments cis-régulateurs et de réseaux d'interaction |
Legal Events
| Date | Code | Title | Description |
|---|---|---|---|
| PUAI | Public reference made under article 153(3) epc to a published international application that has entered the european phase |
Free format text: ORIGINAL CODE: 0009012 |
|
| STAA | Information on the status of an ep patent application or granted ep patent |
Free format text: STATUS: THE APPLICATION HAS BEEN PUBLISHED |
|
| AC | Divisional application: reference to earlier application |
Ref document number: 3172341 Country of ref document: EP Kind code of ref document: P |
|
| AK | Designated contracting states |
Kind code of ref document: A1 Designated state(s): AL AT BE BG CH CY CZ DE DK EE ES FI FR GB GR HR HU IE IS IT LI LT LU LV MC MK MT NL NO PL PT RO RS SE SI SK SM TR |