EP4341649B1 - Method for flow measurement that is subject to interference, magneto-inductive flowmeter and computer program product - Google Patents
Method for flow measurement that is subject to interference, magneto-inductive flowmeter and computer program product Download PDFInfo
- Publication number
- EP4341649B1 EP4341649B1 EP22746997.0A EP22746997A EP4341649B1 EP 4341649 B1 EP4341649 B1 EP 4341649B1 EP 22746997 A EP22746997 A EP 22746997A EP 4341649 B1 EP4341649 B1 EP 4341649B1
- Authority
- EP
- European Patent Office
- Prior art keywords
- frequency
- measurement
- signal
- measurement signal
- interference
- Prior art date
- Legal status (The legal status is an assumption and is not a legal conclusion. Google has not performed a legal analysis and makes no representation as to the accuracy of the status listed.)
- Active
Links
- 238000005259 measurement Methods 0.000 title claims description 124
- 238000000034 method Methods 0.000 title claims description 84
- 238000004590 computer program Methods 0.000 title claims description 45
- 238000004458 analytical method Methods 0.000 claims description 39
- 239000012073 inactive phase Substances 0.000 claims description 16
- 230000000694 effects Effects 0.000 claims description 10
- 230000002950 deficient Effects 0.000 claims description 4
- 238000001228 spectrum Methods 0.000 claims description 4
- 238000012360 testing method Methods 0.000 claims description 4
- 230000011664 signaling Effects 0.000 claims description 2
- 230000006399 behavior Effects 0.000 description 10
- 238000010586 diagram Methods 0.000 description 8
- 238000011156 evaluation Methods 0.000 description 8
- 239000012530 fluid Substances 0.000 description 6
- 230000015556 catabolic process Effects 0.000 description 5
- 238000006731 degradation reaction Methods 0.000 description 5
- 230000001965 increasing effect Effects 0.000 description 5
- 238000004364 calculation method Methods 0.000 description 4
- 230000005284 excitation Effects 0.000 description 4
- 239000002245 particle Substances 0.000 description 4
- 239000012071 phase Substances 0.000 description 4
- 238000012935 Averaging Methods 0.000 description 3
- 230000007547 defect Effects 0.000 description 3
- 230000006870 function Effects 0.000 description 3
- 230000000737 periodic effect Effects 0.000 description 3
- 238000004088 simulation Methods 0.000 description 3
- 238000004422 calculation algorithm Methods 0.000 description 2
- 238000001514 detection method Methods 0.000 description 2
- 238000001914 filtration Methods 0.000 description 2
- 230000004907 flux Effects 0.000 description 2
- 239000007789 gas Substances 0.000 description 2
- 230000001939 inductive effect Effects 0.000 description 2
- 230000003993 interaction Effects 0.000 description 2
- 230000010355 oscillation Effects 0.000 description 2
- 230000008569 process Effects 0.000 description 2
- 238000005070 sampling Methods 0.000 description 2
- 230000006978 adaptation Effects 0.000 description 1
- 230000015572 biosynthetic process Effects 0.000 description 1
- 230000000295 complement effect Effects 0.000 description 1
- 238000012937 correction Methods 0.000 description 1
- 230000008878 coupling Effects 0.000 description 1
- 238000010168 coupling process Methods 0.000 description 1
- 238000005859 coupling reaction Methods 0.000 description 1
- 238000003487 electrochemical reaction Methods 0.000 description 1
- 238000005516 engineering process Methods 0.000 description 1
- 230000006872 improvement Effects 0.000 description 1
- 230000006698 induction Effects 0.000 description 1
- 238000009434 installation Methods 0.000 description 1
- 239000007788 liquid Substances 0.000 description 1
- 239000000696 magnetic material Substances 0.000 description 1
- 238000013178 mathematical model Methods 0.000 description 1
- 238000012544 monitoring process Methods 0.000 description 1
- 238000012545 processing Methods 0.000 description 1
- 238000011002 quantification Methods 0.000 description 1
- 238000004092 self-diagnosis Methods 0.000 description 1
- 230000035945 sensitivity Effects 0.000 description 1
- 230000003595 spectral effect Effects 0.000 description 1
- 239000000126 substance Substances 0.000 description 1
- 230000009466 transformation Effects 0.000 description 1
Images


Classifications
-
- G—PHYSICS
- G01—MEASURING; TESTING
- G01F—MEASURING VOLUME, VOLUME FLOW, MASS FLOW OR LIQUID LEVEL; METERING BY VOLUME
- G01F1/00—Measuring the volume flow or mass flow of fluid or fluent solid material wherein the fluid passes through a meter in a continuous flow
- G01F1/56—Measuring the volume flow or mass flow of fluid or fluent solid material wherein the fluid passes through a meter in a continuous flow by using electric or magnetic effects
- G01F1/58—Measuring the volume flow or mass flow of fluid or fluent solid material wherein the fluid passes through a meter in a continuous flow by using electric or magnetic effects by electromagnetic flowmeters
Definitions
- the invention relates to methods for measuring a flow in a pipe by means of an inductive-magnetic flow meter.
- the invention also relates to a computer program product that is suitable for carrying out at least one such method.
- the invention also relates to a control unit that has such a computer program product and a correspondingly equipped magnetic-inductive flow meter.
- the invention also relates to a computer program product for simulating an operating behavior of such a magnetic-inductive flow meter.
- the publication EN 102 56 103 A1 discloses a method for determining the uncertainty of a measuring method processed with a measuring frequency, which can be used in magnetic-inductive flow meters.
- alternating rectangular pulses are excited and time intervals of these are evaluated.
- a settling is first degenerated.
- EN 10 2019 103 501 A1 shows a method for operating a magnetic-inductive flow meter in which gas bubbles are detected in a measuring tube. Rectangular pulses are generated and evaluated to determine a flow velocity in the measuring tube. In pauses between rectangular pulses, a measuring signal is sampled several times and an average value is calculated from the measuring signals recorded per pause time. Differences between several average values from several periods are calculated and these are compared with a threshold value. When the measuring tube is full, the differences are approximately zero.
- the disclosure document EN 10 2004 031 638 A1 discloses a method for operating a magnetic inductive flow measuring device in which interference signals are minimized.
- a vector product is formed from a received signal spectrum, which includes interference signals, and a reference voltage. Based on this, a useful signal component is determined using an inverse Fourier transformation, which in turn is used to calculate a flow rate.
- the publication DE 694 20 783 T2 discloses an electromagnetic flow meter with a measuring tube and a means for applying an alternating magnetic field.
- the flow meter has sensing means for detecting an electromotive force caused by the magnetic fields.
- the sensing means are designed to detect at several points in time in the same direction in a period.
- WO2021137089 A1 discloses a magnetic inductive flowmeter in which the coils are not arranged symmetrically to the plane in which the voltage sensors are located.
- a digital twin based on a physical model is used to optimize the angles chosen for the installation of the coil and the voltage sensors and to calculate the degree of filling in the pipe.
- Flow meters are used in a variety of applications, such as chemical plants, to determine the flow rate of liquids or gases.
- the flow meters are often subject to interference, which can reduce the measuring accuracy of the flow meters.
- cost-effective flow meters are sought. There is therefore a need for flow meters that are robust are resistant to interference, allow precise measurements and are economical to produce at the same time.
- the invention is based on the object of providing a possibility that offers an improvement in at least one of the aspects outlined.
- a magnetic-inductive flow meter is used which is attached to the pipe.
- the magnetic-inductive flow meter has a magnetic coil through which a magnetic field can be induced in the cross-section of the pipe, which interacts with flowing charged particles in the pipe. This makes it possible to generate an electrical voltage perpendicular to the magnetic field in the cross-section of the pipe, which can be detected by suitably mounted voltage sensors.
- the magnetic coil is excited with a square-wave signal which has a pulse frequency.
- the square-wave signal also called a boxcar signal, can be generated from a superposition of several sinusoidal signals.
- the square-wave signal generates an electrical voltage in the cross-section of the pipe, which is recorded as a measurement signal.
- the measurement signal also essentially has a rectangular shape.
- An amplitude of the measurement signal corresponds to the flow to be measured in the pipe.
- the method includes a second step in which a first measured value section of the measurement signal is recorded.
- the measured value section is a section of the measurement signal in which it at least temporarily assumes the amplitude, i.e. the amplitude value.
- the amplitude in turn depends on a flow speed in the pipe, i.e. the flow.
- the first measured value section includes a first and second subsection, which can be viewed and evaluated separately. In particular, the measurement signal for the first and second subsections can be further processed separately.
- the method further comprises a third step in which, for the first and second subsections of the first measured value section, an average value of the measurement signal is formed.
- an average amplitude value of the measurement signal can be formed as an average value over the first or second subsection.
- a difference between the average values in the first and second subsections is therefore essentially zero if the length is the same.
- the average values in the first and second subsections differ, so that a difference between them deviates from zero.
- the presence of a disturbance is detected in the method according to the invention.
- the disturbance threshold value can be specified, for example, by an input from a user or by an algorithm, so that the sensitivity of such a disturbance detection can be suitably adapted to the respective application. If the presence of a disturbance is detected, the evaluation of the measurement signal can be adjusted in order to precisely measure the flow in the pipe. It is possible to calculate an average value for parts of a measurement signal, i.e. measurement value sections and their sub-ranges, with reduced computational effort.
- the sub-sections are shifted so that, for example, the first and last 25% of the measurement value section belong to the first sub-section and the middle 50% of the measurement value section belongs to the second sub-section.
- the difference between the mean values of the sub-sections is then calculated again.
- the steps described implement quadrature demodulation with a rectangular signal and subsequent low-pass filtering, whereby the differences can be interpreted as real and imaginary parts of the demodulated signal.
- the amount of the complex value then corresponds to the amplitude value of the interference signal.
- the evaluation can be carried out over several periods of the excitation signal. The selection of the sections allows for frequency selectivity of the disturbance detection.
- the method according to the invention can be carried out quickly even on simple hardware due to the averaging and difference calculations.
- the presence of a disturbance in the measurement signal can also be easily identified with a surprisingly high level of reliability.
- a corrected amplitude value can be determined that represents a precise measure of the flow rate in the pipe.
- the square wave signal used to excite the magnetic coil has an inactive phase that is independent of the first and/or second measurement value section.
- the inactive phase lies between two measurement value sections and essentially determines the time interval with which amplitude values of the measurement signal can be generated.
- the polarity of the generated magnetic field is reversed. If a disturbance that is not periodic is detected in the claimed method, the inactive phase can be set in such a way that a desired sampling rate is achieved.
- the magnetic-inductive flow meter can thus be adapted, for example, to another evaluation unit that further processes the measurement results of the magnetic-inductive flow meter.
- the inactive phase can also be shortened in order to achieve an increased sampling rate.
- the technical potential of the magnetic-inductive flow meter is thus further exploited.
- a limit is set for the technical potential of the magnetic-inductive flow meter, which can, however, be fully utilized by the claimed solution.
- the method comprises a further step in which a pulse duration of the square wave signal, i.e. Essentially, the total duration of the respective measured value sections and/or the duration of the inactive phase are adapted, i.e. modified.
- the adaptation is carried out to equalize an interference effect in successive measured value sections.
- the computational effort to compensate for the interference or its interference effect is thereby further reduced, which gives the method increased robustness while at the same time having a broad range of applications.
- the aforementioned compensation can also be carried out over more than two measured value sections. This may be necessary if the interference signal has a low frequency. An amplitude value formed after two measured value sections would then still be subject to errors. Averaging several amplitude values, for example two or four amplitude values, then leads to compensation of the disturbance.
- the first and second sections follow one another, i.e. lie one after the other in time.
- the second section can immediately follow the first section or there can be a time gap between them.
- the first and second sections can also partially overlap in time.
- the first section can begin together with the first measured value section and end after 50% of its total duration.
- the second section can, for example, only begin after 25% of the total duration of the measured value section and end after 75% of the total duration of the measured value section.
- the first measured value section can also have further sections, i.e. a third, fourth, etc. section.
- an average value of the measurement signal can be formed for the first measurement value section and a second measurement value section.
- the average value is formed over the entire first or second measurement value section.
- the first and second measurement value sections can be consecutive measurement value sections in the measurement signal. Accordingly, the first and second measurement value sections can have opposing amplitudes. For example, by appropriately forming the difference between the average values in the first and second measurement value sections, essentially twice the amplitude of the measurement signal, i.e. twice the amplitude value, can be determined. This provides a precise value for the amplitude of the measurement signal with reduced computing effort.
- a very small value is to be expected if the measurement sections have the same length of time. If the length of time is different, appropriate weighting must be carried out. If a very small value is not obtained when summing up, this is an indication of a fault, e.g. a deviation of the magnetic fluxes from the nominal value or an electrochemical reaction at the electrodes. This can indicate a defect or degradation of a component of the magnetic-inductive flow meter.
- the first and second steps are also carried out correspondingly for the second measurement value section.
- the measurement signal is recorded separately for the first and second measurement value section and can be used further.
- a characteristic The size of a measured value section e.g. the mean value of the measurement signal, is modulated as a time series onto a carrier signal, for example by means of quadrature amplitude modulation.
- the carrier signal has a carrier frequency that essentially corresponds to the pulse frequency with which the magnetic coil is excited. From this, a frequency shift compared to a comparison frequency can be determined. In particular, by combining with the comparison frequency, a frequency analysis results in a peak, i.e.
- the combination can be designed as so-called aliasing, among other things. If there is interference that affects the measurement signal, the frequency analysis outlined results in a peak at a frequency that corresponds to a frequency shift between the pulse frequency and the comparison frequency. This makes it possible to determine whether the pulse frequency corresponds to a target value. For example, with a pulse frequency that is coupled to a mains frequency, it is possible to determine whether the existing mains frequency, if there is a disturbance associated with it, corresponds to a nominal mains frequency, in particular 50 Hz or 60 Hz. The existing disturbance when measuring the flow in the pipe can thus be characterized in more detail and thus compensated for in a targeted manner. Furthermore, the steps described can also be carried out for a third, fourth, etc. measurement value section.
- the excitation of the magnetic coil can be interrupted for an adjustable period of time. This can be done by omitting at least one pulse, or in a period of time between two excitations of the magnetic coil. During this time, a residual magnetic field is recorded in the pipe, which is then evaluated. In a normal state, if the magnetic coils are not excited, no technically usable or evaluable measurement signal can be expected. In a faulty state, the received measurement signals correspond to a fault, which is caused, for example, by a magnetic field of a neighboring electrical device. Such detected interference is ignored and/or suppressed during further operation of the magnetic-inductive measuring device when evaluating the measurement signals.
- the cause of the interference can also be diagnosed by evaluating the measurement signals of the residual magnetic field, for example electromagnetic coupling on the lines of the magnetic coil. Overall, a further increase in the measurement accuracy and differentiated self-diagnosis of the magnetic-inductive flow meter can be achieved.
- the method according to the invention is used to measure a flow of a fluid in a pipe to which a magnetic-inductive flow meter is attached.
- the magnetic-inductive flow meter has a magnetic coil through which a magnetic field can be induced in the cross-section of the pipe, which interacts with flowing charged particles in the pipe.
- an electrical voltage can be generated vertically in the magnetic field in the cross-section of the pipe, which can be detected by suitably mounted voltage sensors.
- the magnetic coil is excited with a square-wave signal that has a pulse frequency.
- the square-wave signal also called a boxcar signal, can be generated from a superposition of several sinusoidal signals.
- the square-wave signal generates an electrical voltage in the cross-section of the pipe, which is detected as a measurement signal.
- the measurement signal also has essentially a rectangular shape. An amplitude of the measuring signal corresponds to the flow to be measured in the pipe.
- the method also includes a second step in which a frequency analysis of the measurement signal is carried out.
- the frequency analysis can be carried out in parallel while the method is running.
- the frequency analysis can analyze the measurement signal in the form of a time-frequency analysis over time periods that can overlap.
- the frequency analysis in the second step determines frequency components of the measurement signal. Based on this, the frequency components are examined in more detail.
- a frequency component is recognized as a square-wave frequency component, i.e. as caused by the square-wave signal on the magnetic coil, if the corresponding frequency component corresponds to an odd multiple of the pulse frequency.
- the invention is based, among other things, on the knowledge that a square-wave signal is formed as a combination of oscillations whose frequencies correspond, for example, to one, three, five, seven times, etc. of the pulse frequency.
- a disturbance-free measurement signal therefore shows in the frequency analysis only the frequency components outlined above with predictable amplitudes and phases. Furthermore, inactive phases can be defined between their measurement value sections by combining two superimposed square-wave signals.
- a frequency component of the measurement signal is not a square-wave frequency component
- a fourth step is carried out in the method according to the invention. In this step, the corresponding frequency component of the measurement signal is identified as an interference frequency.
- interference frequencies can be identified not only qualitatively, but also quantitatively.
- the method according to the invention is suitable for precisely determining the amplitude value in the measured value section, which allows an exact calculation of the flow in the pipe despite an existing disturbance.
- the method according to the invention is suitable for detecting a defect or degradation of components of the magnetic-inductive flow meter during the frequency analysis of the measurement signal, since the degradation causes the frequency analysis result to deviate from the expected result.
- the method according to the invention is also suitable for identifying different disturbances and consequently has increased robustness.
- the technical potential of the magnetic-inductive flow meter used is thus further exploited.
- a square-wave signal is also understood to mean any signal that has a predictable result in a frequency analysis in which the effects of disturbances and degradations are clearly identifiable.
- the method comprises a further step in which the duration of the measurement value sections is set to an integer multiple of the period duration of an interference signal.
- the durations of inactive phases are adjusted according to the invention.
- the pulse frequency can be adjusted.
- the frequency analysis is designed as a Fourier analysis or as a wavelet analysis. These provide precise information about the properties of the measurement signal as a whole and about selectable sections of the measurement signal, in particular the measurement value sections that may be subject to interference. Furthermore, Fourier analyses and/or wavelet analyses are provided as efficiently implemented functions in a large number of signal processing chips or controllers. This also makes greater use of the technical potential of magnetic-inductive flow meters.
- the claimed method can also be used on existing magnetic-inductive Flow meters can be subsequently implemented as part of a software or firmware update. Accordingly, the technically reasonable service life of existing magnetic-inductive flow meters can be extended cost-effectively using the claimed method. Alternatively, a so-called least squares estimation can be carried out instead of a frequency analysis, which can be carried out quickly with a small number of measurement signals.
- an amplitude, i.e. an amplitude value, of the measurement signal can be determined at least in one measurement value section using the frequency analysis.
- the amplitude of a Fourier-analyzed measurement signal corresponds to the sum of the harmonic oscillations with alternating signs.
- Such a sum can be determined quickly with reduced computational effort.
- additional calculation steps, for example averaging are unnecessary.
- the further step in which the duration of the measured value sections is set to an integer multiple of the period duration of an interference signal comprises adjusting the pulse frequency.
- the task set out at the beginning is also solved by a computer program product according to the invention, which is used to control a magnetic coil and to process measurement signals from a voltage sensor.
- the computer program product has suitable interfaces for this purpose, which allow the corresponding input and output of data or commands.
- the magnetic coil and the voltage sensor are at least functionally part of a magnetic-inductive flow meter.
- the computer program product is also designed to determine, i.e. measure, a flow of a fluid in the cross section of a pipe on which the flow meter is attached.
- the computer program product is designed according to the invention to carry out at least one embodiment of the methods outlined above.
- the computer program product can be executed on a computing unit that interacts with a memory unit.
- the computer program product can be designed monolithically, i.e. carry out all of its functions on one hardware platform.
- the computer program product can also be designed as a system of at least two subprograms that can be executed on different hardware platforms and interact via a communicative data connection.
- Each subprogram comprises at least one function of the computer program product, for example specifying parameter values for the magnetic-inductive flow meter.
- the functionality of the computer program product is realized through this interaction.
- Such subprograms can be executed, for example, on a control unit of the magnetic-inductive flow meter, a master computer, and/or a computer cloud.
- the computer program product can be designed purely as software or hard-wired, for example as a chip, integrated circuit or FPGA.
- the computer program product can also be designed as a combination of these.
- the underlying object is also achieved by a control unit according to the invention.
- the control unit comprises a memory unit and a computer unit, which interact during operation and enable the execution of computer program products allow.
- the control unit is designed to control a magnetic-inductive flow meter and has suitable inputs and outputs for data or commands.
- the control unit is designed to execute a computer program product that is designed according to one of the embodiments set out above.
- the control unit can be designed to implement at least one embodiment of the described methods.
- Such a control unit can be implemented with simple hardware and is therefore particularly cost-efficient. The technical advantages of the underlying methods can thus be achieved to a particular extent.
- the task is also solved by a magnetic-inductive flow meter according to the invention.
- the magnetic-inductive flow meter is designed to measure a flow of a fluid in a cross-section of a pipe and has a magnetic coil and a voltage sensor for this purpose.
- the magnetic coil and the voltage sensor can be actuated or read out via a control unit.
- the control unit is designed according to one of the embodiments outlined above.
- a computer program product according to the invention which is suitable for simulating an operating behavior of a magnetic-inductive flow meter, in particular is designed for this purpose.
- the computer program product can be set up to simulate the operating behavior of the magnetic-inductive flow meter by specifying its structure, i.e. storing an image of it.
- the operating behavior can also be represented by an abstracted calculation model that is independent of the spatial structure of the magnetic-inductive flow meter.
- the operating behavior can also be determined using a combination of these.
- the device to be simulated the magnetic-inductive flow meter is designed according to one of the embodiments described above.
- the computer program product has a physics module for simulation in which the magnetic-inductive flow meter is depicted and, for example, its electrical or signaling behavior can be reproduced under adjustable operating conditions.
- the adjustable operating conditions include a disturbance spectrum with different disturbance frequencies.
- the adjustable operating conditions can include a flow in the cross section of the pipe, a temperature, a pressure, a viscosity in the fluid in the pipe, its conductivity, its induction behavior, magnetic permissivity, a magnetizability.
- the computer program product can have a data interface via which corresponding data can be specified via a user input and/or other simulation-oriented computer program products.
- the computer program product can also have a data interface for outputting simulation results to a user and/or other simulation-oriented computer program products.
- the computer program product can be used to check measurement signals from voltage sensors of the magnetic-inductive flow meter for plausibility.
- the computer program product according to the invention provides a comprehensive and at the same time computing capacity-saving option for monitoring and/or testing a corresponding magnetic-inductive flow meter.
- the computer program product can be designed as a so-called digital twin, as for example in the publication US 2017/286572 A1 described in more detail.
- the disclosure content of US 2017/286572 A1 is incorporated into the present application by reference.
- the computer program product can be monolithic, i.e. can be executed entirely on a hardware platform.
- the computer program product can be modular and comprise a plurality of subprograms that can be executed on separate hardware platforms and interact via a communicative data connection.
- the computer program product can be designed to be executable in a computer cloud.
- the computer program product according to the invention can be used to test and/or optimize a magnetic-inductive flow meter by simulation, for example in the case of a planned retrofit in a system.
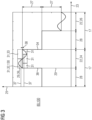
- FIG 1 A schematic structure of an embodiment of a magnetic-inductive flow meter 10 according to the invention is shown in FIG 1
- the magnetic-inductive flow meter 10 is mounted on a pipe 11 and is designed to measure a flow 15 through the pipe 11.
- the magnetic-inductive flow meter 10 via magnetic coils 12, which can be excited via a control unit 30.
- the control unit 30 is designed to send excitation signals in the form of square-wave signals 21 to the magnetic coils 12.
- the magnetic coils 12 can generate a variable magnetic field 13 with a pulse frequency 19, with which electrically charged particles 16 in the fluid 18, whose flow 15 is measured, interact.
- the interaction between the electrically charged particles 16 and the magnetic field 13 consists in causing an electrical voltage 17 essentially transverse to the magnetic field 13, which can be detected via voltage sensors 14.
- the detected electrical voltages 17 can be forwarded to the control unit 30 as measurement signals 20.
- the magnetic coils 12 are excited by means of the square-wave signal 21, so that the magnetic field 13 essentially immediately has a predeterminable magnetic flux density, maintains this for a predeterminable pulse duration and then essentially immediately returns to zero.
- Such a square-wave signal 21 designed as a square-wave signal is also referred to as a boxcar signal.
- the magnetic coil 12 is excited in a first step 110, 210 of a method 100, 200 designed to measure the flow 15.
- the electrical voltage 17 is detected by means of the voltage sensors 14 in a second step 120, 220.
- the respective first steps 110, 210 are the same in all methods 100, 200 according to the invention.
- the methods 100, 200 that can be carried out with the control unit 30 are based on the same consideration of the behavior of the detected measurement signals 20, which reflect the induced voltage 17.
- the control unit 30 has a memory unit 52 and a computing unit 54, by means of which a computer program product 50 can be executed, via which at least one of the methods 100, 200 can be implemented.
- the magnetic-inductive flow meter 10 is depicted in a computer program product 80, which is designed as a so-called digital twin.
- This is at least suitable, preferably designed, to simulate the operating behavior of the magnetic-inductive flow meter 10 and for this purpose comprises a structural image of the magnetic-inductive flow meter 10 and/or a mathematical model that reflects its functionality.
- the computer program product 80 for simulating the operating behavior makes it possible, for example, to identify a defective magnetic coil 12 or a defective voltage sensor 14 and/or to check the plausibility of a determined flow 15.
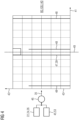
- FIG 1 shows a diagram with a horizontal time axis 23 and a vertical voltage axis 25 as a magnitude axis.
- the graph shows a course of a measurement signal 20, which corresponds to a voltage 17 detected by voltage sensors 14, as for example in FIG 1
- the measuring signal 20 corresponds in its basic form to a square wave signal 21, with which the magnetic coils 12 are connected as in FIG 1 excited.
- the measurement signal 20 comprises measurement value sections 22 which follow one another with alternating orientations. Between the measurement value sections 22 there are inactive phases 28, the durations of which, i.e. their extension along the time axis 23, can be adjusted.
- Each measurement value section 22 has an amplitude value 27 which corresponds to the voltage 17 which is reproduced by the measurement signal 20.
- the amplitude value 27 which corresponds to the existing voltage 17 has a disturbance 29 in the measurement signal 20 which has a disturbance frequency 39. Due to the disturbance 29, the recognition of the correct amplitude value 27 is made more difficult.
- the diagram according to FIG 2 represents a stage of the first method 100 in which the first and second steps 110, 120 have already been carried out and a further evaluation of the measurement signal 20 is to be carried out.
- individual measurement value sections 22, in particular a first and a second measurement value section 24, 26, are examined in more detail.
- FIG 2 The stage of the method 100 shown is simulated in a computer program product 80 which is designed as a digital twin.
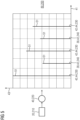
- FIG 3 a stage of the first method 100 according to the invention is shown, which is based on the FIG 2 stage shown follows.
- FIG 3 essentially shows an enlarged section of the diagram from FIG 2 .
- the diagram in FIG 3 also has a time axis 23 and a voltage axis 25, in which the course of the measurement signal 20 is shown.
- a first measurement value section 24 is identified, which is to be evaluated in more detail.
- the first measurement value section 24 is easily recognizable in terms of signal technology, for example, based on its essentially vertical front edge 34 or rear edge 34.
- the first measurement value section 24 is divided into subsections 31, which are to be examined separately.
- an average value 37 of the measurement signal 20 is determined in the third step 130.
- an average value 37 is determined for a second subsection 33 of the first measurement value section 24 in the third step 130.
- the average values 37 are in FIG 3 indicated by broken lines.
- the second section 33 follows directly after the first section 32. Due to the essentially sinusoidal disturbance 29, the average values 37 of the measurement signal 20, i.e. its respective average amplitude value 27, are unequal in the first and second sections 32, 33. By comparing the average values 37 in the first and second sections 32, 33, for example by suitable subtraction, it can be determined that the disturbance 29 is present.
- the presence of the disturbance 29 is recognized when the average values 37 in the first and second sections 32, 33 differ from one another by at least one disturbance threshold value 38.
- the disturbance threshold value 38 is specified by a user or an algorithm that can be designed as a component of the computer program product 50 in the control unit 30.
- other subsections 31 can also be selected as the first or second subsection 32, 33, which can also partially overlap in time.
- the third step 130 can also be carried out correspondingly on a second measured value section 26.
- the formation of the average value 37 can be carried out quickly and easily and represents a meaningful parameter for the method 100.
- the FIG 3 The stage of the method 100 shown is simulated in a computer program product 80 which is designed as a digital twin.
- FIG 4 A further stage of the first method 100 according to the invention is shown in FIG 4
- the stage in FIG 4 assumes that at least the first and second steps 110, 120 are completed and a fourth step 140 can be carried out.
- a carrier signal 45 is provided for the fourth step 140.
- the detected measurement signal 20, as for example in FIG 2 shown, is combined with the carrier signal 45 at least in the scope of the first and second measurement value sections 24, 26 in the course of a modulation 46.
- the modulation 46 is designed as a quadrature amplitude modulation.
- the modulated carrier signal 35 thus obtained is further subjected to a frequency analysis 40 in the course of the fourth step 140, the result of which is FIG 4 is shown as a diagram.
- the diagram comprises a horizontal frequency axis 41 and a vertical magnitude axis 43.
- the diagram is divided by a line that represents the so-called zero frequency, which serves as the comparison frequency 49.
- a peak is to be expected in the frequency analysis 40 at the comparison frequency 49.
- a frequency shift 47 is detected, which quantifies the disturbance 29.
- the amount of the frequency shift 47 i.e. its distance from the comparison frequency 49, corresponds to the disturbance frequency 39 as for example in FIG 2 or FIG 3 shown.
- artifacts 48 are recognized in the frequency analysis 40 so that confusion with an interference frequency 39, i.e. an interference 29, is avoided.
- the artifacts 48 can be predicted mathematically by the computer program product 50 in the control unit 30 based on information on the carrier frequency 53 in conjunction with information on the pulse frequency 19. This ensures that incorrectly diagnosed interference 29 can be avoided in a simple manner.
- a cause of the interference 29 can be deduced.
- the duration of the inactive phases 28 and/or measured value sections 22, as in FIG 2 or FIG 3 shown, so that the disturbing effect of the disturbance 29 for the determination of the flow 15 is minimized.
- the method 100 as shown in FIG 4 allows a reliable and sufficiently precise quantification of the existing disturbance 29, so that targeted countermeasures can be initiated. The method 100 is thus automatically adaptable and therefore robust against disturbances 29.
- the FIG 4 The stage of the method 100 shown is simulated in a computer program product 80 which is designed as a digital twin
- FIG 5 An embodiment of a second method 200 according to the invention for measuring a flow 15 in a pipe 11 is shown in FIG 5 shown schematically.
- the method 200 assumes that a first step 210, as in FIG 2 shown, has already been carried out. Accordingly, a measurement signal 20 is available from the first step 210, which is then subjected to a frequency analysis 40 in a second step 220.
- the frequency analysis 40 is designed as a Fourier analysis, by means of which frequency components 42 of the measurement signal 20 are recorded.
- the result of the frequency analysis 40 is shown in FIG 5 shown in a diagram that has a horizontal frequency axis 41 and a vertical magnitude axis 43.
- the frequency analysis 40 shows a plurality of frequency components 42, the respective frequency of which is recorded in a third step 230.
- frequency components 42 rectangular frequency components 44 are recognized by the fact that in terms of frequency, i.e. the position of the respective peak 51 on the frequency axis 41, they essentially correspond to an odd multiple of the pulse frequency 19, with which, as in FIG 2 outlined, the variable magnetic field 13 is caused.
- the method 200 is based on the fact that a square-wave signal 21 in a Fourier analysis only has frequency components 42 that correspond to odd multiples of the pulse frequencies 19. Such frequency components 42 can therefore be reliably identified in the method 200. Further frequency components 42 that lie between the square-wave frequency components 44 are identified as interference frequencies 39 in a fourth step 240.
- even-numbered harmonics indicate non-linearities that are coupled to the pulse signal 19. For example, these can be saturation effects in magnetic materials or electrochemical effects.
- Signal components with other frequencies can indicate external interference or defects in the electronics of the device.
- the interference frequencies 39 identified in the method 200 can be removed using suitable filters.
- an amplitude value 27 can be calculated from the rectangular frequency components 44, as for example in FIG 2 outlined, can be determined.
- Frequency analyses 40 in particular Fourier analyses, can be carried out quickly and precisely in a large number of control units 30 for magnetic-inductive flow meters 10. The increasing available computing power of control units 30 is thus used and magnetic-inductive flow meters 10 can be used in demanding environments.
- the method 200 is so device-bound that i.e. decentrally. Higher-level control systems of automation systems are thus relieved of the computing effort involved in flow measurement. This allows a large number of magnetic-inductive flow meters 10 to be used in an automation system without running the risk of them generating excessive testing and correction work in the higher-level control system with incorrect values for the flow 15 to be measured. Consequently, the method 200 enables magnetic-inductive flow meters 10 with which even complex automation systems can be operated in a practical manner.
- the method 200, as in FIG 5 can also be simulated in a computer program product 80 which is designed as a digital twin.
Landscapes
- Physics & Mathematics (AREA)
- Electromagnetism (AREA)
- Fluid Mechanics (AREA)
- General Physics & Mathematics (AREA)
- Measuring Volume Flow (AREA)
Description
Die Erfindung betrifft Verfahren zum Messen eines Durchflusses in einem Rohr mittels eines induktiv-magnetischen Durchflussmessers. Ebenso betrifft die Erfindung ein Computerprogrammprodukt, das zum Durchführen zumindest eines derartigen Verfahrens geeignet ist. Die Erfindung betrifft auch eine Steuereinheit, die über ein solches Computerprogrammprodukt verfügt und einen entsprechend ausgerüsteten magnetisch-induktiven Durchflussmesser. Ferner betrifft die Erfindung ein Computerprogrammprodukt zum Simulieren eines Betriebsverhaltens eines derartigen magnetisch-induktiven Durchflussmessers.The invention relates to methods for measuring a flow in a pipe by means of an inductive-magnetic flow meter. The invention also relates to a computer program product that is suitable for carrying out at least one such method. The invention also relates to a control unit that has such a computer program product and a correspondingly equipped magnetic-inductive flow meter. The invention also relates to a computer program product for simulating an operating behavior of such a magnetic-inductive flow meter.
Die Druckschrift
Die Offenlegungsschrift
Aus der Patentschrift
Die Druckschrift
Aus der Offenlegungsschrift
Durchflussmesser werden in einer Vielzahl an Anwendungen, beispielsweise Chemieanlagen, eingesetzt, um Durchsätze von Flüssigkeiten oder Gasen zu bestimmen. Die Durchflussmesser unterliegen dabei häufig Störeinflüssen, durch die eine Messgenauigkeit der Durchflussmesser herabgesetzt werden kann. Gleichzeitig werden kosteneffiziente Durchflussmesser angestrebt. Es besteht daher Bedarf an Durchflussmessern, die robust gegen Störeinflüsse sind, präzise Messungen erlauben und gleichzeitig wirtschaftlich herzustellen sind. Der Erfindung liegt die Aufgabe zugrunde, eine Möglichkeit bereitzustellen, die in zumindest einem der skizzierten Aspekte eine Verbesserung bietet.Flow meters are used in a variety of applications, such as chemical plants, to determine the flow rate of liquids or gases. The flow meters are often subject to interference, which can reduce the measuring accuracy of the flow meters. At the same time, cost-effective flow meters are sought. There is therefore a need for flow meters that are robust are resistant to interference, allow precise measurements and are economical to produce at the same time. The invention is based on the object of providing a possibility that offers an improvement in at least one of the aspects outlined.
Die Aufgabenstellung wird durch ein erfindungsgemäßes Verfahren gelöst, mit dem ein Durchfluss eines Fluids in einem Rohr gemessen wird. Dazu wird ein magnetisch-induktiver Durchflussmesser eingesetzt, der auf dem Rohr befestigt ist. Der magnetisch-induktive Durchflussmesser weist eine Magnetspule auf, durch die im Querschnitt des Rohrs ein Magnetfeld induzierbar ist, das mit fließenden geladenen Teilchen im Rohr in Wechselwirkung tritt. Hierdurch ist im Querschnitt des Rohrs senkrecht im Magnetfeld eine elektrische Spannung hervorrufbar, die über geeignet angebrachte Spannungssensoren erfassbar ist. In einem ersten Schritt des Verfahrens erfolgt ein Anregen der Magnetspule mit einem Rechtecksignal, das eine Pulsfrequenz aufweist. Das Rechtecksignal, auch boxcar signal genannt, kann dabei aus einer Überlagerung mehrerer Sinussignale erzeugt werden. Durch das Rechtecksignal wird im Querschnitt des Rohrs eine elektrische Spannung hervorgerufen, die als Messsignal erfasst wird. Das Messsignal weist im Wesentlich ebenso eine Rechteckform auf. Eine Amplitude des Messsignals korrespondiert mit dem zu messenden Durchfluss im Rohr. Das Verfahren umfasst einen zweiten Schritt, in dem ein Erfassen eines ersten Messwertabschnitts des Messsignals erfolgt. Der Messwertabschnitt ist ein Abschnitt des Messsignals, in dem dieses zumindest zeitweise die Amplitude, also den Amplitudenwert, annimmt. Die Amplitude wiederum hängt von einer Fließgeschwindigkeit im Rohr, also dem Durchfluss, ab. Der erste Messwertabschnitt umfasst einen ersten und zweiten Teilabschnitt, die separat betrachtbar und auswertbar sind. Insbesondere ist das Messsignal für den ersten und zweiten Teilabschnitt separat weiter verarbeitbar.The problem is solved by a method according to the invention with which a flow of a fluid in a pipe is measured. For this purpose, a magnetic-inductive flow meter is used which is attached to the pipe. The magnetic-inductive flow meter has a magnetic coil through which a magnetic field can be induced in the cross-section of the pipe, which interacts with flowing charged particles in the pipe. This makes it possible to generate an electrical voltage perpendicular to the magnetic field in the cross-section of the pipe, which can be detected by suitably mounted voltage sensors. In a first step of the method, the magnetic coil is excited with a square-wave signal which has a pulse frequency. The square-wave signal, also called a boxcar signal, can be generated from a superposition of several sinusoidal signals. The square-wave signal generates an electrical voltage in the cross-section of the pipe, which is recorded as a measurement signal. The measurement signal also essentially has a rectangular shape. An amplitude of the measurement signal corresponds to the flow to be measured in the pipe. The method includes a second step in which a first measured value section of the measurement signal is recorded. The measured value section is a section of the measurement signal in which it at least temporarily assumes the amplitude, i.e. the amplitude value. The amplitude in turn depends on a flow speed in the pipe, i.e. the flow. The first measured value section includes a first and second subsection, which can be viewed and evaluated separately. In particular, the measurement signal for the first and second subsections can be further processed separately.
Ferner umfasst das Verfahren einen dritten Schritt, in dem jeweils für den ersten und zweiten Teilabschnitt des ersten Messwertabschnitts ein Durchschnittswert des Messsignals gebildet wird. Insbesondere kann über den ersten bzw. zweiten Teilabschnitt hinweg als Durchschnittswert ein durchschnittlicher Amplitudenwert des Messsignals gebildet werden. Bei einem störungsfreien Messsignal nimmt dieses über den ersten und zweiten Teilabschnitt hinweg im ersten Messwertabschnitt einen konstanten Amplitudenwert an. Eine Differenz der Durchschnittswerte im ersten und zweiten Teilabschnitt wird bei gleicher Länge folglich im Wesentlichen zu Null. Bei Vorliegen einer Störung entsprechender Frequenz und Phase hingegen unterscheiden sich die Durchschnittswerte im ersten und zweiten Teilabschnitt, so dass eine Differenz zwischen diesen von Null abweicht. Wenn die Durchschnittswerte im ersten und zweiten Teilabschnitt um mindestens einen einstellbaren Stör-Schwellenwert voneinander abweichen, wird im erfindungsgemäßen Verfahren das Vorliegen einer Störung erkannt. Der Stör-Schwellenwert ist beispielsweise durch eine Eingabe eines Benutzers oder durch einen Algorithmus vorgebbar, so dass die Empfindlichkeit einer solchen Störungserkennung an die jeweils vorliegende Anwendung zweckmäßig anpassbar ist. Wenn ein Vorliegen einer Störung erkannt ist, kann die Auswertung des Messsignals angepasst werden, um so den Durchfluss im Rohr präzise zu messen. Das Bilden eines Durchschnittswerts für Teile eines Messsignals, also Messwertabschnitte und deren Teilbereiche, ist mit reduziertem Rechenaufwand möglich. In einem zusätzlichen Schritt erfolgt eine Verschiebung der Teilabschnitte, so dass z. B. die ersten und die letzten 25% des Messwertabschnitts zum ersten Teilabschnitt gehören und die mittleren 50% des Messwertabschnitts zum zweiten Teilabschnitt. Danach wird erneut die Differenz der Mittelwerte der Teilabschnitte gebildet.The method further comprises a third step in which, for the first and second subsections of the first measured value section, an average value of the measurement signal is formed. In particular, an average amplitude value of the measurement signal can be formed as an average value over the first or second subsection. In the case of a disturbance-free measurement signal, this assumes a constant amplitude value over the first and second subsections in the first measured value section. A difference between the average values in the first and second subsections is therefore essentially zero if the length is the same. In the case of a disturbance of the corresponding frequency and phase, however, the average values in the first and second subsections differ, so that a difference between them deviates from zero. If the average values in the first and second subsections differ from one another by at least one adjustable disturbance threshold value, the presence of a disturbance is detected in the method according to the invention. The disturbance threshold value can be specified, for example, by an input from a user or by an algorithm, so that the sensitivity of such a disturbance detection can be suitably adapted to the respective application. If the presence of a disturbance is detected, the evaluation of the measurement signal can be adjusted in order to precisely measure the flow in the pipe. It is possible to calculate an average value for parts of a measurement signal, i.e. measurement value sections and their sub-ranges, with reduced computational effort. In an additional step, the sub-sections are shifted so that, for example, the first and last 25% of the measurement value section belong to the first sub-section and the middle 50% of the measurement value section belongs to the second sub-section. The difference between the mean values of the sub-sections is then calculated again.
Die beschriebenen Schritte verwirklichen eine Quadraturdemodulation mit einem rechteckförmigen Signal und anschließender Tiefpassfilterung, wobei die Differenzen als Real- und Imaginärteile des demodulierten Signals interpretierbar sind. Der Betrag des komplexen Wertes entspricht dann dem Amplitudenwert des Störsignals. Die Auswertung kann über mehrere Perioden des Anregungssignals fortgesetzt werden. Durch die Wahl der Teilabschnitte ist eine Frequenzselektivität der Störungsdetektion gegeben.The steps described implement quadrature demodulation with a rectangular signal and subsequent low-pass filtering, whereby the differences can be interpreted as real and imaginary parts of the demodulated signal. The amount of the complex value then corresponds to the amplitude value of the interference signal. The evaluation can be carried out over several periods of the excitation signal. The selection of the sections allows for frequency selectivity of the disturbance detection.
Das erfindungsgemäße Verfahren ist aufgrund der Mittelwert- und Differenzbildung auch auf einfacher Hardware schnell durchführbar. Das Vorliegen einer Störung im Messsignal ist ferner mit einer überraschend hohen Zuverlässigkeit in einfacher Weise erkennbar. Mittels geeigneter Kompensationsmaßnahmen ist ein korrigierter Amplitudenwert ermittelbar, der ein präzises Maß für den vorliegenden Durchfluss im Rohr darstellt.The method according to the invention can be carried out quickly even on simple hardware due to the averaging and difference calculations. The presence of a disturbance in the measurement signal can also be easily identified with a surprisingly high level of reliability. Using suitable compensation measures, a corrected amplitude value can be determined that represents a precise measure of the flow rate in the pipe.
Erfindungsgemäß weist das Rechtecksignal, mit dem die Magnetspule angeregt wird, eine Inaktivphase auf, die unabhängig vom ersten und/oder zweiten Messwertabschnitt ist. Die Inaktivphase liegt zwischen zwei Messwertabschnitten und bestimmt im Wesentlichen den zeitlichen Abstand, mit dem Amplitudenwerte des Messsignals erzeugbar sind. Während der Inaktivphasen erfolgt ein Umpolen des erzeugten Magnetfeldes. Wenn im beanspruchten Verfahren eine Störung erkannt wird, die unperiodisch ist, ist die Inaktivphase derart einstellbar, dass eine angestrebte Abtastrate erzielt wird. Der magnetisch-induktive Durchflussmesser ist so beispielsweise an eine weitere Auswertungseinheit anpassbar, die Messergebnisse des magnetisch-induktiven Durchflussmessers weiterverarbeitet. Alternativ oder ergänzend ist die Inaktivphase auch verkürzbar, um so eine gesteigerte Abtastrate zu erzielen. Insgesamt wird so das technische Potential des magnetisch-induktiven Durchflussmessers weiter ausgeschöpft. Insbesondere ist durch ein Reduzieren der Inaktivphase auf die Dauer, die zum Umpolen des Magnetfeldes erforderlich ist, eine Grenze für das technische Potential des magnetisch-induktiven Durchflussmessers gesetzt, das jedoch durch die beanspruchte Lösung vollständig nutzbar ist.According to the invention, the square wave signal used to excite the magnetic coil has an inactive phase that is independent of the first and/or second measurement value section. The inactive phase lies between two measurement value sections and essentially determines the time interval with which amplitude values of the measurement signal can be generated. During the inactive phases, the polarity of the generated magnetic field is reversed. If a disturbance that is not periodic is detected in the claimed method, the inactive phase can be set in such a way that a desired sampling rate is achieved. The magnetic-inductive flow meter can thus be adapted, for example, to another evaluation unit that further processes the measurement results of the magnetic-inductive flow meter. Alternatively or additionally, the inactive phase can also be shortened in order to achieve an increased sampling rate. Overall, the technical potential of the magnetic-inductive flow meter is thus further exploited. In particular, by reducing the inactive phase to the duration required to reverse the polarity of the magnetic field, a limit is set for the technical potential of the magnetic-inductive flow meter, which can, however, be fully utilized by the claimed solution.
Weiter erfindungsgemäß umfasst das Verfahren einen weiteren Schritt, in dem eine Pulsdauer des Rechtecksignals, also im Wesentlichen die Gesamtdauer der jeweiligen Messwertabschnitte, und/oder die Dauer der Inaktivphase angepasst, also modifiziert, werden. Das Anpassen erfolgt zu einem Angleichen einer Störwirkung in aufeinanderfolgenden Messwertabschnitten. Durch ein solches Anpassen der Pulsdauer und/oder Dauer der Inaktivphase können sich die Effekte der Störung auf das Messsignal beispielsweise bei einem Ermitteln eines doppelten Amplitudenwerts, wie oben beispielhaft dargelegt, gegenseitig ausgleichen. Dadurch ist insbesondere die Wirkung einer Störung, die periodisch ist, also die beispielsweise mit der Pulsfrequenz gekoppelt ist, reduzierbar. Der Rechenaufwand zur Kompensation der Störung bzw. ihrer Störwirkung ist dadurch weiter reduziert, was dem Verfahren eine erhöhte Robustheit bei einem gleichzeitig breiten Einsatzspektrum verleiht. Der genannte Ausgleich kann auch über mehr als zwei Messwertabschnitte erfolgen. Dies kann notwendig sein, wenn das Störsignal eine niedrige Frequenz ausweist. Ein nach zwei Messwertabschnitten gebildeter Amplitudenwert wäre dann noch fehlerbehaftet. Die Mittelung mehrerer Amplitudenwerte, beispielsweise von zwei oder vier Amplitudenwerten, führt dann zum Ausgleich der Störung.Further according to the invention, the method comprises a further step in which a pulse duration of the square wave signal, i.e. Essentially, the total duration of the respective measured value sections and/or the duration of the inactive phase are adapted, i.e. modified. The adaptation is carried out to equalize an interference effect in successive measured value sections. By adapting the pulse duration and/or duration of the inactive phase in this way, the effects of the interference on the measurement signal can compensate for one another, for example when a double amplitude value is determined, as shown above by way of example. This makes it possible to reduce the effect of an interference that is periodic, i.e. that is coupled to the pulse frequency, for example. The computational effort to compensate for the interference or its interference effect is thereby further reduced, which gives the method increased robustness while at the same time having a broad range of applications. The aforementioned compensation can also be carried out over more than two measured value sections. This may be necessary if the interference signal has a low frequency. An amplitude value formed after two measured value sections would then still be subject to errors. Averaging several amplitude values, for example two or four amplitude values, then leads to compensation of the disturbance.
In einer Ausführungsform des beanspruchten Verfahrens folgen der erste und zweite Teilabschnitt aufeinander, liegen also zeitlich hintereinander. Dabei kann sich der zweite Teilabschnitt unmittelbar an den ersten Teilabschnitt anschließen oder zwischen diesen ein zeitlicher Abstand liegen. Alternativ können der erste und zweite Teilabschnitt auch teilweise zeitlich überlappen. Beispielsweise kann der erste Teilabschnitt gemeinsam mit dem ersten Messwertabschnitt beginnen und nach 50% dessen Gesamtdauer enden. Ergänzend dazu kann der zweite Teilabschnitt beispielsweise erst nach 25% der Gesamtdauer des Messwertabschnitts beginnen und nach Ablauf von 75% der Gesamtdauer des Messwertabschnitts enden. Weiter alternativ oder ergänzend kann der erste Messwertabschnitt auch weitere Teilabschnitte, also einen dritten, vierten, usw. Teilabschnitt, aufweisen. Durch das Bilden von Durchschnittswerten von bereits zwei Teilabschnitten ist in einfacher Weise das Vorliegen einer Störung im Messwertabschnitt erkennbar. Die Mittelwerte kürzerer Teilabschnitte lassen sich weiterverwenden, um die Mittelwerte längerer oder anders positionierter Teilabschnitte zu bilden. Hiermit können Störungen unterschiedlicher Frequenz und Phasenlage mit geringem Rechenaufwand detektiert werden.In one embodiment of the claimed method, the first and second sections follow one another, i.e. lie one after the other in time. The second section can immediately follow the first section or there can be a time gap between them. Alternatively, the first and second sections can also partially overlap in time. For example, the first section can begin together with the first measured value section and end after 50% of its total duration. In addition to this, the second section can, for example, only begin after 25% of the total duration of the measured value section and end after 75% of the total duration of the measured value section. Alternatively or additionally, the first measured value section can also have further sections, i.e. a third, fourth, etc. section. By forming average values from two sections, it is easy to the presence of a disturbance in the measured value section can be identified. The mean values of shorter sections can be used to calculate the mean values of longer or differently positioned sections. This allows disturbances of different frequencies and phases to be detected with little computational effort.
Des Weiteren kann für den ersten Messwertabschnitt und einen zweiten Messwertabschnitt ein Durchschnittswert des Messsignals gebildet werden. Der Durchschnittswert wird hierbei über den gesamten ersten bzw. zweiten Messwertabschnitt gebildet. Der erste und zweite Messwertabschnitt können aufeinander folgende Messwertabschnitte im Messsignal sein. Dementsprechend können der erste und zweite Messwertabschnitt entgegengerichtete Amplituden aufweisen. Beispielsweise ist so durch geeignete Differenzbildung zwischen den Durchschnittswerten im ersten und zweiten Messwertabschnitt betragsmäßig im Wesentlichen die doppelte Amplitude des Messsignals, also der doppelte Amplitudenwert, ermittelbar. Dies liefert bei reduziertem Rechenaufwand einen präzisen Wert für die Amplitude des Messsignals.Furthermore, an average value of the measurement signal can be formed for the first measurement value section and a second measurement value section. The average value is formed over the entire first or second measurement value section. The first and second measurement value sections can be consecutive measurement value sections in the measurement signal. Accordingly, the first and second measurement value sections can have opposing amplitudes. For example, by appropriately forming the difference between the average values in the first and second measurement value sections, essentially twice the amplitude of the measurement signal, i.e. twice the amplitude value, can be determined. This provides a precise value for the amplitude of the measurement signal with reduced computing effort.
Erfolgt alternativ statt der Differenzbildung eine Summierung der Durchschnittswerte, so ist bei gleicher zeitlicher Länge der Messwertabschnitte ein sehr kleiner Wert zu erwarten. Bei unterschiedlichen zeitlichen Längen ist eine entsprechende Gewichtung vorzunehmen. Ist ein sehr kleiner Wert bei der Summierung nicht gegeben, so ist dies ein Hinweis auf eine Störung z. B. eine Abweichung der magnetischen Flüsse vom Nominalwert oder eine elektrochemische Reaktion an den Elektroden. Dies kann einen Defekt oder eine Degradation einer Komponente des magnetisch-induktiven Durchflussmessers anzeigen.If, instead of calculating the difference, the average values are summed up, a very small value is to be expected if the measurement sections have the same length of time. If the length of time is different, appropriate weighting must be carried out. If a very small value is not obtained when summing up, this is an indication of a fault, e.g. a deviation of the magnetic fluxes from the nominal value or an electrochemical reaction at the electrodes. This can indicate a defect or degradation of a component of the magnetic-inductive flow meter.
In einer weiteren Ausführungsform des beanspruchten Verfahrens werden der erste und zweite Schritt korrespondierend auch für den zweiten Messwertabschnitt durchgeführt. Dadurch ist das Messsignal separat für den ersten und zweiten Messwertabschnitt erfasst und weiter nutzbar. Eine charakteristische Größe eines Messwertabschnitts, z. B. der Mittelwert des Messsignals, wird als Zeitreihe auf ein Trägersignal moduliert, beispielsweise mittels einer Quadraturamplitudenmodulation. Das Trägersignal weist eine Trägerfrequenz auf, die im Wesentlichen der Pulsfrequenz entspricht, mit der die Magnetspule angeregt wird. Hieraus ist eine Frequenzverschiebung gegenüber einer Vergleichsfrequenz ermittelbar. Insbesondere durch ein Kombinieren mit der Vergleichsfrequenz ergibt sich in einer Frequenzanalyse eine Spitze, also ein Betragsmaximum, auch peak genannt, bei circa 0 Hz, wenn das Messsignal störungsfrei ist. Das Kombinieren kann unter anderem als ein sogenanntes Aliasing ausgebildet sein. Bei Vorliegen einer Störung, die sich auf das Messsignal auswirkt, ergibt sich bei der skizzierten Frequenzanalyse eine Spitze bei einer Frequenz, die einer Frequenzverschiebung zwischen der Pulsfrequenz und der Vergleichsfrequenz entspricht. Hierdurch ist feststellbar, ob die Pulsfrequenz einem Sollwert entspricht. Beispielsweise ist bei einer Pulsfrequenz, die an eine Netzfrequenz gekoppelt ist, so feststellbar, ob die vorliegende Netzfrequenz, sofern eine daran gebundene Störung vorliegt, einer Netz-Sollfrequenz entspricht, insbesondere 50 Hz oder 60 Hz. Die vorliegende Störung beim Messen des Durchflusses im Rohr ist dadurch weiter näher charakterisierbar und so gezielt kompensierbar. Ferner sind die beschriebenen Schritte auch für einen dritten, vierten, usw. Messwertabschnitt durchführbar.In a further embodiment of the claimed method, the first and second steps are also carried out correspondingly for the second measurement value section. As a result, the measurement signal is recorded separately for the first and second measurement value section and can be used further. A characteristic The size of a measured value section, e.g. the mean value of the measurement signal, is modulated as a time series onto a carrier signal, for example by means of quadrature amplitude modulation. The carrier signal has a carrier frequency that essentially corresponds to the pulse frequency with which the magnetic coil is excited. From this, a frequency shift compared to a comparison frequency can be determined. In particular, by combining with the comparison frequency, a frequency analysis results in a peak, i.e. a maximum amount, also called a peak, at around 0 Hz, if the measurement signal is free of interference. The combination can be designed as so-called aliasing, among other things. If there is interference that affects the measurement signal, the frequency analysis outlined results in a peak at a frequency that corresponds to a frequency shift between the pulse frequency and the comparison frequency. This makes it possible to determine whether the pulse frequency corresponds to a target value. For example, with a pulse frequency that is coupled to a mains frequency, it is possible to determine whether the existing mains frequency, if there is a disturbance associated with it, corresponds to a nominal mains frequency, in particular 50 Hz or 60 Hz. The existing disturbance when measuring the flow in the pipe can thus be characterized in more detail and thus compensated for in a targeted manner. Furthermore, the steps described can also be carried out for a third, fourth, etc. measurement value section.
In einer weiteren Ausführungsform des beanspruchten Verfahrens kann in einem zusätzlichen Schritt ein Anregen der Magnetspule für eine einstellbare Dauer unterbrochen werden. Dies kann durch ein Auslassen zumindest eines Pulses bestehen, oder in einem Zeitraum zwischen zwei Anregungen der Magnetspule erfolgen. Währenddessen erfolgt ein Erfassen eines verbleibenden Restmagnetfelds im Rohr, das weiter ausgewertet wird. In einem bestimmungsgemäßen Zustand ist bei ausbleibender Anregung der Magnetspulen kein technisch nutzbares oder auswertbares Messsignal zu erwarten. In einem gestörten Zustand entsprechen die empfangenen Messsignale einer Störung, die beispielsweise einem Magnetfeld eines benachbarten elektrischen Geräts hervorgerufen wird. Derartige erfasste Störungen werden in einem weiteren Betrieb der magnetisch-induktiven Messvorrichtung beim Auswerten der Messsignale ignoriert und/oder unterdrückt. Ebenso ist durch die Auswertung der Messsignale des Restmagnetfelds eine Störungsursache diagnostizierbar, beispielsweise eine elektromagnetische Einkopplung auf Leitungen der Magnetspule. Insgesamt sind eine weitere Steigerung der Messgenauigkeit und differenzierte Eigendiagnose des magnetisch-induktiven Durchflussmessers erzielbar.In a further embodiment of the claimed method, in an additional step, the excitation of the magnetic coil can be interrupted for an adjustable period of time. This can be done by omitting at least one pulse, or in a period of time between two excitations of the magnetic coil. During this time, a residual magnetic field is recorded in the pipe, which is then evaluated. In a normal state, if the magnetic coils are not excited, no technically usable or evaluable measurement signal can be expected. In a faulty state, the received measurement signals correspond to a fault, which is caused, for example, by a magnetic field of a neighboring electrical device. Such detected interference is ignored and/or suppressed during further operation of the magnetic-inductive measuring device when evaluating the measurement signals. The cause of the interference can also be diagnosed by evaluating the measurement signals of the residual magnetic field, for example electromagnetic coupling on the lines of the magnetic coil. Overall, a further increase in the measurement accuracy and differentiated self-diagnosis of the magnetic-inductive flow meter can be achieved.
Die zugrundeliegende Aufgabenstellung wird ebenso durch das folgende erfindungsgemäße Verfahren gelöst. Dieses beruht auf denselben mathematischen und signaltheoretischen Eigenschaften wie das oben dargelegte Verfahren. Das oben beschriebene Verfahren und das im Folgenden beschriebene Verfahren stellen deshalb unterschiedliche Facetten desselben technologischen Konzepts dar und knüpfen an dieselben erfindungswesentlichen Erwägungen und Erkenntnisse an.The underlying problem is also solved by the following method according to the invention. This is based on the same mathematical and signal-theoretical properties as the method described above. The method described above and the method described below therefore represent different facets of the same technological concept and are based on the same considerations and findings essential to the invention.
Das erfindungsgemäße Verfahren dient zu einem Messen eines Durchflusses eines Fluids in einem Rohr, an dem ein magnetisch-induktiver Durchflussmesser befestigt ist. Der magnetisch-induktive Durchflussmesser weist eine Magnetspule auf, durch die im Querschnitt des Rohrs ein Magnetfeld induzierbar ist, das mit fließenden geladenen Teilchen im Rohr in Wechselwirkung tritt. Hierdurch ist im Querschnitt des Rohrs senkrecht im Magnetfeld eine elektrische Spannung hervorrufbar, die über geeignet angebrachte Spannungssensoren erfassbar ist. In einem ersten Schritt des Verfahrens erfolgt ein Anregen der Magnetspule mit einem Rechtecksignal, das eine Pulsfrequenz aufweist. Das Rechtecksignal, auch boxcar signal genannt, kann dabei aus einer Überlagerung mehrerer Sinussignale erzeugt werden. Durch das Rechtecksignal wird im Querschnitt des Rohrs eine elektrische Spannung hervorgerufen, die als Messsignal erfasst wird. Das Messsignal weist im Wesentlich ebenso eine Rechteckform auf. Eine Amplitude des Messsignals korrespondiert mit dem zu messenden Durchfluss im Rohr.The method according to the invention is used to measure a flow of a fluid in a pipe to which a magnetic-inductive flow meter is attached. The magnetic-inductive flow meter has a magnetic coil through which a magnetic field can be induced in the cross-section of the pipe, which interacts with flowing charged particles in the pipe. As a result, an electrical voltage can be generated vertically in the magnetic field in the cross-section of the pipe, which can be detected by suitably mounted voltage sensors. In a first step of the method, the magnetic coil is excited with a square-wave signal that has a pulse frequency. The square-wave signal, also called a boxcar signal, can be generated from a superposition of several sinusoidal signals. The square-wave signal generates an electrical voltage in the cross-section of the pipe, which is detected as a measurement signal. The measurement signal also has essentially a rectangular shape. An amplitude of the measuring signal corresponds to the flow to be measured in the pipe.
Das Verfahren umfasst auch einen zweiten Schritt, in dem eine Frequenzanalyse des Messsignals durchgeführt wird. Die Frequenzanalyse kann dabei zur Laufzeit des Verfahrens parallel mitlaufend durchgeführt werden. Die Frequenzanalyse kann in Form einer Zeit-Frequenz-Analyse das Messsignal über Zeitabschnitte hinweg analysieren, die sich überlappen können. Durch die Frequenzanalyse im zweiten Schritt erfolgt ein Ermitteln von Frequenzanteilen des Messsignals. Ausgehend hiervon werden die Frequenzanteile näher betrachtet. In einem dritten Schritt wird ein Frequenzanteil als Rechteck-Frequenzanteil, also als durch das Rechtecksignal an der Magnetspule hervorgerufen, erkannt, wenn der entsprechende Frequenzanteil einem ungeradzahligen Vielfachen der Pulsfrequenz entspricht. Der Erfindung liegt unter anderem die Erkenntnis zugrunde, dass ein Rechtecksignal als eine Kombination von Schwingungen gebildet wird, deren Frequenzen beispielsweise einem Einfachen, einem Dreifachen, einem Fünffachen, einem Siebenfachen, usw. der Pulsfrequenz entsprechen. Ein störungsfreies Messsignal zeigt in der Frequenzanalyse daher ausschließlich die oben skizzierten Frequenzanteile mit vorhersagbaren Amplituden und Phasen. Ferner sind durch eine Kombination von zwei überlagerten Rechtecksignalen zwischen deren Messwertabschnitten Inaktivphasen definierbar. Wenn ein Frequenzanteil des Messsignals kein Rechteck-Frequenzanteil ist, erfolgt im erfindungsgemäßen Verfahren ein vierter Schritt. Darin wird der entsprechende Frequenzanteil des Messsignals als Störfrequenz erkannt. Mittels des erfindungsgemäßen Verfahrens sind Störfrequenzen nicht nur qualitativ, sondern gleichzeitig auch quantitativ erkennbar. Dies erlaubt es, durch geeignete Filterung oder Korrekturmaßnahmen die Störwirkung, die von der Störfrequenz ausgeht, auszugleichen. Frequenzanalysen sind schnell durchführbar und erlauben eine präzise Auswertung des Messsignals. Bei einer solchen Frequenzanalyse des Messsignals sind Amplitudenwerte und Phasenwerte dessen algebraisch ermittelbar, was eine exakte Auswertung des Messsignals erlaubt. Dementsprechend ist das erfindungsgemäße Verfahren dazu geeignet, den Amplitudenwert im Messwertabschnitt präzise zu ermitteln, was eine exakte Berechnung des Durchflusses im Rohr trotz einer vorhandenen Störung erlaubt. Zusätzlich ist das erfindungsgemäße Verfahren dazu geeignet, im Zuge der Frequenzanalyse des Messsignals einen Defekt oder eine Degradation von Komponenten des magnetisch-induktiven Durchflussmessers zu erkennen, da die Degradation dazu führt, dass die Frequenzanalyse im Ergebnis vom zu erwartenden Ergebnis abweicht. Das erfindungsgemäße Verfahren ist ferner dazu geeignet, unterschiedliche Störungen zu identifizieren und weist folglich eine erhöhte Robustheit auf. Das technische Potential des eingesetzten magnetisch-induktiven Durchflussmessers wird so weiter ausgeschöpft. Unter einem Rechtecksignal ist auch jegliches Signal zu verstehen, das bei einer Frequenzanalyse ein vorhersagbares Ergebnis aufweist, in dem die Wirkungen von Störungen und Degradationen klar identifizierbar hervorvortreten.The method also includes a second step in which a frequency analysis of the measurement signal is carried out. The frequency analysis can be carried out in parallel while the method is running. The frequency analysis can analyze the measurement signal in the form of a time-frequency analysis over time periods that can overlap. The frequency analysis in the second step determines frequency components of the measurement signal. Based on this, the frequency components are examined in more detail. In a third step, a frequency component is recognized as a square-wave frequency component, i.e. as caused by the square-wave signal on the magnetic coil, if the corresponding frequency component corresponds to an odd multiple of the pulse frequency. The invention is based, among other things, on the knowledge that a square-wave signal is formed as a combination of oscillations whose frequencies correspond, for example, to one, three, five, seven times, etc. of the pulse frequency. A disturbance-free measurement signal therefore shows in the frequency analysis only the frequency components outlined above with predictable amplitudes and phases. Furthermore, inactive phases can be defined between their measurement value sections by combining two superimposed square-wave signals. If a frequency component of the measurement signal is not a square-wave frequency component, a fourth step is carried out in the method according to the invention. In this step, the corresponding frequency component of the measurement signal is identified as an interference frequency. Using the method according to the invention, interference frequencies can be identified not only qualitatively, but also quantitatively. This allows the interference effect emanating from the interference frequency to be compensated for by suitable filtering or corrective measures. Frequency analyses can be carried out quickly and allow a precise evaluation of the measurement signal. With such a frequency analysis of the measurement signal, the amplitude values and phase values can be determined algebraically, which enables an exact evaluation. of the measurement signal. Accordingly, the method according to the invention is suitable for precisely determining the amplitude value in the measured value section, which allows an exact calculation of the flow in the pipe despite an existing disturbance. In addition, the method according to the invention is suitable for detecting a defect or degradation of components of the magnetic-inductive flow meter during the frequency analysis of the measurement signal, since the degradation causes the frequency analysis result to deviate from the expected result. The method according to the invention is also suitable for identifying different disturbances and consequently has increased robustness. The technical potential of the magnetic-inductive flow meter used is thus further exploited. A square-wave signal is also understood to mean any signal that has a predictable result in a frequency analysis in which the effects of disturbances and degradations are clearly identifiable.
Erfindungsgemäß umfasst das Verfahren einen weiteren Schritt, in dem die Dauer der Messwertabschnitte auf ein auf ein ganzzahliges Vielfaches der Periodendauer eines Störsignal eingestellt wird. Dazu werden erfindungsgemäß die Dauern von Inaktivphasen angepasst. Zusätzlich kann die Pulsfrequenz angepasst werden.According to the invention, the method comprises a further step in which the duration of the measurement value sections is set to an integer multiple of the period duration of an interference signal. For this purpose, the durations of inactive phases are adjusted according to the invention. In addition, the pulse frequency can be adjusted.
In einer Ausführungsform des beanspruchten Verfahrens ist die Frequenzanalyse als Fourier-Analyse oder als Wavelet-Analyse ausgebildet. Diese liefern präzise Auskunft über die Eigenschaften des Messsignals als Ganzes und über wählbare Abschnitte des Messsignals, insbesondere die Messwertabschnitte, die eine Störwirkung unterworfen sein können. Ferner werden Fourier-Analysen und/oder Wavelet-Analysen in einer Vielzahl an Signalverarbeitungschips oder Controllern als effizient implementierte Funktionen bereitgestellt. Auch dadurch wird das technische Potential von magnetisch-induktiven Durchflussmessern stärker ausgenutzt. Zusätzlich kann das beanspruchte Verfahren dadurch auch auf bestehenden magnetisch-induktiven Durchflussmessern im Zuge eines Software- oder Firmware-Updates nachträglich implementiert werden. Dementsprechend ist mit dem beanspruchten Verfahren die technisch sinnvolle Nutzungsdauer von bestehenden magnetisch-induktiven Durchflussmessern kosteneffizient verlängerbar. Weiter alternativ kann statt einer Frequenzanalyse auch eine sogenannte Kleinste-Quadrate-Schätzung durchgeführt werden, die bei wenigen Messsignalen schnell durchführbar ist.In one embodiment of the claimed method, the frequency analysis is designed as a Fourier analysis or as a wavelet analysis. These provide precise information about the properties of the measurement signal as a whole and about selectable sections of the measurement signal, in particular the measurement value sections that may be subject to interference. Furthermore, Fourier analyses and/or wavelet analyses are provided as efficiently implemented functions in a large number of signal processing chips or controllers. This also makes greater use of the technical potential of magnetic-inductive flow meters. In addition, the claimed method can also be used on existing magnetic-inductive Flow meters can be subsequently implemented as part of a software or firmware update. Accordingly, the technically reasonable service life of existing magnetic-inductive flow meters can be extended cost-effectively using the claimed method. Alternatively, a so-called least squares estimation can be carried out instead of a frequency analysis, which can be carried out quickly with a small number of measurement signals.
Ferner kann im beanspruchten Verfahren in einem fünften Schritt eine Amplitude, also ein Amplitudenwert, des Messsignals zumindest in einem Messwertabschnitt anhand der Frequenzanalyse ermittelt werden. Beispielsweise entspricht die Amplitude bei einem fourier-analysierten Messsignal der Summe der harmonischen Schwingungen mit alternierendem Vorzeichen. Eine solche Summe ist mit reduziertem Rechenaufwand schnell ermittelbar. Hierdurch werden Zwischenergebnisse bei der Frequenzanalyse weiterverwendet, so dass das beanspruchte Verfahren schnell durchführbar ist. Insbesondere sind aufgrund der algebraischen Berechenbarkeit des Amplitudenwerts zusätzliche Rechenschritte, beispielsweise Durchschnittswertbildungen, entbehrlich.Furthermore, in the claimed method, in a fifth step, an amplitude, i.e. an amplitude value, of the measurement signal can be determined at least in one measurement value section using the frequency analysis. For example, the amplitude of a Fourier-analyzed measurement signal corresponds to the sum of the harmonic oscillations with alternating signs. Such a sum can be determined quickly with reduced computational effort. This means that intermediate results are reused in the frequency analysis, so that the claimed method can be carried out quickly. In particular, due to the algebraic calculability of the amplitude value, additional calculation steps, for example averaging, are unnecessary.
In einer weiteren Ausführungsform des beanspruchten Verfahrens umfasst der weitere Schritt, in dem die Dauer der Messwertabschnitte auf ein auf ein ganzzahliges Vielfaches der Periodendauer eines Störsignal eingestellt wird, dass die Pulsfrequenz angepasst wird.In a further embodiment of the claimed method, the further step in which the duration of the measured value sections is set to an integer multiple of the period duration of an interference signal comprises adjusting the pulse frequency.
In Ausführungsformen, in denen Mittelwerte über Messwertabschnitte gebildet werden, werden so periodische Störungen mit entsprechender Periodendauer unterdrückt. Durch entsprechendes Anpassen sind gleichzeitig zwei Störungen unterschiedlicher und nicht harmonisch verwandter Frequenz unterdrückbar.In embodiments in which averages are formed over measurement value sections, periodic disturbances with a corresponding period duration are suppressed. By appropriate adjustment, two disturbances of different and not harmonically related frequencies can be suppressed simultaneously.
Die eingangs dargelegte Aufgabenstellung wird genauso durch ein erfindungsgemäßes Computerprogrammprodukt gelöst, das zu einem Ansteuern einer Magnetspule und zum Verarbeiten von Messsignalen eines Spannungssensors ausgebildet ist. Das Computerprogrammprodukt verfügt hierzu über geeignete Schnittstellen, die ein entsprechendes Eingeben und Ausgeben von Daten bzw. Befehlen erlaubt. Die Magnetspule und der Spannungssensor gehören dabei zumindest funktional zu einem magnetisch-induktiven Durchflussmesser. Das Computerprogrammprodukt ist ferner dazu ausgebildet, im Querschnitt eines Rohrs, auf dem der Durchflussmesser befestigt ist, einen Durchfluss eines Fluids zu ermitteln, also zu messen. Dazu ist das Computerprogrammprodukt erfindungsgemäß dazu ausgebildet, zumindest eine Ausführungsform der oben skizzierten Verfahren durchzuführen. Das Computerprogrammprodukt ist dabei auf einer Recheneinheit, die mit einer Speichereinheit zusammenwirkt, ausführbar. Des Weiteren kann das Computerprogrammprodukt monolithisch ausgebildet sein, also sämtliche seiner Funktionen auf einer Hardwareplattform ausführen. Alternativ kann das Computerprogrammprodukt auch als System von mindestens zwei Teilprogrammen ausgebildet sein, die auf unterschiedlichen Hardwareplattformen ausführbar sind und durch eine kommunikative Datenverbindung zusammenwirken. Jedes Teilprogramm umfasst dabei zumindest eine Funktion des Computerprogrammprodukts, beispielsweise ein Vorgeben von Parameterwerten für den magnetisch-induktiven Durchflussmesser. Durch dieses Zusammenwirken wird die Funktionsweise des Computerprogrammprodukts verwirklicht. Derartige Teilprogramme können beispielsweise auf einer Steuereinheit des magnetisch-induktiven Durchflussmessers, einem Leitrechner, und/oder einer Computer-Cloud ausgeführt werden. Darüber hinaus kann das Computerprogrammprodukt rein als Software ausgebildet sein oder festverdrahtet, beispielsweise als Chip, Integrierte Schaltung oder FPGA. Weiter alternativ kann das Computerprogrammprodukt auch als eine Kombination hieraus ausgebildet sein.The task set out at the beginning is also solved by a computer program product according to the invention, which is used to control a magnetic coil and to process measurement signals from a voltage sensor. The computer program product has suitable interfaces for this purpose, which allow the corresponding input and output of data or commands. The magnetic coil and the voltage sensor are at least functionally part of a magnetic-inductive flow meter. The computer program product is also designed to determine, i.e. measure, a flow of a fluid in the cross section of a pipe on which the flow meter is attached. For this purpose, the computer program product is designed according to the invention to carry out at least one embodiment of the methods outlined above. The computer program product can be executed on a computing unit that interacts with a memory unit. Furthermore, the computer program product can be designed monolithically, i.e. carry out all of its functions on one hardware platform. Alternatively, the computer program product can also be designed as a system of at least two subprograms that can be executed on different hardware platforms and interact via a communicative data connection. Each subprogram comprises at least one function of the computer program product, for example specifying parameter values for the magnetic-inductive flow meter. The functionality of the computer program product is realized through this interaction. Such subprograms can be executed, for example, on a control unit of the magnetic-inductive flow meter, a master computer, and/or a computer cloud. In addition, the computer program product can be designed purely as software or hard-wired, for example as a chip, integrated circuit or FPGA. Alternatively, the computer program product can also be designed as a combination of these.
Genauso wird die zugrundeliegende Aufgabe durch eine erfindungsgemäße Steuereinheit gelöst. Die Steuereinheit umfasst eine Speichereinheit und eine Rechnereinheit, die im Betrieb zusammenwirken und das Ausführen von Computerprogrammprodukten erlauben. Die Steuereinheit ist dazu ausgebildet, einen magnetisch-induktiven Durchflussmesser anzusteuern und verfügt hierzu über geeignete Eingänge und Ausgänge für Daten bzw. Befehle. Erfindungsgemäß ist die Steuereinheit dazu ausgebildet, ein Computerprogramprodukt auszuführen, das gemäß einer der oben dargelegten Ausführungsformen ausgebildet ist. Alternativ kann die Steuereinheit dazu ausgebildet sein, zumindest eine Ausführungsform der beschriebenen Verfahren umzusetzen. Eine solche Steuereinheit ist mit einfacher Hardware realisierbar und dadurch besonders kosteneffizient. Die technischen Vorzüge der zugrundeliegenden Verfahren sind so in besonderem Umfang erzielbar.The underlying object is also achieved by a control unit according to the invention. The control unit comprises a memory unit and a computer unit, which interact during operation and enable the execution of computer program products allow. The control unit is designed to control a magnetic-inductive flow meter and has suitable inputs and outputs for data or commands. According to the invention, the control unit is designed to execute a computer program product that is designed according to one of the embodiments set out above. Alternatively, the control unit can be designed to implement at least one embodiment of the described methods. Such a control unit can be implemented with simple hardware and is therefore particularly cost-efficient. The technical advantages of the underlying methods can thus be achieved to a particular extent.
Ebenso wird die Aufgabenstellung durch einen erfindungsgemä-βen magnetisch-induktiven Durchflussmesser gelöst. Der magnetisch-induktive Durchflussmesser ist dazu ausgebildet, einen Durchfluss eines Fluids in einem Querschnitt eines Rohrs zu messen und verfügt dazu über eine Magnetspule und einen Spannungssensor. Die Magnetspule und der Spannungssensor sind über eine Steuereinheit betätigbar bzw. auslesbar. Erfindungsgemäß ist die Steuereinheit nach einer der oben skizzierten Ausführungsformen ausgebildet.The task is also solved by a magnetic-inductive flow meter according to the invention. The magnetic-inductive flow meter is designed to measure a flow of a fluid in a cross-section of a pipe and has a magnetic coil and a voltage sensor for this purpose. The magnetic coil and the voltage sensor can be actuated or read out via a control unit. According to the invention, the control unit is designed according to one of the embodiments outlined above.
Ferner wird die zugrundeliegende Aufgabenstellung durch ein erfindungsgemäßes Computerprogrammprodukt gelöst, das zu einem Simulieren eines Betriebsverhaltens eines magnetisch-induktiven Durchflussmessers geeignet ist, insbesondere dazu ausgebildet ist.Furthermore, the underlying problem is solved by a computer program product according to the invention, which is suitable for simulating an operating behavior of a magnetic-inductive flow meter, in particular is designed for this purpose.
Insbesondere kann das Computerprogrammprodukt dazu eingerichtet sein, das Betriebsverhalten des magnetisch-induktiven Durchflussmesser zu simulieren, indem dessen Aufbau darin fest vorgegeben ist, also ein Abbild dessen hinterlegt ist. Alternativ kann das Betriebsverhalten auch durch ein abstrahiertes Rechenmodell dargestellt werden, das vom räumlichen Aufbau des magnetisch-induktiven Durchflussmessers unabhängig ist. Weiter alternativ kann das Betriebsverhalten auch anhand einer Kombination hieraus ermittelt werden. Der zu simulierende magnetisch-induktive Durchflussmesser ist erfindungsgemäß nach einer der oben beschriebenen Ausführungsformen ausgebildet. Das Computerprogrammprodukt verfügt zur Simulation über ein Physik-Modul, in dem der magnetisch-induktive Durchflussmesser abgebildet ist und beispielsweise sein elektrisches oder signaltechnisches Verhalten unter einstellbaren Betriebsbedingungen nachstellbar ist. Zu den einstellbaren Betriebsbedingungen gehört erfindungsgemäß ein Störungsspektrum mit unterschiedlichen Störfrequenzen. Beispielsweise können zu den einstellbaren Betriebsbedingungen ein Durchfluss im Querschnitt des Rohrs, eine Temperatur, ein Druck, eine Viskosität im Fluid im Rohr, dessen Leitfähigkeit, dessen Induktionsverhalten, magnetische Permissivität, eine Magnetisierbarkeit gehören. Hierzu kann das Computerprogrammprodukt über eine Datenschnittstelle verfügen, über die entsprechende Daten über eine Benutzereingabe und/oder andere simulationsgerichtete Computerprogrammprodukte vorgebbar sind. Das Computerprogrammprodukt kann auch über eine Datenschnittstelle zum Ausgeben von Simulationsresultaten an einen Benutzer und/oder andere simulationsgerichtete Computerprogrammprodukte verfügen. Mittels des Computerprogrammprodukts sind erfindungsgemäß Messsignale von Spannungssensoren des magnetisch-induktiven Durchflussmessers auf Plausibilität prüfbar. Ebenso sind auch andere Sensorwerte einer Anlage, in der der magnetisch-induktive Durchflussmesser eingesetzt wird, auf Plausibilität prüfbar. Dadurch kann unter anderem ein defekter Spannungssensor, identifiziert werden. Gleichermaßen ist auch ein Sensor mit Degradationserscheinungen identifizierbar. Die Erfindung beruht unter anderem auch auf der überraschenden Erkenntnis, dass die oben skizzierten Verfahren bei relativ geringem Rechenaufwand mit gesteigerter Präzision modellierbar sind. Dementsprechend wird durch das erfindungsgemäße Computerprogrammprodukt eine umfangreiche und gleichzeitig rechenkapazitätenschonende Möglichkeit zum Überwachen und/oder Erproben eines entsprechenden magnetisch-induktiven Durchflussmessers zur Verfügung gestellt. Das Computerprogrammprodukt kann als sogenannter Digitaler Zwilling ausgebildet sein, wie beispielsweise in der Druckschrift
Die Erfindung wird im Folgenden anhand einzelner Ausführungsformen in Figuren näher erläutert. Die Figuren sind insoweit in gegenseitiger Ergänzung zu lesen, dass gleiche Bezugszeichen in unterschiedlichen Figuren die gleiche technische Bedeutung haben. Die Merkmale der einzelnen Ausführungsformen sind untereinander auch kombinierbar. Ferner sind die in den Figuren gezeigten Ausführungsformen mit den oben skizzierten Merkmalen kombinierbar. Es zeigen im Einzelnen:
- FIG 1
- schematisch einen Aufbau einer Ausführungsform des beanspruchten magnetisch-induktiven Durchflussmessers;
- FIG 2
- ein Stadium einer Ausführungsform ersten erfindungsgemäßen Verfahrens;
- FIG 3
- ein anschließendes Stadium des Verfahrens aus
FIG 2 ; - FIG 4
- ein weiteres Stadium des Verfahrens aus
FIG 3 ; - FIG 5
- schematisch einen Ablauf eines zweiten erfindungsgemäßen Verfahrens.
- FIG 1
- schematically shows a structure of an embodiment of the claimed magnetic-inductive flow meter;
- FIG 2
- a stage of an embodiment of a first method according to the invention;
- FIG 3
- a subsequent stage of the procedure
FIG 2 ; - FIG 4
- a further stage of the procedure
FIG 3 ; - FIG 5
- schematically shows a sequence of a second method according to the invention.
Ein schematischer Aufbau einer Ausführungsform eines erfindungsgemäßen magnetisch-induktiven Durchflussmessers 10 ist in
Eine Ausführungsform des ersten erfindungsgemäßen Verfahrens 100 ist in
In
Ein weiteres Stadium des erfindungsgemäßen ersten Verfahrens 100 ist in
Eine Ausführungsform eines erfindungsgemäßen zweiten Verfahrens 200 zum Messen eines Durchflusses 15 in einem Rohr 11 ist in
Claims (11)
- Method (100) for measuring a flow rate (15) in a pipe (11) by means of a magneto-inductive flowmeter (10) that is fastened to the pipe (11), comprising the steps:a) exciting a magnet coil (12) of the magneto-inductive flowmeter (10) with a square-wave signal (21) at a pulse frequency (19) and capturing a measurement signal (20);b) capturing a first measurement value portion (24) of the measurement signal (20), said measurement value portion comprising a first and a second sub-portion (32, 33);c) establishing a mean value (37) of the measurement signal (20) in each of the first and second sub-portions (32, 33);wherein an interference (29) of the measurement signal (20) is recognised if the mean values (37) differ from one another by at least an adjustable interference threshold value (38), characterised in that the square-wave signal (21) has an inactive phase (28) which is adjustable independently of the first and/or second measurement value portion (24, 26), and in a further step, a pulse duration of the square-wave signal (21) and/or a duration of the inactive phase (28) is adapted for a balancing of an interference effect in successive measurement value portions (22, 24, 26).
- Method (100) according to claim 1, characterised in that the first and second sub-portion (32, 33) follow one another temporally or partially overlap temporally.
- Method (100) according to claim 1 or 2, characterised in that for each of the first measurement value portion (24) and a second measurement value portion (26), a mean value (37) of the measurement signal (20) is established, on the basis of which an amplitude (27) of the measurement signal (20) is established.
- Method (100) according to one of claims 1 to 3, characterised in that at least the steps a) and b) are also carried out for the second measurement value portion (26), wherein the measurement signals (20) of the first and second measurement value portions (24, 26) are modulated onto a carrier signal (45), the carrier frequency (53) of which corresponds to the pulse frequency (19), and from this a frequency shift (47) relative to a comparison frequency (49) is established.
- Method (100) according to claim 4, characterised in that the modulation onto the carrier signal (45) takes place by means of a quadrature amplitude modulation and/or the comparison frequency (49) is a mains target frequency.
- Method (200) for measuring a flow rate (15) in a pipe (11) by means of a magneto-inductive flowmeter (10) that is fastened to the pipe (11), comprising the steps:a) exciting a magnet coil (12) of the magneto-inductive flowmeter (10) with a square-wave signal (21) at a pulse frequency (19) and capturing a measurement signal (20);b) carrying out a frequency analysis (40) of the measurement signal (20) for establishing frequency components (42) of the measurement signal (20);c) recognising a frequency component (42) of the measurement signal (20) as a square-wave frequency component (44) if the frequency component (42) corresponds to an odd-numbered fraction of the pulse frequency (19); and otherwised) recognising a frequency component of the measurement signal (20) as an interference frequency (39);wherein in a further step, the durations of measurement value portions (22) are amended to an integer multiple of a period duration of the interference frequency (39), wherein durations of inactive phases (28) are adapted.
- Method (200) according to claim 6, characterised in that the frequency analysis (40) is designed as a Fourier analysis or a wavelet analysis.
- Method (200) according to claim 6 or 7, characterised in that a further step e) is carried out in which an amplitude (27) of the measurement signal (20) is established on the basis of the frequency analysis (40).
- Control unit (30) of a magneto-inductive flowmeter (10), comprising a storage unit (52) and a computer unit (54) for executing a computer program product (50), characterised in that the control unit (30) is designed to implement at least one of the methods (100) as claimed in one of claims 1 to 8.
- Magneto-inductive flowmeter (10) for measuring a flow rate (15) through a pipe (11), comprising a magnet coil (12) and a voltage sensor (14) which are connected to a control unit (30), characterised in that the control unit (30) is designed as claimed in claim 9.
- Computer program product (80) for simulating an operating behaviour of a magneto-inductive flowmeter (10), characterized in that the flowmeter (10) is designed as claimed in claim 10 and the computer program product (80) is designed as a digital twin, wherein the computer program product (80) has a physics module, in which the magneto-inductive flowmeter (10) is mapped and the electrical or signalling behaviour thereof can be emulated under adjustable operating conditions, wherein the adjustable operating conditions include an interference spectrum with different interference frequencies, and the computer program product (80) is designed for testing measurement signals of voltage sensors of the magneto-inductive flowmeter (10) for plausibility, in order to identify a defective voltage sensor.
Applications Claiming Priority (2)
| Application Number | Priority Date | Filing Date | Title |
|---|---|---|---|
| DE102021208598.9A DE102021208598A1 (en) | 2021-08-06 | 2021-08-06 | Noisy flow measurement method, electromagnetic flowmeter and computer program product |
| PCT/EP2022/068953 WO2023011846A1 (en) | 2021-08-06 | 2022-07-07 | Method for flow measurement that is subject to interference, magneto-inductive flowmeter and computer program product |
Publications (2)
| Publication Number | Publication Date |
|---|---|
| EP4341649A1 EP4341649A1 (en) | 2024-03-27 |
| EP4341649B1 true EP4341649B1 (en) | 2024-08-28 |
Family
ID=82693903
Family Applications (1)
| Application Number | Title | Priority Date | Filing Date |
|---|---|---|---|
| EP22746997.0A Active EP4341649B1 (en) | 2021-08-06 | 2022-07-07 | Method for flow measurement that is subject to interference, magneto-inductive flowmeter and computer program product |
Country Status (5)
| Country | Link |
|---|---|
| EP (1) | EP4341649B1 (en) |
| CN (1) | CN117795295A (en) |
| AU (1) | AU2022321857A1 (en) |
| DE (1) | DE102021208598A1 (en) |
| WO (1) | WO2023011846A1 (en) |
Families Citing this family (1)
| Publication number | Priority date | Publication date | Assignee | Title |
|---|---|---|---|---|
| DE102023102673B3 (en) | 2023-02-03 | 2024-05-16 | Krohne Messtechnik Gmbh | Method for operating a magnetic-inductive flow meter and a corresponding magnetic-inductive flow meter |
Citations (1)
| Publication number | Priority date | Publication date | Assignee | Title |
|---|---|---|---|---|
| WO2021137089A1 (en) * | 2019-12-31 | 2021-07-08 | Abb Schweiz Ag | An electromagnetic flowmeter |
Family Cites Families (10)
| Publication number | Priority date | Publication date | Assignee | Title |
|---|---|---|---|---|
| JP3020772B2 (en) * | 1993-07-09 | 2000-03-15 | 株式会社東芝 | Electromagnetic flow meter |
| US6615149B1 (en) | 1998-12-10 | 2003-09-02 | Rosemount Inc. | Spectral diagnostics in a magnetic flow meter |
| DE10256103B4 (en) | 2002-05-14 | 2004-09-16 | Krohne Meßtechnik GmbH & Co KG | Method for determining the uncertainty of a measuring method using a measuring frequency |
| DE102004031638A1 (en) | 2004-06-30 | 2006-01-26 | Abb Patent Gmbh | Method for operating a magneto-inductive flow measuring device |
| DE102005018179A1 (en) * | 2005-04-19 | 2006-10-26 | Krohne Messtechnik Gmbh & Co. Kg | Method for operating a measuring device |
| JP5444086B2 (en) * | 2010-03-30 | 2014-03-19 | アズビル株式会社 | Electromagnetic flow meter |
| DE102013114427A1 (en) * | 2013-12-19 | 2015-06-25 | Endress + Hauser Flowtec Ag | Arrangement and method for determining a flow-related measured variable |
| US20170286572A1 (en) | 2016-03-31 | 2017-10-05 | General Electric Company | Digital twin of twinned physical system |
| US11441931B2 (en) | 2018-02-12 | 2022-09-13 | Ifm Electronic Gmbh | Method for operating a magnetoinductive flowmeter |
| US10935402B2 (en) * | 2018-09-06 | 2021-03-02 | Micro Motion, Inc. | Fluid contaminant detection using noise levels in magnetic flow meter sensor signals |
-
2021
- 2021-08-06 DE DE102021208598.9A patent/DE102021208598A1/en active Pending
-
2022
- 2022-07-07 EP EP22746997.0A patent/EP4341649B1/en active Active
- 2022-07-07 WO PCT/EP2022/068953 patent/WO2023011846A1/en active Application Filing
- 2022-07-07 CN CN202280054941.6A patent/CN117795295A/en active Pending
- 2022-07-07 AU AU2022321857A patent/AU2022321857A1/en active Pending
Patent Citations (1)
| Publication number | Priority date | Publication date | Assignee | Title |
|---|---|---|---|---|
| WO2021137089A1 (en) * | 2019-12-31 | 2021-07-08 | Abb Schweiz Ag | An electromagnetic flowmeter |
Also Published As
| Publication number | Publication date |
|---|---|
| CN117795295A (en) | 2024-03-29 |
| WO2023011846A1 (en) | 2023-02-09 |
| EP4341649A1 (en) | 2024-03-27 |
| DE102021208598A1 (en) | 2023-02-09 |
| AU2022321857A1 (en) | 2024-02-08 |
Similar Documents
| Publication | Publication Date | Title |
|---|---|---|
| EP1217337B1 (en) | Method for testing the functioning of a flow measurement device | |
| DE102006017676B3 (en) | Coriolis-mass flow rate measuring device operating method, involves utilizing indicator parameter and additional indicator parameter for detection of multiphase flow, where additional parameter is independent of indicator parameter | |
| EP2513612B1 (en) | Method for operating a coriolis mass flow rate meter and coriolis mass flow rate meter | |
| DE102009002682B4 (en) | Device and method for residual evaluation of a residual for detecting system errors in the system behavior of a system of an aircraft | |
| EP2044406B1 (en) | Method for the diagnosis of a blockage of an impulse line in a pressure measurement transducer, and pressure measurement transducer | |
| EP3234512B1 (en) | Differential pressure type flowmeter | |
| EP2936082B1 (en) | Vortex flow meter and method for measuring the void fractions of a multiphase flow | |
| EP2780671B1 (en) | Method of monitoring the vibration characteristics of a coriolis flowmeter and coriolis flowmeter | |
| EP4341649B1 (en) | Method for flow measurement that is subject to interference, magneto-inductive flowmeter and computer program product | |
| EP3293499B1 (en) | Method of operating a magnetic-inductive flow meter and magnetic-inductive flow meter | |
| DE102005033290A1 (en) | Measuring electrodes physical chemical condition recognizing method for e.g. magnetic inductive flow meter in e.g. food industry, involves comparing actual voltage values of electrode with preceding values to eliminate interference voltages | |
| EP2568262B1 (en) | Method for operating multiple neighbouring magnetic-inductive flow meters and arrangement of multiple neighbouring magnetic-inductive flow meters | |
| EP3327406B1 (en) | Method for operating a coriolis mass flow meter and coriolis mass flow meter | |
| DE102017213084A1 (en) | Method and device for safe flow measurement | |
| EP3559604B1 (en) | Method for operating a magneto-inductive flow meter and such a flow meter | |
| DE102020123945B4 (en) | Method for operating a magnetic-inductive flowmeter and corresponding magnetic-inductive flowmeter | |
| EP1363108B1 (en) | Method to determine the uncertainty of a magnetic inductive flow meter | |
| WO2021069192A1 (en) | Method for monitoring a measuring device system | |
| DE10335205A1 (en) | Method for the magnetic-inductive determination of the flow rate of a medium | |
| DE102011050716B4 (en) | Method and device for the online measurement of the viscosity of a fluid | |
| WO2010091700A1 (en) | Method for the operation of a coriolis mass flowmeter, and coriolis mass flowmeter | |
| EP3208598A1 (en) | Method for operating a coriolis mass flow measuring device | |
| WO2014206923A1 (en) | Method for avoiding pulsation-related measurement errors when determining the mass flow | |
| EP4296626A1 (en) | Method for operating a magnetic-inductive flow meter and a corresponding magnetic-inductive flow meter | |
| DE10256103A1 (en) | Method for determining the uncertainty of a measuring method using a measuring frequency |
Legal Events
| Date | Code | Title | Description |
|---|---|---|---|
| STAA | Information on the status of an ep patent application or granted ep patent |
Free format text: STATUS: UNKNOWN |
|
| STAA | Information on the status of an ep patent application or granted ep patent |
Free format text: STATUS: THE INTERNATIONAL PUBLICATION HAS BEEN MADE |
|
| PUAI | Public reference made under article 153(3) epc to a published international application that has entered the european phase |
Free format text: ORIGINAL CODE: 0009012 |
|
| STAA | Information on the status of an ep patent application or granted ep patent |
Free format text: STATUS: REQUEST FOR EXAMINATION WAS MADE |
|
| GRAP | Despatch of communication of intention to grant a patent |
Free format text: ORIGINAL CODE: EPIDOSNIGR1 |
|
| STAA | Information on the status of an ep patent application or granted ep patent |
Free format text: STATUS: GRANT OF PATENT IS INTENDED |
|
| 17P | Request for examination filed |
Effective date: 20231219 |
|
| AK | Designated contracting states |
Kind code of ref document: A1 Designated state(s): AL AT BE BG CH CY CZ DE DK EE ES FI FR GB GR HR HU IE IS IT LI LT LU LV MC MK MT NL NO PL PT RO RS SE SI SK SM TR |
|
| INTG | Intention to grant announced |
Effective date: 20240319 |
|
| GRAS | Grant fee paid |
Free format text: ORIGINAL CODE: EPIDOSNIGR3 |
|
| GRAA | (expected) grant |
Free format text: ORIGINAL CODE: 0009210 |
|
| STAA | Information on the status of an ep patent application or granted ep patent |
Free format text: STATUS: THE PATENT HAS BEEN GRANTED |
|
| AK | Designated contracting states |
Kind code of ref document: B1 Designated state(s): AL AT BE BG CH CY CZ DE DK EE ES FI FR GB GR HR HU IE IS IT LI LT LU LV MC MK MT NL NO PL PT RO RS SE SI SK SM TR |
|
| DAV | Request for validation of the european patent (deleted) | ||
| DAX | Request for extension of the european patent (deleted) | ||
| REG | Reference to a national code |
Ref country code: CH Ref legal event code: EP |
|
| REG | Reference to a national code |
Ref country code: DE Ref legal event code: R096 Ref document number: 502022001583 Country of ref document: DE |