EP4332579A1 - Dispositif d'analyse automatique - Google Patents
Dispositif d'analyse automatique Download PDFInfo
- Publication number
- EP4332579A1 EP4332579A1 EP22795205.8A EP22795205A EP4332579A1 EP 4332579 A1 EP4332579 A1 EP 4332579A1 EP 22795205 A EP22795205 A EP 22795205A EP 4332579 A1 EP4332579 A1 EP 4332579A1
- Authority
- EP
- European Patent Office
- Prior art keywords
- output information
- data
- internal standard
- substance
- measured
- Prior art date
- Legal status (The legal status is an assumption and is not a legal conclusion. Google has not performed a legal analysis and makes no representation as to the accuracy of the status listed.)
- Pending
Links
- 238000004458 analytical method Methods 0.000 title description 4
- 239000000126 substance Substances 0.000 claims abstract description 116
- 230000002159 abnormal effect Effects 0.000 claims abstract description 40
- 238000001514 detection method Methods 0.000 claims abstract description 32
- 230000008859 change Effects 0.000 claims abstract description 24
- 230000002123 temporal effect Effects 0.000 claims abstract description 24
- 238000003745 diagnosis Methods 0.000 claims abstract description 19
- 238000000034 method Methods 0.000 claims abstract description 18
- 239000000523 sample Substances 0.000 claims description 105
- 239000003153 chemical reaction reagent Substances 0.000 claims description 70
- 238000005259 measurement Methods 0.000 claims description 51
- 238000000926 separation method Methods 0.000 claims description 41
- 230000014759 maintenance of location Effects 0.000 claims description 27
- 238000004128 high performance liquid chromatography Methods 0.000 claims description 24
- 238000012423 maintenance Methods 0.000 claims description 20
- 238000002360 preparation method Methods 0.000 claims description 10
- 238000011088 calibration curve Methods 0.000 claims description 9
- 238000011109 contamination Methods 0.000 claims description 4
- 238000004891 communication Methods 0.000 claims description 2
- 230000005856 abnormality Effects 0.000 abstract description 67
- 230000008569 process Effects 0.000 abstract description 8
- 150000002500 ions Chemical class 0.000 description 33
- 238000011002 quantification Methods 0.000 description 23
- 239000007788 liquid Substances 0.000 description 18
- 238000003908 quality control method Methods 0.000 description 18
- 238000006243 chemical reaction Methods 0.000 description 17
- 238000007781 pre-processing Methods 0.000 description 16
- 239000000758 substrate Substances 0.000 description 16
- 238000012544 monitoring process Methods 0.000 description 14
- 238000012797 qualification Methods 0.000 description 14
- 238000007599 discharging Methods 0.000 description 12
- 238000012545 processing Methods 0.000 description 12
- 230000032258 transport Effects 0.000 description 11
- 238000010586 diagram Methods 0.000 description 10
- 239000000356 contaminant Substances 0.000 description 8
- 230000007547 defect Effects 0.000 description 8
- 239000000243 solution Substances 0.000 description 8
- 238000004140 cleaning Methods 0.000 description 7
- 230000007246 mechanism Effects 0.000 description 7
- 150000003839 salts Chemical class 0.000 description 7
- 239000002904 solvent Substances 0.000 description 7
- 239000011324 bead Substances 0.000 description 6
- 230000000875 corresponding effect Effects 0.000 description 6
- 238000000605 extraction Methods 0.000 description 6
- 238000004811 liquid chromatography Methods 0.000 description 5
- 238000004949 mass spectrometry Methods 0.000 description 5
- 238000005406 washing Methods 0.000 description 5
- 230000002950 deficient Effects 0.000 description 4
- 230000006866 deterioration Effects 0.000 description 4
- 238000002347 injection Methods 0.000 description 4
- 239000007924 injection Substances 0.000 description 4
- 238000007726 management method Methods 0.000 description 4
- 238000010926 purge Methods 0.000 description 4
- 238000003759 clinical diagnosis Methods 0.000 description 3
- 238000001556 precipitation Methods 0.000 description 3
- 230000004044 response Effects 0.000 description 3
- 239000002699 waste material Substances 0.000 description 3
- USFZMSVCRYTOJT-UHFFFAOYSA-N Ammonium acetate Chemical compound N.CC(O)=O USFZMSVCRYTOJT-UHFFFAOYSA-N 0.000 description 2
- IJGRMHOSHXDMSA-UHFFFAOYSA-N Atomic nitrogen Chemical compound N#N IJGRMHOSHXDMSA-UHFFFAOYSA-N 0.000 description 2
- 230000009471 action Effects 0.000 description 2
- 230000005540 biological transmission Effects 0.000 description 2
- 230000010485 coping Effects 0.000 description 2
- 230000002596 correlated effect Effects 0.000 description 2
- 229910001873 dinitrogen Inorganic materials 0.000 description 2
- 239000012634 fragment Substances 0.000 description 2
- 230000010354 integration Effects 0.000 description 2
- BDAGIHXWWSANSR-UHFFFAOYSA-N methanoic acid Natural products OC=O BDAGIHXWWSANSR-UHFFFAOYSA-N 0.000 description 2
- 230000002035 prolonged effect Effects 0.000 description 2
- 239000007921 spray Substances 0.000 description 2
- 230000003068 static effect Effects 0.000 description 2
- 238000012360 testing method Methods 0.000 description 2
- OSWFIVFLDKOXQC-UHFFFAOYSA-N 4-(3-methoxyphenyl)aniline Chemical compound COC1=CC=CC(C=2C=CC(N)=CC=2)=C1 OSWFIVFLDKOXQC-UHFFFAOYSA-N 0.000 description 1
- QGZKDVFQNNGYKY-UHFFFAOYSA-O Ammonium Chemical compound [NH4+] QGZKDVFQNNGYKY-UHFFFAOYSA-O 0.000 description 1
- 239000005695 Ammonium acetate Substances 0.000 description 1
- 102000009123 Fibrin Human genes 0.000 description 1
- 108010073385 Fibrin Proteins 0.000 description 1
- BWGVNKXGVNDBDI-UHFFFAOYSA-N Fibrin monomer Chemical compound CNC(=O)CNC(=O)CN BWGVNKXGVNDBDI-UHFFFAOYSA-N 0.000 description 1
- 235000019257 ammonium acetate Nutrition 0.000 description 1
- 229940043376 ammonium acetate Drugs 0.000 description 1
- 239000012491 analyte Substances 0.000 description 1
- 239000002246 antineoplastic agent Substances 0.000 description 1
- 230000006399 behavior Effects 0.000 description 1
- 239000012472 biological sample Substances 0.000 description 1
- 238000004364 calculation method Methods 0.000 description 1
- 230000001276 controlling effect Effects 0.000 description 1
- 230000001934 delay Effects 0.000 description 1
- 230000000694 effects Effects 0.000 description 1
- 238000010828 elution Methods 0.000 description 1
- 229950003499 fibrin Drugs 0.000 description 1
- 235000019253 formic acid Nutrition 0.000 description 1
- 239000007789 gas Substances 0.000 description 1
- 230000036541 health Effects 0.000 description 1
- 229960003444 immunosuppressant agent Drugs 0.000 description 1
- 230000001861 immunosuppressant effect Effects 0.000 description 1
- 239000003018 immunosuppressive agent Substances 0.000 description 1
- 239000012535 impurity Substances 0.000 description 1
- 238000001727 in vivo Methods 0.000 description 1
- 238000004895 liquid chromatography mass spectrometry Methods 0.000 description 1
- 230000007774 longterm Effects 0.000 description 1
- 238000000691 measurement method Methods 0.000 description 1
- 208000030159 metabolic disease Diseases 0.000 description 1
- 239000000825 pharmaceutical preparation Substances 0.000 description 1
- 229940127557 pharmaceutical product Drugs 0.000 description 1
- 230000000704 physical effect Effects 0.000 description 1
- 238000003672 processing method Methods 0.000 description 1
- 230000009467 reduction Effects 0.000 description 1
- 230000003252 repetitive effect Effects 0.000 description 1
- 238000013215 result calculation Methods 0.000 description 1
- 239000013076 target substance Substances 0.000 description 1
- 229940126585 therapeutic drug Drugs 0.000 description 1
- 238000011144 upstream manufacturing Methods 0.000 description 1
- 238000010200 validation analysis Methods 0.000 description 1
Images


Classifications
-
- G—PHYSICS
- G01—MEASURING; TESTING
- G01N—INVESTIGATING OR ANALYSING MATERIALS BY DETERMINING THEIR CHEMICAL OR PHYSICAL PROPERTIES
- G01N35/00—Automatic analysis not limited to methods or materials provided for in any single one of groups G01N1/00 - G01N33/00; Handling materials therefor
- G01N35/00584—Control arrangements for automatic analysers
- G01N35/00594—Quality control, including calibration or testing of components of the analyser
-
- G—PHYSICS
- G01—MEASURING; TESTING
- G01N—INVESTIGATING OR ANALYSING MATERIALS BY DETERMINING THEIR CHEMICAL OR PHYSICAL PROPERTIES
- G01N30/00—Investigating or analysing materials by separation into components using adsorption, absorption or similar phenomena or using ion-exchange, e.g. chromatography or field flow fractionation
- G01N30/02—Column chromatography
- G01N30/86—Signal analysis
-
- G—PHYSICS
- G01—MEASURING; TESTING
- G01N—INVESTIGATING OR ANALYSING MATERIALS BY DETERMINING THEIR CHEMICAL OR PHYSICAL PROPERTIES
- G01N35/00—Automatic analysis not limited to methods or materials provided for in any single one of groups G01N1/00 - G01N33/00; Handling materials therefor
- G01N35/00584—Control arrangements for automatic analysers
- G01N35/00722—Communications; Identification
- G01N2035/00891—Displaying information to the operator
- G01N2035/009—Displaying information to the operator alarms, e.g. audible
Definitions
- the present invention relates to an automatic analyzer.
- HPLC/MS liquid chromatograph mass spectrometer
- HPLC/MS liquid chromatograph mass spectrometer
- the liquid chromatograph mass spectrometer (HPLC/MS) is capable of performing qualification/quantification of the substance to be measured even in the case of co-existence of many analogous substances metabolized in vivo like a pharmaceutical product in the biological sample. Accordingly, application of the HPLC/MS to the clinical examination field has been expected.
- the liquid chromatograph mass spectrometer (HPLC/MS) has been used for examining an immunosuppressant, an anticancer agent, a neonate metabolic disorder testing, a TDM (Therapeutic Drug Monitoring), and the like.
- the automatic analyzer is required to assure robustness of the device by diagnosing the operation abnormality and the failure state at an earlier stage, or performing the prediction at the earlier stage to execute the predictive diagnosis for the maintenance work such as adjustment and replacement of the automatic analyzer and the component.
- Execution of the predictive diagnosis secures to minimize a sudden stop of operations owing to failure and defect of the device or the component, financial damages owing to the mechanical loss, or damages to health and life of the operator or the user of the device.
- the following technique has been known as the predictive diagnosis executed by the automatic analyzer.
- Patent Literature 1 discloses a clinical diagnosis system (100) which includes a sample preparation module (20) for automatically preparing the sample, a liquid chromatography (LC) separation module (30) to be combined with the sample preparation module (20) by a sample preparation/LC interface (40), a mass spectrometer (MS) module (50) to be combined with the LC separation module (30) by an LC/MS interface (60), a result calculation module (70) for identification and/or quantification of a target analyte or a target substance which is contained in the sample, and caused to pass through the LC separation module (30) and the MS module (50), and a control unit (80).
- LC liquid chromatography
- MS mass spectrometer
- the control unit (80) monitors a predetermined set of operation parameters (1 to n) each indicating a performance state of the clinical diagnosis system (100). Upon every deviation of one or more parameters (1 to n) of the predetermined set of the operation parameters (1 to n) from the specification, the control unit is programmed to activate the quality control process and/or the maintenance process. The control unit is further programmed to minimize the quality control process and/or the maintenance process so long as the set of the operation parameters (1 to n) is kept within the specification.
- Patent Literature 2 discloses a clinical sample processing device which can be connected to an externally provided maintenance managing device via a network.
- the clinical sample processing device includes a sample processing unit for processing the sample by causing the respective mechanisms to perform predetermined operations, a comparison unit for comparing a numerical value based on an operation detection signal indicating a predetermined operation of each mechanism with a threshold value as a reference based on which it is determined whether or not the predetermined operation is in a normal state, and a transmission unit.
- the transmission unit transmits failure predication information indicating a higher possibility of failure of the mechanism in the future than the one in the normal state to the maintenance managing device via the network.
- Patent Literature 1 based on the QC and the maintenance operations upon deviation of one or more predetermined parameters from the specification as a trigger, the program for monitoring a set of one or more predetermined operation parameters is controlled to minimize the QC and the maintenance operations to be within the specification upon deviation of one or more predetermined parameters from the specification.
- the QC and the maintenance operations are set as the trigger, the measurement using the sample has to be performed to monitor the set of the predetermined operation parameters.
- the program is designed to bring those parameters to be within the specification for each measurement, the temporal change information across the measurements cannot be processed.
- Patent Literature 2 includes the comparison unit which compares the numerical value based on the operation detection signal indicating the predetermined operation of each mechanism with the threshold value as the reference for determination whether or not the predetermined operation is in the normal state. If the numerical value based on the operation detection signal indicating the predetermined operation of any one of the mechanisms exceeds the threshold value, failure prediction information is output for indicating the higher possibility of failure of the mechanism in the future than the one in the normal state. Based on the numerical value of the signal output by the sensor in the device, and the processing completion time, the device outputs signals to the maintenance management device based on the two-step determination criteria. Specifically, when the value exceeds the first threshold value, a "warning" is transmitted.
- an "abnormal state" is transmitted.
- the value output from each sensor in the device is used as a determination factor with respect to the "warning" or "abnormal state” without using the information originated from the output value of data from the detection unit (MS) as the determination factor. Accordingly, the failure prediction accuracy needs to be further improved.
- the temporal change information across the measurements cannot be processed.
- the present invention has been made in light of the above-described circumstances. It is an object of the present invention to provide an automatic analyzer capable of quickly responding to occurrence of an abnormal process, accurately grasping an abnormal state, and reducing frequencies of early abnormality diagnosis and component adjustment or replacement of the device.
- an automatic analyzer includes an analyzer having a separation unit configured to perform separation of a sample to be measured subjected to a pretreatment, and a detection unit configured to detect a substance to be measured of the sample separated by the separation unit, and a control device configured to control an operation of the analyzer.
- the control device includes a data alarm database that stores data output information including at least one item generated based on a detection result of the sample of the analyzer, a normal data alarm database that stores predetermined reference data output information to determine whether the data output information is in a normal state or in an abnormal state, a data alarm determination unit configured to compare the data output information of the data alarm database with the reference data output information of the normal data alarm database and apply a data alarm to an item of the data output information of the data alarm database determined to be in an abnormal state, a system alarm database that stores system output information including at least one item generated based on a detection result from a sensor provided in the analyzer, a normal system alarm database that stores predetermined reference system output information to determine whether the system output information is in a normal state or in an abnormal state, and a system alarm determination unit configured to compare the system output information of the system alarm database with the reference system output information of the normal system alarm database and apply a data alarm to an item of the data output information of the system alarm database determined to be in an abnormal state.
- the control device is configured to execute a predictive diagnosis of a failure state of the automatic analyzer based on a temporal change of the data output information that is obtained by the analyzer using an internal standard substance as the sample and is stored in the data alarm database and a temporal change of the system output information of the system alarm database.
- the present invention allows quick response to occurrence of an abnormal process, accurate grasping of an abnormal state, and reduction in frequencies of early abnormality diagnosis and component adjustment or replacement of the device.
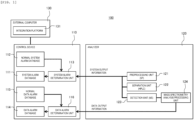
- FIG. 1 is a functional block diagram schematically showing an overall configuration of an automatic analyzer according to an embodiment.
- an automatic analyzer 100 mainly includes a control device 110, an analyzer 120, and an external computer 130.
- the analyzer 120 includes a preprocessing unit (SP) 121, a separation u nit (HPLC) 122, a detection unit (MS) 123, and a mass spectrometry analysis processing unit 124.
- SP preprocessing unit
- HPLC separation u nit
- MS detection unit
- mass spectrometry analysis processing unit 124 The analyzer 120 includes a preprocessing unit (SP) 121, a separation u nit (HPLC) 122, a detection unit (MS) 123, and a mass spectrometry analysis processing unit 124.
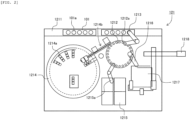
- FIG. 2 is a top view schematically showing an example of a configuration of a preprocessing unit.
- the preprocessing unit (SP) 121 includes a sample transport unit 1211 which transports a sample container rack 101 having multiple sample containers 101a each storing a sample or a specimen to be measured mounted thereon to a dispensation position, a reaction disk unit 1212 provided with multiple reaction containers 1212a where a magnetic bead and a reagent are added to the sample which contains the substance to be measured for reaction, a sample probe 1213 which dispenses (aspires/discharges) the sample in the sample container 101a on the sample container rack 101 which has been transported to the dispensation position to the reaction container 1212a of the reaction disk unit 1212, a reagent disk unit 1214 which holds a reagent container 1214a for storing the magnetic bead and the reagent, a reagent dispensing unit 1214b which dispenses (aspires/discharges) the magnetic bead and the reagent to the reaction disk unit 1212, a reagent container holding unit
- FIG. 3 is a diagram schematically showing an example of a configuration of a separation unit.
- the separation unit (HPLC) 122 has multiple streams (three streams in the embodiment, for example), that is, HPLC1 stream 1222, HPLC2 stream 1223, HPLC3 stream 1224 for improving throughput, and includes an input side stream select valve 1225 positioned in a preceding stage of the respective streams for switching among the streams, and an output side stream select valve 1226 positioned in a subsequent stage of the respective streams for switching among the streams and connection to the detection unit (MS) 123 in the subsequent stage of the respective streams.
- MS detection unit
- the streams 1222, 1223, 1224 include pump units 1222a, 1223a, 1224a for feeding solvents and reagents to a flow passage, sample introduction units 1222b, 1223b, 1224b for introducing the sample transferred from the preprocessing unit (SP) 121 to the flow passage, and separation columns 1222c, 1223c, 1224c for separating the sample, respectively.
- a system reagent unit 1221 capable of selecting the reagent to be used from multiple reagents is provided at the upstream side of the input side stream select valve 1225.
- Each of the pump units 1222a, 1223a, 1224a has two cylinders driven to maintain the set flow rate, an auto purge valve for switching between the flow passage and the waste liquid to remove air in the flow passage, and a pump pressure sensor for monitoring pressure in the flow passage.
- Each of the sample introduction units 1222b, 1223b, 1224b includes an injection valve provided in each stream for switching between a liquid feed passage from the pump and the flow passage from the syringe, a sample loop connected to the injection valve, a syringe for aspirating/discharging the sample, and a syringe pressure sensor for monitoring the aspiration/discharging state of the syringe.
- the sample transported from the preprocessing unit (SP) 121 is transported to a sample aspiration position at each stream in the separation unit transport unit 1218. After aspiration, the sample is transported to a waste liquid aspiration position common to the respective streams so that the solution remained in the sample container is aspired/discharged by a waste liquid probe.
- the separation columns 1222c, 1223c, 1224c are held in column cartridges, respectively each provided with a heat conduction block at a lower part.
- the column cartridge has its temperature controlled in a column oven having a heater, a heat block and a thermistor for sensing the temperature.
- the column cartridge is fixed at a given position in the column oven, and monitored by a position sensor.
- the system reagent unit 1221 includes a lifter for mounting each reagent bottle onto a normal position, and a weight sensor for monitoring an amount of the reagent in each reagent bottle.
- the system reagent unit 1221 includes a lifter for mounting the reagent bottle, and the weight sensor for monitoring an amount of the reagent in the reagent bottle.
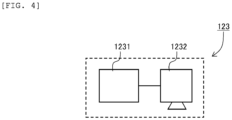
- FIG. 4 is a diagram schematically showing an example of a configuration of a detection unit.
- the detection unit (MS) 123 includes an ion source unit 1231 and a mass spectrometer 1232.
- the mass spectrometer 1232 generates data of signal intensity (area) having a specific m/z (mass/charge number) counted by the detector.
- SP preprocessing unit
- an internal standard substance is added to the sample which contains the substance to be measured to generate the data of signal intensities corresponding to the m/z of the substance to be measured and the m/z of the internal standard substance.
- the mass spectrometer 1232 performs measurement of the known internal standard substance added to several substances to be measured at different known concentrations.
- a calibration curve is then prepared preliminarily by plotting the concentration of the substance to be measured on the horizontal axis, and the ratio of the signal intensity (area) corresponding to those of the substance to be measured and the internal standard substance on the vertical axis.
- the concentration of the substance to be measured is calculated from the preliminarily prepared calibration curve, and the ratio of the signal intensity (area) corresponding to data of those to the m/z of the substance to be measured and the m/z of the internal standard substance, both of which have been generated by the mass spectrometer 1232.
- An output of the detection unit (MS) 123 is transmitted to the mass spectrometry analysis processing unit 124.
- a peak fitting is performed with reference to the signal intensity (area) information having the specific m/z (mass/charge number) counted by the detector to generate data output information.
- a function of the mass spectrometry analysis processing unit 124 is implemented using software which runs on the detection unit (MS) 123, for example.
- the data output information includes:
- the data output information is not limited to those as described above.
- the control device 110 for controlling an operation of the analyzer 120 includes a data alarm database 114 which stores "data output information" generated by the analyzer 120, a normal data alarm database 115 which stores normal state data information, a data alarm determination unit 116, a system alarm database 111 which stores "system output information” generated by the analyzer 120, a normal system alarm database 112 which stores normal state system alarm information, and a system alarm determination unit 113.
- the data output information from the analyzer 120 is transferred to the control device 110, and compared with the normal data alarm database 115 by the data alarm determination unit 116.
- the data output information deviating from the threshold value is determined as an abnormal value, and stored in the data alarm database 114.
- the user is notified of the data alarm affixed to the examination result. At this time, the user confirms the data to determine whether the re-examination is necessary.
- the data alarm may have a specific item to be subjected to automatic re-measurement.
- the system output information from the analyzer 120 is transferred to the control device 110, and compared with the normal system alarm database 112 which stores the normal system alarm information by the system alarm determination unit 113.
- the system output information deviating from the threshold value is determined as an abnormal value, and stored in the system alarm database 111. The user is notified of the system alarm.
- the external computer 130 accurately grasps the abnormal state from the information of the system alarm database 111 and the data alarm database 114, which has been determined as having abnormality by the control device 110. This makes it possible to perform early abnormality diagnosis of the device, and to determine execution of adjustment/replacement of components.
- the external computer 130 includes an integration platform 131 built by the user, and connected to clinical examination devices of various types to share the information relating to the early abnormality diagnosis of device, and adjustment/replacement of components.
- the data alarm database 114 applies a data alarm to a determination item determined as being abnormal.
- FIG. 5 is a flowchart showing contents of an analysis operation of the automatic analyzer.
- the automatic analyzer 100 executes the "start-up step” by turning power ON to activate the respective devices for confirming communication between the analyzer 120 and the control device 110, and each state of the sensors and consumables (step S100).
- the "pre-measurement preparation step” is executed, in which a user or a service person selects the maintenance item, and conducts the selected maintenance (step S110).
- the "main measurement step” is executed for performing a calibration measurement, a QC measurement, and a sample measurement (step S120).
- the "standby step” is executed for making the process standby until start of the next main measurement step (step S121).
- step S130 When turning the automatic analyzer 100 OFF at the end of the main measurement in step S120, the "post-measurement preparation step” (step S130) is executed to prepare for turning the device OFF. The power is turned OFF to execute “shutdown step” for shutting down each device (step S140).
- the calibration measurement signal intensity data to the m/z of the substance to be measured and the m/z of the internal standard substance are generated.
- the mass spectrometer measures several substances to be measured at different known concentrations each added with the known internal standard substance to preliminarily prepare the calibration curve by plotting the concentration of the substance to be measured on the horizontal axis, and the ratio of signal intensity (area) corresponding to each one of the substance to be measured and the internal standard substance on the vertical axis.
- the concentration of the substance to be measured is calculated from the preliminarily prepared calibration curve, and the ratio of the signal intensity (area) corresponding to data of signal intensity (area) to the m/z of the substance to be measured and the m/z of the internal standard substance, which have been generated by the mass spectrometer.
- the QC measurement is executed for management of accuracy, specifically, assuring that the measurement result exhibits correctness (accuracy), and the results of repetitive measurements hardly fluctuate (precision) so long as the sample is kept unchanged.
- the accuracy management is performed to assure that the measurement results are accurate, and to prove validity of the measurement method and the management method based on the measurement result record.
- the QC measurement is performed using the QC sample at the known concentration.
- the concentration is calculated using the calibration curve of the calibration measurement having the generated result preliminarily acquired. It is evaluated whether the calculated concentration is within a specified value. In the series of the process steps, validation is made whether the calculated concentration value is effective.
- the sample measurement can be started after the effective state of the device has been confirmed by the calibration measurement and the QC measurement.
- the concentration of the substance to be measured is calculated from the calibration curve generated by the calibration measurement, and the ratio of signal intensity (area) corresponding to data of signal intensity (area) to the m/z of the substance to be measured and the m/z of the internal standard substance, which have been generated by the mass spectrometer.
- the data output information is transferred to the control device 110, and compared with the normal data alarm database 115 so that the data output information deviating from the threshold value is determined as an abnormal value, and stored in the data alarm database 114.
- the user is notified of the data alarm affixed to the examination result. The user confirms the data to determine whether the re-examination is necessary.
- the automatic analyzer 100 executes detection of abnormality such as insufficient reagent, clogging with reagent, reading defect of RFID, and the like based on the information output by each sensor or software count from the start of measurement.
- the system output information of the preprocessing unit (SP) 121 includes an aspiration position error owing to abnormality in the position sensor, which occurs during driving of the sample probe 1213, the reagent dispensing unit 1214b, and the washing probe 1216, and a clogging detection error owing to abnormality in the pressure sensor, which occurs during aspiration/discharging of the sample or the reagent.
- the information also includes an aspiration/discharging position error owing to abnormality in the position sensor, which occurs during driving of the sample transport unit 1211, the reaction disk unit 1212, the cleaning unit 1217, and the separation unit transport unit 1218, and a temperature abnormality error owing to abnormality in the temperature sensor of the reaction disk unit.
- an aspiration/discharging position error owing to abnormality in the position sensor, which occurs during driving of the sample transport unit 1211, the reaction disk unit 1212, the cleaning unit 1217, and the separation unit transport unit 1218
- a temperature abnormality error owing to abnormality in the temperature sensor of the reaction disk unit.
- the system output information of the separation unit (HPLC) 122 includes errors in the pump cylinder position and the valve position owing to abnormality in the position sensor, which occurs during driving of the pump cylinder, the injection valve, the auto purge valve, the input side stream select valve 1225, the output side stream select valve 1226, and the like.
- Each of the pump units 1222a, 1223a, 1224a is provided with the pump pressure sensor for monitoring the pressure in the flow passage for detecting pressure abnormality, for example, clogging in the flow passage, leakage, and the like.
- the system reagent unit 1221 has the position sensor for detecting the position at which abnormality in the lifter has occurred.
- the weight sensor is provided at a lower part of each reagent bottle mounted on the system reagent unit 1221, and monitors each amount of reagent in the respective reagent bottles. If the amount of reagent becomes smaller than the specified value, the weight sensor detects insufficiency of the reagent.
- the thermistor senses each surface temperature of the heater, the heat block, and the separation column. When the temperature is equal to or higher than the threshold value, temperature abnormality is detected.
- a column position error is caused by abnormality in the position sensor for detecting the position of the column cartridge in the column oven. Fluctuation in the syringe pressure during driving of the syringe for aspiration/discharging of the sample is monitored. Abnormality in the pressure results in clogging abnormality in the syringe, and leakage abnormality.
- the electro-spray ionizing method is implemented for the ion source unit 1231 of the detection unit (MS) 123 to apply high-temperature, high-voltage, high current to the liquid feed passage from the separation unit (HPLC) 122 while feeding liquid through the piping with diameter of several hundreds of ⁇ m in the solution filled in the ion source unit 1231.
- the probe piping of double piping type has its center fed with solution. Nitrogen gas is sprayed into the piping at the outer side, and sprayed to the outside of the piping to improve the ionization efficiency.
- Each of the temperature, voltage value, and the current value is monitored. When each value becomes equal to or larger than the threshold value, abnormalities in the temperature, voltage value, and current value are detected.
- the flow passage of the nitrogen gas is monitored. Abnormality is detected upon deviation from the threshold value.
- a triple-quadrupole type mass spectrometer is used for the mass spectrometer 1232, and includes a filter Q0 for converging ions ionized in the ion source to separate impurities, a filter Q1 as an ion filter for adding only the mass number of the specific m/z, a filter Q2 for generating a fragment ion through collision of gas and ions, a filter Q3 for adding only the specific fragment ion, and the detection unit.
- a filter Q0 for converging ions ionized in the ion source to separate impurities
- a filter Q1 as an ion filter for adding only the mass number of the specific m/z
- a filter Q2 for generating a fragment ion through collision of gas and ions
- a filter Q3 for adding only the specific fragment ion
- the system alarm database 111 applies a system alarm to a determination item determined as being abnormal.
- the determination item and the determination method are not limited to those described above.
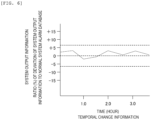
- the control device 110 acquires the system output information with time, and displays the temporal change system output information on a not shown display device.
- a graph is displayed on the display screen of the display device by plotting the temporal change information on the horizontal axis, and the system output information on the vertical axis.
- the vertical axis indicates the ratio of deviation derived from comparison between the normal system alarm database 112 and the system output information.
- FIG. 6 to FIG. 8 are diagram showing an example of the display screen displayed on the display device.
- FIG. 6 represents a relationship between the temporal change information and the system output information, having the horizontal axis (time axis) set in the unit of an hour.
- FIG. 7 represents the relationship having the horizontal axis (time axis) set in the unit of a day.
- Fig. 8 represents the relationship having the horizontal axis (time axis) set in the unit of a month.
- FIG. 6 to FIG. 8 represent exemplary cases of abnormality in the syringe pressure sensor.
- the plot interval on the horizontal axis may be displayed with the whole data, data in the unit of a day, and data in the unit of a month so that the state of the syringe pressure sensor can be confirmed.
- the deviation of the system output information accounting for ⁇ 20% in comparison with the normal system alarm database 112 corresponds to a threshold value in the normal range. If the value deviates from the threshold value, the system output information is determined as an abnormal value, and stored in the system alarm database 111. The system alarm is generated to allow the user to respond in accordance with the processing method to be generated concurrently with the system alarm.
- Another system output information can be displayed on the screen by plotting the deviation ratio of the system output information in comparison with the normal system alarm database 112 on the vertical axis, and the temporal change information on the horizontal axis. This allows grasping of the temporal change in each state of the respective pieces of the system output information.
- abnormality is detected by comparing the system output information value of each sensor at a certain time with the normal system alarm database. Based on the temporal change information, the component is timely adjusted or replaced to reduce the downtime of the device, caused by the device failure.
- the timing for adjusting or replacing the component, and a defective point of the device may be grasped based on each information or combined information of the data alarm database 114 for storing the data output information generated by the analyzer 120 in addition to the system alarm database 111 for storing the system output information generated by the analyzer 120 so that the predictive diagnosis is performed. This makes it possible to reduce the downtime of the device, caused by the device failure.
- Each of the pump units 122a, 1223a, 1224a includes two cylinders driven to maintain the set flow rate, an auto purge valve for switching between the flow passage and liquid wasting to remove air in the flow passage, and the pump pressure sensor for monitoring the pressure in the flow passage to detect pressure abnormality in the flow passage downstream from the pump units 122a, 1223a, 1224a.
- the pressure sensor provided for each syringe is capable of detecting clogging in the flow passage and the component such as the valve in the subsequent stage of the pump units 122a, 1223a, 1224a.
- the pressure curve information is output in the gradient program for the pump liquid feeding in the "measurement preparation operation".
- the threshold value is set to 80 MPa because of the risk of component deterioration or leakage when pressure resistance at the pump seal in the pump or the connection portion becomes excessive. In excess of the threshold value, the system alarm is generated to stop the device.
- the pressure curve is different from the one in the normal state, for example, the quick rise in the pressure curve, it is suspected that clogging is started in the flow passage, the connection portion, or the column body. In the case of the rise delay, it is suspected that leakage occurs owing to deterioration in the flow passage, the connection portion, or the column (dead volume). If the static pressure value is higher than the one in the normal state, clogging caused by pressure is suspected. If the static pressure value is low, leakage is suspected. In this case, a data alarm is generated.
- the retention time of the internal standard substance Focusing on the retention time of the internal standard substance, if the retention time is shorter than the one in the normal condition, the defective liquid feeding function of the pump is suspected (flow rate higher than the set value). If the retention time is longer than the one in the normal condition, it is suspected that the liquid feeding function of the pump is defective (flow rate lower than the set value), and the flow passage, the connection portion, or the column is deteriorated (dead volume). In this case, the data alarm is generated. In this case, the data alarm is generated.
- the pump pressure can be possibly correlated with the retention time. In such a case, the cause of the defect can be easily identified. If the system sensor information of the pressure sensor value is only extracted, the user is allowed to recognize abnormality in the device. In response to the abnormality, however, it is difficult for the user to locate the specific point. Thus, the user has to ask the service person to take action against the abnormality in the end, resulting in prolonged downtime of the device. Extraction of the information in association with the data alarm of the retention time information and the pressure curve information simplifies the coping method. Extraction of the temporal change information of overpressure as the system alarm information, and the retention time and the pressure curve information as the data alarm information allows grasping of a daily state of the device.
- the user implements the maintenance menu to estimate the clogged portion caused by pressure. After locating the clogged portion caused by pressure, the item which can be handled by the user is implemented, for example, replacement of the probe of the ion source, or the component. Otherwise the service person implements the component replacement.
- the user implements replacement of the column as the maintenance menu. As the temporal change information has been acquired, the information indicating that the pressure curve information and the retention time are changing with time is displayed on the GUI to clearly notify the user of such information.
- the solution which contains the internal standard substance is fed from the separation unit (HPLC) 122, and applied with high temperature, high voltage, high current in the ion source for ionization.
- the solution which contains the internal standard substance includes such salt as a formic acid, ammonium acetate, ammonium, and the like.
- the ammonium acetate salt as a volatile substance, and a contaminant may be precipitated.
- the contaminant is expected to be originated from a solvent of the HPLC, the component constituting the flow passage, especially, plastic member, and the component concentrated in the separation column.
- the probe of the ion source is regularly cleaned with a cleaning solution to reduce the risk of precipitation. Long-term continuous use may cause precipitation of salts.
- precipitation of the salt and the contaminant on the probe surface of the ion source, or the counter plate at the inlet of the ion source prevents the applied voltage from reaching the set value.
- the signal is detected, which is originated from the salt having the same m/z as that of the internal standard substance output from the detection unit (MS), and the contaminant.
- the peak of the internal standard substance is concentrated in the separation columns 1222c, 1223c, 1224c of the separation unit (HPLC) 122.
- HPLC separation unit
- the peak of the internal standard substance undergoes obstruction of ionization.
- the resultant peak intensity becomes lower than the intrinsic peak intensity.
- the signal originated from the salt having the same m/z as that of the internal standard substance and the contaminant, which has been output from the detection unit (MS) is always detected in a constant amount irrespective of the retention time in the form of the constant amount of background peaks. Extraction of the temporal change information of the S/N (ratio of peak intensity/background) allows grasping of the daily state of the device.
- the S/N (ratio of peak intensity/background) can be possibly correlated with the voltage of the ion source. In such a case, the cause of the defect can be easily identified. Extraction of only the system sensor information of the voltage value of the ion source as usual allows the user to recognize abnormality in the voltage of the ion source. In response to the abnormality, however, it is difficult for the user to locate the specific point. Thus, the user has to ask the service person to take action against the abnormality in the end, resulting in prolonged downtime of the device. Extraction of the information in association with the data alarm of the information on the correlation between the S/N (ratio of peak intensity/background) and the voltage of the ion source simplifies identification of the coping method.
- the service person is expected to replace the component.
- the user implements the maintenance menu for removing contaminants of the probe of the ion source, or the curtain plate at the inlet of the ion source. Comparison of the voltage value of the ion source between before and after the maintenance, and comparison of the S/N (ratio of peak intensity/background) between before and after the maintenance allow grasping of the state how the contamination source has been removed.
- Each of the sample introduction units 1222b, 1223b, 1224b includes a syringe for aspiration/discharging of the sample, and a syringe pressure sensor for monitoring the aspiration/discharging state of the syringe.
- the pressure value output from the pressure sensor upon aspiration/discharging of the syringe is compared with the normal system alarm for the sample introduction. It is then determined that abnormality has occurred. In this case, the system alarm is generated, and displayed on the GUI to notify the user of the information.
- the value is not determined as being abnormal, there may be the case of extracting the regular temporal change information indicating that the peak of the pressure value is changing stepwise.
- the data alarm is generated, and displayed on the GUI to notify the user of the information.
- the value is not determined as being abnormal, there may be the case of extracting the regular temporal change information indicating that the peak intensity (area) is changing stepwise.
- the service person is allowed to replace the component.
- the user implements the maintenance item for cleaning the sample introduction units 1222b, 1223b, 1224b from the maintenance menu. The user then checks the device, and measures the internal standard substance while monitoring the value of the syringe pressure sensor. The user compares the information on the peak intensity (area) of the internal standard substance with the normal value for restoring the state of the device.
- Each of the sample introduction units 1222b, 1223b, 1224b includes a syringe for aspiration/discharging of the sample, and a syringe pressure sensor for monitoring the aspiration/discharging state of the syringe.
- the weight sensor is provided at the lower part of each reagent bottle mounted on the system reagent unit 1221. The weight sensor monitors each amount of reagent in the respective reagent bottles. If the amount of reagent becomes smaller than the specified value, the weight sensor detects insufficiency of the reagent. When aspiring/discharging the sample, the weight sensor detects insufficiency of the reagent in the reagent bottle.
- the system alarm of "warning" is generated.
- the residual value equal to or lower than 10% influences the measurement result, the data alarm is generated.
- the residual reagent in the piping arranged from the reagent bottle to the pump passage there may be the case that several measurement results obtained from generation of the data alarm are unaffected. In other words, even if the residual value of the solvent in the reagent bottle becomes equal to or lower than 10%, the measurement results may be unaffected so long as the solvent remains downstream from the pump.
- Each of the pump units 1222a, 1223a, 1224a includes the pump pressure sensor for monitoring the pressure in the flow passage to detect the pressure abnormality in the flow passage downstream from the pump units 1222a, 1223a, 1224a.
- the pressure curve information is output in the gradient program of the pump liquid feeding in the "measurement preparation operation".
- the threshold value is set to 80 MPa because of the risk of component deterioration or leakage when the pressure resistance at the pump seal in the pump or the connection portion becomes excessive. In excess of the threshold value, the system alarm is generated to stop the device.
- the pressure curve is different from the one in the normal state, and the rise in the pressure curve delays, it is suspected that the solvent downstream from the pump is insufficient because of insufficient reagent in the reagent bottle. Focusing on the retention time of the internal standard substance, if the retention time is long, it is suspected that the solvent downstream from the pump is insufficient because of insufficient reagent in the reagent bottle.
- the data alarm is not generated to the item with respect to the relevant sample onward when the output value of the weight sensor (system reagent unit) becomes equal to or lower than 10%.
- the pressure curve exhibits the behavior different from the one in the normal state, and the retention time is longer than the threshold value, it is suspected that the solvent downstream from the pump is insufficient owing to insufficiency of the reagent in the reagent bottle. Accordingly, the data alarm is generated to the item with respect to the relevant sample onward.
- the system output information and the data output information have been described. Acquisition of the data output information taking the system output information and the internal standard substance as indexes allows grasping of the abnormal state of the device without performing the calibration measurement, the QC (Quality Control) measurement, and the sample measurement in the "main measurement operation". Specifically, before performing the "main measurement operation", the device is checked at a predetermined time interval in the "pre-measurement preparation" to be performed by the user or the service person for selecting and implementing the maintenance item. It is preferable to check the device at start-up every morning, and analyze the temporal change information of the data alarm information, taking the system alarm output in the device check, and the internal standard substance as indexes. This makes it possible to perform the predictive diagnosis of the device without wasting the calibration reagent, the QC reagent, and the sample.
- the present invention is not limited to the embodiment, and may be variously modified and combined without departing from the scope of the present invention.
- the present invention is not necessarily limited to be configured to have all the structures as described above, and may be configured to have the structure partially omitted.
- the respective structures, functions and the like may be implemented by designing those elements partially or entirely using the integrated circuit, for example.
- the respective structures, functions and the like may be implemented by software through which the processor interprets and executes the program for actualizing the respective functions.
Landscapes
- Physics & Mathematics (AREA)
- Health & Medical Sciences (AREA)
- Life Sciences & Earth Sciences (AREA)
- Chemical & Material Sciences (AREA)
- Analytical Chemistry (AREA)
- Biochemistry (AREA)
- General Health & Medical Sciences (AREA)
- General Physics & Mathematics (AREA)
- Immunology (AREA)
- Pathology (AREA)
- Engineering & Computer Science (AREA)
- Quality & Reliability (AREA)
- Automatic Analysis And Handling Materials Therefor (AREA)
Applications Claiming Priority (2)
| Application Number | Priority Date | Filing Date | Title |
|---|---|---|---|
| JP2021074742 | 2021-04-27 | ||
| PCT/JP2022/004104 WO2022230282A1 (fr) | 2021-04-27 | 2022-02-02 | Dispositif d'analyse automatique |
Publications (1)
| Publication Number | Publication Date |
|---|---|
| EP4332579A1 true EP4332579A1 (fr) | 2024-03-06 |
Family
ID=83848258
Family Applications (1)
| Application Number | Title | Priority Date | Filing Date |
|---|---|---|---|
| EP22795205.8A Pending EP4332579A1 (fr) | 2021-04-27 | 2022-02-02 | Dispositif d'analyse automatique |
Country Status (4)
| Country | Link |
|---|---|
| EP (1) | EP4332579A1 (fr) |
| JP (1) | JPWO2022230282A1 (fr) |
| CN (1) | CN117321421A (fr) |
| WO (1) | WO2022230282A1 (fr) |
Family Cites Families (8)
| Publication number | Priority date | Publication date | Assignee | Title |
|---|---|---|---|---|
| JP2005283332A (ja) * | 2004-03-30 | 2005-10-13 | Shimadzu Corp | バリデーションシステム及びバリデーションプログラム |
| WO2006009251A1 (fr) * | 2004-07-22 | 2006-01-26 | Wako Pure Chemical Industries, Ltd. | Procédé d'assistance d'analyse, analyseur, ordinateur distant, procédé d'analyse de données, programme et conteneur de réactif |
| JP4578519B2 (ja) | 2007-12-28 | 2010-11-10 | シスメックス株式会社 | 臨床検体処理装置および臨床検体処理システム |
| WO2011063139A1 (fr) * | 2009-11-18 | 2011-05-26 | Qiagen | Procédé et système d'unité de commande centrale de laboratoire |
| ES2894840T3 (es) * | 2017-07-04 | 2022-02-16 | Hoffmann La Roche | Sistema y procedimiento de diagnóstico clínico automatizado |
| US11209404B2 (en) * | 2017-12-05 | 2021-12-28 | Shimadzu Corporation | Biological sample analyzing system |
| WO2020084886A1 (fr) * | 2018-10-25 | 2020-04-30 | 株式会社日立ハイテク | Analyseur automatisé |
| CN114072679A (zh) * | 2019-07-04 | 2022-02-18 | 株式会社日立高新技术 | 自动分析装置 |
-
2022
- 2022-02-02 WO PCT/JP2022/004104 patent/WO2022230282A1/fr active Application Filing
- 2022-02-02 JP JP2023517057A patent/JPWO2022230282A1/ja active Pending
- 2022-02-02 EP EP22795205.8A patent/EP4332579A1/fr active Pending
- 2022-02-02 CN CN202280029525.0A patent/CN117321421A/zh active Pending
Also Published As
| Publication number | Publication date |
|---|---|
| JPWO2022230282A1 (fr) | 2022-11-03 |
| WO2022230282A1 (fr) | 2022-11-03 |
| CN117321421A (zh) | 2023-12-29 |
Similar Documents
| Publication | Publication Date | Title |
|---|---|---|
| CN110832299B (zh) | 自动化临床诊断系统和方法 | |
| JP5520841B2 (ja) | 生体サンプルの前処理装置、及びそれを備えた質量分析装置 | |
| CN109557292B (zh) | 校准方法 | |
| WO2010038546A1 (fr) | Système d’analyse automatique | |
| JP7227948B2 (ja) | 分析装置の状態を点検するための技術 | |
| EP3535578A1 (fr) | Procédé de contrôle des composants d'un analyseur de gaz | |
| ES2963300T3 (es) | Técnicas para verificar el estado de analizadores de CL/EM | |
| US11619617B2 (en) | Chromatograph having operation controller that causes automatic purging in a case of detection failure | |
| EP4036573A1 (fr) | Procédé de détection de la présence ou de l'absence d'un caillot dans un analyseur d'échantillons liquides | |
| EP4332579A1 (fr) | Dispositif d'analyse automatique | |
| JP2004251802A (ja) | 自動分析装置 | |
| EP3872500A1 (fr) | Analyseur automatisé | |
| WO2020121726A1 (fr) | Automate d'analyse | |
| US20230417784A1 (en) | Control method of sample pretreatment apparatus | |
| JP6204087B2 (ja) | 自動分析装置 | |
| JP2010266271A (ja) | 異常原因推定方法、分析システム、情報管理サーバ装置 | |
| JPH049756A (ja) | 液体クロマトグラフ分析システム | |
| CN114544795B (zh) | 质谱中气体流参数的异常检测 | |
| JP6979110B2 (ja) | 分析装置の状態をチェックする技術 | |
| EP3761038B1 (fr) | Techniques de vérification de l'état d'analyseurs | |
| EP4361640A1 (fr) | Système de diagnostic, dispositif d'analyse automatisée et procédé de diagnostic | |
| WO2023153073A1 (fr) | Système de détection d'anomalie de composant, dispositif d'analyse automatisé et procédé de détection d'anomalie de composant |
Legal Events
| Date | Code | Title | Description |
|---|---|---|---|
| STAA | Information on the status of an ep patent application or granted ep patent |
Free format text: STATUS: THE INTERNATIONAL PUBLICATION HAS BEEN MADE |
|
| PUAI | Public reference made under article 153(3) epc to a published international application that has entered the european phase |
Free format text: ORIGINAL CODE: 0009012 |
|
| STAA | Information on the status of an ep patent application or granted ep patent |
Free format text: STATUS: REQUEST FOR EXAMINATION WAS MADE |
|
| 17P | Request for examination filed |
Effective date: 20231025 |
|
| AK | Designated contracting states |
Kind code of ref document: A1 Designated state(s): AL AT BE BG CH CY CZ DE DK EE ES FI FR GB GR HR HU IE IS IT LI LT LU LV MC MK MT NL NO PL PT RO RS SE SI SK SM TR |