EP4202416A1 - Spectrum analysis method, device and system - Google Patents
Spectrum analysis method, device and system Download PDFInfo
- Publication number
- EP4202416A1 EP4202416A1 EP22213312.6A EP22213312A EP4202416A1 EP 4202416 A1 EP4202416 A1 EP 4202416A1 EP 22213312 A EP22213312 A EP 22213312A EP 4202416 A1 EP4202416 A1 EP 4202416A1
- Authority
- EP
- European Patent Office
- Prior art keywords
- wavelength band
- feature amount
- unit
- detection
- wavelength
- Prior art date
- Legal status (The legal status is an assumption and is not a legal conclusion. Google has not performed a legal analysis and makes no representation as to the accuracy of the status listed.)
- Pending
Links
Images


Classifications
-
- G—PHYSICS
- G01—MEASURING; TESTING
- G01N—INVESTIGATING OR ANALYSING MATERIALS BY DETERMINING THEIR CHEMICAL OR PHYSICAL PROPERTIES
- G01N21/00—Investigating or analysing materials by the use of optical means, i.e. using sub-millimetre waves, infrared, visible or ultraviolet light
- G01N21/62—Systems in which the material investigated is excited whereby it emits light or causes a change in wavelength of the incident light
- G01N21/63—Systems in which the material investigated is excited whereby it emits light or causes a change in wavelength of the incident light optically excited
- G01N21/64—Fluorescence; Phosphorescence
- G01N21/645—Specially adapted constructive features of fluorimeters
-
- G—PHYSICS
- G01—MEASURING; TESTING
- G01J—MEASUREMENT OF INTENSITY, VELOCITY, SPECTRAL CONTENT, POLARISATION, PHASE OR PULSE CHARACTERISTICS OF INFRARED, VISIBLE OR ULTRAVIOLET LIGHT; COLORIMETRY; RADIATION PYROMETRY
- G01J3/00—Spectrometry; Spectrophotometry; Monochromators; Measuring colours
- G01J3/02—Details
- G01J3/0264—Electrical interface; User interface
-
- G—PHYSICS
- G01—MEASURING; TESTING
- G01J—MEASUREMENT OF INTENSITY, VELOCITY, SPECTRAL CONTENT, POLARISATION, PHASE OR PULSE CHARACTERISTICS OF INFRARED, VISIBLE OR ULTRAVIOLET LIGHT; COLORIMETRY; RADIATION PYROMETRY
- G01J3/00—Spectrometry; Spectrophotometry; Monochromators; Measuring colours
- G01J3/28—Investigating the spectrum
- G01J3/44—Raman spectrometry; Scattering spectrometry ; Fluorescence spectrometry
- G01J3/4406—Fluorescence spectrometry
-
- G—PHYSICS
- G01—MEASURING; TESTING
- G01J—MEASUREMENT OF INTENSITY, VELOCITY, SPECTRAL CONTENT, POLARISATION, PHASE OR PULSE CHARACTERISTICS OF INFRARED, VISIBLE OR ULTRAVIOLET LIGHT; COLORIMETRY; RADIATION PYROMETRY
- G01J3/00—Spectrometry; Spectrophotometry; Monochromators; Measuring colours
- G01J3/28—Investigating the spectrum
- G01J2003/283—Investigating the spectrum computer-interfaced
- G01J2003/2833—Investigating the spectrum computer-interfaced and memorised spectra collection
-
- G—PHYSICS
- G01—MEASURING; TESTING
- G01J—MEASUREMENT OF INTENSITY, VELOCITY, SPECTRAL CONTENT, POLARISATION, PHASE OR PULSE CHARACTERISTICS OF INFRARED, VISIBLE OR ULTRAVIOLET LIGHT; COLORIMETRY; RADIATION PYROMETRY
- G01J3/00—Spectrometry; Spectrophotometry; Monochromators; Measuring colours
- G01J3/28—Investigating the spectrum
- G01J2003/283—Investigating the spectrum computer-interfaced
- G01J2003/284—Spectral construction
-
- G—PHYSICS
- G01—MEASURING; TESTING
- G01N—INVESTIGATING OR ANALYSING MATERIALS BY DETERMINING THEIR CHEMICAL OR PHYSICAL PROPERTIES
- G01N21/00—Investigating or analysing materials by the use of optical means, i.e. using sub-millimetre waves, infrared, visible or ultraviolet light
- G01N21/62—Systems in which the material investigated is excited whereby it emits light or causes a change in wavelength of the incident light
- G01N21/63—Systems in which the material investigated is excited whereby it emits light or causes a change in wavelength of the incident light optically excited
- G01N21/64—Fluorescence; Phosphorescence
- G01N2021/6417—Spectrofluorimetric devices
- G01N2021/6419—Excitation at two or more wavelengths
-
- G—PHYSICS
- G01—MEASURING; TESTING
- G01N—INVESTIGATING OR ANALYSING MATERIALS BY DETERMINING THEIR CHEMICAL OR PHYSICAL PROPERTIES
- G01N21/00—Investigating or analysing materials by the use of optical means, i.e. using sub-millimetre waves, infrared, visible or ultraviolet light
- G01N21/62—Systems in which the material investigated is excited whereby it emits light or causes a change in wavelength of the incident light
- G01N21/63—Systems in which the material investigated is excited whereby it emits light or causes a change in wavelength of the incident light optically excited
- G01N21/64—Fluorescence; Phosphorescence
- G01N2021/6417—Spectrofluorimetric devices
- G01N2021/6421—Measuring at two or more wavelengths
-
- G—PHYSICS
- G01—MEASURING; TESTING
- G01N—INVESTIGATING OR ANALYSING MATERIALS BY DETERMINING THEIR CHEMICAL OR PHYSICAL PROPERTIES
- G01N2201/00—Features of devices classified in G01N21/00
- G01N2201/12—Circuits of general importance; Signal processing
- G01N2201/129—Using chemometrical methods
- G01N2201/1293—Using chemometrical methods resolving multicomponent spectra
-
- G—PHYSICS
- G01—MEASURING; TESTING
- G01N—INVESTIGATING OR ANALYSING MATERIALS BY DETERMINING THEIR CHEMICAL OR PHYSICAL PROPERTIES
- G01N2201/00—Features of devices classified in G01N21/00
- G01N2201/12—Circuits of general importance; Signal processing
- G01N2201/129—Using chemometrical methods
- G01N2201/1296—Using chemometrical methods using neural networks
Definitions
- the present invention relates to a spectrum analysis method, device, and system.
- a spectrum analysis device obtains a spectrum by irradiating a sample with excitation light and measuring light detected from the sample.
- the spectrum analysis devices there is a device that obtains a three-dimensional spectrum configured with three axes of an excitation wavelength, a detection wavelength, and a detection intensity.
- a fluorescence spectrophotometer measures a three-dimensional fluorescence spectrum called an Excitation Emission Matrix (EEM).
- EEM Excitation Emission Matrix
- the sample emits different fluorescence spectra by changing the wavelength of excitation light. Therefore, by measuring the fluorescence spectrum while sequentially changing the wavelength of the excitation light, a three-dimensional spectrum having three axes of the excitation wavelength, fluorescence wavelength, and fluorescence intensity is obtained.
- the above-described detection wavelength corresponds to the fluorescence wavelength
- the detection intensity corresponds to the fluorescence intensity.
- JP2015-180895A discloses a method of providing a rectangular measurement window for an EEM and performing a multivariate analysis by using an integral value of a fluorescence intensity within the measurement window.
- JP2018-013418A discloses a method of estimating the content of a target substance while limiting the excitation wavelength used for estimation by performing sparse estimation by using a light absorption characteristic value (detection intensity) at each of a plurality of the excitation wavelengths as an explanatory variable for two-dimensional spectrum data.
- An object of linear regression using only a peak value is to perform short-time measurement and analysis by determining a wavelength band in which a peak appears, and after that, measuring and analyzing only the wavelength band.
- information of only peaks is used, there are problems of difficulty in quantification/classification using spatial information such as a peak width and a distance between peaks, susceptibility to point-like noise, and the like.
- a wavelength band used for quantification and/or classification will be referred to as an effective wavelength band.
- a rectangular measurement window is provided, and a multivariate analysis is performed by using an integrated value of a fluorescence intensity within the measurement window. Accordingly, an object is to reduce influence of noise while limiting the measurement wavelength band.
- searching is required by manually designing the measurement window, or constructing a regression equation from the fluorescence intensity within the randomly set measurement window and repeating a process of resetting the measurement window based on a quantification result.
- a wavelength band effective for quantification/classification is automatically selected by performing sparse estimation by using all detection intensities in a two-dimensional spectrum data as explanatory variables.
- the selected wavelength band is not a region but a point, similarly to the case of using the information of only peaks, there are problems in that it is difficult to extract spatial information and that it is susceptible to point-like noise.
- an object of the invention is to provide a spectrum analysis device, method, and system that realize highly accurate quantification and/or classification with reduced influence of noise while utilizing the spatial information in three-dimensional spectrum data.
- a spectrum analysis device includes: an input unit receiving spectrum data of a sample as an input; a wavelength-unit feature amount extraction unit extracting a feature amount of the sample from the spectrum data; an estimation unit estimating characteristics of the sample based on the feature amount; and an output unit outputting an estimation result obtained by the estimation unit, in which the spectrum data includes a plurality of excitation wavelengths and spectroscopic spectra indicating detection wavelengths and detection intensities for the excitation wavelengths and is a discretized data with a predetermined wavelength width, the wavelength-unit feature amount extraction unit extracts the feature amount from the detection intensities of two or more detection wavelength bands in each excitation wavelength band or the detection intensities of two or more excitation wavelength bands in each detection wavelength band, and/or the estimation unit performs an estimation process of quantifying and/or classifying the characteristics of the sample.
- a spectrum analysis method disclosed in the invention includes: receiving a spectrum data of a sample as an input; extracting a feature amount of the sample from the spectrum data; estimating characteristics of the sample based on the feature amount; and outputting an estimation result obtained by the estimating, in which the spectrum data includes a plurality of excitation wavelengths and spectroscopic spectra indicating detection wavelengths and detection intensities for the excitation wavelengths and is discretized data with a predetermined wavelength width, in the extracting, the feature amount is extracted from the detection intensities of two or more detection wavelength bands in each excitation wavelength band or the detection intensities of two or more excitation wavelength bands in each detection wavelength band, and in the estimating, an estimation process of quantifying and/or classifying the characteristics of the sample is performed.
- a spectrum analysis device that is capable of performing quantification/classification with reduced influence of noise and limiting wavelength band (effective wavelength band) used for the quantification/classification in units of an excitation wavelength or a detection wavelength while utilizing spatial information in three-dimensional spectrum data.
- the three-dimensional spectrum data in this embodiment is data that includes a plurality of excitation wavelengths and spectroscopic spectra (spectra configured with detection wavelengths and detection intensities) and is discretized with a predetermined wavelength width.
- quantification/classification is referred to as quantification and/or classification
- quantification/classification model is a model for data estimation used for at least one of the quantification and the classification.
- a spectrum analysis device 100 includes an interface unit 110, a calculation unit 111, a memory 112, and a bus 113, and the interface unit 110, the calculation unit 111, and the memory 112 transmit and receive information via the bus 113.
- the interface unit 110 is a communication device that transmits and receives signals to and from a device outside the spectrum analysis device 100.
- a control device 120 that controls a spectrum measurement device 121, the spectrum measurement device 121 that measures the three-dimensional spectrum data, and a display device 122 such as a monitor or a printer that displays the process result of the spectrum analysis device 100.
- the calculation unit 111 is a device that executes various processes in the spectrum analysis device 100 and is, for example, a CPU (Central Processing Unit), an FPGA (Field-Programmable Gate Array), or the like. Functions executed by the calculation unit 111 will be described later.
- a CPU Central Processing Unit
- FPGA Field-Programmable Gate Array
- the memory 112 is a device that stores programs executed by the calculation unit 111, parameters of the quantification/classification model, a process result, and the like, and may be an HDD, an SSD, a RAM, a ROM, a flash memory, or the like.
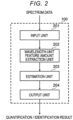
- FIG. 2 is an example of a functional block diagram according to an embodiment of the spectrum analysis device 100.
- Each of these functional units may be realized by software that operates on the calculation unit 111 or may be realized by dedicated hardware.
- the spectrum analysis device 100 includes an input unit 201, a wavelength-unit feature amount extraction unit 202, an estimation unit 203, and an output unit 204 as functional units.
- each functional unit will be described.
- the input unit 201 receives the one or more discretized three-dimensional spectrum data input from the interface unit 110.
- the wavelength-unit feature amount extraction unit 202 extracts the feature amount from the detection intensities of two or more detection wavelength bands in each excitation wavelength band or from the detection intensities of two or more excitation wavelength bands in each detection wavelength band from the three-dimensional spectrum data.
- the estimation unit 203 reads one of the quantification/classification models stored in the memory 112 and performs quantification/classification based on the feature amount.
- the output unit 204 outputs the quantification/classification result.
- the evaluation value of the quantification model such as a coefficient of determination and an RMSE (Root Mean Squared Error) may be output, and a graph data such as a calibration curve may be output.
- evaluation values of the classification model such as an classification rate, an accuracy rate, and a reproduction rate may be output. These outputs are displayed on the display device 122 through the interface unit 110.
- FIG. 5 illustrates an example of a process flowchart according to the first embodiment. Each step corresponds to each element in the functional block diagram illustrated in FIG. 2 .
- an input step 501 the one or more discretized three-dimensional spectrum data input from the interface unit 110 is received.
- the feature amount is extracted from the detection intensities of two or more detection wavelength bands in each excitation wavelength band or from the detection intensities of two or more excitation wavelength bands in each detection wavelength band from the three-dimensional spectrum data.
- an estimation step 503 one of the quantification/classification models stored in the memory 112 is read, and the quantification/classification is performed based on the feature amount.
- the quantification/classification result is output.
- the evaluation value of the quantification model such as a coefficient of determination and an RMSE (Root Mean Squared Error) may be output, and a graph data such as a calibration curve may be output.
- evaluation values of the classification model such as an classification rate, an accuracy rate, and a reproduction rate may be output.
- each functional unit as the subject, but each step corresponding to each functional unit may be read as the subject.
- the input unit 201 receives the discretized three-dimensional spectrum data through the interface unit 110 and stores the discretized three-dimensional spectrum data in the memory 112.
- FIG. 3 illustrates an example of Excitation Emission Matrix (EEM) data.
- Discretized Excitation Emission Matrix (EEM) data 300 is an example of discretized and stored EEM data.
- An EEM data visualization example 301 is an example in which the excitation light wavelength is plotted on the vertical axis and the detection wavelength is plotted on the horizontal axis, and the detection intensity in each combination of the excitation wavelength and the detection wavelength is displayed as a contour line data.
- the EEM data is discretized to be measured and recorded.
- the discretized EEM data 300 indicates an example of measuring the excitation light/detection light of 200 nm to 700 nm at intervals of 5 nm.
- the detection intensity of the detection light of 200 nm with respect to the excitation light of 200 nm is recorded in the first row and the first column of the discretized EEM data 300
- the detection intensity of the detection light of 205 nm with respect to the excitation light of 200 nm is recorded in the first row and the second column
- the detection intensity of the detection light of 200 nm with respect to the excitation light of 205 nm is recorded in the second row and the first column, respectively.
- the number of columns and the number of rows of the discretized EEM data 300 are 100 ⁇ 100.
- the EEM data visualization example 301 is an example in which the discretized EEM data 300 is converted into a two-dimensional image as the contour line data, and when a person observes the EEM data, in many cases, the EEM data is confirmed by a display such as the EEM data visualization example 301. It is noted that, in addition to the contour line data, in some cases, the EEM data is displayed by gray images and heat map images in which detection intensities are assigned to luminance values and colors, a bird's-eye view, or the like.
- the shape of the EEM differs depending on properties of the sample to be measured, and thus, the classification of the sample, the quantification of a specific component, and the like are performed based on a difference of the shapes.
- the wavelength-unit feature amount extraction unit 202 extracts the feature amount from the detection intensities of two or more detection wavelength bands in each excitation wavelength band or from the detection intensities of two or more excitation wavelength bands in each detection wavelength band from the three-dimensional spectrum data. Accordingly, the wavelengths effective for classification and quantification in units of an excitation wavelength or a detection wavelength can be selected and limited while extracting a spatial feature amount in the detection wavelength direction or the excitation wavelength direction.
- a first reference method is a method of performing regression by using each detection intensity, that is, the value of each square of the discretized EEM data 300 as the explanatory variable.
- the regression equation is constructed by assigning a large weight to the detection intensity in combinations of the excitation wavelengths and the detection wavelengths that are effective for the classification and the quantification, among the detection intensities.
- the measurement time is shortened by measuring the explanatory variable assigned with a large weight, that is, only the combination of the excitation wavelength and the detection wavelength.
- a second reference method is a method of extracting the spatial feature amounts by using a CNN (Convolutional Neural Network).
- the CNN is one of the machine learning methods frequently used in the field of image processing, and extracts the feature amount by automatically learning a plurality of filters.
- the spatial feature amount can be extracted, and robustness against point-like noise is also improved.
- the CNN calculates the feature amount comprehensively from the entire two-dimensional data, that is, from the values of all squares in the discretized EEM data 300, there is a tendency to require the detection intensities in a wide range of wavelength bands in order to calculate the feature amount, and it may be difficult to limit the effective wavelength band.
- the feature amount extraction is performed independently from the excitation wavelength, that is, each row of the discretized EEM data 300 or from the detection wavelength, that is, each column of the discretized EEM data 300. Accordingly, the feature amount having spatial information in the detection wavelength direction or the excitation wavelength direction and robust against point-like noise can be extracted, and the effective wavelength band can be selected and limited in units of an excitation wavelength or a detection wavelength.
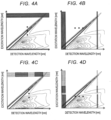
- FIG. 4A to 4D are diagrams illustrating an example of a feature amount extraction range.
- FIG. 4A illustrates an example of extracting the feature amount from all detection wavelength bands in each excitation wavelength band
- FIG. 4B illustrates an example of extracting the feature amount from all excitation wavelength bands in each detection wavelength band
- FIG. 4C illustrates an example of extracting the feature amount from a portion of the detection wavelength band in each excitation wavelength band
- FIG. 4D illustrates an example of extracting the feature amount from a portion of the excitation wavelength band in each detection wavelength band. Rectangles drawn in the three-dimensional spectrum data of FIGS. 4A, 4B, 4C, and 4D indicate input units to the feature amount extraction model for extracting the feature amount.
- the wavelength-unit feature amount extraction unit 202 extracts the feature amount independently for each excitation wavelength band as illustrated in FIGS. 4A and 4C or for each detection wavelength band as illustrated in FIGS. 4B and 4D .
- the feature amount may be extracted from the entire detection or excitation wavelength band, and as illustrated in FIGS. 4C and 4D , the feature amount may be extracted from only a portion of the detection or excitation wavelength band.
- all of the excitation wavelengths are illustrated so as to extract the feature amount from the same detection wavelength, but the detection wavelength band for extracting the feature amount may be changed according to the excitation wavelength.
- the detection wavelength band for extracting the feature amount may be changed according to the excitation wavelength.
- noise called scattered light is measured around a region where the excitation wavelength and the detection wavelength are the same, but the region from which the feature amount is extracted may be changed according to the excitation wavelength so as to avoid this region of the scattered light. It is noted that the same applies when the detection wavelength and the excitation wavelength are exchanged.
- 1DCNN (1 Dimensional Convolutional Neural Network) or the like is used.
- the 1DCNN is a CNN for one-dimensional data and extracts a plurality of the feature amounts for each excitation wavelength or each detection wavelength.
- the feature amount learning method there is a method of learning the feature amount by updating the 1DCNN and the fully connected layer by a machine learning method by connecting one or more 1DCNN for extracting the feature amount and the fully connected layer and the like that performs the quantification and the classification with the output of 1DCNN as an input and using a data set generated for each quantification and classification problem.
- the feature amount learning method is not limited to this, and may be a method of learning a common feature amount by learning a plurality of tasks simultaneously, or may be learned by using an unsupervised learning method such as Auto Encoder.
- a handcrafted feature amount such as HoG (Histograms of Oriented Gradients) and a Haar-like feature amount may be used, and a statistical analysis method such as a principal component analysis and PLS (Partial Least Squares) may also be used.
- the wavelength-unit feature amount extraction unit 202 extracts the information on the region (detection intensities measured at two or more wavelengths) as illustrated in FIGS. 4A to 4D , so that it is also possible to provide the quantification/classification model with improved robustness to noise while utilizing the spatial information in the estimation unit 203 described later.
- the feature amount is extracted independently for each excitation wavelength or each detection wavelength, and in the estimation unit 203, each feature amount is used as an input of the quantification/classification, so that the quantification/classification model capable of limiting the effective wavelength band can be provided.
- the estimation unit 203 performs quantification/classification by reading any quantification/classification model stored in the memory 112, and inputting the feature amount obtained by the wavelength-unit feature amount extraction unit 202 into the quantification/classification model.
- a sparse estimation model such as Lasso regression, Elastic Net, and Group Lasso may be used, and a machine learning model such as Neural Network, Random Forest, and Support Vector Machine may also be used.
- a machine learning model such as Neural Network, Random Forest, and Support Vector Machine may also be used.
- x ij is a wavelength band unit feature amount output from the wavelength-unit feature amount extraction unit 202
- i is an index of the excitation or detection wavelength
- j is an index of the feature amount.
- N the number of excitation or detection wavelengths
- M the number of feature amounts extracted from each wavelength
- w ij indicates the weight for each feature amount
- b indicates the bias value
- y ⁇ indicates the output of the regression model.
- Equation 2a the regression equation such as Equation 2a is configured by using one or more sets of training feature amounts and supervised signals.
- x s,ij indicates the feature amount output by the wavelength-unit feature amount extraction unit 202
- s indicates the index of the sample
- i and j indicate the index of the excitation or detection wavelength and the index of the feature amount similarly to Equation 1.
- y s indicates a supervised signal of the sample s. It is noted that it is assumed that the number of sets of the training feature amounts and the supervised signals is S.
- Equation 2b is an equation in which the notation of matrix vectors in Equation 2a is omitted.
- Equation 3 indicates the regularization strength.
- the first term of Equation 3 has the effect of bringing the output of the regression model closer to the supervised signal y.
- the second term is an L1 regularization term, which has the effect of allowing many elements in the weight w to be closer to 0.
- the strength of the effect is determined by the regularization strength ⁇ .
- the weight w related to some feature amounts becomes zero.
- weights w i1 , ..., w iM corresponding to all feature amounts for wavelength band i become 0, since this denotes that the feature amount obtained from the wavelength band i is not used in the regression, there is no need to measure the wavelength band i. In this manner, by limiting the feature amounts used in the regression in units of a wavelength band, the measurement time can be shortened.
- the weight w constructed by the above method is stored in advance in the memory 112, and when the spectrum analysis device 100 is activated or when the weight w is updated, the estimation unit 203 reads the weight w and executes a quantification/classification process.
- the wavelength-unit feature amount extraction unit 202 extracting the feature amount from the detection intensities of the two or more detection wavelengths at each excitation wavelength or from the detection intensities of the two or more excitation wavelengths at each detection wavelength and with the estimation unit 203 performing the quantification/classification by using the feature amount as the explanatory variable.
- a spectrum analysis device capable of performing highly accurate classification and selection of the effective wavelength band for a quantification/classification problem uniquely set by the user by adding the quantification/classification model generation function to the spectrum analysis device described in the first embodiment will be described.
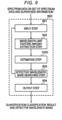
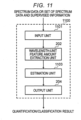
- FIG. 11 is an example of a functional block diagram of the spectrum analysis device according to the second embodiment.
- a spectrum analysis device 1100 includes an input unit 1101, a wavelength-unit feature amount extraction unit 202, an estimation unit 1103, and an output unit 204 as functional units. Since the wavelength-unit feature amount extraction unit 202 and the output unit 204 are the same as those in the first embodiment, description thereof will be omitted. Hereinafter, the input unit 1101 and the estimation unit 1103 will be described.
- the input unit 1101 receives the three-dimensional spectrum data alone or a set of the three-dimensional spectrum data and supervised information through the interface unit 110.
- the estimation unit 1103 generates the quantification/classification model by using a plurality of sets of the three-dimensional spectrum data and the supervised information stored in the memory 112.
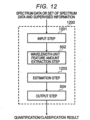
- FIG. 12 illustrates an example of a process flowchart according to the second embodiment. Each step corresponds to each element in the functional block diagram illustrated in FIG. 11 .
- the wavelength-unit feature amount extraction step 502 and the output step 504 in FIG. 12 are the same as the steps described in the first embodiment, and thus, description thereof will be omitted.
- an input step 1201 the three-dimensional spectrum data alone or a set of the three-dimensional spectrum data and the supervised information is received through the interface unit 110.
- an estimation step 1203 a plurality of sets of the three-dimensional spectrum data and the supervised information stored in the memory 112 are used to generate the quantification/classification model.
- each functional unit as the subject, but each step corresponding to each functional unit may be read as the subject.
- the input unit 1101 receives the three-dimensional spectrum data alone or a set of the three-dimensional spectrum data and the supervised information through the interface unit 110. In a case of receiving the three-dimensional spectrum data alone, the input unit 1101 performs the same process as the input unit 201 described in the first embodiment. In a case of receiving a set of the three-dimensional spectrum data and the supervised information, the input unit 1101 stores the received set of the three-dimensional spectrum data and the supervised information in the memory 112.
- the estimation unit 1103 In a case where a certain condition is satisfied, the estimation unit 1103 generates the quantification/classification model by using a plurality of sets of the three-dimensional spectrum data and the supervised information stored in the memory 112.
- the conditions for starting the generation of the quantification/classification model may be a case where the number of sets of the three-dimensional spectrum data and the supervised information newly stored in the memory 112 exceeds a predetermined number, a case where there is a request from the user through the interface unit 110, a case where the quantification/classification model is updated whenever a predetermined time elapses, or the like.
- the sparse estimation model such as Lasso regression, Elastic Net, or Group Lasso may be used as the quantification/classification model
- the machine learning model such as Neural Network, Random Forest, or Support Vector Machine
- an example using the Lasso regression will be described as an example.
- the Lasso regression constructs the regression equation expressed in Equation 2b and derives the weight w based on the constraints expressed in Equation 3.
- the weight w that satisfies Equation 3 is derived.
- ISTA Intelligent Shrinkage Thresholding Algorithm
- the quantification/classification models can be constructed by using data sets collected uniquely by the user.
- the quantification/classification model can be constructed by a similar method.
- the quantification/classification model is learned according to each machine learning algorithm by using the three-dimensional spectrum data group and the supervised information group corresponding thereto. It is noted that the initial value of the weight of the quantification/classification model may be set to a fixed value or a random value, the initial value of the weight may be set according to a probability distribution such as a normal distribution, and the weight of the quantification/classification model stored in the memory 112 may be set.
- the feature amount extraction model may be updated by using a plurality of the three-dimensional spectrum data or a plurality of the sets of the three-dimensional spectrum data and the supervised information described above.
- the supervised information is not required to update the feature amount extraction model. Therefore, the feature amount is updated by unsupervised learning or a statistical analysis by using only a plurality of the three-dimensional spectrum data.
- the feature amount extraction model is updated by executing supervised learning by using a plurality of sets of the three-dimensional spectrum data and the supervised signals or the statistical analysis by using the supervised information as a response variable.
- the quantification/classification model can be constructed by using the data set independently collected by the user, and thus, a spectrum analysis device and method capable of performing highly accurate classification and selection of the effective wavelength band for the quantification/classification problem uniquely set by the user can be provided.
- a spectrum analysis device where a function of automatically determining an effective wavelength band or a function of supporting the user in determining the effective wavelength band is added to the spectrum analysis device 100 described in the second embodiment will be described.
- a hardware configuration of the spectrum analysis device according to the third embodiment is the same as the hardware configuration of the spectrum analysis device according to the first embodiment illustrated in FIG. 1 , and thus, description thereof will be omitted.
- FIG. 6 is an example of a functional block diagram of the spectrum analysis device according to the third embodiment.
- a spectrum analysis device 600 includes an input unit 601, a wavelength-unit feature amount extraction unit 202, an estimation unit 1103, an output unit 604, and an effective wavelength band searching unit 605 as functional units.
- the wavelength-unit feature amount extraction unit 202 is the same as that of the first embodiment, and the estimation unit 1103 is the same as that of the second embodiment, and thus, description thereof will be omitted.
- the input unit 601, the effective wavelength band searching unit 605, and the output unit 604 will be described.
- the input unit 601 receives the three-dimensional spectrum data alone or a set of the three-dimensional spectrum data and the supervised information through the interface unit 110 similarly to the input unit 1101 described in the second embodiment. Further, if necessary, the effective wavelength band is received from the effective wavelength band searching unit 605 described later and the spectrum data to be output to the wavelength-unit feature amount extraction unit 202 is processed. The effective wavelength band searching unit 605 automatically determines the effective wavelength band or supports the user in determining the effective wavelength band based on the weight of the quantification/classification model constructed by the estimation unit 1103.
- the output unit 604 displays the effective wavelength band determined by the effective wavelength band searching unit 605 together with the quantification/classification result and outputs information for supporting the user to determine the effective wavelength band if necessary.
- FIG. 9 illustrates an example of a process flowchart according to the third embodiment. Each step corresponds to each element in the functional block diagram illustrated in FIG. 6 .
- the wavelength-unit feature amount extraction step 502 illustrated in FIG. 9 is the same as that of the first embodiment, and the estimation step 1203 is the same as that of the second embodiment, and thus, description thereof will be omitted.
- the three-dimensional spectrum data alone or a set of the three-dimensional spectrum data and the supervised information is received through the interface unit 110 similarly to the input step 1201 described in the second embodiment. Further, if necessary, the effective wavelength band is received from an effective wavelength band searching step 905 described later, and the spectrum data to be output to the wavelength-unit feature amount extraction step 502 is processed.
- the effective wavelength band searching step 905 based on the weight of the quantification/classification model constructed in the estimation step 1203, the effective wavelength band is automatically determined, or the user is supported in the determining the effective wavelength band.
- an output step 904 the effective wavelength band determined in the effective wavelength band searching step 905 is displayed together with the quantification/classification result, and the information for supporting the user to determine the effective wavelength band is output, if necessary.
- each functional unit as the subject, but each step corresponding to each functional unit may be read as the subject.
- the input unit 601 receives the three-dimensional spectrum data alone or a set of the three-dimensional spectrum data and the supervised information through the interface unit 110 and performs the same process as the input unit 1101 described in the second embodiment.
- the feature amount extraction time may be shortened.
- the effective wavelength band searching unit 605 automatically determines the effective wavelength band in units of an excitation wavelength or a detection wavelength based on the weight of the quantification/classification model constructed by the estimation unit 1103 and outputs the effective wavelength band or displays the information for supporting the determination of the effective wavelength band by the user on the display device 122 through the output unit 604 and the interface unit 110.
- the quantification/classification model is constructed by using the sparse estimation model such as Lasso regression, Elastic Net, or Group Lasso or the machine learning model such as Neural Network, Random Forest, or Support Vector Machine.
- the sparse estimation method such as Lasso regression, Elastic Net, or Group Lasso
- the excitation or detection wavelength band in which the feature amount corresponding to the coefficient that is not 0 is extracted becomes the wavelength band used for quantification/classification.
- the effective wavelength band searching unit 605 receives the value of the weight of the quantification/classification model constructed by the estimation unit 1103 and determines the effective wavelength band based on the value of the weight. For example, in a case of using the Lasso regression as the quantification/classification model, the values of w 11 , w 12 , ⁇ , w nm in Equation 1 are received, in a case where at least one of the weights w i0 , ⁇ , wim corresponding to the feature amount extracted from the wavelength i has a value other than 0, the wavelength i is used as the effective wavelength band, and all the weights w i0 , ⁇ , w im are 0, the wavelength i is excluded from the effective wavelength band. In addition, in a case where a determination tree such as random forest or gradient boosting is used, an arbitrary number of explanatory variables are selected in descending order of importance, and wavelengths corresponding to the explanatory variables are selected as the effective wavelength bands.
- a determination tree such as random forest
- a method of automatically determining a hyperparameter and the like for controlling sparseness will also be described.
- the number of feature amounts that is 0 is changed according to the value of the regularization strength ⁇ described above.
- the value of ⁇ is increased, the number of feature amounts that is 0 is increased, and thus, the number of effective wavelength bands can be reduced, but since the number of feature amounts used for the classification is reduced, the quantification/classification accuracy tends to be decreased as the value of ⁇ is increased.
- a plurality of sets of the three-dimensional spectrum data and the supervised information for the calibration are received from the user and stored in the memory 112.
- Evaluation is performed with a calibration data while changing ⁇ , and while maintaining an accuracy of a predetermined or user-specified threshold value or more for the calibration data, ⁇ is automatically determined by such a method of adopting ⁇ that has the smallest number of effective wavelength bands or adopting the effective wavelength band of a threshold value or less and ⁇ that is the highest classification accuracy.
- the hyperparameter can be automatically determined based on quantification/classification accuracy for the calibration data.
- the effective wavelength band searching unit 605 sorts, for example, the weights of the quantification/classification model in descending order of the absolute values of the weights and determines the effective wavelength band by extracting the feature amount and the wavelength band corresponding to the higher weights.
- a threshold value TH is prepared for determining the wavelength band to be adopted as the effective wavelength band, and the wavelength band corresponding to the weight having an absolute value exceeding the threshold value TH is adopted as the effective wavelength band.
- the method of determining the effective wavelength band is not limited to this.
- a threshold value TH R may be prepared for the order of the sorting result related to the absolute value, and the wavelength bands corresponding to the higher first weight up to the TH R -th weight of the sorting result of the absolute value may be adopted as the effective wavelength band.
- a threshold value TH P may be prepared for the ratio of the sorting results of the absolute values and the wavelength bands corresponding to the weights up to the higher TH P % may be adopted.
- the threshold values TH, TH R , TH P , and the like correspond to the hyperparameters for controlling the sparseness described above, the above-described automatic hyperparameter determination method can also be applied to the threshold values TH, TH R , TH P , and the like. It is noted that the quantification/classification model may be re-updated by using only the spectrum data corresponding to the adopted effective wavelength band.
- the effective wavelength band can be automatically determined based on the weight of the quantification/classification model.
- the effective wavelength band searching unit 605 may automatically determine from which of the excitation wavelengths or the detection wavelengths the feature amount is to be extracted.
- a determination method there is a method by using the calibration data described above.
- the calibration data consisting of a plurality of sets of the three-dimensional spectrum data and the supervised information.
- the quantification/classification accuracy and the number of effective wavelength bands of the method of extracting feature amounts for each excitation wavelength and the method of extracting feature amounts for each detection wavelength are obtained, respectively.
- Which method to adopt is automatically determined based on the quantification/classification accuracy and the number of effective wavelength bands of both methods.
- a method with the high quantification/classification accuracy may be adopted, a method with the quantification/classification accuracy of a predetermined or user-specified threshold value or more and with the smallest number of effective wavelength bands may be adopted, or a method with the highest quantification/classification accuracy and a predetermined or user-specified number of effective wavelength bands or less may be adopted.
- the quantification/classification model it is required to determine, for example, the hyperparameter for controlling sparseness and the feature amount extraction method.
- the regularization strength ⁇ as the hyperparameter is required to be determined.
- the larger the value of ⁇ the smaller the number of effective wavelength bands, but the quantification/classification accuracy also tends to decrease.
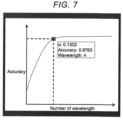
- necessary information is presented. For example, a graph illustrating a relationship between the number of effective wavelength bands and the quantification/classification accuracy as illustrated in FIG.
- FIG. 7 is generated by plotting the number of effective wavelength bands and the quantification/classification accuracy when the value of ⁇ is changed by using the calibration data described above and presented to the user through the output unit 604 described later.
- the example in FIG. 7 is a graph illustrating a relationship between the effective wavelength band and the quantification/classification accuracy in the Lasso regression, and it is assumed that the user selects one quantification/classification model from the graph by using a mouse or the like through the interface unit 110.
- the regularization strength ⁇ , the quantification/classification accuracy, and the number of effective wavelength bands in the selected quantification/classification model are displayed in " ⁇ ", "Accuracy", and "Wavelength".
- the user can select a value of the hyperparameter in consideration of the required measurement time and the quantification/classification accuracy.
- presenting a graph illustrating the relationship between the number of effective wavelength bands and the quantification/classification accuracy in both the case of extracting the feature amount for each excitation wavelength and the case of extracting the feature amount for each detection wavelength it is possible to support the user in selecting from which of excitation wavelength or detection wavelength the feature amount is to be extracted.
- the user may be allowed to determine which of the feature amount extraction methods to use.
- the output unit 604 displays the quantification/classification accuracy, the number of effective wavelength bands, the specific wavelength bands, and the like on the display device 122 through the interface unit 110.
- FIG. 8 illustrates an example of effective wavelength band display.
- the excitation wavelengths of 200 nm, 220 nm, 290 nm, and 315 nm are selected as the effective wavelength bands.
- a GUI illustrating the relationship between the effective wavelength band and the quantification/classification accuracy as illustrated in FIG. 7 may be presented to the user in order to support the determination of the effective wavelength band.
- a spectrum analysis system where the measurement time is shortened by searching for the effective wavelength bands in units of an excitation wavelength or a detection wavelength while realizing highly accurate quantification/classification of the three-dimensional spectrum data by using the spectrum analysis device 600 described in the third embodiment.
- the spectrum analysis system described in the fourth embodiment has two phases including a training phase of constructing the quantification/classification model by using a training data set provided by the user and searching for the effective wavelength band and an evaluation phase of measuring only the spectrum of the effective wavelength band specified in the training phase for the evaluation sample and performing the quantification/classification by using the quantification/classification model constructed in the training phase.
- a training phase of constructing the quantification/classification model by using a training data set provided by the user and searching for the effective wavelength band
- an evaluation phase of measuring only the spectrum of the effective wavelength band specified in the training phase for the evaluation sample and performing the quantification/classification by using the quantification/classification model constructed in the training phase.
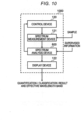
- FIG. 10 illustrates a hardware configuration diagram according to the fourth embodiment.
- a spectrum analysis system 1000 according to the fourth embodiment includes the control device 120, the spectrum measurement device 121, the spectrum analysis device 600, and the display device 122.
- the control device 120 sets the wavelength band of the excitation light with which the sample is irradiated and the detection wavelength band of the light reflected, transmitted, and absorbed by the sample in the spectrum measurement device 121 described later.
- the spectrum measurement device 121 measures the spectra corresponding to the wavelengths set by the control device 120 for a training sample and an evaluation sample and inputs the discretized three-dimensional spectrum data to the spectrum analysis device 600.
- the spectrum analysis device 600 is the spectrum analysis device described in the third embodiment, and in the training phase, constructs a training data from a set of the three-dimensional spectrum data of the training sample output by the spectrum measurement device 121 and the supervised information input by the user and performs generation of the quantification/classification model and the searching for the effective wavelength bands by using the training data set.
- the quantification/classification model generated in the training phase by using the quantification/classification model generated in the training phase, the quantification/classification is performed with an input of the three-dimensional spectrum data (evaluation data) of the evaluation sample output by the spectrum measurement device 121.
- the display device 122 presents the effective wavelength band and the quantification/classification results output by the spectrum analysis device 600 to the user.
- Each device operates differently in the training phase in which the quantification/classification model is constructed and the effective wavelength band is determined based on the training sample and the estimation phase in which the evaluation sample is quantified/classified. For this reason, the operation of each device will be described separately for the training phase and the estimation phase.
- the control device 120 sets the wavelength band of the excitation light with which the training sample is irradiated and the detection wavelength band of reflected light, transmitted light, absorbed light, and the like detected from the sample.
- the entire excitation wavelength bands and the entire detection wavelength bands that can be candidates for the effective wavelength band are set as the measurement wavelength bands.
- the spectrum measurement device 121 measures the spectrum of the training sample for obtaining the training data, acquires the discretized three-dimensional spectrum data, and inputs the discretized three-dimensional spectrum data to the spectrum analysis device 600.
- the spectrum analysis device 600 receives the three-dimensional spectrum data and the supervised information for the three-dimensional spectrum data of the training sample measured by the spectrum measurement device 121 and stores the three-dimensional spectrum data and the supervised information in the memory 112 in the spectrum analysis device 600 as the training data set.
- the quantification/classification model is constructed by the method described in the second embodiment by using the training data set stored in the memory 112. Further, the effective wavelength band is determined automatically by the method described in the third embodiment, or the determination of the effective wavelength band is supported by presenting information to the user through the display device 122.
- the determined effective wavelength band is transmitted to the control device 120 and set as the excitation wavelength band or the detection wavelength band to be measured in the evaluation phase.
- the display device 122 displays a GUI for presenting to the user the quantification/classification accuracy for the training data set output by the spectrum analysis device 600, the number of effective wavelength bands as illustrated in FIG. 8 , the specific wavelength bands, and the like. Further, as described in the third embodiment, a GUI for supporting determination of the effective wavelength band as illustrated in FIG. 7 may be presented to the user.
- the control device 120 sets the effective wavelength band output by the spectrum analysis device 600 in the training phase as the wavelength band of the excitation light with which the evaluation sample is irradiated and the wavelength band of reflected light, transmitted light, absorbed light, and the like detected from the sample.
- the spectrum measurement device 121 measures the spectrum corresponding to the wavelength set by the control device 120 for the evaluation sample, acquires the discretized three-dimensional spectrum data by the same method as in the training phase, and inputs the discretized three-dimensional spectrum data to the spectrum analysis device 600.
- the spectrum analysis device 600 receives the three-dimensional spectrum data of the evaluation sample measured by the spectrum measurement device 121 and performs the quantification/classification by the method described in the first embodiment by using the quantification/classification model constructed in the training phase.
- the display device 122 presents the quantification/classification result of the evaluation sample output by the spectrum analysis device 600 to the user.
- the acquired spectrum may be visualized and displayed if necessary.
- the input unit 201 may perform an arbitrary preprocess on the three-dimensional spectrum data after receiving the discretized three-dimensional spectrum data. For example, centering and standardization process based on a statistic amount such as an average and a standard deviation for each wavelength band of a plurality of the spectrum data and frequency filtering such as a high-pass filter, a low-pass filter, a band-pass filter, or a linear/nonlinear function may be applied, and the detection intensity of a specific region such as the scattered light described above or the detection intensity of a value of a certain value or more may be replaced with a fixed value.
- preprocess may be performed by the wavelength-unit feature amount extraction unit 202.
- the increasing of the training data set may be performed by using any data enrichment method.
- the data enrichment methods for example, the random noise may be assigned, the weighted linear summation of a plurality of the spectrum data may be performed, and value range may be varied.
- the quantification/classification model may be generated by adding an enriched data to the training data set, and the quantification/classification model may be generated by using only the enriched data. Further, more detailed evaluation may be performed by using the enriched data as the calibration data or by enriching the calibration data.
- the wavelength-unit feature amount extraction unit 202 may extract the feature amount by combining the two or more detection intensities input in units of an excitation wavelength or a detection wavelength and other information. For example, a differential value of the spectrum data, coordinate information (information on sets of the excitation wavelength and the detection wavelength) of each detection intensity, light absorption characteristics, experimental conditions, experimental environment, and the like may be combined.
- the calibration data separately from training data may be prepared, newly generated models and models already stored in the memory 112 may be evaluated, and which model to adopt may be determined based on an evaluation result.
- the evaluation result may include not only the quantification/classification result but also the number of effective wavelength bands, and the like.
- a method of selecting a model with a predetermined quantification/classification accuracy or more and the lowest number of effective wavelength bands or a method of selecting a model with a predetermined number of effective wavelength bands or less and the highest quantification/classification accuracy may be used, or a method of performing the selection based on some index calculated from the quantification/classification accuracy and the number of effective wavelength bands may be used.
- the evaluation result may be presented to the user to determine which model to adopt.
- the effective wavelength band by using the quantification/classification model stored in advance in the memory 112 may be searched for and, as illustrated in FIG. 8 , the effective wavelength band may be presented to the user.
- the three-dimensional spectrum data prepared in advance may be stored in the memory 112 and used as a portion of the training data.
- the input unit 201 (601, 1101) may receive the discretized three-dimensional spectrum data and, after that, perform an enlargement/reduction process according to a nearest neighbor interpolation method or a linear interpolation method.
- the quantification/classification model generated from the training data set may be applied by the input unit 201 performing the enlargement process so that the height (the number of excitation wavelength bands) and the width (the number of detection wavelength bands) are five times the discretized EEM data 300 of the evaluation data.
- the enlargement/reduction process may be performed by the estimation unit 203 (1103).
- the estimation unit 203 1103 may perform the enlargement process on the feature amount of the discretized EEM data 300 in units of an excitation wavelength or a detection wavelength obtained by the wavelength-unit feature amount extraction unit 202 so that the size in the direction of the wavelength band or the direction of the detection wavelength band becomes five times and apply the quantification/classification model generated from the training data set. The same is true when performing the reduction process.
- the disclosed spectrum analysis device includes the input unit 201 that receives spectrum data of a sample as an input, the wavelength-unit feature amount extraction unit 202 extracting the feature amount of the sample from a spectrum data, the estimation unit 203 estimating the characteristics of the sample based on the feature amount, and the output unit 204 outputting the estimation result obtained by the estimation unit 203.
- the spectrum data includes a plurality of the excitation wavelengths and spectroscopic spectra indicating the detection wavelengths and the detection intensities for the excitation wavelengths and is a discretized data with a predetermined wavelength width
- the wavelength-unit feature amount extraction unit 202 extracts the feature amount from the detection intensities of two or more detection wavelength bands in each excitation wavelength band or from the detection intensities of two or more excitation wavelength bands in each detection wavelength band
- the estimation unit 203 performs the estimation process to quantify and/or classify the characteristics of the sample.
- the input unit 1101 receives the one or more sets of the spectrum data and the supervised information corresponding to the spectrum data
- the estimation unit 1103 can construct the quantification and/or classification model based on the feature amount extracted from the spectrum data by the wavelength-unit feature amount extraction unit 202 and the supervised information.
- the effective wavelength band searching unit 605 that searches for the effective wavelength band which is the wavelength band corresponding to the feature amount used for the quantification and/or classification based on the parameter of the quantification and/or classification model obtained by the estimation unit 1103 may also be further included.
- the effective wavelength band searching unit 605 searches for the effective wavelength band in units of an excitation wavelength in a case where the wavelength-unit feature amount extraction unit 202 extracts the feature amount for each detection intensity of the two or more detection wavelength bands in each excitation wavelength band and in units of a detection wavelength in a case where the wavelength-unit feature amount extraction unit 202 extracts the feature amount for each detection intensity of the two or more excitation wavelength bands in each detection wavelength band.
- the output unit 604 outputs the effective wavelength band searched by the effective wavelength band searching unit 605 in addition to the estimation result.
- the wavelength-unit feature amount extraction unit 202 may extract the feature amount that can be commonly used for a plurality of the quantifications and/or the classifications by analyzing or learning a plurality of the training data sets.
- the effective wavelength band searching unit 605 acquires, as evaluation information, a quantification and/or classification accuracy and the number of effective wavelength bands in a case where the wavelength-unit feature amount extraction unit 202 extracts the feature amount for each detection intensity of the two or more detection wavelength bands in each excitation wavelength band and in a case where the wavelength-unit feature amount extraction unit 202 extracts the feature amount for each detection intensity of the two or more excitation wavelength bands in each detection wavelength band, and automatically determines the effective wavelength band based on the evaluation information or presents the evaluation information to the user to support the user in determining the effective wavelength band.
- the quantification and the classification can be efficiently performed by using an appropriate number of effective wavelength bands according to the desired classification accuracy.
- the effective wavelength band searching unit 605 acquires, as the evaluation information, the relationship between the quantification and/or classification accuracy and the number of effective wavelength bands in a case of changing the hyperparameter that affect the quantification and/or classification accuracy and the number of effective wavelength bands in the estimation unit 1103, automatically determines the value of the hyperparameter based on the evaluation information or presents the evaluation information to the user to support the user to determine the value of the hyperparameter.
- the input unit 601 receives the effective wavelength band output by the effective wavelength band searching unit 605, and among the spectrum data received as an input, only the spectrum corresponding to the effective wavelength band is output to the wavelength-unit feature amount extraction unit 202.
- the disclosed system includes the control device 120 that sets the wavelength band of the excitation light with which the sample is irradiated and the wavelength band of the detection light, the spectrum measurement device 121 that measures the spectrum data corresponding to the wavelength band set in the control device for the sample, the spectrum analysis device 600 that analyzes the spectrum data measured by the spectrum measurement device 121, and the display device 122 that displays the estimation result obtained by the spectrum analysis device.
- the spectrum analysis device 600 includes the input unit 601 receiving spectrum data of the sample as an input, the wavelength-unit feature amount extraction unit 202 extracting the feature amount of the sample from the spectrum data, the estimation unit 1103 estimating the characteristics of the sample based on the feature amount, and the output unit 604 outputting the estimation result obtained by the estimation unit 1103.
- the spectrum data includes a plurality of excitation wavelengths and spectroscopic spectra indicating detection wavelengths and detection intensities for the excitation wavelengths and is a discretized data with a predetermined wavelength width.
- the wavelength-unit feature amount extraction unit 202 extracts the feature amount from the detection intensities of two or more detection wavelength bands in each excitation wavelength band or the detection intensities of two or more excitation wavelength bands in each detection wavelength band.
- the estimation unit 1103 performs the estimation process of quantifying and/or classifying the characteristics of the sample.
- a system having the spectrum analysis device can realize highly accurate quantification and/or classification with reduced influence of noise and limit the wavelength band used for the quantification and/or classification in units of an excitation wavelength or a detection wavelength while utilizing the spatial information in the three-dimensional spectrum data.
- the spectrum analysis device 600 further includes the effective wavelength band searching unit 605 that searches for the effective wavelength band which is the wavelength band corresponding to the feature amount used for the quantification and/or classification based on the parameter of the quantification and/or classification model obtained by the estimation unit 1103.
- the effective wavelength band searching unit 605 searches for the effective wavelength band in units of an excitation wavelength in a case where the wavelength-unit feature amount extraction unit 202 extracts the feature amount for each detection intensity of the two or more detection wavelength bands in each excitation wavelength band and in units of a detection wavelength in a case where the wavelength-unit feature amount extraction unit 202 extracts the feature amount for each detection intensity of the two or more excitation wavelength bands in each detection wavelength band.
- the output unit 604 outputs the effective wavelength band searched by the effective wavelength band searching unit 605 in addition to the estimation result.
- the control device 120 receives the effective wavelength band output by the spectrum analysis device 600 and sets the effective wavelength band as the wavelength band of the excitation light with which the sample is irradiated or the wavelength band of the detection light to be detected.
- the time required for spectrum measurement device 121 to acquire the spectrum data can be shortened.
- the invention is not limited to the above embodiments, and includes various modified examples.
- the above-described embodiments have been described in detail in order to explain the invention in an easy-to-understand manner, and the embodiments are not limited to have all the necessary configurations.
- the embodiments are not limited to have all the necessary configurations.
- deletion of such a configuration replacement and addition of the configuration are possible.
Landscapes
- Physics & Mathematics (AREA)
- Spectroscopy & Molecular Physics (AREA)
- General Physics & Mathematics (AREA)
- Health & Medical Sciences (AREA)
- Nuclear Medicine, Radiotherapy & Molecular Imaging (AREA)
- Human Computer Interaction (AREA)
- Engineering & Computer Science (AREA)
- Life Sciences & Earth Sciences (AREA)
- Chemical & Material Sciences (AREA)
- Analytical Chemistry (AREA)
- Biochemistry (AREA)
- General Health & Medical Sciences (AREA)
- Immunology (AREA)
- Pathology (AREA)
- Investigating, Analyzing Materials By Fluorescence Or Luminescence (AREA)
Applications Claiming Priority (1)
| Application Number | Priority Date | Filing Date | Title |
|---|---|---|---|
| JP2021208165A JP7752041B2 (ja) | 2021-12-22 | 2021-12-22 | スペクトル解析方法、装置およびシステム |
Publications (1)
| Publication Number | Publication Date |
|---|---|
| EP4202416A1 true EP4202416A1 (en) | 2023-06-28 |
Family
ID=84535984
Family Applications (1)
| Application Number | Title | Priority Date | Filing Date |
|---|---|---|---|
| EP22213312.6A Pending EP4202416A1 (en) | 2021-12-22 | 2022-12-14 | Spectrum analysis method, device and system |
Country Status (2)
| Country | Link |
|---|---|
| EP (1) | EP4202416A1 (enExample) |
| JP (1) | JP7752041B2 (enExample) |
Families Citing this family (1)
| Publication number | Priority date | Publication date | Assignee | Title |
|---|---|---|---|---|
| JP2025129886A (ja) * | 2024-02-26 | 2025-09-05 | 株式会社日立ハイテク | スペクトル生成装置および方法、機械学習モデル構築装置 |
Citations (3)
| Publication number | Priority date | Publication date | Assignee | Title |
|---|---|---|---|---|
| JP2015180895A (ja) | 2015-06-22 | 2015-10-15 | 国立研究開発法人農業・食品産業技術総合研究機構 | 判別フィルタ設計方法、判別方法、判別フィルタセット、判別装置、および、プログラム |
| JP2018013418A (ja) | 2016-07-21 | 2018-01-25 | ヤンマー株式会社 | 波長選択方法、対象物質含有量推定装置の製造方法及び対象物質含有量推定装置 |
| US20200268252A1 (en) * | 2019-02-27 | 2020-08-27 | Deep Smart Light Limited | Noninvasive, multispectral-fluorescence characterization of biological tissues with machine/deep learning |
Family Cites Families (8)
| Publication number | Priority date | Publication date | Assignee | Title |
|---|---|---|---|---|
| FR2961597B1 (fr) | 2010-06-16 | 2017-02-24 | Spectralys Innovation | Procede de caracterisation d'un produit agroalimentaire et appareil pour la mise en oeuvre d'un tel procede. |
| JP6212454B2 (ja) | 2014-08-26 | 2017-10-11 | 国立研究開発法人農業・食品産業技術総合研究機構 | チーズの熟成度指標推定方法、チーズの熟成度指標推定装置、コンピュータが実行可能なプログラム、及びプロセスチーズの製造方法 |
| CN104458690A (zh) | 2014-12-19 | 2015-03-25 | 中国环境科学研究院 | 一种确定有机废弃物中类蛋白物质存在形态的方法 |
| JP6831094B2 (ja) | 2016-09-06 | 2021-02-17 | 株式会社日立ハイテクサイエンス | 未知試料判定方法、未知試料判定装置及び未知試料判定プログラム |
| WO2018117273A1 (ja) | 2016-12-22 | 2018-06-28 | 国立大学法人筑波大学 | データ作成方法及びデータ使用方法 |
| JP2020191783A (ja) | 2017-08-17 | 2020-12-03 | 東京エレクトロン株式会社 | 培養培地分析による多能性幹細胞の未分化状態の位置特異的な判定方法 |
| US11295152B2 (en) | 2019-03-01 | 2022-04-05 | Basf Coatings Gmbh | Method and system for object recognition via a computer vision application |
| CN114026408A (zh) | 2019-07-30 | 2022-02-08 | 亚历法克斯公司 | 识别微生物的方法 |
-
2021
- 2021-12-22 JP JP2021208165A patent/JP7752041B2/ja active Active
-
2022
- 2022-12-14 EP EP22213312.6A patent/EP4202416A1/en active Pending
Patent Citations (3)
| Publication number | Priority date | Publication date | Assignee | Title |
|---|---|---|---|---|
| JP2015180895A (ja) | 2015-06-22 | 2015-10-15 | 国立研究開発法人農業・食品産業技術総合研究機構 | 判別フィルタ設計方法、判別方法、判別フィルタセット、判別装置、および、プログラム |
| JP2018013418A (ja) | 2016-07-21 | 2018-01-25 | ヤンマー株式会社 | 波長選択方法、対象物質含有量推定装置の製造方法及び対象物質含有量推定装置 |
| US20200268252A1 (en) * | 2019-02-27 | 2020-08-27 | Deep Smart Light Limited | Noninvasive, multispectral-fluorescence characterization of biological tissues with machine/deep learning |
Non-Patent Citations (1)
| Title |
|---|
| HIGASHI HIROSHI ET AL: "Sparse regression for selecting fluorescence wavelengths for accurate prediction of food properties", CHEMOMETRICS AND INTELLIGENT LABORATORY SYSTEMS, ELSEVIER SCIENCE PUBLISHERS B.V. AMSTERDAM, NL, vol. 154, 17 March 2016 (2016-03-17), pages 29 - 37, XP029524083, ISSN: 0169-7439, DOI: 10.1016/J.CHEMOLAB.2016.03.008 * |
Also Published As
| Publication number | Publication date |
|---|---|
| JP7752041B2 (ja) | 2025-10-09 |
| JP2023092883A (ja) | 2023-07-04 |
Similar Documents
| Publication | Publication Date | Title |
|---|---|---|
| US11216741B2 (en) | Analysis apparatus, analysis method, and non-transitory computer readable medium | |
| CN108629365B (zh) | 分析数据解析装置以及分析数据解析方法 | |
| Bouveresse et al. | Two novel methods for the determination of the number of components in independent components analysis models | |
| CN110232419A (zh) | 一种边坡岩石类别自动识别的方法 | |
| JP6828807B2 (ja) | データ解析装置、データ解析方法およびデータ解析プログラム | |
| CN102708373A (zh) | 融合空间信息及光谱信息的遥感图像的分类方法及装置 | |
| CN117538287A (zh) | 一种无损检测黄冠梨果磷含量的方法及装置 | |
| EP3961555A1 (en) | Learning system, data generating device, data generating method, and data generating program | |
| CN114184599B (zh) | 单细胞拉曼光谱采集数目估计方法、数据处理方法及装置 | |
| CN113763381B (zh) | 一种融合图像全局信息的对象检测方法及系统 | |
| EP4202416A1 (en) | Spectrum analysis method, device and system | |
| US10395139B2 (en) | Information processing apparatus, method and computer program product | |
| JP4696278B2 (ja) | 領域分割画像生成方法、領域分割画像生成装置及びコンピュータプログラム | |
| TW201321739A (zh) | 訊號分析裝置、訊號分析方法及電腦程式產品 | |
| CN117789038A (zh) | 一种基于机器学习的数据处理与识别模型的训练方法 | |
| CN113567369A (zh) | 一种基于多光谱遥感的森林环境监测方法及系统 | |
| CN120112781A (zh) | 光谱分析装置、光谱分析系统和光谱分析方法 | |
| JP6334281B2 (ja) | 林相解析装置、林相解析方法及びプログラム | |
| CN115931727A (zh) | 一种叶绿素a遥感反演方法、装置、系统以及存储介质 | |
| EP3637154A1 (en) | Analysis device, stratum dating device, analysis method, stratum dating method, and program | |
| KR102187344B1 (ko) | 결정 트리를 이용한 반려동물 진단 방법 및 장치 | |
| CN117541832B (zh) | 异常检测方法、系统、电子设备及存储介质 | |
| CN111105417A (zh) | 影像噪声定位方法及系统 | |
| Dilillo et al. | Enhancing Lettuce Classification: Optimizing Spectral Wavelength Selection via CCARS and PLS-DA | |
| CN118225740A (zh) | 光谱分析方法、装置和系统 |
Legal Events
| Date | Code | Title | Description |
|---|---|---|---|
| PUAI | Public reference made under article 153(3) epc to a published international application that has entered the european phase |
Free format text: ORIGINAL CODE: 0009012 |
|
| STAA | Information on the status of an ep patent application or granted ep patent |
Free format text: STATUS: REQUEST FOR EXAMINATION WAS MADE |
|
| 17P | Request for examination filed |
Effective date: 20230210 |
|
| AK | Designated contracting states |
Kind code of ref document: A1 Designated state(s): AL AT BE BG CH CY CZ DE DK EE ES FI FR GB GR HR HU IE IS IT LI LT LU LV MC ME MK MT NL NO PL PT RO RS SE SI SK SM TR |
|
| STAA | Information on the status of an ep patent application or granted ep patent |
Free format text: STATUS: EXAMINATION IS IN PROGRESS |
|
| 17Q | First examination report despatched |
Effective date: 20240312 |