EP4123310B1 - Automatische analysevorrichtung - Google Patents
Automatische analysevorrichtung Download PDFInfo
- Publication number
- EP4123310B1 EP4123310B1 EP21771338.7A EP21771338A EP4123310B1 EP 4123310 B1 EP4123310 B1 EP 4123310B1 EP 21771338 A EP21771338 A EP 21771338A EP 4123310 B1 EP4123310 B1 EP 4123310B1
- Authority
- EP
- European Patent Office
- Prior art keywords
- value
- variation
- measurement
- quality control
- calibration solution
- Prior art date
- Legal status (The legal status is an assumption and is not a legal conclusion. Google has not performed a legal analysis and makes no representation as to the accuracy of the status listed.)
- Active
Links
Images


Classifications
-
- G—PHYSICS
- G01—MEASURING; TESTING
- G01N—INVESTIGATING OR ANALYSING MATERIALS BY DETERMINING THEIR CHEMICAL OR PHYSICAL PROPERTIES
- G01N35/00—Automatic analysis not limited to methods or materials provided for in any single one of groups G01N1/00 - G01N33/00; Handling materials therefor
- G01N35/00584—Control arrangements for automatic analysers
- G01N35/00594—Quality control, including calibration or testing of components of the analyser
- G01N35/00613—Quality control
- G01N35/00623—Quality control of instruments
-
- G—PHYSICS
- G01—MEASURING; TESTING
- G01N—INVESTIGATING OR ANALYSING MATERIALS BY DETERMINING THEIR CHEMICAL OR PHYSICAL PROPERTIES
- G01N35/00—Automatic analysis not limited to methods or materials provided for in any single one of groups G01N1/00 - G01N33/00; Handling materials therefor
- G01N35/00584—Control arrangements for automatic analysers
- G01N35/00594—Quality control, including calibration or testing of components of the analyser
- G01N35/00613—Quality control
-
- G—PHYSICS
- G01—MEASURING; TESTING
- G01N—INVESTIGATING OR ANALYSING MATERIALS BY DETERMINING THEIR CHEMICAL OR PHYSICAL PROPERTIES
- G01N35/00—Automatic analysis not limited to methods or materials provided for in any single one of groups G01N1/00 - G01N33/00; Handling materials therefor
- G01N35/00584—Control arrangements for automatic analysers
- G01N35/00594—Quality control, including calibration or testing of components of the analyser
- G01N35/00693—Calibration
-
- G—PHYSICS
- G01—MEASURING; TESTING
- G01N—INVESTIGATING OR ANALYSING MATERIALS BY DETERMINING THEIR CHEMICAL OR PHYSICAL PROPERTIES
- G01N35/00—Automatic analysis not limited to methods or materials provided for in any single one of groups G01N1/00 - G01N33/00; Handling materials therefor
- G01N35/10—Devices for transferring samples or any liquids to, in, or from, the analysis apparatus, e.g. suction devices, injection devices
- G01N35/1002—Reagent dispensers
-
- G—PHYSICS
- G01—MEASURING; TESTING
- G01N—INVESTIGATING OR ANALYSING MATERIALS BY DETERMINING THEIR CHEMICAL OR PHYSICAL PROPERTIES
- G01N35/00—Automatic analysis not limited to methods or materials provided for in any single one of groups G01N1/00 - G01N33/00; Handling materials therefor
- G01N35/00584—Control arrangements for automatic analysers
- G01N35/00594—Quality control, including calibration or testing of components of the analyser
- G01N35/00693—Calibration
- G01N2035/00702—Curve-fitting; Parameter matching; Calibration constants
Definitions
- the present invention relates to an automatic analysis device that analyzes a sample.
- PTL 1 does not disclose supporting an analysis of a cause of variation occurring in a measurement value of a quality control substance.
- the measurement value of the quality control substance varies, it is desirable to quickly analyze the cause of variation. For example, when it is possible to estimate whether the cause of variation in the measurement value of the quality control substance is a lot change of a calibration solution used for calibration, a subsequent measure is easy to be taken.
- an object of the invention is to provide an automatic analysis device that estimates a cause of variation in a measurement value of a quality control substance.
- sample cups 3 each containing a sample such as blood or urine supplied from a patient or a standard sample used for calibration and quality control are concentrically arranged and loaded.
- the sample cups 3 may not be loaded on the sample disk 2 but on a sample rack in which the sample cups 3 are arranged on a straight line.
- the standard sample used for calibration includes a standard solution having a known concentration of a specific component and a calibration solution.
- the standard solution is a solution containing the specific component, and has at least a concentration in the vicinity of an upper limit value and a concentration in the vicinity of a lower limit value of a measurement range of the automatic analysis device 1. That is, at least two standard solutions are used.
- the calibration solution is a solution that simulates a sample supplied from the patient.
- Reagents to be reacted with a sample or the like are stored on the reagent disk 4. Each reagent is dispensed into the reaction container 5 from the reagent disk 4 by the reagent dispensing unit 6. Further, the sample or the like is dispensed into the reaction container 5 from a sample cup 3 by the sample dispensing unit 7. The reagent, the sample, and the like that are dispensed into the reaction container 5 react and develop a color by being maintained at a predetermined temperature, and absorbance of a color-developed liquid is measured by the photometer 13.
- the reagent disk 4, the reaction container 5, the photometer 13, and the like related to absorbance measurement are collectively referred to as colorimetric units.
- the electrolyte measurement unit 8 is a unit that measures potential of an electrolyte solution obtained by diluting the sample or the standard sample, and will be described later with reference to FIG. 2 .
- the computer 10 controls units connected through the interface 9, calculates a concentration value of the specific component based on results measured by the colorimetric units or the electrolyte measurement unit 8, and outputs the calculated concentration value to the output unit 12.
- the output unit 12 is, for example, a liquid crystal monitor, a touch panel, or a printer, and displays and prints the concentration value of the specific component output from the computer 10. Measurement conditions and the like in the colorimetric units or the electrolyte measurement unit 8 may be received from the input unit 11.
- the input unit 11 is, for example, a keyboard or a mouse, and when the output unit 12 is a touch panel, a graphical user interface (GUI) displayed on the touch panel functions as the input unit 11.
- GUI graphical user interface
- the electrolyte measurement unit 8 is a unit that measures a concentration of ions contained in the sample or the standard sample, and includes an electrolyte concentration calculation unit 14, a potentiometer 15, a dilution tank 18, a Cl electrode 19, a K electrode 20, a Na electrode 21, a pinch valve 22, and a reference electrode 23.
- the sample or the standard sample dispensed from the sample cup 3 by the sample dispensing unit 7 is diluted by the diluent 17 to a concentration suitable for measurement.
- the diluted sample or the diluted standard sample is passed through the Cl electrode 19, the K electrode 20, and the Na electrode 21 by operations of the pinch valve 22.
- Potential corresponding to ion concentrations of Cl ions, K ions, and Na ions contained in the passing-through solution is generated in the Cl electrode 19, the K electrode 20, and the Na electrode 21, respectively.
- potential corresponding to a concentration of a reference electrode solution 24 is also generated in the reference electrode 23, a potential difference between each of the Cl electrode 19, the K electrode 20, and the Na electrode 21 and the reference electrode 23 is measured by the potentiometer 15.
- a potential difference of an internal standard solution 16 with respect to the reference electrode solution 24 is measured as a reference potential of the electrolyte measurement unit 8.
- the potential difference measured by the potentiometer 15 is sent to the electrolyte concentration calculation unit 14.
- the electrolyte concentration calculation unit 14 is a calculation unit that converts the potential difference measured for the sample into the ion concentrations of the Cl ions, the K ions, and the Na ions contained in the sample, and includes, for example, a central processing unit (CPU) and a memory.
- the computer 10 may function as the electrolyte concentration calculation unit 14.
- a calibration curve which is a straight line representing a relationship between the potential difference and the concentration, is used.
- the calibration curve is created by executing calibration including measurement of a potential difference of a plurality of standard solutions having known concentrations or a calibration solution.
- an inclination of the calibration curve is calculated by setting a potential difference measured for a standard solution having a low concentration and a potential difference measured for a standard solution having a high concentration on a vertical axis and setting concentrations of the two standard solutions on a horizontal axis. Further, a segment of the calibration curve having the calculated inclination is calculated based on the potential difference measured for the calibration solution and a concentration of the calibration solution.
- the calibration curve created by calibration is stored in the electrolyte concentration calculation unit 14, and is read and used when a concentration of the sample or a quality control substance is calculated.
- FIG. 3 is an example of the daily difference variation graph in which a vertical axis represents measurement values of the quality control substance having a known Na concentration and a horizontal axis represents measurement dates, and it is confirmed daily that the measurement values of the concentration of the quality control substance are between upper and lower limit values.
- the upper and lower limit values are set for each quality control substance, and for example, the quality control may range from (average value - 2 ⁇ standard deviation) to (average value + 2 ⁇ standard deviation) based on an average value and standard deviation when the same quality control substance is measured a plurality of times.
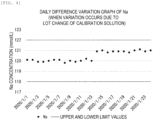
- FIG. 4 is an example of the daily difference variation graph in which a variation occurs in measurement values of the quality control substance, and shows a case in which a lot of the calibration solution is changed to 2020/1/14.
- a concentration value of the calibration solution provided by a reagent manufacturer and the potential difference measured for the calibration solution are used.
- the concentration value of the calibration solution provided by the reagent manufacturer is referred to as a display value.
- the display value is input into the automatic analysis device by an operator through the input unit 11.
- an actual concentration of the calibration solution has a width of 139.5 to 140.4. That is, even in a case of the calibration solution having the same display value of 140, actual concentration values between different lots may have a maximum difference of 0.9, and the measurement value of the quality control substance may vary due to use of a different calibration curve according to a difference of an actual concentration value.
- a cause of variation in the measurement value of the quality control substance is not limited to a lot change of the calibration solution. If the operator misjudges the cause of variation, it takes a long time to deal with the variation.
- the cause of variation in the measurement value of the quality control substance is estimated based on a comparison result between a predicted variation amount, which is calculated based on a difference value between the concentration values of the calibration solution used for calibration before and after the lot change, and a variation amount of the measurement value of the quality control substance.
- the computer 10 causes the colorimetric units or the electrolyte measurement unit 8 to measure the standard solution and the calibration solution, and executes calibration. Specifically, the inclination of the calibration curve is calculated based on measurement values of absorbance or potential differences of the standard solutions having a low concentration and a high concentration and the concentrations of the two standard solutions. Further, a segment of the calibration curve having the calculated inclination is calculated based on measurement values of absorbance or a potential difference of the calibration solution and the display value of the concentration of the calibration solution.
- a calibration curve is created based on a display value C N of a concentration of a new lot calibration solution, which is the calibration solution after the lot change, and a measurement value for the new lot calibration solution, and the calibration curve is stored together with the lot change of the calibration solution.
- a display value C o of a concentration of an old lot calibration solution which is the calibration solution before the lot change, is stored together with the display value C N of the new lot calibration solution.
- the measurement values of the absorbance or the potential differences for the old lot calibration solution and the new lot calibration solution are also stored.
- the calibration curve is created and stored based on the display value C o of the old lot calibration solution and the measurement value for the old lot calibration solution.
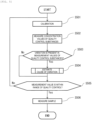
- the computer 10 causes the colorimetric units or the electrolyte measurement unit 8 to measure concentration values of at least two quality control substances. Specifically, a measurement value of absorbance or a potential difference of each quality control substance is converted into a concentration value of the quality control substance by the calibration curve calculated in S501. The calculated concentration value may be displayed in the daily difference variation graph.
- the computer 10 determines whether a variation is present in the concentration values of the quality control substances measured in S502. Presence or absence of the variation is determined based on, for example, a comparison between an average value of past measurement values ⁇ 2 ⁇ standard deviation and the measurement value in S502. Since a measurement value of 120.9 of 2020/1/14 in FIG. 4 is out of a range of 119.8 to 120.2 determined based on an average value of 120.0 of measurement values from 2020/1/1 to 2020/1/13 and a standard deviation of 0.1, it is determined that the variation is present.
- the process proceeds to S504, and when the variation is absent, the process proceeds to S505.
- a difference between the average value of the past measurement values and the measurement value in S502 is acquired as the variation amount of the measurement value of the quality control substance. That is, the computer 10 functions as an acquisition unit that acquires the variation amount of the measurement value of the quality control substance.
- the computer 10 estimates the cause of variation in the measurement value of the concentration of the quality control substance.
- the computer 10 determines whether the measurement value of each quality control substance and the concentration value of the calibration solution have the same variation direction among lots. Specifically, it is determined whether positive or negative of the variation amount acquired in S503 is the same as that of a difference value (C' N - C' o ) between the concentration values C' o and C' N calculated in S603. When the variation directions are the same, the process proceeds to S605, and when the variation directions are different, the process proceeds to S608.
- the computer 10 estimates that the cause of variation in the measurement value of the quality control substance is the lot change of the calibration solution.
- the estimated cause of variation may be displayed in a daily difference variation graph as shown in FIG. 7 , for example.
- a portion where the measurement value of the Na concentration varies is indicated by a marker different from other portions, and a mark for drawing attention and a comment indicating the cause of variation are displayed.
- other portions are black circular markers
- the portion where the measurement value varies is indicated by a white rhombic marker.
- "!” is displayed as the mark for drawing attention
- "Concentration varies due to lot change of calibration solution" is displayed as a comment indicating the cause of variation.
- the computer 10 estimates that the cause of variation in the measurement value of the quality control substance is not the lot change of the calibration solution.
- the estimated cause of variation may be displayed as a comment in the daily difference variation graph. Instead of displaying the comment of the cause of variation, the difference value (C' N - C' o ) between the measurement values of the concentrations of the calibration solution before and after the lot change may be displayed as a reference.
- the cause of variation in the measurement value of the concentration of the quality control substance is estimated. That is, the computer 10 functions as an estimation unit that estimates the cause of variation occurring in the measurement value of the quality control substance. The operator may take a measure according to the estimated cause of variation.
- the computer 10 causes the colorimetric units or the electrolyte measurement unit 8 to measure the sample supplied from the patient. A measurement result is output to the output unit 12.
- the cause of variation is estimated. Since the operator can take an appropriate measure according to the cause of variation estimated by the automatic analysis device 1, subsequent sample measurement is smoothly executed, and quality of the sample measurement is also maintained.
- estimation of the cause of variation in the measurement value of the quality control substance is described. It is preferable that the operator takes a measure according to the estimated cause of variation.
- the concentration value of the calibration solution input through the input unit 11 may be changed within a range of display values provided by the reagent manufacturer. In the present embodiment, presentation of a more appropriate input value will be described.
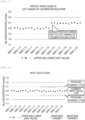
- the display value of the calibration solution provided by the reagent manufacturer is in a range of values that can be input, and is denoted by, for example, "140 ⁇ 1" as the display value of Na. Therefore, in the present embodiment, when the process proceeds to S607 in FIG. 6 , a more appropriate input value is calculated by the computer 10 and is output to the output unit 12. For example, the display value C N at which the predicted variation amount calculated in S605 is minimized is calculated within the range of display values provided by the reagent manufacturer, and is output as the more appropriate input value.
- a plurality of input values may be output, and as shown in FIG. 8 , a daily difference variation graph created when each input value is used may be displayed as an input value guide. According to the input value guide in FIG. 8 , the operator can quickly determine which input value is to be used.
- the measurement value of the quality control substance may be corrected according to the cause of variation. Therefore, in the present embodiment, when the process proceeds to S607 in FIG. 6 , the measurement value of the quality control substance is corrected according to the variation amount generated due to the lot change of the calibration solution.
- a deviation ⁇ (C' N - C' o ) - (C N - C o ) ⁇ between the difference value (C' N - C' o ) between the concentration values of the old and new lots of the calibration solution and the difference value (C N - C o ) between the display values is subtracted from the measurement value of the quality control substance to execute correction. Whether to correct the measurement value of the quality control substance is selected based on a setting of the operator.
Landscapes
- Engineering & Computer Science (AREA)
- Quality & Reliability (AREA)
- General Health & Medical Sciences (AREA)
- Chemical & Material Sciences (AREA)
- Analytical Chemistry (AREA)
- Biochemistry (AREA)
- Physics & Mathematics (AREA)
- General Physics & Mathematics (AREA)
- Immunology (AREA)
- Pathology (AREA)
- Life Sciences & Earth Sciences (AREA)
- Health & Medical Sciences (AREA)
- Automatic Analysis And Handling Materials Therefor (AREA)
Claims (7)
- Automatische Analysevorrichtung (1) zum Analysieren einer Probe, wobei die automatische Analysevorrichtung (1) umfasst:eine Erfassungseinheit, die konfiguriert ist, einen Variationsbetrag eines Messwerts einer Qualitätskontrollsubstanz, die für eine Qualitätskontrolle verwendet wird, zu erfassen, wobei der Variationsbetrag ein Unterschied zwischen dem Mittelwert der vergangenen Messwerte und dem Messwert ist;eine Berechnungseinheit, die konfiguriert ist, einen vorhergesagten Variationsbetrag anhand eines Unterschiedswerts zwischen Konzentrationswerten einer Kalibrierungslösung, die für eine Kalibration verwendet wird, vor und nach einer Losänderung zu berechnen; undeine Schätzeinheit, die konfiguriert ist, eine Ursache einer Variation, die in dem Messwert der Qualitätskontrollsubstanz auftritt, anhand eines Vergleichsergebnisses zwischen dem Variationsbetrag und dem vorhergesagten Variationsbetrag zu schätzen, wobeidie Schätzeinheit konfiguriert ist, zu schätzen, dass die Losänderung der Kalibrierungslösung die Ursache der Variation ist, wenn der Variationsbetrag innerhalb eines Bereichs des vorhergesagten Variationsbetrags liegt.
- Automatische Analysevorrichtung (1) nach Anspruch 1,
wobei die Berechnungseinheit den vorhergesagten Variationsbetrag anhand eines Anzeigenunterschiedswerts, der ein Unterschiedswert zwischen Anzeigewerten einer Konzentration der Kalibrierungslösung vor und nach der Losänderung ist, und eines Messunterschiedswerts, der ein Unterschiedswert zwischen Messwerten der Konzentration der Kalibrierungslösung vor und nach der Losänderung ist, berechnet, wobei ein Anzeigenwert der Konzentrationswert der Kalibrierungslösung ist, die durch den Reagenzhersteller bereitgestellt wird. - Automatische Analysevorrichtung (1) nach Anspruch 2, wobeidie Schätzeinheit schätzt, dass die Losänderung der Kalibrierungslösung nicht die Ursache der Variation ist, wenn Richtungen der Variationen des Messwerts der Qualitätskontrollsubstanz und des Messwerts der Konzentration der Kalibrierungslösung verschieden sind,wobei die Richtung der Variation durch ein Vorzeichen des Variationsbetrags, das negativ oder positiv ist, bestimmt wird.
- Automatische Analysevorrichtung (1) nach Anspruch 2, wobei
dann, wenn die Schätzeinheit schätzt, dass die Losänderung der Kalibrierungslösung die Ursache der Variation ist, und die durch den Reagenzhersteller bereitgestellte Kalibrierungslösung in einem Bereich von Werten ist, der Anzeigenwert, bei dem der berechnete vorhergesagte Variationsbetrag minimiert wird, innerhalb des Bereichs von Anzeigenwerten berechnet wird, der durch den Reagenzhersteller bereitgestellt wird, und als ein Eingabewert ausgegeben wird. - Automatische Analysevorrichtung (1) nach Anspruch 4, wobei
der Eingabewert in einem Tagesunterschiedsvariationsgraph angezeigt wird, der eine Verschiebung des Messwerts der Qualitätskontrollsubstanz angibt. - Automatische Analysevorrichtung (1) nach Anspruch 2, wobei
dann, wenn die Schätzeinheit schätzt, dass die Losänderung der Kalibrierungslösung die Ursache der Variation ist, der Messwert der Qualitätskontrollsubstanz anhand des Anzeigenunterschiedswerts und des Messunterschiedswerts korrigiert wird. - Automatische Analysevorrichtung (1) nach Anspruch 2, wobei
dann, wenn die Schätzeinheit schätzt, dass die Losänderung der Kalibrierungslösung nicht die Ursache der Variation ist, der Messunterschiedswert in einem Tagesunterschiedsvariationsgraphen angezeigt wird, der eine Verschiebung des Messwerts der Qualitätskontrollsubstanz angibt.
Applications Claiming Priority (2)
| Application Number | Priority Date | Filing Date | Title |
|---|---|---|---|
| JP2020048865 | 2020-03-19 | ||
| PCT/JP2021/001436 WO2021186874A1 (ja) | 2020-03-19 | 2021-01-18 | 自動分析装置 |
Publications (3)
| Publication Number | Publication Date |
|---|---|
| EP4123310A1 EP4123310A1 (de) | 2023-01-25 |
| EP4123310A4 EP4123310A4 (de) | 2024-04-17 |
| EP4123310B1 true EP4123310B1 (de) | 2025-07-09 |
Family
ID=77770756
Family Applications (1)
| Application Number | Title | Priority Date | Filing Date |
|---|---|---|---|
| EP21771338.7A Active EP4123310B1 (de) | 2020-03-19 | 2021-01-18 | Automatische analysevorrichtung |
Country Status (5)
| Country | Link |
|---|---|
| US (1) | US20230135949A1 (de) |
| EP (1) | EP4123310B1 (de) |
| JP (1) | JP7423752B2 (de) |
| CN (1) | CN115280156B (de) |
| WO (1) | WO2021186874A1 (de) |
Families Citing this family (1)
| Publication number | Priority date | Publication date | Assignee | Title |
|---|---|---|---|---|
| JP2023126007A (ja) * | 2022-02-28 | 2023-09-07 | シスメックス株式会社 | 検体分析装置に管理基準値を適用する方法、検体分析装置、及びコンピュータプログラム |
Family Cites Families (24)
| Publication number | Priority date | Publication date | Assignee | Title |
|---|---|---|---|---|
| CA1312263C (en) * | 1986-11-04 | 1993-01-05 | James William Bacus | Apparatus and method for analyses of biological specimens |
| DE4121089A1 (de) * | 1991-06-26 | 1993-01-07 | Boehringer Mannheim Gmbh | Analysesystem zur automatischen analyse von koerperfluessigkeiten |
| JP3647105B2 (ja) * | 1995-10-26 | 2005-05-11 | アークレイ株式会社 | 分析方法及び分析装置 |
| JPH11326332A (ja) * | 1998-05-18 | 1999-11-26 | Hitachi Ltd | 自動分析装置 |
| JP3598019B2 (ja) * | 1999-06-16 | 2004-12-08 | 株式会社日立製作所 | 自動分析装置 |
| JP4006203B2 (ja) * | 2001-08-21 | 2007-11-14 | 株式会社日立製作所 | 自動分析装置及び化学分析方法の精度管理方法 |
| WO2006009251A1 (ja) * | 2004-07-22 | 2006-01-26 | Wako Pure Chemical Industries, Ltd. | 分析支援方法、分析装置、遠隔コンピュータ、データ解析方法及びプログラム並びに試薬容器 |
| JP4619892B2 (ja) * | 2005-08-04 | 2011-01-26 | 株式会社日立ハイテクノロジーズ | 自動分析装置 |
| JP4871618B2 (ja) * | 2006-03-14 | 2012-02-08 | 株式会社日立ハイテクノロジーズ | 精度管理システム |
| JP4991586B2 (ja) * | 2008-01-31 | 2012-08-01 | 株式会社日立ハイテクノロジーズ | 自動分析装置 |
| JP2009222610A (ja) * | 2008-03-18 | 2009-10-01 | Hitachi High-Technologies Corp | 自動分析装置 |
| CN101368884A (zh) * | 2008-09-28 | 2009-02-18 | 广东省环境保护监测中心站 | 适用于空气污染监测仪器在线校准的样品采送装置及方法 |
| JP2010133870A (ja) * | 2008-12-05 | 2010-06-17 | Beckman Coulter Inc | 自動分析装置及び自動分析装置の精度管理方法 |
| CN102246047B (zh) * | 2008-12-09 | 2013-11-13 | 株式会社日立高新技术 | 自动分析装置 |
| EP2359147A1 (de) * | 2008-12-19 | 2011-08-24 | F. Hoffmann-La Roche AG | Vorrichtung und verfahren zur automatisierten durchführung einer verifikation der kalibration (calibration verification) eines analysators |
| US9229015B2 (en) * | 2008-12-26 | 2016-01-05 | Hitachi High-Technologies Corporation | Accuracy management method |
| JP5147906B2 (ja) * | 2010-07-22 | 2013-02-20 | 株式会社日立ハイテクノロジーズ | 精度管理システム |
| JP2012032188A (ja) * | 2010-07-29 | 2012-02-16 | Hitachi High-Technologies Corp | 自動分析システム |
| JP5855372B2 (ja) * | 2011-07-07 | 2016-02-09 | シスメックス株式会社 | 検体分析装置及びコンピュータプログラム |
| EP2813839A1 (de) * | 2013-06-12 | 2014-12-17 | Roche Diagniostics GmbH | Kalibrierverfahren für Fotometrie |
| EP3088901B1 (de) * | 2013-12-25 | 2025-07-02 | Hitachi High-Tech Corporation | Automatische analysevorrichtung und analyseverfahren |
| EP3078972B1 (de) * | 2015-04-07 | 2019-05-15 | F. Hoffmann-La Roche AG | Reagenzverwaltungssystem |
| US10197993B2 (en) * | 2016-03-31 | 2019-02-05 | Sysmex Corporation | Method and system for performing quality control on a diagnostic analyzer |
| JP7043319B2 (ja) * | 2018-03-29 | 2022-03-29 | シスメックス株式会社 | 精度管理用指標の生成方法、精度管理用指標の生成装置、検体分析装置、精度管理データ生成システム及び精度管理データ生成システムの構築方法 |
-
2021
- 2021-01-18 CN CN202180019843.4A patent/CN115280156B/zh active Active
- 2021-01-18 US US17/910,946 patent/US20230135949A1/en active Pending
- 2021-01-18 JP JP2022508090A patent/JP7423752B2/ja active Active
- 2021-01-18 EP EP21771338.7A patent/EP4123310B1/de active Active
- 2021-01-18 WO PCT/JP2021/001436 patent/WO2021186874A1/ja not_active Ceased
Also Published As
| Publication number | Publication date |
|---|---|
| JPWO2021186874A1 (de) | 2021-09-23 |
| EP4123310A4 (de) | 2024-04-17 |
| JP7423752B2 (ja) | 2024-01-29 |
| WO2021186874A1 (ja) | 2021-09-23 |
| CN115280156B (zh) | 2025-11-18 |
| EP4123310A1 (de) | 2023-01-25 |
| US20230135949A1 (en) | 2023-05-04 |
| CN115280156A (zh) | 2022-11-01 |
Similar Documents
| Publication | Publication Date | Title |
|---|---|---|
| US8871080B2 (en) | Management system for an electrolyte analyzer | |
| EP2711713B1 (de) | Vorrichtung für automatische analysen und programm für automatische analysen | |
| EP2096442B1 (de) | Automatisches Analysegerät | |
| US9310388B2 (en) | Automatic analyzer and analysis method | |
| US9217712B2 (en) | Method for assisting judgment of abnormality of reaction process data and automatic analyzer | |
| EP4123310B1 (de) | Automatische analysevorrichtung | |
| EP3757561A1 (de) | Automatisierter analysator und automatisches analyseverfahren | |
| Phillipou et al. | Capillary blood glucose measurements in hospital inpatients using portable glucose meters | |
| JP2009047638A (ja) | 自動分析装置 | |
| EP3951398A1 (de) | Datenanalyseverfahren, datenanalysesystem und rechner | |
| US11714095B2 (en) | Abnormality determining method, and automatic analyzer | |
| JP5427975B2 (ja) | 電解質分析装置の管理システム | |
| JP2022083293A (ja) | 自動分析装置 | |
| JP5787948B2 (ja) | 反応過程データの異常判定支援方法及び自動分析装置 | |
| US20230273609A1 (en) | Method for applying control reference value to specimen analyzer, specimen analyzer, and computer program | |
| WO2023106234A1 (ja) | 自動分析装置及び試薬量表示方法 | |
| Phillipou et al. | Capillary blood glucose measurements in hospital inpatients using portable glucose meters zyxwvutsrqpo |
Legal Events
| Date | Code | Title | Description |
|---|---|---|---|
| STAA | Information on the status of an ep patent application or granted ep patent |
Free format text: STATUS: THE INTERNATIONAL PUBLICATION HAS BEEN MADE |
|
| PUAI | Public reference made under article 153(3) epc to a published international application that has entered the european phase |
Free format text: ORIGINAL CODE: 0009012 |
|
| STAA | Information on the status of an ep patent application or granted ep patent |
Free format text: STATUS: REQUEST FOR EXAMINATION WAS MADE |
|
| 17P | Request for examination filed |
Effective date: 20221019 |
|
| AK | Designated contracting states |
Kind code of ref document: A1 Designated state(s): AL AT BE BG CH CY CZ DE DK EE ES FI FR GB GR HR HU IE IS IT LI LT LU LV MC MK MT NL NO PL PT RO RS SE SI SK SM TR |
|
| DAV | Request for validation of the european patent (deleted) | ||
| DAX | Request for extension of the european patent (deleted) | ||
| A4 | Supplementary search report drawn up and despatched |
Effective date: 20240315 |
|
| RIC1 | Information provided on ipc code assigned before grant |
Ipc: G01N 35/00 20060101AFI20240311BHEP |
|
| GRAP | Despatch of communication of intention to grant a patent |
Free format text: ORIGINAL CODE: EPIDOSNIGR1 |
|
| STAA | Information on the status of an ep patent application or granted ep patent |
Free format text: STATUS: GRANT OF PATENT IS INTENDED |
|
| INTG | Intention to grant announced |
Effective date: 20250304 |
|
| GRAS | Grant fee paid |
Free format text: ORIGINAL CODE: EPIDOSNIGR3 |
|
| GRAA | (expected) grant |
Free format text: ORIGINAL CODE: 0009210 |
|
| STAA | Information on the status of an ep patent application or granted ep patent |
Free format text: STATUS: THE PATENT HAS BEEN GRANTED |
|
| AK | Designated contracting states |
Kind code of ref document: B1 Designated state(s): AL AT BE BG CH CY CZ DE DK EE ES FI FR GB GR HR HU IE IS IT LI LT LU LV MC MK MT NL NO PL PT RO RS SE SI SK SM TR |
|
| REG | Reference to a national code |
Ref country code: GB Ref legal event code: FG4D |
|
| REG | Reference to a national code |
Ref country code: CH Ref legal event code: EP |
|
| REG | Reference to a national code |
Ref country code: IE Ref legal event code: FG4D |
|
| REG | Reference to a national code |
Ref country code: DE Ref legal event code: R096 Ref document number: 602021033844 Country of ref document: DE |
|
| REG | Reference to a national code |
Ref country code: NL Ref legal event code: MP Effective date: 20250709 |