EP4119686B1 - Aluminum alloy products exhibiting improved bond durability and/or having phosphorus-containing surfaces and methods of making the same - Google Patents
Aluminum alloy products exhibiting improved bond durability and/or having phosphorus-containing surfaces and methods of making the same Download PDFInfo
- Publication number
- EP4119686B1 EP4119686B1 EP22193045.6A EP22193045A EP4119686B1 EP 4119686 B1 EP4119686 B1 EP 4119686B1 EP 22193045 A EP22193045 A EP 22193045A EP 4119686 B1 EP4119686 B1 EP 4119686B1
- Authority
- EP
- European Patent Office
- Prior art keywords
- aluminum alloy
- migrant
- concentration
- product
- subsurface
- Prior art date
- Legal status (The legal status is an assumption and is not a legal conclusion. Google has not performed a legal analysis and makes no representation as to the accuracy of the status listed.)
- Active
Links
Images


Classifications
-
- C—CHEMISTRY; METALLURGY
- C22—METALLURGY; FERROUS OR NON-FERROUS ALLOYS; TREATMENT OF ALLOYS OR NON-FERROUS METALS
- C22C—ALLOYS
- C22C21/00—Alloys based on aluminium
-
- B—PERFORMING OPERATIONS; TRANSPORTING
- B21—MECHANICAL METAL-WORKING WITHOUT ESSENTIALLY REMOVING MATERIAL; PUNCHING METAL
- B21B—ROLLING OF METAL
- B21B1/00—Metal-rolling methods or mills for making semi-finished products of solid or profiled cross-section; Sequence of operations in milling trains; Layout of rolling-mill plant, e.g. grouping of stands; Succession of passes or of sectional pass alternations
- B21B1/46—Metal-rolling methods or mills for making semi-finished products of solid or profiled cross-section; Sequence of operations in milling trains; Layout of rolling-mill plant, e.g. grouping of stands; Succession of passes or of sectional pass alternations for rolling metal immediately subsequent to continuous casting
-
- B—PERFORMING OPERATIONS; TRANSPORTING
- B23—MACHINE TOOLS; METAL-WORKING NOT OTHERWISE PROVIDED FOR
- B23K—SOLDERING OR UNSOLDERING; WELDING; CLADDING OR PLATING BY SOLDERING OR WELDING; CUTTING BY APPLYING HEAT LOCALLY, e.g. FLAME CUTTING; WORKING BY LASER BEAM
- B23K11/00—Resistance welding; Severing by resistance heating
- B23K11/10—Spot welding; Stitch welding
- B23K11/11—Spot welding
-
- C—CHEMISTRY; METALLURGY
- C22—METALLURGY; FERROUS OR NON-FERROUS ALLOYS; TREATMENT OF ALLOYS OR NON-FERROUS METALS
- C22C—ALLOYS
- C22C21/00—Alloys based on aluminium
- C22C21/02—Alloys based on aluminium with silicon as the next major constituent
-
- C—CHEMISTRY; METALLURGY
- C22—METALLURGY; FERROUS OR NON-FERROUS ALLOYS; TREATMENT OF ALLOYS OR NON-FERROUS METALS
- C22C—ALLOYS
- C22C21/00—Alloys based on aluminium
- C22C21/12—Alloys based on aluminium with copper as the next major constituent
-
- C—CHEMISTRY; METALLURGY
- C22—METALLURGY; FERROUS OR NON-FERROUS ALLOYS; TREATMENT OF ALLOYS OR NON-FERROUS METALS
- C22F—CHANGING THE PHYSICAL STRUCTURE OF NON-FERROUS METALS AND NON-FERROUS ALLOYS
- C22F1/00—Changing the physical structure of non-ferrous metals or alloys by heat treatment or by hot or cold working
- C22F1/04—Changing the physical structure of non-ferrous metals or alloys by heat treatment or by hot or cold working of aluminium or alloys based thereon
- C22F1/043—Changing the physical structure of non-ferrous metals or alloys by heat treatment or by hot or cold working of aluminium or alloys based thereon of alloys with silicon as the next major constituent
-
- C—CHEMISTRY; METALLURGY
- C22—METALLURGY; FERROUS OR NON-FERROUS ALLOYS; TREATMENT OF ALLOYS OR NON-FERROUS METALS
- C22F—CHANGING THE PHYSICAL STRUCTURE OF NON-FERROUS METALS AND NON-FERROUS ALLOYS
- C22F1/00—Changing the physical structure of non-ferrous metals or alloys by heat treatment or by hot or cold working
- C22F1/04—Changing the physical structure of non-ferrous metals or alloys by heat treatment or by hot or cold working of aluminium or alloys based thereon
- C22F1/047—Changing the physical structure of non-ferrous metals or alloys by heat treatment or by hot or cold working of aluminium or alloys based thereon of alloys with magnesium as the next major constituent
-
- C—CHEMISTRY; METALLURGY
- C22—METALLURGY; FERROUS OR NON-FERROUS ALLOYS; TREATMENT OF ALLOYS OR NON-FERROUS METALS
- C22F—CHANGING THE PHYSICAL STRUCTURE OF NON-FERROUS METALS AND NON-FERROUS ALLOYS
- C22F1/00—Changing the physical structure of non-ferrous metals or alloys by heat treatment or by hot or cold working
- C22F1/04—Changing the physical structure of non-ferrous metals or alloys by heat treatment or by hot or cold working of aluminium or alloys based thereon
- C22F1/053—Changing the physical structure of non-ferrous metals or alloys by heat treatment or by hot or cold working of aluminium or alloys based thereon of alloys with zinc as the next major constituent
-
- C—CHEMISTRY; METALLURGY
- C23—COATING METALLIC MATERIAL; COATING MATERIAL WITH METALLIC MATERIAL; CHEMICAL SURFACE TREATMENT; DIFFUSION TREATMENT OF METALLIC MATERIAL; COATING BY VACUUM EVAPORATION, BY SPUTTERING, BY ION IMPLANTATION OR BY CHEMICAL VAPOUR DEPOSITION, IN GENERAL; INHIBITING CORROSION OF METALLIC MATERIAL OR INCRUSTATION IN GENERAL
- C23F—NON-MECHANICAL REMOVAL OF METALLIC MATERIAL FROM SURFACE; INHIBITING CORROSION OF METALLIC MATERIAL OR INCRUSTATION IN GENERAL; MULTI-STEP PROCESSES FOR SURFACE TREATMENT OF METALLIC MATERIAL INVOLVING AT LEAST ONE PROCESS PROVIDED FOR IN CLASS C23 AND AT LEAST ONE PROCESS COVERED BY SUBCLASS C21D OR C22F OR CLASS C25
- C23F1/00—Etching metallic material by chemical means
- C23F1/10—Etching compositions
- C23F1/14—Aqueous compositions
- C23F1/16—Acidic compositions
- C23F1/20—Acidic compositions for etching aluminium or alloys thereof
-
- C—CHEMISTRY; METALLURGY
- C23—COATING METALLIC MATERIAL; COATING MATERIAL WITH METALLIC MATERIAL; CHEMICAL SURFACE TREATMENT; DIFFUSION TREATMENT OF METALLIC MATERIAL; COATING BY VACUUM EVAPORATION, BY SPUTTERING, BY ION IMPLANTATION OR BY CHEMICAL VAPOUR DEPOSITION, IN GENERAL; INHIBITING CORROSION OF METALLIC MATERIAL OR INCRUSTATION IN GENERAL
- C23F—NON-MECHANICAL REMOVAL OF METALLIC MATERIAL FROM SURFACE; INHIBITING CORROSION OF METALLIC MATERIAL OR INCRUSTATION IN GENERAL; MULTI-STEP PROCESSES FOR SURFACE TREATMENT OF METALLIC MATERIAL INVOLVING AT LEAST ONE PROCESS PROVIDED FOR IN CLASS C23 AND AT LEAST ONE PROCESS COVERED BY SUBCLASS C21D OR C22F OR CLASS C25
- C23F1/00—Etching metallic material by chemical means
- C23F1/10—Etching compositions
- C23F1/14—Aqueous compositions
- C23F1/32—Alkaline compositions
- C23F1/36—Alkaline compositions for etching aluminium or alloys thereof
-
- C—CHEMISTRY; METALLURGY
- C23—COATING METALLIC MATERIAL; COATING MATERIAL WITH METALLIC MATERIAL; CHEMICAL SURFACE TREATMENT; DIFFUSION TREATMENT OF METALLIC MATERIAL; COATING BY VACUUM EVAPORATION, BY SPUTTERING, BY ION IMPLANTATION OR BY CHEMICAL VAPOUR DEPOSITION, IN GENERAL; INHIBITING CORROSION OF METALLIC MATERIAL OR INCRUSTATION IN GENERAL
- C23F—NON-MECHANICAL REMOVAL OF METALLIC MATERIAL FROM SURFACE; INHIBITING CORROSION OF METALLIC MATERIAL OR INCRUSTATION IN GENERAL; MULTI-STEP PROCESSES FOR SURFACE TREATMENT OF METALLIC MATERIAL INVOLVING AT LEAST ONE PROCESS PROVIDED FOR IN CLASS C23 AND AT LEAST ONE PROCESS COVERED BY SUBCLASS C21D OR C22F OR CLASS C25
- C23F17/00—Multi-step processes for surface treatment of metallic material involving at least one process provided for in class C23 and at least one process covered by subclass C21D or C22F or class C25
-
- C—CHEMISTRY; METALLURGY
- C23—COATING METALLIC MATERIAL; COATING MATERIAL WITH METALLIC MATERIAL; CHEMICAL SURFACE TREATMENT; DIFFUSION TREATMENT OF METALLIC MATERIAL; COATING BY VACUUM EVAPORATION, BY SPUTTERING, BY ION IMPLANTATION OR BY CHEMICAL VAPOUR DEPOSITION, IN GENERAL; INHIBITING CORROSION OF METALLIC MATERIAL OR INCRUSTATION IN GENERAL
- C23G—CLEANING OR DE-GREASING OF METALLIC MATERIAL BY CHEMICAL METHODS OTHER THAN ELECTROLYSIS
- C23G1/00—Cleaning or pickling metallic material with solutions or molten salts
- C23G1/02—Cleaning or pickling metallic material with solutions or molten salts with acid solutions
- C23G1/12—Light metals
- C23G1/125—Light metals aluminium
-
- C—CHEMISTRY; METALLURGY
- C23—COATING METALLIC MATERIAL; COATING MATERIAL WITH METALLIC MATERIAL; CHEMICAL SURFACE TREATMENT; DIFFUSION TREATMENT OF METALLIC MATERIAL; COATING BY VACUUM EVAPORATION, BY SPUTTERING, BY ION IMPLANTATION OR BY CHEMICAL VAPOUR DEPOSITION, IN GENERAL; INHIBITING CORROSION OF METALLIC MATERIAL OR INCRUSTATION IN GENERAL
- C23G—CLEANING OR DE-GREASING OF METALLIC MATERIAL BY CHEMICAL METHODS OTHER THAN ELECTROLYSIS
- C23G1/00—Cleaning or pickling metallic material with solutions or molten salts
- C23G1/14—Cleaning or pickling metallic material with solutions or molten salts with alkaline solutions
- C23G1/22—Light metals
-
- B—PERFORMING OPERATIONS; TRANSPORTING
- B23—MACHINE TOOLS; METAL-WORKING NOT OTHERWISE PROVIDED FOR
- B23K—SOLDERING OR UNSOLDERING; WELDING; CLADDING OR PLATING BY SOLDERING OR WELDING; CUTTING BY APPLYING HEAT LOCALLY, e.g. FLAME CUTTING; WORKING BY LASER BEAM
- B23K2103/00—Materials to be soldered, welded or cut
- B23K2103/08—Non-ferrous metals or alloys
- B23K2103/10—Aluminium or alloys thereof
-
- C—CHEMISTRY; METALLURGY
- C22—METALLURGY; FERROUS OR NON-FERROUS ALLOYS; TREATMENT OF ALLOYS OR NON-FERROUS METALS
- C22C—ALLOYS
- C22C21/00—Alloys based on aluminium
- C22C21/06—Alloys based on aluminium with magnesium as the next major constituent
- C22C21/08—Alloys based on aluminium with magnesium as the next major constituent with silicon
Definitions
- the present disclosure is directed to aluminum alloy products and the surface features of the same.
- the disclosure further relates to methods of producing aluminum alloy products.
- Aluminum alloy products are often bonded or joined to other metals or alloys, including other aluminum alloys, during fabrication of aluminum alloy and other metals based products. Requirements of the aluminum alloy products include, for example, good bond durability and high resistance to corrosion. Aluminum alloy products can be processed in a manner to enhance the bond durability and corrosion resistance.
- aluminum alloy products should exhibit amenability to resistance spot welding and other joining methods.
- the methods should include safeguards such that the replacement of consumable items used in the joining methods is minimized.
- the aluminum alloy product according to the present invention comprises a subsurface portion having a concentration of a migrant element and a bulk portion having a concentration of the migrant element, wherein the subsurface portion extends from the surface to a depth of 2.0 ⁇ m within the interior of the alloy product and wherein the migrant element comprises Mg, Si, Cu, Mn, Cr and/or Fe.
- the concentration of the migrant element in the subsurface portion is higher than the concentration of the migrant element in the bulk portion.
- the aluminum alloy product can optionally comprise a 6xxx series aluminum alloy or a 5xxx series aluminum alloy.
- the method comprises casting an aluminum alloy comprising a migrant element to produce a cast aluminum alloy article, rolling the cast aluminum alloy article to provide a rolled aluminum alloy article, and heat treating the rolled aluminum alloy article to form an aluminum alloy product.
- the rolling step can be performed at a temperature of from about 200 °C to about 550 °C.
- the heat treating step can be performed at a temperature of from about 400 °C to about 580 °C and for a duration of about 120 seconds or less.
- the method can further comprise pretreating the cast aluminum alloy product.
- the pretreating step can include cleaning a surface of the alloy product, etching the surface of the alloy product, and applying a pretreatment to the surface of the alloy product.
- the pretreating is performed after the heat treating step.
- the casting can comprise direct chill casting or continuous casting.
- the aluminum alloy products can comprise motor vehicle body parts, among others.
- metal alloy products including aluminum alloy products, having desired surface properties.
- the aluminum alloy products described herein have a concentration of migrant elements, including magnesium and silicon, which can be controlled. In some cases, the concentration of the migrant elements throughout the thickness of the alloy product can be controlled to result in desirable properties.
- Exemplary desirable properties exhibited by the aluminum alloy products described herein include, for example, high bond durability and high corrosion resistance.
- the properties of the alloys are achieved due to the methods of processing the alloys to produce the described plates, shates, and sheets. As further described herein, the desirable properties can be achieved by specially designed rolling, heat treating, and/or etching and pretreating techniques.
- a plate generally has a thickness of greater than about 15 mm.
- a plate may refer to an aluminum product having a thickness of greater than 15 mm, greater than 20 mm, greater than 25 mm, greater than 30 mm, greater than 35 mm, greater than 40 mm, greater than 45 mm, greater than 50 mm, or greater than 100 mm.
- a shate (also referred to as a sheet plate) generally has a thickness of from about 4 mm to about 15 mm.
- a shate may have a thickness of 4 mm, 5 mm, 6 mm, 7 mm, 8 mm, 9 mm, 10 mm, 11 mm, 12 mm, 13 mm, 14 mm, or 15 mm.
- a sheet generally refers to an aluminum product having a thickness of less than about 4 mm.
- a sheet may have a thickness of less than 4 mm, less than 3 mm, less than 2 mm, less than 1 mm, less than 0.5 mm, less than 0.3 mm, or less than 0.1 mm.
- An F condition or temper refers to an aluminum alloy as fabricated.
- a W condition or temper refers to an aluminum alloy solution heat treated at a temperature greater than a solvus temperature of the aluminum alloy, and quenched.
- An O condition or temper refers to an aluminum alloy after annealing.
- An Hxx condition or temper also referred to herein as an H temper, refers to a non-heat treatable aluminum alloy after cold rolling with or without thermal treatment (e.g., annealing).
- Suitable H tempers include HX1, HX2, HX3 HX4, HX5, HX6, HX7, HX8, or HX9 tempers.
- a T1 condition or temper refers to an aluminum alloy cooled from hot working and naturally aged (e.g., at room temperature).
- a T2 condition or temper refers to an aluminum alloy cooled from hot working, cold worked and naturally aged.
- a T3 condition or temper refers to an aluminum alloy solution heat treated, cold worked, and naturally aged.
- a T4 condition or temper refers to an aluminum alloy solution heat treated and naturally aged.
- a T5 condition or temper refers to an aluminum alloy cooled from hot working and artificially aged (at elevated temperatures).
- a T6 condition or temper refers to an aluminum alloy solution heat treated and artificially aged.
- a T7 condition or temper refers to an aluminum alloy solution heat treated and artificially overaged.
- a T8x condition or temper refers to an aluminum alloy solution heat treated, cold worked, and artificially aged.
- a T9 condition or temper refers to an aluminum alloy solution heat treated, artificially aged, and cold worked.
- a W condition or temper refers to an aluminum alloy after solution heat treatment.
- cast metal article As used herein, terms such as "cast metal article,” “cast article,” and the like are interchangeable and refer to a product produced by direct chill casting (including direct chill co-casting) or semi-continuous casting, continuous casting (including, for example, by use of a twin belt caster, a twin roll caster, a block caster, or any other continuous caster), electromagnetic casting, hot top casting, or any other casting method.
- bond durability refers to an ability of a bonding agent bonding two products together to withstand cycled mechanical stress after exposure to environmental conditions that initiate failure of the bonding agent. Bond durability is characterized in terms of number of mechanical stress cycles applied to the bound products, while the bound products are exposed to the environmental conditions, until the bond fails.
- room temperature can include a temperature of from about 15 °C to about 30 °C, for example about 15 °C, about 16 °C, about 17 °C, about 18 °C, about 19 °C, about 20 °C, about 21 °C, about 22 °C, about 23 °C, about 24 °C, about 25 °C, about 26 °C, about 27 °C, about 28 °C, about 29 °C, or about 30 °C.
- the aluminum alloy products described herein contain a controlled concentration of migrant elements throughout the thickness of the alloy product, including within the subsurface of the alloy product.
- the disclosed alloy products have improved surface qualities for bonding, joining, friction, corrosion resistance, and optical properties.
- the alloy products also demonstrate very good anodized qualities.
- alloys having desirable surface properties, including improved bonding and joining properties have a low enrichment ratio of magnesium (Mg) and silicon (Si). Differences in the atomic concentration of the migrant elements between the subsurface area and the remainder of the alloy (i.e., the bulk of the alloy product) can cause a gradient in electrochemical activity. The gradient in electrochemical activity can lead to a surface that is more anodically active and prone to being corroded due to galvanic coupling between the subsurface and the bulk portion of the alloy product.
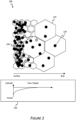
- Figure 1 is an illustrative representation of an aluminum alloy product 100 comprising an aluminum matrix 110 that is enriched with Mg 120 and Si 130.
- Mg 120 and Si 130 can migrate to an alloy surface during thermal treatments, thus providing undesired surface characteristics.
- a difference in the atomic concentration of the migrant element between the alloy subsurface and the bulk (remainder) of the alloy can cause a gradient in electrochemical activity as seen in the open circuit potential (OCP) profile 150 in Figure 1 .
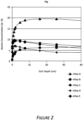
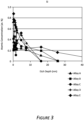
- Figures 2 and 3 demonstrate the elemental distribution of Mg and Si, respectively, in 5xxx series (Alloys A and B) and 6xxx series (Alloys C, D, and E) alloy products.
- the 5xxx series alloys demonstrate less enrichment of Mg and Si near the surface of the alloy product
- the 6xxx series alloys demonstrate more enrichment of Mg and Si near the surface as compared to the amount in the remaining portion of the alloy product.
- the term "subsurface” refers to the portion of the alloy product that extends from the surface to a depth of 2.0 ⁇ m within the interior of the alloy product.
- the portion of the aluminum alloy product excluding the subsurface portion is referred to herein as the bulk of the alloy product.
- the term "migrant element,” as used herein, refers to an element that can diffuse from a first position in the alloy product to a second position in the alloy product, as a result of, for example, one or more of the production and processing steps of the alloy product as further described below.
- the migrant elements include magnesium (Mg), silicon (Si), copper (Cu), manganese (Mn), chromium (Cr), and iron (Fe).
- the migrant element is in the form of a compound or phase.
- Mg can be present as Mg 2 Si or MgO.
- Mn and Fe can be present, for example, as Al(FeMn) or Al(Fe,Mn)Si.
- a migrant element as described herein can diffuse throughout the alloy product such that the concentration of the element is distributed throughout the full thickness of the alloy product (i.e., within the subsurface and the bulk portions).
- the alloy product can include a concentration of Mg and Si that is distributed throughout the alloy product and not concentrated within the subsurface.
- Such alloy products display exceptional bond durability and corrosion resistance properties.
- a migrant element as described herein can diffuse toward the subsurface portion of the alloy product such that an enrichment of the migrant element is provided near the surface of the alloy product.
- the alloy product can include a concentration of Cu, Mn, Cr, and/or Fe that is localized within the subsurface portion of the alloy product.
- Such alloy products display exceptional adhesive performance and can behave as a pretreatment.
- alloy products including Cr enrichment within the subsurface can control the Fe-Si particle distribution and thus enhance corrosion resistance.
- the migrant element can be homogeneously populated or variably populated within the full thickness or subsurface of the alloy product.
- homogeneously populated as related to the migrant elements means that the particular migrant element is evenly distributed within the full thickness or subsurface of the alloy product. In these cases, the concentration of the particular migrant element per region (i.e., within a region of the subsurface or within a region of the full thickness of the alloy product) is relatively constant across regions, on average.
- relatively constant as related to migrant element distribution means that the concentration of the element in a first region of the subsurface or full thickness of the alloy product can differ from the concentration of the element in a second region of the subsurface or full thickness of the alloy product up to about 20 % (e.g., by up to about 15 %, by up to about 10 %, by up to about 5 %, or by about up to 1 %).
- the concentration of the particular migrant element in a region is variably populated within the full thickness or subsurface of the alloy product.
- "variably populated" as related to migrant element distribution means that the particular migrant element is not evenly distributed within the full thickness or subsurface of the alloy product. For example, a higher concentration of the migrant element can be localized in a first portion of the subsurface (or in a first portion of the full thickness of the alloy product) as compared to the concentration of the same migrant element in a second portion of the subsurface (or in a second portion of the full thickness of the alloy product).
- the migrant element distribution within the alloy product is characterized by an enrichment ratio.
- the enrichment ratio is a comparison of the migrant element concentration in the subsurface to the migrant element concentration in the bulk of the alloy product.
- the enrichment ratio can be calculated by measuring a peak atomic concentration of a migrant element at a depth within the subsurface and at a depth within the thickness of the alloy and outside of the subsurface (i.e., within the bulk of the alloy).
- the enrichment ratio can be quantified by the following equation: atomic concentration subsurface peak ⁇ atomic concentration bulk atomic concentration bulk
- the atomic concentration can be measured at 2 nm, which represents a depth within the subsurface of a particular alloy product in which the peak atomic concentration can be found, and at 40 nm, which represents a depth within the bulk portion of a particular alloy product.
- the enrichment ratio can be provided, for example, using the following equation: atomic concentration 2 nm ⁇ atomic concentration 40 nm atomic concentration 40 nm wherein (atomic concentration) 2nm represents the concentration of the migrant element at 2 nm and (atomic concentration) 40nm represents the concentration of the migrant element at 40 nm.
- the atomic concentrations can be measured using techniques as known to those of ordinary skill in the art, including x-ray photoelectron spectroscopy (XPS).
- a low enrichment ratio for a particular element indicates that the concentration of the migrant element is distributed throughout the alloy product and is not localized primarily within the subsurface.
- Enrichment ratios that are considered as low enrichment ratios include from 1.0 to 4.0.
- the enrichment ratio can be 1.0.
- a high enrichment ratio for a particular element indicates that a high concentration of the migrant element is localized within the subsurface of the alloy product.
- Enrichment ratios that are considered as high enrichment ratios include 4.1 or greater.
- the enrichment ratio can be approximately 4.1 or greater, 4.2 or greater, 4.3 or greater, 4.4 or greater, 4.5 or greater, 4.6 or greater, 4.7 or greater, 4.8 or greater, 4.9 or greater, 5.0 or greater, 5.1 or greater, 5.2 or greater, 5.3 or greater, 5.4 or greater, 5.5 or greater, 5.6 or greater, 5.7 or greater, 5.8 or greater, 5.9 or greater, 6.0 or greater, 6.1 or greater, 6.2 or greater, 6.3 or greater, 6.4 or greater, 6.5 or greater, 6.6 or greater, 6.7 or greater, 6.8 or greater, 6.9 or greater, 7.0 or greater, 7.1 or greater, 7.2 or greater, 7.3 or greater, 7.4 or greater, 7.5 or greater, 7.6 or greater, 7.7 or greater, 7.8 or greater
- an aluminum alloy product having a high enrichment ratio for one or more migrant elements and a low enrichment ratio (e.g., a depletion) for other migrant elements.
- the aluminum alloy product as described herein has low enrichment ratios for Mg, Si, and/or Cu.
- the aluminum alloy product as described herein has high enrichment ratios for Cr, Mn, and/or Fe.
- elemental enrichment in a certain area can be accompanied by an elemental depletion in another area of the aluminum alloy product.
- Mg, Si, and/or Cu enrichment can occur in areas of the subsurface of the aluminum alloy product in which Fe and Mn can be depleted.
- the aluminum alloy product can have a subsurface characterized by Si, Mn, and/or Fe depletion along with Cu enrichment.
- migrant element particle size and morphology can affect surface properties of the aluminum alloy product.
- small Cu dispersoids and/or particles e.g., less than about 10 nm in diameter
- the Cu dispersoids and/or particles are about 9 nm or less in diameter, about 8 nm or less in diameter, about 7 nm or less in diameter, about 6 nm or less in diameter, about 5 nm or less in diameter, about 4 nm or less in diameter, about 3 nm or less in diameter, about 2 nm or less in diameter, or about 1 nm or less in diameter.
- the aluminum alloy products include a 5xxx series aluminum alloy, or a 6xxx series aluminum alloy.
- Non-limiting exemplary AA5xxx series alloys for use as the aluminum alloy product can include AA5182, AA5183, AA5005, AA5005A, AA5205, AA5305, AA5505, AA5605, AA5006, AA5106, AA5010, AA5110, AA5110A, AA5210, AA5310, AA5016, AA5017, AA5018, AA5018A, AA5019, AA5019A, AA5119, AA5119A, AA5021, AA5022, AA5023, AA5024, AA5026, AA5027, AA5028, AA5040, AA5140, AA5041, AA5042, AA5043, AA5049, AA5149, AA5249, AA5349, AA5449, AA5449A, AA5050, AA5050A, AA5050C, AA5150, AA5051,
- Non-limiting exemplary AA6xxx series alloys for use as the aluminum alloy product can include AA6101, AA6101A, AA6101B, AA6201, AA6201A, AA6401, AA6501, AA6002, AA6003, AA6103, AA6005, AA6005A, AA6005B, AA6005C, AA6105, AA6205, AA6305, AA6006, AA6106, AA6206, AA6306, AA6008, AA6009, AA6010, AA6110, AA6110A, AA6011, AA6111, AA6012, AA6012A, AA6013, AA6113, AA6014, AA6015, AA6016, AA6016A, AA6116, AA6018, AA6019, AA6020, AA6021, AA6022, AA6023, AA6024, AA6025, AA6026, AA6027, AA6028
- the aluminum alloy product can have any suitable gauge.
- the aluminum alloy product can be an aluminum alloy plate, an aluminum alloy shate, or an aluminum alloy sheet having a gauge between about 0.5 mm and about 50 mm (e.g., about 0.5 mm, about 1 mm, about 2 mm, about 3 mm, about 4 mm, about 5 mm, about 6 mm, about 7 mm, about 8 mm, about 9 mm, about 10 mm, about 15 mm, about 20 mm, about 25 mm, about 30 mm, about 35 mm, about 40 mm, about 45 mm, about 50 mm, or anywhere in between).
- the disclosed alloy products can be prepared using a method as described herein.
- aluminum alloy properties are partially determined by the formation of microstructures during the preparation of the alloy.
- the method of preparation for an alloy composition determines whether the alloy will have properties adequate for a desired application.
- certain processing steps and conditions including the rolling (e.g., hot rolling and/or cold rolling), heat treating (e.g., homogenizing, solutionizing, and/or annealing), and pretreatment steps and conditions, provide the alloy products described above having the desirable bond durability and corrosion resistance properties.
- the methods of producing aluminum alloy products as described herein include the steps of casting a molten aluminum alloy to form a cast aluminum alloy article, and processing the aluminum alloy article by one or more steps, including quenching, rolling, heat treating, and/or pretreating to form an aluminum alloy product.
- the aluminum alloy products described herein can be cast using a direct chill (DC) casting process to form a cast product such as an ingot.
- the resulting ingots can then be scalped.
- the cast product can then be subjected to further processing steps.
- the processing method includes homogenizing the aluminum alloy ingot and hot rolling the aluminum alloy ingot to form an aluminum alloy hot band.
- the aluminum alloy hot band can then be subjected to cold rolling, solution heat treatment, and optionally a pretreatment step.
- the homogenization step can include heating a cast product prepared from an alloy composition as described herein to attain a peak metal temperature (PMT) of about, or at least about, 450 °C (e.g., at least about 460 °C, at least about 470 °C, at least about 480 °C, at least about 490 °C, at least about 500 °C, at least about 510 °C, at least about 520 °C, at least about 530 °C, at least about 540 °C, at least about 550 °C, at least about 560 °C, at least about 570 °C, or at least about 580 °C).
- PMT peak metal temperature
- the ingot can be heated to a temperature of from about 450 °C to about 580 °C, from about 460 °C to about 575 °C, from about 470 °C to about 570 °C, from about 480 °C to about 565 °C, from about 490 °C to about 555 °C, or from about 500 °C to about 550 °C.
- the heating rate to the PMT can be about 100 °C/hour or less, about 75 °C/hour or less, about 50 °C/hour or less, about 40 °C/hour or less, about 30 °C/hour or less, about 25 °C/hour or less, about 20 °C/hour or less, or about 15 °C/hour or less.
- the heating rate to the PMT can be from about 10 °C/min to about 100 °C/min (e.g., about 10 °C/min to about 90 °C/min, about 10 °C/min to about 70 °C/min, about 10 °C/min to about 60 °C/min, from about 20 °C/min to about 90 °C/min, from about 30 °C/min to about 80 °C/min, from about 40 °C/min to about 70 °C/min, or from about 50 °C/min to about 60 °C/min).
- °C/min e.g., about 10 °C/min to about 90 °C/min, about 10 °C/min to about 70 °C/min, about 10 °C/min to about 60 °C/min, from about 20 °C/min to about 90 °C/min, from about 30 °C/min to about 80 °C/min, from about 40 °C/min to about 70
- the ingot is then allowed to soak (i.e., held at the indicated temperature) for a period of time.
- the ingot is allowed to soak for up to about 6 hours (e.g., from about 30 minutes to about 6 hours, inclusively).
- the ingot can be soaked at a temperature of at least about 500 °C for about 30 minutes, about 1 hour, about 2 hours, about 3 hours, about 4 hours, about 5 hours, or about 6 hours, or anywhere in between.
- a hot rolling step can be performed to form a hot band.
- the ingots are laid down and hot-rolled.
- the hot rolling temperature can be from about 200 °C to about 550 °C (e.g., from about 250 °C to about 500 °C, from about 300 °C to about 400 °C).
- the hot rolling temperature can be about 200 °C, about 205 °C, about 210 °C, about 215 °C, about 220 °C, about 225 °C, about 230 °C, about 235 °C, about 240 °C, about 245 °C, about 250 °C, about 255 °C, about 260 °C, about 265 °C, about 270 °C, about 275 °C, about 280 °C, about 285 °C, about 290 °C, about 295 °C, about 300 °C, about 305 °C, about 310 °C, about 315 °C, about 320 °C, about 325 °C, about 330 °C, about 335 °C, about 340 °C, about 345 °C, about 350 °C, about 355 °C, about 360 °C, about 365 °C, about 370 °C, about 375 °C
- a hot roll exit temperature can be from about 200 °C to about 450 °C. In some examples, the hot roll exit temperature should not exceed about 360 °C. For example, the hot roll exit temperature can range from about 250 °C to about 360 °C (e.g., from about 300 °C to about 350 °C).
- the hot roll exit temperature can be about 250 °C, about 255 °C, about 260 °C, about 265 °C, about 270 °C, about 275 °C, about 280 °C, about 285 °C, about 290 °C, about 295 °C, about 300 °C, about 305 °C, about 310 °C, about 315 °C, about 320 °C, about 325 °C, about 330 °C, about 335 °C, about 340 °C, about 345 °C, about 350 °C, about 355 °C, or about 360 °C.
- the cast article can be hot rolled to an about 4 mm to about 15 mm thick gauge (e.g., from about 5 mm to about 12 mm thick gauge), which is referred to as a shate.
- the ingot can be hot rolled to an about 4 mm thick gauge, about 5 mm thick gauge, about 6 mm thick gauge, about 7 mm thick gauge, about 8 mm thick gauge, about 9 mm thick gauge, about 10 mm thick gauge, about 11 mm thick gauge, about 12 mm thick gauge, about 13 mm thick gauge, about 14 mm thick gauge, or about 15 mm thick gauge.
- the ingot can be hot rolled to a gauge greater than 15 mm thick (i.e., a plate). In other cases, the ingot can be hot rolled to a gauge less than 4 mm (i.e., a sheet).
- a cold rolling step can be performed following the hot rolling step.
- the hot band from the hot rolling step can be cold rolled to a sheet.
- the hot band temperature can be reduced to a temperature ranging from about 20 °C to about 200 °C (e.g., from about 120 °C to about 200 °C).
- the cold rolling step can be performed for a period of time to result in a desired final gauge thickness.
- the cold rolling step can be performed for a period of up to about 1 hour (e.g., from about 10 minutes to about 30 minutes).
- the cold rolling step can be performed for a period of about 10 minutes, about 20 minutes, about 30 minutes, about 40 minutes, about 50 minutes, or about 1 hour.
- the desired final gauge thickness is below approximately 4.0 mm.
- the rolled product is cold rolled to a thickness of about 0.4 mm to about 1.0 mm, about 1.0 mm to about 3.0 mm, or about 3.0 mm to less than about 4.0 mm.
- the alloy is cold rolled to about 3.5 mm or less, about 3 mm or less, about 2.5 mm or less, about 2 mm or less, about 1.5 mm or less, about 1 mm or less, about 0.5 mm or less, about 0.4 mm or less, about 0.3 mm or less, about 0.2 mm or less, or about 0.1 mm or less, or anywhere in between.
- the cold rolled coil can then be solutionized in a solution heat treatment step.
- the solutionizing can include heating the final gauge aluminum alloy from room temperature to a temperature of from about 400 °C to about 580 °C (e.g., from about 450 °C to about 575 °C, from about 520 °C to about 580 °C, from about 530 °C to about 570 °C, from about 545 °C to about 575 °C, from about 550 °C to about 570 °C, from about 555 °C to about 565 °C, from about 540 °C to about 560 °C, from about 560 °C to about 580 °C, or from about 550 °C to about 575 °C).
- the solutionizing step can be performed by heating the final gauge aluminum alloy to about 400 °C, about 405 °C, about 410 °C, about 415 °C, about 420 °C, about 425 °C, about 430 °C, about 435 °C, about 440 °C, about 445 °C, about 450 °C, about 455 °C, about 460 °C, about 465 °C, about 470 °C, about 475 °C, about 480 °C, about 485 °C, about 490 °C, about 495 °C, about 500 °C, about 505 °C, about 510 °C, about 515 °C, about 520 °C, about 525 °C, about 530 °C, about 535 °C, about 540 °C, about 545 °C, about 550 °C, about 555 °C, about 560 °C, about 565 °C, about 500
- the solutionizing is performed at a temperature of 560 °C or below (e.g., from about 520 °C to about 560 °C).
- the solutionizing can be performed at a temperature of about 520 °C, about 525 °C, about 530 °C, about 535 °C, about 540 °C, about 545 °C, about 550 °C, about 555 °C, or about 560 °C.
- Solutionizing at a temperature of 560 °C or below can result in an alloy product having a desired particle size and particle size distribution of migrant element particles within the alloy product subsurface and the alloy product bulk, and having a low enrichment ratio for certain migrant elements (e.g., Mg and Si).
- the cold rolled coil can soak at the solutionizing temperature for a period of time.
- the cold rolled coil is allowed to soak for up to approximately 2 hours (e.g., from about 1 second to about 120 minutes, inclusively).
- the cold rolled coil can be soaked at the solutionizing temperature of from about 525 °C to about 590 °C for 1 second, 5 seconds, 10 seconds, 15 seconds, 20 seconds, 25 seconds, 30 seconds, 35 seconds, 40 seconds, 45 seconds, 50 seconds, 55 seconds, 60 seconds, 65 seconds, 70 seconds, 75 seconds, 80 seconds, 85 seconds, 90 seconds, 95 seconds, 100 seconds, 105 seconds, 110 seconds, 115 seconds, 120 seconds, 125 seconds, 130 seconds, 135 seconds, 140 seconds, 145 seconds, 150 seconds, 5 minutes, 10 minutes, 15 minutes, 20 minutes, 25 minutes, 30 minutes, 35 minutes, 40 minutes, 45 minutes, 50 minutes, 55 minutes, 60 minutes, 65 minutes, 70 minutes, 75 minutes, 80 minutes, 85 minutes, 90 minutes, 95 minutes, 100 minutes, 105 minutes, 110 minutes, 115 seconds
- a shorter soaking duration is desirable.
- the cold rolled coil can be allowed to soak for about 120 seconds or less (e.g., 115 seconds or less, 110 seconds or less, 105 seconds or less, 100 seconds or less, 95 seconds or less, 90 seconds or less, 85 seconds or less, 80 seconds or less, 75 seconds or less, 70 seconds or less, 65 seconds or less, 60 seconds or less, 55 seconds or less, 50 seconds or less, 45 seconds or less, 40 seconds or less, 35 seconds or less, 30 seconds or less, 25 seconds or less, 20 seconds or less, 15 seconds or less, 10 seconds or less, 5 seconds or less, or 1 second).
- the aluminum alloy product can then be cooled to a temperature of about 35 °C at a quench speed that can vary between about 50 °C/s to 400 °C/s in a quenching step that is based on the selected gauge.
- the quench rate can be from about 50 °C/s to about 375 °C/s, from about 60 °C/s to about 375 °C/s, from about 70 °C/s to about 350 °C/s, from about 80 °C/s to about 325 °C/s, from about 90 °C/s to about 300 °C/s, from about 100 °C/s to about 275 °C/s, from about 125 °C/s to about 250 °C/s, from about 150 °C/s to about 225 °C/s, or from about 175 °C/s to about 200 °C/s.
- the aluminum alloy product is quenched with a liquid (e.g., water) and/or gas or another selected quench medium.
- a liquid e.g., water
- gas or another selected quench medium e.g., water
- the aluminum alloy product can be air quenched.
- the aluminum alloy product can optionally undergo a pretreatment process, as further described below.
- the aluminum alloy products described herein can be cast using a continuous casting (CC) process to form a cast aluminum alloy article.
- the CC process may include, but is not limited to, the use of twin belt casters, twin roll casters, or block casters.
- the casting process is performed by a CC process to form a cast product such as a billet, slab, shate, strip, or the like.
- the CC method described herein can include extracting heat from the molten alloy by cooling the molten alloy with water, controlling a feed rate of the molten alloy, or controlling a casting speed of the molten alloy, as further described below. Extracting heat from the molten alloy can control diffusion of migrant elements within the molten alloy.
- the continuous casting method can include extracting heat in a controlled manner to control diffusion of migrant elements within the metal article.
- solidifying a molten alloy without controlled heat extraction can allow undesired diffusion of the migrant elements within the molten alloy.
- the migrant elements can diffuse to a surface of the molten alloy during solidifying, providing a cast metal article having undesired surface properties.
- controlling a rate of solidification e.g., extracting heat in a controlled manner
- Controlling the diffusion of the migrant elements can provide selective enrichment of a cast metal article surface, thus providing a cast metal article having tailored surface properties.
- Extracting heat from the molten alloy can be performed by any suitable method, including cooling with water, cooling with air, controlling a feed rate of the molten alloy into the casting cavity, or controlling a speed of a pair of moving opposed casting surfaces.
- Cooling with water can be performed by employing either one or a plurality of nozzles to deliver water directly onto the molten alloy.
- cooling with air can be performed by employing either one or a plurality of nozzles to deliver forced air directly onto the molten alloy.
- controlling the feed rate of the molten alloy into the casting cavity can control the diffusion of the migrant elements.
- a slower feed rate can allow the molten alloy to solidify closer to the molten metal injector, thus suppressing any undesired diffusion of the migrant elements.
- a faster feed rate can allow the molten alloy to solidify farther from the molten metal injector, thus allowing undesired diffusion of the migrant elements.
- controlling the speed of the pair of moving opposed casting surfaces can control the diffusion of the migrant elements.
- a slower speed of the pair of moving opposed casting surfaces can allow the molten alloy to solidify closer to the molten metal injector, thus suppressing any undesired diffusion of the migrant elements.
- a faster speed of the pair of moving opposed casting surfaces can allow the molten alloy to solidify farther from the molten metal injector, thus allowing undesired diffusion of the migrant elements.
- controlling the diffusion rate of the migrant elements can provide selective diffusion of the migrant elements.
- heat can be extracted from the molten metal at a rate that can promote diffusion of a first migrant element and simultaneously suppress diffusion of a second migrant element.
- the metal article surface can be selectively enriched by a select migrant element during solidification of the molten alloy to provide the metal article.
- the cast aluminum alloy article is then subjected to further processing steps to form the aluminum alloy product.
- the processing steps include, for example, quenching, hot rolling, cold rolling, and/or annealing steps.
- the cast aluminum alloy article can be quenched.
- the cast aluminum alloy article can be cooled to a temperature at or below about 300 °C.
- the cast aluminum alloy article can be cooled to a temperature at or below about 290 °C, at or below about 280 °C, at or below about 270 °C, at or below about 260 °C, at or below about 250 °C, at or below about 240 °C, at or below about 230 °C, at or below about 220 °C, at or below about 210 °C, at or below about 200 °C, at or below about 190 °C, at or below about 180 °C, at or below about 170 °C, at or below about 160 °C, at or below about 150 °C, at or below about 140 °C, at or below about 130 °C, at or below about 120 °C, at or below about 110 °C, at or below about 100 °C, at or below about
- the method also includes a step of hot rolling the cast aluminum alloy article to produce a rolled aluminum alloy article (e.g., a hot band).
- the step of hot rolling the cast aluminum alloy article can include reducing the thickness of the cast aluminum alloy article by at least about 30 % and up to about 80% (e.g., by about 30%, by about 35 %, by about 40 %, by about 45 %, by about 50 %, by about 55 %, by about 60 %, by about 65 %, by about 70 %, or by about 75 %).
- Hot rolling can be performed at a temperature of from about 400 °C to about 600 °C (e.g., from about 425 °C to about 575 °C or from about 450 °C to about 550 °C).
- the hot rolling step can be performed at a temperature of about 400 °C, about 410 °C, about 420 °C, about 430 °C, about 440 °C, about 450 °C, about 460 °C, about 470 °C, about 480 °C, about 490 °C, about 500 °C, about 510 °C, about 520 °C, about 530 °C, about 540 °C, about 550 °C, about 560 °C, about 570 °C, about 580 °C, about 590 °C, about 600 °C, or anywhere in between.
- a cold rolling step can then be performed using, for example, a single stand mill or a multi-stand mill.
- the cold rolling step is a one-stage cold rolling process.
- the cold rolling step is a two-stage cold rolling process.
- the coil or sheet temperature can be reduced to a temperature ranging from about 20 °C to about 150 °C (e.g., from about 120 °C to about 200 °C).
- the coil or sheet is cold rolled with an entry temperature range of from about 20 °C to about 150 °C.
- the entry temperature can be, for example, about 20 °C, about 30 °C, about 40 °C, about 50 °C, about 60 °C, about 70 °C, about 80 °C, about 90 °C, about 100 °C, about 110 °C, about 120 °C, about 130 °C, about 140 °C, or about 150 °C.
- the cold roll exit temperature can range from about 80 °C to about 200 °C.
- the cold roll exit temperature can be, for example, about 80 °C, about 90 °C, about 100 °C, about 110 °C, about 120 °C, about 130 °C, about 140 °C, about 150 °C, about 160 °C, about 170 °C, about 180 °C, about 190 °C, or about 200 °C.
- the cold rolling step can be performed for a period of time to result in a gauge of from about 0.2 mm to about 6 mm.
- the resulting gauge can be from about 0.5 mm to about 5.5 mm or from about 0.8 mm to about 5.0 mm.
- the cold rolling step can be performed for a period of up to about 1 hour (e.g., from about 10 minutes to about 30 minutes).
- the cold rolling step can be performed for a period of about 10 minutes, about 20 minutes, about 30 minutes, about 40 minutes, about 50 minutes, or about 1 hour.
- the cold rolling step can be a two-stage cold rolling process in which an intervening annealing step is performed during the cold rolling.
- the coil or sheet temperature can be reduced to a temperature ranging from about 20 °C to about 150 °C (e.g., from about 120 °C to about 200 °C).
- the coil or sheet is cold rolled with an entry temperature range of from about 20 °C to about 150 °C.
- the entry temperature can be, for example, about 20 °C, about 30 °C, about 40 °C, about 50 °C, about 60 °C, about 70 °C, about 80 °C, about 90 °C, about 100 °C, about 110 °C, about 120 °C, about 130 °C, about 140 °C, or about 150 °C.
- the cold roll exit temperature can range from about 80 °C to about 200 °C.
- the exit temperature can be, for example, about 80 °C, about 90 °C, about 100 °C, about 110 °C, about 120 °C, about 130 °C, about 140 °C, about 150 °C, about 160 °C, about 170 °C, about 180 °C, about 190 °C, or about 200 °C.
- the first stage of the cold rolling step can be performed for a period of time to result in a gauge of from about 1.2 mm to about 6 mm.
- the resulting gauge can be from about 1.25 mm to about 5.5 mm, from about 1.3 mm to about 4 mm, from about 1.4 mm to about 3.5 mm, or from about 1.5 mm to about 3 mm.
- the cold rolling step can be performed for a period of up to about 1 hour (e.g., from about 10 minutes to about 30 minutes).
- the cold rolling step can be performed for a period of about 10 minutes, about 20 minutes, about 30 minutes, about 40 minutes, about 50 minutes, or about 1 hour.
- an annealing process referred to herein as an intermediate annealing step can be performed.
- the cold rolled gauge can be held at a temperature ranging from about 250 °C to about 450 °C (e.g., from about 275 °C to about 400 °C or from about 300 °C to about 375 °C), with a soak time of up to about 4 hours.
- the soak time can range from about 10 minutes to about 4 hours (e.g., about 10 minutes, about 30 minutes, about 1 hour, about 2 hours, about 3 hours, or about 4 hours).
- the intermediate annealing step can result in an alloy having grains that are round.
- a second stage of the cold-rolling process can be performed.
- the second stage of the cold-rolling process includes cold rolling using a single stand mill or a multi-stand mill with an entry temperature range of from about 20 °C to about 150 °C.
- the entry temperature can be, for example, about 20 °C, about 30 °C, about 40 °C, about 50 °C, about 60 °C, about 70 °C, about 80 °C, about 90 °C, about 100 °C, about 110 °C, about 120 °C, about 130 °C, about 140 °C, or about 150 °C.
- the cold roll exit temperature can range from about 80 °C to about 200 °C.
- the exit temperature can be, for example, about 80 °C, about 90 °C, about 100 °C, about 110 °C, about 120 °C, about 130 °C, about 140 °C, about 150 °C, about 160 °C, about 170 °C, about 180 °C, about 190 °C, or about 200 °C to result in a gauge of about 3 mm or less (e.g., from about 0.2 mm to about 2 mm or from about 0.2 mm to about 1.4 mm).
- the resulting gauge can be about 0.2 mm, about 0.3 mm, about 0.4 mm, about 0.5 mm, about 0.6 mm, about 0.7 mm, about 0.8 mm, about 0.9 mm, about 1 mm, about 1.1 mm, about 1.2 mm, about 1.3 mm, about 1.4 mm, about 1.5 mm, about 1.6 mm, about 1.7 mm, about 1.8 mm, about 1.9 mm, about 2 mm, about 2.1 mm, about 2.2 mm, about 2.3 mm, about 2.4 mm, about 2.5 mm, about 2.6 mm, about 2.7 mm, about 2.8 mm, about 2.9 mm, or about 3 mm.
- the cold rolled coil can then be solutionized in a solution heat treatment step.
- the solutionizing can include heating the final gauge aluminum alloy from room temperature to a temperature of from about 520 °C to about 590 °C (e.g., from about 520 °C to about 580 °C, from about 530 °C to about 570 °C, from about 545 °C to about 575 °C, from about 550 °C to about 570 °C, from about 555 °C to about 565 °C, from about 540 °C to about 560 °C, from about 560 °C to about 580 °C, or from about 550 °C to about 575 °C).
- the cold rolled coil can soak at the solutionizing temperature for a period of time.
- the cold rolled coil is allowed to soak for up to approximately 2 hours (e.g., from about 1 second to about 120 minutes, inclusively).
- the cold rolled coil can be soaked at the solutionizing temperature of from about 525 °C to about 590 °C for 1 second, 5 seconds, 10 seconds, 15 seconds, 20 seconds, 25 seconds, 30 seconds, 35 seconds, 40 seconds, 45 seconds, 50 seconds, 55 seconds, 60 seconds, 65 seconds, 70 seconds, 75 seconds, 80 seconds, 85 seconds, 90 seconds, 95 seconds, 100 seconds, 105 seconds, 110 seconds, 115 seconds, 120 seconds, 125 seconds, 130 seconds, 135 seconds, 140 seconds, 145 seconds, 150 seconds, 5 minutes, 10 minutes, 15 minutes, 20 minutes, 25 minutes, 30 minutes, 35 minutes, 40 minutes, 45 minutes, 50 minutes, 55 minutes, 60 minutes, 65 minutes, 70 minutes, 75 minutes, 80 minutes, 85 minutes, 90 minutes, 95 minutes, 100 minutes, 105 minutes, 110 minutes, 115 seconds
- the aluminum alloy product can then be cooled to a temperature of about 35 °C at a quench speed that can vary between about 50 °C/s to 400 °C/s in a quenching step that is based on the selected gauge.
- the quench rate can be from about 50 °C/s to about 375 °C/s, from about 60 °C/s to about 375 °C/s, from about 70 °C/s to about 350 °C/s, from about 80 °C/s to about 325 °C/s, from about 90 °C/s to about 300 °C/s, from about 100 °C/s to about 275 °C/s, from about 125 °C/s to about 250 °C/s, from about 150 °C/s to about 225 °C/s, or from about 175 °C/s to about 200 °C/s.
- the quenching step can be performed using a liquid (e.g., water), a liquid (
- the aluminum alloy products described herein and cast by DC casting or CC and subsequently processed can be pretreated.
- the pretreatment process described herein includes a step of applying a cleaner (also referred to herein as an entry cleaner or pre-cleaner) to one or more surfaces of the aluminum alloy product.
- the entry cleaner removes residual oils, or loosely adhering oxides, from the aluminum alloy product surface.
- the entry cleaning can be performed using an alkaline solution having a pH of 7.5 or above.
- the pH of the alkaline solution can be about 8, about 8.5, about 9, about 9.5, about 10, about 10.5, about 11, about 11.5, about 12, about 12.5, or about 13.
- the concentration of the alkaline agent in the alkaline solution can be from about 1 % to about 5 % (e.g., about 1 %, about 2 %, about 3 %, about 4 %, or about 5 % based on the volume of the alkaline solution).
- Suitable alkaline agents include, for example, silicates and hydroxides (e.g., sodium hydroxide).
- the alkaline solution can further include one or more surfactants, including for example anionic and non-ionic surfactants.
- the pretreatment process described herein can also include a step of etching the surface of the aluminum alloy product.
- the surface of the aluminum alloy product can be etched using a chemical etch such as an acid etch (i.e., an etching procedure that includes an acid solution having a pH of less than 7), an alkaline etch (i.e., an etching procedure that includes a basic solution having a pH of greater than 7), or an etch under neutral conditions (i.e., an etching procedure that includes a neutral solution having a pH of 7).
- the chemical etch prepares the surface to accept the subsequent application of a pretreatment.
- any loosely adhering oxides such as Al oxides and Mg rich oxides, entrapped oils, or debris, can be adequately removed during this step.
- Exemplary chemicals for performing the acid etch include sulfuric acid, hydrofluoric acid, nitric acid, phosphoric acid, and combinations of these.
- Exemplary chemicals for performing the alkaline etch include sodium hydroxide and potassium hydroxide.
- a pretreatment can then be applied to the surface of the aluminum alloy product.
- the pretreatment can include an adhesion promoter, a corrosion inhibitor, a coupling agent, an antimicrobial agent, or a mixture thereof.
- the surface of the aluminum alloy product optionally can be rinsed with a solvent (e.g., an aqueous or an organic solvent).
- a solvent e.g., an aqueous or an organic solvent.
- the surface of the aluminum alloy product can be dried after the rinsing step.
- the aluminum alloy products and methods described herein can be used in automotive, electronics, and transportation applications, such as commercial vehicle, aircraft, or railway applications.
- the aluminum alloy products can be used for chassis, cross-member, and intra-chassis components (encompassing, but not limited to, all components between the two C channels in a commercial vehicle chassis) to gain strength, serving as a full or partial replacement of high-strength steels.
- the aluminum alloy products can be used in the F, T4, T6, or T8x tempers.
- the aluminum alloy products and methods can be used to prepare motor vehicle body part products.
- the disclosed aluminum alloy products and methods can be used to prepare automobile body parts, such as bumpers, side beams, roof beams, cross beams, pillar reinforcements (e.g., A-pillars, B-pillars, and C-pillars), inner panels, side panels, floor panels, tunnels, structure panels, reinforcement panels, inner hoods, or trunk lid panels.
- the disclosed aluminum alloy products and methods can also be used in aircraft or railway vehicle applications, to prepare, for example, external and internal panels.
- the aluminum alloy products and methods described herein can also be used in electronics applications, to prepare, for example, external and internal encasements.
- the aluminum alloy products and methods described herein can also be used to prepare housings for electronic devices, including mobile phones and tablet computers.
- the aluminum alloy products can be used to prepare housings for the outer casing of mobile phones (e.g., smart phones) and tablet bottom chassis.
- the aluminum alloy products and methods can be used to prepare aerospace vehicle body part products.
- the disclosed aluminum alloy products and methods can be used to prepare airplane body parts, such as skin alloys.
- the product may include monolithic materials, as well as non-monolithic materials such as roll-bonded materials, clad materials, or composite materials (such as but not limited to carbon fiber-containing materials).
- the aluminum alloy product is a metal coil, a metal strip, a metal plate, a metal sheet, a metal billet, a metal ingot, or the like.
- an alloying element, and/or an oxide thereof, as described herein can diffuse throughout the alloy product such that the concentration of the alloying element and/or oxide thereof is distributed throughout a full thickness (e.g., a bulk of the aluminum alloy) of the aluminum alloy product (i.e., at least within the subsurface and the bulk portions).
- the aluminum alloy product can include a concentration of Mg and/or MgO that is distributed throughout the aluminum alloy product and can migrate to the subsurface portion during various processing steps, including homogenization, hot rolling, cold rolling, and solutionizing.
- the aluminum alloy products described herein can have a surface roughness suitable for successful bonding according to any suitable bonding technique, including, for example, resistance spot welding.
- the aluminum alloy products described herein can have an average surface roughness of from about 25 nanometers (nm) to about 50 nm.
- the aluminum alloy products described herein can have a surface roughness of about 25 nm, about 26 nm, about 27 nm, about 28 nm, about 29 nm, about 30 nm, about 31 nm, about 32 nm, about 33 nm, about 34 nm, about 35 nm, about 36 nm, about 37 nm, about 38 nm, about 39 nm, about 40 nm, about 41 nm, about 42 nm, about 43 nm, about 44 nm, about 45 nm, about 46 nm, about 47 nm, about 48 nm, about 49 nm, about 50 nm., or anywhere in between.
- Two samples of a 6xxx series aluminum alloy were prepared by direct chill casting and were processed by homogenizing, hot rolling, cold rolling, solution heat treating, air quenching, etching using 7% R243, and pretreating with an adhesion promoter.
- the processing methods differed only by the solution heat treatment step.
- the first alloy sample was solution heat treated at 540 °C for 1 second (Method 1) and the second alloy sample was solution heat treated at 578 °C for 35 seconds (Method 2).
- Figure 4 presents X-ray photoelectron spectroscopy (XPS) depth profile data for the Mg content in the sample prepared according to Method 1 (indicated by square symbols), the Mg content in the sample prepared according to Method 2 (indicated by triangle symbols), and the Mg content in a comparative 6xxx series aluminum alloy that was not solution heat treated ("AA 6xxx;" indicated by circle symbols).
- XPS X-ray photoelectron spectroscopy
- Method 2 provided a greater Mg content closer to the aluminum alloy surface and a lower Mg content in the bulk of the aluminum alloy, as well as a greater Mg content compared to the exemplary aluminum alloy prepared according to Method 1 and the comparative 6xxx series aluminum alloy.
- the comparative 6xxx series aluminum alloy exhibited a highly uniform Mg concentration from the surface to the bulk of the aluminum alloy and a lower overall Mg content near the surface of the aluminum alloy.
- Figure 5 presents XPS depth profile data for the Si content in the aluminum alloy product prepared according to Method 1 (indicated by square symbols), the aluminum alloy product prepared according to Method 2 (indicated by triangle symbols), and a comparative 6xxx series aluminum alloy that was not solution heat treated (indicated by circle symbols).
- Figure 5 is the ability to control migrant silicon (Si) concentration in the bulk aluminum alloy and provide uniform Si concentration into the bulk of the aluminum alloy.
- Method 1 provided a greater Si content closer to the aluminum alloy surface and a lower Si content in the bulk of the aluminum alloy.
- Method 2 provided a greater Si content near the surface of the aluminum alloy and a more uniform Si concentration further into the bulk of the aluminum alloy.
- the Si content of the Method 2 alloy product was higher than that of the comparative 6xxx series aluminum alloy product.
- the comparative 6xxx series aluminum alloy exhibited a highly uniform and very low Si concentration from the surface to the bulk of the aluminum alloy and a lower overall Si content near the surface of the aluminum alloy.
- Figure 6 shows bond durability testing results of aluminum alloys prepare according to methods described herein.
- Exemplary aluminum alloy samples prepared according to Method 1 and Method 2 were bonded together and subjected to a stress durability test.
- a stress durability test In the stress durability test, a set of 6 lap joints/bonds were connected in sequence by bolts and positioned vertically in a 90% relative humidity (RH) humidity cabinet. The temperature was maintained at 50 °C. A force load of 2.4 kN was applied to the bond sequence.
- the stress durability test is a cyclic exposure test that is conducted for up to 45 cycles. Each cycle lasts for 24 hours. In each cycle, the bonds are exposed in the humidity cabinet for 22 hours, then immersed in 5% NaCl for 15 minutes, and finally air-dried for 105 minutes. Upon the breaking of three joints, the test is discontinued for the particular set of joints and is indicated as a first failure.
- the exemplary aluminum alloy prepared according to Method 2 (left set of histograms) exhibited a lower cycles to failure number, indicating a lower bond durability than the exemplary aluminum alloy prepared according to Method 1 (right set of histograms). Mean cycles to failure is indicated by the left histogram in each set (hatched histogram) with first observed failure indicated by the right histogram in each set (cross-hatched).
- Two samples of a 6xxx series aluminum alloy were prepared by direct chill casting and were processed by homogenizing, hot rolling, cold rolling, solution heat treating, air quenching, etching using 7% R243, and pretreating with an adhesion promoter.
- the processing methods differed only by the hot rolling temperatures.
- the first alloy sample was hot rolled with a 390 °C hot mill exit temperature (Method 1) and the second alloy sample was hot rolled with a 330 °C hot mill exit temperature (Method 2).
- Figure 7 shows the XPS depth profiling of the Mg content in the aluminum alloy product prepared by the high-temperature (Method 1) versus the low-temperature (Method 2) rolled surface.
- the aluminum alloy sample prepared according to Method 1 exhibited an enrichment ratio of 2 and an Mg concentration of 10 % within the aluminum alloy subsurface.
- the aluminum alloy prepared according to Method 2 exhibited an enrichment ratio of 1.6 and an Mg concentration of 5 % within the aluminum alloy subsurface.
- Two samples of a 6xxx series aluminum alloy were prepared by direct chill casting and were processed by homogenizing, hot rolling, cold rolling, solution heat treating, air quenching, etching using 7% R243, and pretreating with an adhesion promoter.
- the processing methods differed only by the order of the cleaning step.
- the first alloy sample was pre-cleaned before solution heat treatment (referred to as "Pre-clean -> SHT") and the second alloy sample was solution heat treated and then pre-cleaned (referred to as "SHT -> Pre-clean"). Both were followed by acid etching and pre-treatment application.
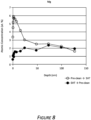
- Figure 8 presents XPS depth profile data of the Mg content in the aluminum alloy samples.
- the exemplary aluminum alloy cleaned before solutionizing (referred to as "Pre-clean ⁇ SHT”) showed a 6 % Mg concentration and a 2.4 enrichment ratio.
- the exemplary aluminum alloy cleaned after solutionizing (referred to as "SHT ⁇ Pre-clean”) showed a 1.5 % Mg concentration and a 0.7 enrichment ratio (not according to the invention).
- Example 4 Controlling Migrant Element Concentrations in a Continuously Cast Aluminum Alloy
- Aluminum alloy products were prepared according to continuous casting methods as described above. The products were cast at a width of 1450 mm and trimmed to 1300 mm. The products were then hot rolled, cold rolled to 5.1 mm, annealed at 400 °C for 2 hours, and cold rolled to 2 mm. The products were then solutionized and quenched under varying conditions, as shown in Table 1.
- Table 1 Sample ID Solutionizing Temperature Quenching Method Continuous Casting Condition 1 (C1) 553°C Air Continuous Casting Condition 2 (C2) 553°C Water Continuous Casting Condition 3 (C3) 544°C Water Continuous Casting Condition 4 (C4) 560°C Air Direct Chill Casting Condition (D1) 560°C Air
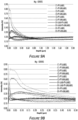
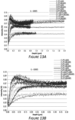
- Figures 9A and 9B show GDOES data for Mg content near the surfaces of aluminum alloy sheets (e.g., from the surface to a depth of 2.0 ⁇ m).
- Figure 9A shows data for Mg content extending into the bulk of the aluminum alloy sheet.
- Figure 9B shows data for Mg content considered to be found in the surface of the aluminum alloy sheet (e.g., from the surface to a depth of 0.5 ⁇ m).
- Figures 9A and 9B show a high diffusion of Mg to the surface of the aluminum alloy sheets produced by direct chill casting (samples D1 and D1-lab).
- Figures 9A and 9B show decreased diffusion of Mg to the surface of the aluminum alloy sheets, and a uniform distribution of Mg from the surface into the bulk of the aluminum alloy sheets, produced by the exemplary continuous casting method described above. A lower concentration of Mg near the surface of the aluminum alloy sheets is desirable for bonding and joining applications.
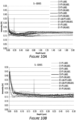
- Figures 10A and 10B show GDOES data for Si content near the surfaces of aluminum alloy sheets (e.g., from the surface to a depth of 2.0 ⁇ m).
- Figure 10A shows data for Si content extending into the bulk of the aluminum alloy sheet.
- Figure 10B shows data for Si content considered to be found in the surface of the aluminum alloy sheet (e.g., from the surface to a depth of 0.5 ⁇ m).
- Figures 10A and 10B show a high diffusion of Si to the surface of the aluminum alloy sheets produced by direct chill casting (samples D1 and D1-lab).
- Figures 10A and 10B show decreased diffusion of Si to the surface of the aluminum alloy sheets, and a uniform distribution of Si from the surface into the bulk of the aluminum alloy sheets produced by the exemplary continuous casting method described above.
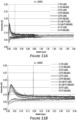
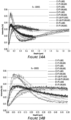
- Figures 11A and 11B show GDOES data for Cu content near the surfaces of aluminum alloy sheets (e.g., from the surface to a depth of 2.0 ⁇ m).
- Figure 11A shows data for Cu content extending into the bulk of the aluminum alloy sheet.
- Figure 11B shows data for Cu content considered to be found in the surface of the aluminum alloy sheet (e.g., from the surface to a depth of 0.5 ⁇ m).
- Figures 11A and 11B show a low diffusion of Cu to the surface of the aluminum alloy sheets produced by direct chill casting (samples D1 and D1-lab).
- Figures 11A and 11B show increased diffusion of Cu to the surface of the aluminum alloy sheets produced by the exemplary continuous casting method described above. Controlled diffusion of Cu to the surface of the aluminum alloy sheets can be desirable for bonding and joining applications.
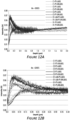
- Figures 12A and 12B show GDOES data for Mn content near the surfaces of aluminum alloy sheets (e.g., from the surface to a depth of 2.0 ⁇ m).
- Figure 12A shows data for Mn content extending into the bulk of the aluminum alloy sheet.
- Figure 12B shows data for Mn content considered to be found in the surface of the aluminum alloy sheet (e.g., from the surface to a depth of 0.5 ⁇ m).
- Figures 12A and 12B show no diffusion of Mn to the surface of the aluminum alloy sheets produced by direct chill casting (samples D1 and D1-lab).
- Figures 12A and 12B show increased diffusion of Mn to the surface of the aluminum alloy sheets produced by the exemplary continuous casting method described above.
- Figures 13A and 13B show GDOES data for Cr content near the surfaces of aluminum alloy sheets (e.g., from the surface to a depth of 2.0 ⁇ m).
- Figure 13A shows data for Cr content extending into the bulk of the aluminum alloy sheet.
- Figure 13B shows data for Cr content considered to be found in the surface of the aluminum alloy sheet (e.g., from the surface to a depth of 0.5 ⁇ m).
- Figures 13A and 13B show no diffusion of Cr to the surface of the aluminum alloy sheets produced by direct chill casting (samples D1 and D1-lab).
- Figures 13A and 13B show increased diffusion of Cr to the surface of the aluminum alloy sheets produced by the exemplary continuous casting method described above. Controlled diffusion of Cr to the surface of the aluminum alloy sheets can be desirable for bonding and joining applications. Controlled diffusion of Cr to the surface of the aluminum alloy sheets can be desirable for corrosion resistance.
- Figures 14A and 14B show GDOES data for Fe content near the surfaces of aluminum alloy sheets (e.g., from the surface to a depth of 2.0 ⁇ m).
- Figure 14A shows data for Fe content extending into the bulk of the aluminum alloy sheet.
- Figure 14B shows data for Fe content considered to be found in the surface of the aluminum alloy sheet (e.g, from the surface to a depth of 0.5 ⁇ m).
- Figures 14A and 14B show no diffusion of Fe to the surface of the aluminum alloy sheets produced by direct chill casting (samples D1 and D1-lab).
- Figures 14A and 14B show increased diffusion of Fe to the surface of the aluminum alloy sheets produced by the exemplary continuous casting method described above.
- Bond durability test results for the exemplary continuously cast aluminum alloy sheets and the comparative direct chill cast aluminum alloy sheets were performed according to the procedure described in Example 2. For this experiment, the completion of 45 cycles indicates that the set of joints passed the bond durability test.
- the test results are shown below in Table 2.
- each of the joints are numbered 1 through 6, where joint 1 is the top joint and joint 6 is the bottom joint when oriented vertically.
- the number in the cells, except for "45,” indicates the number of successful cycles before a break.
- the number "45 in a cell indicates that the joints remained intact for 45 cycles.
- test coupons were cut from the exemplary continuously cast aluminum alloy sheets.
- the test coupons were subjected to alkaline and acid etching to clean and prepare the surfaces for bonding. Bonding was performed by pretreating the aluminum alloy sheets with an adhesion promoter and bonding the test coupons with an adhesive. Bonded test coupons were exposed to a humid environment for up to 45 duty cycles.
- test coupons were cut from the exemplary continuously cast aluminum alloy sheets.
- the test coupons were subjected to a strong alkaline cleaning and acid etching to clean and prepare the surfaces for bonding. Bonding was performed by pretreating the aluminum alloy sheets with an adhesion promoter and bonding the test coupons with an adhesive. Bonded test coupons were exposed to a humid environment for up to 45 duty cycles.
- test coupons were cut from the exemplary continuously cast aluminum alloy sheets.
- the test coupons were subjected to an acid etching to clean and prepare the surfaces for bonding. Bonding was performed by pretreating the aluminum alloy sheets with an adhesion promoter and bonding the test coupons with an adhesive. Bonded test coupons were exposed to a humid environment for up to 45 duty cycles.
- test coupons were cut from the exemplary continuously cast aluminum alloy sheets.
- the test coupons were solution heat treated in the lab furnace and then subjected to alkaline and acid etching to clean and prepare the surface for bonding. Bonding was performed by pretreating the aluminum alloy sheets with an adhesion promoter and bonding the test coupons with an adhesive. Bonded test coupons were exposed to a humid environment for up to 45 duty cycles.
- test coupons were cut from the comparative direct chill cast aluminum alloy sheets.
- the test coupons were subjected to acid etching to prepare the surface for bonding. Bonding was performed by pretreating the aluminum alloy sheets with an adhesion promoter and bonding the test coupons with an adhesive. Bonded test coupons were exposed to a humid environment for up to 45 duty cycles.
- the exemplary continuously cast aluminum alloy sheets having controlled diffusion of Mn and Cr to the surface of the aluminum alloy sheets demonstrated excellent bond durability, surviving 45 test cycles without failure.
- the comparative direct chill cast aluminum alloy sheets having Mg diffused to the surface demonstrated poor bond durability.
- Example 5 (not according to the invention): Resistance Spot Welding (RSW) Electrode Life after Etching with Various Etchants
- etchants employed were (i) a mixture of phosphoric and sulfuric acid (referred to as solution “A” in Table 3 below), (ii) a mixture of sulfuric acid and ammonium fluoride (referred to as solution “B” in Table 3 below), (iii) a mixture of sulfuric acid and iron (III) sulfate hydrate (referred to as solution “C” in Table 3 below), and (iv) sodium hydroxide (referred to as solution “D” in Table 3 below).
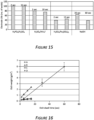
- Figure 15 is a graph showing the RSW electrode service lifetime for RSW electrodes employed to weld aluminum alloy samples after etching in the various etchant solutions described above.
- Solution D NaOH
- Solution A a mixture of phosphoric acid and sulfuric acid (H 3 PO 4 /H 2 SO 4 )
- H 3 PO 4 /H 2 SO 4 a mixture of phosphoric acid and sulfuric acid
- the mixture of H 3 PO 4 /H 2 SO 4 provided an atomic concentration ratio of P/Mg of about 0.65 in a subsurface extending to a depth of about 83 ⁇ m from the surface of the aluminum alloy.
- Solution B a mixture of sulfuric acid and ammonium fluoride (H 2 SO 4 /NH 4 F)
- Solution C a mixture of sulfuric acid and iron (III) sulfate hydrate (H 2 SO 4 /Fe 2 (SO 4 ) 3 )
- incorporating P into a Mg-containing subsurface significantly increased the RSW electrode lifetime.
- Figure 16 is a graph showing etch weight (i.e., amount of material removed from the surface of the aluminum alloys during etching) for each etch performed (Etches 1 - 16 in Table 3).
- Solution D was able to provide the greatest etch weight and was thus employed as a comparative solution.
- Solution B provided the greatest etch weight
- Solutions A and C provided similar etch weights, both less than that provided by Solution B.
- Solution B provided the greatest etch weight (see Figure 16 ) but did not exhibit improvement to the RSW electrode lifetime.
- solutions A and C provided similar etch weights but also provided significantly different RSW electrode lifetimes.
- Solution A (containing P) provided a significantly improved RSW electrode lifetime and Solution C was detrimental to the RSW electrode lifetime.
- removal of the deformed oxide layer alone is insufficient to improve the RSW electrode lifetime.
- removal of a portion of the deformed oxide layer, and a presence of a residual P concentration can work in concert to improve the RSW electrode lifetime.
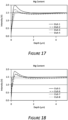
- Figures 17 - 20 are graphs showing glow discharge optical emission spectroscopy (GDOES) data for Mg content near the surface of the aluminum alloy samples described above (e.g., from the surface to a depth of 5.0 ⁇ m).
- Figure 17 shows data for Mg content extending into the bulk of the aluminum alloy sample etched with Solution A.
- Figure 18 shows data for Mg content extending into the bulk of the aluminum alloy sample etched with Solution B.
- Figure 19 shows data for Mg content extending into the bulk of the aluminum alloy sample etched with Solution C.
- Figure 20 shows data for Mg content extending into the bulk of the aluminum alloy sample etched with Solution D.
- a Mg concentration found within the subsurface portion of the aluminum alloy samples can negatively impact the RSW electrode lifetime.
- RSW electrode lifetime was significantly improved even though the sample contained a concentration of Mg within the subsurface of the aluminum alloy.
- the aluminum alloy sample etched with comparative Solution D ( Figure 20 ) exhibited nearly complete removal of Mg near the surface of the aluminum alloy, further indicating that the presence of Mg and/or a Mg containing compound (e.g., MgO) after etching with a P containing compound provides a significantly improved RSW electrode lifetime.
- Mg containing compound e.g., MgO
- Figure 19 shows the GDOES data for the aluminum alloy sample etched with Solution C.
- Mg and/or Mg containing compounds are present near the surface of the aluminum alloy samples; however, Solution C did not contain P and was detrimental to the RSW electrode lifetime (see Figure 15 ).
- Solution C did not contain P and was detrimental to the RSW electrode lifetime (see Figure 15 ).
- the presence of Mg and/or Mg containing compounds near the surface of the aluminum alloy without having P present in the etching solution can be detrimental to the RSW electrode lifetime.
- Example 6 Aluminum Alloy Surface Properties after Etching with Various Etchants
- alloying element and/or alloying element oxide particle size and morphology can affect surface properties of the aluminum alloy product.
- Figures 21 , 22 , 23 , and 24 present scanning electron microscope (SEM) micrographs of the aluminum alloy samples described above.
- Figures 21A-D show SEM micrographs of the aluminum alloy samples etched using Solution A.
- Figures 21A and 21B show the SEM micrographs from Etch 1 (see Table 3).
- Figures 21C and 21D show the SEM micrographs from Etch 4.
- Figures 21A and 21C are micrographs from a scanning electron mode.
- Figures 21B and 21D are micrographs from a back-scattered electron mode.
- Figures 22A-D shows SEM micrographs of the aluminum alloy samples etched using Solution B.
- Figures 22A and 22B show the SEM micrographs from Etch 5.
- Figures 22C and 22D show the SEM micrographs from Etch 7.
- Figures 22A and 22C are micrographs from a scanning electron mode.
- Figures 22B and 22D are micrographs from a back-scattered electron mode.
- Figures 23A-D shows SEM micrographs of the aluminum alloy samples etched using Solution C.
- Figures 23A and 23B show the SEM micrographs from Etch 9.
- Figures 23C and 23D show the SEM micrographs from Etch 12.
- Figures 23A and 23C are micrographs from a scanning electron mode.
- Figures 23B and 23D are micrographs from a back-scattered electron mode.
- Figures 24A-D shows SEM micrographs of the aluminum alloy samples etched using Solution D.
- Figures 24A and 24B show the SEM micrographs from Etch 13.
- Figures 24C and 24D show the SEM micrographs from Etch 16.
- Figures 24A and 24C are micrographs from a scanning electron mode.
- Figures 24B and 24D are micrographs from a back-scattered electron mode.
- Solution B ( Figure 22 ) provided the greatest etch weight of Etch Solutions A, B, and C, see Figure 16 ), thus providing a surface having a reduced amount of Mg and/or Mg containing compound particles (indicated by bright spots in Figures 21 , 23 , and 24 ), and a reduced deformed oxide layer (shown as darker grey areas in Figures 21 , 23 , and 24 ).
- FIG. 25 Panel A shows a copper RSW electrode tip.
- Panel A MgO particles 1105 adhered to the RSW electrode tip.
- Panel B shows a micrograph of the weld
- Panel C is a higher magnification image of Figure 25 , Panel B.
- dark areas 1110 indicate MgO present at the surface or in the subsurface of the aluminum alloy sheet.
- the Mg content was 6.9 %.
- An as-produced AA5182 aluminum alloy contains from 4 % to 5 % Mg (e.g., about 4.5 % Mg).
- a Mg content of 6.9 % at the surface or in the subsurface indicated migration of Mg from a bulk of the aluminum alloy toward the surface during processing, providing undesired amounts of MgO at the surface or in the subsurface of the aluminum alloy. Accordingly, during the RSW trial, MgO particles adhered to the RSW electrode tip. Such MgO particle pick-up can significantly reduce the RSW electrode lifetime.
- etching and/or cleaning the surface of the aluminum alloy sheet according to the methods described herein can remove MgO from the surface or the subsurface of the aluminum alloy, form Mg-P compounds as described above, eliminate MgO pick-up by the RSW electrode, and increase the lifetime of the RSW electrode.
- Figure 26 is a graph showing the yellow index (YI) of the aluminum alloy samples prepared as described above.
- the YI can indicate the presence of a Mg and/or Mg containing compound (e.g., MgO) on the surface of the aluminum alloys.
- a lack of a significant YI is indicated by a dashed line (e.g., a YI less than about 1).
- the aluminum alloy samples etched using comparative Solution D e.g., providing the greatest etch weight
- a very low YI indicates a negligible concentration of Mg or Mg containing compounds on the surface of the aluminum alloys.
- the aluminum alloy samples etched using Solution B e.g., providing the greatest etch weight of the exemplary etch solutions (Solutions A, B, and C)
- exhibited a low YI indicating a significant removal of Mg and/or Mg containing compounds from the surface of the aluminum alloy samples.
- the aluminum alloy samples etched using Solutions A and C exhibited a greater YI for each sample, indicating a greater Mg and/or Mg containing compounds concentration than the aluminum alloy samples etched using Solutions B and D.
- the aluminum alloy samples etched using Solution A provided a significantly improved RSW electrode lifetime even while having a significant Mg and/or Mg containing compounds concentration at the surface of the aluminum alloy samples. Also, an increase in the YI was observed from Etch Reference No. 1 to Etch Reference No. 2 (e.g., a "reverse effect" was observed), indicating the etch procedure exposed additional Mg to the alloy surface and thus oxidizing the additional Mg once exposed. Additional Mg can be attributed to a Mg enriched subsurface. Surprisingly, the aluminum alloy samples etched using Solution C exhibited detrimental effects on the RSW electrode lifetime when exhibiting a similar YI to the aluminum alloy samples etched using Solution A.
- an optimized surface chemistry wherein a lower etch weight allows for a concentration of Mg and/or Mg containing compounds to remain within the subsurface of an aluminum alloy, created by etching with a P containing compound in which residual P can remain, provided a significantly improved RSW electrode lifetime.
- the standard deviation of the YI for all samples was less than 1.5% of the mean YI.
- Figure 27 is a graph showing the surface roughness of the aluminum alloy samples prepared as described above.
- the aluminum alloy samples etched using Solutions A and C e.g., providing low etch weights
- the aluminum alloy samples etched using Solution A provided a significantly improved RSW electrode lifetime even while having a lower surface roughness compared to the aluminum alloy samples etched using Solutions B and D, in particular, Etch Reference Nos. 8, 14, 15, and 16.
- Illustration 40 is an aluminum alloy product prepared according to the method of any preceding or subsequent illustration, wherein the aluminum alloy product comprises a motor vehicle body part, an aerospace body part, a transportation body part, a marine body part, a motor vehicle panel, an aerospace skin panel, a marine panel, an electronics device housing, an architectural structural part, or an architectural aesthetic panel.
- Two samples of a 6xxx series aluminum alloy were prepared by direct chill casting and were processed by homogenizing, hot rolling, cold rolling, solution heat treating, air quenching, etching using 7% R243, and pretreating with an adhesion promoter.
- the processing methods differed only by the solution heat treatment step.
- the first alloy sample was solution heat treated at 540 °C for 1 second (Method 1) and the second alloy sample was solution heat treated at 578 °C for 35 seconds (Method 2).
- Figure 4 presents X-ray photoelectron spectroscopy (XPS) depth profile data for the Mg content in the sample prepared according to Method 1 (indicated by square symbols), the Mg content in the sample prepared according to Method 2 (indicated by triangle symbols), and the Mg content in a comparative 6xxx series aluminum alloy that was not solution heat treated ("AA 6xxx;" indicated by circle symbols).
- XPS X-ray photoelectron spectroscopy
- Method 2 provided a greater Mg content closer to the aluminum alloy surface and a lower Mg content in the bulk of the aluminum alloy, as well as a greater Mg content compared to the exemplary aluminum alloy prepared according to Method 1 and the comparative 6xxx series aluminum alloy.
- the comparative 6xxx series aluminum alloy exhibited a highly uniform Mg concentration from the surface to the bulk of the aluminum alloy and a lower overall Mg content near the surface of the aluminum alloy.
- Figure 5 presents XPS depth profile data for the Si content in the aluminum alloy product prepared according to Method 1 (indicated by square symbols), the aluminum alloy product prepared according to Method 2 (indicated by triangle symbols), and a comparative 6xxx series aluminum alloy that was not solution heat treated (indicated by circle symbols).
- Figure 5 is the ability to control migrant silicon (Si) concentration in the bulk aluminum alloy and provide uniform Si concentration into the bulk of the aluminum alloy.
- Method 1 provided a greater Si content closer to the aluminum alloy surface and a lower Si content in the bulk of the aluminum alloy.
- Method 2 provided a greater Si content near the surface of the aluminum alloy and a more uniform Si concentration further into the bulk of the aluminum alloy.
- the Si content of the Method 2 alloy product was higher than that of the comparative 6xxx series aluminum alloy product.
- the comparative 6xxx series aluminum alloy exhibited a highly uniform and very low Si concentration from the surface to the bulk of the aluminum alloy and a lower overall Si content near the surface of the aluminum alloy.
- Figure 6 shows bond durability testing results of aluminum alloys prepare according to methods described herein.
- Exemplary aluminum alloy samples prepared according to Method 1 and Method 2 were bonded together and subjected to a stress durability test.
- a stress durability test In the stress durability test, a set of 6 lap joints/bonds were connected in sequence by bolts and positioned vertically in a 90% relative humidity (RH) humidity cabinet. The temperature was maintained at 50 °C. A force load of 2.4 kN was applied to the bond sequence.
- the stress durability test is a cyclic exposure test that is conducted for up to 45 cycles. Each cycle lasts for 24 hours. In each cycle, the bonds are exposed in the humidity cabinet for 22 hours, then immersed in 5% NaCl for 15 minutes, and finally air-dried for 105 minutes. Upon the breaking of three joints, the test is discontinued for the particular set of joints and is indicated as a first failure.
- the exemplary aluminum alloy prepared according to Method 2 (left set of histograms) exhibited a lower cycles to failure number, indicating a lower bond durability than the exemplary aluminum alloy prepared according to Method 1 (right set of histograms). Mean cycles to failure is indicated by the left histogram in each set (hatched histogram) with first observed failure indicated by the right histogram in each set (cross-hatched).
- Two samples of a 6xxx series aluminum alloy were prepared by direct chill casting and were processed by homogenizing, hot rolling, cold rolling, solution heat treating, air quenching, etching using 7% R243, and pretreating with an adhesion promoter.
- the processing methods differed only by the hot rolling temperatures.
- the first alloy sample was hot rolled with a 390 °C hot mill exit temperature (Method 1) and the second alloy sample was hot rolled with a 330 °C hot mill exit temperature (Method 2).
- Figure 7 shows the XPS depth profiling of the Mg content in the aluminum alloy product prepared by the high-temperature (Method 1) versus the low-temperature (Method 2) rolled surface.
- the aluminum alloy sample prepared according to Method 1 exhibited an enrichment ratio of 2 and an Mg concentration of 10 % within the aluminum alloy subsurface.
- the aluminum alloy prepared according to Method 2 exhibited an enrichment ratio of 1.6 and an Mg concentration of 5 % within the aluminum alloy subsurface.
- Two samples of a 6xxx series aluminum alloy were prepared by direct chill casting and were processed by homogenizing, hot rolling, cold rolling, solution heat treating, air quenching, etching using 7% R243, and pretreating with an adhesion promoter.
- the processing methods differed only by the order of the cleaning step.
- the first alloy sample was pre-cleaned before solution heat treatment (referred to as "Pre-clean -> SHT") and the second alloy sample was solution heat treated and then pre-cleaned (referred to as "SHT -> Pre-clean"). Both were followed by acid etching and pre-treatment application.
- Figure 8 presents XPS depth profile data of the Mg content in the aluminum alloy samples.
- the exemplary aluminum alloy cleaned before solutionizing (referred to as "Pre-clean ⁇ SHT”) showed a 6 % Mg concentration and a 2.4 enrichment ratio.
- the exemplary aluminum alloy cleaned after solutionizing (referred to as "SHT -> Pre-clean”) showed a 1.5 % Mg concentration and a 0.7 enrichment ratio.
- Example 4 Controlling Migrant Element Concentrations in a Continuously Cast Aluminum Alloy
- Aluminum alloy products were prepared according to continuous casting methods as described above. The products were cast at a width of 1450 mm and trimmed to 1300 mm. The products were then hot rolled, cold rolled to 5.1 mm, annealed at 400 °C for 2 hours, and cold rolled to 2 mm. The products were then solutionized and quenched under varying conditions, as shown in Table 1.
- Table 1 Sample ID Solutionizing Temperature Quenching Method Continuous Casting Condition 1 (C1) 553°C Air Continuous Casting Condition 2 (C2) 553°C Water Continuous Casting Condition 3 (C3) 544°C Water Continuous Casting Condition 4 (C4) 560°C Air Direct Chill Casting Condition (D1) 560°C Air
- Figures 9A and 9B show GDOES data for Mg content near the surfaces of aluminum alloy sheets (e.g., from the surface to a depth of 2.0 ⁇ m).
- Figure 9A shows data for Mg content extending into the bulk of the aluminum alloy sheet.
- Figure 9B shows data for Mg content considered to be found in the surface of the aluminum alloy sheet (e.g., from the surface to a depth of 0.5 ⁇ m).
- Figures 9A and 9B show a high diffusion of Mg to the surface of the aluminum alloy sheets produced by direct chill casting (samples D1 and D1-lab).
- Figures 9A and 9B show decreased diffusion of Mg to the surface of the aluminum alloy sheets, and a uniform distribution of Mg from the surface into the bulk of the aluminum alloy sheets, produced by the exemplary continuous casting method described above. A lower concentration of Mg near the surface of the aluminum alloy sheets is desirable for bonding and joining applications.
- Figures 10A and 10B show GDOES data for Si content near the surfaces of aluminum alloy sheets (e.g., from the surface to a depth of 2.0 ⁇ m).
- Figure 10A shows data for Si content extending into the bulk of the aluminum alloy sheet.
- Figure 10B shows data for Si content considered to be found in the surface of the aluminum alloy sheet (e.g., from the surface to a depth of 0.5 ⁇ m).
- Figures 10A and 10B show a high diffusion of Si to the surface of the aluminum alloy sheets produced by direct chill casting (samples D1 and D1-lab).
- Figures 10A and 10B show decreased diffusion of Si to the surface of the aluminum alloy sheets, and a uniform distribution of Si from the surface into the bulk of the aluminum alloy sheets produced by the exemplary continuous casting method described above.
- Figures 11A and 11B show GDOES data for Cu content near the surfaces of aluminum alloy sheets (e.g., from the surface to a depth of 2.0 ⁇ m).
- Figure 11A shows data for Cu content extending into the bulk of the aluminum alloy sheet.
- Figure 11B shows data for Cu content considered to be found in the surface of the aluminum alloy sheet (e.g., from the surface to a depth of 0.5 ⁇ m).
- Figures 11A and 11B show a low diffusion of Cu to the surface of the aluminum alloy sheets produced by direct chill casting (samples D1 and D1-lab).
- Figures 11A and 11B show increased diffusion of Cu to the surface of the aluminum alloy sheets produced by the exemplary continuous casting method described above. Controlled diffusion of Cu to the surface of the aluminum alloy sheets can be desirable for bonding and joining applications.
- Figures 12A and 12B show GDOES data for Mn content near the surfaces of aluminum alloy sheets (e.g., from the surface to a depth of 2.0 ⁇ m).
- Figure 12A shows data for Mn content extending into the bulk of the aluminum alloy sheet.
- Figure 12B shows data for Mn content considered to be found in the surface of the aluminum alloy sheet (e.g., from the surface to a depth of 0.5 ⁇ m).
- Figures 12A and 12B show no diffusion of Mn to the surface of the aluminum alloy sheets produced by direct chill casting (samples D1 and D1-lab).
- Figures 12A and 12B show increased diffusion of Mn to the surface of the aluminum alloy sheets produced by the exemplary continuous casting method described above.
- Figures 13A and 13B show GDOES data for Cr content near the surfaces of aluminum alloy sheets (e.g., from the surface to a depth of 2.0 ⁇ m).
- Figure 13A shows data for Cr content extending into the bulk of the aluminum alloy sheet.
- Figure 13B shows data for Cr content considered to be found in the surface of the aluminum alloy sheet (e.g., from the surface to a depth of 0.5 ⁇ m).
- Figures 13A and 13B show no diffusion of Cr to the surface of the aluminum alloy sheets produced by direct chill casting (samples D1 and D1-lab).
- Figures 13A and 13B show increased diffusion of Cr to the surface of the aluminum alloy sheets produced by the exemplary continuous casting method described above. Controlled diffusion of Cr to the surface of the aluminum alloy sheets can be desirable for bonding and joining applications. Controlled diffusion of Cr to the surface of the aluminum alloy sheets can be desirable for corrosion resistance.
- Figures 14A and 14B show GDOES data for Fe content near the surfaces of aluminum alloy sheets (e.g., from the surface to a depth of 2.0 ⁇ m).
- Figure 14A shows data for Fe content extending into the bulk of the aluminum alloy sheet.
- Figure 14B shows data for Fe content considered to be found in the surface of the aluminum alloy sheet (e.g, from the surface to a depth of 0.5 ⁇ m).
- Figures 14A and 14B show no diffusion of Fe to the surface of the aluminum alloy sheets produced by direct chill casting (samples D1 and D1-lab).
- Figures 14A and 14B show increased diffusion of Fe to the surface of the aluminum alloy sheets produced by the exemplary continuous casting method described above.
- Bond durability test results for the exemplary continuously cast aluminum alloy sheets and the comparative direct chill cast aluminum alloy sheets were performed according to the procedure described in Example 2. For this experiment, the completion of 45 cycles indicates that the set of joints passed the bond durability test.
- the test results are shown below in Table 2.
- each of the joints are numbered 1 through 6, where joint 1 is the top joint and joint 6 is the bottom joint when oriented vertically.
- the number in the cells, except for "45,” indicates the number of successful cycles before a break.
- the number "45 in a cell indicates that the joints remained intact for 45 cycles.
- test coupons were cut from the exemplary continuously cast aluminum alloy sheets.
- the test coupons were subjected to alkaline and acid etching to clean and prepare the surfaces for bonding. Bonding was performed by pretreating the aluminum alloy sheets with an adhesion promoter and bonding the test coupons with an adhesive. Bonded test coupons were exposed to a humid environment for up to 45 duty cycles.
- test coupons were cut from the exemplary continuously cast aluminum alloy sheets.
- the test coupons were subjected to a strong alkaline cleaning and acid etching to clean and prepare the surfaces for bonding. Bonding was performed by pretreating the aluminum alloy sheets with an adhesion promoter and bonding the test coupons with an adhesive. Bonded test coupons were exposed to a humid environment for up to 45 duty cycles.
- test coupons were cut from the exemplary continuously cast aluminum alloy sheets.
- the test coupons were subjected to an acid etching to clean and prepare the surfaces for bonding. Bonding was performed by pretreating the aluminum alloy sheets with an adhesion promoter and bonding the test coupons with an adhesive. Bonded test coupons were exposed to a humid environment for up to 45 duty cycles.
- test coupons were cut from the exemplary continuously cast aluminum alloy sheets.
- the test coupons were solution heat treated in the lab furnace and then subjected to alkaline and acid etching to clean and prepare the surface for bonding. Bonding was performed by pretreating the aluminum alloy sheets with an adhesion promoter and bonding the test coupons with an adhesive. Bonded test coupons were exposed to a humid environment for up to 45 duty cycles.
- test coupons were cut from the comparative direct chill cast aluminum alloy sheets.
- the test coupons were subjected to acid etching to prepare the surface for bonding. Bonding was performed by pretreating the aluminum alloy sheets with an adhesion promoter and bonding the test coupons with an adhesive. Bonded test coupons were exposed to a humid environment for up to 45 duty cycles.
- the exemplary continuously cast aluminum alloy sheets having controlled diffusion of Mn and Cr to the surface of the aluminum alloy sheets demonstrated excellent bond durability, surviving 45 test cycles without failure.
- the comparative direct chill cast aluminum alloy sheets having Mg diffused to the surface demonstrated poor bond durability.
- etchants employed were (i) a mixture of phosphoric and sulfuric acid (referred to as solution “A” in Table 3 below), (ii) a mixture of sulfuric acid and ammonium fluoride (referred to as solution “B” in Table 3 below), (iii) a mixture of sulfuric acid and iron (III) sulfate hydrate (referred to as solution “C” in Table 3 below), and (iv) sodium hydroxide (referred to as solution “D” in Table 3 below).
- Figure 15 is a graph showing the RSW electrode service lifetime for RSW electrodes employed to weld aluminum alloy samples after etching in the various etchant solutions described above.
- Solution D NaOH
- Solution A a mixture of phosphoric acid and sulfuric acid (H 3 PO 4 /H 2 SO 4 )
- H 3 PO 4 /H 2 SO 4 a mixture of phosphoric acid and sulfuric acid
- the mixture of H 3 PO 4 /H 2 SO 4 provided an atomic concentration ratio of P/Mg of about 0.65 in a subsurface extending to a depth of about 83 ⁇ m from the surface of the aluminum alloy.
- Solution B a mixture of sulfuric acid and ammonium fluoride (H 2 SO 4 /NH 4 F)
- Solution C a mixture of sulfuric acid and iron (III) sulfate hydrate (H 2 SO 4 /Fe 2 (SO 4 ) 3 )
- incorporating P into a Mg-containing subsurface significantly increased the RSW electrode lifetime.
- Figure 16 is a graph showing etch weight (i.e., amount of material removed from the surface of the aluminum alloys during etching) for each etch performed (Etches 1 - 16 in Table 3).
- Solution D was able to provide the greatest etch weight and was thus employed as a comparative solution.
- Solution B provided the greatest etch weight
- Solutions A and C provided similar etch weights, both less than that provided by Solution B.
- Solution B provided the greatest etch weight (see Figure 16 ) but did not exhibit improvement to the RSW electrode lifetime.
- solutions A and C provided similar etch weights but also provided significantly different RSW electrode lifetimes.
- Solution A (containing P) provided a significantly improved RSW electrode lifetime and Solution C was detrimental to the RSW electrode lifetime.
- removal of the deformed oxide layer alone is insufficient to improve the RSW electrode lifetime.
- removal of a portion of the deformed oxide layer, and a presence of a residual P concentration can work in concert to improve the RSW electrode lifetime.
- Figures 17 - 20 are graphs showing glow discharge optical emission spectroscopy (GDOES) data for Mg content near the surface of the aluminum alloy samples described above (e.g., from the surface to a depth of 5.0 ⁇ m).
- Figure 17 shows data for Mg content extending into the bulk of the aluminum alloy sample etched with Solution A.
- Figure 18 shows data for Mg content extending into the bulk of the aluminum alloy sample etched with Solution B.
- Figure 19 shows data for Mg content extending into the bulk of the aluminum alloy sample etched with Solution C.
- Figure 20 shows data for Mg content extending into the bulk of the aluminum alloy sample etched with Solution D.
- a Mg concentration found within the subsurface portion of the aluminum alloy samples can negatively impact the RSW electrode lifetime.
- RSW electrode lifetime was significantly improved even though the sample contained a concentration of Mg within the subsurface of the aluminum alloy.
- the aluminum alloy sample etched with comparative Solution D ( Figure 20 ) exhibited nearly complete removal of Mg near the surface of the aluminum alloy, further indicating that the presence of Mg and/or a Mg containing compound (e.g., MgO) after etching with a P containing compound provides a significantly improved RSW electrode lifetime.
- Mg containing compound e.g., MgO
- Figure 19 shows the GDOES data for the aluminum alloy sample etched with Solution C.
- Mg and/or Mg containing compounds are present near the surface of the aluminum alloy samples; however, Solution C did not contain P and was detrimental to the RSW electrode lifetime (see Figure 15 ).
- Solution C did not contain P and was detrimental to the RSW electrode lifetime (see Figure 15 ).
- the presence of Mg and/or Mg containing compounds near the surface of the aluminum alloy without having P present in the etching solution can be detrimental to the RSW electrode lifetime.
- alloying element and/or alloying element oxide particle size and morphology can affect surface properties of the aluminum alloy product.
- Figures 21 , 22 , 23 , and 24 present scanning electron microscope (SEM) micrographs of the aluminum alloy samples described above.
- Figures 21A-D show SEM micrographs of the aluminum alloy samples etched using Solution A.
- Figures 21A and 21B show the SEM micrographs from Etch 1 (see Table 3).
- Figures 21C and 21D show the SEM micrographs from Etch 4.
- Figures 21A and 21C are micrographs from a scanning electron mode.
- Figures 21B and 21D are micrographs from a back-scattered electron mode.
- Figures 22A-D shows SEM micrographs of the aluminum alloy samples etched using Solution B.
- Figures 22A and 22B show the SEM micrographs from Etch 5.
- Figures 22C and 22D show the SEM micrographs from Etch 7.
- Figures 22A and 22C are micrographs from a scanning electron mode.
- Figures 22B and 22D are micrographs from a back-scattered electron mode.
- Figures 23A-D shows SEM micrographs of the aluminum alloy samples etched using Solution C.
- Figures 23A and 23B show the SEM micrographs from Etch 9.
- Figures 23C and 23D show the SEM micrographs from Etch 12.
- Figures 23A and 23C are micrographs from a scanning electron mode.
- Figures 23B and 23D are micrographs from a back-scattered electron mode.
- Figures 24A-D shows SEM micrographs of the aluminum alloy samples etched using Solution D.
- Figures 24A and 24B show the SEM micrographs from Etch 13.
- Figures 24C and 24D show the SEM micrographs from Etch 16.
- Figures 24A and 24C are micrographs from a scanning electron mode.
- Figures 24B and 24D are micrographs from a back-scattered electron mode.
- Solution B ( Figure 22 ) provided the greatest etch weight of Etch Solutions A, B, and C, see Figure 16 ), thus providing a surface having a reduced amount of Mg and/or Mg containing compound particles (indicated by bright spots in Figures 21 , 23 , and 24 ), and a reduced deformed oxide layer (shown as darker grey areas in Figures 21 , 23 , and 24 ).
- FIG. 25 Panel A shows a copper RSW electrode tip.
- Panel A MgO particles 1105 adhered to the RSW electrode tip.
- Panel B shows a micrograph of the weld
- Panel C is a higher magnification image of Figure 25 , Panel B.
- dark areas 1110 indicate MgO present at the surface or in the subsurface of the aluminum alloy sheet.
- the Mg content was 6.9 %.
- An as-produced AA5182 aluminum alloy contains from 4 % to 5 % Mg (e.g., about 4.5 % Mg).
- a Mg content of 6.9 % at the surface or in the subsurface indicated migration of Mg from a bulk of the aluminum alloy toward the surface during processing, providing undesired amounts of MgO at the surface or in the subsurface of the aluminum alloy. Accordingly, during the RSW trial, MgO particles adhered to the RSW electrode tip. Such MgO particle pick-up can significantly reduce the RSW electrode lifetime.
- etching and/or cleaning the surface of the aluminum alloy sheet according to the methods described herein can remove MgO from the surface or the subsurface of the aluminum alloy, form Mg-P compounds as described above, eliminate MgO pick-up by the RSW electrode, and increase the lifetime of the RSW electrode.
- Figure 26 is a graph showing the yellow index (YI) of the aluminum alloy samples prepared as described above.
- the YI can indicate the presence of a Mg and/or Mg containing compound (e.g., MgO) on the surface of the aluminum alloys.
- a lack of a significant YI is indicated by a dashed line (e.g., a YI less than about 1).
- the aluminum alloy samples etched using comparative Solution D e.g., providing the greatest etch weight
- a very low YI indicates a negligible concentration of Mg or Mg containing compounds on the surface of the aluminum alloys.
- the aluminum alloy samples etched using Solution B e.g., providing the greatest etch weight of the exemplary etch solutions (Solutions A, B, and C)
- exhibited a low YI indicating a significant removal of Mg and/or Mg containing compounds from the surface of the aluminum alloy samples.
- the aluminum alloy samples etched using Solutions A and C exhibited a greater YI for each sample, indicating a greater Mg and/or Mg containing compounds concentration than the aluminum alloy samples etched using Solutions B and D.
- the aluminum alloy samples etched using Solution A provided a significantly improved RSW electrode lifetime even while having a significant Mg and/or Mg containing compounds concentration at the surface of the aluminum alloy samples. Also, an increase in the YI was observed from Etch Reference No. 1 to Etch Reference No. 2 (e.g., a "reverse effect" was observed), indicating the etch procedure exposed additional Mg to the alloy surface and thus oxidizing the additional Mg once exposed. Additional Mg can be attributed to a Mg enriched subsurface. Surprisingly, the aluminum alloy samples etched using Solution C exhibited detrimental effects on the RSW electrode lifetime when exhibiting a similar YI to the aluminum alloy samples etched using Solution A.
- an optimized surface chemistry wherein a lower etch weight allows for a concentration of Mg and/or Mg containing compounds to remain within the subsurface of an aluminum alloy, created by etching with a P containing compound in which residual P can remain, provided a significantly improved RSW electrode lifetime.
- the standard deviation of the YI for all samples was less than 1.5% of the mean YI.
- Figure 27 is a graph showing the surface roughness of the aluminum alloy samples prepared as described above.
- the aluminum alloy samples etched using Solutions A and C e.g., providing low etch weights
- the aluminum alloy samples etched using Solution A provided a significantly improved RSW electrode lifetime even while having a lower surface roughness compared to the aluminum alloy samples etched using Solutions B and D, in particular, Etch Reference Nos. 8, 14, 15, and 16.
- Various embodiments of the invention have been described in fulfillment of the various objectives of the invention. It should be recognized that these embodiments are merely illustrative of the principles of the present invention. Numerous modifications and adaptions thereof will be readily apparent to those skilled in the art without departing from the present invention as defined in the following claims.
Landscapes
- Chemical & Material Sciences (AREA)
- Engineering & Computer Science (AREA)
- Mechanical Engineering (AREA)
- Materials Engineering (AREA)
- Metallurgy (AREA)
- Organic Chemistry (AREA)
- Crystallography & Structural Chemistry (AREA)
- Physics & Mathematics (AREA)
- Thermal Sciences (AREA)
- General Chemical & Material Sciences (AREA)
- Chemical Kinetics & Catalysis (AREA)
- Physical Vapour Deposition (AREA)
- ing And Chemical Polishing (AREA)
- Powder Metallurgy (AREA)
- Metal Rolling (AREA)
- Pressure Welding/Diffusion-Bonding (AREA)
- Chemically Coating (AREA)
- Electrolytic Production Of Metals (AREA)
- Solid-Sorbent Or Filter-Aiding Compositions (AREA)
- Electrolytic Production Of Non-Metals, Compounds, Apparatuses Therefor (AREA)
Description
- This application claims the benefit of
U.S. Provisional Application Nos. 62/608,614, filed December 21, 2017 62/741,688, filed October 5, 2018 - The present disclosure is directed to aluminum alloy products and the surface features of the same. The disclosure further relates to methods of producing aluminum alloy products.
- Aluminum alloy products are often bonded or joined to other metals or alloys, including other aluminum alloys, during fabrication of aluminum alloy and other metals based products. Requirements of the aluminum alloy products include, for example, good bond durability and high resistance to corrosion. Aluminum alloy products can be processed in a manner to enhance the bond durability and corrosion resistance.
- In addition, aluminum alloy products should exhibit amenability to resistance spot welding and other joining methods. In addition, the methods should include safeguards such that the replacement of consumable items used in the joining methods is minimized.
- Covered embodiments of the invention are defined by the claims, not this summary. This summary is a high-level overview of various aspects of the invention and introduces some of the concepts that are further described in the Detailed Description section below. This summary is not intended to identify key or essential features of the claimed subject matter, nor is it intended to be used in isolation to determine the scope of the claimed subject matter. The subject matter should be understood by reference to appropriate portions of the entire specification, any or all drawings, and each claim.
- The subject matter of the present invention is defined in
independent claims dependent claims 2 and 4-6. - The aluminum alloy product according to the present invention comprises a subsurface portion having a concentration of a migrant element and a bulk portion having a concentration of the migrant element, wherein the subsurface portion extends from the surface to a depth of 2.0 µm within the interior of the alloy product and wherein the migrant element comprises Mg, Si, Cu, Mn, Cr and/or Fe. In these products, the concentration of the migrant element in the subsurface portion is higher than the concentration of the migrant element in the bulk portion. The aluminum alloy product can optionally comprise a 6xxx series aluminum alloy or a 5xxx series aluminum alloy.
- Also described herein is a method of producing an aluminum alloy product as defined in
claim 3 and claims 4-6 dependent thereon. The method comprises casting an aluminum alloy comprising a migrant element to produce a cast aluminum alloy article, rolling the cast aluminum alloy article to provide a rolled aluminum alloy article, and heat treating the rolled aluminum alloy article to form an aluminum alloy product. The rolling step can be performed at a temperature of from about 200 °C to about 550 °C. The heat treating step can be performed at a temperature of from about 400 °C to about 580 °C and for a duration of about 120 seconds or less. - The method can further comprise pretreating the cast aluminum alloy product. The pretreating step can include cleaning a surface of the alloy product, etching the surface of the alloy product, and applying a pretreatment to the surface of the alloy product. Optionally, the pretreating is performed after the heat treating step. The casting can comprise direct chill casting or continuous casting.
- Also described herein are aluminum alloy products prepared according to the methods described herein. The aluminum alloy products can comprise motor vehicle body parts, among others.
- Further aspects, objects, and advantages will become apparent upon consideration of the detailed description and figures that follow.
-
-
Figure 1 is a schematic of migrant elements within subsurface and bulk portions of an aluminum alloy product. -
Figure 2 is a graph showing the Mg content in 5xxx and 6xxx series aluminum alloy products by X-ray photoelectron spectroscopy. -
Figure 3 is a graph showing the Si content in 5xxx and 6xxx series aluminum alloy products by X-ray photoelectron spectroscopy. -
Figure 4 is a graph showing the Mg content in exemplary aluminum alloy product surfaces by X-ray photoelectron spectroscopy. -
Figure 5 is a graph showing the Si content in exemplary aluminum alloy product surfaces by X-ray photoelectron spectroscopy. -
Figure 6 is a graph showing bond durability of exemplary alloys prepared and processed according to methods described herein. -
Figure 7 is a graph showing the Mg content in exemplary aluminum alloy product surfaces provided according to exemplary methods described herein. -
Figure 8 is a graph showing the Mg content in exemplary aluminum alloy product surfaces provided according to exemplary methods described herein. -
Figure 9A is a graph showing glow discharge optical emission spectroscopy of Mg in the subsurface and bulk portions of an aluminum alloy produced by exemplary methods described herein. -
Figure 9B is a graph showing glow discharge optical emission spectroscopy of Mg in the subsurface and bulk portions of an aluminum alloy produced by exemplary methods described herein. -
Figure 10A is a graph showing glow discharge optical emission spectroscopy of Si in the subsurface and bulk portions of an aluminum alloy produced by exemplary methods described herein. -
Figure 10B is a graph showing glow discharge optical emission spectroscopy of Si in the subsurface and bulk portions of an aluminum alloy produced by exemplary methods described herein. -
Figure 11A is a graph showing glow discharge optical emission spectroscopy of Cu in the subsurface and bulk portions of an aluminum alloy produced by exemplary methods described herein. -
Figure 11B is a graph showing glow discharge optical emission spectroscopy of Cu in the subsurface and bulk portions of an aluminum alloy produced by exemplary methods described herein. -
Figure 12A is a graph showing glow discharge optical emission spectroscopy of Mn in the subsurface and bulk portions of an aluminum alloy produced by exemplary methods described herein. -
Figure 12B is a graph showing glow discharge optical emission spectroscopy of Mn in the subsurface and bulk portions of an aluminum alloy produced by exemplary methods described herein. -
Figure 13A is a graph showing glow discharge optical emission spectroscopy of Cr in the subsurface and bulk portions of an aluminum alloy produced by exemplary methods described herein. -
Figure 13B is a graph showing glow discharge optical emission spectroscopy of Cr in the subsurface and bulk portions of an aluminum alloy produced by exemplary methods described herein. -
Figure 14A is a graph showing glow discharge optical emission spectroscopy of Fe in the subsurface and bulk portions of an aluminum alloy produced by exemplary methods described herein. -
Figure 14B is a graph showing glow discharge optical emission spectroscopy of Fe in the subsurface and bulk portions of an aluminum alloy produced by exemplary methods described herein. -
Figure 15 is a graph comparing resistance spot welding electrode tip life after welding for various aluminum alloy samples. -
Figure 16 is a graph showing amount of material removed (referred to as "etch weight") during etching of aluminum alloys. -
Figure 17 is a graph showing glow-discharge optical emission spectroscopy (GDOES) of Mg in aluminum alloys. -
Figure 18 is a graph showing glow-discharge optical emission spectroscopy (GDOES) of Mg in aluminum alloys. -
Figure 19 is a graph showing glow-discharge optical emission spectroscopy (GDOES) of Mg in aluminum alloys. -
Figure 20 is a graph showing glow-discharge optical emission spectroscopy (GDOES) of Mg in aluminum alloys. -
Figure 21A is a scanning electron micrograph showing a surface portion of an aluminum alloy. -
Figure 21B is a scanning electron micrograph showing a surface portion of an aluminum alloy. -
Figure 21C is a scanning electron micrograph showing a surface portion of an aluminum alloy. -
Figure 21D is a scanning electron micrograph showing a surface portion of an aluminum alloy. -
Figure 22A is a scanning electron micrograph showing a surface portion of an aluminum alloy. -
Figure 22B is a scanning electron micrograph showing a surface portion of an aluminum alloy. -
Figure 22C is a scanning electron micrograph showing a surface portion of an aluminum alloy. -
Figure 22D is a scanning electron micrograph showing a surface portion of an aluminum alloy. -
Figure 23A is a scanning electron micrograph showing a surface portion of an aluminum alloy. -
Figure 23B is a scanning electron micrograph showing a surface portion of an aluminum alloy. -
Figure 23C is a scanning electron micrograph showing a surface portion of an aluminum alloy. -
Figure 23D is a scanning electron micrograph showing a surface portion of an aluminum alloy. -
Figure 24A is a scanning electron micrograph showing a surface portion of an aluminum alloy. -
Figure 24B is a scanning electron micrograph showing a surface portion of an aluminum alloy. -
Figure 24C is a scanning electron micrograph showing a surface portion of an aluminum alloy. -
Figure 24D is a scanning electron micrograph showing a surface portion of an aluminum alloy. -
Figure 25 , Panel A shows scanning electron micrographs of a resistance spot welding copper electrode tip.Figure 25 , Panel B shows a weld zone.Figure 25 , Panel C shows a higher magnification image of Panel B. -
Figure 26 is a graph showing the yellow index (YI) of aluminum alloys. -
Figure 27 is a graph showing the surface roughness of aluminum alloys. - According to the present invention, described herein are metal alloy products, including aluminum alloy products, having desired surface properties. The aluminum alloy products described herein have a concentration of migrant elements, including magnesium and silicon, which can be controlled. In some cases, the concentration of the migrant elements throughout the thickness of the alloy product can be controlled to result in desirable properties. Exemplary desirable properties exhibited by the aluminum alloy products described herein include, for example, high bond durability and high corrosion resistance. The properties of the alloys are achieved due to the methods of processing the alloys to produce the described plates, shates, and sheets. As further described herein, the desirable properties can be achieved by specially designed rolling, heat treating, and/or etching and pretreating techniques.
- The terms "invention," "the invention," "this invention" and "the present invention" used herein are intended to refer broadly to all of the subject matter of this patent application and the claims below. Statements containing these terms should be understood not to limit the subject matter described herein or to limit the meaning or scope of the patent claims below.
- In this description, reference is made to alloys identified by aluminum industry designations, such as "series" or "6xxx." For an understanding of the number designation system most commonly used in naming and identifying aluminum and its alloys, see "International Alloy Designations and Chemical Composition Limits for Wrought Aluminum and Wrought Aluminum Alloys" or "Registration Record of Aluminum Association Alloy Designations and Chemical Compositions Limits for Aluminum Alloys in the Form of Castings and Ingot," both published by The Aluminum Association.
- As used herein, the meaning of "a," "an," or "the" includes singular and plural references unless the context clearly dictates otherwise.
- As used herein, a plate generally has a thickness of greater than about 15 mm. For example, a plate may refer to an aluminum product having a thickness of greater than 15 mm, greater than 20 mm, greater than 25 mm, greater than 30 mm, greater than 35 mm, greater than 40 mm, greater than 45 mm, greater than 50 mm, or greater than 100 mm.
- As used herein, a shate (also referred to as a sheet plate) generally has a thickness of from about 4 mm to about 15 mm. For example, a shate may have a thickness of 4 mm, 5 mm, 6 mm, 7 mm, 8 mm, 9 mm, 10 mm, 11 mm, 12 mm, 13 mm, 14 mm, or 15 mm.
- As used herein, a sheet generally refers to an aluminum product having a thickness of less than about 4 mm. For example, a sheet may have a thickness of less than 4 mm, less than 3 mm, less than 2 mm, less than 1 mm, less than 0.5 mm, less than 0.3 mm, or less than 0.1 mm.
- Reference is made in this application to alloy temper or condition. For an understanding of the alloy temper descriptions most commonly used, see "American National Standards (ANSI) H35 on Alloy and Temper Designation Systems." An F condition or temper refers to an aluminum alloy as fabricated. A W condition or temper refers to an aluminum alloy solution heat treated at a temperature greater than a solvus temperature of the aluminum alloy, and quenched. An O condition or temper refers to an aluminum alloy after annealing. An Hxx condition or temper, also referred to herein as an H temper, refers to a non-heat treatable aluminum alloy after cold rolling with or without thermal treatment (e.g., annealing). Suitable H tempers include HX1, HX2, HX3 HX4, HX5, HX6, HX7, HX8, or HX9 tempers. A T1 condition or temper refers to an aluminum alloy cooled from hot working and naturally aged (e.g., at room temperature). A T2 condition or temper refers to an aluminum alloy cooled from hot working, cold worked and naturally aged. A T3 condition or temper refers to an aluminum alloy solution heat treated, cold worked, and naturally aged. A T4 condition or temper refers to an aluminum alloy solution heat treated and naturally aged. A T5 condition or temper refers to an aluminum alloy cooled from hot working and artificially aged (at elevated temperatures). A T6 condition or temper refers to an aluminum alloy solution heat treated and artificially aged. A T7 condition or temper refers to an aluminum alloy solution heat treated and artificially overaged. A T8x condition or temper refers to an aluminum alloy solution heat treated, cold worked, and artificially aged. A T9 condition or temper refers to an aluminum alloy solution heat treated, artificially aged, and cold worked. A W condition or temper refers to an aluminum alloy after solution heat treatment.
- As used herein, terms such as "cast metal article," "cast article," and the like are interchangeable and refer to a product produced by direct chill casting (including direct chill co-casting) or semi-continuous casting, continuous casting (including, for example, by use of a twin belt caster, a twin roll caster, a block caster, or any other continuous caster), electromagnetic casting, hot top casting, or any other casting method.
- As used herein, "bond durability" refers to an ability of a bonding agent bonding two products together to withstand cycled mechanical stress after exposure to environmental conditions that initiate failure of the bonding agent. Bond durability is characterized in terms of number of mechanical stress cycles applied to the bound products, while the bound products are exposed to the environmental conditions, until the bond fails.
- As used herein, "room temperature" can include a temperature of from about 15 °C to about 30 °C, for example about 15 °C, about 16 °C, about 17 °C, about 18 °C, about 19 °C, about 20 °C, about 21 °C, about 22 °C, about 23 °C, about 24 °C, about 25 °C, about 26 °C, about 27 °C, about 28 °C, about 29 °C, or about 30 °C.
- All ranges disclosed herein are to be understood to encompass any endpoints and any and all subranges subsumed therein. For example, a stated range of "1 to 10" should be considered to include any and all subranges between (and inclusive of) the minimum value of 1 and the maximum value of 10; that is, all subranges beginning with a minimum value of 1 or more, e.g. 1 to 6.1, and ending with a maximum value of 10 or less, e.g., 5.5 to 10.
- Described herein are aluminum alloy products having desired surface properties. Among other properties, the aluminum alloy products described herein contain a controlled concentration of migrant elements throughout the thickness of the alloy product, including within the subsurface of the alloy product. In some non-limiting examples, the disclosed alloy products have improved surface qualities for bonding, joining, friction, corrosion resistance, and optical properties. In certain cases, the alloy products also demonstrate very good anodized qualities. According to the invention, alloys having desirable surface properties, including improved bonding and joining properties, have a low enrichment ratio of magnesium (Mg) and silicon (Si). Differences in the atomic concentration of the migrant elements between the subsurface area and the remainder of the alloy (i.e., the bulk of the alloy product) can cause a gradient in electrochemical activity. The gradient in electrochemical activity can lead to a surface that is more anodically active and prone to being corroded due to galvanic coupling between the subsurface and the bulk portion of the alloy product.
-
Figure 1 is an illustrative representation of analuminum alloy product 100 comprising analuminum matrix 110 that is enriched withMg 120 andSi 130. As shown inFigure 1 ,Mg 120 andSi 130 can migrate to an alloy surface during thermal treatments, thus providing undesired surface characteristics. A difference in the atomic concentration of the migrant element between the alloy subsurface and the bulk (remainder) of the alloy can cause a gradient in electrochemical activity as seen in the open circuit potential (OCP)profile 150 inFigure 1 .Figures 2 and3 demonstrate the elemental distribution of Mg and Si, respectively, in 5xxx series (Alloys A and B) and 6xxx series (Alloys C, D, and E) alloy products. The 5xxx series alloys (Alloys A and B) demonstrate less enrichment of Mg and Si near the surface of the alloy product, whereas the 6xxx series alloys (Alloys C, D, and E) demonstrate more enrichment of Mg and Si near the surface as compared to the amount in the remaining portion of the alloy product. Surprisingly, controlling migrant element distribution within the subsurface can reverse the effects shown inFigures 1-3 and provide desirable surface properties, without the need to alter or otherwise adjust the concentration of the elements used to prepare the aluminum alloy product. Such aluminum alloy products containing desirable surface properties, due to a suitable distribution of elements within the subsurface, are described below. - As used herein, the term "subsurface" refers to the portion of the alloy product that extends from the surface to a depth of 2.0 µm within the interior of the alloy product. The portion of the aluminum alloy product excluding the subsurface portion (e.g., the remainder of the alloy product) is referred to herein as the bulk of the alloy product.
- The term "migrant element," as used herein, refers to an element that can diffuse from a first position in the alloy product to a second position in the alloy product, as a result of, for example, one or more of the production and processing steps of the alloy product as further described below. The migrant elements include magnesium (Mg), silicon (Si), copper (Cu), manganese (Mn), chromium (Cr), and iron (Fe). Optionally, the migrant element is in the form of a compound or phase. For example, Mg can be present as Mg2Si or MgO. Mn and Fe can be present, for example, as Al(FeMn) or Al(Fe,Mn)Si.
- In some examples, a migrant element as described herein can diffuse throughout the alloy product such that the concentration of the element is distributed throughout the full thickness of the alloy product (i.e., within the subsurface and the bulk portions). For example, the alloy product can include a concentration of Mg and Si that is distributed throughout the alloy product and not concentrated within the subsurface. Such alloy products display exceptional bond durability and corrosion resistance properties.
- According to the invention, a migrant element as described herein can diffuse toward the subsurface portion of the alloy product such that an enrichment of the migrant element is provided near the surface of the alloy product. For example, the alloy product can include a concentration of Cu, Mn, Cr, and/or Fe that is localized within the subsurface portion of the alloy product. Such alloy products display exceptional adhesive performance and can behave as a pretreatment. In addition, alloy products including Cr enrichment within the subsurface can control the Fe-Si particle distribution and thus enhance corrosion resistance.
- In either case of a migrant element that is distributed throughout the full thickness of the alloy product or that is localized within the subsurface portion of the alloy product, the migrant element can be homogeneously populated or variably populated within the full thickness or subsurface of the alloy product. As used herein, "homogeneously populated" as related to the migrant elements means that the particular migrant element is evenly distributed within the full thickness or subsurface of the alloy product. In these cases, the concentration of the particular migrant element per region (i.e., within a region of the subsurface or within a region of the full thickness of the alloy product) is relatively constant across regions, on average. As used herein, "relatively constant" as related to migrant element distribution means that the concentration of the element in a first region of the subsurface or full thickness of the alloy product can differ from the concentration of the element in a second region of the subsurface or full thickness of the alloy product up to about 20 % (e.g., by up to about 15 %, by up to about 10 %, by up to about 5 %, or by about up to 1 %).
- In other cases, the concentration of the particular migrant element in a region is variably populated within the full thickness or subsurface of the alloy product. As used herein, "variably populated" as related to migrant element distribution means that the particular migrant element is not evenly distributed within the full thickness or subsurface of the alloy product. For example, a higher concentration of the migrant element can be localized in a first portion of the subsurface (or in a first portion of the full thickness of the alloy product) as compared to the concentration of the same migrant element in a second portion of the subsurface (or in a second portion of the full thickness of the alloy product).
- The migrant element distribution within the alloy product is characterized by an enrichment ratio. The enrichment ratio is a comparison of the migrant element concentration in the subsurface to the migrant element concentration in the bulk of the alloy product. In some examples, the enrichment ratio can be calculated by measuring a peak atomic concentration of a migrant element at a depth within the subsurface and at a depth within the thickness of the alloy and outside of the subsurface (i.e., within the bulk of the alloy). The enrichment ratio can be quantified by the following equation:

- A low enrichment ratio for a particular element indicates that the concentration of the migrant element is distributed throughout the alloy product and is not localized primarily within the subsurface. Enrichment ratios that are considered as low enrichment ratios include from 1.0 to 4.0. For example, the enrichment ratio can be 1.0.
- A high enrichment ratio for a particular element indicates that a high concentration of the migrant element is localized within the subsurface of the alloy product. Enrichment ratios that are considered as high enrichment ratios include 4.1 or greater. For example, the enrichment ratio can be approximately 4.1 or greater, 4.2 or greater, 4.3 or greater, 4.4 or greater, 4.5 or greater, 4.6 or greater, 4.7 or greater, 4.8 or greater, 4.9 or greater, 5.0 or greater, 5.1 or greater, 5.2 or greater, 5.3 or greater, 5.4 or greater, 5.5 or greater, 5.6 or greater, 5.7 or greater, 5.8 or greater, 5.9 or greater, 6.0 or greater, 6.1 or greater, 6.2 or greater, 6.3 or greater, 6.4 or greater, 6.5 or greater, 6.6 or greater, 6.7 or greater, 6.8 or greater, 6.9 or greater, 7.0 or greater, 7.1 or greater, 7.2 or greater, 7.3 or greater, 7.4 or greater, 7.5 or greater, 7.6 or greater, 7.7 or greater, 7.8 or greater, 7.9 or greater, or 8.0 or greater.
- It is desirable to have an aluminum alloy product having a high enrichment ratio for one or more migrant elements and a low enrichment ratio (e.g., a depletion) for other migrant elements. The aluminum alloy product as described herein has low enrichment ratios for Mg, Si, and/or Cu. The aluminum alloy product as described herein has high enrichment ratios for Cr, Mn, and/or Fe.
- In some cases, elemental enrichment in a certain area can be accompanied by an elemental depletion in another area of the aluminum alloy product. In some non-limiting examples, Mg, Si, and/or Cu enrichment can occur in areas of the subsurface of the aluminum alloy product in which Fe and Mn can be depleted. In some other examples, the aluminum alloy product can have a subsurface characterized by Si, Mn, and/or Fe depletion along with Cu enrichment.
- In some aspects, migrant element particle size and morphology can affect surface properties of the aluminum alloy product. For example, small Cu dispersoids and/or particles (e.g., less than about 10 nm in diameter) within the subsurface of the aluminum alloy product can provide good bond durability with no significant effect on corrosion susceptibility. Optionally, the Cu dispersoids and/or particles are about 9 nm or less in diameter, about 8 nm or less in diameter, about 7 nm or less in diameter, about 6 nm or less in diameter, about 5 nm or less in diameter, about 4 nm or less in diameter, about 3 nm or less in diameter, about 2 nm or less in diameter, or about 1 nm or less in diameter.
- The aluminum alloy products include a 5xxx series aluminum alloy, or a 6xxx series aluminum alloy.
- Non-limiting exemplary AA5xxx series alloys for use as the aluminum alloy product can include AA5182, AA5183, AA5005, AA5005A, AA5205, AA5305, AA5505, AA5605, AA5006, AA5106, AA5010, AA5110, AA5110A, AA5210, AA5310, AA5016, AA5017, AA5018, AA5018A, AA5019, AA5019A, AA5119, AA5119A, AA5021, AA5022, AA5023, AA5024, AA5026, AA5027, AA5028, AA5040, AA5140, AA5041, AA5042, AA5043, AA5049, AA5149, AA5249, AA5349, AA5449, AA5449A, AA5050, AA5050A, AA5050C, AA5150, AA5051, AA5051A, AA5151, AA5251, AA5251A, AA5351, AA5451, AA5052, AA5252, AA5352, AA5154, AA5154A, AA5154B, AA5154C, AA5254, AA5354, AA5454, AA5554, AA5654, AA5654A, AA5754, AA5854, AA5954, AA5056, AA5356, AA5356A, AA5456, AA5456A, AA5456B, AA5556, AA5556A, AA5556B, AA5556C, AA5257, AA5457, AA5557, AA5657, AA5058, AA5059, AA5070, AA5180, AA5180A, AA5082, AA5182, AA5083, AA5183, AA5183A, AA5283, AA5283A, AA5283B, AA5383, AA5483, AA5086, AA5186, AA5087, AA5187, and AA5088.
- Non-limiting exemplary AA6xxx series alloys for use as the aluminum alloy product can include AA6101, AA6101A, AA6101B, AA6201, AA6201A, AA6401, AA6501, AA6002, AA6003, AA6103, AA6005, AA6005A, AA6005B, AA6005C, AA6105, AA6205, AA6305, AA6006, AA6106, AA6206, AA6306, AA6008, AA6009, AA6010, AA6110, AA6110A, AA6011, AA6111, AA6012, AA6012A, AA6013, AA6113, AA6014, AA6015, AA6016, AA6016A, AA6116, AA6018, AA6019, AA6020, AA6021, AA6022, AA6023, AA6024, AA6025, AA6026, AA6027, AA6028, AA6031, AA6032, AA6033, AA6040, AA6041, AA6042, AA6043, AA6151, AA6351, AA6351A, AA6451, AA6951, AA6053, AA6055, AA6056, AA6156, AA6060, AA6160, AA6260, AA6360, AA6460, AA6460B, AA6560, AA6660, AA6061, AA6061A, AA6261, AA6361, AA6162, AA6262, AA6262A, AA6063, AA6063A, AA6463, AA6463A, AA6763, A6963, AA6064, AA6064A, AA6065, AA6066, AA6068, AA6069, AA6070, AA6081, AA6181, AA6181A, AA6082, AA6082A, AA6182, AA6091, and AA6092.
- The aluminum alloy product can have any suitable gauge. For example, the aluminum alloy product can be an aluminum alloy plate, an aluminum alloy shate, or an aluminum alloy sheet having a gauge between about 0.5 mm and about 50 mm (e.g., about 0.5 mm, about 1 mm, about 2 mm, about 3 mm, about 4 mm, about 5 mm, about 6 mm, about 7 mm, about 8 mm, about 9 mm, about 10 mm, about 15 mm, about 20 mm, about 25 mm, about 30 mm, about 35 mm, about 40 mm, about 45 mm, about 50 mm, or anywhere in between).
- In certain aspects, the disclosed alloy products can be prepared using a method as described herein. Without intending to limit the invention, aluminum alloy properties are partially determined by the formation of microstructures during the preparation of the alloy. In certain aspects, the method of preparation for an alloy composition determines whether the alloy will have properties adequate for a desired application. As described below, certain processing steps and conditions, including the rolling (e.g., hot rolling and/or cold rolling), heat treating (e.g., homogenizing, solutionizing, and/or annealing), and pretreatment steps and conditions, provide the alloy products described above having the desirable bond durability and corrosion resistance properties. The methods of producing aluminum alloy products as described herein include the steps of casting a molten aluminum alloy to form a cast aluminum alloy article, and processing the aluminum alloy article by one or more steps, including quenching, rolling, heat treating, and/or pretreating to form an aluminum alloy product.
- In some cases, the aluminum alloy products described herein can be cast using a direct chill (DC) casting process to form a cast product such as an ingot. The resulting ingots can then be scalped. The cast product can then be subjected to further processing steps. In one non-limiting example, the processing method includes homogenizing the aluminum alloy ingot and hot rolling the aluminum alloy ingot to form an aluminum alloy hot band. The aluminum alloy hot band can then be subjected to cold rolling, solution heat treatment, and optionally a pretreatment step.
- The homogenization step can include heating a cast product prepared from an alloy composition as described herein to attain a peak metal temperature (PMT) of about, or at least about, 450 °C (e.g., at least about 460 °C, at least about 470 °C, at least about 480 °C, at least about 490 °C, at least about 500 °C, at least about 510 °C, at least about 520 °C, at least about 530 °C, at least about 540 °C, at least about 550 °C, at least about 560 °C, at least about 570 °C, or at least about 580 °C). For example, the ingot can be heated to a temperature of from about 450 °C to about 580 °C, from about 460 °C to about 575 °C, from about 470 °C to about 570 °C, from about 480 °C to about 565 °C, from about 490 °C to about 555 °C, or from about 500 °C to about 550 °C. In some cases, the heating rate to the PMT can be about 100 °C/hour or less, about 75 °C/hour or less, about 50 °C/hour or less, about 40 °C/hour or less, about 30 °C/hour or less, about 25 °C/hour or less, about 20 °C/hour or less, or about 15 °C/hour or less. In other cases, the heating rate to the PMT can be from about 10 °C/min to about 100 °C/min (e.g., about 10 °C/min to about 90 °C/min, about 10 °C/min to about 70 °C/min, about 10 °C/min to about 60 °C/min, from about 20 °C/min to about 90 °C/min, from about 30 °C/min to about 80 °C/min, from about 40 °C/min to about 70 °C/min, or from about 50 °C/min to about 60 °C/min).
- The ingot is then allowed to soak (i.e., held at the indicated temperature) for a period of time. According to one non-limiting example, the ingot is allowed to soak for up to about 6 hours (e.g., from about 30 minutes to about 6 hours, inclusively). For example, the ingot can be soaked at a temperature of at least about 500 °C for about 30 minutes, about 1 hour, about 2 hours, about 3 hours, about 4 hours, about 5 hours, or about 6 hours, or anywhere in between.
- Following the homogenization step, a hot rolling step can be performed to form a hot band. In certain cases, the ingots are laid down and hot-rolled. The hot rolling temperature can be from about 200 °C to about 550 °C (e.g., from about 250 °C to about 500 °C, from about 300 °C to about 400 °C). For example, the hot rolling temperature can be about 200 °C, about 205 °C, about 210 °C, about 215 °C, about 220 °C, about 225 °C, about 230 °C, about 235 °C, about 240 °C, about 245 °C, about 250 °C, about 255 °C, about 260 °C, about 265 °C, about 270 °C, about 275 °C, about 280 °C, about 285 °C, about 290 °C, about 295 °C, about 300 °C, about 305 °C, about 310 °C, about 315 °C, about 320 °C, about 325 °C, about 330 °C, about 335 °C, about 340 °C, about 345 °C, about 350 °C, about 355 °C, about 360 °C, about 365 °C, about 370 °C, about 375 °C, about 380 °C, about 385 °C, about 390 °C, about 395 °C, about 400 °C, about 405 °C, about 410 °C, about 415 °C, about 420 °C, about 425 °C, about 430 °C, about 435 °C, about 440 °C, about 445 °C, about 450 °C, about 455 °C, about 460 °C, about 465 °C, about 470 °C, about 475 °C, about 480 °C, about 485 °C, about 490 °C, about 495 °C, about 500 °C, about 505 °C, about 510 °C, about 515 °C, about 520 °C, about 525 °C, about 530 °C, about 535 °C, about 540 °C, about 545 °C, or about 550 °C.
- In some non-limiting examples, a hot roll exit temperature can be from about 200 °C to about 450 °C. In some examples, the hot roll exit temperature should not exceed about 360 °C. For example, the hot roll exit temperature can range from about 250 °C to about 360 °C (e.g., from about 300 °C to about 350 °C). In these examples, the hot roll exit temperature can be about 250 °C, about 255 °C, about 260 °C, about 265 °C, about 270 °C, about 275 °C, about 280 °C, about 285 °C, about 290 °C, about 295 °C, about 300 °C, about 305 °C, about 310 °C, about 315 °C, about 320 °C, about 325 °C, about 330 °C, about 335 °C, about 340 °C, about 345 °C, about 350 °C, about 355 °C, or about 360 °C.
- In certain cases, the cast article can be hot rolled to an about 4 mm to about 15 mm thick gauge (e.g., from about 5 mm to about 12 mm thick gauge), which is referred to as a shate. For example, the ingot can be hot rolled to an about 4 mm thick gauge, about 5 mm thick gauge, about 6 mm thick gauge, about 7 mm thick gauge, about 8 mm thick gauge, about 9 mm thick gauge, about 10 mm thick gauge, about 11 mm thick gauge, about 12 mm thick gauge, about 13 mm thick gauge, about 14 mm thick gauge, or about 15 mm thick gauge. In certain cases, the ingot can be hot rolled to a gauge greater than 15 mm thick (i.e., a plate). In other cases, the ingot can be hot rolled to a gauge less than 4 mm (i.e., a sheet).
- A cold rolling step can be performed following the hot rolling step. In certain aspects, the hot band from the hot rolling step can be cold rolled to a sheet. The hot band temperature can be reduced to a temperature ranging from about 20 °C to about 200 °C (e.g., from about 120 °C to about 200 °C). The cold rolling step can be performed for a period of time to result in a desired final gauge thickness. Optionally, the cold rolling step can be performed for a period of up to about 1 hour (e.g., from about 10 minutes to about 30 minutes). For example, the cold rolling step can be performed for a period of about 10 minutes, about 20 minutes, about 30 minutes, about 40 minutes, about 50 minutes, or about 1 hour.
- Optionally, the desired final gauge thickness is below approximately 4.0 mm. In certain aspects, the rolled product is cold rolled to a thickness of about 0.4 mm to about 1.0 mm, about 1.0 mm to about 3.0 mm, or about 3.0 mm to less than about 4.0 mm. In certain aspects, the alloy is cold rolled to about 3.5 mm or less, about 3 mm or less, about 2.5 mm or less, about 2 mm or less, about 1.5 mm or less, about 1 mm or less, about 0.5 mm or less, about 0.4 mm or less, about 0.3 mm or less, about 0.2 mm or less, or about 0.1 mm or less, or anywhere in between.
- The cold rolled coil can then be solutionized in a solution heat treatment step. The solutionizing can include heating the final gauge aluminum alloy from room temperature to a temperature of from about 400 °C to about 580 °C (e.g., from about 450 °C to about 575 °C, from about 520 °C to about 580 °C, from about 530 °C to about 570 °C, from about 545 °C to about 575 °C, from about 550 °C to about 570 °C, from about 555 °C to about 565 °C, from about 540 °C to about 560 °C, from about 560 °C to about 580 °C, or from about 550 °C to about 575 °C). For example, the solutionizing step can be performed by heating the final gauge aluminum alloy to about 400 °C, about 405 °C, about 410 °C, about 415 °C, about 420 °C, about 425 °C, about 430 °C, about 435 °C, about 440 °C, about 445 °C, about 450 °C, about 455 °C, about 460 °C, about 465 °C, about 470 °C, about 475 °C, about 480 °C, about 485 °C, about 490 °C, about 495 °C, about 500 °C, about 505 °C, about 510 °C, about 515 °C, about 520 °C, about 525 °C, about 530 °C, about 535 °C, about 540 °C, about 545 °C, about 550 °C, about 555 °C, about 560 °C, about 565 °C, about 570 °C, about 575 °C, or about 580 °C.
- In some examples, the solutionizing is performed at a temperature of 560 °C or below (e.g., from about 520 °C to about 560 °C). For example, the solutionizing can be performed at a temperature of about 520 °C, about 525 °C, about 530 °C, about 535 °C, about 540 °C, about 545 °C, about 550 °C, about 555 °C, or about 560 °C. Solutionizing at a temperature of 560 °C or below can result in an alloy product having a desired particle size and particle size distribution of migrant element particles within the alloy product subsurface and the alloy product bulk, and having a low enrichment ratio for certain migrant elements (e.g., Mg and Si).
- The cold rolled coil can soak at the solutionizing temperature for a period of time. In certain aspects, the cold rolled coil is allowed to soak for up to approximately 2 hours (e.g., from about 1 second to about 120 minutes, inclusively). For example, the cold rolled coil can be soaked at the solutionizing temperature of from about 525 °C to about 590 °C for 1 second, 5 seconds, 10 seconds, 15 seconds, 20 seconds, 25 seconds, 30 seconds, 35 seconds, 40 seconds, 45 seconds, 50 seconds, 55 seconds, 60 seconds, 65 seconds, 70 seconds, 75 seconds, 80 seconds, 85 seconds, 90 seconds, 95 seconds, 100 seconds, 105 seconds, 110 seconds, 115 seconds, 120 seconds, 125 seconds, 130 seconds, 135 seconds, 140 seconds, 145 seconds, 150 seconds, 5 minutes, 10 minutes, 15 minutes, 20 minutes, 25 minutes, 30 minutes, 35 minutes, 40 minutes, 45 minutes, 50 minutes, 55 minutes, 60 minutes, 65 minutes, 70 minutes, 75 minutes, 80 minutes, 85 minutes, 90 minutes, 95 minutes, 100 minutes, 105 minutes, 110 minutes, 115 minutes, or 120 minutes, or anywhere in between.
- In some examples, a shorter soaking duration is desirable. For example, the cold rolled coil can be allowed to soak for about 120 seconds or less (e.g., 115 seconds or less, 110 seconds or less, 105 seconds or less, 100 seconds or less, 95 seconds or less, 90 seconds or less, 85 seconds or less, 80 seconds or less, 75 seconds or less, 70 seconds or less, 65 seconds or less, 60 seconds or less, 55 seconds or less, 50 seconds or less, 45 seconds or less, 40 seconds or less, 35 seconds or less, 30 seconds or less, 25 seconds or less, 20 seconds or less, 15 seconds or less, 10 seconds or less, 5 seconds or less, or 1 second).
- In certain aspects, the aluminum alloy product can then be cooled to a temperature of about 35 °C at a quench speed that can vary between about 50 °C/s to 400 °C/s in a quenching step that is based on the selected gauge. For example, the quench rate can be from about 50 °C/s to about 375 °C/s, from about 60 °C/s to about 375 °C/s, from about 70 °C/s to about 350 °C/s, from about 80 °C/s to about 325 °C/s, from about 90 °C/s to about 300 °C/s, from about 100 °C/s to about 275 °C/s, from about 125 °C/s to about 250 °C/s, from about 150 °C/s to about 225 °C/s, or from about 175 °C/s to about 200 °C/s.
- In the quenching step, the aluminum alloy product is quenched with a liquid (e.g., water) and/or gas or another selected quench medium. In certain aspects, the aluminum alloy product can be air quenched. The aluminum alloy product can optionally undergo a pretreatment process, as further described below.
- The aluminum alloy products described herein can be cast using a continuous casting (CC) process to form a cast aluminum alloy article. The CC process may include, but is not limited to, the use of twin belt casters, twin roll casters, or block casters. In some examples, the casting process is performed by a CC process to form a cast product such as a billet, slab, shate, strip, or the like. The CC method described herein can include extracting heat from the molten alloy by cooling the molten alloy with water, controlling a feed rate of the molten alloy, or controlling a casting speed of the molten alloy, as further described below. Extracting heat from the molten alloy can control diffusion of migrant elements within the molten alloy.
- In some non-limiting examples, the continuous casting method can include extracting heat in a controlled manner to control diffusion of migrant elements within the metal article. In some aspects, solidifying a molten alloy without controlled heat extraction can allow undesired diffusion of the migrant elements within the molten alloy. In some cases, the migrant elements can diffuse to a surface of the molten alloy during solidifying, providing a cast metal article having undesired surface properties. In some non-limiting examples, controlling a rate of solidification (e.g., extracting heat in a controlled manner) can control diffusion of the migrant elements, thus providing a cast metal article with desired surface properties. Controlling the diffusion of the migrant elements can provide selective enrichment of a cast metal article surface, thus providing a cast metal article having tailored surface properties.
- Extracting heat from the molten alloy can be performed by any suitable method, including cooling with water, cooling with air, controlling a feed rate of the molten alloy into the casting cavity, or controlling a speed of a pair of moving opposed casting surfaces. Cooling with water can be performed by employing either one or a plurality of nozzles to deliver water directly onto the molten alloy. Likewise, cooling with air can be performed by employing either one or a plurality of nozzles to deliver forced air directly onto the molten alloy. In some examples, controlling the feed rate of the molten alloy into the casting cavity can control the diffusion of the migrant elements. A slower feed rate can allow the molten alloy to solidify closer to the molten metal injector, thus suppressing any undesired diffusion of the migrant elements. Likewise, a faster feed rate can allow the molten alloy to solidify farther from the molten metal injector, thus allowing undesired diffusion of the migrant elements. In some examples, controlling the speed of the pair of moving opposed casting surfaces can control the diffusion of the migrant elements. A slower speed of the pair of moving opposed casting surfaces can allow the molten alloy to solidify closer to the molten metal injector, thus suppressing any undesired diffusion of the migrant elements. Likewise, a faster speed of the pair of moving opposed casting surfaces can allow the molten alloy to solidify farther from the molten metal injector, thus allowing undesired diffusion of the migrant elements.
- In some non-limiting examples, controlling the diffusion rate of the migrant elements can provide selective diffusion of the migrant elements. For example, heat can be extracted from the molten metal at a rate that can promote diffusion of a first migrant element and simultaneously suppress diffusion of a second migrant element. Thus, the metal article surface can be selectively enriched by a select migrant element during solidification of the molten alloy to provide the metal article.
- The cast aluminum alloy article is then subjected to further processing steps to form the aluminum alloy product. The processing steps include, for example, quenching, hot rolling, cold rolling, and/or annealing steps.
- After the casting step, the cast aluminum alloy article can be quenched. In the quenching step, the cast aluminum alloy article can be cooled to a temperature at or below about 300 °C. For example, the cast aluminum alloy article can be cooled to a temperature at or below about 290 °C, at or below about 280 °C, at or below about 270 °C, at or below about 260 °C, at or below about 250 °C, at or below about 240 °C, at or below about 230 °C, at or below about 220 °C, at or below about 210 °C, at or below about 200 °C, at or below about 190 °C, at or below about 180 °C, at or below about 170 °C, at or below about 160 °C, at or below about 150 °C, at or below about 140 °C, at or below about 130 °C, at or below about 120 °C, at or below about 110 °C, at or below about 100 °C, at or below about 90 °C, at or below about 80 °C, at or below about 70 °C, at or below about 60 °C, at or below about 50 °C, or at or below about 40 °C (e.g., about 25 °C). The quenching step can be performed using a liquid (e.g., water), a gas (e.g., air), or another selected quench medium.
- The method also includes a step of hot rolling the cast aluminum alloy article to produce a rolled aluminum alloy article (e.g., a hot band). The step of hot rolling the cast aluminum alloy article can include reducing the thickness of the cast aluminum alloy article by at least about 30 % and up to about 80% (e.g., by about 30%, by about 35 %, by about 40 %, by about 45 %, by about 50 %, by about 55 %, by about 60 %, by about 65 %, by about 70 %, or by about 75 %). Hot rolling can be performed at a temperature of from about 400 °C to about 600 °C (e.g., from about 425 °C to about 575 °C or from about 450 °C to about 550 °C). For example, the hot rolling step can be performed at a temperature of about 400 °C, about 410 °C, about 420 °C, about 430 °C, about 440 °C, about 450 °C, about 460 °C, about 470 °C, about 480 °C, about 490 °C, about 500 °C, about 510 °C, about 520 °C, about 530 °C, about 540 °C, about 550 °C, about 560 °C, about 570 °C, about 580 °C, about 590 °C, about 600 °C, or anywhere in between.
- A cold rolling step can then be performed using, for example, a single stand mill or a multi-stand mill. In some cases, the cold rolling step is a one-stage cold rolling process. In some cases, the cold rolling step is a two-stage cold rolling process.
- In the one-stage cold rolling process, the coil or sheet temperature can be reduced to a temperature ranging from about 20 °C to about 150 °C (e.g., from about 120 °C to about 200 °C). In some cases, the coil or sheet is cold rolled with an entry temperature range of from about 20 °C to about 150 °C. The entry temperature can be, for example, about 20 °C, about 30 °C, about 40 °C, about 50 °C, about 60 °C, about 70 °C, about 80 °C, about 90 °C, about 100 °C, about 110 °C, about 120 °C, about 130 °C, about 140 °C, or about 150 °C. In some cases, the cold roll exit temperature can range from about 80 °C to about 200 °C. The cold roll exit temperature can be, for example, about 80 °C, about 90 °C, about 100 °C, about 110 °C, about 120 °C, about 130 °C, about 140 °C, about 150 °C, about 160 °C, about 170 °C, about 180 °C, about 190 °C, or about 200 °C.
- The cold rolling step can be performed for a period of time to result in a gauge of from about 0.2 mm to about 6 mm. For example, the resulting gauge can be from about 0.5 mm to about 5.5 mm or from about 0.8 mm to about 5.0 mm. Optionally, the cold rolling step can be performed for a period of up to about 1 hour (e.g., from about 10 minutes to about 30 minutes). For example, the cold rolling step can be performed for a period of about 10 minutes, about 20 minutes, about 30 minutes, about 40 minutes, about 50 minutes, or about 1 hour.
- As discussed above, the cold rolling step can be a two-stage cold rolling process in which an intervening annealing step is performed during the cold rolling. In the two-stage cold rolling process, the coil or sheet temperature can be reduced to a temperature ranging from about 20 °C to about 150 °C (e.g., from about 120 °C to about 200 °C). In some cases, the coil or sheet is cold rolled with an entry temperature range of from about 20 °C to about 150 °C. The entry temperature can be, for example, about 20 °C, about 30 °C, about 40 °C, about 50 °C, about 60 °C, about 70 °C, about 80 °C, about 90 °C, about 100 °C, about 110 °C, about 120 °C, about 130 °C, about 140 °C, or about 150 °C. In some cases, the cold roll exit temperature can range from about 80 °C to about 200 °C. The exit temperature can be, for example, about 80 °C, about 90 °C, about 100 °C, about 110 °C, about 120 °C, about 130 °C, about 140 °C, about 150 °C, about 160 °C, about 170 °C, about 180 °C, about 190 °C, or about 200 °C.
- The first stage of the cold rolling step can be performed for a period of time to result in a gauge of from about 1.2 mm to about 6 mm. For example, the resulting gauge can be from about 1.25 mm to about 5.5 mm, from about 1.3 mm to about 4 mm, from about 1.4 mm to about 3.5 mm, or from about 1.5 mm to about 3 mm. Optionally, the cold rolling step can be performed for a period of up to about 1 hour (e.g., from about 10 minutes to about 30 minutes). For example, the cold rolling step can be performed for a period of about 10 minutes, about 20 minutes, about 30 minutes, about 40 minutes, about 50 minutes, or about 1 hour.
- As the next step of the two-stage cold rolling process, an annealing process referred to herein as an intermediate annealing step can be performed. In the intermediate annealing step, the cold rolled gauge can be held at a temperature ranging from about 250 °C to about 450 °C (e.g., from about 275 °C to about 400 °C or from about 300 °C to about 375 °C), with a soak time of up to about 4 hours. For example, the soak time can range from about 10 minutes to about 4 hours (e.g., about 10 minutes, about 30 minutes, about 1 hour, about 2 hours, about 3 hours, or about 4 hours). Optionally, the intermediate annealing step can result in an alloy having grains that are round.
- Following the intermediate annealing step, a second stage of the cold-rolling process can be performed. In some cases, the second stage of the cold-rolling process includes cold rolling using a single stand mill or a multi-stand mill with an entry temperature range of from about 20 °C to about 150 °C. The entry temperature can be, for example, about 20 °C, about 30 °C, about 40 °C, about 50 °C, about 60 °C, about 70 °C, about 80 °C, about 90 °C, about 100 °C, about 110 °C, about 120 °C, about 130 °C, about 140 °C, or about 150 °C. In some cases, the cold roll exit temperature can range from about 80 °C to about 200 °C. The exit temperature can be, for example, about 80 °C, about 90 °C, about 100 °C, about 110 °C, about 120 °C, about 130 °C, about 140 °C, about 150 °C, about 160 °C, about 170 °C, about 180 °C, about 190 °C, or about 200 °C to result in a gauge of about 3 mm or less (e.g., from about 0.2 mm to about 2 mm or from about 0.2 mm to about 1.4 mm). For example, the resulting gauge can be about 0.2 mm, about 0.3 mm, about 0.4 mm, about 0.5 mm, about 0.6 mm, about 0.7 mm, about 0.8 mm, about 0.9 mm, about 1 mm, about 1.1 mm, about 1.2 mm, about 1.3 mm, about 1.4 mm, about 1.5 mm, about 1.6 mm, about 1.7 mm, about 1.8 mm, about 1.9 mm, about 2 mm, about 2.1 mm, about 2.2 mm, about 2.3 mm, about 2.4 mm, about 2.5 mm, about 2.6 mm, about 2.7 mm, about 2.8 mm, about 2.9 mm, or about 3 mm.
- The cold rolled coil can then be solutionized in a solution heat treatment step. The solutionizing can include heating the final gauge aluminum alloy from room temperature to a temperature of from about 520 °C to about 590 °C (e.g., from about 520 °C to about 580 °C, from about 530 °C to about 570 °C, from about 545 °C to about 575 °C, from about 550 °C to about 570 °C, from about 555 °C to about 565 °C, from about 540 °C to about 560 °C, from about 560 °C to about 580 °C, or from about 550 °C to about 575 °C).
- The cold rolled coil can soak at the solutionizing temperature for a period of time. In certain aspects, the cold rolled coil is allowed to soak for up to approximately 2 hours (e.g., from about 1 second to about 120 minutes, inclusively). For example, the cold rolled coil can be soaked at the solutionizing temperature of from about 525 °C to about 590 °C for 1 second, 5 seconds, 10 seconds, 15 seconds, 20 seconds, 25 seconds, 30 seconds, 35 seconds, 40 seconds, 45 seconds, 50 seconds, 55 seconds, 60 seconds, 65 seconds, 70 seconds, 75 seconds, 80 seconds, 85 seconds, 90 seconds, 95 seconds, 100 seconds, 105 seconds, 110 seconds, 115 seconds, 120 seconds, 125 seconds, 130 seconds, 135 seconds, 140 seconds, 145 seconds, 150 seconds, 5 minutes, 10 minutes, 15 minutes, 20 minutes, 25 minutes, 30 minutes, 35 minutes, 40 minutes, 45 minutes, 50 minutes, 55 minutes, 60 minutes, 65 minutes, 70 minutes, 75 minutes, 80 minutes, 85 minutes, 90 minutes, 95 minutes, 100 minutes, 105 minutes, 110 minutes, 115 minutes, or 120 minutes, or anywhere in between.
- In certain aspects, the aluminum alloy product can then be cooled to a temperature of about 35 °C at a quench speed that can vary between about 50 °C/s to 400 °C/s in a quenching step that is based on the selected gauge. For example, the quench rate can be from about 50 °C/s to about 375 °C/s, from about 60 °C/s to about 375 °C/s, from about 70 °C/s to about 350 °C/s, from about 80 °C/s to about 325 °C/s, from about 90 °C/s to about 300 °C/s, from about 100 °C/s to about 275 °C/s, from about 125 °C/s to about 250 °C/s, from about 150 °C/s to about 225 °C/s, or from about 175 °C/s to about 200 °C/s. The quenching step can be performed using a liquid (e.g., water), a gas (e.g., air), or another selected quench medium.
- Optionally, the aluminum alloy products described herein and cast by DC casting or CC and subsequently processed can be pretreated.
- The pretreatment process described herein includes a step of applying a cleaner (also referred to herein as an entry cleaner or pre-cleaner) to one or more surfaces of the aluminum alloy product. The entry cleaner removes residual oils, or loosely adhering oxides, from the aluminum alloy product surface. Optionally, the entry cleaning can be performed using an alkaline solution having a pH of 7.5 or above. In some cases, the pH of the alkaline solution can be about 8, about 8.5, about 9, about 9.5, about 10, about 10.5, about 11, about 11.5, about 12, about 12.5, or about 13. The concentration of the alkaline agent in the alkaline solution can be from about 1 % to about 5 % (e.g., about 1 %, about 2 %, about 3 %, about 4 %, or about 5 % based on the volume of the alkaline solution). Suitable alkaline agents include, for example, silicates and hydroxides (e.g., sodium hydroxide). The alkaline solution can further include one or more surfactants, including for example anionic and non-ionic surfactants.
- The pretreatment process described herein can also include a step of etching the surface of the aluminum alloy product. The surface of the aluminum alloy product can be etched using a chemical etch such as an acid etch (i.e., an etching procedure that includes an acid solution having a pH of less than 7), an alkaline etch (i.e., an etching procedure that includes a basic solution having a pH of greater than 7), or an etch under neutral conditions (i.e., an etching procedure that includes a neutral solution having a pH of 7). The chemical etch prepares the surface to accept the subsequent application of a pretreatment. Any loosely adhering oxides, such as Al oxides and Mg rich oxides, entrapped oils, or debris, can be adequately removed during this step. Exemplary chemicals for performing the acid etch include sulfuric acid, hydrofluoric acid, nitric acid, phosphoric acid, and combinations of these. Exemplary chemicals for performing the alkaline etch include sodium hydroxide and potassium hydroxide. After the acid etching step, the surface of the aluminum alloy product can be rinsed with an aqueous or organic solvent.
- A pretreatment can then be applied to the surface of the aluminum alloy product. Optionally, the pretreatment can include an adhesion promoter, a corrosion inhibitor, a coupling agent, an antimicrobial agent, or a mixture thereof. After the application of the pretreatment, the surface of the aluminum alloy product optionally can be rinsed with a solvent (e.g., an aqueous or an organic solvent). The surface of the aluminum alloy product can be dried after the rinsing step.
- The aluminum alloy products and methods described herein can be used in automotive, electronics, and transportation applications, such as commercial vehicle, aircraft, or railway applications. For example, the aluminum alloy products can be used for chassis, cross-member, and intra-chassis components (encompassing, but not limited to, all components between the two C channels in a commercial vehicle chassis) to gain strength, serving as a full or partial replacement of high-strength steels. In certain examples, the aluminum alloy products can be used in the F, T4, T6, or T8x tempers.
- In certain aspects, the aluminum alloy products and methods can be used to prepare motor vehicle body part products. For example, the disclosed aluminum alloy products and methods can be used to prepare automobile body parts, such as bumpers, side beams, roof beams, cross beams, pillar reinforcements (e.g., A-pillars, B-pillars, and C-pillars), inner panels, side panels, floor panels, tunnels, structure panels, reinforcement panels, inner hoods, or trunk lid panels. The disclosed aluminum alloy products and methods can also be used in aircraft or railway vehicle applications, to prepare, for example, external and internal panels.
- The aluminum alloy products and methods described herein can also be used in electronics applications, to prepare, for example, external and internal encasements. For example, the aluminum alloy products and methods described herein can also be used to prepare housings for electronic devices, including mobile phones and tablet computers. In some examples, the aluminum alloy products can be used to prepare housings for the outer casing of mobile phones (e.g., smart phones) and tablet bottom chassis.
- In certain aspects, the aluminum alloy products and methods can be used to prepare aerospace vehicle body part products. For example, the disclosed aluminum alloy products and methods can be used to prepare airplane body parts, such as skin alloys.
- Aluminum alloy products are described throughout the text. The product may include monolithic materials, as well as non-monolithic materials such as roll-bonded materials, clad materials, or composite materials (such as but not limited to carbon fiber-containing materials). In some examples, the aluminum alloy product is a metal coil, a metal strip, a metal plate, a metal sheet, a metal billet, a metal ingot, or the like. In some examples, an alloying element, and/or an oxide thereof, as described herein can diffuse throughout the alloy product such that the concentration of the alloying element and/or oxide thereof is distributed throughout a full thickness (e.g., a bulk of the aluminum alloy) of the aluminum alloy product (i.e., at least within the subsurface and the bulk portions). For example, the aluminum alloy product can include a concentration of Mg and/or MgO that is distributed throughout the aluminum alloy product and can migrate to the subsurface portion during various processing steps, including homogenization, hot rolling, cold rolling, and solutionizing.
- The aluminum alloy products described herein can have a surface roughness suitable for successful bonding according to any suitable bonding technique, including, for example, resistance spot welding. The aluminum alloy products described herein can have an average surface roughness of from about 25 nanometers (nm) to about 50 nm. For example, the aluminum alloy products described herein can have a surface roughness of about 25 nm, about 26 nm, about 27 nm, about 28 nm, about 29 nm, about 30 nm, about 31 nm, about 32 nm, about 33 nm, about 34 nm, about 35 nm, about 36 nm, about 37 nm, about 38 nm, about 39 nm, about 40 nm, about 41 nm, about 42 nm, about 43 nm, about 44 nm, about 45 nm, about 46 nm, about 47 nm, about 48 nm, about 49 nm, about 50 nm., or anywhere in between.
- Two samples of a 6xxx series aluminum alloy were prepared by direct chill casting and were processed by homogenizing, hot rolling, cold rolling, solution heat treating, air quenching, etching using 7% R243, and pretreating with an adhesion promoter. The processing methods differed only by the solution heat treatment step. The first alloy sample was solution heat treated at 540 °C for 1 second (Method 1) and the second alloy sample was solution heat treated at 578 °C for 35 seconds (Method 2).
Figure 4 presents X-ray photoelectron spectroscopy (XPS) depth profile data for the Mg content in the sample prepared according to Method 1 (indicated by square symbols), the Mg content in the sample prepared according to Method 2 (indicated by triangle symbols), and the Mg content in a comparative 6xxx series aluminum alloy that was not solution heat treated ("AA 6xxx;" indicated by circle symbols). Evident inFigure 4 is the ability to control migrant Mg concentrations in the subsurface and provide a uniform Mg concentration throughout the aluminum alloy product.Method 1 provided a more uniform Mg concentration from the surface to the bulk of the aluminum alloy with a greater Mg content compared to the comparative 6xxx series aluminum alloy.Method 2 provided a greater Mg content closer to the aluminum alloy surface and a lower Mg content in the bulk of the aluminum alloy, as well as a greater Mg content compared to the exemplary aluminum alloy prepared according toMethod 1 and the comparative 6xxx series aluminum alloy. The comparative 6xxx series aluminum alloy exhibited a highly uniform Mg concentration from the surface to the bulk of the aluminum alloy and a lower overall Mg content near the surface of the aluminum alloy. -
Figure 5 presents XPS depth profile data for the Si content in the aluminum alloy product prepared according to Method 1 (indicated by square symbols), the aluminum alloy product prepared according to Method 2 (indicated by triangle symbols), and a comparative 6xxx series aluminum alloy that was not solution heat treated (indicated by circle symbols). Evident inFigure 5 is the ability to control migrant silicon (Si) concentration in the bulk aluminum alloy and provide uniform Si concentration into the bulk of the aluminum alloy.Method 1 provided a greater Si content closer to the aluminum alloy surface and a lower Si content in the bulk of the aluminum alloy.Method 2 provided a greater Si content near the surface of the aluminum alloy and a more uniform Si concentration further into the bulk of the aluminum alloy. The Si content of theMethod 2 alloy product was higher than that of the comparative 6xxx series aluminum alloy product. The comparative 6xxx series aluminum alloy exhibited a highly uniform and very low Si concentration from the surface to the bulk of the aluminum alloy and a lower overall Si content near the surface of the aluminum alloy. -
Figure 6 shows bond durability testing results of aluminum alloys prepare according to methods described herein. Exemplary aluminum alloy samples prepared according toMethod 1 andMethod 2 were bonded together and subjected to a stress durability test. In the stress durability test, a set of 6 lap joints/bonds were connected in sequence by bolts and positioned vertically in a 90% relative humidity (RH) humidity cabinet. The temperature was maintained at 50 °C. A force load of 2.4 kN was applied to the bond sequence. The stress durability test is a cyclic exposure test that is conducted for up to 45 cycles. Each cycle lasts for 24 hours. In each cycle, the bonds are exposed in the humidity cabinet for 22 hours, then immersed in 5% NaCl for 15 minutes, and finally air-dried for 105 minutes. Upon the breaking of three joints, the test is discontinued for the particular set of joints and is indicated as a first failure. - The exemplary aluminum alloy prepared according to Method 2 (left set of histograms) exhibited a lower cycles to failure number, indicating a lower bond durability than the exemplary aluminum alloy prepared according to Method 1 (right set of histograms). Mean cycles to failure is indicated by the left histogram in each set (hatched histogram) with first observed failure indicated by the right histogram in each set (cross-hatched).
- Two samples of a 6xxx series aluminum alloy were prepared by direct chill casting and were processed by homogenizing, hot rolling, cold rolling, solution heat treating, air quenching, etching using 7% R243, and pretreating with an adhesion promoter. The processing methods differed only by the hot rolling temperatures. The first alloy sample was hot rolled with a 390 °C hot mill exit temperature (Method 1) and the second alloy sample was hot rolled with a 330 °C hot mill exit temperature (Method 2).
Figure 7 shows the XPS depth profiling of the Mg content in the aluminum alloy product prepared by the high-temperature (Method 1) versus the low-temperature (Method 2) rolled surface. The aluminum alloy sample prepared according toMethod 1 exhibited an enrichment ratio of 2 and an Mg concentration of 10 % within the aluminum alloy subsurface. The aluminum alloy prepared according toMethod 2 exhibited an enrichment ratio of 1.6 and an Mg concentration of 5 % within the aluminum alloy subsurface. - Two samples of a 6xxx series aluminum alloy were prepared by direct chill casting and were processed by homogenizing, hot rolling, cold rolling, solution heat treating, air quenching, etching using 7% R243, and pretreating with an adhesion promoter. The processing methods differed only by the order of the cleaning step. The first alloy sample was pre-cleaned before solution heat treatment (referred to as "Pre-clean -> SHT") and the second alloy sample was solution heat treated and then pre-cleaned (referred to as "SHT -> Pre-clean"). Both were followed by acid etching and pre-treatment application.
-
Figure 8 presents XPS depth profile data of the Mg content in the aluminum alloy samples. The exemplary aluminum alloy cleaned before solutionizing (referred to as "Pre-clean → SHT") showed a 6 % Mg concentration and a 2.4 enrichment ratio. The exemplary aluminum alloy cleaned after solutionizing (referred to as "SHT → Pre-clean") showed a 1.5 % Mg concentration and a 0.7 enrichment ratio (not according to the invention). - Aluminum alloy products were prepared according to continuous casting methods as described above. The products were cast at a width of 1450 mm and trimmed to 1300 mm. The products were then hot rolled, cold rolled to 5.1 mm, annealed at 400 °C for 2 hours, and cold rolled to 2 mm. The products were then solutionized and quenched under varying conditions, as shown in Table 1.
Table 1 Sample ID Solutionizing Temperature Quenching Method Continuous Casting Condition 1 (C1) 553°C Air Continuous Casting Condition 2 (C2) 553°C Water Continuous Casting Condition 3 (C3) 544°C Water Continuous Casting Condition 4 (C4) 560°C Air Direct Chill Casting Condition (D1) 560°C Air - Surfaces of the aluminum alloy sheets were analyzed by glow discharge optical emission spectroscopy (GDOES). Amounts of magnesium (Mg), silicon (Si), copper (Cu), manganese (Mn), chromium (Cr), and iron (Fe) were analyzed. Measurements were conducted from the surface to a depth of 2.0 µm. Exemplary continuously cast aluminum alloy sheets are referred to as "C1," "C2," "C3," and "C4."
- All samples were pretreated with an adhesion promoter (indicated by "PT"). A first surface of the aluminum alloy sheets (e.g., a surface contacting the belt of the caster) is indicated by "label." A second analyzed surface (e.g., a surface not contacting the belt of the caster) is indicated by "unlabel." Comparative DC cast aluminum alloys (referred to as "D1") were analyzed for comparison and effectiveness of continuously casting aluminum alloys for controlled enrichment of the surfaces of the aluminum alloy sheets.
-
Figures 9A and 9B show GDOES data for Mg content near the surfaces of aluminum alloy sheets (e.g., from the surface to a depth of 2.0 µm).Figure 9A shows data for Mg content extending into the bulk of the aluminum alloy sheet.Figure 9B shows data for Mg content considered to be found in the surface of the aluminum alloy sheet (e.g., from the surface to a depth of 0.5 µm).Figures 9A and 9B show a high diffusion of Mg to the surface of the aluminum alloy sheets produced by direct chill casting (samples D1 and D1-lab).Figures 9A and 9B show decreased diffusion of Mg to the surface of the aluminum alloy sheets, and a uniform distribution of Mg from the surface into the bulk of the aluminum alloy sheets, produced by the exemplary continuous casting method described above. A lower concentration of Mg near the surface of the aluminum alloy sheets is desirable for bonding and joining applications. -
Figures 10A and 10B show GDOES data for Si content near the surfaces of aluminum alloy sheets (e.g., from the surface to a depth of 2.0 µm).Figure 10A shows data for Si content extending into the bulk of the aluminum alloy sheet.Figure 10B shows data for Si content considered to be found in the surface of the aluminum alloy sheet (e.g., from the surface to a depth of 0.5 µm).Figures 10A and 10B show a high diffusion of Si to the surface of the aluminum alloy sheets produced by direct chill casting (samples D1 and D1-lab).Figures 10A and 10B show decreased diffusion of Si to the surface of the aluminum alloy sheets, and a uniform distribution of Si from the surface into the bulk of the aluminum alloy sheets produced by the exemplary continuous casting method described above. -
Figures 11A and 11B show GDOES data for Cu content near the surfaces of aluminum alloy sheets (e.g., from the surface to a depth of 2.0 µm).Figure 11A shows data for Cu content extending into the bulk of the aluminum alloy sheet.Figure 11B shows data for Cu content considered to be found in the surface of the aluminum alloy sheet (e.g., from the surface to a depth of 0.5 µm).Figures 11A and 11B show a low diffusion of Cu to the surface of the aluminum alloy sheets produced by direct chill casting (samples D1 and D1-lab).Figures 11A and 11B show increased diffusion of Cu to the surface of the aluminum alloy sheets produced by the exemplary continuous casting method described above. Controlled diffusion of Cu to the surface of the aluminum alloy sheets can be desirable for bonding and joining applications. -
Figures 12A and 12B show GDOES data for Mn content near the surfaces of aluminum alloy sheets (e.g., from the surface to a depth of 2.0 µm).Figure 12A shows data for Mn content extending into the bulk of the aluminum alloy sheet.Figure 12B shows data for Mn content considered to be found in the surface of the aluminum alloy sheet (e.g., from the surface to a depth of 0.5 µm).Figures 12A and 12B show no diffusion of Mn to the surface of the aluminum alloy sheets produced by direct chill casting (samples D1 and D1-lab).Figures 12A and 12B show increased diffusion of Mn to the surface of the aluminum alloy sheets produced by the exemplary continuous casting method described above. -
Figures 13A and 13B show GDOES data for Cr content near the surfaces of aluminum alloy sheets (e.g., from the surface to a depth of 2.0 µm).Figure 13A shows data for Cr content extending into the bulk of the aluminum alloy sheet.Figure 13B shows data for Cr content considered to be found in the surface of the aluminum alloy sheet (e.g., from the surface to a depth of 0.5 µm).Figures 13A and 13B show no diffusion of Cr to the surface of the aluminum alloy sheets produced by direct chill casting (samples D1 and D1-lab).Figures 13A and 13B show increased diffusion of Cr to the surface of the aluminum alloy sheets produced by the exemplary continuous casting method described above. Controlled diffusion of Cr to the surface of the aluminum alloy sheets can be desirable for bonding and joining applications. Controlled diffusion of Cr to the surface of the aluminum alloy sheets can be desirable for corrosion resistance. -
Figures 14A and 14B show GDOES data for Fe content near the surfaces of aluminum alloy sheets (e.g., from the surface to a depth of 2.0 µm).Figure 14A shows data for Fe content extending into the bulk of the aluminum alloy sheet.Figure 14B shows data for Fe content considered to be found in the surface of the aluminum alloy sheet (e.g, from the surface to a depth of 0.5 µm).Figures 14A and 14B show no diffusion of Fe to the surface of the aluminum alloy sheets produced by direct chill casting (samples D1 and D1-lab).Figures 14A and 14B show increased diffusion of Fe to the surface of the aluminum alloy sheets produced by the exemplary continuous casting method described above. - Bond durability test results for the exemplary continuously cast aluminum alloy sheets and the comparative direct chill cast aluminum alloy sheets were performed according to the procedure described in Example 2. For this experiment, the completion of 45 cycles indicates that the set of joints passed the bond durability test. The test results are shown below in Table 2. In Table 2, each of the joints are numbered 1 through 6, where joint 1 is the top joint and joint 6 is the bottom joint when oriented vertically. The number in the cells, except for "45," indicates the number of successful cycles before a break. The number "45 in a cell indicates that the joints remained intact for 45 cycles. The results are summarized in Table 2 below:
Table 2 Trial Sample Surface Finishing Bond Durability Test Coupon Arrangement 1 Top 2 3 4 5 6 Bottom 1 C1 Alkaline and acid etch 45 45 45 45 45 45 2 C2 Alkaline and acid etch 45 45 45 45 45 45 3 C3 Alkaline and acid etch 45 45 45 45 45 45 4 C1 Strong alkaline and acid etch 45 45 45 45 45 45 5 C1 Acid etch 45 45 45 45 45 45 6 C4 Alkaline and acid etch 45 45 45 45 45 45 7 D1 Acid etch 20 21 21 21 21 21 - For
Trials - For
Trial 4, test coupons were cut from the exemplary continuously cast aluminum alloy sheets. The test coupons were subjected to a strong alkaline cleaning and acid etching to clean and prepare the surfaces for bonding. Bonding was performed by pretreating the aluminum alloy sheets with an adhesion promoter and bonding the test coupons with an adhesive. Bonded test coupons were exposed to a humid environment for up to 45 duty cycles. - For
Trial 5, test coupons were cut from the exemplary continuously cast aluminum alloy sheets. The test coupons were subjected to an acid etching to clean and prepare the surfaces for bonding. Bonding was performed by pretreating the aluminum alloy sheets with an adhesion promoter and bonding the test coupons with an adhesive. Bonded test coupons were exposed to a humid environment for up to 45 duty cycles. - For
Trial 6, test coupons were cut from the exemplary continuously cast aluminum alloy sheets. The test coupons were solution heat treated in the lab furnace and then subjected to alkaline and acid etching to clean and prepare the surface for bonding. Bonding was performed by pretreating the aluminum alloy sheets with an adhesion promoter and bonding the test coupons with an adhesive. Bonded test coupons were exposed to a humid environment for up to 45 duty cycles. - For
Trial 7, test coupons were cut from the comparative direct chill cast aluminum alloy sheets. The test coupons were subjected to acid etching to prepare the surface for bonding. Bonding was performed by pretreating the aluminum alloy sheets with an adhesion promoter and bonding the test coupons with an adhesive. Bonded test coupons were exposed to a humid environment for up to 45 duty cycles. - The exemplary continuously cast aluminum alloy sheets having controlled diffusion of Mn and Cr to the surface of the aluminum alloy sheets demonstrated excellent bond durability, surviving 45 test cycles without failure. The comparative direct chill cast aluminum alloy sheets having Mg diffused to the surface demonstrated poor bond durability.
- Four samples of an AA5xxx series aluminum alloy were prepared by direct chill casting and were processed by homogenizing, hot rolling, cold rolling to a gauge of 1.5 mm, solution heat treating, air quenching, and etching using four different etchants. The etchants employed were (i) a mixture of phosphoric and sulfuric acid (referred to as solution "A" in Table 3 below), (ii) a mixture of sulfuric acid and ammonium fluoride (referred to as solution "B" in Table 3 below), (iii) a mixture of sulfuric acid and iron (III) sulfate hydrate (referred to as solution "C" in Table 3 below), and (iv) sodium hydroxide (referred to as solution "D" in Table 3 below). Sodium hydroxide (NaOH) was employed as a comparative control etchant due to its ability to remove any oxide layers from the subsurface.
Table 3 - Etching Conditions and Results Etch Solution Etch Reference Dwell Time (s) Temperature (°C) Etch Weight (g/m3) Average Std. Dev. A 1 2 70 0.226 0.022 A 2 5 70 0.277 0.023 A 3 10 70 0.345 0.016 A 4 15 70 0.441 0.017 B 5 2 60 0.679 0.057 B 6 5 60 1.148 0.064 B 7 10 60 1.783 0.036 B 8 15 60 2.406 0.078 C 9 2 67 0.209 0.018 C 10 5 67 0.242 0.008 C 11 10 67 0.308 0.006 C 12 15 67 0.316 0.025 D 13 5* 65 0.446 0.086 D 14 20* 65 1.508 0.558 D 15 30* 65 3.162 0.617 D 16 60* 65 5.931 0.695 *Additional desmutting was employed after etching. -
Figure 15 is a graph showing the RSW electrode service lifetime for RSW electrodes employed to weld aluminum alloy samples after etching in the various etchant solutions described above. Solution D (NaOH) was employed as a comparative control etchant as it is known in the art to completely remove a deformed oxide layer present on a rolled aluminum alloy product, particularly when the dwell time is at least 20 seconds (e.g.,Etches Figure 15 , Solution A (a mixture of phosphoric acid and sulfuric acid (H3PO4/H2SO4)) provided a RSW electrode lifetime of 100 welds, which is greater than the current industry demand of 80 welds. Additionally, in the example ofFigure 15 , the mixture of H3PO4/H2SO4 provided an atomic concentration ratio of P/Mg of about 0.65 in a subsurface extending to a depth of about 83 µm from the surface of the aluminum alloy. Solution B (a mixture of sulfuric acid and ammonium fluoride (H2SO4/NH4F)) provided a RSW electrode lifetime of 80 welds when etched for 2 seconds, however a longer etch dwell time resulted in a loss of electrode lifetime. Solution C (a mixture of sulfuric acid and iron (III) sulfate hydrate (H2SO4/Fe2(SO4)3)) exhibited a poor performance, significantly reducing the RSW electrode lifetime. Thus, incorporating P into a Mg-containing subsurface significantly increased the RSW electrode lifetime. -
Figure 16 is a graph showing etch weight (i.e., amount of material removed from the surface of the aluminum alloys during etching) for each etch performed (Etches 1 - 16 in Table 3). Evident in the graph ofFigure 16 and described above, Solution D was able to provide the greatest etch weight and was thus employed as a comparative solution. Of the etch solutions A, B, and C, Solution B provided the greatest etch weight and Solutions A and C provided similar etch weights, both less than that provided by Solution B. Referring toFigure 15 , Solution B provided the greatest etch weight (seeFigure 16 ) but did not exhibit improvement to the RSW electrode lifetime. Surprisingly, solutions A and C provided similar etch weights but also provided significantly different RSW electrode lifetimes. Particularly, Solution A (containing P) provided a significantly improved RSW electrode lifetime and Solution C was detrimental to the RSW electrode lifetime. Thus, removal of the deformed oxide layer alone is insufficient to improve the RSW electrode lifetime. Evident inFigures 15 and 16 , removal of a portion of the deformed oxide layer, and a presence of a residual P concentration, can work in concert to improve the RSW electrode lifetime. -
Figures 17 - 20 are graphs showing glow discharge optical emission spectroscopy (GDOES) data for Mg content near the surface of the aluminum alloy samples described above (e.g., from the surface to a depth of 5.0 µm).Figure 17 shows data for Mg content extending into the bulk of the aluminum alloy sample etched with Solution A.Figure 18 shows data for Mg content extending into the bulk of the aluminum alloy sample etched with Solution B.Figure 19 shows data for Mg content extending into the bulk of the aluminum alloy sample etched with Solution C. -
Figure 20 shows data for Mg content extending into the bulk of the aluminum alloy sample etched with Solution D. Not to be bound by theory, a Mg concentration found within the subsurface portion of the aluminum alloy samples can negatively impact the RSW electrode lifetime. Surprisingly, when the aluminum alloy samples were etched with Solution A (containing P), RSW electrode lifetime was significantly improved even though the sample contained a concentration of Mg within the subsurface of the aluminum alloy. The aluminum alloy sample etched with comparative Solution D (Figure 20 ) exhibited nearly complete removal of Mg near the surface of the aluminum alloy, further indicating that the presence of Mg and/or a Mg containing compound (e.g., MgO) after etching with a P containing compound provides a significantly improved RSW electrode lifetime. - Further,
Figure 19 shows the GDOES data for the aluminum alloy sample etched with Solution C. Evident in the graph ofFigure 19 , Mg and/or Mg containing compounds are present near the surface of the aluminum alloy samples; however, Solution C did not contain P and was detrimental to the RSW electrode lifetime (seeFigure 15 ). Thus, the presence of Mg and/or Mg containing compounds near the surface of the aluminum alloy without having P present in the etching solution can be detrimental to the RSW electrode lifetime. - In some aspects, alloying element and/or alloying element oxide particle size and morphology can affect surface properties of the aluminum alloy product. For example,
Figures 21 ,22 ,23 , and24 present scanning electron microscope (SEM) micrographs of the aluminum alloy samples described above.Figures 21A-D show SEM micrographs of the aluminum alloy samples etched using Solution A.Figures 21A and 21B show the SEM micrographs from Etch 1 (see Table 3).Figures 21C and 21D show the SEM micrographs fromEtch 4.Figures 21A and 21C are micrographs from a scanning electron mode.Figures 21B and 21D are micrographs from a back-scattered electron mode.Figures 22A-D shows SEM micrographs of the aluminum alloy samples etched using Solution B.Figures 22A and 22B show the SEM micrographs fromEtch 5.Figures 22C and 22D show the SEM micrographs fromEtch 7.Figures 22A and 22C are micrographs from a scanning electron mode.Figures 22B and 22D are micrographs from a back-scattered electron mode.Figures 23A-D shows SEM micrographs of the aluminum alloy samples etched using Solution C.Figures 23A and 23B show the SEM micrographs fromEtch 9.Figures 23C and 23D show the SEM micrographs fromEtch 12.Figures 23A and 23C are micrographs from a scanning electron mode.Figures 23B and 23D are micrographs from a back-scattered electron mode.Figures 24A-D shows SEM micrographs of the aluminum alloy samples etched using Solution D.Figures 24A and 24B show the SEM micrographs fromEtch 13.Figures 24C and 24D show the SEM micrographs fromEtch 16.Figures 24A and 24C are micrographs from a scanning electron mode.Figures 24B and 24D are micrographs from a back-scattered electron mode. Evident inFigures 21 - 24 , Solution B (Figure 22 ) provided the greatest etch weight of Etch Solutions A, B, and C, seeFigure 16 ), thus providing a surface having a reduced amount of Mg and/or Mg containing compound particles (indicated by bright spots inFigures 21 ,23 , and24 ), and a reduced deformed oxide layer (shown as darker grey areas inFigures 21 ,23 , and24 ). - A commercially produced AA5182 aluminum alloy sheet having a thickness of 1.1 mm was used in an as-produced condition (meaning the aluminum alloy sheet was not etched according to the methods described herein). The aluminum alloy sheet was subjected to a RSW trial.
Figure 25 , Panel A shows a copper RSW electrode tip. In the example ofFigure 25 , Panel A,MgO particles 1105 adhered to the RSW electrode tip.Figure 25 , Panel B shows a micrograph of the weld, andFigure 25 , Panel C is a higher magnification image ofFigure 25 , Panel B. As shown inFigure 25 , Panel C,dark areas 1110 indicate MgO present at the surface or in the subsurface of the aluminum alloy sheet. In the example ofFigure 25 , Panel C, the Mg content was 6.9 %. An as-produced AA5182 aluminum alloy contains from 4 % to 5 % Mg (e.g., about 4.5 % Mg). A Mg content of 6.9 % at the surface or in the subsurface indicated migration of Mg from a bulk of the aluminum alloy toward the surface during processing, providing undesired amounts of MgO at the surface or in the subsurface of the aluminum alloy. Accordingly, during the RSW trial, MgO particles adhered to the RSW electrode tip. Such MgO particle pick-up can significantly reduce the RSW electrode lifetime. Thus, etching and/or cleaning the surface of the aluminum alloy sheet according to the methods described herein can remove MgO from the surface or the subsurface of the aluminum alloy, form Mg-P compounds as described above, eliminate MgO pick-up by the RSW electrode, and increase the lifetime of the RSW electrode. -
Figure 26 is a graph showing the yellow index (YI) of the aluminum alloy samples prepared as described above. As described above, the YI can indicate the presence of a Mg and/or Mg containing compound (e.g., MgO) on the surface of the aluminum alloys. A lack of a significant YI is indicated by a dashed line (e.g., a YI less than about 1). The aluminum alloy samples etched using comparative Solution D (e.g., providing the greatest etch weight) exhibited a very low YI, particularly when the etching dwell time was greater than 20 seconds (e.g.,Etches -
Figure 27 is a graph showing the surface roughness of the aluminum alloy samples prepared as described above. The aluminum alloy samples etched using Solutions A and C (e.g., providing low etch weights) exhibited a negligible change in surface roughness with increasing etch time for each sample, indicating a more uniform etch (i.e., a more uniform removal of surface material) regardless of etch time when compared to the aluminum alloy samples etched using Solutions B and D. Surprisingly, the aluminum alloy samples etched using Solution A provided a significantly improved RSW electrode lifetime even while having a lower surface roughness compared to the aluminum alloy samples etched using Solutions B and D, in particular, Etch Reference Nos. 8, 14, 15, and 16. - Various embodiments of the invention have been described in fulfillment of the various objectives of the invention. It should be recognized that these embodiments are merely illustrative of the principles of the present invention. Numerous modifications and adaptions thereof will be readily apparent to those skilled in the art without departing from the scope of the present invention as defined in the following claims.
-
Illustration 40 is an aluminum alloy product prepared according to the method of any preceding or subsequent illustration, wherein the aluminum alloy product comprises a motor vehicle body part, an aerospace body part, a transportation body part, a marine body part, a motor vehicle panel, an aerospace skin panel, a marine panel, an electronics device housing, an architectural structural part, or an architectural aesthetic panel. - The following examples will serve to further illustrate the present invention without, however, constituting any limitation thereof. On the contrary, it is to be clearly understood that resort may be had to various embodiments, modifications, and equivalents thereof which, after reading the description herein, may suggest themselves to those skilled in the art without departing from the spirit of the invention. During the studies described in the following examples, conventional procedures were followed, unless otherwise stated. Some of the procedures are described below for illustrative purposes.
- Two samples of a 6xxx series aluminum alloy were prepared by direct chill casting and were processed by homogenizing, hot rolling, cold rolling, solution heat treating, air quenching, etching using 7% R243, and pretreating with an adhesion promoter. The processing methods differed only by the solution heat treatment step. The first alloy sample was solution heat treated at 540 °C for 1 second (Method 1) and the second alloy sample was solution heat treated at 578 °C for 35 seconds (Method 2).
Figure 4 presents X-ray photoelectron spectroscopy (XPS) depth profile data for the Mg content in the sample prepared according to Method 1 (indicated by square symbols), the Mg content in the sample prepared according to Method 2 (indicated by triangle symbols), and the Mg content in a comparative 6xxx series aluminum alloy that was not solution heat treated ("AA 6xxx;" indicated by circle symbols). Evident inFigure 4 is the ability to control migrant Mg concentrations in the subsurface and provide a uniform Mg concentration throughout the aluminum alloy product.Method 1 provided a more uniform Mg concentration from the surface to the bulk of the aluminum alloy with a greater Mg content compared to the comparative 6xxx series aluminum alloy.Method 2 provided a greater Mg content closer to the aluminum alloy surface and a lower Mg content in the bulk of the aluminum alloy, as well as a greater Mg content compared to the exemplary aluminum alloy prepared according toMethod 1 and the comparative 6xxx series aluminum alloy. The comparative 6xxx series aluminum alloy exhibited a highly uniform Mg concentration from the surface to the bulk of the aluminum alloy and a lower overall Mg content near the surface of the aluminum alloy. -
Figure 5 presents XPS depth profile data for the Si content in the aluminum alloy product prepared according to Method 1 (indicated by square symbols), the aluminum alloy product prepared according to Method 2 (indicated by triangle symbols), and a comparative 6xxx series aluminum alloy that was not solution heat treated (indicated by circle symbols). Evident inFigure 5 is the ability to control migrant silicon (Si) concentration in the bulk aluminum alloy and provide uniform Si concentration into the bulk of the aluminum alloy.Method 1 provided a greater Si content closer to the aluminum alloy surface and a lower Si content in the bulk of the aluminum alloy.Method 2 provided a greater Si content near the surface of the aluminum alloy and a more uniform Si concentration further into the bulk of the aluminum alloy. The Si content of theMethod 2 alloy product was higher than that of the comparative 6xxx series aluminum alloy product. The comparative 6xxx series aluminum alloy exhibited a highly uniform and very low Si concentration from the surface to the bulk of the aluminum alloy and a lower overall Si content near the surface of the aluminum alloy. -
Figure 6 shows bond durability testing results of aluminum alloys prepare according to methods described herein. Exemplary aluminum alloy samples prepared according toMethod 1 andMethod 2 were bonded together and subjected to a stress durability test. In the stress durability test, a set of 6 lap joints/bonds were connected in sequence by bolts and positioned vertically in a 90% relative humidity (RH) humidity cabinet. The temperature was maintained at 50 °C. A force load of 2.4 kN was applied to the bond sequence. The stress durability test is a cyclic exposure test that is conducted for up to 45 cycles. Each cycle lasts for 24 hours. In each cycle, the bonds are exposed in the humidity cabinet for 22 hours, then immersed in 5% NaCl for 15 minutes, and finally air-dried for 105 minutes. Upon the breaking of three joints, the test is discontinued for the particular set of joints and is indicated as a first failure. - The exemplary aluminum alloy prepared according to Method 2 (left set of histograms) exhibited a lower cycles to failure number, indicating a lower bond durability than the exemplary aluminum alloy prepared according to Method 1 (right set of histograms). Mean cycles to failure is indicated by the left histogram in each set (hatched histogram) with first observed failure indicated by the right histogram in each set (cross-hatched).
- Two samples of a 6xxx series aluminum alloy were prepared by direct chill casting and were processed by homogenizing, hot rolling, cold rolling, solution heat treating, air quenching, etching using 7% R243, and pretreating with an adhesion promoter. The processing methods differed only by the hot rolling temperatures. The first alloy sample was hot rolled with a 390 °C hot mill exit temperature (Method 1) and the second alloy sample was hot rolled with a 330 °C hot mill exit temperature (Method 2).
Figure 7 shows the XPS depth profiling of the Mg content in the aluminum alloy product prepared by the high-temperature (Method 1) versus the low-temperature (Method 2) rolled surface. The aluminum alloy sample prepared according toMethod 1 exhibited an enrichment ratio of 2 and an Mg concentration of 10 % within the aluminum alloy subsurface. The aluminum alloy prepared according toMethod 2 exhibited an enrichment ratio of 1.6 and an Mg concentration of 5 % within the aluminum alloy subsurface. - Two samples of a 6xxx series aluminum alloy were prepared by direct chill casting and were processed by homogenizing, hot rolling, cold rolling, solution heat treating, air quenching, etching using 7% R243, and pretreating with an adhesion promoter. The processing methods differed only by the order of the cleaning step. The first alloy sample was pre-cleaned before solution heat treatment (referred to as "Pre-clean -> SHT") and the second alloy sample was solution heat treated and then pre-cleaned (referred to as "SHT -> Pre-clean"). Both were followed by acid etching and pre-treatment application.
-
Figure 8 presents XPS depth profile data of the Mg content in the aluminum alloy samples. The exemplary aluminum alloy cleaned before solutionizing (referred to as "Pre-clean → SHT") showed a 6 % Mg concentration and a 2.4 enrichment ratio. The exemplary aluminum alloy cleaned after solutionizing (referred to as "SHT -> Pre-clean") showed a 1.5 % Mg concentration and a 0.7 enrichment ratio. - Aluminum alloy products were prepared according to continuous casting methods as described above. The products were cast at a width of 1450 mm and trimmed to 1300 mm. The products were then hot rolled, cold rolled to 5.1 mm, annealed at 400 °C for 2 hours, and cold rolled to 2 mm. The products were then solutionized and quenched under varying conditions, as shown in Table 1.
Table 1 Sample ID Solutionizing Temperature Quenching Method Continuous Casting Condition 1 (C1) 553°C Air Continuous Casting Condition 2 (C2) 553°C Water Continuous Casting Condition 3 (C3) 544°C Water Continuous Casting Condition 4 (C4) 560°C Air Direct Chill Casting Condition (D1) 560°C Air - Surfaces of the aluminum alloy sheets were analyzed by glow discharge optical emission spectroscopy (GDOES). Amounts of magnesium (Mg), silicon (Si), copper (Cu), manganese (Mn), chromium (Cr), and iron (Fe) were analyzed. Measurements were conducted from the surface to a depth of 2.0 µm. Exemplary continuously cast aluminum alloy sheets are referred to as "C1," "C2," "C3," and "C4."
- All samples were pretreated with an adhesion promoter (indicated by "PT"). A first surface of the aluminum alloy sheets (e.g., a surface contacting the belt of the caster) is indicated by "label." A second analyzed surface (e.g., a surface not contacting the belt of the caster) is indicated by "unlabel." Comparative DC cast aluminum alloys (referred to as "D1") were analyzed for comparison and effectiveness of continuously casting aluminum alloys for controlled enrichment of the surfaces of the aluminum alloy sheets.
-
Figures 9A and 9B show GDOES data for Mg content near the surfaces of aluminum alloy sheets (e.g., from the surface to a depth of 2.0 µm).Figure 9A shows data for Mg content extending into the bulk of the aluminum alloy sheet.Figure 9B shows data for Mg content considered to be found in the surface of the aluminum alloy sheet (e.g., from the surface to a depth of 0.5 µm).Figures 9A and 9B show a high diffusion of Mg to the surface of the aluminum alloy sheets produced by direct chill casting (samples D1 and D1-lab).Figures 9A and 9B show decreased diffusion of Mg to the surface of the aluminum alloy sheets, and a uniform distribution of Mg from the surface into the bulk of the aluminum alloy sheets, produced by the exemplary continuous casting method described above. A lower concentration of Mg near the surface of the aluminum alloy sheets is desirable for bonding and joining applications. -
Figures 10A and 10B show GDOES data for Si content near the surfaces of aluminum alloy sheets (e.g., from the surface to a depth of 2.0 µm).Figure 10A shows data for Si content extending into the bulk of the aluminum alloy sheet.Figure 10B shows data for Si content considered to be found in the surface of the aluminum alloy sheet (e.g., from the surface to a depth of 0.5 µm).Figures 10A and 10B show a high diffusion of Si to the surface of the aluminum alloy sheets produced by direct chill casting (samples D1 and D1-lab).Figures 10A and 10B show decreased diffusion of Si to the surface of the aluminum alloy sheets, and a uniform distribution of Si from the surface into the bulk of the aluminum alloy sheets produced by the exemplary continuous casting method described above. -
Figures 11A and 11B show GDOES data for Cu content near the surfaces of aluminum alloy sheets (e.g., from the surface to a depth of 2.0 µm).Figure 11A shows data for Cu content extending into the bulk of the aluminum alloy sheet.Figure 11B shows data for Cu content considered to be found in the surface of the aluminum alloy sheet (e.g., from the surface to a depth of 0.5 µm).Figures 11A and 11B show a low diffusion of Cu to the surface of the aluminum alloy sheets produced by direct chill casting (samples D1 and D1-lab).Figures 11A and 11B show increased diffusion of Cu to the surface of the aluminum alloy sheets produced by the exemplary continuous casting method described above. Controlled diffusion of Cu to the surface of the aluminum alloy sheets can be desirable for bonding and joining applications. -
Figures 12A and 12B show GDOES data for Mn content near the surfaces of aluminum alloy sheets (e.g., from the surface to a depth of 2.0 µm).Figure 12A shows data for Mn content extending into the bulk of the aluminum alloy sheet.Figure 12B shows data for Mn content considered to be found in the surface of the aluminum alloy sheet (e.g., from the surface to a depth of 0.5 µm).Figures 12A and 12B show no diffusion of Mn to the surface of the aluminum alloy sheets produced by direct chill casting (samples D1 and D1-lab).Figures 12A and 12B show increased diffusion of Mn to the surface of the aluminum alloy sheets produced by the exemplary continuous casting method described above. -
Figures 13A and 13B show GDOES data for Cr content near the surfaces of aluminum alloy sheets (e.g., from the surface to a depth of 2.0 µm).Figure 13A shows data for Cr content extending into the bulk of the aluminum alloy sheet.Figure 13B shows data for Cr content considered to be found in the surface of the aluminum alloy sheet (e.g., from the surface to a depth of 0.5 µm).Figures 13A and 13B show no diffusion of Cr to the surface of the aluminum alloy sheets produced by direct chill casting (samples D1 and D1-lab).Figures 13A and 13B show increased diffusion of Cr to the surface of the aluminum alloy sheets produced by the exemplary continuous casting method described above. Controlled diffusion of Cr to the surface of the aluminum alloy sheets can be desirable for bonding and joining applications. Controlled diffusion of Cr to the surface of the aluminum alloy sheets can be desirable for corrosion resistance. -
Figures 14A and 14B show GDOES data for Fe content near the surfaces of aluminum alloy sheets (e.g., from the surface to a depth of 2.0 µm).Figure 14A shows data for Fe content extending into the bulk of the aluminum alloy sheet.Figure 14B shows data for Fe content considered to be found in the surface of the aluminum alloy sheet (e.g, from the surface to a depth of 0.5 µm).Figures 14A and 14B show no diffusion of Fe to the surface of the aluminum alloy sheets produced by direct chill casting (samples D1 and D1-lab).Figures 14A and 14B show increased diffusion of Fe to the surface of the aluminum alloy sheets produced by the exemplary continuous casting method described above. - Bond durability test results for the exemplary continuously cast aluminum alloy sheets and the comparative direct chill cast aluminum alloy sheets were performed according to the procedure described in Example 2. For this experiment, the completion of 45 cycles indicates that the set of joints passed the bond durability test. The test results are shown below in Table 2. In Table 2, each of the joints are numbered 1 through 6, where joint 1 is the top joint and joint 6 is the bottom joint when oriented vertically. The number in the cells, except for "45," indicates the number of successful cycles before a break. The number "45 in a cell indicates that the joints remained intact for 45 cycles. The results are summarized in Table 2 below:
Table 2 Trial Sample Surface Finishing Bond Durability Test Coupon Arrangement 1 Top 2 3 4 5 6 Bottom 1 C1 Alkaline and acid etch 45 45 45 45 45 45 2 C2 Alkaline and acid etch 45 45 45 45 45 45 3 C3 Alkaline and acid etch 45 45 45 45 45 45 4 C1 Strong alkaline and acid etch 45 45 45 45 45 45 5 C1 Acid etch 45 45 45 45 45 45 6 C4 Alkaline and acid etch 45 45 45 45 45 45 7 D1 Acid etch 20 21 21 21 21 21 - For
Trials - For
Trial 4, test coupons were cut from the exemplary continuously cast aluminum alloy sheets. The test coupons were subjected to a strong alkaline cleaning and acid etching to clean and prepare the surfaces for bonding. Bonding was performed by pretreating the aluminum alloy sheets with an adhesion promoter and bonding the test coupons with an adhesive. Bonded test coupons were exposed to a humid environment for up to 45 duty cycles. - For
Trial 5, test coupons were cut from the exemplary continuously cast aluminum alloy sheets. The test coupons were subjected to an acid etching to clean and prepare the surfaces for bonding. Bonding was performed by pretreating the aluminum alloy sheets with an adhesion promoter and bonding the test coupons with an adhesive. Bonded test coupons were exposed to a humid environment for up to 45 duty cycles. - For
Trial 6, test coupons were cut from the exemplary continuously cast aluminum alloy sheets. The test coupons were solution heat treated in the lab furnace and then subjected to alkaline and acid etching to clean and prepare the surface for bonding. Bonding was performed by pretreating the aluminum alloy sheets with an adhesion promoter and bonding the test coupons with an adhesive. Bonded test coupons were exposed to a humid environment for up to 45 duty cycles. - For
Trial 7, test coupons were cut from the comparative direct chill cast aluminum alloy sheets. The test coupons were subjected to acid etching to prepare the surface for bonding. Bonding was performed by pretreating the aluminum alloy sheets with an adhesion promoter and bonding the test coupons with an adhesive. Bonded test coupons were exposed to a humid environment for up to 45 duty cycles. - The exemplary continuously cast aluminum alloy sheets having controlled diffusion of Mn and Cr to the surface of the aluminum alloy sheets demonstrated excellent bond durability, surviving 45 test cycles without failure. The comparative direct chill cast aluminum alloy sheets having Mg diffused to the surface demonstrated poor bond durability.
- Four samples of an AA5xxx series aluminum alloy were prepared by direct chill casting and were processed by homogenizing, hot rolling, cold rolling to a gauge of 1.5 mm, solution heat treating, air quenching, and etching using four different etchants. The etchants employed were (i) a mixture of phosphoric and sulfuric acid (referred to as solution "A" in Table 3 below), (ii) a mixture of sulfuric acid and ammonium fluoride (referred to as solution "B" in Table 3 below), (iii) a mixture of sulfuric acid and iron (III) sulfate hydrate (referred to as solution "C" in Table 3 below), and (iv) sodium hydroxide (referred to as solution "D" in Table 3 below). Sodium hydroxide (NaOH) was employed as a comparative control etchant due to its ability to remove any oxide layers from the subsurface.
Table 3 - Etching Conditions and Results Etch Solution Etch Reference Dwell Time (s) Temperature (°C) Etch Weight (g/m3) Average Std. Dev. A 1 2 70 0.226 0.022 A 2 5 70 0.277 0.023 A 3 10 70 0.345 0.016 A 4 15 70 0.441 0.017 B 5 2 60 0.679 0.057 B 6 5 60 1.148 0.064 B 7 10 60 1.783 0.036 B 8 15 60 2.406 0.078 C 9 2 67 0.209 0.018 C 10 5 67 0.242 0.008 C 11 10 67 0.308 0.006 C 12 15 67 0.316 0.025 D 13 5* 65 0.446 0.086 D 14 20* 65 1.508 0.558 D 15 30* 65 3.162 0.617 D 16 60* 65 5.931 0.695 *Additional desmutting was employed after etching. -
Figure 15 is a graph showing the RSW electrode service lifetime for RSW electrodes employed to weld aluminum alloy samples after etching in the various etchant solutions described above. Solution D (NaOH) was employed as a comparative control etchant as it is known in the art to completely remove a deformed oxide layer present on a rolled aluminum alloy product, particularly when the dwell time is at least 20 seconds (e.g.,Etches Figure 15 , Solution A (a mixture of phosphoric acid and sulfuric acid (H3PO4/H2SO4)) provided a RSW electrode lifetime of 100 welds, which is greater than the current industry demand of 80 welds. Additionally, in the example ofFigure 15 , the mixture of H3PO4/H2SO4 provided an atomic concentration ratio of P/Mg of about 0.65 in a subsurface extending to a depth of about 83 µm from the surface of the aluminum alloy. Solution B (a mixture of sulfuric acid and ammonium fluoride (H2SO4/NH4F)) provided a RSW electrode lifetime of 80 welds when etched for 2 seconds, however a longer etch dwell time resulted in a loss of electrode lifetime. Solution C (a mixture of sulfuric acid and iron (III) sulfate hydrate (H2SO4/Fe2(SO4)3)) exhibited a poor performance, significantly reducing the RSW electrode lifetime. Thus, incorporating P into a Mg-containing subsurface significantly increased the RSW electrode lifetime. -
Figure 16 is a graph showing etch weight (i.e., amount of material removed from the surface of the aluminum alloys during etching) for each etch performed (Etches 1 - 16 in Table 3). Evident in the graph ofFigure 16 and described above, Solution D was able to provide the greatest etch weight and was thus employed as a comparative solution. Of the etch solutions A, B, and C, Solution B provided the greatest etch weight and Solutions A and C provided similar etch weights, both less than that provided by Solution B. Referring toFigure 15 , Solution B provided the greatest etch weight (seeFigure 16 ) but did not exhibit improvement to the RSW electrode lifetime. Surprisingly, solutions A and C provided similar etch weights but also provided significantly different RSW electrode lifetimes. Particularly, Solution A (containing P) provided a significantly improved RSW electrode lifetime and Solution C was detrimental to the RSW electrode lifetime. Thus, removal of the deformed oxide layer alone is insufficient to improve the RSW electrode lifetime. Evident inFigures 15 and 16 , removal of a portion of the deformed oxide layer, and a presence of a residual P concentration, can work in concert to improve the RSW electrode lifetime. -
Figures 17 - 20 are graphs showing glow discharge optical emission spectroscopy (GDOES) data for Mg content near the surface of the aluminum alloy samples described above (e.g., from the surface to a depth of 5.0 µm).Figure 17 shows data for Mg content extending into the bulk of the aluminum alloy sample etched with Solution A.Figure 18 shows data for Mg content extending into the bulk of the aluminum alloy sample etched with Solution B.Figure 19 shows data for Mg content extending into the bulk of the aluminum alloy sample etched with Solution C. -
Figure 20 shows data for Mg content extending into the bulk of the aluminum alloy sample etched with Solution D. Not to be bound by theory, a Mg concentration found within the subsurface portion of the aluminum alloy samples can negatively impact the RSW electrode lifetime. Surprisingly, when the aluminum alloy samples were etched with Solution A (containing P), RSW electrode lifetime was significantly improved even though the sample contained a concentration of Mg within the subsurface of the aluminum alloy. The aluminum alloy sample etched with comparative Solution D (Figure 20 ) exhibited nearly complete removal of Mg near the surface of the aluminum alloy, further indicating that the presence of Mg and/or a Mg containing compound (e.g., MgO) after etching with a P containing compound provides a significantly improved RSW electrode lifetime. - Further,
Figure 19 shows the GDOES data for the aluminum alloy sample etched with Solution C. Evident in the graph ofFigure 19 , Mg and/or Mg containing compounds are present near the surface of the aluminum alloy samples; however, Solution C did not contain P and was detrimental to the RSW electrode lifetime (seeFigure 15 ). Thus, the presence of Mg and/or Mg containing compounds near the surface of the aluminum alloy without having P present in the etching solution can be detrimental to the RSW electrode lifetime. - In some aspects, alloying element and/or alloying element oxide particle size and morphology can affect surface properties of the aluminum alloy product. For example,
Figures 21 ,22 ,23 , and24 present scanning electron microscope (SEM) micrographs of the aluminum alloy samples described above.Figures 21A-D show SEM micrographs of the aluminum alloy samples etched using Solution A.Figures 21A and 21B show the SEM micrographs from Etch 1 (see Table 3).Figures 21C and 21D show the SEM micrographs fromEtch 4.Figures 21A and 21C are micrographs from a scanning electron mode.Figures 21B and 21D are micrographs from a back-scattered electron mode.Figures 22A-D shows SEM micrographs of the aluminum alloy samples etched using Solution B.Figures 22A and 22B show the SEM micrographs fromEtch 5.Figures 22C and 22D show the SEM micrographs fromEtch 7.Figures 22A and 22C are micrographs from a scanning electron mode.Figures 22B and 22D are micrographs from a back-scattered electron mode.Figures 23A-D shows SEM micrographs of the aluminum alloy samples etched using Solution C.Figures 23A and 23B show the SEM micrographs fromEtch 9.Figures 23C and 23D show the SEM micrographs fromEtch 12.Figures 23A and 23C are micrographs from a scanning electron mode.Figures 23B and 23D are micrographs from a back-scattered electron mode.Figures 24A-D shows SEM micrographs of the aluminum alloy samples etched using Solution D.Figures 24A and 24B show the SEM micrographs fromEtch 13.Figures 24C and 24D show the SEM micrographs fromEtch 16.Figures 24A and 24C are micrographs from a scanning electron mode.Figures 24B and 24D are micrographs from a back-scattered electron mode. Evident inFigures 21 - 24 , Solution B (Figure 22 ) provided the greatest etch weight of Etch Solutions A, B, and C, seeFigure 16 ), thus providing a surface having a reduced amount of Mg and/or Mg containing compound particles (indicated by bright spots inFigures 21 ,23 , and24 ), and a reduced deformed oxide layer (shown as darker grey areas inFigures 21 ,23 , and24 ). - A commercially produced AA5182 aluminum alloy sheet having a thickness of 1.1 mm was used in an as-produced condition (meaning the aluminum alloy sheet was not etched according to the methods described herein). The aluminum alloy sheet was subjected to a RSW trial.
Figure 25 , Panel A shows a copper RSW electrode tip. In the example ofFigure 25 , Panel A,MgO particles 1105 adhered to the RSW electrode tip.Figure 25 , Panel B shows a micrograph of the weld, andFigure 25 , Panel C is a higher magnification image ofFigure 25 , Panel B. As shown inFigure 25 , Panel C,dark areas 1110 indicate MgO present at the surface or in the subsurface of the aluminum alloy sheet. In the example ofFigure 25 , Panel C, the Mg content was 6.9 %. An as-produced AA5182 aluminum alloy contains from 4 % to 5 % Mg (e.g., about 4.5 % Mg). A Mg content of 6.9 % at the surface or in the subsurface indicated migration of Mg from a bulk of the aluminum alloy toward the surface during processing, providing undesired amounts of MgO at the surface or in the subsurface of the aluminum alloy. Accordingly, during the RSW trial, MgO particles adhered to the RSW electrode tip. Such MgO particle pick-up can significantly reduce the RSW electrode lifetime. Thus, etching and/or cleaning the surface of the aluminum alloy sheet according to the methods described herein can remove MgO from the surface or the subsurface of the aluminum alloy, form Mg-P compounds as described above, eliminate MgO pick-up by the RSW electrode, and increase the lifetime of the RSW electrode. -
Figure 26 is a graph showing the yellow index (YI) of the aluminum alloy samples prepared as described above. As described above, the YI can indicate the presence of a Mg and/or Mg containing compound (e.g., MgO) on the surface of the aluminum alloys. A lack of a significant YI is indicated by a dashed line (e.g., a YI less than about 1). The aluminum alloy samples etched using comparative Solution D (e.g., providing the greatest etch weight) exhibited a very low YI, particularly when the etching dwell time was greater than 20 seconds (e.g.,Etches -
Figure 27 is a graph showing the surface roughness of the aluminum alloy samples prepared as described above. The aluminum alloy samples etched using Solutions A and C (e.g., providing low etch weights) exhibited a negligible change in surface roughness with increasing etch time for each sample, indicating a more uniform etch (i.e., a more uniform removal of surface material) regardless of etch time when compared to the aluminum alloy samples etched using Solutions B and D. Surprisingly, the aluminum alloy samples etched using Solution A provided a significantly improved RSW electrode lifetime even while having a lower surface roughness compared to the aluminum alloy samples etched using Solutions B and D, in particular, Etch Reference Nos. 8, 14, 15, and 16. Various embodiments of the invention have been described in fulfillment of the various objectives of the invention. It should be recognized that these embodiments are merely illustrative of the principles of the present invention. Numerous modifications and adaptions thereof will be readily apparent to those skilled in the art without departing from the present invention as defined in the following claims.
Claims (6)
- An aluminum alloy product, comprising:a subsurface portion having a concentration of a migrant element, wherein the subsurface portion extends from the surface to a depth of 2.0 µm within the interior of the alloy product and wherein the migrant element comprises Mg, Si, Cu, Mn, Cr and/or Fe; anda bulk portion having a concentration of the migrant element,wherein the concentration of the migrant element in the subsurface portion is higher than the concentration of the migrant element in the bulk portion, andwherein the aluminum alloy product has a high enrichment ratio of migrant elements Cr, Mn and/or Fe of 4.1 or greater and has a low enrichment ratio for one or more migrant elements from Mg, Si and Cu of 1.0 to 4.0, wherein the enrichment ratio is a ratio of the atomic concentration of the migrant element in the subsurface portion to the atomic concentration of the migrant element in the bulk portion.
- The aluminum alloy product of claim 1, wherein the aluminum alloy product comprises a 6xxx series aluminum alloy or a 5xxx series aluminum alloy.
- A method of producing an aluminum alloy product according to claim 1 or 2, comprising:casting a molten aluminum alloy comprising a migrant element to produce a cast aluminum alloy article;quenching the cast aluminum alloy article;rolling the cast aluminum alloy article to provide a rolled aluminum alloy article;heat treating the rolled aluminum alloy article to form an aluminum alloy product; andoptionally pretreating the aluminum alloy product,wherein the concentration of the migrant element in the subsurface portion is higher than the concentration of the migrant element in the bulk portion of the aluminum alloy product.
- The method according to claim 3, comprising:direct chill casting the aluminum alloy;homogenizing the cast aluminum alloy article;hot rolling the cast aluminum alloy article to form an aluminum alloy hot band;cold rolling the aluminum alloy hot band; andsolution heat treatment.
- The method according to claim 3, comprising:continuous casting the aluminum alloy;quenching the cast aluminum alloy article;hot rolling the cast aluminum alloy article to form a rolled aluminum alloy article;cold rolling the rolled aluminum alloy article; andannealing.
- The method according to claims 3-5, wherein the method comprises pretreating including cleaning a surface of the alloy product, etching a surface of the alloy product, or applying a pretreatment, such as an adhesion promoter, a corrosion inhibitor, a coupling agent, an antimicrobial agent, or a mixture thereof, to a surface of the alloy product.
Priority Applications (1)
| Application Number | Priority Date | Filing Date | Title |
|---|---|---|---|
| EP25158294.6A EP4530368A3 (en) | 2017-12-21 | 2018-10-23 | Aluminum alloy products exhibiting improved bond durability and/or having phosphorus-containing surfaces and methods of making the same |
Applications Claiming Priority (4)
| Application Number | Priority Date | Filing Date | Title |
|---|---|---|---|
| US201762608614P | 2017-12-21 | 2017-12-21 | |
| US201862741688P | 2018-10-05 | 2018-10-05 | |
| PCT/US2018/057046 WO2019125594A1 (en) | 2017-12-21 | 2018-10-23 | Aluminum alloy products exhibiting improved bond durability and/or having phosphorus-containing surfaces and methods of making the same |
| EP18801128.2A EP3728665A1 (en) | 2017-12-21 | 2018-10-23 | Aluminum alloy products exhibiting improved bond durability and/or having phosphorus-containing surfaces and methods of making the same |
Related Parent Applications (1)
| Application Number | Title | Priority Date | Filing Date |
|---|---|---|---|
| EP18801128.2A Division EP3728665A1 (en) | 2017-12-21 | 2018-10-23 | Aluminum alloy products exhibiting improved bond durability and/or having phosphorus-containing surfaces and methods of making the same |
Related Child Applications (1)
| Application Number | Title | Priority Date | Filing Date |
|---|---|---|---|
| EP25158294.6A Division EP4530368A3 (en) | 2017-12-21 | 2018-10-23 | Aluminum alloy products exhibiting improved bond durability and/or having phosphorus-containing surfaces and methods of making the same |
Publications (2)
| Publication Number | Publication Date |
|---|---|
| EP4119686A1 EP4119686A1 (en) | 2023-01-18 |
| EP4119686B1 true EP4119686B1 (en) | 2025-02-19 |
Family
ID=64277818
Family Applications (3)
| Application Number | Title | Priority Date | Filing Date |
|---|---|---|---|
| EP18801128.2A Ceased EP3728665A1 (en) | 2017-12-21 | 2018-10-23 | Aluminum alloy products exhibiting improved bond durability and/or having phosphorus-containing surfaces and methods of making the same |
| EP25158294.6A Pending EP4530368A3 (en) | 2017-12-21 | 2018-10-23 | Aluminum alloy products exhibiting improved bond durability and/or having phosphorus-containing surfaces and methods of making the same |
| EP22193045.6A Active EP4119686B1 (en) | 2017-12-21 | 2018-10-23 | Aluminum alloy products exhibiting improved bond durability and/or having phosphorus-containing surfaces and methods of making the same |
Family Applications Before (2)
| Application Number | Title | Priority Date | Filing Date |
|---|---|---|---|
| EP18801128.2A Ceased EP3728665A1 (en) | 2017-12-21 | 2018-10-23 | Aluminum alloy products exhibiting improved bond durability and/or having phosphorus-containing surfaces and methods of making the same |
| EP25158294.6A Pending EP4530368A3 (en) | 2017-12-21 | 2018-10-23 | Aluminum alloy products exhibiting improved bond durability and/or having phosphorus-containing surfaces and methods of making the same |
Country Status (8)
| Country | Link |
|---|---|
| US (1) | US11649529B2 (en) |
| EP (3) | EP3728665A1 (en) |
| JP (1) | JP7191106B2 (en) |
| KR (1) | KR102508358B1 (en) |
| CN (1) | CN112218962B (en) |
| CA (2) | CA3085731C (en) |
| MX (1) | MX2020006118A (en) |
| WO (1) | WO2019125594A1 (en) |
Families Citing this family (4)
| Publication number | Priority date | Publication date | Assignee | Title |
|---|---|---|---|---|
| EP3728665A1 (en) | 2017-12-21 | 2020-10-28 | Novelis, Inc. | Aluminum alloy products exhibiting improved bond durability and/or having phosphorus-containing surfaces and methods of making the same |
| JP7182725B2 (en) * | 2019-09-27 | 2022-12-02 | 本田技研工業株式会社 | metal painting method |
| US20230082861A1 (en) * | 2020-02-19 | 2023-03-16 | Novelis Inc. | Metal products with improved bond durability and related methods |
| US20250051928A1 (en) * | 2022-01-25 | 2025-02-13 | Novelis Inc. | Cold spray systems and methods for coating cast materials |
Citations (6)
| Publication number | Priority date | Publication date | Assignee | Title |
|---|---|---|---|---|
| US7070735B2 (en) | 2002-07-22 | 2006-07-04 | Honda Giken Kogyo Kabushiki Kaisha | Aluminum alloy material for forging and continuous casting process therefor |
| JP2007131889A (en) | 2005-11-09 | 2007-05-31 | Sumitomo Light Metal Ind Ltd | Al-Mg-Si aluminum alloy plate |
| JP2013124402A (en) | 2011-12-15 | 2013-06-24 | Mitsubishi Alum Co Ltd | Aluminum foil for electrolytic capacitor, and method for producing the same |
| US20140166162A1 (en) | 2011-07-25 | 2014-06-19 | Nissan Motor Co., Ltd. | Aluminum alloy sheet and method for manufacturing same |
| US9669604B2 (en) | 2012-09-20 | 2017-06-06 | Kobe Steel, Ltd. | Aluminum-alloy plate and joined body as well as automobile member using the same |
| WO2019125594A1 (en) | 2017-12-21 | 2019-06-27 | Novelis Inc. | Aluminum alloy products exhibiting improved bond durability and/or having phosphorus-containing surfaces and methods of making the same |
Family Cites Families (38)
| Publication number | Priority date | Publication date | Assignee | Title |
|---|---|---|---|---|
| JPS4918697B1 (en) * | 1970-09-29 | 1974-05-11 | ||
| JPS4918697A (en) | 1972-06-13 | 1974-02-19 | ||
| EP0557531A1 (en) * | 1991-09-04 | 1993-09-01 | Furukawa Aluminum Co., Ltd. | Aluminum alloy sheet for automotive body and production thereof |
| JP3201033B2 (en) * | 1992-12-28 | 2001-08-20 | 日本軽金属株式会社 | Manufacturing method of aluminum alloy sheet with excellent corrosion resistance and paint base treatment |
| JP3207588B2 (en) * | 1993-03-05 | 2001-09-10 | 新日本製鐵株式会社 | Aluminum alloy plate excellent in adhesion and method for producing the same |
| KR100393024B1 (en) * | 1996-02-05 | 2003-12-01 | 신닛뽄세이테쯔 카부시키카이샤 | Corrosion resistant surface treatment metal materials and their surface treatment agents |
| JPH09263868A (en) * | 1996-03-28 | 1997-10-07 | Nippon Steel Corp | Aluminum alloy plate having excellent coating film adhesion and method for producing the same |
| JP4171141B2 (en) | 1999-03-30 | 2008-10-22 | 株式会社神戸製鋼所 | Aluminum alloy material with excellent yarn rust resistance |
| DE60024889T2 (en) | 2000-10-10 | 2006-08-10 | Alcoa Inc. | ACID TREATMENT FOR THE BONDING OF MOTOR VEHICLE PARTS |
| JP2002256460A (en) | 2001-02-09 | 2002-09-11 | Nippon Parkerizing Co Ltd | Composition and method for etching and desmutting used for aluminum and aluminum alloy |
| AT412877B (en) * | 2003-07-01 | 2005-08-25 | Miba Gleitlager Gmbh | LAYER MATERIAL |
| US8524015B2 (en) | 2003-12-19 | 2013-09-03 | Nippon Light Metal Company, Ltd. | Aluminum alloy sheet excellent in resistance to softening by baking |
| CN100360714C (en) | 2005-09-21 | 2008-01-09 | 中国海洋大学 | Chemical Etching Solutions for Aluminum and Aluminum Alloys |
| JP4888809B2 (en) * | 2007-01-23 | 2012-02-29 | 燐化学工業株式会社 | White treatment liquid composition for aluminum or aluminum alloy and white treatment method |
| KR20100018048A (en) | 2007-06-29 | 2010-02-16 | 노스이스턴 유니버시티 | A structural material part of a high-si mg-containing al alloy and the manufacture method thereof |
| JP5149582B2 (en) * | 2007-09-28 | 2013-02-20 | 富士フイルム株式会社 | Aluminum alloy plate for lithographic printing plate and method for producing the same |
| FR2933424B1 (en) | 2008-07-07 | 2011-03-25 | Alcan Rhenalu | PROCESS FOR THE PREPARATION BEFORE WELDING ALUMINUM LITHIUM ALLOY PRODUCTS |
| JP2010222659A (en) * | 2009-03-24 | 2010-10-07 | Kobe Steel Ltd | Aluminum alloy material and method of manufacturing the same |
| CN102312233B (en) | 2010-06-29 | 2013-10-30 | 株式会社神户制钢所 | Aluminum alloy plate after surface treatment and manufacturing method thereof |
| JP5427143B2 (en) * | 2010-08-25 | 2014-02-26 | 株式会社神戸製鋼所 | Aluminum alloy sheet for forming |
| JP2013159806A (en) | 2012-02-03 | 2013-08-19 | Kobe Steel Ltd | Aluminum alloy sheet, and joined body and member for automobile using the same |
| CN104271289A (en) * | 2012-03-07 | 2015-01-07 | 美铝公司 | Improved aluminum alloy containing magnesium, silicon, manganese, iron and copper and preparation method thereof |
| AU2013202557B2 (en) * | 2012-03-07 | 2017-06-15 | Arconic Inc. | Improved 6XXX aluminum alloys and methods for producing the same |
| EP2862952B1 (en) | 2012-06-15 | 2020-03-04 | UACJ Corporation | Aluminum alloy plate |
| JP5944862B2 (en) * | 2012-08-08 | 2016-07-05 | 株式会社Uacj | Aluminum alloy plate excellent in surface quality after anodizing treatment and manufacturing method thereof |
| KR20140041293A (en) | 2012-09-27 | 2014-04-04 | 현대제철 주식회사 | Cold-rolled steel sheet and method of manufacturing the same |
| JP5905810B2 (en) * | 2012-10-23 | 2016-04-20 | 株式会社神戸製鋼所 | Aluminum alloy sheet for forming |
| DE102013200847B4 (en) * | 2013-01-21 | 2014-08-07 | Federal-Mogul Nürnberg GmbH | Cast aluminum alloy, aluminum alloy cast piston, and method of making an aluminum casting alloy |
| JP2015040320A (en) * | 2013-08-21 | 2015-03-02 | 株式会社Uacj | High strength aluminum alloy, and method for producing the same |
| KR101511632B1 (en) * | 2013-09-05 | 2015-04-13 | 한국기계연구원 | Method for manufacturing of Al-Zn alloy sheet using twin roll casting and Al-Zn alloy sheet thereby |
| JP6685079B2 (en) * | 2014-04-11 | 2020-04-22 | 株式会社Uacj | Aluminum alloy plate with excellent surface quality |
| JP2016089261A (en) * | 2014-11-11 | 2016-05-23 | 株式会社神戸製鋼所 | Aluminum alloy material, joined body, automotive member, and method for producing aluminum alloy material |
| US20160160355A1 (en) | 2014-12-08 | 2016-06-09 | Novelis Inc. | Pretreatment of metal surfaces with a calcium-containing aqueous agent |
| US9359686B1 (en) * | 2015-01-09 | 2016-06-07 | Apple Inc. | Processes to reduce interfacial enrichment of alloying elements under anodic oxide films and improve anodized appearance of heat treatable alloys |
| JP2017203209A (en) | 2015-07-09 | 2017-11-16 | 株式会社神戸製鋼所 | Method for producing aluminum alloy material, aluminum alloy material and joined body |
| EP3396017A4 (en) * | 2015-12-24 | 2019-01-16 | Posco | ALLOY-COATED STEEL SHEET AND MANUFACTURING METHOD THEREFOR |
| JP7038706B2 (en) | 2016-12-21 | 2022-03-18 | アーコニック テクノロジーズ エルエルシー | High zinc aluminum alloy products |
| US20190037721A1 (en) * | 2017-07-27 | 2019-01-31 | Apple Inc. | Anodized aluminum alloys having alloying elements to eliminate filiform corrosion |
-
2018
- 2018-10-23 EP EP18801128.2A patent/EP3728665A1/en not_active Ceased
- 2018-10-23 US US16/168,016 patent/US11649529B2/en active Active
- 2018-10-23 CN CN201880082455.9A patent/CN112218962B/en active Active
- 2018-10-23 KR KR1020207020464A patent/KR102508358B1/en active Active
- 2018-10-23 CA CA3085731A patent/CA3085731C/en active Active
- 2018-10-23 CA CA3166074A patent/CA3166074C/en active Active
- 2018-10-23 WO PCT/US2018/057046 patent/WO2019125594A1/en not_active Ceased
- 2018-10-23 MX MX2020006118A patent/MX2020006118A/en unknown
- 2018-10-23 EP EP25158294.6A patent/EP4530368A3/en active Pending
- 2018-10-23 EP EP22193045.6A patent/EP4119686B1/en active Active
- 2018-10-23 JP JP2020533082A patent/JP7191106B2/en active Active
Patent Citations (6)
| Publication number | Priority date | Publication date | Assignee | Title |
|---|---|---|---|---|
| US7070735B2 (en) | 2002-07-22 | 2006-07-04 | Honda Giken Kogyo Kabushiki Kaisha | Aluminum alloy material for forging and continuous casting process therefor |
| JP2007131889A (en) | 2005-11-09 | 2007-05-31 | Sumitomo Light Metal Ind Ltd | Al-Mg-Si aluminum alloy plate |
| US20140166162A1 (en) | 2011-07-25 | 2014-06-19 | Nissan Motor Co., Ltd. | Aluminum alloy sheet and method for manufacturing same |
| JP2013124402A (en) | 2011-12-15 | 2013-06-24 | Mitsubishi Alum Co Ltd | Aluminum foil for electrolytic capacitor, and method for producing the same |
| US9669604B2 (en) | 2012-09-20 | 2017-06-06 | Kobe Steel, Ltd. | Aluminum-alloy plate and joined body as well as automobile member using the same |
| WO2019125594A1 (en) | 2017-12-21 | 2019-06-27 | Novelis Inc. | Aluminum alloy products exhibiting improved bond durability and/or having phosphorus-containing surfaces and methods of making the same |
Non-Patent Citations (5)
| Title |
|---|
| CARLBERG TORBJÖRN ET AL: "Surface Segregation and Surface Defect Formation During Aluminum Billet Casting", FUNDAMENTALS OF PETROLEUM AND PETROCHEMICAL ENGINEERING,, vol. 68, no. 6, 11 September 2015 (2015-09-11), pages 1065 - 1069, XP035580109, DOI: 10.1007/S12666-015-0647-0 * |
| D7 - INSPECTION CERTIFICATE VOM 24. JULI 2014 ZUR PACKLISTE 1450309174 000010 |
| D8 - RECHNUNG MIT DER NR. 1480217573 ZUR PACKLISTE 1450309174 / 10 |
| D9 - KONTOAUSZUG ZUR ZAHLUNG DER RECHNUNG 1480217573 |
| NADELLA, R. ESKIN, D.G. DU, Q. KATGERMAN, L.: "Macrosegregation in direct-chill casting of aluminium alloys", PROGRESS IN MATERIALS SCIENCE., PERGAMON PRESS., GB, vol. 53, no. 3, 26 October 2007 (2007-10-26), GB , pages 421 - 480, XP022492051, ISSN: 0079-6425, DOI: 10.1016/j.pmatsci.2007.10.001 |
Also Published As
| Publication number | Publication date |
|---|---|
| EP4530368A3 (en) | 2025-10-22 |
| US20190193185A1 (en) | 2019-06-27 |
| EP3728665A1 (en) | 2020-10-28 |
| CN112218962B (en) | 2022-12-30 |
| CN112218962A (en) | 2021-01-12 |
| CA3166074A1 (en) | 2019-06-27 |
| EP4119686A1 (en) | 2023-01-18 |
| CA3085731C (en) | 2022-12-13 |
| CA3166074C (en) | 2024-10-22 |
| US11649529B2 (en) | 2023-05-16 |
| KR102508358B1 (en) | 2023-03-10 |
| CA3085731A1 (en) | 2019-06-27 |
| WO2019125594A1 (en) | 2019-06-27 |
| JP7191106B2 (en) | 2022-12-16 |
| MX2020006118A (en) | 2020-08-24 |
| JP2021508358A (en) | 2021-03-04 |
| KR20200096636A (en) | 2020-08-12 |
| EP4530368A2 (en) | 2025-04-02 |
Similar Documents
| Publication | Publication Date | Title |
|---|---|---|
| CA3077516C (en) | Aluminum alloy articles having improved bond durability and inert surface aluminum alloy articles and methods of making and using the same | |
| EP4119686B1 (en) | Aluminum alloy products exhibiting improved bond durability and/or having phosphorus-containing surfaces and methods of making the same | |
| CA3111834C (en) | Highly deformable and thermally treatable continuous coils and method of producing the same | |
| KR102404163B1 (en) | Clad aluminum alloy products | |
| JPWO2013015110A1 (en) | Aluminum alloy plate and method for producing aluminum alloy plate | |
| KR20200042919A (en) | Aluminum alloy product and manufacturing method with selectively recrystallized microstructure | |
| EP4407068A2 (en) | Aluminum alloys and coated aluminum alloys with high corrosion resistance and methods of making the same | |
| JP5968956B2 (en) | Aluminum alloy plate, joined body and automobile member using the same | |
| WO2016031940A1 (en) | Aluminum alloy material, bonded object, and automotive member | |
| JP2006249550A (en) | Aluminum alloy sheet for automobile body |
Legal Events
| Date | Code | Title | Description |
|---|---|---|---|
| PUAI | Public reference made under article 153(3) epc to a published international application that has entered the european phase |
Free format text: ORIGINAL CODE: 0009012 |
|
| STAA | Information on the status of an ep patent application or granted ep patent |
Free format text: STATUS: REQUEST FOR EXAMINATION WAS MADE |
|
| 17P | Request for examination filed |
Effective date: 20220831 |
|
| AC | Divisional application: reference to earlier application |
Ref document number: 3728665 Country of ref document: EP Kind code of ref document: P |
|
| AK | Designated contracting states |
Kind code of ref document: A1 Designated state(s): AL AT BE BG CH CY CZ DE DK EE ES FI FR GB GR HR HU IE IS IT LI LT LU LV MC MK MT NL NO PL PT RO RS SE SI SK SM TR |
|
| STAA | Information on the status of an ep patent application or granted ep patent |
Free format text: STATUS: EXAMINATION IS IN PROGRESS |
|
| 17Q | First examination report despatched |
Effective date: 20230919 |
|
| GRAP | Despatch of communication of intention to grant a patent |
Free format text: ORIGINAL CODE: EPIDOSNIGR1 |
|
| STAA | Information on the status of an ep patent application or granted ep patent |
Free format text: STATUS: GRANT OF PATENT IS INTENDED |
|
| TPAC | Observations filed by third parties |
Free format text: ORIGINAL CODE: EPIDOSNTIPA |
|
| INTG | Intention to grant announced |
Effective date: 20240809 |
|
| GRAJ | Information related to disapproval of communication of intention to grant by the applicant or resumption of examination proceedings by the epo deleted |
Free format text: ORIGINAL CODE: EPIDOSDIGR1 |
|
| GRAP | Despatch of communication of intention to grant a patent |
Free format text: ORIGINAL CODE: EPIDOSNIGR1 |
|
| RAP3 | Party data changed (applicant data changed or rights of an application transferred) |
Owner name: NOVELIS INC. |
|
| RIN1 | Information on inventor provided before grant (corrected) |
Inventor name: LIN, DECHAO Inventor name: MANAVBASI, ALP Inventor name: PARADIS, BRIAN Inventor name: MALPICA, JULIO Inventor name: FELBERBAUM, MILAN Inventor name: VEGA, LUIS FANOR Inventor name: YUAN, YUDIE Inventor name: ZHU, DEWEI Inventor name: SON, CHANGOOK Inventor name: REDMOND, PETER LLOYD Inventor name: DAS, SAZOL KUMAR Inventor name: MACFARLANE, THERESA ELIZABETH Inventor name: LI, LIANGLIANG |
|
| INTG | Intention to grant announced |
Effective date: 20240918 |
|
| GRAS | Grant fee paid |
Free format text: ORIGINAL CODE: EPIDOSNIGR3 |
|
| GRAA | (expected) grant |
Free format text: ORIGINAL CODE: 0009210 |
|
| STAA | Information on the status of an ep patent application or granted ep patent |
Free format text: STATUS: THE PATENT HAS BEEN GRANTED |
|
| AC | Divisional application: reference to earlier application |
Ref document number: 3728665 Country of ref document: EP Kind code of ref document: P |
|
| AK | Designated contracting states |
Kind code of ref document: B1 Designated state(s): AL AT BE BG CH CY CZ DE DK EE ES FI FR GB GR HR HU IE IS IT LI LT LU LV MC MK MT NL NO PL PT RO RS SE SI SK SM TR |
|
| REG | Reference to a national code |
Ref country code: GB Ref legal event code: FG4D |
|
| REG | Reference to a national code |
Ref country code: CH Ref legal event code: EP |
|
| REG | Reference to a national code |
Ref country code: DE Ref legal event code: R096 Ref document number: 602018079499 Country of ref document: DE |
|
| REG | Reference to a national code |
Ref country code: IE Ref legal event code: FG4D |
|
| REG | Reference to a national code |
Ref country code: SE Ref legal event code: TRGR |
|
| P01 | Opt-out of the competence of the unified patent court (upc) registered |
Free format text: CASE NUMBER: APP_21092/2025 Effective date: 20250505 |
|
| REG | Reference to a national code |
Ref country code: NL Ref legal event code: MP Effective date: 20250219 |
|
| PG25 | Lapsed in a contracting state [announced via postgrant information from national office to epo] |
Ref country code: RS Free format text: LAPSE BECAUSE OF FAILURE TO SUBMIT A TRANSLATION OF THE DESCRIPTION OR TO PAY THE FEE WITHIN THE PRESCRIBED TIME-LIMIT Effective date: 20250519 |
|
| PG25 | Lapsed in a contracting state [announced via postgrant information from national office to epo] |
Ref country code: FI Free format text: LAPSE BECAUSE OF FAILURE TO SUBMIT A TRANSLATION OF THE DESCRIPTION OR TO PAY THE FEE WITHIN THE PRESCRIBED TIME-LIMIT Effective date: 20250219 |
|
| PG25 | Lapsed in a contracting state [announced via postgrant information from national office to epo] |
Ref country code: PL Free format text: LAPSE BECAUSE OF FAILURE TO SUBMIT A TRANSLATION OF THE DESCRIPTION OR TO PAY THE FEE WITHIN THE PRESCRIBED TIME-LIMIT Effective date: 20250219 |
|
| PG25 | Lapsed in a contracting state [announced via postgrant information from national office to epo] |
Ref country code: ES Free format text: LAPSE BECAUSE OF FAILURE TO SUBMIT A TRANSLATION OF THE DESCRIPTION OR TO PAY THE FEE WITHIN THE PRESCRIBED TIME-LIMIT Effective date: 20250219 |
|
| REG | Reference to a national code |
Ref country code: LT Ref legal event code: MG9D |
|
| PG25 | Lapsed in a contracting state [announced via postgrant information from national office to epo] |
Ref country code: NO Free format text: LAPSE BECAUSE OF FAILURE TO SUBMIT A TRANSLATION OF THE DESCRIPTION OR TO PAY THE FEE WITHIN THE PRESCRIBED TIME-LIMIT Effective date: 20250519 Ref country code: IS Free format text: LAPSE BECAUSE OF FAILURE TO SUBMIT A TRANSLATION OF THE DESCRIPTION OR TO PAY THE FEE WITHIN THE PRESCRIBED TIME-LIMIT Effective date: 20250619 |
|
| PG25 | Lapsed in a contracting state [announced via postgrant information from national office to epo] |
Ref country code: NL Free format text: LAPSE BECAUSE OF FAILURE TO SUBMIT A TRANSLATION OF THE DESCRIPTION OR TO PAY THE FEE WITHIN THE PRESCRIBED TIME-LIMIT Effective date: 20250219 |
|
| PG25 | Lapsed in a contracting state [announced via postgrant information from national office to epo] |
Ref country code: HR Free format text: LAPSE BECAUSE OF FAILURE TO SUBMIT A TRANSLATION OF THE DESCRIPTION OR TO PAY THE FEE WITHIN THE PRESCRIBED TIME-LIMIT Effective date: 20250219 |
|
| PG25 | Lapsed in a contracting state [announced via postgrant information from national office to epo] |
Ref country code: PT Free format text: LAPSE BECAUSE OF FAILURE TO SUBMIT A TRANSLATION OF THE DESCRIPTION OR TO PAY THE FEE WITHIN THE PRESCRIBED TIME-LIMIT Effective date: 20250620 Ref country code: LV Free format text: LAPSE BECAUSE OF FAILURE TO SUBMIT A TRANSLATION OF THE DESCRIPTION OR TO PAY THE FEE WITHIN THE PRESCRIBED TIME-LIMIT Effective date: 20250219 |
|
| PG25 | Lapsed in a contracting state [announced via postgrant information from national office to epo] |
Ref country code: GR Free format text: LAPSE BECAUSE OF FAILURE TO SUBMIT A TRANSLATION OF THE DESCRIPTION OR TO PAY THE FEE WITHIN THE PRESCRIBED TIME-LIMIT Effective date: 20250520 Ref country code: BG Free format text: LAPSE BECAUSE OF FAILURE TO SUBMIT A TRANSLATION OF THE DESCRIPTION OR TO PAY THE FEE WITHIN THE PRESCRIBED TIME-LIMIT Effective date: 20250219 |
|
| PG25 | Lapsed in a contracting state [announced via postgrant information from national office to epo] |
Ref country code: SM Free format text: LAPSE BECAUSE OF FAILURE TO SUBMIT A TRANSLATION OF THE DESCRIPTION OR TO PAY THE FEE WITHIN THE PRESCRIBED TIME-LIMIT Effective date: 20250219 |
|
| PG25 | Lapsed in a contracting state [announced via postgrant information from national office to epo] |
Ref country code: DK Free format text: LAPSE BECAUSE OF FAILURE TO SUBMIT A TRANSLATION OF THE DESCRIPTION OR TO PAY THE FEE WITHIN THE PRESCRIBED TIME-LIMIT Effective date: 20250219 |
|
| PG25 | Lapsed in a contracting state [announced via postgrant information from national office to epo] |
Ref country code: IT Free format text: LAPSE BECAUSE OF FAILURE TO SUBMIT A TRANSLATION OF THE DESCRIPTION OR TO PAY THE FEE WITHIN THE PRESCRIBED TIME-LIMIT Effective date: 20250219 |
|
| PGFP | Annual fee paid to national office [announced via postgrant information from national office to epo] |
Ref country code: BE Payment date: 20250923 Year of fee payment: 8 Ref country code: GB Payment date: 20250923 Year of fee payment: 8 |
|
| PGFP | Annual fee paid to national office [announced via postgrant information from national office to epo] |
Ref country code: FR Payment date: 20250924 Year of fee payment: 8 |
|
| PGFP | Annual fee paid to national office [announced via postgrant information from national office to epo] |
Ref country code: SE Payment date: 20250923 Year of fee payment: 8 |
|
| PG25 | Lapsed in a contracting state [announced via postgrant information from national office to epo] |
Ref country code: EE Free format text: LAPSE BECAUSE OF FAILURE TO SUBMIT A TRANSLATION OF THE DESCRIPTION OR TO PAY THE FEE WITHIN THE PRESCRIBED TIME-LIMIT Effective date: 20250219 Ref country code: CZ Free format text: LAPSE BECAUSE OF FAILURE TO SUBMIT A TRANSLATION OF THE DESCRIPTION OR TO PAY THE FEE WITHIN THE PRESCRIBED TIME-LIMIT Effective date: 20250219 |
|
| PG25 | Lapsed in a contracting state [announced via postgrant information from national office to epo] |
Ref country code: RO Free format text: LAPSE BECAUSE OF FAILURE TO SUBMIT A TRANSLATION OF THE DESCRIPTION OR TO PAY THE FEE WITHIN THE PRESCRIBED TIME-LIMIT Effective date: 20250219 |
|
| PG25 | Lapsed in a contracting state [announced via postgrant information from national office to epo] |
Ref country code: SK Free format text: LAPSE BECAUSE OF FAILURE TO SUBMIT A TRANSLATION OF THE DESCRIPTION OR TO PAY THE FEE WITHIN THE PRESCRIBED TIME-LIMIT Effective date: 20250219 |
|
| REG | Reference to a national code |
Ref country code: CH Ref legal event code: U11 Free format text: ST27 STATUS EVENT CODE: U-0-0-U10-U11 (AS PROVIDED BY THE NATIONAL OFFICE) Effective date: 20251101 |
|
| REG | Reference to a national code |
Ref country code: DE Ref legal event code: R026 Ref document number: 602018079499 Country of ref document: DE |
|
| PLBI | Opposition filed |
Free format text: ORIGINAL CODE: 0009260 |
|
| REG | Reference to a national code |
Ref country code: CH Ref legal event code: L10 Free format text: ST27 STATUS EVENT CODE: U-0-0-L10-L00 (AS PROVIDED BY THE NATIONAL OFFICE) Effective date: 20251126 |
|
| PLAX | Notice of opposition and request to file observation + time limit sent |
Free format text: ORIGINAL CODE: EPIDOSNOBS2 |
|
| 26 | Opposition filed |
Opponent name: SPEIRA GMBH Effective date: 20251119 |
|
| PGFP | Annual fee paid to national office [announced via postgrant information from national office to epo] |
Ref country code: DE Payment date: 20250923 Year of fee payment: 8 |
|
| PGFP | Annual fee paid to national office [announced via postgrant information from national office to epo] |
Ref country code: AT Payment date: 20250926 Year of fee payment: 8 |
|
| PGFP | Annual fee paid to national office [announced via postgrant information from national office to epo] |
Ref country code: CH Payment date: 20251101 Year of fee payment: 8 |