EP4005785A1 - Abnormality detecting device, abnormality detecting method, and abnormality detecting program - Google Patents
Abnormality detecting device, abnormality detecting method, and abnormality detecting program Download PDFInfo
- Publication number
- EP4005785A1 EP4005785A1 EP20844882.9A EP20844882A EP4005785A1 EP 4005785 A1 EP4005785 A1 EP 4005785A1 EP 20844882 A EP20844882 A EP 20844882A EP 4005785 A1 EP4005785 A1 EP 4005785A1
- Authority
- EP
- European Patent Office
- Prior art keywords
- abnormality detecting
- abnormality
- target device
- index
- index value
- Prior art date
- Legal status (The legal status is an assumption and is not a legal conclusion. Google has not performed a legal analysis and makes no representation as to the accuracy of the status listed.)
- Granted
Links
Images



Classifications
-
- G—PHYSICS
- G05—CONTROLLING; REGULATING
- G05B—CONTROL OR REGULATING SYSTEMS IN GENERAL; FUNCTIONAL ELEMENTS OF SUCH SYSTEMS; MONITORING OR TESTING ARRANGEMENTS FOR SUCH SYSTEMS OR ELEMENTS
- G05B23/00—Testing or monitoring of control systems or parts thereof
- G05B23/02—Electric testing or monitoring
- G05B23/0205—Electric testing or monitoring by means of a monitoring system capable of detecting and responding to faults
- G05B23/0218—Electric testing or monitoring by means of a monitoring system capable of detecting and responding to faults characterised by the fault detection method dealing with either existing or incipient faults
- G05B23/0224—Process history based detection method, e.g. whereby history implies the availability of large amounts of data
- G05B23/024—Quantitative history assessment, e.g. mathematical relationships between available data; Functions therefor; Principal component analysis [PCA]; Partial least square [PLS]; Statistical classifiers, e.g. Bayesian networks, linear regression or correlation analysis; Neural networks
-
- G—PHYSICS
- G05—CONTROLLING; REGULATING
- G05B—CONTROL OR REGULATING SYSTEMS IN GENERAL; FUNCTIONAL ELEMENTS OF SUCH SYSTEMS; MONITORING OR TESTING ARRANGEMENTS FOR SUCH SYSTEMS OR ELEMENTS
- G05B23/00—Testing or monitoring of control systems or parts thereof
- G05B23/02—Electric testing or monitoring
- G05B23/0205—Electric testing or monitoring by means of a monitoring system capable of detecting and responding to faults
- G05B23/0218—Electric testing or monitoring by means of a monitoring system capable of detecting and responding to faults characterised by the fault detection method dealing with either existing or incipient faults
-
- B—PERFORMING OPERATIONS; TRANSPORTING
- B30—PRESSES
- B30B—PRESSES IN GENERAL
- B30B15/00—Details of, or accessories for, presses; Auxiliary measures in connection with pressing
- B30B15/26—Program-control arrangements
-
- B—PERFORMING OPERATIONS; TRANSPORTING
- B30—PRESSES
- B30B—PRESSES IN GENERAL
- B30B15/00—Details of, or accessories for, presses; Auxiliary measures in connection with pressing
- B30B15/28—Arrangements for preventing distortion of, or damage to, presses or parts thereof
-
- G—PHYSICS
- G05—CONTROLLING; REGULATING
- G05B—CONTROL OR REGULATING SYSTEMS IN GENERAL; FUNCTIONAL ELEMENTS OF SUCH SYSTEMS; MONITORING OR TESTING ARRANGEMENTS FOR SUCH SYSTEMS OR ELEMENTS
- G05B19/00—Program-control systems
- G05B19/02—Program-control systems electric
- G05B19/18—Numerical control [NC], i.e. automatically operating machines, in particular machine tools, e.g. in a manufacturing environment, so as to execute positioning, movement or co-ordinated operations by means of program data in numerical form
- G05B19/406—Numerical control [NC], i.e. automatically operating machines, in particular machine tools, e.g. in a manufacturing environment, so as to execute positioning, movement or co-ordinated operations by means of program data in numerical form characterised by monitoring or safety
-
- G—PHYSICS
- G06—COMPUTING OR CALCULATING; COUNTING
- G06F—ELECTRIC DIGITAL DATA PROCESSING
- G06F18/00—Pattern recognition
- G06F18/20—Analysing
- G06F18/22—Matching criteria, e.g. proximity measures
-
- G—PHYSICS
- G05—CONTROLLING; REGULATING
- G05B—CONTROL OR REGULATING SYSTEMS IN GENERAL; FUNCTIONAL ELEMENTS OF SUCH SYSTEMS; MONITORING OR TESTING ARRANGEMENTS FOR SUCH SYSTEMS OR ELEMENTS
- G05B2219/00—Program-control systems
- G05B2219/30—Nc systems
- G05B2219/34—Director, elements to supervisory
- G05B2219/34465—Safety, control of correct operation, abnormal states
Definitions
- the present invention relates to an abnormality detecting device, an abnormality detecting method, and an abnormality detecting program that detect an abnormality of a target device.
- Patent Document 1 a technique is known to detect a press abnormality based on a load waveform of a press load when pressing a work in a press system (see, for example, Patent Document 1).
- Patent Document 2 a technique is known to control a motor by using a probability density function depending on the speed of a servomotor (see, for example, Patent Document 2).
- Patent Document 1 or Patent Document 2 determines whether an abnormality occurs according to whether a measured value of the device in a machining operation for machining the work is within the standard deviation.
- the prediction curve of the press load or the motor speed during the machining operation may sometimes have a steep part during the machining operation.
- whether an abnormality occurs is determined based on whether the measured value of the device in the machining operation is within the standard deviation as in the related art described above, when the prediction curve is steep, it is likely to determine that there is an abnormality even though no abnormality occurs.
- One aspect of the present invention has been made in view of the above circumstances, and an objective of the present invention is to provide a technique capable of appropriately performing an abnormality determination.
- an abnormality detecting device detecting an abnormality of a target device, and includes an acquisition part and an abnormality detecting part.
- the acquisition part acquires a first index value associated with a first index and a second index value associated with a second index in an operation of the target device.
- the abnormality detecting part detects an abnormality of the target device based on a distance from a predetermined reference curve to a point indicated by the first index value and the second index value on a two-dimensional plane with the first index and the second index being axes.
- an abnormality detecting method is an abnormality detecting method executed in an abnormality detecting device detecting an abnormality of a target device, and includes: an index value acquisition step of acquiring a first index value associated with a first index and a second index value associated with a second index in an operation of the target device; and an abnormality detecting step of detecting an abnormality of the target device based on a distance from a predetermined reference curve to a point indicated by the first index value and the second index value on a two-dimensional plane with the first index and the second index being axes.
- an abnormality detecting program is an abnormality detecting program for causing a computer to function as the above abnormality detecting device, and causes a computer to function as the acquisition part and the abnormality detecting part.
- FIG. 1 is a view schematically showing a site where an abnormality detecting device 100 according to the present embodiment is used.
- the abnormality detecting device 100 is, for example, a device used at a production site to detect an abnormality of a target device 10.
- the abnormality detecting device 100 is realized by, for example, a PLC (programmable controller).
- the abnormality detecting device 100 may have a configuration that controls the operation of the target device 10.
- the abnormality detecting device 100 is connected to one or more target devices 10 via a network such as a field network or a local network.
- the target device 10 is, for example, a press machine driven by a servomotor as a power source.
- the press machine which is an example of the target device 10, rotates a servomotor 20, converts the rotational motion of the servomotor 20 into a linear motion by an actuator 15, and press-fits a press-fitting work 5b into a press-fitted work 5a via a press tool 12.
- the contact surface with the press-fitting work 5b wears.
- metal powder is generated, and at the time of press-fitting, if the metal powder is brought into a space between the press-fitting work 5b and the press-fitted work 5a, an abnormality of foreign matter biting, an abnormality in which the press tool cannot be pulled out, etc. occurs.
- the abnormality detecting device 100 has a function of collecting, learning, and monitoring data related to the operation of the target device 10. From the target device 10, the abnormality detecting device 100 acquires, for example, information such as a torque, a speed, and a position of the servomotor, information of a load applied to the press tool 12 measured by a load cell 16, and a sensor value (position) detected by a displacement sensor 11.
- the abnormality detecting device 100 acquires a first index value associated with a first index, e.g., a value related to a stage of the operation of the target device 10, and a second index value associated with a second index, e.g., a value related to a load of the operation of the target device 10, and with reference to these two index values, determines whether an abnormality occurs in the target device 10.
- a first index value associated with a first index e.g., a value related to a stage of the operation of the target device 10
- a second index value associated with a second index e.g., a value related to a load of the operation of the target device 10
- the abnormality detecting device 100 determines whether an abnormality occurs in the target device 10 based on a distance from a predetermined reference curve to a point indicated by the first index value and the second index value on a two-dimensional plane with the first index and the second index being axes.
- the abnormality detecting device 100 can monitor from the start of the machining operation to the end of the machining operation of the target device 10 and detect an abnormality sign at an early stage. Further, even in a situation in which the sensor value suddenly changes in the operation process of the target device 10, it is possible to appropriately determine whether an abnormality occurs. Further, by performing an abnormality determination using a value related to the stage of the operation of the target device 10 and a value related to the load of the operation of the target device 10, it is possible to appropriately perform an abnormality determination at each stage of the operation of the target device 10.
- FIG. 2 is a block diagram showing a main configuration of the abnormality detecting device 100.
- the abnormality detecting device 100 includes a communication part 101, a control part 110, and a storage part 120.
- the communication part 101 performs communication with the target device 10 via a network and executes transmission/reception of data.
- the communication part 101 is realized using, for example, an integrated circuit (IC) such as a communication IC.
- IC integrated circuit
- the communication part 101 performs communication with the target device 10 by wired communication or wireless communication.
- the control part 110 is a computation device having a function of comprehensively controlling each part of the abnormality detecting device 100.
- the control part 110 may control each part of the abnormality detecting device 100 by, for example, executing a program stored in one or more memories (e.g., a RAM or a ROM) by one or more processors (e.g., a CPU).
- memories e.g., a RAM or a ROM
- processors e.g., a CPU
- the storage part 120 stores various data used by the control part 110 and various software executed by the control part 110. Further, the storage part 120 stores data related to the operation of the target device 10 acquired and learned from the target device 10 by the control part 110.
- the control part 110 includes an acquisition part 111, a reference generation part 112, a scale normalization part 113, and an abnormality detecting part 114.
- the acquisition part 111 acquires a first index value associated with a first index and a second index value associated with a second index in the operation of the target device 10 via the communication part 101.
- the value of the first index and the value of the second index in the operation of the target device 10 are values related to a position, a torque, a load applied to the press tool 12 (a load applied to the press-fitting work 5b), etc. indicated by the servomotor 20, the displacement sensor 11, or the load cell 16 of the target device 10.
- the load applied to the press tool 12 may also be estimated from the torque of the servomotor 20.
- the reference generation part 112 collects the first index value and the second index value acquired by the acquisition part 111 from the target device 10, and generates a regression prediction model, which is a method of machine learning, for the collected first index value and second index value. From the result of machine learning, the reference generation part 112 sets a reference curve on a two-dimensional plane with the first index and the second index being axes.
- the reference curve represents a relationship between the first index value and the second index value in a normal state of the target device 10.
- the abnormality detecting device 100 may also acquire information indicating the reference curve in advance from outside.
- the first index value associated with the first index is a value related to the stage of the operation of the target device 10, and when the target device 10 is a servo press machine, the first index value is, for example, a value indicating a degree of progress in a series of press operation (a value indicating a percentage at which the process has progressed from the start to the end of a series of press operation, e.g., the position of the servomotor 20 or the position of the press tool 12), or an elapsed time from the start of a series of press operation.
- the second index value associated with the second index is a value related to a load of the target device 10.
- the first index value and the second index value are not limited to a value indicating a degree of progress in a series of press operation and a value related to a load (a load of the load cell) of the target device 10, but values such as the position, torque, and speed of the servomotor, and measured values associated with the target device 10 may be appropriately selected and used.
- the scale normalization part 113 individually normalizes each of the scale of the first index and the scale of the second index on the two-dimensional plane with the first index and the second index being axes. Based on the result of machine learning of the first index value and the second index value by the reference generation part 112, the scale normalization part 113 normalizes the scale of the first index and the scale of the second index.
- a reference curve may be set for the two-dimensional plane with the normalized scales. In this manner, by appropriately normalizing each index value and performing the abnormality determination, it is possible to appropriately perform the abnormality determination.
- FIG. 3 is a graph showing the first index value and the second index value in the press operation performed multiple times collected from the target device 10 which is a servo press machine, in which the first index (position) is the horizontal axis, and the second index (load) is the vertical axis.
- FIG. 4 a graph showing a reference curve set by the reference generation part 112 using the scales normalized by the scale normalization part 113 using the collected data shown in FIG. 3 .
- the reference curve set according to machine learning by the reference generation part 112 is, for example, a line graph.
- the horizontal axis shows a value (e.g., position) related to the stage of the operation of the target device 10, which is the first index value associated with the first index normalized by the scale normalization part 113
- the vertical axis shows a value related to the load, which is the second index value associated with the second index normalized by the scale normalization part 113.
- the reference curve may be, for example, a correlation diagram between the position of the servomotor and the load applied to the press tool, or a correlation diagram between the speed of the servomotor and the torque of the servomotor.
- the reference curve is, for example, a line graph which is a regression prediction model f(x) represented by (Formula 1) below.
- y ideal indicates the second index value on the reference curve.
- x norm indicates the normalized first index value. [Math. 1]
- y ideal f x norm
- the abnormality detecting part 114 detects an abnormality of the target device 10 based on a distance from the reference curve to a point indicated by the first index value and the second index value on the two-dimensional plane with the first index and the second index being axes.
- FIG. 5 is a view showing parameters related to the first index value associated with the first index and the second index value associated with the second index on the reference curve of the regression prediction model f(x).
- the horizontal axis is the first index (x) indicating the stage of the operation, and the vertical axis is the second index (y).
- the scale normalization part 113 first obtains x norm and y norm obtained by normalizing a measured value x act of the first index value and a measured value y act of the second index value acquired by the acquisition part 111, using (Formula 2) and (Formula 3) below.
- x norm x act ⁇ x min / x max ⁇ x min
- y norm y act ⁇ y min / y max ⁇ y min
- x min and y min may respectively be minimum values of the measured values x act and y act of the first index value and the second index value stored in the storage part 120, or minimum values of the first index value and the second index value on the reference curve.
- xmax and y max may respectively be maximum values of the measured values x act and y act of the first index value and the second index value stored in the storage part 120, or maximum values of the first index value and the second index value on the reference curve. Normalization is performed to match the scale of the first index and the scale of the second index.
- the abnormality detecting part 114 obtains y ideal for the normalized first index value x norm using (Formula 1).
- the abnormality detecting part 114 obtains xideai for the normalized second index value y norm using (Formula 4) below.
- x ideal indicates the first index value on the reference curve.
- g(y) is the inverse function of f(x).
- y ideal indicates the second index value (ideal value of the second index) when the first index value is x norm in the case where the target device 10 is normal.
- x ideal indicates the first index value (ideal value of the first index) when the second index value is y norm in the case where the target device 10 is normal. [Math. 4]
- x ideal g y norm
- the abnormality detecting part 114 obtains ⁇ x and ⁇ y which are deviations of the normalized first index value x norm and second index value y norm from their respective ideal values x ideal and y ideal using (Formula 5) and (Formula 6) below.
- ⁇ x x ideal ⁇ x norm
- ⁇ y y norm ⁇ y ideal
- the abnormality detecting part 114 calculates a distance ⁇ h from the reference curve to the point indicated by the first index value and the second index value according to (Formula 7) below using the deviations ⁇ x and ⁇ y of the first index value and the second index value deviating from the ideal values xideai and y ideal .
- ⁇ h h ⁇ x ⁇ y
- the abnormality detecting part 114 detects an abnormality of the target device 10 based on the distance ⁇ h from the predetermined reference curve to the point indicated by the first index value and the second index value on the two-dimensional plane with the first index and the second index being axes. Accordingly, even at a process position where the slope changes sharply on the reference curve, the abnormality detecting device 100 can appropriately perform abnormality detection, and can suppress determination that there is an abnormality even though an abnormality does not occur.
- FIG. 6 is a graph showing a reference curve based on the inverse regression prediction model g(y).
- the vertical axis is the first index (x) indicating the stage of the operation, and the horizontal axis is the second index (y).
- the reference curve is not limited to the configuration indicated by the regression prediction model f(x), but may also have a configuration indicated by the inverse regression prediction model g(y). Even when the reference curve is indicated by the inverse regression prediction model g(y), the abnormality detecting part 114 can calculate the distance ⁇ h from the reference curve to the point indicated by the first index value and the second index value according to the above method using (Formula 2) to (Formula 8).
- FIG. 7 is a view showing a time change of the distance ⁇ h.
- the horizontal axis is the time (first index), and the vertical axis is the distance ⁇ h.
- the abnormality detecting part 114 assigns a positive sign to the distance ⁇ h when the second index value (load) is on the large side with respect to the reference curve. Further, the abnormality detecting part 114 assigns a negative sign to the distance ⁇ h when the second index value is on the small side with respect to the reference curve. In this manner, the abnormality detecting part 114 switches the sign (positive or negative) assigned to the distance ⁇ h according to whether the second index value is on the large side or the small side with respect to the reference curve.
- the abnormality detecting part 114 determines whether an abnormality occurs in the target device 10.
- the abnormality detecting part 114 may also perform a determination on an abnormality based on an absolute value of the distance ⁇ h without distinguishing between the positive and negative.
- the abnormality detecting part 114 may have a different threshold value of the distance ⁇ h used for determining whether an abnormality occurs in the target device 10.
- the threshold value on the positive side and the absolute value of the threshold value on the negative side that indicate the boundary of the normal range associated with ⁇ h may be different.
- the abnormality detecting part 114 may select an appropriate threshold value according to the distance ⁇ h assigned with the positive/negative sign according to whether the second index value is on the side with a larger load or on the side with a smaller load with respect to the reference curve, to determine whether an abnormality occurs in the target device 10. Therefore, according to the configuration of the abnormality detecting part 114, it is possible to suppress an erroneous determination that an abnormality occurs even though an abnormality does not occur in the target device 10, and it is possible to appropriately perform an abnormality determination.
- FIG. 8 is a flowchart showing a flow of a reference curve generation process by the abnormality detecting device 100.
- the control part 110 of the abnormality detecting device 100 first acquires, by the function of the acquisition part 111, a first index value associated with a first index and a second index value associated with a second index from the target device 10 in the normal state via the communication part 101 (step S1).
- the control part 110 stores the first index value associated with the first index and the second index value associated with the second index acquired by the function of the acquisition part 111 to the storage part 120 (step S2).
- the control part 110 determines whether a series of machining operation such as a press-fitting process and a caulking process performed by the target device 10 has been completed (step S3). When the control part 110 determines that the series of machining operation performed by the target device 10 has been completed (YES in step S3), the process proceeds to step S4. When it is determined that the series of machining operation performed by the target device 10 has not been completed (NO in step S3), returning to step S1, the control part 110 continues the collection of the first index value associated with the first index and the second index value associated with the second index.
- control part 110 performs machine learning to generate a regression model for the first index value associated with the first index and the second index value associated with the second index related to the series of machining operation performed by the target device 10 that are stored in the storage part 120 (step S4).
- the control part 110 normalizes, by the function of the scale normalization part 113, the scales of the first index and the second index. Based on the scales normalized by the scale normalization part 113 and the result of machine learning, the reference generation part 112 sets a reference curve (normalized reference curve) associated with a series (one stroke from the start of operation to the completion of operation) of machining operation performed by the target device 10 (step S5).
- a reference curve normalized reference curve
- the control part 110 stores the set reference curve to the storage part 120. Further, the control part 110 presets a normal range associated with ⁇ h and stores it to the storage part 120. The normal range may also be inputted by a user.
- the abnormality detecting device 100 monitors, by the function of the abnormality detecting part 114, the machining operation performed by the target device 10, and detects when an abnormality occurs in the machining operation performed by the target device 10.
- FIG. 9 is a flowchart showing a flow of an abnormality detecting process by the abnormality detecting device 100.
- the control part 110 of the abnormality detecting device 100 acquires, by the function of the acquisition part 111, a first index value associated with the first index and a second index value associated with the second index from the target device 10 via the communication part 101 (step S12).
- the control part 110 normalizes, by the function of the scale normalization part 113, each of the first index value and the second index value acquired by the acquisition part 111 using (Formula 2) and (Formula 3) above (step S13).
- the scale normalization part 113 of the control part 110 normalizes each of the first index value and the second index value by using the maximum value and the minimum value on the reference curve before normalization.
- the control part 110 calculates, by the function of the abnormality detecting part 114, a deviation ⁇ x of the normalized index value x norm of the first index deviating from an ideal value x ideal , and a deviation ⁇ y of the normalized index value y norm of the second index deviating from an ideal value y ideal , using (Formula 5) and (Formula 6) above (step S14).
- the abnormality detecting part 114 calculates a distance ⁇ h from the reference curve to a point indicated by the first index value and the second index value on the two-dimensional plane according to (Formula 7) above using the deviation ⁇ x of the first index value and the deviation ⁇ y of the second index value (step S15).
- the control part 110 stores the distance ⁇ h to the storage part 120.
- the control part 110 determines, by the function of the abnormality detecting part 114, whether the distance ⁇ h is within a predetermined normal range corresponding to the sign (positive or negative) (step S16).
- the control part 110 determines by the abnormality detecting part 114 that the distance ⁇ h is within the normal range (YES in step S16)
- the process proceeds to step S18.
- the control part 110 determines by the abnormality detecting part 114 that the distance ⁇ h is outside the normal range (NO in step S16)
- the process proceeds to step S17.
- Flag represents an integration period (integration section) in which the distance ⁇ h is outside the normal range.
- the control part 110 determines whether the entirety of the series of operation performed by the target device 10 has been completed (step S18). The control part 110 may also determine whether the entirety of the series of operation performed by the target device 10 has been completed with reference to, for example, the index value of the first index, the index value of the second index, and the reference curve. Further, the control part 110 may also acquire information as to whether the entirety of the series of operation has been completed from, for example, the target device 10 via the acquisition part 111.
- step S18 determines that the entirety of the series of operation performed by the target device 10 has been completed (YES in step S18).
- the process proceeds to step S19.
- the control part 110 determines that the entirety of the series of operation performed by the target device 10 has not been completed (NO in step S18), returning to step S12, the process continues. Accordingly, during the series of operation of the target device 10, for example, at a predetermined time interval, the control part 110 continues the acquisition of the first index value associated with the first index and the second index value associated with the second index from the target device 10 via the communication part 101.
- the control part 110 calculates, by the function of the abnormality detecting part 114, a feature amount of ⁇ h in the entirety of the series of operation (step S19).
- the abnormality detecting part 114 may calculate a mean, a variance, or a standard deviation of the distance ⁇ h calculated during the series of operation performed by the target device 10 as the feature amount. Further, the abnormality detecting part 114 may also calculate a feature amount in a frequency distribution of the distance ⁇ h calculated during the series of machining operation performed by the target device 10.
- the frequency distribution of the distance ⁇ h during the machining operation of the target device 10 may be a histogram with the distance ⁇ h during the machining operation taken as a bin, and the abnormality detecting part 114 may also calculate a kurtosis or a skewness in the histogram as the feature amount in the frequency distribution of the distance ⁇ h during the machining operation.
- control part 110 determines, by the function of the abnormality detecting part 114, whether or not an abnormality occurs in the entirety of the series of operation of the target device 10 (step S20).
- the abnormality detecting part 114 may determine that an abnormality occurs in the entirety of the series of operation of the target device 10. Further, if the skewness of the histogram with the distance ⁇ h taken as a bin is larger than a predetermined threshold value, the abnormality detecting part 114 may determine that an abnormality occurs in the entirety of the series of operation of the target device 10. Further, if the mean, the variance, or the standard deviation of the distance ⁇ h is larger than a predetermined threshold value, the abnormality detecting part 114 may determine that an abnormality occurs in the entirety of the series of operation of the target device 10.
- the abnormality detecting part 114 may determine whether or not an abnormality occurs in the entirety of the series of operation of the target device 10. Even in the case where an abnormality of the target device 10 is suspected from the feature amount of the distance ⁇ h, the abnormality detecting part 114 may determine that an abnormality does not occur in the series of operation of the target device 10 if the count amount (Flag) of the abnormality detection flag remains at the initial value (0).
- the abnormality detecting part 114 may determine that an abnormality occurs in the series of operation of the target device 10 if the count amount (Flag) of the abnormality detection flag is larger than a predetermined value.
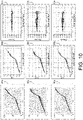
- FIG. 10 to FIG. 13 are views showing graphs corresponding to the first index value associated with the first index and the second index value associated with the second index collected when a series of operation is performed multiple times in the target device 10.
- Graphs 61a, 62a, and 63a of FIG. 10 are motion profiles showing the process of the operation of the target device 10 by the first index value (horizontal axis) and the second index value (vertical axis).
- Each of graphs 61b, 62b, and 63b of FIG. 10 is a graph obtained by respectively normalizing the first index value and the second index value of the graphs 61a, 62a, and 63a.
- FIG. 11 is a graph (the horizontal axis is the first index) showing a distribution of the distance ⁇ h from the reference curve to the point indicated by the normalized first index value and second index value respectively shown in the graphs 61b, 62b and 63b.
- Each of graphs 61d, 62d, and 63d of FIG. 11 is a histogram (the vertical axis is the distance ⁇ h, and the horizontal axis is the frequency) in which the distance ⁇ h respectively shown in the graphs 61c, 62c, and 63c is taken as a bin.
- the example shown in the graphs 61a, 61b, 61c, and 61d of FIG. 10 and FIG. 11 shows a case where it is determined that there is no abnormality as a result of performing an abnormality determination based on the distance ⁇ h as well as performing an abnormality determination based on the feature amount in the frequency distribution of the distance ⁇ h for the operation of the target device 10.
- the abnormality detecting part 114 does not detect an abnormality in the operation performed by the target device 10 (determining that there is no abnormality).
- the example shown in the graphs 62a, 62b, 62c, and 62d of FIG. 10 and FIG. 11 shows a case where the distance ⁇ h sometimes falls outside the range of the threshold value on the negative side in the process of the operation of the target device 10.
- the standard deviation in the frequency distribution of the distance ⁇ h may be within the predetermined range.
- the abnormality detecting part 114 can detect an abnormality in the operation performed by the target device 10 based on whether the kurtosis or the skewness of the histogram with the distance ⁇ h taken as a bin is within the predetermined range.
- the abnormality detecting part 114 may also be configured to detect an abnormality of the target device 10 at a time point when detecting that the distance ⁇ h falls outside the range of the threshold value on the negative side, or may also be configured to detect an abnormality of the target device 10 based on the standard deviation in the frequency distribution of the distance ⁇ h in the entirety of the series of operation and the kurtosis or the skewness of the histogram with the distance ⁇ h taken as a bin.
- the example shown in the graphs 63a, 63b, 63c, and 63d of FIG. 10 and FIG. 11 show a case where the distance ⁇ h sometimes falls outside the range of the threshold value on the positive side and the negative side in the process of the operation of the target device 10.
- the standard deviation in the frequency distribution of the distance ⁇ h may be within the predetermined range.
- the abnormality detecting part 114 can detect an abnormality in the operation performed by the target device 10 based on whether the kurtosis or the skewness of the histogram with the distance ⁇ h taken as a bin is within the predetermined range.
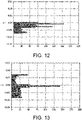
- FIG. 12 shows an example of a histogram (the vertical axis is the distance ⁇ h, and the horizontal axis is the frequency) of the distance ⁇ h in the target device 10 in which an abnormality occurs.
- the mean in the frequency distribution of the distance ⁇ h is well below 0 (the mean is less than the threshold value on the negative side).
- the abnormality detecting part 114 may detect an abnormality of the target device 10 according to whether a statistical value such as the mean in the frequency distribution of the distance ⁇ h is within a normal range.
- FIG. 13 shows another example of a histogram (the vertical axis is the distance ⁇ h, and the horizontal axis is the frequency) of the distance ⁇ h in the target device 10 in which an abnormality occurs.
- the standard deviation in the frequency distribution of the distance ⁇ h is larger than the threshold value.
- the abnormality detecting part 114 may detect an abnormality of the target device 10 according to whether a statistical value such as the standard deviation in the frequency distribution of the distance ⁇ h is within a normal range.
- the target device 10 is a press machine driven by a servomotor as a power source
- the target device 10 is not limited to a press machine, but may be any device driven by a servomotor as a power source, and it is also possible to appropriately detect an abnormality by the abnormality detecting device 100.
- the abnormality detecting process by the abnormality detecting device 100 is applicable not only to a servomotor but also to a stepping motor and other devices driven by a simple motor as a power source.
- the abnormality detecting process by the abnormality detecting device 100 is applicable not only to a motor but also to a device driven by a general actuator such as a hydraulic or pneumatic actuator as a power source.
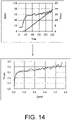
- FIG. 14 is a view showing a first index value associated with a first index, a second index value associated with a second index, and a reference curve in a case where the target device 10 is a device other than a press machine.
- the upper graph of FIG. 14 is a view showing measured values x act and y act of the rotation speed of the servomotor which is the first index value associated with the first index and the torque of the servomotor which is the second index value associated with the second index in a series of operation of the target device 10, with the horizontal axis being time.
- the lower graph of FIG. 14 a graph showing normalized first index value x norm and second index value y norm , and the reference curve on a two-dimensional plane with the first index being the x-axis and the second index being the y-axis.
- the target device 10 being any device driven by a servomotor as a power source, it is possible to detect an abnormality based on the distance ⁇ h between the reference curve and the point indicated by the normalized first index value x norm and second index value y norm on the two-dimensional plane with the first index being the x-axis and the second index being the y-axis.
- the control block (specifically, the acquisition part 111, the reference generation part 112, the scale normalization part 113, and the abnormality detecting part 114) of the abnormality detecting device 100 may be realized by a logic circuit (hardware) formed in an integrated circuit (IC chip) or the like, or may be realized by software.
- the abnormality detecting device 100 includes a computer executing commands of a program which is software realizing each function.
- the computer includes, for example, one or more processors and a computer-readable recording medium that stores the program. Then, in the computer, the objective of the present invention is achieved by the processor reading the program from the recording medium and executing the program.
- a processor for example, a CPU (central processing unit) may be used.
- the recording medium a "non-transitory tangible medium" such as a ROM (read only memory) and the like, a tape, a disk, a card, a semiconductor memory, a programmable logic circuit, etc. may be used. Further, a RAM (random access memory) or the like for developing the program may be further provided.
- the program may be supplied to the computer via an arbitrary transmission medium (communication network, broadcast wave, etc.) capable of transmitting the program.
- a transmission medium communication network, broadcast wave, etc.
- One aspect of the present invention may also be realized in the form of a data signal embedded in a carrier wave, in which the program is embodied by electronic transmission.
- an abnormality detecting device detecting an abnormality of a target device, and includes an acquisition part and an abnormality detecting part.
- the acquisition part acquires a first index value associated with a first index and a second index value associated with a second index in an operation of the target device.
- the abnormality detecting part detects an abnormality of the target device based on a distance from a predetermined reference curve to a point indicated by the first index value and the second index value on a two-dimensional plane with the first index and the second index being axes.
- an abnormality detecting method is an abnormality detecting method executed in an abnormality detecting device detecting an abnormality of a target device, and includes: an index value acquisition step of acquiring a first index value associated with a first index and a second index value associated with a second index in an operation of the target device; and an abnormality detecting step of detecting an abnormality of the target device based on a distance from a predetermined reference curve to a point indicated by the first index value and the second index value on a two-dimensional plane with the first index and the second index being axes.
- the first index value is a value related to a stage of the operation of the target device
- the second index value is a value related to a load of the operation of the target device
- the abnormality detecting device includes a scale normalization part that individually normalizes each of a scale of the first index value on the two-dimensional plane and a scale of the second index value on the two-dimensional plane.
- the abnormality detecting part switches a sign of positive and negative assigned to the distance according to whether the second index value is on a side with a large load or a side with a small load with respect to the reference curve, and detects an abnormality of the target device based on the distance assigned with the sign.
- the abnormality detecting part changes a threshold value of the distance from the reference curve, which is a threshold value used for determination on presence or absence of an abnormality of the target device, according to the sign assigned to the distance.
- the abnormality detecting part detects an abnormality of the target device based on a standard deviation of the distance during a machining operation.
- the abnormality detecting part detects an abnormality of the target device based on a feature amount in a frequency distribution of the distance during a machining operation.
- the feature amount in the frequency distribution is a kurtosis in a histogram in which the distance during the machining operation is taken as a bin.
- the feature amount in the frequency distribution is a skewness in a histogram in which the distance during the machining operation is taken as a bin.
- an abnormality detecting program is an abnormality detecting program for causing a computer to function as the above abnormality detecting device, and causes a computer to function as the acquisition part and the abnormality detecting part.
- the present invention is not limited to the above embodiments, and various changes may be made within the scope of the claims.
- the technical scope of the present invention also includes embodiments obtained by appropriately combining the technical means disclosed in the different embodiments.
Landscapes
- Engineering & Computer Science (AREA)
- Physics & Mathematics (AREA)
- General Physics & Mathematics (AREA)
- Automation & Control Theory (AREA)
- Data Mining & Analysis (AREA)
- Theoretical Computer Science (AREA)
- Evolutionary Computation (AREA)
- Artificial Intelligence (AREA)
- Mechanical Engineering (AREA)
- Evolutionary Biology (AREA)
- Computer Vision & Pattern Recognition (AREA)
- Bioinformatics & Computational Biology (AREA)
- General Engineering & Computer Science (AREA)
- Bioinformatics & Cheminformatics (AREA)
- Life Sciences & Earth Sciences (AREA)
- Mathematical Physics (AREA)
- Human Computer Interaction (AREA)
- Manufacturing & Machinery (AREA)
- Testing And Monitoring For Control Systems (AREA)
Abstract
Description
- The present invention relates to an abnormality detecting device, an abnormality detecting method, and an abnormality detecting program that detect an abnormality of a target device.
- Conventionally, a technique is known to detect a press abnormality based on a load waveform of a press load when pressing a work in a press system (see, for example, Patent Document 1).
- Further, a technique is known to control a motor by using a probability density function depending on the speed of a servomotor (see, for example, Patent Document 2).
- The technique described in
Patent Document 1 orPatent Document 2 determines whether an abnormality occurs according to whether a measured value of the device in a machining operation for machining the work is within the standard deviation. -
- [Patent Document 1]
Japanese Patent Laid-Open No. 2016-209885 - [Patent Document 2]
Japanese Patent Laid-Open No. 2006-158031 - In addition, in a target device using a servomotor as a power source, the prediction curve of the press load or the motor speed during the machining operation may sometimes have a steep part during the machining operation. In a case where whether an abnormality occurs is determined based on whether the measured value of the device in the machining operation is within the standard deviation as in the related art described above, when the prediction curve is steep, it is likely to determine that there is an abnormality even though no abnormality occurs.
- One aspect of the present invention has been made in view of the above circumstances, and an objective of the present invention is to provide a technique capable of appropriately performing an abnormality determination.
- To solve the above problems, an abnormality detecting device according to an aspect of the present invention is an abnormality detecting device detecting an abnormality of a target device, and includes an acquisition part and an abnormality detecting part. The acquisition part acquires a first index value associated with a first index and a second index value associated with a second index in an operation of the target device. The abnormality detecting part detects an abnormality of the target device based on a distance from a predetermined reference curve to a point indicated by the first index value and the second index value on a two-dimensional plane with the first index and the second index being axes.
- Further, to solve the above problems, an abnormality detecting method according to an aspect of the present invention is an abnormality detecting method executed in an abnormality detecting device detecting an abnormality of a target device, and includes: an index value acquisition step of acquiring a first index value associated with a first index and a second index value associated with a second index in an operation of the target device; and an abnormality detecting step of detecting an abnormality of the target device based on a distance from a predetermined reference curve to a point indicated by the first index value and the second index value on a two-dimensional plane with the first index and the second index being axes.
- Further, an abnormality detecting program according to an aspect of the present invention is an abnormality detecting program for causing a computer to function as the above abnormality detecting device, and causes a computer to function as the acquisition part and the abnormality detecting part.
- According to an aspect of the present invention, it is possible to appropriately perform an abnormality determination of a target device.
-
-
FIG. 1 is a view schematically showing a site where an abnormality detecting device according to the present embodiment is used. -
FIG. 2 is a block diagram showing a main configuration of the abnormality detecting device. -
FIG. 3 is a graph showing measured values of a first index value and a second index value. -
FIG. 4 is a graph showing a reference curve. -
FIG. 5 is a graph showing a reference curve based on a regression prediction model f(x). -
FIG. 6 is a graph showing a reference curve based on an inverse regression prediction model g(y). -
FIG. 7 is a view showing a time change of Δh. -
FIG. 8 is a flowchart showing a flow of a reference curve generation process by an abnormality detecting device. -
FIG. 9 is a flowchart showing a flow of an abnormality detecting process by the abnormality detecting device. -
FIG. 10 shows graphs related to a series of operation in a target device. -
FIG. 11 shows graphs related to a series of operation in a target device. -
FIG. 12 shows an example of a histogram of a distance Δh in a target device in which an abnormality occurs. -
FIG. 13 shows another example of a histogram of a distance Δh in a target device in which an abnormality occurs. -
FIG. 14 is a view showing a first index value, a second index value, and a reference curve related to a series of operation of a target device which is not a press machine. - Hereinafter, an embodiment (hereinafter also referred to as "the present embodiment") according to one aspect of the present invention will be described with reference to the drawings.
- An example of a situation in which the present invention is applied will be described with reference to
FIG. 1. FIG. 1 is a view schematically showing a site where anabnormality detecting device 100 according to the present embodiment is used. - As shown in
FIG. 1 , theabnormality detecting device 100 is, for example, a device used at a production site to detect an abnormality of atarget device 10. Theabnormality detecting device 100 is realized by, for example, a PLC (programmable controller). In a configuration in which theabnormality detecting device 100 is realized by a PLC, theabnormality detecting device 100 may have a configuration that controls the operation of thetarget device 10. Theabnormality detecting device 100 is connected to one ormore target devices 10 via a network such as a field network or a local network. - The
target device 10 is, for example, a press machine driven by a servomotor as a power source. The press machine, which is an example of thetarget device 10, rotates aservomotor 20, converts the rotational motion of theservomotor 20 into a linear motion by anactuator 15, and press-fits a press-fitting work 5b into a press-fittedwork 5a via apress tool 12. - When the
press tool 12 of the press machine performs press-fitting repeatedly, the contact surface with the press-fittingwork 5b wears. As the wearing of thepress tool 12 continues, metal powder is generated, and at the time of press-fitting, if the metal powder is brought into a space between the press-fittingwork 5b and the press-fittedwork 5a, an abnormality of foreign matter biting, an abnormality in which the press tool cannot be pulled out, etc. occurs. - The
abnormality detecting device 100 has a function of collecting, learning, and monitoring data related to the operation of thetarget device 10. From thetarget device 10, theabnormality detecting device 100 acquires, for example, information such as a torque, a speed, and a position of the servomotor, information of a load applied to thepress tool 12 measured by aload cell 16, and a sensor value (position) detected by adisplacement sensor 11. - Based on the data related to the operation of the
target device 10, theabnormality detecting device 100 acquires a first index value associated with a first index, e.g., a value related to a stage of the operation of thetarget device 10, and a second index value associated with a second index, e.g., a value related to a load of the operation of thetarget device 10, and with reference to these two index values, determines whether an abnormality occurs in thetarget device 10. - Specifically, the
abnormality detecting device 100 determines whether an abnormality occurs in thetarget device 10 based on a distance from a predetermined reference curve to a point indicated by the first index value and the second index value on a two-dimensional plane with the first index and the second index being axes. - Accordingly, the
abnormality detecting device 100 can monitor from the start of the machining operation to the end of the machining operation of thetarget device 10 and detect an abnormality sign at an early stage. Further, even in a situation in which the sensor value suddenly changes in the operation process of thetarget device 10, it is possible to appropriately determine whether an abnormality occurs. Further, by performing an abnormality determination using a value related to the stage of the operation of thetarget device 10 and a value related to the load of the operation of thetarget device 10, it is possible to appropriately perform an abnormality determination at each stage of the operation of thetarget device 10. - Hereinafter, an embodiment of the present invention will be described in detail.
-
FIG. 2 is a block diagram showing a main configuration of theabnormality detecting device 100. As shown inFIG. 2 , theabnormality detecting device 100 includes acommunication part 101, acontrol part 110, and astorage part 120. - The
communication part 101 performs communication with thetarget device 10 via a network and executes transmission/reception of data. Thecommunication part 101 is realized using, for example, an integrated circuit (IC) such as a communication IC. Thecommunication part 101 performs communication with thetarget device 10 by wired communication or wireless communication. - The
control part 110 is a computation device having a function of comprehensively controlling each part of theabnormality detecting device 100. Thecontrol part 110 may control each part of theabnormality detecting device 100 by, for example, executing a program stored in one or more memories (e.g., a RAM or a ROM) by one or more processors (e.g., a CPU). - The
storage part 120 stores various data used by thecontrol part 110 and various software executed by thecontrol part 110. Further, thestorage part 120 stores data related to the operation of thetarget device 10 acquired and learned from thetarget device 10 by thecontrol part 110. - The
control part 110 includes anacquisition part 111, a reference generation part 112, ascale normalization part 113, and anabnormality detecting part 114. - The
acquisition part 111 acquires a first index value associated with a first index and a second index value associated with a second index in the operation of thetarget device 10 via thecommunication part 101. The value of the first index and the value of the second index in the operation of thetarget device 10 are values related to a position, a torque, a load applied to the press tool 12 (a load applied to the press-fittingwork 5b), etc. indicated by theservomotor 20, thedisplacement sensor 11, or theload cell 16 of thetarget device 10. The load applied to thepress tool 12 may also be estimated from the torque of theservomotor 20. - The reference generation part 112 collects the first index value and the second index value acquired by the
acquisition part 111 from thetarget device 10, and generates a regression prediction model, which is a method of machine learning, for the collected first index value and second index value. From the result of machine learning, the reference generation part 112 sets a reference curve on a two-dimensional plane with the first index and the second index being axes. The reference curve represents a relationship between the first index value and the second index value in a normal state of thetarget device 10. Theabnormality detecting device 100 may also acquire information indicating the reference curve in advance from outside. - The first index value associated with the first index is a value related to the stage of the operation of the
target device 10, and when thetarget device 10 is a servo press machine, the first index value is, for example, a value indicating a degree of progress in a series of press operation (a value indicating a percentage at which the process has progressed from the start to the end of a series of press operation, e.g., the position of theservomotor 20 or the position of the press tool 12), or an elapsed time from the start of a series of press operation. The second index value associated with the second index is a value related to a load of thetarget device 10. - The first index value and the second index value are not limited to a value indicating a degree of progress in a series of press operation and a value related to a load (a load of the load cell) of the
target device 10, but values such as the position, torque, and speed of the servomotor, and measured values associated with thetarget device 10 may be appropriately selected and used. - The
scale normalization part 113 individually normalizes each of the scale of the first index and the scale of the second index on the two-dimensional plane with the first index and the second index being axes. Based on the result of machine learning of the first index value and the second index value by the reference generation part 112, thescale normalization part 113 normalizes the scale of the first index and the scale of the second index. A reference curve may be set for the two-dimensional plane with the normalized scales. In this manner, by appropriately normalizing each index value and performing the abnormality determination, it is possible to appropriately perform the abnormality determination. -
FIG. 3 is a graph showing the first index value and the second index value in the press operation performed multiple times collected from thetarget device 10 which is a servo press machine, in which the first index (position) is the horizontal axis, and the second index (load) is the vertical axis. -
FIG. 4 a graph showing a reference curve set by the reference generation part 112 using the scales normalized by thescale normalization part 113 using the collected data shown inFIG. 3 . As shown inFIG. 4 , the reference curve set according to machine learning by the reference generation part 112 is, for example, a line graph. In the reference curve, the horizontal axis shows a value (e.g., position) related to the stage of the operation of thetarget device 10, which is the first index value associated with the first index normalized by thescale normalization part 113, and the vertical axis shows a value related to the load, which is the second index value associated with the second index normalized by thescale normalization part 113. The reference curve may be, for example, a correlation diagram between the position of the servomotor and the load applied to the press tool, or a correlation diagram between the speed of the servomotor and the torque of the servomotor. - The reference curve is, for example, a line graph which is a regression prediction model f(x) represented by (Formula 1) below. yideal indicates the second index value on the reference curve. xnorm indicates the normalized first index value.
[Math. 1]
- The
abnormality detecting part 114 detects an abnormality of thetarget device 10 based on a distance from the reference curve to a point indicated by the first index value and the second index value on the two-dimensional plane with the first index and the second index being axes. -
FIG. 5 is a view showing parameters related to the first index value associated with the first index and the second index value associated with the second index on the reference curve of the regression prediction model f(x). The horizontal axis is the first index (x) indicating the stage of the operation, and the vertical axis is the second index (y). - The
scale normalization part 113 first obtains xnorm and ynorm obtained by normalizing a measured value xact of the first index value and a measured value yact of the second index value acquired by theacquisition part 111, using (Formula 2) and (Formula 3) below.
[Math. 2]

- Herein, xmin and ymin may respectively be minimum values of the measured values xact and yact of the first index value and the second index value stored in the
storage part 120, or minimum values of the first index value and the second index value on the reference curve. Further, xmax and ymax may respectively be maximum values of the measured values xact and yact of the first index value and the second index value stored in thestorage part 120, or maximum values of the first index value and the second index value on the reference curve. Normalization is performed to match the scale of the first index and the scale of the second index. - Subsequently, the
abnormality detecting part 114 obtains yideal for the normalized first index value xnorm using (Formula 1). Theabnormality detecting part 114 obtains xideai for the normalized second index value ynorm using (Formula 4) below. xideal indicates the first index value on the reference curve. g(y) is the inverse function of f(x). yideal indicates the second index value (ideal value of the second index) when the first index value is xnorm in the case where thetarget device 10 is normal. xideal indicates the first index value (ideal value of the first index) when the second index value is ynorm in the case where thetarget device 10 is normal.
[Math. 4]
- Next, the
abnormality detecting part 114 obtains Δx and Δy which are deviations of the normalized first index value xnorm and second index value ynorm from their respective ideal values xideal and yideal using (Formula 5) and (Formula 6) below.
[Math. 5]

- The
abnormality detecting part 114 calculates a distance Δh from the reference curve to the point indicated by the first index value and the second index value according to (Formula 7) below using the deviations Δx and Δy of the first index value and the second index value deviating from the ideal values xideai and yideal.
[Math. 7]
- In addition, for example, when Δy is a predetermined value ε or less, or when |Δy| is a predetermined value ε or less, Δh = 0 and the error from the reference curve may be ignored.
- In this manner, the
abnormality detecting part 114 detects an abnormality of thetarget device 10 based on the distance Δh from the predetermined reference curve to the point indicated by the first index value and the second index value on the two-dimensional plane with the first index and the second index being axes. Accordingly, even at a process position where the slope changes sharply on the reference curve, theabnormality detecting device 100 can appropriately perform abnormality detection, and can suppress determination that there is an abnormality even though an abnormality does not occur. -
FIG. 6 is a graph showing a reference curve based on the inverse regression prediction model g(y). The vertical axis is the first index (x) indicating the stage of the operation, and the horizontal axis is the second index (y). As shown inFIG. 6 , the reference curve is not limited to the configuration indicated by the regression prediction model f(x), but may also have a configuration indicated by the inverse regression prediction model g(y). Even when the reference curve is indicated by the inverse regression prediction model g(y), theabnormality detecting part 114 can calculate the distance Δh from the reference curve to the point indicated by the first index value and the second index value according to the above method using (Formula 2) to (Formula 8). -
FIG. 7 is a view showing a time change of the distance Δh. The horizontal axis is the time (first index), and the vertical axis is the distance Δh. As shown inFIG. 7 , theabnormality detecting part 114 assigns a positive sign to the distance Δh when the second index value (load) is on the large side with respect to the reference curve. Further, theabnormality detecting part 114 assigns a negative sign to the distance Δh when the second index value is on the small side with respect to the reference curve. In this manner, theabnormality detecting part 114 switches the sign (positive or negative) assigned to the distance Δh according to whether the second index value is on the large side or the small side with respect to the reference curve. Based on whether the distance Δh assigned with the positive/negative sign is within a predetermined normal range (normal range), theabnormality detecting part 114 determines whether an abnormality occurs in thetarget device 10. Theabnormality detecting part 114 may also perform a determination on an abnormality based on an absolute value of the distance Δh without distinguishing between the positive and negative. - In addition, depending on the type of the
target device 10, for example, when the second index value (load) is on the large side with respect to the reference curve, it may be considered that the possibility of abnormality is higher than when the second index value is on the small side with respect to the reference curve. Therefore, according to the sign (positive or negative) assigned to the distance Δh, theabnormality detecting part 114 may have a different threshold value of the distance Δh used for determining whether an abnormality occurs in thetarget device 10. In other words, the threshold value on the positive side and the absolute value of the threshold value on the negative side that indicate the boundary of the normal range associated with Δh may be different. - In this manner, instead of the absolute value of the distance Δh from the reference curve to the point indicated by the first index value and the second index value, the
abnormality detecting part 114 may select an appropriate threshold value according to the distance Δh assigned with the positive/negative sign according to whether the second index value is on the side with a larger load or on the side with a smaller load with respect to the reference curve, to determine whether an abnormality occurs in thetarget device 10. Therefore, according to the configuration of theabnormality detecting part 114, it is possible to suppress an erroneous determination that an abnormality occurs even though an abnormality does not occur in thetarget device 10, and it is possible to appropriately perform an abnormality determination. -
FIG. 8 is a flowchart showing a flow of a reference curve generation process by theabnormality detecting device 100. - In the reference curve generation process, the
control part 110 of theabnormality detecting device 100 first acquires, by the function of theacquisition part 111, a first index value associated with a first index and a second index value associated with a second index from thetarget device 10 in the normal state via the communication part 101 (step S1). - The
control part 110 stores the first index value associated with the first index and the second index value associated with the second index acquired by the function of theacquisition part 111 to the storage part 120 (step S2). - The
control part 110 determines whether a series of machining operation such as a press-fitting process and a caulking process performed by thetarget device 10 has been completed (step S3). When thecontrol part 110 determines that the series of machining operation performed by thetarget device 10 has been completed (YES in step S3), the process proceeds to step S4. When it is determined that the series of machining operation performed by thetarget device 10 has not been completed (NO in step S3), returning to step S1, thecontrol part 110 continues the collection of the first index value associated with the first index and the second index value associated with the second index. - By the function of the reference generation part 112, the
control part 110 performs machine learning to generate a regression model for the first index value associated with the first index and the second index value associated with the second index related to the series of machining operation performed by thetarget device 10 that are stored in the storage part 120 (step S4). - With reference to the result of machine learning by the reference generation part 112, the
control part 110 normalizes, by the function of thescale normalization part 113, the scales of the first index and the second index. Based on the scales normalized by thescale normalization part 113 and the result of machine learning, the reference generation part 112 sets a reference curve (normalized reference curve) associated with a series (one stroke from the start of operation to the completion of operation) of machining operation performed by the target device 10 (step S5). - The
control part 110 stores the set reference curve to thestorage part 120. Further, thecontrol part 110 presets a normal range associated with Δh and stores it to thestorage part 120. The normal range may also be inputted by a user. - With reference to the reference curve set in step S5, the
abnormality detecting device 100 monitors, by the function of theabnormality detecting part 114, the machining operation performed by thetarget device 10, and detects when an abnormality occurs in the machining operation performed by thetarget device 10. -
FIG. 9 is a flowchart showing a flow of an abnormality detecting process by theabnormality detecting device 100. - The
abnormality detecting device 100 initializes an abnormality detection flag (Flag) (Flag = 0) at a start timing of a series of operation in the machining operation of the target device 10 (step S11). - During the operation of the
target device 10, thecontrol part 110 of theabnormality detecting device 100 acquires, by the function of theacquisition part 111, a first index value associated with the first index and a second index value associated with the second index from thetarget device 10 via the communication part 101 (step S12). - The
control part 110 normalizes, by the function of thescale normalization part 113, each of the first index value and the second index value acquired by theacquisition part 111 using (Formula 2) and (Formula 3) above (step S13). Herein, thescale normalization part 113 of thecontrol part 110 normalizes each of the first index value and the second index value by using the maximum value and the minimum value on the reference curve before normalization. - The
control part 110 calculates, by the function of theabnormality detecting part 114, a deviation Δx of the normalized index value xnorm of the first index deviating from an ideal value xideal, and a deviation Δy of the normalized index value ynorm of the second index deviating from an ideal value yideal, using (Formula 5) and (Formula 6) above (step S14). - The
abnormality detecting part 114 calculates a distance Δh from the reference curve to a point indicated by the first index value and the second index value on the two-dimensional plane according to (Formula 7) above using the deviation Δx of the first index value and the deviation Δy of the second index value (step S15). - The
control part 110 stores the distance Δh to thestorage part 120. - Subsequently, the
control part 110 determines, by the function of theabnormality detecting part 114, whether the distance Δh is within a predetermined normal range corresponding to the sign (positive or negative) (step S16). When thecontrol part 110 determines by theabnormality detecting part 114 that the distance Δh is within the normal range (YES in step S16), the process proceeds to step S18. When thecontrol part 110 determines by theabnormality detecting part 114 that the distance Δh is outside the normal range (NO in step S16), the process proceeds to step S17. - When the distance Δh is outside the normal range, the
control part 110 detects that an abnormality occurs in thetarget device 10 and counts up the abnormality detection flag (Flag) (Flag = Flag + 1), and the process proceeds to step S18 (step S17). "Flag" represents an integration period (integration section) in which the distance Δh is outside the normal range. - When it is determined in step S16 that the distance Δh is within the normal range, the
control part 110 determines whether the entirety of the series of operation performed by thetarget device 10 has been completed (step S18). Thecontrol part 110 may also determine whether the entirety of the series of operation performed by thetarget device 10 has been completed with reference to, for example, the index value of the first index, the index value of the second index, and the reference curve. Further, thecontrol part 110 may also acquire information as to whether the entirety of the series of operation has been completed from, for example, thetarget device 10 via theacquisition part 111. - When the
control part 110 determines that the entirety of the series of operation performed by thetarget device 10 has been completed (YES in step S18), the process proceeds to step S19. When thecontrol part 110 determines that the entirety of the series of operation performed by thetarget device 10 has not been completed (NO in step S18), returning to step S12, the process continues. Accordingly, during the series of operation of thetarget device 10, for example, at a predetermined time interval, thecontrol part 110 continues the acquisition of the first index value associated with the first index and the second index value associated with the second index from thetarget device 10 via thecommunication part 101. - When the entirety of the series of operation performed by the
target device 10 is completed, thecontrol part 110 calculates, by the function of theabnormality detecting part 114, a feature amount of Δh in the entirety of the series of operation (step S19). Theabnormality detecting part 114 may calculate a mean, a variance, or a standard deviation of the distance Δh calculated during the series of operation performed by thetarget device 10 as the feature amount. Further, theabnormality detecting part 114 may also calculate a feature amount in a frequency distribution of the distance Δh calculated during the series of machining operation performed by thetarget device 10. Herein, the frequency distribution of the distance Δh during the machining operation of thetarget device 10 may be a histogram with the distance Δh during the machining operation taken as a bin, and theabnormality detecting part 114 may also calculate a kurtosis or a skewness in the histogram as the feature amount in the frequency distribution of the distance Δh during the machining operation. - Based on the feature amount of the distance Δh during the series of operation performed by the
target device 10, thecontrol part 110 determines, by the function of theabnormality detecting part 114, whether or not an abnormality occurs in the entirety of the series of operation of the target device 10 (step S20). - For example, if the kurtosis in the histogram with the distance Δh taken as a bin is smaller than a predetermined threshold value, the
abnormality detecting part 114 may determine that an abnormality occurs in the entirety of the series of operation of thetarget device 10. Further, if the skewness of the histogram with the distance Δh taken as a bin is larger than a predetermined threshold value, theabnormality detecting part 114 may determine that an abnormality occurs in the entirety of the series of operation of thetarget device 10. Further, if the mean, the variance, or the standard deviation of the distance Δh is larger than a predetermined threshold value, theabnormality detecting part 114 may determine that an abnormality occurs in the entirety of the series of operation of thetarget device 10. - Further, based on the feature amount of the distance Δh and the count amount of the abnormality detection flag, the
abnormality detecting part 114 may determine whether or not an abnormality occurs in the entirety of the series of operation of thetarget device 10. Even in the case where an abnormality of thetarget device 10 is suspected from the feature amount of the distance Δh, theabnormality detecting part 114 may determine that an abnormality does not occur in the series of operation of thetarget device 10 if the count amount (Flag) of the abnormality detection flag remains at the initial value (0). Further, even in the case where it is not determined that an abnormality occurs in thetarget device 10 from the feature amount of the distance Δh, theabnormality detecting part 114 may determine that an abnormality occurs in the series of operation of thetarget device 10 if the count amount (Flag) of the abnormality detection flag is larger than a predetermined value. -
FIG. 10 to FIG. 13 are views showing graphs corresponding to the first index value associated with the first index and the second index value associated with the second index collected when a series of operation is performed multiple times in thetarget device 10. -
Graphs FIG. 10 are motion profiles showing the process of the operation of thetarget device 10 by the first index value (horizontal axis) and the second index value (vertical axis). Each ofgraphs FIG. 10 is a graph obtained by respectively normalizing the first index value and the second index value of thegraphs graphs FIG. 10 andFIG. 11 is a graph (the horizontal axis is the first index) showing a distribution of the distance Δh from the reference curve to the point indicated by the normalized first index value and second index value respectively shown in thegraphs graphs FIG. 11 is a histogram (the vertical axis is the distance Δh, and the horizontal axis is the frequency) in which the distance Δh respectively shown in thegraphs - The example shown in the
graphs FIG. 10 andFIG. 11 shows a case where it is determined that there is no abnormality as a result of performing an abnormality determination based on the distance Δh as well as performing an abnormality determination based on the feature amount in the frequency distribution of the distance Δh for the operation of thetarget device 10. As shown in thegraphs abnormality detecting part 114 does not detect an abnormality in the operation performed by the target device 10 (determining that there is no abnormality). - The example shown in the
graphs FIG. 10 andFIG. 11 shows a case where the distance Δh sometimes falls outside the range of the threshold value on the negative side in the process of the operation of thetarget device 10. As shown in thegraphs abnormality detecting part 114 can detect an abnormality in the operation performed by thetarget device 10 based on whether the kurtosis or the skewness of the histogram with the distance Δh taken as a bin is within the predetermined range. - The
abnormality detecting part 114 may also be configured to detect an abnormality of thetarget device 10 at a time point when detecting that the distance Δh falls outside the range of the threshold value on the negative side, or may also be configured to detect an abnormality of thetarget device 10 based on the standard deviation in the frequency distribution of the distance Δh in the entirety of the series of operation and the kurtosis or the skewness of the histogram with the distance Δh taken as a bin. - The example shown in the
graphs FIG. 10 andFIG. 11 show a case where the distance Δh sometimes falls outside the range of the threshold value on the positive side and the negative side in the process of the operation of thetarget device 10. As shown in thegraphs abnormality detecting part 114 can detect an abnormality in the operation performed by thetarget device 10 based on whether the kurtosis or the skewness of the histogram with the distance Δh taken as a bin is within the predetermined range. -
FIG. 12 shows an example of a histogram (the vertical axis is the distance Δh, and the horizontal axis is the frequency) of the distance Δh in thetarget device 10 in which an abnormality occurs. In the example shown inFIG. 12 , the mean in the frequency distribution of the distance Δh is well below 0 (the mean is less than the threshold value on the negative side). Theabnormality detecting part 114 may detect an abnormality of thetarget device 10 according to whether a statistical value such as the mean in the frequency distribution of the distance Δh is within a normal range. -
FIG. 13 shows another example of a histogram (the vertical axis is the distance Δh, and the horizontal axis is the frequency) of the distance Δh in thetarget device 10 in which an abnormality occurs. In the example shown inFIG. 13 , the standard deviation in the frequency distribution of the distance Δh is larger than the threshold value. Theabnormality detecting part 114 may detect an abnormality of thetarget device 10 according to whether a statistical value such as the standard deviation in the frequency distribution of the distance Δh is within a normal range. - In the above description, the case where the
target device 10 is a press machine driven by a servomotor as a power source has been taken as an example. However, thetarget device 10 is not limited to a press machine, but may be any device driven by a servomotor as a power source, and it is also possible to appropriately detect an abnormality by theabnormality detecting device 100. Further, the abnormality detecting process by theabnormality detecting device 100 is applicable not only to a servomotor but also to a stepping motor and other devices driven by a simple motor as a power source. Further, the abnormality detecting process by theabnormality detecting device 100 is applicable not only to a motor but also to a device driven by a general actuator such as a hydraulic or pneumatic actuator as a power source. -
FIG. 14 is a view showing a first index value associated with a first index, a second index value associated with a second index, and a reference curve in a case where thetarget device 10 is a device other than a press machine. The upper graph ofFIG. 14 is a view showing measured values xact and yact of the rotation speed of the servomotor which is the first index value associated with the first index and the torque of the servomotor which is the second index value associated with the second index in a series of operation of thetarget device 10, with the horizontal axis being time. The lower graph ofFIG. 14 a graph showing normalized first index value xnorm and second index value ynorm, and the reference curve on a two-dimensional plane with the first index being the x-axis and the second index being the y-axis. - In this manner, with the
target device 10 being any device driven by a servomotor as a power source, it is possible to detect an abnormality based on the distance Δh between the reference curve and the point indicated by the normalized first index value xnorm and second index value ynorm on the two-dimensional plane with the first index being the x-axis and the second index being the y-axis. - The control block (specifically, the
acquisition part 111, the reference generation part 112, thescale normalization part 113, and the abnormality detecting part 114) of theabnormality detecting device 100 may be realized by a logic circuit (hardware) formed in an integrated circuit (IC chip) or the like, or may be realized by software. - In the latter case, the
abnormality detecting device 100 includes a computer executing commands of a program which is software realizing each function. The computer includes, for example, one or more processors and a computer-readable recording medium that stores the program. Then, in the computer, the objective of the present invention is achieved by the processor reading the program from the recording medium and executing the program. As the processor, for example, a CPU (central processing unit) may be used. As the recording medium, a "non-transitory tangible medium" such as a ROM (read only memory) and the like, a tape, a disk, a card, a semiconductor memory, a programmable logic circuit, etc. may be used. Further, a RAM (random access memory) or the like for developing the program may be further provided. Further, the program may be supplied to the computer via an arbitrary transmission medium (communication network, broadcast wave, etc.) capable of transmitting the program. One aspect of the present invention may also be realized in the form of a data signal embedded in a carrier wave, in which the program is embodied by electronic transmission. - To solve the above problems, an abnormality detecting device according to an aspect of the present invention is an abnormality detecting device detecting an abnormality of a target device, and includes an acquisition part and an abnormality detecting part. The acquisition part acquires a first index value associated with a first index and a second index value associated with a second index in an operation of the target device. The abnormality detecting part detects an abnormality of the target device based on a distance from a predetermined reference curve to a point indicated by the first index value and the second index value on a two-dimensional plane with the first index and the second index being axes.
- Further, to solve the above problems, an abnormality detecting method according to an aspect of the present invention is an abnormality detecting method executed in an abnormality detecting device detecting an abnormality of a target device, and includes: an index value acquisition step of acquiring a first index value associated with a first index and a second index value associated with a second index in an operation of the target device; and an abnormality detecting step of detecting an abnormality of the target device based on a distance from a predetermined reference curve to a point indicated by the first index value and the second index value on a two-dimensional plane with the first index and the second index being axes.
- According to the above configuration, it is possible to appropriately perform an abnormality determination in the operation process of the target device.
- Further, in the abnormality detecting device according to an aspect of the present invention, the first index value is a value related to a stage of the operation of the target device, and the second index value is a value related to a load of the operation of the target device.
- According to the above configuration, it is possible to appropriately perform an abnormality determination at each stage of the operation of the target device.
- Further, the abnormality detecting device according to an aspect of the present invention includes a scale normalization part that individually normalizes each of a scale of the first index value on the two-dimensional plane and a scale of the second index value on the two-dimensional plane.
- According to the above configuration, since each index value is appropriately normalized to perform the abnormality determination, it is possible to appropriately perform the abnormality determination.
- Further, in the abnormality detecting device according to an aspect of the present invention, the abnormality detecting part the abnormality detecting part switches a sign of positive and negative assigned to the distance according to whether the second index value is on a side with a large load or a side with a small load with respect to the reference curve, and detects an abnormality of the target device based on the distance assigned with the sign.
- According to the above configuration, it is also possible to appropriately perform an abnormality determination in a case where there is no abnormality even if the index value is smaller than the reference curve to some extent, but there is a high possibility of abnormality when the index value is higher than the reference curve.
- Further, in the abnormality detecting device according to an aspect of the present invention, the abnormality detecting part changes a threshold value of the distance from the reference curve, which is a threshold value used for determination on presence or absence of an abnormality of the target device, according to the sign assigned to the distance.
- According to the above configuration, it is possible to appropriately perform an abnormality determination even if the determination on presence or absence of an abnormality differs depending on the sign (positive or negative) of the distance.
- Further, in the abnormality detecting device according to an aspect of the present invention, the abnormality detecting part detects an abnormality of the target device based on a standard deviation of the distance during a machining operation.
- Further, in the abnormality detecting device according to an aspect of the present invention, the abnormality detecting part detects an abnormality of the target device based on a feature amount in a frequency distribution of the distance during a machining operation.
- Further, in the abnormality detecting device according to an aspect of the present invention, the feature amount in the frequency distribution is a kurtosis in a histogram in which the distance during the machining operation is taken as a bin.
- Further, in the abnormality detecting device according to an aspect of the present invention, the feature amount in the frequency distribution is a skewness in a histogram in which the distance during the machining operation is taken as a bin.
- Further, an abnormality detecting program according to an aspect of the present invention is an abnormality detecting program for causing a computer to function as the above abnormality detecting device, and causes a computer to function as the acquisition part and the abnormality detecting part.
- The present invention is not limited to the above embodiments, and various changes may be made within the scope of the claims. The technical scope of the present invention also includes embodiments obtained by appropriately combining the technical means disclosed in the different embodiments.
-
- 10
- target device
- 20
- servo motor
- 100
- abnormality detecting device
- 110
- control part
- 111
- acquisition part
- 112
- reference generation part
- 113
- scale normalization part
- 114
- abnormality detecting part
- 120
- storage part
Claims (11)
- An abnormality detecting device which detects an abnormality of a target device, the abnormality detecting device comprising:an acquisition part that acquires a first index value associated with a first index and a second index value associated with a second index in an operation of the target device; andan abnormality detecting part that detects an abnormality of the target device based on a distance from a predetermined reference curve to a point indicated by the first index value and the second index value on a two-dimensional plane with the first index and the second index being axes.
- The abnormality detecting device according to claim 1, wherein the first index value is a value related to a stage of the operation of the target device, and
the second index value is a value related to a load of the operation of the target device. - The abnormality detecting device according to claim 1 or 2, comprising:
a scale normalization part that individually normalizes each of a scale of the first index value on the two-dimensional plane and a scale of the second index value on the two-dimensional plane. - The abnormality detecting device according to claim 2 or 3, wherein the abnormality detecting part switches a sign of positive and negative assigned to the distance according to whether the second index value is on a side with a large load or a side with a small load with respect to the reference curve, and detects an abnormality of the target device based on the distance assigned with the sign.
- The abnormality detecting device according to claim 4, wherein the abnormality detecting part changes a threshold value of the distance from the reference curve, which is a threshold value used for determination on presence or absence of an abnormality of the target device, according to the sign assigned to the distance.
- The abnormality detecting device according to any one of claims 1 to 5, wherein the abnormality detecting part detects an abnormality of the target device based on a standard deviation of the distance during a machining operation of the target device.
- The abnormality detecting device according to any one of claims 1 to 5, wherein the abnormality detecting part detects an abnormality of the target device based on a feature amount in a frequency distribution of the distance during a machining operation of the target device.
- The abnormality detecting device according to claim 7, wherein the feature amount in the frequency distribution is a kurtosis in a histogram in which the distance during the machining operation of the target device is taken as a bin.
- The abnormality detecting device according to claim 7, wherein the feature amount in the frequency distribution is a skewness in a histogram in which the distance during the machining operation of the target device is taken as a bin.
- An abnormality detecting method executed in an abnormality detecting device which detects an abnormality of a target device, the abnormality detecting method comprising:an index value acquisition step of acquiring a first index value associated with a first index and a second index value associated with a second index in an operation of the target device; andan abnormality detecting step of detecting an abnormality of the target device based on a distance from a predetermined reference curve to a point indicated by the first index value and the second index value on a two-dimensional plane with the first index and the second index being axes.
- An abnormality detecting program for causing a computer to function as the abnormality detecting device according to claim 1, wherein the abnormality detecting program causes a computer to function as the acquisition part and the abnormality detecting part.
Applications Claiming Priority (2)
| Application Number | Priority Date | Filing Date | Title |
|---|---|---|---|
| JP2019135695A JP7367366B2 (en) | 2019-07-23 | 2019-07-23 | Anomaly detection device, anomaly detection method, and anomaly detection program |
| PCT/JP2020/008498 WO2021014670A1 (en) | 2019-07-23 | 2020-02-28 | Abnormality detecting device, abnormality detecting method, and abnormality detecting program |
Publications (3)
| Publication Number | Publication Date |
|---|---|
| EP4005785A1 true EP4005785A1 (en) | 2022-06-01 |
| EP4005785A4 EP4005785A4 (en) | 2023-07-26 |
| EP4005785B1 EP4005785B1 (en) | 2025-03-19 |
Family
ID=74192721
Family Applications (1)
| Application Number | Title | Priority Date | Filing Date |
|---|---|---|---|
| EP20844882.9A Active EP4005785B1 (en) | 2019-07-23 | 2020-02-28 | Abnormality detecting device, abnormality detecting method, and abnormality detecting program |
Country Status (5)
| Country | Link |
|---|---|
| US (1) | US12276975B2 (en) |
| EP (1) | EP4005785B1 (en) |
| JP (1) | JP7367366B2 (en) |
| CN (1) | CN113924207B (en) |
| WO (1) | WO2021014670A1 (en) |
Families Citing this family (7)
| Publication number | Priority date | Publication date | Assignee | Title |
|---|---|---|---|---|
| JP7759583B2 (en) * | 2021-03-04 | 2025-10-24 | パナソニックIpマネジメント株式会社 | Method for generating learned judgment criteria, method for generating press working result judger, method for estimating press working result, device for generating learned judgment criteria, and press working result judger |
| JP7347468B2 (en) * | 2021-03-26 | 2023-09-20 | 横河電機株式会社 | Apparatus, method and program |
| CN113884889B (en) * | 2021-10-29 | 2024-04-26 | 章鱼博士智能技术(上海)有限公司 | Method and device for battery safety pre-warning, storage medium and electronic equipment |
| US12072251B2 (en) * | 2022-03-01 | 2024-08-27 | Asmpt Singapore Pte. Ltd. | Force measurement device and method for bonding or encapsulation process and apparatus incorporating the device |
| WO2023233926A1 (en) * | 2022-06-03 | 2023-12-07 | オムロン株式会社 | Abnormality sign detection device, detection method of abnormality sign, and program |
| JP7746237B2 (en) * | 2022-08-25 | 2025-09-30 | 株式会社栗本鐵工所 | Measurement waveform display device and program |
| JP2024112670A (en) | 2023-02-08 | 2024-08-21 | オムロン株式会社 | Work analysis device, work analysis system, work analysis method, and program |
Family Cites Families (15)
| Publication number | Priority date | Publication date | Assignee | Title |
|---|---|---|---|---|
| US5119311A (en) | 1988-07-14 | 1992-06-02 | Coors Brewing Company | Monitor and control assembly for use with a can end press |
| JP3231536B2 (en) * | 1993-02-25 | 2001-11-26 | トヨタ自動車株式会社 | Diagnosis method of press machine abnormality |
| JP3996428B2 (en) * | 2001-12-25 | 2007-10-24 | 松下電器産業株式会社 | Abnormality detection device and abnormality detection system |
| JP4431415B2 (en) * | 2004-02-12 | 2010-03-17 | 株式会社リコー | Abnormality diagnosis method, state determination apparatus, and image forming apparatus |
| JP4250552B2 (en) * | 2004-03-03 | 2009-04-08 | 株式会社東芝 | Manufacturing apparatus management system, manufacturing apparatus management method, and program |
| JP2006158031A (en) | 2004-11-26 | 2006-06-15 | Yaskawa Electric Corp | Motor control device and control method thereof |
| JP4769983B2 (en) * | 2007-05-17 | 2011-09-07 | 独立行政法人産業技術総合研究所 | Abnormality detection apparatus and abnormality detection method |
| ES2513666T3 (en) * | 2011-04-14 | 2014-10-27 | Koninklijke Philips N.V. | Device and method of stress measurement |
| JP6326321B2 (en) * | 2014-08-07 | 2018-05-16 | 株式会社日立製作所 | Data display system |
| JP6492555B2 (en) | 2014-11-07 | 2019-04-03 | 株式会社Ihi | Abnormality diagnosis method, abnormality diagnosis device, and abnormality diagnosis program |
| ES2732473T3 (en) | 2015-02-16 | 2019-11-22 | Siemens Ag | Device and diagnostic procedure for monitoring the operation of a control loop |
| JP6585374B2 (en) * | 2015-04-30 | 2019-10-02 | コマツ産機株式会社 | Press system and control method of press system |
| JP6895816B2 (en) | 2017-06-15 | 2021-06-30 | 株式会社 日立産業制御ソリューションズ | Abnormality diagnosis device, abnormality diagnosis method and abnormality diagnosis program |
| JP6593715B2 (en) * | 2017-10-27 | 2019-10-23 | 株式会社安川電機 | Abnormality judgment system, motor control device |
| JP7028625B2 (en) | 2017-12-14 | 2022-03-02 | 株式会社ジャノメ | Electric press, load determination method and program |
-
2019
- 2019-07-23 JP JP2019135695A patent/JP7367366B2/en active Active
-
2020
- 2020-02-28 CN CN202080041120.XA patent/CN113924207B/en active Active
- 2020-02-28 US US17/621,685 patent/US12276975B2/en active Active
- 2020-02-28 WO PCT/JP2020/008498 patent/WO2021014670A1/en not_active Ceased
- 2020-02-28 EP EP20844882.9A patent/EP4005785B1/en active Active
Also Published As
| Publication number | Publication date |
|---|---|
| CN113924207B (en) | 2024-04-05 |
| US20220357732A1 (en) | 2022-11-10 |
| CN113924207A (en) | 2022-01-11 |
| JP2021018753A (en) | 2021-02-15 |
| US12276975B2 (en) | 2025-04-15 |
| EP4005785B1 (en) | 2025-03-19 |
| JP7367366B2 (en) | 2023-10-24 |
| EP4005785A4 (en) | 2023-07-26 |
| WO2021014670A1 (en) | 2021-01-28 |
Similar Documents
| Publication | Publication Date | Title |
|---|---|---|
| EP4005785B1 (en) | Abnormality detecting device, abnormality detecting method, and abnormality detecting program | |
| US12332112B2 (en) | Diagnostic device, computer program, and diagnostic system | |
| US11467024B2 (en) | Diagnostic device, computer program, and diagnostic system | |
| JP7585368B2 (en) | Condition monitoring device, method and program | |
| US11226607B2 (en) | Abnormality determination system, data transmitter-receptor, motor controller, and method for determining abnormality | |
| US20190196458A1 (en) | Method for selecting leading associated parameter and method for combining critical parameter and leading associated parameter for equipment prognostics and health management | |
| US12257704B2 (en) | Abnormality detection device and abnormality detection method | |
| US20230097101A1 (en) | Vibration analysis apparatus and vibration analysis method | |
| CN114077919A (en) | System for predicting machining anomalies | |
| Wu et al. | Monitoring of punch failure in micro-piercing process based on vibratory signal and logistic regression | |
| WO2020152741A1 (en) | Abnormality cause estimation device, abnormality cause estimation method, and program | |
| JP6915763B1 (en) | Abnormality diagnosis system and abnormality diagnosis method | |
| US20070282548A1 (en) | Method and Apparatus for Assessing Condition of Motor-Driven Mechanical System | |
| JP7131611B2 (en) | Abnormality determination device and abnormality determination method | |
| Brophy et al. | AI-based condition monitoring of the drilling process | |
| JP2022176183A (en) | Machining condition management system, machining control device, machining system, and machining program | |
| US20230409909A1 (en) | Data analysis system, data analysis method, and non-transitory computer-readable recording medium | |
| EP4328688A1 (en) | Data processing system, data processing method, and program | |
| EP4328689A1 (en) | Data processing system, data processing method, and program | |
| EP4328690A1 (en) | Data processing system, data processing method, and program | |
| JP7783297B2 (en) | Abnormality diagnosis device, abnormality diagnosis system, and storage medium | |
| JP6690436B2 (en) | Discrimination device, discrimination method, and discrimination program | |
| CN120875695B (en) | Production management method and system based on sheet metal punching quality trend prediction | |
| EP4597038A1 (en) | Anomaly diagnosis device and anomaly diagnosis method | |
| EP4535104A1 (en) | Abnormality detection device, abnormality detection method, and program |
Legal Events
| Date | Code | Title | Description |
|---|---|---|---|
| STAA | Information on the status of an ep patent application or granted ep patent |
Free format text: STATUS: THE INTERNATIONAL PUBLICATION HAS BEEN MADE |
|
| PUAI | Public reference made under article 153(3) epc to a published international application that has entered the european phase |
Free format text: ORIGINAL CODE: 0009012 |
|
| STAA | Information on the status of an ep patent application or granted ep patent |
Free format text: STATUS: REQUEST FOR EXAMINATION WAS MADE |
|
| 17P | Request for examination filed |
Effective date: 20211209 |
|
| AK | Designated contracting states |
Kind code of ref document: A1 Designated state(s): AL AT BE BG CH CY CZ DE DK EE ES FI FR GB GR HR HU IE IS IT LI LT LU LV MC MK MT NL NO PL PT RO RS SE SI SK SM TR |
|
| DAV | Request for validation of the european patent (deleted) | ||
| DAX | Request for extension of the european patent (deleted) | ||
| A4 | Supplementary search report drawn up and despatched |
Effective date: 20230623 |
|
| RIC1 | Information provided on ipc code assigned before grant |
Ipc: G05B 19/406 20060101ALI20230619BHEP Ipc: G05B 23/02 20060101ALI20230619BHEP Ipc: B30B 15/26 20060101ALI20230619BHEP Ipc: B30B 15/28 20060101AFI20230619BHEP |
|
| GRAP | Despatch of communication of intention to grant a patent |
Free format text: ORIGINAL CODE: EPIDOSNIGR1 |
|
| STAA | Information on the status of an ep patent application or granted ep patent |
Free format text: STATUS: GRANT OF PATENT IS INTENDED |
|
| INTG | Intention to grant announced |
Effective date: 20241016 |
|
| GRAS | Grant fee paid |
Free format text: ORIGINAL CODE: EPIDOSNIGR3 |
|
| GRAA | (expected) grant |
Free format text: ORIGINAL CODE: 0009210 |
|
| STAA | Information on the status of an ep patent application or granted ep patent |
Free format text: STATUS: THE PATENT HAS BEEN GRANTED |
|
| AK | Designated contracting states |
Kind code of ref document: B1 Designated state(s): AL AT BE BG CH CY CZ DE DK EE ES FI FR GB GR HR HU IE IS IT LI LT LU LV MC MK MT NL NO PL PT RO RS SE SI SK SM TR |
|
| REG | Reference to a national code |
Ref country code: GB Ref legal event code: FG4D |
|
| REG | Reference to a national code |
Ref country code: CH Ref legal event code: EP |
|
| REG | Reference to a national code |
Ref country code: IE Ref legal event code: FG4D |
|
| REG | Reference to a national code |
Ref country code: DE Ref legal event code: R096 Ref document number: 602020048067 Country of ref document: DE |
|
| PG25 | Lapsed in a contracting state [announced via postgrant information from national office to epo] |
Ref country code: RS Free format text: LAPSE BECAUSE OF FAILURE TO SUBMIT A TRANSLATION OF THE DESCRIPTION OR TO PAY THE FEE WITHIN THE PRESCRIBED TIME-LIMIT Effective date: 20250619 |
|
| PG25 | Lapsed in a contracting state [announced via postgrant information from national office to epo] |
Ref country code: FI Free format text: LAPSE BECAUSE OF FAILURE TO SUBMIT A TRANSLATION OF THE DESCRIPTION OR TO PAY THE FEE WITHIN THE PRESCRIBED TIME-LIMIT Effective date: 20250319 |
|
| REG | Reference to a national code |
Ref country code: LT Ref legal event code: MG9D |
|
| PG25 | Lapsed in a contracting state [announced via postgrant information from national office to epo] |
Ref country code: NO Free format text: LAPSE BECAUSE OF FAILURE TO SUBMIT A TRANSLATION OF THE DESCRIPTION OR TO PAY THE FEE WITHIN THE PRESCRIBED TIME-LIMIT Effective date: 20250619 |
|
| PG25 | Lapsed in a contracting state [announced via postgrant information from national office to epo] |
Ref country code: HR Free format text: LAPSE BECAUSE OF FAILURE TO SUBMIT A TRANSLATION OF THE DESCRIPTION OR TO PAY THE FEE WITHIN THE PRESCRIBED TIME-LIMIT Effective date: 20250319 |
|
| PG25 | Lapsed in a contracting state [announced via postgrant information from national office to epo] |
Ref country code: LV Free format text: LAPSE BECAUSE OF FAILURE TO SUBMIT A TRANSLATION OF THE DESCRIPTION OR TO PAY THE FEE WITHIN THE PRESCRIBED TIME-LIMIT Effective date: 20250319 |
|
| PG25 | Lapsed in a contracting state [announced via postgrant information from national office to epo] |
Ref country code: GR Free format text: LAPSE BECAUSE OF FAILURE TO SUBMIT A TRANSLATION OF THE DESCRIPTION OR TO PAY THE FEE WITHIN THE PRESCRIBED TIME-LIMIT Effective date: 20250620 Ref country code: BG Free format text: LAPSE BECAUSE OF FAILURE TO SUBMIT A TRANSLATION OF THE DESCRIPTION OR TO PAY THE FEE WITHIN THE PRESCRIBED TIME-LIMIT Effective date: 20250319 |
|
| REG | Reference to a national code |
Ref country code: NL Ref legal event code: MP Effective date: 20250319 |
|
| REG | Reference to a national code |
Ref country code: AT Ref legal event code: MK05 Ref document number: 1776649 Country of ref document: AT Kind code of ref document: T Effective date: 20250319 |
|
| PG25 | Lapsed in a contracting state [announced via postgrant information from national office to epo] |
Ref country code: NL Free format text: LAPSE BECAUSE OF FAILURE TO SUBMIT A TRANSLATION OF THE DESCRIPTION OR TO PAY THE FEE WITHIN THE PRESCRIBED TIME-LIMIT Effective date: 20250319 |
|
| PG25 | Lapsed in a contracting state [announced via postgrant information from national office to epo] |
Ref country code: SE Free format text: LAPSE BECAUSE OF FAILURE TO SUBMIT A TRANSLATION OF THE DESCRIPTION OR TO PAY THE FEE WITHIN THE PRESCRIBED TIME-LIMIT Effective date: 20250319 |
|
| PG25 | Lapsed in a contracting state [announced via postgrant information from national office to epo] |
Ref country code: SM Free format text: LAPSE BECAUSE OF FAILURE TO SUBMIT A TRANSLATION OF THE DESCRIPTION OR TO PAY THE FEE WITHIN THE PRESCRIBED TIME-LIMIT Effective date: 20250319 |
|
| PG25 | Lapsed in a contracting state [announced via postgrant information from national office to epo] |
Ref country code: ES Free format text: LAPSE BECAUSE OF FAILURE TO SUBMIT A TRANSLATION OF THE DESCRIPTION OR TO PAY THE FEE WITHIN THE PRESCRIBED TIME-LIMIT Effective date: 20250319 Ref country code: PT Free format text: LAPSE BECAUSE OF FAILURE TO SUBMIT A TRANSLATION OF THE DESCRIPTION OR TO PAY THE FEE WITHIN THE PRESCRIBED TIME-LIMIT Effective date: 20250721 |
|
| PG25 | Lapsed in a contracting state [announced via postgrant information from national office to epo] |
Ref country code: IT Free format text: LAPSE BECAUSE OF FAILURE TO SUBMIT A TRANSLATION OF THE DESCRIPTION OR TO PAY THE FEE WITHIN THE PRESCRIBED TIME-LIMIT Effective date: 20250319 Ref country code: PL Free format text: LAPSE BECAUSE OF FAILURE TO SUBMIT A TRANSLATION OF THE DESCRIPTION OR TO PAY THE FEE WITHIN THE PRESCRIBED TIME-LIMIT Effective date: 20250319 |
|
| PG25 | Lapsed in a contracting state [announced via postgrant information from national office to epo] |
Ref country code: AT Free format text: LAPSE BECAUSE OF FAILURE TO SUBMIT A TRANSLATION OF THE DESCRIPTION OR TO PAY THE FEE WITHIN THE PRESCRIBED TIME-LIMIT Effective date: 20250319 |
|
| PG25 | Lapsed in a contracting state [announced via postgrant information from national office to epo] |
Ref country code: CZ Free format text: LAPSE BECAUSE OF FAILURE TO SUBMIT A TRANSLATION OF THE DESCRIPTION OR TO PAY THE FEE WITHIN THE PRESCRIBED TIME-LIMIT Effective date: 20250319 Ref country code: EE Free format text: LAPSE BECAUSE OF FAILURE TO SUBMIT A TRANSLATION OF THE DESCRIPTION OR TO PAY THE FEE WITHIN THE PRESCRIBED TIME-LIMIT Effective date: 20250319 |
|
| PG25 | Lapsed in a contracting state [announced via postgrant information from national office to epo] |
Ref country code: RO Free format text: LAPSE BECAUSE OF FAILURE TO SUBMIT A TRANSLATION OF THE DESCRIPTION OR TO PAY THE FEE WITHIN THE PRESCRIBED TIME-LIMIT Effective date: 20250319 |
|
| PG25 | Lapsed in a contracting state [announced via postgrant information from national office to epo] |
Ref country code: SK Free format text: LAPSE BECAUSE OF FAILURE TO SUBMIT A TRANSLATION OF THE DESCRIPTION OR TO PAY THE FEE WITHIN THE PRESCRIBED TIME-LIMIT Effective date: 20250319 |
|
| PG25 | Lapsed in a contracting state [announced via postgrant information from national office to epo] |
Ref country code: IS Free format text: LAPSE BECAUSE OF FAILURE TO SUBMIT A TRANSLATION OF THE DESCRIPTION OR TO PAY THE FEE WITHIN THE PRESCRIBED TIME-LIMIT Effective date: 20250719 |
|
| REG | Reference to a national code |
Ref country code: DE Ref legal event code: R097 Ref document number: 602020048067 Country of ref document: DE |
|
| PG25 | Lapsed in a contracting state [announced via postgrant information from national office to epo] |
Ref country code: DK Free format text: LAPSE BECAUSE OF FAILURE TO SUBMIT A TRANSLATION OF THE DESCRIPTION OR TO PAY THE FEE WITHIN THE PRESCRIBED TIME-LIMIT Effective date: 20250319 |
|
| PLBE | No opposition filed within time limit |
Free format text: ORIGINAL CODE: 0009261 |
|
| STAA | Information on the status of an ep patent application or granted ep patent |
Free format text: STATUS: NO OPPOSITION FILED WITHIN TIME LIMIT |
|
| REG | Reference to a national code |
Ref country code: CH Ref legal event code: L10 Free format text: ST27 STATUS EVENT CODE: U-0-0-L10-L00 (AS PROVIDED BY THE NATIONAL OFFICE) Effective date: 20260128 |
|
| 26N | No opposition filed |
Effective date: 20251222 |
|
| PG25 | Lapsed in a contracting state [announced via postgrant information from national office to epo] |
Ref country code: LT Free format text: LAPSE BECAUSE OF FAILURE TO SUBMIT A TRANSLATION OF THE DESCRIPTION OR TO PAY THE FEE WITHIN THE PRESCRIBED TIME-LIMIT Effective date: 20250319 |