EP3841983B1 - Ultrasonic analysis device, ultrasonic analysis method, and ultrasonic analysis program - Google Patents
Ultrasonic analysis device, ultrasonic analysis method, and ultrasonic analysis program Download PDFInfo
- Publication number
- EP3841983B1 EP3841983B1 EP19850967.1A EP19850967A EP3841983B1 EP 3841983 B1 EP3841983 B1 EP 3841983B1 EP 19850967 A EP19850967 A EP 19850967A EP 3841983 B1 EP3841983 B1 EP 3841983B1
- Authority
- EP
- European Patent Office
- Prior art keywords
- ultrasonic
- image
- interest
- muscle
- region
- Prior art date
- Legal status (The legal status is an assumption and is not a legal conclusion. Google has not performed a legal analysis and makes no representation as to the accuracy of the status listed.)
- Active
Links
- 238000004458 analytical method Methods 0.000 title claims description 49
- 210000003205 muscle Anatomy 0.000 claims description 100
- 210000003314 quadriceps muscle Anatomy 0.000 claims description 99
- 238000004364 calculation method Methods 0.000 claims description 26
- 238000012545 processing Methods 0.000 claims description 20
- 238000000034 method Methods 0.000 claims description 12
- 239000000284 extract Substances 0.000 claims description 3
- 239000000523 sample Substances 0.000 description 52
- 230000000875 corresponding effect Effects 0.000 description 22
- 210000000689 upper leg Anatomy 0.000 description 14
- 238000002591 computed tomography Methods 0.000 description 11
- 238000002604 ultrasonography Methods 0.000 description 11
- 230000005540 biological transmission Effects 0.000 description 10
- 238000010586 diagram Methods 0.000 description 9
- 238000011156 evaluation Methods 0.000 description 9
- 210000002027 skeletal muscle Anatomy 0.000 description 8
- 230000007423 decrease Effects 0.000 description 7
- 238000013441 quality evaluation Methods 0.000 description 7
- 238000002595 magnetic resonance imaging Methods 0.000 description 6
- 238000012285 ultrasound imaging Methods 0.000 description 6
- 238000006243 chemical reaction Methods 0.000 description 5
- 238000009826 distribution Methods 0.000 description 5
- 238000007918 intramuscular administration Methods 0.000 description 5
- 230000015572 biosynthetic process Effects 0.000 description 4
- 230000005855 radiation Effects 0.000 description 4
- 238000003786 synthesis reaction Methods 0.000 description 4
- 230000008901 benefit Effects 0.000 description 3
- 230000004044 response Effects 0.000 description 3
- 230000003187 abdominal effect Effects 0.000 description 2
- 210000000988 bone and bone Anatomy 0.000 description 2
- 230000008859 change Effects 0.000 description 2
- 238000012937 correction Methods 0.000 description 2
- 238000001514 detection method Methods 0.000 description 2
- 230000000694 effects Effects 0.000 description 2
- 238000000605 extraction Methods 0.000 description 2
- 230000006870 function Effects 0.000 description 2
- 230000012447 hatching Effects 0.000 description 2
- 238000005259 measurement Methods 0.000 description 2
- 230000035479 physiological effects, processes and functions Effects 0.000 description 2
- 238000003825 pressing Methods 0.000 description 2
- 206010016654 Fibrosis Diseases 0.000 description 1
- 230000002159 abnormal effect Effects 0.000 description 1
- 230000032683 aging Effects 0.000 description 1
- 244000309466 calf Species 0.000 description 1
- 230000001276 controlling effect Effects 0.000 description 1
- 230000002596 correlated effect Effects 0.000 description 1
- 210000003195 fascia Anatomy 0.000 description 1
- 230000004761 fibrosis Effects 0.000 description 1
- 239000012634 fragment Substances 0.000 description 1
- 238000010191 image analysis Methods 0.000 description 1
- 238000003384 imaging method Methods 0.000 description 1
- 238000001727 in vivo Methods 0.000 description 1
- 238000007689 inspection Methods 0.000 description 1
- 150000002632 lipids Chemical class 0.000 description 1
- 238000004519 manufacturing process Methods 0.000 description 1
- 239000000203 mixture Substances 0.000 description 1
- 238000012986 modification Methods 0.000 description 1
- 230000004048 modification Effects 0.000 description 1
- 230000007659 motor function Effects 0.000 description 1
- 238000001964 muscle biopsy Methods 0.000 description 1
- 230000006855 networking Effects 0.000 description 1
- 210000000715 neuromuscular junction Anatomy 0.000 description 1
- 230000002093 peripheral effect Effects 0.000 description 1
- 238000003908 quality control method Methods 0.000 description 1
- 238000002601 radiography Methods 0.000 description 1
- 230000035945 sensitivity Effects 0.000 description 1
- 239000000126 substance Substances 0.000 description 1
- 210000001519 tissue Anatomy 0.000 description 1
- 238000012549 training Methods 0.000 description 1
Images


Classifications
-
- A—HUMAN NECESSITIES
- A61—MEDICAL OR VETERINARY SCIENCE; HYGIENE
- A61B—DIAGNOSIS; SURGERY; IDENTIFICATION
- A61B8/00—Diagnosis using ultrasonic, sonic or infrasonic waves
- A61B8/52—Devices using data or image processing specially adapted for diagnosis using ultrasonic, sonic or infrasonic waves
- A61B8/5215—Devices using data or image processing specially adapted for diagnosis using ultrasonic, sonic or infrasonic waves involving processing of medical diagnostic data
- A61B8/5223—Devices using data or image processing specially adapted for diagnosis using ultrasonic, sonic or infrasonic waves involving processing of medical diagnostic data for extracting a diagnostic or physiological parameter from medical diagnostic data
-
- A—HUMAN NECESSITIES
- A61—MEDICAL OR VETERINARY SCIENCE; HYGIENE
- A61B—DIAGNOSIS; SURGERY; IDENTIFICATION
- A61B8/00—Diagnosis using ultrasonic, sonic or infrasonic waves
- A61B8/52—Devices using data or image processing specially adapted for diagnosis using ultrasonic, sonic or infrasonic waves
- A61B8/5207—Devices using data or image processing specially adapted for diagnosis using ultrasonic, sonic or infrasonic waves involving processing of raw data to produce diagnostic data, e.g. for generating an image
-
- A—HUMAN NECESSITIES
- A61—MEDICAL OR VETERINARY SCIENCE; HYGIENE
- A61B—DIAGNOSIS; SURGERY; IDENTIFICATION
- A61B8/00—Diagnosis using ultrasonic, sonic or infrasonic waves
- A61B8/08—Detecting organic movements or changes, e.g. tumours, cysts, swellings
- A61B8/0833—Detecting organic movements or changes, e.g. tumours, cysts, swellings involving detecting or locating foreign bodies or organic structures
-
- A—HUMAN NECESSITIES
- A61—MEDICAL OR VETERINARY SCIENCE; HYGIENE
- A61B—DIAGNOSIS; SURGERY; IDENTIFICATION
- A61B8/00—Diagnosis using ultrasonic, sonic or infrasonic waves
- A61B8/42—Details of probe positioning or probe attachment to the patient
- A61B8/4272—Details of probe positioning or probe attachment to the patient involving the acoustic interface between the transducer and the tissue
-
- A—HUMAN NECESSITIES
- A61—MEDICAL OR VETERINARY SCIENCE; HYGIENE
- A61B—DIAGNOSIS; SURGERY; IDENTIFICATION
- A61B8/00—Diagnosis using ultrasonic, sonic or infrasonic waves
- A61B8/46—Ultrasonic, sonic or infrasonic diagnostic devices with special arrangements for interfacing with the operator or the patient
- A61B8/461—Displaying means of special interest
- A61B8/463—Displaying means of special interest characterised by displaying multiple images or images and diagnostic data on one display
-
- A—HUMAN NECESSITIES
- A61—MEDICAL OR VETERINARY SCIENCE; HYGIENE
- A61B—DIAGNOSIS; SURGERY; IDENTIFICATION
- A61B8/00—Diagnosis using ultrasonic, sonic or infrasonic waves
- A61B8/52—Devices using data or image processing specially adapted for diagnosis using ultrasonic, sonic or infrasonic waves
- A61B8/5215—Devices using data or image processing specially adapted for diagnosis using ultrasonic, sonic or infrasonic waves involving processing of medical diagnostic data
- A61B8/5238—Devices using data or image processing specially adapted for diagnosis using ultrasonic, sonic or infrasonic waves involving processing of medical diagnostic data for combining image data of patient, e.g. merging several images from different acquisition modes into one image
- A61B8/5246—Devices using data or image processing specially adapted for diagnosis using ultrasonic, sonic or infrasonic waves involving processing of medical diagnostic data for combining image data of patient, e.g. merging several images from different acquisition modes into one image combining images from the same or different imaging techniques, e.g. color Doppler and B-mode
- A61B8/5253—Devices using data or image processing specially adapted for diagnosis using ultrasonic, sonic or infrasonic waves involving processing of medical diagnostic data for combining image data of patient, e.g. merging several images from different acquisition modes into one image combining images from the same or different imaging techniques, e.g. color Doppler and B-mode combining overlapping images, e.g. spatial compounding
Definitions
- the present invention relates to an ultrasonic analysis apparatus, an ultrasonic analysis method and an ultrasonic analysis program for analyzing the inside of a body by ultrasonic waves.
- the decline of muscle with aging is manifested not only as a decrease in muscle mass but also as a decrease in muscle quality.
- muscle quality There is no clear definition of muscle quality, but the main index includes increased intramuscular fat, fibrosis, fast/slow muscles, pennation angle, aerobic capacity, and neuromuscular junction functioning.
- intramuscular fat is the index of the muscle quality which is related to the motor function degeneracy of the elderly and needs to be measured.
- An increase in the intramuscular fat leads to a decrease in muscle strength that can be exerted without a decrease in muscle mass.
- EP 3 323 352 A1 relates to ultrasound imaging obtaining both linear and sector images.
- CT and MRI systems are complex, expensive, and involve exposure to possibly harmful radiation.
- there is no dedicated software for image analysis it cannot be handled by general engineers.
- An object of the present invention is to provide an ultrasonic analysis apparatus for evaluating the state of a muscle with a relatively simple configuration without being exposed to radiation.
- An ultrasonic analysis apparatus as defined in independent claim 1 is characterized by comprising: an interface module configured to receive signals from a transmitter/receiver which receives ultrasonic waves transmitted from a plurality of mutually different positions on the surface of a body toward muscles inside the body and reflected from inside the body; an ultrasonic image generating module configured to generate ultrasonic images corresponding to the respective positions based on the signals inputted from the interface module; an image compositing module configured to stitch the ultrasonic images at the respective positions to generate a stitched image; an area setting module configured to both set a region of interest for at least one of the stitched image and a secondary region of interest for at least one ultrasonic image of the plurality of ultrasonic images before the stitch, the region of interest set for the stitched image and each secondary region of interest set for the at least one ultrasonic image before the stitch corresponding to each other; and an index calculation module configured to calculate an index related to the muscle, the index corresponding to a muscle quality of the muscle, from
- An ultrasonic analysis method is characterized by comprising the steps of receiving a signal from a transmitter/receiver which receives ultrasonic waves transmitted from a plurality of mutually different positions on a surface of a body toward muscles from inside the body and reflected therein; respectively generating ultrasonic images corresponding to the respective positions based on the received signal; stitching the ultrasonic images at the respective positions to generate a stitched image; setting both a region of interest for the stitched image and a secondary region of interest for at least one ultrasonic image of the plurality of the ultrasonic images before the stitch, the region of interest set for the stitched image and each secondary region of interest set for the ultrasonic image before the stitch corresponding to each other; and calculating an index related to the muscle, the index corresponding to a muscle quality of the muscle, from the secondary region(s) of interest set for the at least one ultrasonic image before the stitch.
- An ultrasonic analysis program as defined in independent claim 9 is configured to cause a computer to execute processing, the computer controlling an ultrasonic analysis apparatus as defined above, which program comprises instructions, which when run on the computer, cause the ultrasonic analysis apparatus to carry out the method as defined above.
- the state of the muscle can be evaluated with a relatively simple configuration and without being exposed to radiation.
- the quadriceps femoris is the analysis subject of muscle quality, but the type of muscle is not particularly limited in the present invention.
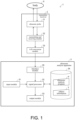
- FIG. 1 is a block diagram of an ultrasonic analysis system 1 according to an embodiment of the present invention.
- the ultrasonic analysis system 1 includes a transmitter /receiver 2 and an ultrasonic analysis apparatus 3 connected to the transmitter/receiver 2.
- the transmitter/receiver 2 is a device for transmitting ultrasonic waves toward muscles inside a body 9 and receiving echo signals reflected from inside the body 9.
- the transmitter/receiver 2 includes an ultrasonic probe 21, a transmitting and receiving module 22, and an A/D conversion module 23.
- the ultrasonic probe 21 is a device for transmitting ultrasonic waves from a plurality of different positions on a surface of the body 9 toward the inside of the body 9 and receiving the ultrasonic waves reflected from the inside of the body 9.
- the ultrasonic probe 21 is configured to be gripped and moved by a user, and an ultrasonic transmission/reception surface is provided on a lower end surface of the ultrasonic probe 21.
- An ultrasonic array sensor constituted by arranging a plurality of ultrasonic vibrators in a line, is arranged on the ultrasonic transmission/reception surface.
- the user When acquiring a tomographic image of the body 9 (or a cross-sectional image), the user makes contact between the body 9 and the ultrasonic transmission/reception surface of the ultrasonic probe 21, and moves the ultrasonic probe 21 along the surface of the body 9 (scans with the ultrasonic probe 21). Meanwhile, the ultrasonic probe 21 intermittently transmits ultrasonic waves from the ultrasonic transmission/reception surface toward the inside of the body 9, and receives the ultrasonic waves reflected from the inside of the body 9 on the ultrasonic transmission/reception surface. Thus, the ultrasonic probe 21 outputs an electric signal (echo signal) indicating the received ultrasonic wave.
- echo signal an electric signal
- the ultrasonic probe 21 is attached to a probe adapter 24, and a contacting surface of the probe adapter 24 contacts on the surface of a thigh 91 of the body 9.
- the user moves the ultrasonic probe 21 and the probe adapter 24 along an outer periphery of a transverse section of the thigh 91 that is to be imaged.
- ultrasonic waves are transmitted at predetermined time intervals from the plurality of ultrasonic vibrators of the ultrasonic probe 21.
- the ultrasonic probe 21 transmits ultrasonic waves from different positions toward a quadriceps femoris 92 a plurality of times.
- the ultrasonic probe 21 or the probe adapter 24 may be provided with an inclination sensor.
- the inclination sensor detects an inclination of the ultrasonic probe 21 with respect to a vertical direction, that is, a direction in which the ultrasonic transmission/reception surface is facing.
- the ultrasonic image may be acquired by moving only the ultrasonic probe 21 without using the probe adapter 24.
- the ultrasonic probe 21 is operable in two modes, a linear scan mode for acquiring a linear scan image and a sector scan mode for acquiring a sector scan image.
- the ultrasonic analysis apparatus 3 can generate an ultrasonic image in which the zonal region 93 is clearly imaged.
- the ultrasonic analysis apparatus 3 can generate an ultrasonic image obtained by imaging the fan-shaped region 94.
- the ultrasonic probe 21 operates while alternately repeating the linear scan mode and the sector scan mode, and acquires multiple linear scan images and sector scan images, for example, 200 images are acquired during the linear scan mode and the sector scan mode, thus a total of 400 images are acquired.
- the number of the images is only one example, and is set to an arbitrary value. The number may be determined according to the operation and the condition of the subject.
- the ultrasonic probe 21 may be configured to acquire either a linear scan image or a sector scan image at a given time.
- the transmitter/receiver 2 shown in FIG. 1 forms a waveform of a carrier wave that constitutes a frequency of an ultrasonic band into a pulse shape to generate a transmission pulse, and outputs the generated transmission pulse to the ultrasonic probe 21.
- ultrasonic waves are transmitted from the plurality of ultrasonic vibrators of the ultrasonic probe 21 in a depth direction of the body 9.
- the transmitting and receiving module 22 receives the echo signal received by the plurality of ultrasonic vibrators of the ultrasonic probe 21 from the inside of the body 9.
- the A/D conversion module 23 converts the echo signal transmitted from the transmitting and receiving module 22 from an analog format to a digital format, and transmits the converted echo signal to the ultrasonic analysis apparatus 3.
- the ultrasonic analysis apparatus 3 includes an input module 31, a signal processing module 32, and an output module 33.
- the ultrasonic analysis apparatus 3 is constituted by a known personal computer, and includes, as a hardware configuration, a processor (not shown) such as a CPU for performing data processing, a memory (not shown) used by the processor in a work area for data processing, a recording module 34 for recording processing data, a bus (not shown) for transmitting data between each module, and an interface module (hereinafter referred to as I/F module 35) for inputting/outputting data to/from an external apparatus.
- the ultrasonic analysis apparatus 3 can be connected to an external server via a network such as the Internet.
- the input module 31 receives input of an operation from a user.
- the input module 31 may be a keyboard, a mouse, a touch panel, or the like.
- the signal processing module 32 is a functional block that receives an echo signal converted into the digital format from the transmitter/receiver 2 and performs various arithmetic processing functions such as calculation of an index corresponding to a muscle quality of the quadriceps femoris 92 to be analyzed.
- the signal processing module 32 may be implemented in hardware by a logic circuit formed on an integrated circuit, but in this embodiment, the signal processing module 32 is implemented in software by the processor executing an ultrasonic analysis program P previously recorded in the recording module 34 or the memory.
- the ultrasonic analysis program P may be installed in the ultrasonic analysis apparatus 3 via a network.
- the ultrasonic analysis program P may be installed in the ultrasonic analysis apparatus 3 by causing the ultrasonic analysis apparatus 3 to read a computer-readable non-temporary tangible recording medium, such as a CD-ROM, in which the ultrasonic analysis program P is recorded. Details of the signal processing module 32 will be described later with reference to FIG. 4 .
- the output module 33 outputs a calculation result of the signal processing module 32.
- the output module 33 can be configured with a monitor, a printer, or the like.
- the I/F module 35 receives a signal (the converted echo signal) from the transmitter/receiver 2.
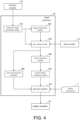
- FIG. 4 is a functional block diagram of the signal processing module 32.
- the signal processing module 32 includes an ultrasonic image generating module 321, an image compositing module 322, an area setting module 323, an index calculation module 324, a muscle quality evaluation module 325, a cross-sectional area calculator 326, and a decision module 327.
- the ultrasonic image generating module 321 generates an ultrasonic image of the inside of the body 9 based on the echo signal input from the I/F module 35.
- the transmitter/receiver 2 transmits ultrasonic waves a plurality of times while alternately repeating the linear scan mode and the sector scan mode, and receives the echo signals reflected from inside the body 9. Therefore, each time the transmitter/receiver 2 receives the echo signal, the I/F module 35 receives the converted echo signal.
- the ultrasonic image generating module 321 generates a linear scan image as an ultrasonic image from the echo signal received in the linear scan mode, and generates a sector scan image as an ultrasonic image from the echo signal received in the sector scan mode.
- the ultrasonic image generating module 321 generates multiple linear scan images and multiple sector scan images, for example, 200 linear scan images and 200 sector scan images, thus, a total of 400 ultrasonic images.
- the ultrasonic image generating module 321 may correct the deformation caused by the pressing of the ultrasonic probe 21 against the cross section of the body 9 in the ultrasonic image, based on a force of the ultrasonic probe 21 pressing the body 9 and a position and direction of the ultrasonic probe 21.
- FIG. 5 is a diagram for explaining generation of a linear scan image.
- FIG. 5A is a partial sectional view of the thigh 91, and the thigh 91 is divided into the quadriceps femoris 92 and other portions for convenience.
- a real image region of the linear scan image also becomes the zonal region 93.
- the linear scan image Li1 as shown in FIG. 5B is generated
- the linear scan image Li2 as shown in FIG. 5C is generated
- the linear scan image Li3 as shown in FIG. 5D is generated.
- FIG. 6 is a diagram for explaining generation of a sector scan image.
- FIG. 6A is a partial sectional view of the thigh 91, and similarly to FIG. 5A , the thigh 91 is divided into the quadriceps femoris 92 and other portions for convenience.
- the ultrasonic wave is directed to the fan-shaped region 94, a real image region in the sector scan image Se is fan-shaped as shown in FIG. 6B .
- the image compositing module 322 stitches a plurality of ultrasonic images (linear scan image and sector scan image) generated by the ultrasonic image generating module 321 to generate a stitched image.
- the method for stitching the ultrasonic image is not particularly limited, and any known method can be used.
- the image compositing module 322 detects and matches a feature amount between regions included in each of the plurality of ultrasonic images, thereby determining a position at which the plurality of ultrasonic images overlap.
- the image compositing module 322 rotates each ultrasonic image on the basis of a detection angle obtained from the inclination sensor, and performs matching on the basis of the rotated ultrasonic image.
- a rotation angle of each ultrasonic image can be accurately corrected, and an overlapped position of a fragment image can be determined with higher accuracy.
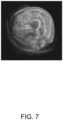
- FIG. 7 is an example of a stitched image of the thigh 91.
- the area setting module 323 shown in FIG. 4 is a functional block for setting a region of interest (ROI: Region of Interest) for at least one of the stitched image and the ultrasonic image.
- ROI Region of Interest
- the area setting module 323 is a functional block that sets a region of interest for the stitched image and sets a region of interest for the ultrasonic image corresponding to the region of interest of the stitched image before the generation of the stitched image.
- the area setting module 323 may set one region of interest for the entire quadriceps femoris 92 included in the stitched image, or may evaluate the muscle qualities of each of a rectus femoris, vastus lateralis, vastus intermedius, and vastus medialis constituting the quadriceps femoris 92 in order to accurately evaluate the muscle qualities of the quadriceps femoris 92. Therefore, in this embodiment, the area setting module 323 sets a region of interest for each of the rectus femoris, vastus lateralis, vastus intermedius, and vastus medialis.
- the area setting module 323 sets the region of interest in the stitched image in response to a user's operation via the input module 31.
- a specific example of setting a region of interest in the stitched image shown in FIG. 7 will be described.
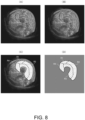
- the user operates the mouse or the like while viewing the stitched image shown in FIG. 7 , and as shown in FIG. 8A , hits a point at the boundary position of the rectus femoris, vastus lateralis, vastus intermedius, and vastus medialis.
- a color of the point may be different depending on a type of the adjacent tissue.
- the points shown in FIG. 8A may be automatically set by a method for automatically detecting the boundaries of the rectus femoris, vastus lateralis, vastus intermedius, and vastus medialis.
- the quadriceps femoris 92 is divided into 4 regions such as the rectus femoris, the vastus lateralis, the vastus intermedius, and the vastus medialis, and the area setting module 323 sets 4 regions as regions of interest R1 to R4, respectively.
- the area setting module 323 extracts a mask image (masked image) comprising the set regions of interest R1 to R4 from the stitched image. As described above, setting of the region of interest for the stitched image is completed.
- the regions of interest R1 to R4 are divided by hatching, a type of hatching is independent of brightness, which will be described later.
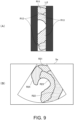
- the area setting module 323 sets a region of interest corresponding to the region of interest of the stitched image also for the ultrasonic image before the stitch.
- the area setting module 323 overlaps the mask images composed of the regions of interest R1 to R4 extracted from the stitched image with the ultrasonic images. At this time, the mask image is rotated according to the rotation angle of each ultrasonic image.
- the area setting module 323 can specify the boundary of the region of interest in each ultrasonic image and also set the region of interest for each ultrasonic image.
- the regions of interest R11, R12 and R13 included in the linear scan image Li3 are set as shown in FIG. 9A .
- regions of interest R21, R22, R23 and R24 included in the sector scan image Se are set as shown in FIG. 9B .
- region of interest (For example, regions of interest R11 to R13 and R21 to R24) set in the ultrasonic image before synthesis is sometimes referred to as "secondary region of interest”.
- the index calculation module 324 shown in FIG. 4 calculates an index related to the muscle from the secondary region(s) of interest set for the ultrasonic images before the stitch.
- the index calculation module 324 calculates an index corresponding to the muscle quality of the muscle based on the image (here, it is an ultrasonic image, more specifically, a linear scan image or a sector scan image) corresponding to the secondary region of interest set for the ultrasonic image before synthesis. Since the brightness of the image of the muscle increases as the intramuscular fat content increases, the index calculation module 324 calculates the average value of the brightness of the secondary region of interest of the ultrasonic image as an index. A specific example of the calculation method of the index is described below.
- the index calculation module 324 extracts the secondary region of interest set in each ultrasonic image. For example, from the linear scan image Li3 shown in FIG. 5D , secondary regions of interest R11, R12, and R13 corresponding to the rectus femoris, vastus lateralis, and vastus intermedius, respectively, are extracted as shown in FIG. 10 (A) . Further, from the sector scan image Se shown in FIG. 6B , secondary regions of interest R21, R22, R23, and R24 corresponding to the rectus femoris, vastus lateralis, vastus intermedius, and vastus medialis, respectively, are extracted as shown in FIG. 10 (B) . The index calculation module 324 performs the extraction process for all the linear scan images and the sector scan images.
- an outer peripheral edge of the region of interest may be removed (For example, a few pixels) for extraction.
- line enhancement image filters, binarization, and high brightness line detection by the Dijkstra's algorithm can be used.
- FIGs. 11 (A) and (B) are graphs showing the brightness of the secondary regions of interest R11 to R13 extracted from the 200 linear scan images
- FIGS. 11 (C) and (D) are graphs showing the brightness of the secondary region of interests R21 to R24 extracted from the 200 sector scan images.
- the horizontal axis represents a number assigned to the acquisition order of the linear scan image or the sector scan image
- the vertical axis represents the brightness of the secondary region of interest.
- a portion where the brightness is 70% or more of the maximum brightness of the secondary region of interest is indicated by a thick line.
- the index calculation module 324 calculates an average value of brightness indicated by a thick line for each secondary region of interest, and outputs the calculated average value as an index corresponding to the muscle quality. In calculating the index, all the secondary regions of interest may be used, but the index may be calculated by selectively using either the linear scan image or the sector scan image depending on the part of the muscle.
- the linear scan images and sector scan images have the following advantages and disadvantages.
- the linear scan image has the advantage of being less influenced by the characteristics of the echo and having high reliability.
- the linear scan image has the following disadvantages. Since the observation range at a given time is narrow and each secondary region of interest is only partially reflected, the linear scan image is easily affected by unevenness in the secondary region of interest. It is difficult to distinguish an image having a correct value from an image to be removed due to unevenness. In particular, the latter disadvantage is prominent in a linear scan image of the vastus medialis. In addition, the vastus medialis muscle has a smaller variation range than other muscles (with low sensitivity), and the effect of the directionality to which ultrasonic waves hit is greater.
- the sector scan image has the following advantages. Since an observation range at a given time is wide and many images include all or most part of the secondary region of interest, the sector scan image is averaged even if there is unevenness in the secondary region of interest. It is easy to distinguish an image having a correct value from an image having an abnormal value (when the secondary region of interest is not reflected behind the bone).
- the vastus medialis muscle which shows a large change in the linear scan image, shows the same change as other muscles in the sector scan image.
- the sector scan image is easily affected by the characteristics of the echo, and has a disadvantage that the deeper the sector scan image is, the worse the echo characteristics become.
- an image for calculating the index may be selected for each muscle region.
- the correlation between the brightness of the secondary region of interest and the equivalent CT value tends to be higher in the linear scan image than in the sector scan image. Therefore, for the vastus lateralis and vastus intermedius, an index may be calculated using the linear scan image.
- the correlation between the brightness of the secondary region of interest and the CT value equivalent tends to be higher in the sector scan image than in the linear scan image. Therefore, for the rectus femoris and vastus medialis, an index may be calculated using the sector scan image.
- the brightness can be expressed in 0 ⁇ 255 gradations.
- a brightness correction technique may be used to calculate a corrected brightness.
- the calculation of the corrected brightness is possible by a) correcting for scaling according to the part in order to evaluate a tendency of the part that is bright and the part that is dark appears in the same order, and b) correcting for differences of trends when using a mix of results from different scanning methods.
- it is not necessary to standardize settings related to image quality and brightness such as a gain of the transmitter/receiver 2.
- the brightness is an image processing value under a specific condition, it can be generalized by converting it into a physical index.
- brightness can be converted to dB as an echo reflection level.
- a reference can be determined by a substance corresponding to 0 dB (For example, a phantom for quality control), and the brightness can be converted to dB from measurement or calculation. This makes it possible to correct variations in mass production through inspection and correction, and to standardize indices for multiple models.
- the index calculation module 324 may calculate a CT value equivalent value (HU), an MRI equivalent value (T1, T2), or a muscle tissue evaluation value (Fat equivalent (%), effective muscle cross-sectional area, etc.) of the image as an index corresponding to the muscle quality, instead of the average value of the brightness.
- HU CT value equivalent value
- T1, T2 MRI equivalent value
- Fat equivalent (%), effective muscle cross-sectional area, etc. a muscle tissue evaluation value
- These values can be correlated with clinically significant data, such as CT and MRI measurements and the actual anatomic and medical condition of the muscle.
- the muscle quality evaluation module 325 shown in FIG. 4 evaluates the muscle quality based on the index calculated by the index calculation module 324.
- the index is an average value of brightness, it can be evaluated that the larger the average value is, the larger the amount of fat in the muscle and lower is the muscle quality.
- a histogram representing the brightness distribution can also be used to evaluate the muscle quality. For example, as shown in FIGs. 12 (A) and 12 (B) , since a ratio of the number of pixels to a specific brightness value is different between the elderly and the young, the muscle quality can be evaluated based on the ratio.
- the muscle quality can be evaluated by a size relationship of the region of the brightness distribution. Since the brightness distribution differs as the muscle quality decreases from the healthy state, for example, as shown in FIG. 13 , the brightness values in the gray area and the areas before and after the gray area are judged in 3 stages of ⁇ (abound), ⁇ (intermediate), and ⁇ (little), and the muscle quality is evaluated by the combination of the size relation.
- the vertical axis and the horizontal axis represent brightness and image number, respectively.
- patterns and spatial frequencies can be used to evaluate muscle quality.
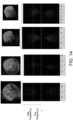
- a two-dimensional fast Fourier transform FFT: Fast Fourier Transform
- the upper four images shown in FIG. 14 are images before conversion, and the lower four images are images after conversion.
- a high frequency component of the brightness in the converted image is larger than a low frequency component, and the low frequency component is at a low level, but the distribution of the brightness moves to the low frequency side with the lowering of the muscle quality. Therefore, the muscle quality can be evaluated based on the high frequency component and the low frequency component.
- this evaluation method can improve the evaluation accuracy by additionally performing the above-mentioned muscle quality evaluation using the average value or histogram of brightness.
- the cross-sectional area calculator 326 shown in FIG. 4 calculates the cross-sectional areas of the rectus femoris, vastus lateralis, vastus intermedius, and vastus medialis of the quadriceps femoris 92.
- the calculation result is an input to the muscle quality evaluation module 325 together with the evaluation result of the decision module 327.
- the decision module 327 also receives subject information T such as the age, sex, height, and weight of the body 9 stored in the recording module 34.
- the cross-sectional area calculator 326 and the subject information T may have any configuration.
- the decision module 327 presents the evaluation result of the muscle quality, the muscle cross-sectional area, and reference data based on the subject information T inputted from the muscle quality evaluation module 325 and the cross-sectional area calculator 326, respectively. Further, the decision module 327 performs calculation (e.g., T-SCORE) in comparison with the reference data for determination. These results are output to the output module 33 and can be confirmed by the user.
- calculation e.g., T-SCORE
- FIG. 15 is a flow chart showing a flow of processing in an ultrasonic analysis method according to the present embodiment.
- the ultrasonic analysis method according to the present embodiment can be implemented by the transmitter/receiver 2 and the ultrasonic analysis apparatus 3.
- step S1 the transmitter/receiver 2 shown in FIG. 1 transmits ultrasonic waves from different positions from the transducer of the ultrasonic probe 21 toward the muscles inside of the body 9, and receives the echo signals reflected from inside of the body 9 by the transducer of the ultrasonic probe 21.
- the muscle is the quadriceps femoris 92.
- the transmitter/receiver 2 digitally converts the received echo signal and transmits it to the ultrasonic analysis apparatus 3, and the I/F module 35 of the ultrasonic analysis apparatus 3 receives the echo signal from the transmitter/receiver 2.
- step S2 the ultrasonic image generating module 321 shown in FIG. 4 generates an ultrasonic image of the inside of the body 9 based on the received echo signal.
- the ultrasonic image generating module 321 generates a linear scan image and a sector scan image as ultrasonic images.
- step S3 the image compositing module 322 stitches the ultrasonic images to generate a stitched image.
- step S4 the area setting module 323 sets a region of interest for the stitched image and the ultrasonic image before the stitching.
- a region of interest is set for each of the rectus femoris, vastus lateralis, vastus intermedius, and vastus medialis constituting the quadriceps femoris 92.
- step S5 the index calculation module 324 calculates an index corresponding to the muscle quality based on the image corresponding to the secondary region of interest set for the ultrasonic image before the stitching.
- the index is, for example, an average value of brightness of an image.
- step S6 the muscle quality evaluation module 325 evaluates the muscle quality based on the index.
- the evaluation of the muscle quality can be performed based on the average value of the brightness, the histogram of the brightness, the ratio of the number of pixels of a specific brightness value, etc.
- the cross-sectional area calculating module 326 calculates a muscle cross-sectional area.
- the cross-sectional area calculation module 326 calculates the cross-sectional areas of the rectus femoris, vastus lateralis, vastus intermedius, and vastus medialis of the quadriceps femoris 92.
- step S7 the decision module 327 presents the evaluation result of the muscle quality, the muscle cross-sectional area, and reference data based on the subject information T.
- the ultrasonic analysis apparatus 3 and the ultrasonic analysis method according to the present embodiment it is possible to evaluate the muscle quality by analyzing an ultrasonic image without using a CT apparatus or an MRI apparatus having a complicated configuration as in the prior art. Therefore, it is possible to evaluate the muscle quality with a relatively simple constitution without accompanying exposure to possibly harmful radiations.
- the index calculation module 324 calculates the index corresponding to the muscle quality from the secondary region of interest set for the ultrasonic image before synthesis, in accordance with the invention but the index could have been calculated from the region of interest set for the stitched image in an example outside the scope of the present invention.
- the brightness decreases according to the depth in the ultrasonic image, and thus, the brightness is affected in the stitched image. Therefore, in accordance with the invention, the index is calculated from the secondary region of interest set for the ultrasonic image before synthesis.
- a plurality of ultrasonic images are acquired by transmitting ultrasonic waves from different positions toward the quadriceps femoris 92 a plurality of times, but the method for acquiring the plurality of ultrasonic images is not limited thereto.
- a plurality of ultrasonic probes similar to the ultrasonic probe 21, may be disposed around the thigh 91, and ultrasonic waves may be simultaneously transmitted from each ultrasonic probe toward the quadriceps femoris 92 to obtain the plurality of ultrasonic images.
- the ultrasonic image generating module 321 may generate the linear scan image and the sector scan image as ultrasonic images in the aforementioned embodiment, the ultrasonic image generating module 321 may generate only one of the linear scan image and the sector scan image in various other embodiments.
- the ultrasonic image generating module 321 may generate a convex image as an ultrasonic image.
- the region of interest may be set in the convex image, and the index corresponding to the muscle quality may be calculated from the image corresponding to the region of interest.
- 200 linear scan images and 200 sector scan images are used for calculating the index respectively, but the number of ultrasonic images used for calculating the index is not particularly limited, and a part of the acquired ultrasonic images may be selected and used for calculating the index. For example, 50 images may be selected at predetermined intervals from the total 400 ultrasonic images arranged in an order of acquisition.
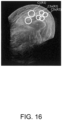
- the quadriceps femoris 92 is divided into four regions of the rectus femoris, vastus lateralis, vastus intermedius, and vastus medialis, but it may be difficult to manually find the boundary of the region depending on the subject. Therefore, for example, as shown in FIG. 16 , a typical position of the muscle may be surrounded by a frame having a simple shape such as a circular frame, and an area within the frame may be set as a region of interest. In the example shown in FIG. 16 , a circular frame C1 including the rectus femoris is set as a region of interest R1.
- a region within the muscle may be surrounded by a plurality of circular frames C2a and C2b, and a region within the circular frames C2a and C2b may be set as a region of interest R2.
- one region of interest may be set for the entire quadriceps femoris 92, or at least one of the rectus femoris, vastus lateralis, vastus intermedius, and vastus medialis constituting the quadriceps femoris 92.
- the analysis subject of the muscle is the quadriceps femoris 92, but the present invention is not limited thereto, and any muscle such as the back of the thigh 91, the calf, and the upper arm muscle can be included in the analysis subject.
- the ultrasonic wave is intermittently transmitted from the ultrasonic probe 21 while the ultrasonic probe 21 is moved along the surface of the body 9, the embodiments for obtaining ultrasound images are not limited thereto.
- a plurality of ultrasonic probes 21 may be arranged in the body 9, and ultrasonic waves may be transmitted simultaneously from each ultrasonic probe 21.
Description
- The present invention relates to an ultrasonic analysis apparatus, an ultrasonic analysis method and an ultrasonic analysis program for analyzing the inside of a body by ultrasonic waves.
- The decline of muscle with aging is manifested not only as a decrease in muscle mass but also as a decrease in muscle quality. There is no clear definition of muscle quality, but the main index includes increased intramuscular fat, fibrosis, fast/slow muscles, pennation angle, aerobic capacity, and neuromuscular junction functioning. Among these, intramuscular fat is the index of the muscle quality which is related to the motor function degeneracy of the elderly and needs to be measured. An increase in the intramuscular fat leads to a decrease in muscle strength that can be exerted without a decrease in muscle mass.
- Conventionally, a technique for measuring the muscle quality from a muscle cross-sectional image acquired by a CT (Computed Tomography) apparatus or an MRI (Magnetic Resonance Imaging) apparatus has been used. In
non-patent document 1, since there is a significant correlation between the skeletal muscle average CT value and the intramuscular fat amount obtained by muscle biopsy, it is shown that the skeletal muscle average CT value is effective as an evaluation index of the muscle quality. - Goodpaster BH, et al, "Skeletal muscle attenuation determined by computed tomography is associated with skeletal muscle lipid content", J Appl Physiol (1985), 2000 Jul, 89 (1), 104 -10 (1), 104 -110
- The paper by Fukuda Osamu et al.: "Analysis of thigh cross-sectional properties using the portable ultrasound imaging system", 2016 IEEE 18TH INTERNATIONAL CONFERENCE ON E-HEALTH NETWORKING, APPLICATIONS AND SERVICES (HEALTHCOM), 14 September 2016, pages 1 - 6, describes to compose an ultrasound image and describes that a muscle index is obtained from a cross-sectional image.
- The article by Tanaka Noriko I. et al.: "Reliability of size and echo intensity of abdominal skeletal muscles using extended-field-of -view ultrasound imaging", EUROPEAN JOURNAL OF APPLIED PHYSIOLOGY, vol. 117, no.11, 14 September 2017, pages 2263-2270, is aimed to examine the reliability of extended field-of-view ultrasound imaging to evaluate the cross-sectional area and echo intensity of abdominal skeletal muscles. The publication by Juha P. Ahtiainen et al.: "Panoramic ultrasonography is a valid method to measure changes in skeletal muscle cross-sectional area", EUROPEAN JOURNAL OF APPLIED PHYSIOLOGY, vol. 108, no. 2, 24 September 2009, pages 273-279, discloses some background information regarding extended field-of-view ultrasound imaging, called panoramic ultrasonography therein.
- The paper by MacGillivray T. J. et al.: "3D Freehand Ultrasound for in vivo Determination of Human Skeletal Muscle Volume", ULTRASOUND IN MEDICINE AND BIOLOGY, vol. 35, no. 6, 1 June 2009, pages 928-935, has the purpose to detect by ultrasound imaging training-induced changes in muscle cross-section area.
-
EP 3 323 352 A1 - The publication by Santos R. et al.: "Reproducibility of ultrasound-derived muscle thickness and echo-intensity for the entire quadriceps femoris muscle", RADIOGRAPHY, vol. 23, no. 3, 4 April 2017, shows data interpolation in 3D image synthesis
- However, CT and MRI systems are complex, expensive, and involve exposure to possibly harmful radiation. In addition, since there is no dedicated software for image analysis, it cannot be handled by general engineers.
- An object of the present invention is to provide an ultrasonic analysis apparatus for evaluating the state of a muscle with a relatively simple configuration without being exposed to radiation.
- The above objects are solved by the subject-matter of the independent claims.
- An ultrasonic analysis apparatus according to the present invention as defined in
independent claim 1 is characterized by comprising: an interface module configured to receive signals from a transmitter/receiver which receives ultrasonic waves transmitted from a plurality of mutually different positions on the surface of a body toward muscles inside the body and reflected from inside the body; an ultrasonic image generating module configured to generate ultrasonic images corresponding to the respective positions based on the signals inputted from the interface module; an image compositing module configured to stitch the ultrasonic images at the respective positions to generate a stitched image; an area setting module configured to both set a region of interest for at least one of the stitched image and a secondary region of interest for at least one ultrasonic image of the plurality of ultrasonic images before the stitch, the region of interest set for the stitched image and each secondary region of interest set for the at least one ultrasonic image before the stitch corresponding to each other; and an index calculation module configured to calculate an index related to the muscle, the index corresponding to a muscle quality of the muscle, from the secondary region(s) of interest set for the at least one ultrasonic image before the stitch. - An ultrasonic analysis method according to the present invention as defined in independent claim 8 is characterized by comprising the steps of receiving a signal from a transmitter/receiver which receives ultrasonic waves transmitted from a plurality of mutually different positions on a surface of a body toward muscles from inside the body and reflected therein; respectively generating ultrasonic images corresponding to the respective positions based on the received signal; stitching the ultrasonic images at the respective positions to generate a stitched image; setting both a region of interest for the stitched image and a secondary region of interest for at least one ultrasonic image of the plurality of the ultrasonic images before the stitch, the region of interest set for the stitched image and each secondary region of interest set for the ultrasonic image before the stitch corresponding to each other; and calculating an index related to the muscle, the index corresponding to a muscle quality of the muscle, from the secondary region(s) of interest set for the at least one ultrasonic image before the stitch.
- An ultrasonic analysis program according to the present invention as defined in
independent claim 9 is configured to cause a computer to execute processing, the computer controlling an ultrasonic analysis apparatus as defined above, which program comprises instructions, which when run on the computer, cause the ultrasonic analysis apparatus to carry out the method as defined above. - According to the present invention, the state of the muscle can be evaluated with a relatively simple configuration and without being exposed to radiation.
-
-
FIG. 1 is a block diagram of an ultrasound analysis system according to an embodiment of the present invention; -
FIG. 2 illustrates an operational aspect of an ultrasound probe; -
FIG. 3 is a diagram for explaining an operation mode of a linear scan mode and a sector scan mode; -
FIG. 4 is a functional block diagram of a signal processing module; -
FIG. 5 illustrates the generation of a linear scan image; -
FIG. 6 illustrates the generation of a sector scan image; -
FIG. 7 is an example of a stitched image of a thigh; -
FIG. 8 is a diagram for explaining the setting of a region of interest in a stitched image; -
FIG. 9 is an example of an ultrasound image in which a region of interest is set; -
FIG. 10 is an example of a region of interest extracted from an ultrasound image; -
FIG. 11 is a graph showing a relationship between a brightness of a region of interest and an image number; -
FIG. 12 is a histogram representing a brightness distribution; -
FIG. 13 is a graph showing the relationship between the brightness of the region of interest and the image number; -
FIG. 14 shows a linear scan image and a two-dimensional fast Fourier transformed image of it; -
FIG. 15 is a flow chart showing a flow of processing in an ultrasonic analysis method according to an embodiment of the present invention; and -
FIG. 16 is a diagram for explaining another example of setting a region of interest in a stitched image. - Embodiments of the present invention will now be described in detail with reference to the accompanying drawings. In the following description and the drawings, the same reference numerals indicate the same or similar components, and therefore redundant description of the same or similar components is omitted. In the following description, the quadriceps femoris is the analysis subject of muscle quality, but the type of muscle is not particularly limited in the present invention.
- [overall configuration]
FIG. 1 is a block diagram of anultrasonic analysis system 1 according to an embodiment of the present invention. Theultrasonic analysis system 1 includes a transmitter /receiver 2 and anultrasonic analysis apparatus 3 connected to the transmitter/receiver 2. - [transmitter/receiver] The transmitter/
receiver 2 is a device for transmitting ultrasonic waves toward muscles inside abody 9 and receiving echo signals reflected from inside thebody 9. The transmitter/receiver 2 includes anultrasonic probe 21, a transmitting and receivingmodule 22, and an A/D conversion module 23. - As shown in
FIG. 2A , theultrasonic probe 21 is a device for transmitting ultrasonic waves from a plurality of different positions on a surface of thebody 9 toward the inside of thebody 9 and receiving the ultrasonic waves reflected from the inside of thebody 9. In this embodiment, theultrasonic probe 21 is configured to be gripped and moved by a user, and an ultrasonic transmission/reception surface is provided on a lower end surface of theultrasonic probe 21. An ultrasonic array sensor, constituted by arranging a plurality of ultrasonic vibrators in a line, is arranged on the ultrasonic transmission/reception surface. When acquiring a tomographic image of the body 9 (or a cross-sectional image), the user makes contact between thebody 9 and the ultrasonic transmission/reception surface of theultrasonic probe 21, and moves theultrasonic probe 21 along the surface of the body 9 (scans with the ultrasonic probe 21). Meanwhile, theultrasonic probe 21 intermittently transmits ultrasonic waves from the ultrasonic transmission/reception surface toward the inside of thebody 9, and receives the ultrasonic waves reflected from the inside of thebody 9 on the ultrasonic transmission/reception surface. Thus, theultrasonic probe 21 outputs an electric signal (echo signal) indicating the received ultrasonic wave. - In an embodiment, as shown in
FIGs. 2A and 2B , theultrasonic probe 21 is attached to aprobe adapter 24, and a contacting surface of theprobe adapter 24 contacts on the surface of athigh 91 of thebody 9. In this state, the user moves theultrasonic probe 21 and theprobe adapter 24 along an outer periphery of a transverse section of thethigh 91 that is to be imaged. While theultrasonic probe 21 is moved along the surface of thethigh 91, ultrasonic waves are transmitted at predetermined time intervals from the plurality of ultrasonic vibrators of theultrasonic probe 21. Thus, theultrasonic probe 21 transmits ultrasonic waves from different positions toward a quadriceps femoris 92 a plurality of times. - The
ultrasonic probe 21 or theprobe adapter 24 may be provided with an inclination sensor. The inclination sensor detects an inclination of theultrasonic probe 21 with respect to a vertical direction, that is, a direction in which the ultrasonic transmission/reception surface is facing. Further, although an example in which theultrasonic probe 24 to which theprobe adapter 24 is attached, alternatively, the ultrasonic image may be acquired by moving only theultrasonic probe 21 without using theprobe adapter 24. - The
ultrasonic probe 21 is operable in two modes, a linear scan mode for acquiring a linear scan image and a sector scan mode for acquiring a sector scan image. - When the
ultrasonic probe 21 is operated in the linear scan mode, as shown inFIG. 3A , the ultrasonic wave transmitted from the ultrasonic transmission/reception surface is directed toward azonal region 93. Therefore, when theultrasonic probe 21 is driven in the linear scan mode, theultrasonic analysis apparatus 3 can generate an ultrasonic image in which thezonal region 93 is clearly imaged. - When the
ultrasonic probe 21 is operated in the sector scan mode, as shown inFIG. 3B , the ultrasonic wave transmitted from the ultrasonic transmission/reception surface is directed toward a fan-shapedregion 94. Therefore, when theultrasonic probe 21 is driven in the sector scan mode, theultrasonic analysis apparatus 3 can generate an ultrasonic image obtained by imaging the fan-shapedregion 94. - In the present embodiment, the
ultrasonic probe 21 operates while alternately repeating the linear scan mode and the sector scan mode, and acquires multiple linear scan images and sector scan images, for example, 200 images are acquired during the linear scan mode and the sector scan mode, thus a total of 400 images are acquired. The number of the images is only one example, and is set to an arbitrary value. The number may be determined according to the operation and the condition of the subject. Theultrasonic probe 21 may be configured to acquire either a linear scan image or a sector scan image at a given time. - The transmitter/
receiver 2 shown inFIG. 1 forms a waveform of a carrier wave that constitutes a frequency of an ultrasonic band into a pulse shape to generate a transmission pulse, and outputs the generated transmission pulse to theultrasonic probe 21. Thus, ultrasonic waves are transmitted from the plurality of ultrasonic vibrators of theultrasonic probe 21 in a depth direction of thebody 9. The transmitting and receivingmodule 22 receives the echo signal received by the plurality of ultrasonic vibrators of theultrasonic probe 21 from the inside of thebody 9. - The A/
D conversion module 23 converts the echo signal transmitted from the transmitting and receivingmodule 22 from an analog format to a digital format, and transmits the converted echo signal to theultrasonic analysis apparatus 3. - [ultrasonic analysis apparatus] The
ultrasonic analysis apparatus 3 includes aninput module 31, asignal processing module 32, and anoutput module 33. - In the present embodiment, the
ultrasonic analysis apparatus 3 is constituted by a known personal computer, and includes, as a hardware configuration, a processor (not shown) such as a CPU for performing data processing, a memory (not shown) used by the processor in a work area for data processing, arecording module 34 for recording processing data, a bus (not shown) for transmitting data between each module, and an interface module (hereinafter referred to as I/F module 35) for inputting/outputting data to/from an external apparatus. As an optional function, theultrasonic analysis apparatus 3 can be connected to an external server via a network such as the Internet. - The
input module 31 receives input of an operation from a user. For example, theinput module 31 may be a keyboard, a mouse, a touch panel, or the like. - The
signal processing module 32 is a functional block that receives an echo signal converted into the digital format from the transmitter/receiver 2 and performs various arithmetic processing functions such as calculation of an index corresponding to a muscle quality of thequadriceps femoris 92 to be analyzed. Thesignal processing module 32 may be implemented in hardware by a logic circuit formed on an integrated circuit, but in this embodiment, thesignal processing module 32 is implemented in software by the processor executing an ultrasonic analysis program P previously recorded in therecording module 34 or the memory. The ultrasonic analysis program P may be installed in theultrasonic analysis apparatus 3 via a network. Alternatively, the ultrasonic analysis program P may be installed in theultrasonic analysis apparatus 3 by causing theultrasonic analysis apparatus 3 to read a computer-readable non-temporary tangible recording medium, such as a CD-ROM, in which the ultrasonic analysis program P is recorded. Details of thesignal processing module 32 will be described later with reference toFIG. 4 . - The
output module 33 outputs a calculation result of thesignal processing module 32. By way of example, theoutput module 33 can be configured with a monitor, a printer, or the like. - The I/
F module 35 receives a signal (the converted echo signal) from the transmitter/receiver 2. -
FIG. 4 is a functional block diagram of thesignal processing module 32. Thesignal processing module 32 includes an ultrasonicimage generating module 321, animage compositing module 322, anarea setting module 323, anindex calculation module 324, a musclequality evaluation module 325, across-sectional area calculator 326, and adecision module 327. - [generation of ultrasonic image and stitched image] The ultrasonic
image generating module 321 generates an ultrasonic image of the inside of thebody 9 based on the echo signal input from the I/F module 35. As described above, the transmitter/receiver 2 transmits ultrasonic waves a plurality of times while alternately repeating the linear scan mode and the sector scan mode, and receives the echo signals reflected from inside thebody 9. Therefore, each time the transmitter/receiver 2 receives the echo signal, the I/F module 35 receives the converted echo signal. In response to this, the ultrasonicimage generating module 321 generates a linear scan image as an ultrasonic image from the echo signal received in the linear scan mode, and generates a sector scan image as an ultrasonic image from the echo signal received in the sector scan mode. In the present embodiment, the ultrasonicimage generating module 321 generates multiple linear scan images and multiple sector scan images, for example, 200 linear scan images and 200 sector scan images, thus, a total of 400 ultrasonic images. - The ultrasonic
image generating module 321 may correct the deformation caused by the pressing of theultrasonic probe 21 against the cross section of thebody 9 in the ultrasonic image, based on a force of theultrasonic probe 21 pressing thebody 9 and a position and direction of theultrasonic probe 21. -
FIG. 5 is a diagram for explaining generation of a linear scan image.FIG. 5A is a partial sectional view of thethigh 91, and thethigh 91 is divided into thequadriceps femoris 92 and other portions for convenience. In the linear scan mode, since the ultrasonic wave is directed to thezonal region 93, a real image region of the linear scan image also becomes thezonal region 93. For example, when the ultrasonic wave is directed to azonal region 93a, the linear scan image Li1 as shown inFIG. 5B is generated, when the ultrasonic wave is directed to azonal region 93b, the linear scan image Li2 as shown inFIG. 5C is generated, and when the ultrasonic wave is directed to azonal region 93c, the linear scan image Li3 as shown inFIG. 5D is generated. -
FIG. 6 is a diagram for explaining generation of a sector scan image.FIG. 6A is a partial sectional view of thethigh 91, and similarly toFIG. 5A , thethigh 91 is divided into thequadriceps femoris 92 and other portions for convenience. In the sector scan mode, since the ultrasonic wave is directed to the fan-shapedregion 94, a real image region in the sector scan image Se is fan-shaped as shown inFIG. 6B . - The
image compositing module 322 stitches a plurality of ultrasonic images (linear scan image and sector scan image) generated by the ultrasonicimage generating module 321 to generate a stitched image. The method for stitching the ultrasonic image is not particularly limited, and any known method can be used. For example, in the case of generating a stitched image by the method described inWO2017/010193A1 , theimage compositing module 322 detects and matches a feature amount between regions included in each of the plurality of ultrasonic images, thereby determining a position at which the plurality of ultrasonic images overlap. When theultrasonic probe 21 or theprobe adapter 24 is provided with the inclination sensor, theimage compositing module 322 rotates each ultrasonic image on the basis of a detection angle obtained from the inclination sensor, and performs matching on the basis of the rotated ultrasonic image. Thus, a rotation angle of each ultrasonic image can be accurately corrected, and an overlapped position of a fragment image can be determined with higher accuracy.FIG. 7 is an example of a stitched image of thethigh 91. - [setting the region of interest] The
area setting module 323 shown inFIG. 4 is a functional block for setting a region of interest (ROI: Region of Interest) for at least one of the stitched image and the ultrasonic image. In the present embodiment, thearea setting module 323 is a functional block that sets a region of interest for the stitched image and sets a region of interest for the ultrasonic image corresponding to the region of interest of the stitched image before the generation of the stitched image. - The
area setting module 323 may set one region of interest for theentire quadriceps femoris 92 included in the stitched image, or may evaluate the muscle qualities of each of a rectus femoris, vastus lateralis, vastus intermedius, and vastus medialis constituting thequadriceps femoris 92 in order to accurately evaluate the muscle qualities of thequadriceps femoris 92. Therefore, in this embodiment, thearea setting module 323 sets a region of interest for each of the rectus femoris, vastus lateralis, vastus intermedius, and vastus medialis. - The
area setting module 323 sets the region of interest in the stitched image in response to a user's operation via theinput module 31. Hereinafter, a specific example of setting a region of interest in the stitched image shown inFIG. 7 will be described. - The user operates the mouse or the like while viewing the stitched image shown in
FIG. 7 , and as shown inFIG. 8A , hits a point at the boundary position of the rectus femoris, vastus lateralis, vastus intermedius, and vastus medialis. In this case, a color of the point may be different depending on a type of the adjacent tissue. - The points shown in
FIG. 8A may be automatically set by a method for automatically detecting the boundaries of the rectus femoris, vastus lateralis, vastus intermedius, and vastus medialis. - Subsequently, as shown in
FIG. 8B , in response to a user's instruction via theinput module 31, points of the same color are connected to each other, whereby thesignal processing module 32 creates a boundary line. Thus, as shown inFIG. 8C , thequadriceps femoris 92 is divided into 4 regions such as the rectus femoris, the vastus lateralis, the vastus intermedius, and the vastus medialis, and thearea setting module 323 sets 4 regions as regions of interest R1 to R4, respectively. Thereafter, as shown inFIG. 8D , thearea setting module 323 extracts a mask image (masked image) comprising the set regions of interest R1 to R4 from the stitched image. As described above, setting of the region of interest for the stitched image is completed. - The regions of interest R1 to R4 are divided by hatching, a type of hatching is independent of brightness, which will be described later.
- Further, the
area setting module 323 sets a region of interest corresponding to the region of interest of the stitched image also for the ultrasonic image before the stitch. In the present embodiment, thearea setting module 323 overlaps the mask images composed of the regions of interest R1 to R4 extracted from the stitched image with the ultrasonic images. At this time, the mask image is rotated according to the rotation angle of each ultrasonic image. Thus, thearea setting module 323 can specify the boundary of the region of interest in each ultrasonic image and also set the region of interest for each ultrasonic image. - In an example, for the linear scan image Li3 shown in
FIG. 5D , the regions of interest R11, R12 and R13 included in the linear scan image Li3 are set as shown inFIG. 9A . For the sector scan image Se shown inFIG. 6B , regions of interest R21, R22, R23 and R24 included in the sector scan image Se are set as shown inFIG. 9B . - In the following description, the region of interest (For example, regions of interest R11 to R13 and R21 to R24) set in the ultrasonic image before synthesis is sometimes referred to as "secondary region of interest".
- [calculation of index] The
index calculation module 324 shown inFIG. 4 calculates an index related to the muscle from the secondary region(s) of interest set for the ultrasonic images before the stitch. In the present embodiment, theindex calculation module 324 calculates an index corresponding to the muscle quality of the muscle based on the image (here, it is an ultrasonic image, more specifically, a linear scan image or a sector scan image) corresponding to the secondary region of interest set for the ultrasonic image before synthesis. Since the brightness of the image of the muscle increases as the intramuscular fat content increases, theindex calculation module 324 calculates the average value of the brightness of the secondary region of interest of the ultrasonic image as an index. A specific example of the calculation method of the index is described below. - First, the
index calculation module 324 extracts the secondary region of interest set in each ultrasonic image. For example, from the linear scan image Li3 shown inFIG. 5D , secondary regions of interest R11, R12, and R13 corresponding to the rectus femoris, vastus lateralis, and vastus intermedius, respectively, are extracted as shown inFIG. 10 (A) . Further, from the sector scan image Se shown inFIG. 6B , secondary regions of interest R21, R22, R23, and R24 corresponding to the rectus femoris, vastus lateralis, vastus intermedius, and vastus medialis, respectively, are extracted as shown inFIG. 10 (B) . Theindex calculation module 324 performs the extraction process for all the linear scan images and the sector scan images. - Since there is a line (Lines of fascia within bones and the vastus lateralis) with high brightness in the region of interest, an outer peripheral edge of the region of interest may be removed (For example, a few pixels) for extraction. For the removal of high brightness lines, for example, line enhancement image filters, binarization, and high brightness line detection by the Dijkstra's algorithm, can be used.
- Subsequently, the
index calculation module 324 calculates the brightness of each region of interest.FIGs. 11 (A) and (B) are graphs showing the brightness of the secondary regions of interest R11 to R13 extracted from the 200 linear scan images, andFIGS. 11 (C) and (D) are graphs showing the brightness of the secondary region of interests R21 to R24 extracted from the 200 sector scan images. In each graph, the horizontal axis represents a number assigned to the acquisition order of the linear scan image or the sector scan image, and the vertical axis represents the brightness of the secondary region of interest. In addition, a portion where the brightness is 70% or more of the maximum brightness of the secondary region of interest is indicated by a thick line. - The
index calculation module 324 calculates an average value of brightness indicated by a thick line for each secondary region of interest, and outputs the calculated average value as an index corresponding to the muscle quality. In calculating the index, all the secondary regions of interest may be used, but the index may be calculated by selectively using either the linear scan image or the sector scan image depending on the part of the muscle. - The linear scan images and sector scan images have the following advantages and disadvantages. The linear scan image has the advantage of being less influenced by the characteristics of the echo and having high reliability. However, the linear scan image has the following disadvantages. Since the observation range at a given time is narrow and each secondary region of interest is only partially reflected, the linear scan image is easily affected by unevenness in the secondary region of interest. It is difficult to distinguish an image having a correct value from an image to be removed due to unevenness. In particular, the latter disadvantage is prominent in a linear scan image of the vastus medialis. In addition, the vastus medialis muscle has a smaller variation range than other muscles (with low sensitivity), and the effect of the directionality to which ultrasonic waves hit is greater.
- On the other hand, the sector scan image has the following advantages. Since an observation range at a given time is wide and many images include all or most part of the secondary region of interest, the sector scan image is averaged even if there is unevenness in the secondary region of interest. It is easy to distinguish an image having a correct value from an image having an abnormal value (when the secondary region of interest is not reflected behind the bone). The vastus medialis muscle, which shows a large change in the linear scan image, shows the same change as other muscles in the sector scan image. On the other hand, the sector scan image is easily affected by the characteristics of the echo, and has a disadvantage that the deeper the sector scan image is, the worse the echo characteristics become.
- Based on the characteristics of the linear scan image and the sector scan image as described above, an image for calculating the index may be selected for each muscle region. For the vastus lateralis and vastus intermedius in the
quadriceps femoris 92, the correlation between the brightness of the secondary region of interest and the equivalent CT value tends to be higher in the linear scan image than in the sector scan image. Therefore, for the vastus lateralis and vastus intermedius, an index may be calculated using the linear scan image. On the other hand, for the rectus femoris and vastus medialis in thequadriceps femoris 92, the correlation between the brightness of the secondary region of interest and the CT value equivalent tends to be higher in the sector scan image than in the linear scan image. Therefore, for the rectus femoris and vastus medialis, an index may be calculated using the sector scan image. - The brightness can be expressed in 0 ~ 255 gradations. However, due to a possibility that an error may occur depending on the region of the muscle or the method of scanning, a brightness correction technique may be used to calculate a corrected brightness. The calculation of the corrected brightness is possible by a) correcting for scaling according to the part in order to evaluate a tendency of the part that is bright and the part that is dark appears in the same order, and b) correcting for differences of trends when using a mix of results from different scanning methods. As a result, it is not necessary to standardize settings related to image quality and brightness such as a gain of the transmitter/
receiver 2. - Since the brightness is an image processing value under a specific condition, it can be generalized by converting it into a physical index. For example, brightness can be converted to dB as an echo reflection level. Specifically, a reference can be determined by a substance corresponding to 0 dB (For example, a phantom for quality control), and the brightness can be converted to dB from measurement or calculation. This makes it possible to correct variations in mass production through inspection and correction, and to standardize indices for multiple models.
- Further, the
index calculation module 324 may calculate a CT value equivalent value (HU), an MRI equivalent value (T1, T2), or a muscle tissue evaluation value (Fat equivalent (%), effective muscle cross-sectional area, etc.) of the image as an index corresponding to the muscle quality, instead of the average value of the brightness. These values can be correlated with clinically significant data, such as CT and MRI measurements and the actual anatomic and medical condition of the muscle. - [evaluation of muscle quality] The muscle
quality evaluation module 325 shown inFIG. 4 evaluates the muscle quality based on the index calculated by theindex calculation module 324. When the index is an average value of brightness, it can be evaluated that the larger the average value is, the larger the amount of fat in the muscle and lower is the muscle quality. - A histogram representing the brightness distribution can also be used to evaluate the muscle quality. For example, as shown in
FIGs. 12 (A) and 12 (B) , since a ratio of the number of pixels to a specific brightness value is different between the elderly and the young, the muscle quality can be evaluated based on the ratio. - Alternatively, the muscle quality can be evaluated by a size relationship of the region of the brightness distribution. Since the brightness distribution differs as the muscle quality decreases from the healthy state, for example, as shown in
FIG. 13 , the brightness values in the gray area and the areas before and after the gray area are judged in 3 stages of ⊚ (abound), ∘ (intermediate), and △ (little), and the muscle quality is evaluated by the combination of the size relation. In each graph ofFIG. 13 , the vertical axis and the horizontal axis represent brightness and image number, respectively. - Alternatively, patterns and spatial frequencies can be used to evaluate muscle quality. For example, a two-dimensional fast Fourier transform (FFT: Fast Fourier Transform) is performed on a linear scan image. The upper four images shown in
FIG. 14 are images before conversion, and the lower four images are images after conversion. In the normal state, a high frequency component of the brightness in the converted image is larger than a low frequency component, and the low frequency component is at a low level, but the distribution of the brightness moves to the low frequency side with the lowering of the muscle quality. Therefore, the muscle quality can be evaluated based on the high frequency component and the low frequency component. It should be noted that this evaluation method can improve the evaluation accuracy by additionally performing the above-mentioned muscle quality evaluation using the average value or histogram of brightness. - The
cross-sectional area calculator 326 shown inFIG. 4 calculates the cross-sectional areas of the rectus femoris, vastus lateralis, vastus intermedius, and vastus medialis of thequadriceps femoris 92. The calculation result is an input to the musclequality evaluation module 325 together with the evaluation result of thedecision module 327. Thedecision module 327 also receives subject information T such as the age, sex, height, and weight of thebody 9 stored in therecording module 34. Thecross-sectional area calculator 326 and the subject information T may have any configuration. - The
decision module 327 presents the evaluation result of the muscle quality, the muscle cross-sectional area, and reference data based on the subject information T inputted from the musclequality evaluation module 325 and thecross-sectional area calculator 326, respectively. Further, thedecision module 327 performs calculation (e.g., T-SCORE) in comparison with the reference data for determination. These results are output to theoutput module 33 and can be confirmed by the user. - [ultrasonic analysis method]
FIG. 15 is a flow chart showing a flow of processing in an ultrasonic analysis method according to the present embodiment. The ultrasonic analysis method according to the present embodiment can be implemented by the transmitter/receiver 2 and theultrasonic analysis apparatus 3. - In step S1, the transmitter/
receiver 2 shown inFIG. 1 transmits ultrasonic waves from different positions from the transducer of theultrasonic probe 21 toward the muscles inside of thebody 9, and receives the echo signals reflected from inside of thebody 9 by the transducer of theultrasonic probe 21. In this embodiment, the muscle is thequadriceps femoris 92. The transmitter/receiver 2 digitally converts the received echo signal and transmits it to theultrasonic analysis apparatus 3, and the I/F module 35 of theultrasonic analysis apparatus 3 receives the echo signal from the transmitter/receiver 2. - In step S2, the ultrasonic
image generating module 321 shown inFIG. 4 generates an ultrasonic image of the inside of thebody 9 based on the received echo signal. In the present embodiment, the ultrasonicimage generating module 321 generates a linear scan image and a sector scan image as ultrasonic images. - In step S3, the
image compositing module 322 stitches the ultrasonic images to generate a stitched image. - In step S4, the
area setting module 323 sets a region of interest for the stitched image and the ultrasonic image before the stitching. In this embodiment, a region of interest is set for each of the rectus femoris, vastus lateralis, vastus intermedius, and vastus medialis constituting thequadriceps femoris 92. - In step S5, the
index calculation module 324 calculates an index corresponding to the muscle quality based on the image corresponding to the secondary region of interest set for the ultrasonic image before the stitching. The index is, for example, an average value of brightness of an image. - In step S6, the muscle
quality evaluation module 325 evaluates the muscle quality based on the index. The evaluation of the muscle quality can be performed based on the average value of the brightness, the histogram of the brightness, the ratio of the number of pixels of a specific brightness value, etc. - In step S7, the cross-sectional
area calculating module 326 calculates a muscle cross-sectional area. In the present embodiment, the cross-sectionalarea calculation module 326 calculates the cross-sectional areas of the rectus femoris, vastus lateralis, vastus intermedius, and vastus medialis of thequadriceps femoris 92. - In step S7, the
decision module 327 presents the evaluation result of the muscle quality, the muscle cross-sectional area, and reference data based on the subject information T. - [summary of the embodiments] According to the
ultrasonic analysis apparatus 3 and the ultrasonic analysis method according to the present embodiment, it is possible to evaluate the muscle quality by analyzing an ultrasonic image without using a CT apparatus or an MRI apparatus having a complicated configuration as in the prior art. Therefore, it is possible to evaluate the muscle quality with a relatively simple constitution without accompanying exposure to possibly harmful radiations. - While the embodiments of the present invention have been described above, the present invention is not limited to the embodiments described above, and various modifications can be made provided they fall under the scope of the appended claims.
- In the above embodiment, the
index calculation module 324 calculates the index corresponding to the muscle quality from the secondary region of interest set for the ultrasonic image before synthesis, in accordance with the invention but the index could have been calculated from the region of interest set for the stitched image in an example outside the scope of the present invention. However, in this example, the brightness decreases according to the depth in the ultrasonic image, and thus, the brightness is affected in the stitched image. Therefore, in accordance with the invention, the index is calculated from the secondary region of interest set for the ultrasonic image before synthesis. - Further, in the above embodiment, while one
ultrasonic probe 21 is moved along the surface of thethigh 91, a plurality of ultrasonic images are acquired by transmitting ultrasonic waves from different positions toward the quadriceps femoris 92 a plurality of times, but the method for acquiring the plurality of ultrasonic images is not limited thereto. For example, a plurality of ultrasonic probes, similar to theultrasonic probe 21, may be disposed around thethigh 91, and ultrasonic waves may be simultaneously transmitted from each ultrasonic probe toward thequadriceps femoris 92 to obtain the plurality of ultrasonic images. - Although the ultrasonic
image generating module 321 generates the linear scan image and the sector scan image as ultrasonic images in the aforementioned embodiment, the ultrasonicimage generating module 321 may generate only one of the linear scan image and the sector scan image in various other embodiments. Alternatively, the ultrasonicimage generating module 321 may generate a convex image as an ultrasonic image. In this case, the region of interest may be set in the convex image, and the index corresponding to the muscle quality may be calculated from the image corresponding to the region of interest. - In the above embodiment, 200 linear scan images and 200 sector scan images are used for calculating the index respectively, but the number of ultrasonic images used for calculating the index is not particularly limited, and a part of the acquired ultrasonic images may be selected and used for calculating the index. For example, 50 images may be selected at predetermined intervals from the total 400 ultrasonic images arranged in an order of acquisition.
- Further, when setting the region of interest in the stitched image, in the above embodiment, the
quadriceps femoris 92 is divided into four regions of the rectus femoris, vastus lateralis, vastus intermedius, and vastus medialis, but it may be difficult to manually find the boundary of the region depending on the subject. Therefore, for example, as shown inFIG. 16 , a typical position of the muscle may be surrounded by a frame having a simple shape such as a circular frame, and an area within the frame may be set as a region of interest. In the example shown inFIG. 16 , a circular frame C1 including the rectus femoris is set as a region of interest R1. In the case of a muscle having an elongated cross-sectional shape such as the vastus lateralis muscle, a region within the muscle may be surrounded by a plurality of circular frames C2a and C2b, and a region within the circular frames C2a and C2b may be set as a region of interest R2. - When the
quadriceps femoris 92 is used as the analysis subject of the muscle quality, one region of interest may be set for theentire quadriceps femoris 92, or at least one of the rectus femoris, vastus lateralis, vastus intermedius, and vastus medialis constituting thequadriceps femoris 92. - In the above embodiment, the analysis subject of the muscle is the
quadriceps femoris 92, but the present invention is not limited thereto, and any muscle such as the back of thethigh 91, the calf, and the upper arm muscle can be included in the analysis subject. - Further, in the above embodiment, in order to obtain an ultrasonic image corresponding to a plurality of mutually different positions on the surface of the
body 9, the ultrasonic wave is intermittently transmitted from theultrasonic probe 21 while theultrasonic probe 21 is moved along the surface of thebody 9, the embodiments for obtaining ultrasound images are not limited thereto. For example, a plurality ofultrasonic probes 21 may be arranged in thebody 9, and ultrasonic waves may be transmitted simultaneously from eachultrasonic probe 21. -
- 1
- ultrasonic analysis system
- 2
- transmitter/receiver
- 21
- ultrasonic probe
- 22
- transmitting and receiving module
- 23
- A/D conversion module
- 24
- probe adapter
- 3
- ultrasonic analysis apparatus
- 31
- input module
- 32
- signal processing module
- 321
- ultrasonic image generating module
- 322
- image compositing module
- 323
- area setting module
- 324
- index calculation module
- 325
- muscle quality evaluation module
- 326
- cross-sectional area calculator
- 327
- decision module
- 33
- output module
- 34
- recording module
- 35
- interface module
- 9
- body
- 91
- thigh
- 92
- quadriceps femoris
- 93
- zonal region
- 93a
- zonal region
- 93b
- zonal region
- 93c
- zonal region
- 94
- fan-shaped region
- C1
- circular frame
- C2a
- circular frame
- C2b
- circular frame
- Li1
- linear scan image
- Li2
- linear scan image
- Li3
- linear scan image
- P
- ultrasonic analysis program
- R1 - R4
- regions of interest
- R 11 to R 14
- regions of interest
-
R 21 toR 24 - regions of interest
- Se
- sector scan image
- T
- subject information
Claims (9)
- An ultrasonic analysis apparatus (3), comprising:an interface module (35) configured to receive signals from a transmitter/receiver (2) which receives ultrasonic waves transmitted from a plurality of mutually different positions on a surface of a body (9) toward a muscle inside the body (9) and reflected from inside the body (9);an ultrasonic image generating module (321) configured to generate a plurality of ultrasonic images corresponding to the respective positions based on the signals inputted from the interface module (35);an image compositing module (322) configured to stitch the plurality of ultrasonic images at the respective positions to generate a stitched image;an area setting module (323) configured to both set a region of interest for the stitched image and a secondary region of interest for at least one ultrasonic image of the plurality of ultrasonic images before the stitch, the region of interest set for the stitched image and each secondary region of interest set for the at least one ultrasonic image before the stitch corresponding to each other; andan index calculation module (324) configured to calculate an index related to the muscle, the index corresponding to a muscle quality of the muscle, from the secondary region(s) of interest set for the at least one ultrasonic image before the stitch.
- The ultrasonic analysis apparatus (3) of claim 1, wherein:
the plurality of ultrasonic images include at least one of a linear scan image and a sector scan image. - The ultrasonic analysis apparatus (3) any one of claims 1 to 2, wherein:
the index is an average value of a brightness of the secondary region(s) of interest. - The ultrasonic analysis apparatus (3) any one of claims 1 to 3, wherein:
the muscle is a quadriceps femoris (92). - The ultrasonic analysis apparatus (3) of claim 4, wherein:the area setting module (323) sets the region of interest and secondary region(s) of interest for each of a rectus femoris, a vastus lateralis, a vastus intermedius, and a vastus medialis of the quadriceps femoris (92), andthe index calculation module (324) calculates the index related to each muscle of the rectus femoris, the vastus lateralis, the vastus intermedius, and the vastus medialis.
- The ultrasonic analysis apparatus (3) of claim 5, wherein:the plurality of ultrasonic images include a sector scan image and a linear scan image, andthe index calculation module (324) calculates the index related to each muscle of the vastus lateralis and the vastus intermedius from the secondary region(s) of interest set in the linear scan image, and calculates the index related to each muscle of the rectus femoris and the vastus medialis from the secondary region(s) of interest set in the sector scan image.
- The ultrasonic analysis apparatus (3) any one of claims 1 to 6, wherein:
the area setting module (323) extracts a mask image comprising the region of interest set in the stitched image from the stitched image and sets the secondary region of interest for the at least one ultrasonic image before the stitch by overlapping the mask image on the ultrasonic image - An ultrasonic analysis method, comprising the steps of:receiving signals from a transmitter/receiver (2) which receives ultrasonic waves transmitted from a plurality of mutually different positions on a surface of a body (9) toward a muscle inside the body (9) and reflected from inside the body (9);generating a plurality of ultrasonic images corresponding to the respective positions based on the received signals;stitching the plurality of ultrasonic images at the respective positions to generate a stitched image;setting both a region of interest for the stitched image and a secondary region of interest for at least one ultrasonic image of the plurality of ultrasonic images before the stitch, the region of interest set for the stitched image and each secondary region of interest set for the at least one ultrasonic image before the stitch corresponding to each other; andcalculating an index related to the muscle, the index corresponding to a muscle quality of the muscle, from the secondary region(s) of interest set for the at least one ultrasonic image before the stitch.
- An ultrasonic analysis program configured to cause a computer to execute processing, the computer controlling an ultrasonic analysis apparatus according to any one of claims 1 to 7, which program comprises instructions, which when run on the computer, cause the ultrasonic analysis apparatus to carry out the method of claim 8.
Applications Claiming Priority (2)
| Application Number | Priority Date | Filing Date | Title |
|---|---|---|---|
| JP2018155356 | 2018-08-22 | ||
| PCT/JP2019/027884 WO2020039796A1 (en) | 2018-08-22 | 2019-07-16 | Ultrasonic analysis device, ultrasonic analysis method, and ultrasonic analysis program |
Publications (3)
| Publication Number | Publication Date |
|---|---|
| EP3841983A1 EP3841983A1 (en) | 2021-06-30 |
| EP3841983A4 EP3841983A4 (en) | 2022-05-18 |
| EP3841983B1 true EP3841983B1 (en) | 2024-01-10 |
Family
ID=69592509
Family Applications (1)
| Application Number | Title | Priority Date | Filing Date |
|---|---|---|---|
| EP19850967.1A Active EP3841983B1 (en) | 2018-08-22 | 2019-07-16 | Ultrasonic analysis device, ultrasonic analysis method, and ultrasonic analysis program |
Country Status (5)
| Country | Link |
|---|---|
| US (1) | US20210169454A1 (en) |
| EP (1) | EP3841983B1 (en) |
| JP (1) | JP7179860B2 (en) |
| CN (1) | CN112367922A (en) |
| WO (1) | WO2020039796A1 (en) |
Families Citing this family (4)
| Publication number | Priority date | Publication date | Assignee | Title |
|---|---|---|---|---|
| EP4338684A1 (en) * | 2021-05-11 | 2024-03-20 | Furuno Electric Co., Ltd. | Ultrasonic imaging device, ultrasonic imaging method, ultrasonic imaging system, and ultrasonic imaging program |
| WO2023089845A1 (en) * | 2021-11-19 | 2023-05-25 | 古野電気株式会社 | Ultrasonic imaging device, ultrasonic imaging system, ultrasonic imaging method, and ultrasonic imaging program |
| TWI797976B (en) * | 2022-01-26 | 2023-04-01 | 國立成功大學 | Method for measuring muscle mass |
| CN116977184B (en) * | 2023-08-01 | 2024-03-19 | 南方电网数字电网研究院股份有限公司 | Transmission line image acquisition method, device, computer equipment and storage medium |
Family Cites Families (8)
| Publication number | Priority date | Publication date | Assignee | Title |
|---|---|---|---|---|
| US8167802B2 (en) * | 2002-09-12 | 2012-05-01 | Hitachi Medical Corporation | Biological tissue motion trace method and image diagnosis device using the trace method |
| US7092749B2 (en) * | 2003-06-11 | 2006-08-15 | Siemens Medical Solutions Usa, Inc. | System and method for adapting the behavior of a diagnostic medical ultrasound system based on anatomic features present in ultrasound images |
| JP2009247739A (en) * | 2008-04-09 | 2009-10-29 | Toshiba Corp | Medical image processing and displaying device, computer processing program thereof, and ultrasonic diagnosing equipment |
| JP5596393B2 (en) * | 2010-03-31 | 2014-09-24 | 古野電気株式会社 | Pixel data generation device, image display device, radar device, pixel data generation method, and pixel data generation program |
| US9179890B2 (en) * | 2011-07-14 | 2015-11-10 | Siemens Aktiengesellschaft | Model-based positioning for intracardiac echocardiography volume stitching |
| CN108938004A (en) | 2015-07-13 | 2018-12-07 | 古野电气株式会社 | Probe adapter, ultrasonic imaging apparatus |
| CN110022774B (en) * | 2016-11-29 | 2022-08-30 | 皇家飞利浦有限公司 | Ultrasound imaging system and method |
| US11064971B2 (en) * | 2016-11-30 | 2021-07-20 | Musclesound, Inc. | Non-Invasive determination of muscle tissue quality and intramuscular fat |
-
2019
- 2019-07-16 JP JP2020538231A patent/JP7179860B2/en active Active
- 2019-07-16 EP EP19850967.1A patent/EP3841983B1/en active Active
- 2019-07-16 WO PCT/JP2019/027884 patent/WO2020039796A1/en unknown
- 2019-07-16 CN CN201980045489.5A patent/CN112367922A/en active Pending
-
2021
- 2021-02-22 US US17/182,103 patent/US20210169454A1/en active Pending
Also Published As
| Publication number | Publication date |
|---|---|
| WO2020039796A1 (en) | 2020-02-27 |
| EP3841983A4 (en) | 2022-05-18 |
| JP7179860B2 (en) | 2022-11-29 |
| JPWO2020039796A1 (en) | 2021-08-12 |
| US20210169454A1 (en) | 2021-06-10 |
| CN112367922A (en) | 2021-02-12 |
| EP3841983A1 (en) | 2021-06-30 |
Similar Documents
| Publication | Publication Date | Title |
|---|---|---|
| EP3841983B1 (en) | Ultrasonic analysis device, ultrasonic analysis method, and ultrasonic analysis program | |
| JP5730979B2 (en) | Ultrasonic diagnostic apparatus and elasticity evaluation method | |
| US7985182B2 (en) | Ultrasonic diagnostic apparatus and ultrasonic image acquiring method | |
| US10743845B2 (en) | Ultrasound diagnostic apparatus and method for distinguishing a low signal/noise area in an ultrasound image | |
| US20130046168A1 (en) | Method and system of characterization of carotid plaque | |
| US20100249590A1 (en) | Ultrasonic diagnosis apparatus and ultrasonic image generating method | |
| US20050283076A1 (en) | Non-invasive diagnosis of breast cancer using real-time ultrasound strain imaging | |
| US20100014738A1 (en) | Method and system for breast cancer screening | |
| JP5192921B2 (en) | Ultrasonic diagnostic equipment | |
| US20100256493A1 (en) | Ultrasonic diagostic apparatus, operation method thereof, and ultrasonic diagnostic program | |
| JP6216736B2 (en) | Ultrasonic diagnostic apparatus and ultrasonic diagnostic method | |
| US20120065512A1 (en) | Ultrasonic diagnostic apparatus and ultrasonic image processng apparatus | |
| US10101450B2 (en) | Medical image processing apparatus, a medical image processing method and a medical diagnosis apparatus | |
| JP2016506809A (en) | Ultrasound imaging system and method | |
| US20050129297A1 (en) | Classification of breast lesion method and system | |
| JP5235103B2 (en) | Ultrasonic diagnostic equipment | |
| US7050610B2 (en) | Method and system for improving the spatial resolution for strain imaging | |
| US8083679B1 (en) | Ultrasonic imaging apparatus | |
| CN109069117B (en) | Ultrasonic diagnostic apparatus | |
| Ng et al. | Automatic measurement of human subcutaneous fat with ultrasound | |
| JP7432426B2 (en) | Ultrasonic diagnostic equipment, signal processing equipment, and signal processing programs | |
| CN113491535B (en) | Ultrasonic diagnostic apparatus, signal processing apparatus, and recording medium | |
| JP4217542B2 (en) | Ultrasonic diagnostic equipment | |
| JP7187734B1 (en) | Image processing device and program | |
| JP7238164B2 (en) | Ultrasound Observation Apparatus, Ultrasound Observation System, Ultrasound Observation Method, Ultrasound Observation Program, and Ultrasound Endoscope System |
Legal Events
| Date | Code | Title | Description |
|---|---|---|---|
| STAA | Information on the status of an ep patent application or granted ep patent |
Free format text: STATUS: THE INTERNATIONAL PUBLICATION HAS BEEN MADE |
|
| PUAI | Public reference made under article 153(3) epc to a published international application that has entered the european phase |
Free format text: ORIGINAL CODE: 0009012 |
|
| STAA | Information on the status of an ep patent application or granted ep patent |
Free format text: STATUS: REQUEST FOR EXAMINATION WAS MADE |
|
| 17P | Request for examination filed |
Effective date: 20210319 |
|
| AK | Designated contracting states |
Kind code of ref document: A1 Designated state(s): AL AT BE BG CH CY CZ DE DK EE ES FI FR GB GR HR HU IE IS IT LI LT LU LV MC MK MT NL NO PL PT RO RS SE SI SK SM TR |
|
| DAV | Request for validation of the european patent (deleted) | ||
| DAX | Request for extension of the european patent (deleted) | ||
| REG | Reference to a national code |
Ref country code: DE Ref legal event code: R079 Ref document number: 602019045020 Country of ref document: DE Free format text: PREVIOUS MAIN CLASS: A61B0008140000 Ipc: A61B0008000000 Ref legal event code: R079 |
|
| A4 | Supplementary search report drawn up and despatched |
Effective date: 20220420 |
|
| RIC1 | Information provided on ipc code assigned before grant |
Ipc: A61B 8/08 20060101ALI20220412BHEP Ipc: A61B 8/14 20060101ALI20220412BHEP Ipc: A61B 8/00 20060101AFI20220412BHEP |
|
| GRAP | Despatch of communication of intention to grant a patent |
Free format text: ORIGINAL CODE: EPIDOSNIGR1 |
|
| STAA | Information on the status of an ep patent application or granted ep patent |
Free format text: STATUS: GRANT OF PATENT IS INTENDED |
|
| INTG | Intention to grant announced |
Effective date: 20230927 |
|
| GRAS | Grant fee paid |
Free format text: ORIGINAL CODE: EPIDOSNIGR3 |
|
| GRAA | (expected) grant |
Free format text: ORIGINAL CODE: 0009210 |
|
| STAA | Information on the status of an ep patent application or granted ep patent |
Free format text: STATUS: THE PATENT HAS BEEN GRANTED |
|
| AK | Designated contracting states |
Kind code of ref document: B1 Designated state(s): AL AT BE BG CH CY CZ DE DK EE ES FI FR GB GR HR HU IE IS IT LI LT LU LV MC MK MT NL NO PL PT RO RS SE SI SK SM TR |
|
| REG | Reference to a national code |
Ref country code: GB Ref legal event code: FG4D |
|
| REG | Reference to a national code |
Ref country code: CH Ref legal event code: EP |
|
| REG | Reference to a national code |
Ref country code: DE Ref legal event code: R096 Ref document number: 602019045020 Country of ref document: DE |
|
| REG | Reference to a national code |
Ref country code: IE Ref legal event code: FG4D |