EP3789751A1 - Verfahren und system zur bestimmung der thrombozytenkonzentration - Google Patents
Verfahren und system zur bestimmung der thrombozytenkonzentration Download PDFInfo
- Publication number
- EP3789751A1 EP3789751A1 EP19792132.3A EP19792132A EP3789751A1 EP 3789751 A1 EP3789751 A1 EP 3789751A1 EP 19792132 A EP19792132 A EP 19792132A EP 3789751 A1 EP3789751 A1 EP 3789751A1
- Authority
- EP
- European Patent Office
- Prior art keywords
- platelet
- suspension
- histogram
- blood sample
- signals
- Prior art date
- Legal status (The legal status is an assumption and is not a legal conclusion. Google has not performed a legal analysis and makes no representation as to the accuracy of the status listed.)
- Granted
Links
Images


Classifications
-
- G—PHYSICS
- G01—MEASURING; TESTING
- G01N—INVESTIGATING OR ANALYSING MATERIALS BY DETERMINING THEIR CHEMICAL OR PHYSICAL PROPERTIES
- G01N33/00—Investigating or analysing materials by specific methods not covered by groups G01N1/00 - G01N31/00
- G01N33/48—Biological material, e.g. blood, urine; Haemocytometers
- G01N33/483—Physical analysis of biological material
- G01N33/487—Physical analysis of biological material of liquid biological material
- G01N33/49—Blood
-
- G—PHYSICS
- G01—MEASURING; TESTING
- G01N—INVESTIGATING OR ANALYSING MATERIALS BY DETERMINING THEIR CHEMICAL OR PHYSICAL PROPERTIES
- G01N15/00—Investigating characteristics of particles; Investigating permeability, pore-volume or surface-area of porous materials
- G01N15/06—Investigating concentration of particle suspensions
- G01N15/0656—Investigating concentration of particle suspensions using electric, e.g. electrostatic methods or magnetic methods
-
- G—PHYSICS
- G01—MEASURING; TESTING
- G01N—INVESTIGATING OR ANALYSING MATERIALS BY DETERMINING THEIR CHEMICAL OR PHYSICAL PROPERTIES
- G01N15/00—Investigating characteristics of particles; Investigating permeability, pore-volume or surface-area of porous materials
- G01N15/10—Investigating individual particles
- G01N15/1031—Investigating individual particles by measuring electrical or magnetic effects
- G01N15/12—Investigating individual particles by measuring electrical or magnetic effects by observing changes in resistance or impedance across apertures when traversed by individual particles, e.g. by using the Coulter principle
-
- G—PHYSICS
- G01—MEASURING; TESTING
- G01N—INVESTIGATING OR ANALYSING MATERIALS BY DETERMINING THEIR CHEMICAL OR PHYSICAL PROPERTIES
- G01N15/00—Investigating characteristics of particles; Investigating permeability, pore-volume or surface-area of porous materials
- G01N15/10—Investigating individual particles
- G01N15/14—Optical investigation techniques, e.g. flow cytometry
- G01N15/1456—Optical investigation techniques, e.g. flow cytometry without spatial resolution of the texture or inner structure of the particle, e.g. processing of pulse signals
- G01N15/1459—Optical investigation techniques, e.g. flow cytometry without spatial resolution of the texture or inner structure of the particle, e.g. processing of pulse signals the analysis being performed on a sample stream
-
- G—PHYSICS
- G01—MEASURING; TESTING
- G01N—INVESTIGATING OR ANALYSING MATERIALS BY DETERMINING THEIR CHEMICAL OR PHYSICAL PROPERTIES
- G01N33/00—Investigating or analysing materials by specific methods not covered by groups G01N1/00 - G01N31/00
- G01N33/48—Biological material, e.g. blood, urine; Haemocytometers
- G01N33/483—Physical analysis of biological material
- G01N33/487—Physical analysis of biological material of liquid biological material
- G01N33/48707—Physical analysis of biological material of liquid biological material by electrical means
-
- G—PHYSICS
- G16—INFORMATION AND COMMUNICATION TECHNOLOGY [ICT] SPECIALLY ADAPTED FOR SPECIFIC APPLICATION FIELDS
- G16H—HEALTHCARE INFORMATICS, i.e. INFORMATION AND COMMUNICATION TECHNOLOGY [ICT] SPECIALLY ADAPTED FOR THE HANDLING OR PROCESSING OF MEDICAL OR HEALTHCARE DATA
- G16H10/00—ICT specially adapted for the handling or processing of patient-related medical or healthcare data
- G16H10/40—ICT specially adapted for the handling or processing of patient-related medical or healthcare data for data related to laboratory analysis, e.g. patient specimen analysis
-
- G—PHYSICS
- G16—INFORMATION AND COMMUNICATION TECHNOLOGY [ICT] SPECIALLY ADAPTED FOR SPECIFIC APPLICATION FIELDS
- G16H—HEALTHCARE INFORMATICS, i.e. INFORMATION AND COMMUNICATION TECHNOLOGY [ICT] SPECIALLY ADAPTED FOR THE HANDLING OR PROCESSING OF MEDICAL OR HEALTHCARE DATA
- G16H15/00—ICT specially adapted for medical reports, e.g. generation or transmission thereof
-
- G—PHYSICS
- G16—INFORMATION AND COMMUNICATION TECHNOLOGY [ICT] SPECIALLY ADAPTED FOR SPECIFIC APPLICATION FIELDS
- G16H—HEALTHCARE INFORMATICS, i.e. INFORMATION AND COMMUNICATION TECHNOLOGY [ICT] SPECIALLY ADAPTED FOR THE HANDLING OR PROCESSING OF MEDICAL OR HEALTHCARE DATA
- G16H40/00—ICT specially adapted for the management or administration of healthcare resources or facilities; ICT specially adapted for the management or operation of medical equipment or devices
- G16H40/60—ICT specially adapted for the management or administration of healthcare resources or facilities; ICT specially adapted for the management or operation of medical equipment or devices for the operation of medical equipment or devices
- G16H40/63—ICT specially adapted for the management or administration of healthcare resources or facilities; ICT specially adapted for the management or operation of medical equipment or devices for the operation of medical equipment or devices for local operation
-
- G—PHYSICS
- G16—INFORMATION AND COMMUNICATION TECHNOLOGY [ICT] SPECIALLY ADAPTED FOR SPECIFIC APPLICATION FIELDS
- G16H—HEALTHCARE INFORMATICS, i.e. INFORMATION AND COMMUNICATION TECHNOLOGY [ICT] SPECIALLY ADAPTED FOR THE HANDLING OR PROCESSING OF MEDICAL OR HEALTHCARE DATA
- G16H40/00—ICT specially adapted for the management or administration of healthcare resources or facilities; ICT specially adapted for the management or operation of medical equipment or devices
- G16H40/60—ICT specially adapted for the management or administration of healthcare resources or facilities; ICT specially adapted for the management or operation of medical equipment or devices for the operation of medical equipment or devices
- G16H40/67—ICT specially adapted for the management or administration of healthcare resources or facilities; ICT specially adapted for the management or operation of medical equipment or devices for the operation of medical equipment or devices for remote operation
-
- G—PHYSICS
- G01—MEASURING; TESTING
- G01N—INVESTIGATING OR ANALYSING MATERIALS BY DETERMINING THEIR CHEMICAL OR PHYSICAL PROPERTIES
- G01N15/00—Investigating characteristics of particles; Investigating permeability, pore-volume or surface-area of porous materials
- G01N15/06—Investigating concentration of particle suspensions
- G01N15/075—Investigating concentration of particle suspensions by optical means
-
- G—PHYSICS
- G01—MEASURING; TESTING
- G01N—INVESTIGATING OR ANALYSING MATERIALS BY DETERMINING THEIR CHEMICAL OR PHYSICAL PROPERTIES
- G01N15/00—Investigating characteristics of particles; Investigating permeability, pore-volume or surface-area of porous materials
- G01N15/01—Investigating characteristics of particles; Investigating permeability, pore-volume or surface-area of porous materials specially adapted for biological cells, e.g. blood cells
- G01N2015/016—White blood cells
-
- G—PHYSICS
- G01—MEASURING; TESTING
- G01N—INVESTIGATING OR ANALYSING MATERIALS BY DETERMINING THEIR CHEMICAL OR PHYSICAL PROPERTIES
- G01N15/00—Investigating characteristics of particles; Investigating permeability, pore-volume or surface-area of porous materials
- G01N15/01—Investigating characteristics of particles; Investigating permeability, pore-volume or surface-area of porous materials specially adapted for biological cells, e.g. blood cells
- G01N2015/018—Platelets
-
- G—PHYSICS
- G01—MEASURING; TESTING
- G01N—INVESTIGATING OR ANALYSING MATERIALS BY DETERMINING THEIR CHEMICAL OR PHYSICAL PROPERTIES
- G01N15/00—Investigating characteristics of particles; Investigating permeability, pore-volume or surface-area of porous materials
- G01N15/10—Investigating individual particles
- G01N2015/1006—Investigating individual particles for cytology
-
- G—PHYSICS
- G01—MEASURING; TESTING
- G01N—INVESTIGATING OR ANALYSING MATERIALS BY DETERMINING THEIR CHEMICAL OR PHYSICAL PROPERTIES
- G01N15/00—Investigating characteristics of particles; Investigating permeability, pore-volume or surface-area of porous materials
- G01N15/10—Investigating individual particles
- G01N2015/1019—Associating Coulter-counter and optical flow cytometer [OFC]
-
- G—PHYSICS
- G01—MEASURING; TESTING
- G01N—INVESTIGATING OR ANALYSING MATERIALS BY DETERMINING THEIR CHEMICAL OR PHYSICAL PROPERTIES
- G01N15/00—Investigating characteristics of particles; Investigating permeability, pore-volume or surface-area of porous materials
- G01N15/10—Investigating individual particles
- G01N15/14—Optical investigation techniques, e.g. flow cytometry
- G01N2015/1486—Counting the particles
Definitions
- the present disclosure relates to methods and systems for determining a platelet concentration in a blood sample. More specifically, the present disclosure relates to determination of the platelet concentration using an impedance measurement of platelets in a diluted blood sample in combination with an optical measurement of platelets in a lysed blood sample.
- the platelet count is less than 20 x 10 9 per liter, it may become necessary to transfuse platelets. Otherwise, the patient may potentially have life threatening bleeding.
- an impedance measurement system provides relatively accurate results in measuring platelet count, it has certain limitations.
- an impedance measurement method is not able to differentiate between platelets and interfering particles, such as microcytes and schistocytes (fragmented red blood cells), which leads to falsely high platelet count.
- large platelets and giant platelets may fall outside a defined threshold for platelets and be classified as red blood cells, which leads to falsely low platelet count.
- a mathematical curve fitting is performed on the platelet volume distribution in a histogram between 2 and 20 femtoliters (fL) in order to extend a dynamic range up to 70 fL.
- fL femtoliters
- an accurate platelet count cannot be obtained under certain circumstances, for example, if the platelet distribution does not fit into a logarithmic distribution, or if the upper end of the platelet distribution is not decreasing, the mean platelet volume is outside its normal range, and the fitting mode is no longer applicable. Under these circumstances, it is often that only those platelets located in the range between 2 and 20 fL are reported by the impedance measurement system with flagging.
- the present disclosure is directed to a method of determining a platelet concentration in a blood sample, which includes mixing a first aliquot of the blood sample with a diluent to form a first suspension; mixing a second aliquot of the blood sample with a lytic agent and a fluorescent dye to lyse red blood cells and stain white blood cells to form a second suspension; measuring DC impedance signals of the first suspension passing through an aperture; measuring light scatter signals and fluorescent signals of the second suspension passing through an optical flow cell; analyzing the DC impedance signals of the first suspension to obtain a first platelet distribution; analyzing the light scatter signals and the fluorescent signals of the second suspension to differentiate platelets from white blood cells and to obtain a second platelet distribution; and determining the platelet concentration of the blood sample using the first and second platelet distributions.
- the method further includes differentiating the white blood cells of the blood sample using the light scatter signals and the fluorescent signals of the second suspension into white blood cell subpopulations that include monocytes, lymphocytes, neutr
- the present disclosure is directed to a hematology system for determining a platelet concentration in a blood sample.
- the hematology system includes a first module that includes a first mixing chamber configured to mix a first aliquot of the blood sample with a diluent to form a first suspension, and a DC impedance detector equipped with an aperture in a flow path connected with the first mixing chamber, the DC impedance detector configured to measure DC impedance signals of the first suspension passing through the aperture; a second module that includes a second mixing chamber configured to mix a second aliquot of the blood sample with a lytic agent and a fluorescent dye to lyse red blood cells and stain white blood cells to form a second suspension, a light source configured with a light beam aimed at an orifice of an optical flow cell in a flow path connected with the second mixing chamber, and one or more optical detectors equipped with the optical flow cell and configured to measure light scatter signals and fluorescent signals of the second suspension passing through the optical flow cell; and a data processing
- the present disclosure is directed to a method of determining a platelet concentration in a blood sample, which includes mixing a first aliquot of the blood sample with a diluent to form a first suspension; mixing a second aliquot of the blood sample with a lytic agent to lyse red blood cells to form a second suspension; measuring DC impedance signals of the first suspension passing through an aperture; measuring forward angle light scatter signals and side scatter signals or medium angle light scatter signals of the second suspension passing through an optical flow cell; analyzing the DC impedance signals of the first suspension to obtain a first platelet distribution; analyzing the forward angle light scatter signals, and the side scatter or the medium angle light scatter signals of the second suspension to differentiate platelets from white blood cells and to obtain a second platelet distribution; and determining the platelet concentration of the blood sample using the first and second platelet distributions.
- the method further includes differentiating white blood cells of the blood sample using the forward angle light scatter signals and the side scatter signals or the medium angle light scatter signals of the second suspension into white blood cell subpopulations that include monocytes, lymphocytes, neutrophils and eosinophils.
- the present disclosure is directed to a hematology system for determining a platelet concentration in a blood sample.
- the system includes a first module that includes a first mixing chamber configured to mix a first aliquot of a blood sample with a diluent to form a first suspension, and a DC impedance detector equipped with an aperture in a flow path connected with the first mixing chamber, the DC impedance detector configured to measure DC impedance signals of the first suspension passing through the aperture; a second module that includes a second mixing chamber configured to mix a second aliquot of the blood sample with a lytic agent to lyse red blood cells to form a second suspension, a light source configured with a light beam aimed at an orifice of an optical flow cell in a flow path connected with the second mixing chamber, and one or more optical detectors equipped with the optical flow cell and configured to measure forward angle light scatter signals, and side scatter or medium angle light scatter signals of the second suspension passing through the optical flow cell; a data processing module operably connecting with the
- the data processing module is further configured to differentiate white blood cells of the blood sample using the forward angle light scatter signals and the side scatter signals or the medium angle light scatter signals of the second suspension into white blood cell subpopulations comprising monocytes, lymphocytes, neutrophils and eosinophils.
- the present disclosure generally relates to methods and hematology systems for determining a platelet concentration in a blood sample. Embodiments are described more fully hereinafter with reference to the accompanying drawings. The various embodiments may, however, be embodied in many different forms and should not be construed as limited to the embodiments set forth herein.
- the present disclosure provides a method of determination of platelet concentration using an impedance measurement of platelets in a diluted blood sample in combination with an optical measurement of platelets in a lysed blood sample.
- platelet concentration is also often referred to as platelet count in hematology, and is reported as number of platelets per liter of blood.
- the method comprises mixing a first aliquot of a blood sample with a diluent to form a first suspension, mixing a second aliquot of the blood sample with a lytic agent and a fluorescent dye to lyse red blood cells and stain white blood cells to form a second suspension, measuring DC impedance signals of the first suspension passing through an aperture, measuring light scatter and fluorescent signals of the second suspension passing through an optical flow cell, analyzing the DC impedance signals of the first suspension to obtain a first platelet distribution, analyzing light scatter and fluorescent signals of the second suspension to differentiate platelets from white blood cells and to obtain a second platelet distribution, and determining a platelet concentration of the blood sample using the first and second platelet distributions.
- the first suspension is a diluted blood sample.
- a blood diluent is commonly used on hematology analyzers to dilute a blood sample for measuring red blood cells and platelets.
- the diluent typically contains one or more salts, such as alkali metal salt(s), and is adjusted to be isotonic for maintaining red blood cell volumes.
- Commercially available blood diluents can be used for diluting the first aliquot of the blood sample to form the first suspension, for example, M-68DS diluent and M-53D diluent produced by Shenzhen Mindray Bio-Medical Electronics Co., Ltd., Shenzhen, China.
- the direct current (DC) impedance signals of the first suspension can be measured with a DC impedance detector equipped with a non-focused flow aperture or a focused flow aperture in a flow path.
- a particle or a blood cell suspended in a conductive solution passes through an aperture, an electrical signal can be measured due to impedance change.
- the pulse shape, height and width of the impedance signals are directly correlated to the size or volume of a particle, and can be converted to the volume of the subject particle.
- a frequency histogram obtained from the impedance measurement may represent a size distribution of these particles.
- a frequency histogram including platelets and red blood cells in the diluted blood sample can be generated.
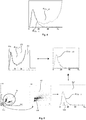
- the first platelet distribution D1 is a platelet DC impedance histogram H Plt-D from the first suspension, which represents size distribution of platelets 10a in the first suspension.
- the volume Vol p of platelets 10a is expressed in femtoliter (fL).
- fL femtoliter
- the second suspension is a lysed blood sample.
- Red blood cells in a blood sample can be lysed by a lytic agent, such as cationic, nonionic, anionic, or amphiphilic surfactants and combinations thereof.
- a lytic agent such as cationic, nonionic, anionic, or amphiphilic surfactants and combinations thereof.
- Various known lysing reagents used for differential analysis of white blood cells on hematology analyzers may be used for lysing red blood cells in the second suspension in the present disclosure.
- the lysing reagents used for differential analysis of white blood cells on hematology analyzers are typically aqueous solutions containing one or more lytic agents, which may include cationic, nonionic, anionic or amphiphilic surfactants, or combinations thereof.
- the lysing reagent may include one or more lytic agents for lysing red blood cells and a fluorescent dye which stains nucleated blood cells for differentiation of nucleated blood cells, such as white blood cells, from other cell types by light scatter and fluorescent measurements.
- lytic agents for lysing red blood cells
- fluorescent dye which stains nucleated blood cells for differentiation of nucleated blood cells, such as white blood cells, from other cell types by light scatter and fluorescent measurements.
- the lysing reagents may comprise a cationic cyanine compound (a fluorescent dye), a cationic surfactant, a nonionic surfactant, and an anionic compound, and the lysing reagents may be used for lysing red blood cells and differentiating white blood cells into their subpopulations using fluorescent and light scatter measurements.
- a fluorescent dye a cationic cyanine compound
- Other known fluorescent dyes may also be used in the lysing reagents, such as the fluorescent dyes described in U.S. Patent No. 8,273,329 , which is incorporated herein by reference in its entirety.
- the fluorescent dye may be contained in a separate staining solution, which can be used together with a lysing reagent that does not contain a dye.
- a staining solution can be added to a blood sample before, after or simultaneously with the lytic agent to stain the nucleated blood cells.
- optical flow cell refers to a focused-flow flow cell suitable for detection of light scatter signals and fluorescent signals, such as those used in existing flow cytometers and hematology analyzers.
- a particle such as a blood cell
- an incident light beam from an illumination source directed at the aperture is scattered by the particle in all directions.
- the scattered light or light scatter signals can be detected by a photo-detector at various angles relative to the incident light beam.
- Different blood cell populations have different light scattering properties, which can be utilized for differentiation of different cell populations.
- the light scatter signals detected near the incident light are often referred to as forward angle light scatter or small angle light scatter signals.
- the forward angle light scatter signals may be measured from about 1° to about 10° from the incident light. In other embodiments, the forward angle light scatter signals may be measured from about 2° to about 6° from the incident light.
- the light scatter signals detected at about 90° from the incident light are commonly referred to as side scatter signals, and fluorescent signals emitted from blood cells stained by a fluorescent dye are typically detected at about 90° from the incident light beam. In some embodiments, the side scatter signals are measured from about 65° to about 115° from the incident light.
- One or more optical detectors may be used for measuring the forward angle light scatter and side scatter signals and fluorescent signals from the second suspension.
- Various known designs of optical detection hardware can be used for the purpose of the present disclosure.
- the platelets are differentiated from the white blood cells in the second suspension.
- a platelet region P (platelet region herein refers to a region, in which platelets may exist, but not excluding that other particles and platelets overlap to some degree), in which platelets 10b in the second suspension locate, and a white blood cell region W, in which white blood cells 30 locate, are clearly differentiated.
- a platelet region and a white blood cell region can also be separated in a fluorescence vs. side scatter (SSC) scattergram obtained from the second suspension of a blood sample.
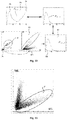
- Figs. 3A-5 further illustrate details of determining a platelet concentration in a blood sample in some embodiments of the present disclosure.
- the platelet region P is differentiated from the white blood cell region W as shown in Fig. 3A .
- a two-dimensional distribution of platelets 10b in the platelet region P is identified as shown in an enlarged view of the platelet region P in the SFL vs. FSC scattergram shown in Fig. 3B .
- the two-dimensional distribution of platelets 10b is one form of the second platelet distribution D2 obtained from the light scatter and fluorescent signals of the platelets in the second suspension.
- the second platelet distribution D2 shown in Fig. 3B can be further converted to a derived platelet volume histogram H Plt-L using light scatter signals of platelets 10b in the platelet region P.
- the derived platelet volume histogram is another form of the second platelet distribution, as indicated by D2' in Fig. 3C , which is a one-dimensional distribution of the platelets in the second suspension.
- Derived platelet volumes of the platelets in the second suspension can be calculated as a function of the light scatter signals of platelets 10b in the platelet region P.
- the derived platelet volume of each platelet in the platelet region defined above may be calculated according to Mie scatter theory using forward angle light scatter and side scatter signals obtained from the second suspension. Furthermore, in the above calculation either using equation (1) or (2) or the Mie scatter theory, the derived platelet volume of the platelets in the second suspension is correlated with the platelet volume in the DC platelet histogram according to size correlation between the platelet volume in the DC platelet histogram and respective light scatter signals obtained from the second suspension. Therefore, in the derived platelet volume histogram H Plt-L shown in Fig. 3C , the size range of the platelets is the same as that in the platelet DC impedance histogram H Plt-D shown in Fig. 1 .
- derived platelet volume histograms generated with derived platelet volumes obtained using equation (1) or (2), or Mie scatter theory are all referred to as the derived platelet volume histogram H Plt-L .
- Fig. 4 illustrates two overlaid histograms obtained using the method described above.
- a platelet DC impedance histogram H Plt-D from the first suspension of a blood sample is overlaid with a derived platelet volume histogram H Plt-L from the second suspension of the blood sample, which is generated with derived platelet volumes (Vol p2 ) obtained using equation (1).
- This blood sample used in the embodiment shown in Fig. 4 is an abnormal blood sample containing fragmented red blood cells as determined by the manual reference method.
- Fig. 4 illustrates two overlaid histograms obtained using the method described above.
- a platelet DC impedance histogram H Plt-D from the first suspension of a blood sample is overlaid with a derived platelet volume histogram H Plt-L from the second suspension of the blood sample, which is generated with derived platelet volumes (Vol p2 ) obtained using equation (1).
- This blood sample used in the embodiment shown in Fig. 4 is an abnormal blood sample
- the two histograms substantially overlap with each other, except that at the high end of platelet population, namely in a region from about 20 fL and above, the platelet DC impedance histogram ( H Plt-D ) is elevated substantially due to interferences from the fragmented red blood cells.
- the platelet DC impedance histogram H Plt-D
- the high end of the platelet population distribution reflects only in formation about platelets 10b, without an influence of interference materials from red blood cells such as microcytes and fragmented red blood cells.
- the derived platelet volume histogram H Plt-L obtained from the second suspension reflects the distribution of platelets 10b including the large platelets, without overlapping with the red blood cells as that would likely occur in the platelet DC impedance histogram obtained from the first suspension.
- the same also applies to blood samples containing giant platelets.
- the composite platelet histogram H Plt-D incorporates information obtained from platelet measurements of both the first suspension and the second suspension.
- k i1 and k i2 in equation (3) may be constants.
- k i1 and k i2 are established according to the following criteria:
- Fig. 5 further illustrates the process described above and a composite platelet histogram H Plt-LD generated with the above criteria using the abnormal blood sample shown in Fig. 4 .
- the size range of the platelets is the same as that in the platelet DC impedance histogram H Plt-D shown in Fig. 1 and that in the derived platelet volume histogram H Plt-L shown in Fig. 3C .
- the elevation of the curve at the high end of the platelet population occurred in the platelet DC impedance histogram H Plt-D in Fig. 4 due to interferences of fragmented red blood cells in the blood sample has been corrected.
- the platelet concentration of the blood sample is then determined according to the area under the curve in the composite platelet histogram H Plt-LD .
- k i1 and k i2 in equation (3) may also be variables determined according to a platelet valley/peak ratio (R v/p ) in the platelet DC impedance histogram H Plt-D of the first suspension which is defined hereinafter.
- the composite platelet histogram H Plt-LD can be used as a third platelet distribution obtained using the first platelet distribution from the first suspension and the second platelet distribution from the second suspension, namely the derived platelet volume histogram.
- the platelet concentration is obtained from this third platelet distribution.
- the cut-off point of 15 fL is an empirical value, which may vary with instruments and/or reagents used with the method. Same as described above, the platelet concentration of a blood sample is then determined according to the area under the curve in the composite platelet histogram ( H Plt-LDa ).
- a derived platelet volume histogram H Plt-Lb may be generated by a curve fitting process using the light scatter signals of platelets 10b in the platelet region (P) in the SFL vs. FSC scattergram of the second suspension.
- the cut-off point of 12 fL is an empirical value, which may vary with instruments and/or reagents used with the method. Same as described above, the platelet concentration of a blood sample is then determined according to the area under the curve in the composite platelet histogram H Plt-LDb .
- the composite platelet histogram H Plt-LDb can be generated using the derived platelet volume histogram H Plt-Lb obtained using equation (8) and the platelet DC impedance histogram H Plt-D obtained from the first suspension according to any method related to equation (3) as described above.
- the composite platelet histogram H Plt-LDa can be generated using the platelet DC impedance histogram H Plt-D obtained from the first suspension and the derived platelet volume histogram H Plt-L obtained from the second suspension according to a criterion defined by equations (9) and (10).
- the platelet DC impedance histogram H Plt-D obtained from the first suspension and the derived platelet volume histogram H Plt-L obtained using equation (1) or (2), or Mie scatter theory, or the derived platelet volume histogram H Plt-Lb obtained using equation (8) from the second suspension as described above can be used to determine a platelet concentration of a blood sample according to the following process.
- an area under the curve in the platelet DC impedance histogram H Plt-D obtained from the first suspension between a line representing the platelet volume (Vol p ) at 15 fL and Line-S which represents the bottom of a valley between the platelets and the red blood cells in the histogram is calculated and designated as Area-1.
- an area under the curve in the derived platelet volume histogram H Plt-L obtained from the second suspension from a line representing the derived platelet volume Vol p2 at 15 fL to the right is calculated and designated as Area-2. Area-2 correlates with the platelets in the histogram having a volume greater than 15 fL.
- an absolute difference ⁇ between Area-1 and Area-2 is compared with a predetermined area threshold A T .
- the predetermined area threshold A T is an empirical value.
- the platelet concentration of a blood sample is calculated using equations (11) and (12) according to a composing criterion which dictates that when ⁇ > A T , equation (11) is used, and when ⁇ ⁇ A T , equation (12) is used:
- C plt V HD 1 + V HD 2 + ... + V HD 15 + V HL 16 + V HL 17 + ... + V HL n
- C plt V HD 1 + V HD 2 + ... + V HD 15 + V HD 16 + V HD 17 + ... + V HD n wherein V HD (1 , 2 ,...
- n is the value, or height, of the platelet DC impedance histogram H Plt-D at the position on the axis corresponding to the platelet volume of 1 fL, 2 fL, ... and n fL, respectively;
- V HL (1 , 2 ,... n ) is the value, or height, of the derived platelet volume histogram H Plt-L at the position on the axis corresponding to the platelet volume of 1 fL, 2 fL, ...and n fL, respectively; and
- C plt is the platelet concentration.
- the cut-off point of 15 fL for calculation of Area-1 and Area-2 is determined empirically, which may vary with instruments and/or reagents used with the method.
- the platelet concentration C plt obtained using equations (11) and (12) is similar to that obtained by generating a composite platelet histogram H Plt-LDc by selecting respective parts of the platelet DC impedance histogram H Plt-D and the derived platelet volume histogram H Plt-L using the composing criterion described above.
- the composite platelet histogram H Plt-LDc is generated using the platelet DC impedance histogram H Plt-D
- the composite platelet histogram H Plt-LDc is generated using both H Plt-D and H Plt-L , with the portion corresponding to platelet volume above 15 fL using the derived platelet volume histogram H Plt-L .
- the platelet concentration is calculated according to the area under the curve of the composite platelet histogram as described above.
- the composite platelet histogram in various embodiments described above is a graphical representation of the distribution of platelet volume, which is a commonly used form of representing probability distribution of a continuous variable.
- the distribution of the platelet volume may also be expressed numerically in a form of table or list, with an equivalent or similar resolution of the histogram, or expressed by other suitable forms known in the art. Therefore, for the purpose of the present disclosure the composite platelet histogram described above can also be referred to as a composite platelet distribution which is not limited by its graphical representation.
- the derived platelet volume histogram described above can also be referred to as a derived platelet volume distribution which is not limited by its graphical representation.
- the platelet DC impedance histogram obtained from the first suspension described above can also be referred to as a DC platelet volume distribution which is not limited by its graphical representation.
- the composite platelet distribution is a third platelet distribution obtained using the first platelet distribution from the first suspension and the second platelet distribution from the second suspension, and the platelet concentration is obtained from the third platelet distribution.
- the platelet region P in the SFL vs. FSC scattergram obtained from the second suspension can be differentiated from nucleated red blood cells in the case that abnormal blood samples contain nucleated red blood cells.
- the platelet concentration of a blood sample can be determined using the first platelet distribution from the first suspension and the second platelet distribution from the second suspension using a method described hereinafter in reference to Figs. 7 through 10C .
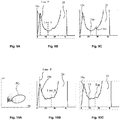
- the method includes determining a platelet valley/peak ratio R v/p in the platelet DC impedance histogram H Plt-D of the first suspension, and comparing the obtained platelet valley/peak ratio R v/p with a predetermined ratio threshold R T .
- the platelet valley/peak ratio R v/p is determined by dividing the number of platelets at Line-S by the number of platelets at the peak of the platelets as indicated by Line-P, or in other words, by dividing the height of the curve at Line-S by the height of the peak at Line-P.
- Line-S represents the bottom of a valley between the platelets and the red blood cells in the histogram, and locates in a boundary area B between the two populations shown in Fig. 7 .
- the predetermined ratio threshold R T may be determined using a large number of normal blood samples.
- the predetermined ratio threshold R T may be a maximum platelet valley/peak ratio of normal blood samples.
- the method determines the number of events N that are present in a designated area P G within the platelet region P in the SFL vs. FSC scattergram of the second suspension.
- the population in the platelet region P and the designated area P G shown in Fig. 8 can be more clearly seen in an enlarged view of Fig. 9A . It has been found that the events present in the designated area P G within the platelet region correlate with large platelets, and in normal blood samples only a limited number of events appear in this designated area.
- an elevation of the number of events N in the designated area P G indicates a potential interference to DC impedance measurement of platelets in the first suspension due to overlap of the large platelets with red blood cells, and the extent of elevation further reflects the extent of the potential interference.
- the elevation of the number of events N in the designated area P G can be assessed according to a predetermined event threshold G T .
- the predetermined event threshold G T may be determined with a large number of normal blood samples, which reflects a maximum number of events located in the designated area P G in normal blood samples. In analysis of a blood sample, if the measured N exceeds G T , it indicates an abnormal elevation of events in the designated area P G .
- the method determines a derived separation threshold T d in the valley between the platelets and the red blood cells in the platelet DC impedance histogram obtained from the first suspension for separating the platelets from the red blood cells using these parameters.
- the offset criterion dictates that if R v/p exceeds R T , and N is below G T , equation (14) is applied for determining the derived separation threshold T d defined in equation (13); and if R v/p exceeds R T , and N also exceeds G T , equation (15) is applied for determining the derived separation threshold T d defined in equation (13). Moreover, according to the offset criterion, if R v/p does not exceed R T , neither equation (14) nor (15) is applied, in other words, F of is zero in equation (13).
- the derived separation threshold T d is used to separate the two cell populations in the platelet DC impedance histogram H Plt-D of the first suspension, namely, to separate the platelets from the red blood cells.
- the platelet concentration of the blood sample is then determined according to the area under the curve for the platelet population as defined by the derived separation threshold T d in the histogram.
- Figs. 9A-9C and 10A-10C respectively illustrate the process for determining a platelet concentration of an abnormal blood sample using the methods described above.
- Figs. 9A-9C illustrate the process for determining a platelet concentration in an abnormal blood sample containing large platelets.
- Fig. 9A in the SFL vs. FSC scattergram from the second suspension of the blood sample, a large number of events N appeared in the designated area P G , as such N exceeded the predetermined event threshold G T .
- the platelet DC impedance histogram H Plt-D of the first suspension shown in Fig. 9B the platelet valley/peak ratio R v/p also exceeded the predetermined ratio threshold R T .
- equation (15) was applied in determining the offset F of .
- the derived separation threshold T d obtained from equation (13) was right shifted from the apparent separation threshold T ap , and the extent of the shift is dictated by F of obtained from equation (15).
- the platelet concentration according to a flow cytometer reference method was 87 x 10 9 /L
- the platelet concentration reported by a conventional impedance measurement method using the apparent separation threshold T ap shown in Fig. 9C was 63 x 10 9 /L, which was substantially lower than the result of the flow cytometer reference method.
- the platelet concentration obtained was 84 x 10 9 /L. Because of the ability to assess the presence of large platelets in the SFL vs.
- the present method enables correction of substantial errors that frequently occur with conventional impedance methods in measuring platelet concentrations of blood samples containing large platelets.
- Figs. 10A-10C further illustrate the process for determining a platelet concentration of an abnormal blood sample that contains fragmented red blood cells.
- the platelet valley/peak ratio R v/p in the platelet DC impedance histogram H Plt-D from the first suspension exceeded the predetermined ratio threshold R T ; however, the number of events N in the designated area P G in the SFL vs. FSC scattergram from the second suspension was normal and did not exceed the predetermined event threshold G T , see Fig. 10A .
- equation (14) was applied in determining the offset F of .
- Fig. 10B the platelet valley/peak ratio R v/p in the platelet DC impedance histogram H Plt-D from the first suspension exceeded the predetermined ratio threshold R T ; however, the number of events N in the designated area P G in the SFL vs. FSC scattergram from the second suspension was normal and did not exceed the predetermined event threshold G T , see Fig. 10A .
- equation (14) was applied
- the derived separation threshold T d obtained from equation (13) was left shifted from the apparent separation threshold T ap and the extent of shift was dictated by F of obtained from equation (14).
- the platelet concentration according to the flow cytometer reference method was 46 x 10 9 /L
- the platelet concentration reported by the conventional impedance measurement method using an apparent separation threshold T ap shown in Fig. 10C was 66 x 10 9 /L, which was more than 40% higher than the result of the reference method.
- the platelet concentration obtained was 42 x 10 9 /L. Therefore, the present method enables correction of substantial errors due to interferences of fragmented red blood cells in determining the platelet concentration using the conventional impedance measurement method.
- the derived separation threshold T d' is calculated as a function of N and R v/p obtained from the analysis of light scatter and fluorescent signals of the second suspension and the analysis of DC impedance signals of the first suspension, respectively, as described above.
- the platelets are separated from the red blood cells in the platelet DC impedance histogram H Plt-D of the first suspension using the derived separation threshold T d' obtained from equation (16), in the same manner as illustrated in Figs. 9C and 10C .
- the platelet concentration of the blood sample is then determined based on the area under the curve for the platelet population as defined by the derived separation threshold T d' in the histogram.
- the platelet DC impedance histogram from the first suspension with the derived separation threshold separating the platelets and the red blood cells is another third platelet distribution obtained using the first platelet distribution from the first suspension and the second platelet distribution from the second suspension, namely a two dimensional distribution of platelets in the platelet region in the scattergram described above.
- the platelet concentration is obtained from this third platelet distribution.
- platelet data of various forms can be obtained using the third platelet distribution, for example, the composite platelet histograms H Plt-LDa , H Plt-LDb , H Plt-LDc , or the curve for the platelet population as defined by the derived separation threshold T d' in the platelet DC impedance histogram.
- the obtained platelet data includes but is not limited to a platelet count (PLT), mean platelet volume (MPV), platelet distribution width (PDW), thrombocytocrit (PCT), etc.
- the present method may further include differentiating white blood cells into subpopulations using the light scatter and fluorescent signals of the second suspension.
- Main white blood cell subpopulations include lymphocytes, monocytes, neutrophils, eosinophils and basophils.
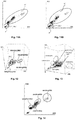
- Fig. 12 shows a three-dimensional scattergram of SFL, SSC and FSC, illustrating differentiation of white blood cells into four subpopulations, namely, lymphocytes, monocytes, neutrophils, eosinophils using fluorescent signals, side scatter signals and forward angle light scatter signals obtained from the second suspension of a blood sample.
- basophils may be differentiated from other white blood cell subpopulations using the light scatter and fluorescent signals of the second suspension.
- the present method may further include enumerating the number of the white blood cells in the second suspension to report a white blood cell count of a blood sample.
- the present method may further include identifying nucleated red blood cells, immature cells or blast cells using the light scatter and fluorescent signals of the second suspension. For example, as shown in Fig. 13 , if immature cells are present in a blood sample, the present method can use the light scatter and fluorescent signals of the second suspension to identify the immature cells and differentiating the white blood cells into four subpopulations, namely, lymphocytes, monocytes, neutrophils, eosinophils.
- Fig. 15 shows a simplified block diagram of a hematology system 100 that carries out the methods described herein.
- the hematology system 100 may include a first module 200, a second module 300, and a data processing module 400.
- the first module 200 includes a first mixing chamber 210 configured to mix an aliquot of a blood sample with a diluent to form the first suspension, and a DC impedance detector 230 with electrodes arranged with an aperture 220 in a flow path connected with the first mixing chamber 210.
- the DC impedance detector 230 is configured to measure DC impedance signals of the first suspension passing through the aperture 220.
- the second module 300 includes a second mixing chamber 310 configured to mix an aliquot of a blood sample with a lytic agent and a fluorescent dye to form the second suspension, a light source 330 configured with its light beam aimed at an orifice of an optical flow cell 320 in a flow path connected with the second mixing chamber 310, and one or more optical detectors 340 equipped with the optical flow cell 320 and configured to measure light scatter signals and fluorescent signals of the second suspension passing through the orifice of the optical flow cell 320.
- the hematology system 100 may include a red semiconductor laser with an emission wavelength of 640 nm as the light source, and three optical detectors enabling detections of forward angle light scatter, side scatter and fluorescent signals, respectively.
- the forward angle light scatter signals may be measured from about 1° to about 10° or from about 2° to about 6° from the incident light beam, and the side scatter signals and fluorescent signals may be measured at about 90° from the incident light beam.
- the forward angle light scatter signals may be measured from about 1° to about 10° and the side scatter signals may be measured from about 65° to about 115° from the incident light beam.
- the system 100 may include one or more optical detectors configured to detect light scatter signals at other angles.
- each of the first mixing chamber 210 and the second mixing chamber 310 is configured to prepare the respective suspension.
- the hematology analyzer may have one shared mixing chamber used for preparing the first suspension and second suspension, respectively, for example, in a sequential manner.
- the shared mixing chamber may be cleaned with a diluent between preparations of the two different suspensions.
- the data processing module 400 is operably connecting with the DC impedance detector 230 in the first module 200 and optical detectors 340 in the second module 300, respectively.
- the data processing module 400 includes one or more processors 410 and a storage system 420 that can store basic programs and data constructs which provide the functionality of implementing the various aspects of the methods disclosed herein.
- Storage system 420 may include one or more memories and one or more non-transitory computer readable media.
- the non-transitory computer readable media may include hard disk drives, floppy disks, optical discs, secure digital memory card (SD), compact flash card, and the like.
- the memory may include a main random access memory (RAM) or dynamic RAM (DRAM) for storage of instructions and data during execution of the computer programs and a read only memory (ROM) in which fixed instructions may be stored.
- the non-transitory computer readable medium is programmed with a computer application program that implements the functionality of the methods described herein and can be executed by one or more processors 410. When executed by the processor, the computer application program stored in the non-transitory computer readable medium causes the processor to determine the platelet concentration of a blood sample according to the methods described herein and to perform differentiation and enumeration of the white blood cells, or identification of the nucleated red blood cells, the immature cells or the blast cells according to the methods described herein.
- the data processing module 400 is configured to carry out various aspects of the methods described herein.
- the DC impedance signals detected in the first module and the light scatter and fluorescent signals detected in the second module may be processed, respectively, in real time.
- these signals may be processed using Field-Programmable Gate Array (FPGA), Digital Signal Processing (DSP), or CPU.
- FPGA Field-Programmable Gate Array
- DSP Digital Signal Processing
- the processed DC impedance signals, light scatter signals and fluorescent signals are analyzed automatically with the programed computer applications to obtain the first and second platelet distributions and determine the platelet concentration of a blood sample according to the methods described herein.
- the signals from the second module are also used for differentiation and enumeration of the white blood cells, or for identification of the nucleated red blood cells, the immature cells or the blast cells, according to the methods described herein.
- the hematology system 100 further includes a user interface 500 which includes user interface input and output devices.
- the results obtained by the methods described herein may be displayed on a user interface output device, such as a computer screen.
- graphic results may be generated on the screen display, such as a composite platelet histogram H Plt-LD shown in Fig. 5 or a composite platelet histogram H Plt-LDa ) or H plt-LDb , a DC platelet histogram H Plt-D with a derived separation threshold T d shown in Fig. 9C or 10C , and 2-D or 3-D scattergram showing differentiation of white blood cell subpopulations.
- the display may further include information obtained in intermediate steps of the methods described herein, for example, the platelet DC impedance histogram H Plt-D of the first suspension, the derived platelet volume histogram H Plt-L or H Plt-Lb , the overlay of H Plt-D and H Plt-L as shown in Fig. 4 or an overlay of H Plt-D and H Plt-LD , the SFL vs. FSC scattergram and/or an enlarged view of the platelet region P shown in Figs. 3A and 3B , and the designated area P G in the SFL vs. FSC scattergram as shown in Figs. 9A and 10A .
- the display of platelet information may be presented in various forms, such as displayed together with analysis results of other cell types in a blood sample, displayed in a designated platelet screen, displayed in layered manner which allows the user to select a specific display of their interest, and other alternatives.
- the method of determining a platelet concentration of a blood sample described above can also be accomplished with multi-angle light scatter measurements of the second suspension of the blood sample without the fluorescence measurement. More specifically, the present inventors discovered that side scatter signals or medium angle light scatter signals from the second suspension could be used for obtaining the second platelet distribution in replacement of the fluorescent signals in determining the platelet concentration of a blood sample with the methods described above.
- the medium angle light scatter signals are detected at an angle between the forward angle light scatter and the side scatter.
- the forward angle light scatter signals may be detected from about 1° to about 10° and the side scatter signals may be detected from about 65° to about 115° from the incident light beam.
- the forward angle light scatter signals may be detected from about 2° to about 6° from the incident light beam, and light scatter signals at a low medium angle from about 8° to about 24° may be detected.
- the latter is referred to as a low medium angle light scatter.
- light scatter signals at a high medium angle from about 25° to about 65° from the incident light beam may be detected, which is referred as a high medium angle light scatter.
- Figs. 11A and 11B illustrate a forward angle light scatter (FSC) vs. side scatter (SSC) scattergram obtained from the second suspension of a normal blood sample and an abnormal blood sample containing large platelets, respectively.
- FSC forward angle light scatter
- SSC side scatter
- a platelet region P' is differentiated from a white blood cell region W' in the FSC vs. SSC scattergram.
- the second platelet distribution may be in the form of a two-dimensional distribution of the platelets in the platelet region P' shown in Figs.
- the second platelet distribution obtained from the light scatter signals of the second suspension can be used together with the first platelet distribution obtained from the first suspension for determining the platelet concentration of a blood sample in the same manner as described above.
- a platelet concentration of a blood sample may be determined using the process described above in reference to equations (1)-(3).
- a derived platelet volume histogram H Plt-L' can be obtained from the second suspension using forward angle scatter signals of the platelets in the platelet region P' in the FSC vs. SSC scattergram according to equation (1) or (2) in the same manner as described above, or using the forward angle light scatter and side scatter signals of the platelets in the platelet region P' according to the Mie scatter theory as described above.
- a composite platelet histogram H Plt-LD' is generated according to equation (3) using the platelet DC impedance histogram H Plt-D from the first suspension and the derived platelet volume histogram H Plt-L' from the second suspension.
- event ( i ) in the derived platelet volume histogram H Plt-L substituted into equation (3) is event ( i ) in the derived platelet volume histogram H Plt-L' .
- the platelet concentration is then determined according to the area under the curve in the composite platelet histogram H Plt-LD' .
- a platelet concentration of a blood sample may also be determined using the process described above in reference to composite platelet histogram H Plt-LDa .
- a composite platelet histogram H Plt-LDa' may be generated using the platelet DC impedance histogram H Plt-D obtained from the first suspension and the derived platelet volume histogram H Plt-L' obtained from light scatter signals of the platelets in the platelet region P' in the FSC vs. SSC scattergram described above according to equations (6) and (7).
- event ( i ) in the derived platelet volume histogram H Plt-L substituted into equation (6) is event ( i ) in the derived platelet volume histogram H Plt-L' .
- the platelet concentration is then determined according to the area under the curve in the composite platelet histogram H Plt-LDa' .
- a platelet concentration of a blood sample may also be determined using the process described above in reference to composite platelet histogram H Plt-LDb .
- a composite platelet histogram H Plt-LDb' may be generated according to the criterion defined by equations (9) and (10), using the platelet DC impedance histogram H Plt-D obtained from the first suspension and the derived platelet volume histogram H Plt-Lb' obtained from forward angle light scatter signals of the platelets in the platelet region P' in the FSC vs. SSC scattergram using equation (8).
- event ( i ) in the derived platelet volume histogram H Plt-L substituted into equation (9) is event ( i ) in the derived platelet volume histogram H Plt-L' .
- the platelet concentration is then determined according to the area under the curve in the composite platelet histogram H Plt-LDb' .
- a platelet concentration of a blood sample may also be determined using the process described above in reference to equations (11) and (12).
- the platelet concentration can be calculated using equations (11) and (12) according to the composing criterion described above.
- the elements in the derived platelet volume histogram H Plt-L defined in equation (11) are corresponding elements in the derived platelet volume histogram H Plt-L' obtained from light signals of the platelets in the platelet region P' in the FSC vs.
- an absolute difference ⁇ ' is the absolute difference between the Area-1 in the platelet DC impedance histogram H Plt-D and Area-2' in the derived platelet volume histogram H Plt-L' , which is further compared to a predetermined area threshold A T '.
- the composite platelet histogram such as H Plt-LDa' or H Plt-LDb' is a third platelet distribution obtained using the first platelet distribution from the first suspension and the second platelet distribution from the second suspension, namely, respective derived platelet volume histogram described herein.
- the platelet concentration is obtained from the third platelet distribution.
- the platelet concentration may be determined using the process described above in reference to equations (13)-(15).
- Fig. 10B for illustrating the method of determining the platelet concentration without fluorescent signals
- Fig. 10B for illustrating the method of determining the platelet concentration without fluorescent signals
- such information from the second platelet distribution may be used together with the platelet valley/peak ratio R v/p in the platelet DC impedance histogram H Plt-D from the first suspension to determine the offset F of and the derived separation threshold T d using equations (13)-(15) and the offset criterion in the same manner as described above.
- N is the number of events in the designated area P G ' within the platelet region P' in the FSC vs. SSC scattergram from the second suspension.
- the derived separation threshold T d obtained is used to separate the platelets from the red blood cells in the platelet DC impedance histogram H Plt-D from the first suspension to obtain the platelet concentration as described above in reference to Figs. 9C and 10C .
- the predetermined event threshold G T may be determined using a large number of normal blood samples, which reflects a maximum number of events located in the designated area P G ' within the platelet region P' in the FSC vs. SSC scattergram in normal blood samples.
- the derived separation threshold T d may also be determined using equation (16), in which N is the number of events in the designated area P G ' within the platelet region P' in the FSC vs. SSC scattergram from the second suspension, and G T is the predetermined event threshold in the designated area P G '.
- the hematology system carrying out the methods described above includes a second module that includes one or more optical detectors configured to detect forward angle light scatter signals and side scatter signals of the second suspension passing through the orifice of the optical flow cell, or configured to detect forward angle light scatter signals and medium angle light scatter signals of the second suspension passing through the orifice of the optical flow cell.
- the hematology system shown in Fig. 15 may include two optical detectors, one for detection of forward angle light scatter signals, and the other for detection of side scatter signals or medium angle light scatter signals of the second suspension.
- the data processing module is configured to analyze the DC impedance signals of the first suspension from the first module and the light scatter signals of the second suspension from the second module, respectively, and to implement various aspects of the method.
- the computer applications stored in the non-transitory computer readable medium causes the processor to determine the platelet concentration according to the methods described herein, and to perform differentiation and enumeration of the white blood cells according to the methods described below.
- the preparation of the second suspension does not require a fluorescent dye.
- the lysing reagents described above containing one or more lytic agents for lysing red blood cells in the second suspension, but without the fluorescent dye.
- various existing lysing reagents used for differential analysis of white blood cells on hematology analyzers may be used for preparing the second suspension, for example various lysing reagent formulations described in U.S. Patent No. 7,413,905 , which is incorporated herein by reference in its entirety. More specifically, as described U.S. Patent No.
- the lysing reagents may include one or more surfactants, as the lytic agent, for lysing red blood cells and partly damaging the cell membrane of white blood cells, an organic compound bearing an anionic group capable of binding to the cationic component present in the white blood cells to provide morphological differences among white blood cell subpopulations, and a buffer to adjust the reagent pH to 2-8.
- the lytic agents may include one or more cationic surfactants, one or more anionic surfactants, one or more ampholytic surfactants, a combination of one or more cationic surfactants and one or more ampholytic surfactants, or a combination of one or more anionic surfactants and one or more ampholytic surfactants.
- This embodiment is advantageous in terms of instrument simplicity and low cost because no fluorescent measurement is required.
- This embodiment may be implemented on existing hematology analyzers that are equipped with forward angle light scatter and side scatter measurements, or forward angle light scatter and medium angle light scatter measurements. Moreover, since no fluorescent dye is needed, it substantially reduces the cost of the reagent.
- this embodiment is applicable for hematology analyzers with fluorescent measurement, which can simultaneously measure forward angle light scatter signals, side scatter signals and fluorescent signals.
- the methods in this embodiment may further include differentiating white blood cells into subpopulations using the light scatter signals from the second suspension.
- Fig. 14 shows a FSC vs SSC scattergram illustrating differentiation of white blood cells into lymphocytes, monocytes, neutrophils, eosinophils using the light scatter signals obtained from the second suspension.
- basophils may be differentiated from other white blood cell subpopulations using the light scatter signals of the second suspension.
- the method in this embodiment may further include enumerating the number of the white blood cells in the second suspension to report a white blood cell count of a blood sample.
- Examples 1 to 7 further illustrate the methods of determining a platelet concentration of a blood sample described above.
- a hematology analyzer enabling detections of forward angle light scatter, side scatter and fluorescent signals was used to determine platelet concentrations of 25 blood samples including 5 normal and 20 abnormal blood samples which contained fragment red blood cells, microcytes, or large platelets.
- the platelet concentrations of the same blood samples were also measured by a flow cytometer as a reference method, as well as by a conventional DC impedance measurement method for comparison.
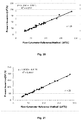
- Fig. 16 shows a correlation of the platelet concentrations of these blood samples obtained using the conventional DC impedance measurement method to the platelet concentrations of these blood samples obtained using the flow cytometry reference method.
- the platelet concentrations of these blood samples obtained using the conventional DC impedance measurement method correlated poorly with the results obtained using the reference method since a major portion of the blood samples were abnormal blood samples containing fragment red blood cells microcytes, or large platelets which were known to interfere with conventional impedance measurement of platelets.
- the correlation coefficient (R 2 ) in the linear regression analysis of the results of these 25 blood samples was 0.8343.
- the platelet concentrations of the blood samples containing fragmented red blood cells or microcytes obtained using the conventional DC impedance measurement method were substantially higher than the results obtained by the reference method.
- the platelet concentrations of the blood samples containing large platelets obtained using the conventional DC impedance measurement method were substantially lower than the results obtained by the reference method.
- Example 2 the platelet concentrations of these 25 blood samples obtained using a composite platelet histogram H Plt-LDa generated according to the criterion defined in equations (6) and (7) correlated closely with the results obtained by the flow cytometer reference method with a correlation coefficient (R 2 ) of 0.9739, see Fig. 18 .
- a composite platelet histogram H Plt-LDb was generated using a derived platelet volume histogram H Plt-Lb obtained from light scatter signals of platelets in the platelet region P using the curve fitting process defined by equation 8 described above.
- the platelet concentrations of these 25 blood samples obtained using the composite platelet histogram H Plt-LDb correlated closely with the results obtained by the flow cytometer reference method with a correlation coefficient (R 2 ) of 0.9681, see Fig. 19 .
- the platelet concentrations of these 25 blood samples determined using equations (11) and (12) according to the composing criterion described above correlated closely with the results obtained by the flow cytometer reference method with a correlation coefficient (R 2 ) of 0.9797, see Fig. 20 .
- the present methods enabled accurate measurements of platelet concentrations in the blood samples, and substantial errors occurred in the conventional impedance method due to the presence of fragment red blood cells, microcytes, or large platelets in the abnormal blood samples were effectively corrected.
- Example 5 further illustrates measurements of platelet concentrations of the blood samples using equations (13)-(15) and the offset criterion described above.
- the same 25 blood samples in Example 1 were used for the measurements.
- the platelet concentrations of these blood samples obtained by the method using equations (13)-(15) correlated closely with the results obtained by the flow cytometer reference method with a correlation coefficient (R 2 ) of 0.9937.
- the method provided accurate measurements of platelet concentrations in the blood samples. The substantial errors occurred in the conventional impedance method due to the presence of fragment red blood cells, microcytes, or large platelets in the abnormal blood samples were effectively corrected using this method.
- Examples 1-5 The methods for measuring platelets in Examples 1-5 were applied in the steps for differentiating white blood cells after lysing red blood cells.
- the method for measuring platelets as described in Example 6 was applied in the steps for differentiating nucleated red blood cell after lysing red blood cells.
- Examples 6 and 7 shows the composite platelet histogram H Plt-LD generated using equation (3) by the methods described above.
- Fig. 22 further shows the process for generating the composite platelet histogram H Plt-LD in Example 6, which is similar to the process for generating H Plt-LD shown in Fig. 5 .
- the platelet region can also be differentiated in the fluorescent (SFL) vs. side light scatter (SSC) scattergram, as shown in Fig. 23 .
- fluorescent signals, forward angle light scatter signals and side light scatter signals are simultaneously measured when a sample passes through a nucleated red blood cell detection component.
- P region is differentiated in the fluorescent (SFL) vs. side light scatter (SSC) scattergram first, and then a derived platelet volume histogram H Plt-ND is obtained at least using the forward angle light scatter signals of each cell.
- SFL fluorescent
- SSC side light scatter
- the platelet concentration of a sample may be determined using the process described above in reference to equations (13)-(15).
- Fig. 24 shows that the number of events appeared in the designated area P G within the platelet region in the FSC vs. SSC scattergram from the second suspension is normal.
- such information from the second platelet distribution may be used together with the platelet valley/peak ratio R v/p in the platelet DC impedance histogram H Plt-D from the first suspension to determine the offset F of and the derived separation threshold T d using equations (13)-(15) and the offset criterion in the same manner as described above.
- N is the number of events in the designated area P G within the platelet region in the FSC vs. SSC scattergram from the second suspension.
- the derived separation threshold T d obtained is used to separate the platelets from the red blood cells in the platelet DC impedance histogram H Plt-D from the first suspension to obtain the platelet concentration as described below.
- the designated area can be identified using the FSC vs. SSC scattergram, to determine whether the number of events is normal or not.
- the embodiments described above provide accurate measurements of platelet concentration of blood samples, which are particularly effective in the presence of an interference to the impedance measurement methods, such as with blood samples containing fragmented red blood cells, microcytes, or large platelets.
- the present methods have overcome the difficulties of existing impedance measurement methods and met a long felt need of accurate measurements of platelet concentration in in-vitro diagnostic analysis.
- some existing high end hematology analyzers use a separate optical measurement of platelets in addition to the conventional impedance measurement in order to differentiate interference substances and remove the effect of interferences.
- this substantially increases instrument complexity and manufacturing cost.
- the instant methods can be implemented with existing complete blood count (CBC) and white blood cell differential measurements on various commercial hematology analyzers without increasing instrument cost. Therefore, the present methods are particularly advantageous in their broad applications in improving accuracy of platelet measurements on existing instruments in the field of in-vitro diagnostic industry.
- CBC complete blood count
- white blood cell differential measurements on various commercial hematology analyzers without increasing instrument cost. Therefore, the present methods are particularly advantageous in their broad applications in improving accuracy of platelet measurements on existing instruments in the field of in-vitro diagnostic industry.
- the BC-6800 hematology analyzer has a CBC module and a differential module.
- the CBC module includes a mixing chamber configured to mix one aliquot of a blood sample with a diluent to form a first suspension and a DC impedance detector configured to measure DC impedance signals of the first suspension passing through an aperture in a flow path.
- the differential module includes another mixing chamber configured to mix another aliquot of the blood sample with a lytic agent and a fluorescent dye to form a second suspension, a red semiconductor laser with an emission wavelength of 640 nm as the light source which is configured with its light beam aimed at an orifice of an optical flow cell, and optical detectors enabling detection of forward angle light scatter signals from about 1° to about 10° and side scatter signals from about 65° to about 115° from the incident light beam, and fluorescent signals of the second suspension passing through the orifice of the optical flow cell.
- CBC module 4 ⁇ L of an anticoagulated whole blood sample was mixed with 1.5 mL of M-68DS diluent (a product of Shenzhen Mindray Bio-Medical Electronics Co., Ltd., Shenzhen, China) to form the first suspension.
- M-68DS diluent a product of Shenzhen Mindray Bio-Medical Electronics Co., Ltd., Shenzhen, China
- differential module 20 ⁇ L of the same whole blood sample was mixed with 1 mL of M-68LD Lyse and 20 ⁇ L of M-68FD Dye (both are products of Shenzhen Mindray Bio-Medical Electronics Co., Ltd., Shenzhen, China) to lyse red blood cells and stain nucleated blood cells and to form the second suspension.
- the M-68LD Lyse was an aqueous solution containing a cationic surfactant, a nonionic surfactant, and an anionic compound for lysing red blood cells in a blood sample.
- the M-68FD Dye was an aqueous solution containing a cationic cyanine compound for staining nucleated blood cells in a blood sample.
- the data collected from the measurement of DC impedance signals of the first suspension were post analyzed to generate a platelet DC impedance histogram H Plt-D , as that illustrated in Fig. 1 .
- the data collected from the measurements of forward angle light scatter signals and fluorescent signals of the second suspension were post analyzed to differentiate the platelet region (P) from the white blood cell region (W) in a SFL vs. FSC scattergram as illustrated in Figs. 3A-3B .
- the derived platelet volume was calculated with equation (1) using the forward angle light scatter signals of platelets in the platelet region P.
- a composite platelet histogram H Plt-LD was generated according to equation (3) described above.
- the platelet concentration of a blood sample was determined according to the area under the curve in the composite platelet histogram H Plt-LD .
- 25 whole blood samples were analyzed as described above, including five normal blood samples, ten abnormal blood samples which contained fragmented red blood cells or microcytes, and ten abnormal blood samples which contained large platelets. The presence of fragmented red blood cells, microcytes, or large platelets in these abnormal blood samples was confirmed by manual examination of blood smears under a microscope. These blood samples were further analyzed on a BriCyte E6 flow cytometer (a product of Shenzhen Mindray Bio-Medical Electronics Co., Ltd., Shenzhen, China) using the RBC/Platelet Ratio Method, a reference method as recommended by The International Council for Standardization in Hematology (ICSH) and the International Society of Laboratory Hematology (ISLH). Moreover, platelet concentrations of these blood samples reported on the BC-6800 hematology analyzer using a conventional DC impedance measurement method were also obtained for comparison.
- ICSH International Council for Standardization in Hematology
- ISLH International Society of Laboratory Hematology
- Fig. 16 shows a correlation of the platelet concentrations of these blood samples obtained using the conventional DC impedance measurement method to the results obtained using the flow cytometry reference method.
- the platelet concentrations of these blood samples obtained using the conventional DC impedance measurement method correlated poorly with the reference method.
- the platelet concentrations of the abnormal blood samples containing fragmented red blood cells or microcytes were substantially higher than the results obtained by the flow cytometer reference method.
- the platelet concentrations of the abnormal blood samples containing large platelets were substantially lower than the results obtained by the reference method.
- the correlation coefficient (R 2 ) in the linear regression analysis of the results of these 25 blood samples was 0.8343.
- Fig. 17 shows a correlation of the platelet concentrations of these blood samples obtained using the method described above associated with equation (3) to the results obtained using the flow cytometry reference method.
- the platelet concentrations obtained using the composite platelet histogram according to equation (3) correlated closely with the results from the flow cytometer reference method with a correlation coefficient (R 2 ) of 0.9940.
- R 2 correlation coefficient
- the data collected from the measurements of DC impedance signals of the first suspension were post analyzed to generate a platelet DC impedance histogram H Plt-D .
- the data collected from the measurements of forward angle light scatter signals and fluorescent signals of the second suspension were post analyzed to differentiate the platelet region (P) from the white blood cell region (W) in the SFL vs. FSC scattergram.
- a derived platelet volume histogram H Plt-L and derived platelet volumes were obtained using equation (1).
- a composite platelet histogram H Plt-LDa was generated according to the criterion defined in equations (6) and (7) as described above.
- the platelet concentration of each blood sample was determined according to the area under the curve in the composite platelet histogram H Plt-LDa .
- Fig. 18 shows a correlation of the platelet concentrations of these blood samples obtained in this example to the results from the flow cytometry reference method obtained in Example 1. As shown, the platelet concentrations of these blood samples obtained using the method described in this example correlated closely with the results from the flow cytometer reference method, with a correlation coefficient (R 2 ) of 0.9739.
- the data collected from the measurement of DC impedance signals of the first suspension were post analyzed to generate a platelet DC impedance histogram H Plt-D .
- the data collected from the measurements of forward angle light scatter signals and fluorescent signals of the second suspension were post analyzed to differentiate the platelet region P from the white blood cell region W in a SFL vs. FSC scattergram.
- a derived platelet volume histogram H Plt-Lb was generated with light scatter signals of platelets in the platelet region P using the curve fitting process defined by equation (8) as described above.
- a composite platelet histogram H Plt-LDb was generated according to the criterion defined by equations (9) and (10) as described above.
- the platelet concentration of each blood sample was determined according to the area under the curve in the composite platelet histogram H Plt-LDb .
- Fig. 18 shows a correlation of the platelet concentrations of these blood samples obtained in this example to the results from the flow cytometry reference method obtained in Example 1. As shown, the platelet concentrations of these blood samples obtained using the method described in this example correlated closely with the results from the flow cytometer reference method, with a correlation coefficient (R 2 ) of 0.9681.
- the data collected from the measurement of DC impedance signals of the first suspension were post analyzed to generate a platelet DC impedance histogram H Plt-D .
- the data collected from the measurements of forward angle light scatter signals and fluorescent signals of the second suspension were post analyzed to differentiate the platelet region P from the white blood cell region W in a SFL vs. FSC scattergram.
- a derived platelet volume histogram H Plt-L and derived platelet volumes were obtained using equation (1).
- the platelet concentration of each blood sample was calculated using equations (11) and (12) according to the composing criterion as described above.
- Fig. 19 shows a correlation of the platelet concentrations of these blood samples obtained in this example to the results from the flow cytometry reference method obtained in Example 1. As shown, the platelet concentrations of these blood samples obtained using the method described in this example correlated closely with the results from the flow cytometer reference method, with a correlation coefficient (R 2 ) of 0.9797.
- the data collected from the measurement of DC impedance signals of the first suspension were post analyzed to generate a platelet DC impedance histogram H Plt-D , as those illustrated in Figs. 9B and 10B , and to determine the platelet valley/peak ratio R v/p in the histogram.
- the data collected from the measurements of forward angle light scatter signals and fluorescent signals of the second suspension were post analyzed to differentiate the platelet region P from the white blood cell region W in a SFL vs. FSC scattergram, and to determine the number of events N in the designated area P G .
- a derived separation threshold T d was determined according to equations (13)-(15) and the offset criterion described above.
- the obtained derived separation threshold T d was used then to separate the platelets from the red blood cells in the platelet DC impedance histogram H Plt-D , as illustrated in Figs. 9C and 10C , and the platelet concentration of each blood sample was calculated according to the area under the curve for the platelet population as defined by the derived separation threshold T d in the platelet DC impedance histogram.
- Fig. 20 shows a correlation of the platelet concentrations of these blood samples obtained in this example to the results from the flow cytometry reference method obtained in Example 1.
- the platelet concentrations of these blood samples obtained using the method described in this example correlated closely with the results from the flow cytometer reference method, with a correlation coefficient (R 2 ) of 0.9937.
- R 2 correlation coefficient
- a whole blood sample containing nucleated red blood cells was measured on a commercial hematology analyzer BC-6800 (a product of Shenzhen Mindray Bio-Medical Electronics Co., Ltd., Shenzhen, China) and the data collected from measurements of the first and second suspensions were post analyzed using the method in one embodiment described above.
- the BC-6800 hematology analyzer has a CBC module and a differential module.
- the CBC module includes a mixing chamber configured to mix one aliquot of a blood sample with a diluent to form a first suspension and a DC impedance detector configured to measure DC impedance signals of the first suspension passing through an aperture in a flow path.
- the differential module is a differential module for nucleated red blood cell and includes another mixing chamber configured to mix another aliquot of the blood sample with a lytic agent and a fluorescent dye to form a second suspension, a red semiconductor laser with an emission wavelength of 640 nm as the light source which is configured with its light beam aimed at an orifice of an optical flow cell, and optical detectors enabling detection of forward angle light scatter signals from about 1° to about 10° and side scatter signals from about 65° to about 115° from the incident light beam, and fluorescent signals of the second suspension passing through the orifice of the optical flow cell.
- CBC module 4 ⁇ L of an anticoagulated whole blood sample was mixed with 1.5 mL of M-68DS diluent (a product of Shenzhen Mindray Bio-Medical Electronics Co., Ltd., Shenzhen, China) to form the first suspension.
- M-68DS diluent a product of Shenzhen Mindray Bio-Medical Electronics Co., Ltd., Shenzhen, China
- differential module 20 ⁇ L of the same whole blood sample was mixed with 1 mL of M-68LN Lyse and 20 ⁇ L of M-68FN Dye (both are products of Shenzhen Mindray Bio-Medical Electronics Co., Ltd., Shenzhen, China) to lyse red blood cells and stain nucleated blood cells and to form the second suspension.
- the M-68LN Lyse was an aqueous solution containing a cationic surfactant and an anionic compound for lysing red blood cells in a blood sample.
- the M-68FN Dye was an aqueous solution containing a cationic cyanine compound for staining nucleated blood cells in a blood sample.
- the data collected from the measurement of DC impedance signals of the first suspension were post analyzed to generate a platelet DC impedance histogram H Plt-D , as that illustrated in Fig. 1 .
- the data collected from the measurements of forward angle light scatter signals and fluorescent signals of the second suspension were post analyzed to differentiate the platelet region P from the white blood cell region W in a SFL vs. FSC scattergram as illustrated in Fig 22 .
- derived platelet volumes were calculated using equation (1) based on forward angle light scatter signals of platelets in the platelet region P.
- a derived platelet volume histogram H Plt-N as illustrated in Fig. 22 was generated.
- a composite platelet histogram H Plt-LD was generated according to equation (3) described above.
- the platelet concentration of a blood sample was determined according to the area under the curve in the composite platelet histogram H Plt-LD .
- nucleated red blood cells and white blood cells were identified and counted using the light scatter signals and fluorescent signals of the second suspension of the blood sample.
- the blood sample was confirmed to contain fragmented red blood cells by manual examination of blood smears under a microscope.
- the reference value obtained by the flow cytometry reference method was 86 x 10 9 /L
- the platelet count result obtained by the impedance method was 110 x 10 9 /L
- the platelet count result obtained by the present disclosure was 91 x 10 9 /L, which was closer to the reference value.
- a whole blood sample containing nucleated red blood cells was measured on a commercial hematology analyzer BC-6800 (a product of Shenzhen Mindray Bio-Medical Electronics Co., Ltd., Shenzhen, China) and the data collected from measurements of the first and second suspensions were post analyzed using the method in one embodiment described above.
- the BC-6800 hematology analyzer has a CBC module and a differential module.
- the CBC module includes a mixing chamber configured to mix one aliquot of a blood sample with a diluent to form a first suspension and a DC impedance detector configured to measure DC impedance signals of the first suspension passing through an aperture in a flow path.
- the differential module is a differential module for nucleated red blood cell and includes another mixing chamber configured to mix another aliquot of the blood sample with a lytic agent and a fluorescent dye to form a second suspension, a red semiconductor laser with an emission wavelength of 640 nm as the light source which is configured with its light beam aimed at an orifice of an optical flow cell, and optical detectors enabling detection of forward angle light scatter signals from about 1° to about 10° and side scatter signals from about 65° to about 115° from the incident light beam, and fluorescent signals of the second suspension passing through the orifice of the optical flow cell.
- CBC module 4 ⁇ L of an anticoagulated whole blood sample was mixed with 1.5 mL of M-68DS diluent (a product of Shenzhen Mindray Bio-Medical Electronics Co., Ltd., Shenzhen, China) to form the first suspension.
- M-68DS diluent a product of Shenzhen Mindray Bio-Medical Electronics Co., Ltd., Shenzhen, China
- differential module 20 ⁇ L of the same whole blood sample was mixed with 1 mL of M-68LN Lyse and 20 ⁇ L of M-68FN Dye (both are products of Shenzhen Mindray Bio-Medical Electronics Co., Ltd., Shenzhen, China) to lyse red blood cells and stain nucleated blood cells and to form the second suspension.
- the M-68LN Lyse was an aqueous solution containing a cationic surfactant and an anionic compound for lysing red blood cells in a blood sample.
- the M-68FN Dye was an aqueous solution containing a cationic cyanine compound for staining nucleated blood cells in a blood sample.
- the data collected from the measurement of DC impedance signals of the first suspension were post analyzed to generate a platelet DC impedance histogram H Plt-D , as that illustrated in Fig. 25B , and to determine the platelet valley/peak ratio R v/p in the histogram.
- the data collected from the measurements of forward angle light scatter signals and fluorescent signals of the second suspension were post analyzed to differentiate the platelet region P from the white blood cell region W in a SFL vs. FSC scattergram, and to determine the number of events N in the designated area P G .
- a derived separation threshold T d was determined according to equations (13)-(15) and the offset criterion described above.
- the obtained derived separation threshold T d was used then to separate the platelets from the red blood cells in the platelet DC impedance histogram H Plt-D .
- the number of events N in the designated area P G was normal, and the derived separation threshold T d was left shifted from the apparent separation threshold T ap , as shown in Fig. 25C , and the platelet concentration of the blood sample was calculated according to the area under the curve for the platelet population as defined by the derived separation threshold T d in the platelet DC impedance histogram.
- the blood sample was confirmed to contain fragmented red blood cells by manual examination of blood smears under a microscope.
- the reference value obtained by the flow cytometry reference method was 86 x 10 9 /L
- the platelet count result obtained by the impedance method was 110 x 10 9 /L
- the platelet count result obtained by the present disclosure was 95 x 10 9 /L, which was closer to the reference value.
Landscapes
- Health & Medical Sciences (AREA)
- Engineering & Computer Science (AREA)
- Life Sciences & Earth Sciences (AREA)
- Biomedical Technology (AREA)
- Chemical & Material Sciences (AREA)
- General Health & Medical Sciences (AREA)
- Physics & Mathematics (AREA)
- General Physics & Mathematics (AREA)
- Immunology (AREA)
- Analytical Chemistry (AREA)
- Pathology (AREA)
- Biochemistry (AREA)
- Hematology (AREA)
- Primary Health Care (AREA)
- Epidemiology (AREA)
- Public Health (AREA)
- Medical Informatics (AREA)
- Molecular Biology (AREA)
- Biophysics (AREA)
- Medicinal Chemistry (AREA)
- Urology & Nephrology (AREA)
- Food Science & Technology (AREA)
- Dispersion Chemistry (AREA)
- Ecology (AREA)
- Business, Economics & Management (AREA)
- General Business, Economics & Management (AREA)
- Investigating Or Analysing Biological Materials (AREA)
- Investigating Or Analyzing Materials By The Use Of Electric Means (AREA)
- Investigating, Analyzing Materials By Fluorescence Or Luminescence (AREA)
Priority Applications (1)
| Application Number | Priority Date | Filing Date | Title |
|---|---|---|---|
| EP24180348.5A EP4439582B1 (de) | 2018-04-28 | 2019-04-26 | Verfahren und system zur analyse einer blutprobe |
Applications Claiming Priority (2)
| Application Number | Priority Date | Filing Date | Title |
|---|---|---|---|
| CN2018085197 | 2018-04-28 | ||
| PCT/CN2019/084687 WO2019206313A1 (zh) | 2018-04-28 | 2019-04-26 | 测定血小板浓度的方法及系统 |
Related Child Applications (1)
| Application Number | Title | Priority Date | Filing Date |
|---|---|---|---|
| EP24180348.5A Division EP4439582B1 (de) | 2018-04-28 | 2019-04-26 | Verfahren und system zur analyse einer blutprobe |
Publications (4)
| Publication Number | Publication Date |
|---|---|
| EP3789751A1 true EP3789751A1 (de) | 2021-03-10 |
| EP3789751A4 EP3789751A4 (de) | 2021-06-30 |
| EP3789751C0 EP3789751C0 (de) | 2024-06-26 |
| EP3789751B1 EP3789751B1 (de) | 2024-06-26 |
Family
ID=68294401
Family Applications (2)
| Application Number | Title | Priority Date | Filing Date |
|---|---|---|---|
| EP24180348.5A Active EP4439582B1 (de) | 2018-04-28 | 2019-04-26 | Verfahren und system zur analyse einer blutprobe |
| EP19792132.3A Active EP3789751B1 (de) | 2018-04-28 | 2019-04-26 | Verfahren und system zur bestimmung der thrombozytenkonzentration |
Family Applications Before (1)
| Application Number | Title | Priority Date | Filing Date |
|---|---|---|---|
| EP24180348.5A Active EP4439582B1 (de) | 2018-04-28 | 2019-04-26 | Verfahren und system zur analyse einer blutprobe |
Country Status (4)
| Country | Link |
|---|---|
| US (2) | US11841358B2 (de) |
| EP (2) | EP4439582B1 (de) |
| CN (1) | CN111801568B (de) |
| WO (1) | WO2019206313A1 (de) |
Cited By (1)
| Publication number | Priority date | Publication date | Assignee | Title |
|---|---|---|---|---|
| EP4553485A1 (de) * | 2023-11-08 | 2025-05-14 | Fenwal, Inc. | Bestimmung der zellkonzentration und/oder des plättchenmasseindexes einer flüssigkeit |
Families Citing this family (6)
| Publication number | Priority date | Publication date | Assignee | Title |
|---|---|---|---|---|
| EP4439582B1 (de) * | 2018-04-28 | 2025-10-22 | Shenzhen Mindray Bio-Medical Electronics Co., Ltd. | Verfahren und system zur analyse einer blutprobe |
| EP3842782B1 (de) | 2019-12-27 | 2024-06-26 | Beckman Coulter, Inc. | Probenvorbereitungsinstrument |
| CN111337392A (zh) * | 2020-02-28 | 2020-06-26 | 清华大学深圳国际研究生院 | 一种悬浮颗粒偏振荧光同步测量装置 |
| CN114729871B (zh) * | 2021-08-05 | 2025-09-23 | 深圳迈瑞动物医疗科技股份有限公司 | 一种样本分析装置、动物用分析装置和样本分析方法 |
| CN114047109B (zh) * | 2022-01-11 | 2022-06-21 | 深圳市帝迈生物技术有限公司 | 一种样本分析仪及其计数方法 |
| CN116952805A (zh) | 2022-04-14 | 2023-10-27 | 深圳迈瑞生物医疗电子股份有限公司 | 样本分析仪以及血小板计数方法 |
Family Cites Families (23)
| Publication number | Priority date | Publication date | Assignee | Title |
|---|---|---|---|---|
| US2656508A (en) | 1949-08-27 | 1953-10-20 | Wallace H Coulter | Means for counting particles suspended in a fluid |
| US3810011A (en) | 1970-05-25 | 1974-05-07 | Coulter Electronics | Apparatus and method for analyzing the particle volume distribution for a plurality of particles of different size in a quantity of liquid |
| DE69432410T2 (de) * | 1993-05-14 | 2004-03-04 | Coulter International Corp., Miami | Retikulozyt bestimmungsverfahren und geraet, das lichtstreuungstechniken verwendet |
| US5874310A (en) * | 1997-11-21 | 1999-02-23 | Coulter International Corp. | Method for differentiation of nucleated red blood cells |
| US6060322A (en) * | 1998-10-20 | 2000-05-09 | Coulter International Corp. | Method for identification of reticulated cells |
| JP4101994B2 (ja) * | 1999-01-21 | 2008-06-18 | シスメックス株式会社 | 粒子分析装置および自動粒子分析方法 |
| JP2005506525A (ja) * | 2001-07-27 | 2005-03-03 | ベックマン コールター,インコーポレーテッド | 有核赤血球の計測法の方法 |
| US6743634B2 (en) * | 2002-08-23 | 2004-06-01 | Coulter International Corp. | Method and apparatus for differentiating blood cells using back-scatter |
| US7208319B2 (en) * | 2004-02-10 | 2007-04-24 | Beckman Coulter, Inc. | Method of measurement of nucleated red blood cells |
| US7344890B2 (en) * | 2005-11-09 | 2008-03-18 | Beckman Coulter, Inc. | Method for discriminating platelets from red blood cells |
| CN101078721B (zh) | 2006-05-23 | 2010-12-22 | 深圳迈瑞生物医疗电子股份有限公司 | 对白细胞进行分类的试剂及方法 |
| CN101750274B (zh) | 2008-12-17 | 2014-06-25 | 深圳迈瑞生物医疗电子股份有限公司 | 白细胞分类计数试剂、试剂盒以及白细胞分类计数的方法 |
| CN102115456B (zh) | 2009-12-30 | 2014-08-20 | 深圳迈瑞生物医疗电子股份有限公司 | 花菁类化合物,包含所述化合物的组合物及其在细胞检测中的用途 |
| US9164079B2 (en) * | 2011-03-17 | 2015-10-20 | Greyledge Technologies Llc | Systems for autologous biological therapeutics |
| BR112015000018B1 (pt) * | 2012-07-05 | 2021-11-09 | Beckman Coulter, Inc | Sistema e método automatizado para determinar uma condição de células brancas do sangue em uma amostra biológica |
| KR20150103005A (ko) * | 2012-12-31 | 2015-09-09 | 베크만 컬터, 인코포레이티드 | 미성숙 혈소판 계수 시스템 및 방법 |
| CN103471980B (zh) * | 2013-08-23 | 2015-08-26 | 深圳中科强华科技有限公司 | 一种芯片式血细胞分析装置及方法 |
| CN103471982B (zh) * | 2013-08-23 | 2015-11-25 | 深圳中科强华科技有限公司 | 一种血细胞分析芯片、分析仪及分析方法 |
| CN103472216A (zh) * | 2013-08-23 | 2013-12-25 | 深圳中科强华科技有限公司 | 一种血细胞分析芯片、分析仪及分析方法 |
| CN103472034B (zh) * | 2013-08-23 | 2015-10-28 | 深圳中科强华科技有限公司 | 一种血细胞分析芯片、分析仪及分析方法 |
| JP6661278B2 (ja) * | 2015-03-27 | 2020-03-11 | シスメックス株式会社 | 血液分析装置および血液分析方法 |
| EP3258274B1 (de) * | 2016-06-17 | 2019-11-06 | Sysmex Corporation | Verfahren zur steuerung eines blutanalysators zur plättchenmessung |
| EP4439582B1 (de) * | 2018-04-28 | 2025-10-22 | Shenzhen Mindray Bio-Medical Electronics Co., Ltd. | Verfahren und system zur analyse einer blutprobe |
-
2019
- 2019-04-26 EP EP24180348.5A patent/EP4439582B1/de active Active
- 2019-04-26 EP EP19792132.3A patent/EP3789751B1/de active Active
- 2019-04-26 CN CN201980011879.0A patent/CN111801568B/zh active Active
- 2019-04-26 WO PCT/CN2019/084687 patent/WO2019206313A1/zh not_active Ceased
-
2020
- 2020-10-20 US US17/075,603 patent/US11841358B2/en active Active
-
2023
- 2023-12-11 US US18/536,047 patent/US12287319B2/en active Active
Cited By (1)
| Publication number | Priority date | Publication date | Assignee | Title |
|---|---|---|---|---|
| EP4553485A1 (de) * | 2023-11-08 | 2025-05-14 | Fenwal, Inc. | Bestimmung der zellkonzentration und/oder des plättchenmasseindexes einer flüssigkeit |
Also Published As
| Publication number | Publication date |
|---|---|
| US20240133864A1 (en) | 2024-04-25 |
| US11841358B2 (en) | 2023-12-12 |
| EP3789751C0 (de) | 2024-06-26 |
| EP4439582A3 (de) | 2024-10-16 |
| EP3789751A4 (de) | 2021-06-30 |
| EP4439582C0 (de) | 2025-10-22 |
| US12287319B2 (en) | 2025-04-29 |
| US20240230621A9 (en) | 2024-07-11 |
| EP4439582A2 (de) | 2024-10-02 |
| WO2019206313A1 (zh) | 2019-10-31 |
| EP4439582B1 (de) | 2025-10-22 |
| CN111801568B (zh) | 2024-05-24 |
| EP3789751B1 (de) | 2024-06-26 |
| CN111801568A (zh) | 2020-10-20 |
| US20210033593A1 (en) | 2021-02-04 |
Similar Documents
| Publication | Publication Date | Title |
|---|---|---|
| US12287319B2 (en) | Methods and systems for determining platelet concentration | |
| US12135287B2 (en) | Alarm method, system and storage medium for abnormalities of sample analyzer | |
| US11105742B2 (en) | Nucleated red blood cell warning method and device, and flow cytometer using the same | |
| US11874212B2 (en) | Blood analysis method, blood analysis system and storage medium | |
| US12158409B2 (en) | Blood analysis system, blood analyzer, blood analysis method and storage medium | |
| US7008792B2 (en) | Method of measurement of nucleated red blood cells | |
| US6472215B1 (en) | Method of analyzing nucleated red blood cells in a blood sample | |
| US9797824B2 (en) | Method for hematology analysis | |
| US7208319B2 (en) | Method of measurement of nucleated red blood cells | |
| CN114450589A (zh) | 分析血液样本中红细胞方法及血液分析系统 | |
| WO2022115982A1 (zh) | 样本分析方法、样本分析仪及计算机可读存储介质 | |
| JP4417936B2 (ja) | 尿中赤血球の鑑別装置および方法 | |
| CN115201156A (zh) | 分析血液样本中红细胞的方法及血液分析系统 | |
| CN115201155A (zh) | 血液样本的检测方法和样本分析仪 |
Legal Events
| Date | Code | Title | Description |
|---|---|---|---|
| STAA | Information on the status of an ep patent application or granted ep patent |
Free format text: STATUS: THE INTERNATIONAL PUBLICATION HAS BEEN MADE |
|
| PUAI | Public reference made under article 153(3) epc to a published international application that has entered the european phase |
Free format text: ORIGINAL CODE: 0009012 |
|
| STAA | Information on the status of an ep patent application or granted ep patent |
Free format text: STATUS: REQUEST FOR EXAMINATION WAS MADE |
|
| 17P | Request for examination filed |
Effective date: 20201028 |
|
| AK | Designated contracting states |
Kind code of ref document: A1 Designated state(s): AL AT BE BG CH CY CZ DE DK EE ES FI FR GB GR HR HU IE IS IT LI LT LU LV MC MK MT NL NO PL PT RO RS SE SI SK SM TR |
|
| AX | Request for extension of the european patent |
Extension state: BA ME |
|
| A4 | Supplementary search report drawn up and despatched |
Effective date: 20210601 |
|
| RIC1 | Information provided on ipc code assigned before grant |
Ipc: G01N 15/10 20060101AFI20210526BHEP Ipc: G01N 15/14 20060101ALI20210526BHEP Ipc: G01N 33/49 20060101ALI20210526BHEP Ipc: G01N 33/487 20060101ALI20210526BHEP Ipc: G16H 10/40 20180101ALI20210526BHEP Ipc: G16H 40/63 20180101ALI20210526BHEP Ipc: G01N 15/12 20060101ALI20210526BHEP Ipc: G01N 15/00 20060101ALN20210526BHEP |
|
| DAV | Request for validation of the european patent (deleted) | ||
| DAX | Request for extension of the european patent (deleted) | ||
| REG | Reference to a national code |
Ref country code: DE Free format text: PREVIOUS MAIN CLASS: G01N0015120000 Ref country code: DE Ref legal event code: R079 Ref document number: 602019054275 Country of ref document: DE Free format text: PREVIOUS MAIN CLASS: G01N0015120000 Ipc: G01N0015100000 |
|
| GRAP | Despatch of communication of intention to grant a patent |
Free format text: ORIGINAL CODE: EPIDOSNIGR1 |
|
| STAA | Information on the status of an ep patent application or granted ep patent |
Free format text: STATUS: GRANT OF PATENT IS INTENDED |
|
| RIC1 | Information provided on ipc code assigned before grant |
Ipc: G01N 15/00 20060101ALN20231212BHEP Ipc: G16H 40/63 20180101ALI20231212BHEP Ipc: G16H 10/40 20180101ALI20231212BHEP Ipc: G01N 33/49 20060101ALI20231212BHEP Ipc: G01N 33/487 20060101ALI20231212BHEP Ipc: G01N 15/14 20060101ALI20231212BHEP Ipc: G01N 15/12 20060101ALI20231212BHEP Ipc: G01N 15/10 20060101AFI20231212BHEP |
|
| INTG | Intention to grant announced |
Effective date: 20240111 |
|
| GRAS | Grant fee paid |
Free format text: ORIGINAL CODE: EPIDOSNIGR3 |
|
| GRAA | (expected) grant |
Free format text: ORIGINAL CODE: 0009210 |
|
| STAA | Information on the status of an ep patent application or granted ep patent |
Free format text: STATUS: THE PATENT HAS BEEN GRANTED |
|
| AK | Designated contracting states |
Kind code of ref document: B1 Designated state(s): AL AT BE BG CH CY CZ DE DK EE ES FI FR GB GR HR HU IE IS IT LI LT LU LV MC MK MT NL NO PL PT RO RS SE SI SK SM TR |
|
| REG | Reference to a national code |
Ref country code: GB Ref legal event code: FG4D |
|
| REG | Reference to a national code |
Ref country code: CH Ref legal event code: EP |
|
| REG | Reference to a national code |
Ref country code: DE Ref legal event code: R096 Ref document number: 602019054275 Country of ref document: DE |
|
| U01 | Request for unitary effect filed |
Effective date: 20240626 |
|
| U07 | Unitary effect registered |
Designated state(s): AT BE BG DE DK EE FI FR IT LT LU LV MT NL PT SE SI Effective date: 20240702 |
|
| PG25 | Lapsed in a contracting state [announced via postgrant information from national office to epo] |
Ref country code: HR Free format text: LAPSE BECAUSE OF FAILURE TO SUBMIT A TRANSLATION OF THE DESCRIPTION OR TO PAY THE FEE WITHIN THE PRESCRIBED TIME-LIMIT Effective date: 20240626 |
|
| PG25 | Lapsed in a contracting state [announced via postgrant information from national office to epo] |
Ref country code: GR Free format text: LAPSE BECAUSE OF FAILURE TO SUBMIT A TRANSLATION OF THE DESCRIPTION OR TO PAY THE FEE WITHIN THE PRESCRIBED TIME-LIMIT Effective date: 20240927 |
|
| PG25 | Lapsed in a contracting state [announced via postgrant information from national office to epo] |
Ref country code: NO Free format text: LAPSE BECAUSE OF FAILURE TO SUBMIT A TRANSLATION OF THE DESCRIPTION OR TO PAY THE FEE WITHIN THE PRESCRIBED TIME-LIMIT Effective date: 20240926 Ref country code: HR Free format text: LAPSE BECAUSE OF FAILURE TO SUBMIT A TRANSLATION OF THE DESCRIPTION OR TO PAY THE FEE WITHIN THE PRESCRIBED TIME-LIMIT Effective date: 20240626 Ref country code: GR Free format text: LAPSE BECAUSE OF FAILURE TO SUBMIT A TRANSLATION OF THE DESCRIPTION OR TO PAY THE FEE WITHIN THE PRESCRIBED TIME-LIMIT Effective date: 20240927 Ref country code: RS Free format text: LAPSE BECAUSE OF FAILURE TO SUBMIT A TRANSLATION OF THE DESCRIPTION OR TO PAY THE FEE WITHIN THE PRESCRIBED TIME-LIMIT Effective date: 20240926 |
|
| PG25 | Lapsed in a contracting state [announced via postgrant information from national office to epo] |
Ref country code: PL Free format text: LAPSE BECAUSE OF FAILURE TO SUBMIT A TRANSLATION OF THE DESCRIPTION OR TO PAY THE FEE WITHIN THE PRESCRIBED TIME-LIMIT Effective date: 20240626 |
|
| PG25 | Lapsed in a contracting state [announced via postgrant information from national office to epo] |
Ref country code: IS Free format text: LAPSE BECAUSE OF FAILURE TO SUBMIT A TRANSLATION OF THE DESCRIPTION OR TO PAY THE FEE WITHIN THE PRESCRIBED TIME-LIMIT Effective date: 20241026 |
|
| PG25 | Lapsed in a contracting state [announced via postgrant information from national office to epo] |
Ref country code: CZ Free format text: LAPSE BECAUSE OF FAILURE TO SUBMIT A TRANSLATION OF THE DESCRIPTION OR TO PAY THE FEE WITHIN THE PRESCRIBED TIME-LIMIT Effective date: 20240626 |
|
| PG25 | Lapsed in a contracting state [announced via postgrant information from national office to epo] |
Ref country code: RO Free format text: LAPSE BECAUSE OF FAILURE TO SUBMIT A TRANSLATION OF THE DESCRIPTION OR TO PAY THE FEE WITHIN THE PRESCRIBED TIME-LIMIT Effective date: 20240626 Ref country code: SK Free format text: LAPSE BECAUSE OF FAILURE TO SUBMIT A TRANSLATION OF THE DESCRIPTION OR TO PAY THE FEE WITHIN THE PRESCRIBED TIME-LIMIT Effective date: 20240626 |
|
| PG25 | Lapsed in a contracting state [announced via postgrant information from national office to epo] |
Ref country code: SM Free format text: LAPSE BECAUSE OF FAILURE TO SUBMIT A TRANSLATION OF THE DESCRIPTION OR TO PAY THE FEE WITHIN THE PRESCRIBED TIME-LIMIT Effective date: 20240626 Ref country code: ES Free format text: LAPSE BECAUSE OF FAILURE TO SUBMIT A TRANSLATION OF THE DESCRIPTION OR TO PAY THE FEE WITHIN THE PRESCRIBED TIME-LIMIT Effective date: 20240626 |
|
| PG25 | Lapsed in a contracting state [announced via postgrant information from national office to epo] |
Ref country code: SM Free format text: LAPSE BECAUSE OF FAILURE TO SUBMIT A TRANSLATION OF THE DESCRIPTION OR TO PAY THE FEE WITHIN THE PRESCRIBED TIME-LIMIT Effective date: 20240626 Ref country code: SK Free format text: LAPSE BECAUSE OF FAILURE TO SUBMIT A TRANSLATION OF THE DESCRIPTION OR TO PAY THE FEE WITHIN THE PRESCRIBED TIME-LIMIT Effective date: 20240626 Ref country code: RO Free format text: LAPSE BECAUSE OF FAILURE TO SUBMIT A TRANSLATION OF THE DESCRIPTION OR TO PAY THE FEE WITHIN THE PRESCRIBED TIME-LIMIT Effective date: 20240626 Ref country code: PL Free format text: LAPSE BECAUSE OF FAILURE TO SUBMIT A TRANSLATION OF THE DESCRIPTION OR TO PAY THE FEE WITHIN THE PRESCRIBED TIME-LIMIT Effective date: 20240626 Ref country code: IS Free format text: LAPSE BECAUSE OF FAILURE TO SUBMIT A TRANSLATION OF THE DESCRIPTION OR TO PAY THE FEE WITHIN THE PRESCRIBED TIME-LIMIT Effective date: 20241026 Ref country code: ES Free format text: LAPSE BECAUSE OF FAILURE TO SUBMIT A TRANSLATION OF THE DESCRIPTION OR TO PAY THE FEE WITHIN THE PRESCRIBED TIME-LIMIT Effective date: 20240626 Ref country code: CZ Free format text: LAPSE BECAUSE OF FAILURE TO SUBMIT A TRANSLATION OF THE DESCRIPTION OR TO PAY THE FEE WITHIN THE PRESCRIBED TIME-LIMIT Effective date: 20240626 |
|
| PLBE | No opposition filed within time limit |
Free format text: ORIGINAL CODE: 0009261 |
|
| STAA | Information on the status of an ep patent application or granted ep patent |
Free format text: STATUS: NO OPPOSITION FILED WITHIN TIME LIMIT |
|
| 26N | No opposition filed |
Effective date: 20250327 |
|
| U20 | Renewal fee for the european patent with unitary effect paid |
Year of fee payment: 7 Effective date: 20250425 |
|
| REG | Reference to a national code |
Ref country code: CH Ref legal event code: H13 Free format text: ST27 STATUS EVENT CODE: U-0-0-H10-H13 (AS PROVIDED BY THE NATIONAL OFFICE) Effective date: 20251125 |