EP3776217B1 - Debugging an executable control flow graph that specifies control flow - Google Patents
Debugging an executable control flow graph that specifies control flow Download PDFInfo
- Publication number
- EP3776217B1 EP3776217B1 EP19713959.5A EP19713959A EP3776217B1 EP 3776217 B1 EP3776217 B1 EP 3776217B1 EP 19713959 A EP19713959 A EP 19713959A EP 3776217 B1 EP3776217 B1 EP 3776217B1
- Authority
- EP
- European Patent Office
- Prior art keywords
- control flow
- execution
- plan
- task
- flow graph
- Prior art date
- Legal status (The legal status is an assumption and is not a legal conclusion. Google has not performed a legal analysis and makes no representation as to the accuracy of the status listed.)
- Active
Links
Images








Classifications
-
- G—PHYSICS
- G06—COMPUTING OR CALCULATING; COUNTING
- G06F—ELECTRIC DIGITAL DATA PROCESSING
- G06F11/00—Error detection; Error correction; Monitoring
- G06F11/36—Prevention of errors by analysis, debugging or testing of software
- G06F11/362—Debugging of software
- G06F11/3636—Debugging of software by tracing the execution of the program
-
- G—PHYSICS
- G06—COMPUTING OR CALCULATING; COUNTING
- G06F—ELECTRIC DIGITAL DATA PROCESSING
- G06F11/00—Error detection; Error correction; Monitoring
- G06F11/36—Prevention of errors by analysis, debugging or testing of software
- G06F11/3698—Environments for analysis, debugging or testing of software
-
- G—PHYSICS
- G06—COMPUTING OR CALCULATING; COUNTING
- G06F—ELECTRIC DIGITAL DATA PROCESSING
- G06F11/00—Error detection; Error correction; Monitoring
- G06F11/30—Monitoring
- G06F11/32—Monitoring with visual or acoustical indication of the functioning of the machine
- G06F11/323—Visualisation of programs or trace data
-
- G—PHYSICS
- G06—COMPUTING OR CALCULATING; COUNTING
- G06F—ELECTRIC DIGITAL DATA PROCESSING
- G06F11/00—Error detection; Error correction; Monitoring
- G06F11/36—Prevention of errors by analysis, debugging or testing of software
- G06F11/362—Debugging of software
-
- G—PHYSICS
- G06—COMPUTING OR CALCULATING; COUNTING
- G06F—ELECTRIC DIGITAL DATA PROCESSING
- G06F11/00—Error detection; Error correction; Monitoring
- G06F11/36—Prevention of errors by analysis, debugging or testing of software
- G06F11/362—Debugging of software
- G06F11/3648—Debugging of software using additional hardware
- G06F11/3656—Debugging of software using additional hardware using a specific debug interface
-
- G—PHYSICS
- G06—COMPUTING OR CALCULATING; COUNTING
- G06F—ELECTRIC DIGITAL DATA PROCESSING
- G06F11/00—Error detection; Error correction; Monitoring
- G06F11/36—Prevention of errors by analysis, debugging or testing of software
- G06F11/3668—Testing of software
- G06F11/3696—Methods or tools to render software testable
Definitions
- the present description relates to methods, system and computer-readable media for debugging an executable control flow graph that specifies control flow among a plurality of functional modules.
- a debugger or debugging tool is a computer program that is used to test and debug other computer programs.
- WO 0000/077628 A1 discloses a system and method for graphically debugging a computer program.
- a graphical debugging environment is provided, which is capable of displaying a graphical representation of an application program to be debugged. Thereafter, the graphical debugging environment may allow a user to insert debugging tools, such as breakpoints directly into the graphical representation of the application program. Thus a user may not be required to interact with the textual source code of an application program when debugging it.
- the graphical debugging environment may display indicators illustrating where debug tools have been inserted within the application program.
- the graphical debugging environment may allow a user to perform debugging during an application program's runtime. Thus, a user may not be required to halt an application program prior to debugging it.
- the graphical debugging environment executing on a local computer may be used to debug an application program residing on a remote computer.
- US 2002/120919 A1 discloses an execution monitoring tool, a method and a computer program product for monitoring execution of an hierarchical visual program.
- Execution progress reports are sent to an execution monitoring controller which maps the report data to its own representation of the hierarchical program to determine the current position within an execution program.
- the hierarchical structure of the program and the current execution position are displayed during execution on a test system.
- the execution monitoring controller maintains an hierarchical representation of the visual program's structure, builds an execution stack from the execution progress reports, and compares the received reports with the hierarchical representation to determine a current execution position.
- the execution reports include the current execution status as well as the position within the execution flow.
- the execution progress reports include the content and structure of the message during execution and this is also displayed to the user.
- a set of debug nodes for generating the execution progress reports are preferably automatically inserted in the message flow before executing it on a test and debugging system, and these debug nodes send execution progress reports to a debug controller.
- the present invention relates to a computer-implemented method as defined by independent claim 1, to a computer system according to independent claim 21, and to a computer-readable medium according to independent claim 22.
- the computer-implemented method according to the invention is for debugging an executable control flow graph that specifies control flow among a plurality of functional modules, with the control flow being represented as transitions among the plurality of functional modules, with each functional module being configured to execute one or more actions on a computer system and with each functional module including a plurality of methods to perform the actions, wherein the plurality of methods includes a method that causes a controlled application to run and one or more framework methods, with the one or more framework methods including a method that sets up an environment for the controlled application to run or a method that executes based on a result of a run of the controlled application, and with the control flow specifying an order in which individual functional modules are to be executed, the computer-implemented method including:
- Thecomputer system comprises: one or more processors; a memory storing instructions, which, when executed by the one or more processors, cause the one or more processors to perform any one of the methods according to the invention.
- the computer-readable medium according to the invention is storing instructions, which, when executed by one or more computers, cause the one or more computers to perform any one of the methods according to the invention.
- diagram 2 illustrates graphical portion 1 of a plan.
- plan 1 For purposes of convenience, and without limitation, the entirety of the plan (that includes graphical portion 1) is hereinafter referred to as plan 1.
- plan 1 also called herein an "executable control flow graph” or a “graphical control flow application”
- each functional module represents a controlled application.
- the plan specifies control flow among the functional modules. By specifying the control flow, the plan provides a visual organization of the execution of the various functional modules of the plan. Generally, the control flow specified by the plan is represented by transitions or connections between the graphical program elements in the plan. The plan can be run or executed and encapsulates information through the functional modules for the various controlled applications to be executed.
- a controlled application includes a program that is external to the plan and is run by the plan. Examples of a controlled application include a computer program, a script, a dataflow graph, another plan, and so forth.
- a graphical program element includes an element of the visual program in a visual programming language (VPL) that can be manipulated graphically rather than textually.
- VPL visual programming language
- a functional module includes data structures of the plan, methods of the plan and code for implementing the methods with the data structures.
- a type of functional module is a task that includes a series of actions (within the plan, rather than the controlled application) to be executed.
- a functional module may also be referred to herein as a "task,” without limitation.
- control flow expresses logic about a sequence of execution of the functional modules of the plan.
- a functional module represents conditional logic, a program, a user script, a process, and so forth.
- a functional module may be implemented using a dataflow graph or may represent another executable control flow graph (called a "subplan" or a sub-executable control flow graph).
- a subplan is a plan embedded in a larger plan and is used in a plan for organizational convenience and can include various functionality, e.g., looping functionality.
- the subplan can represent many different tasks, as well as further nested subplans.
- the plan controls the sequence, relationships, and communication between tasks by how the tasks are connected and how methods and parameters are specified. In the plan, the tasks, the run sequence, the conditional logic, and the relationships between tasks are represented graphically.
- the plan includes a graphical layer (previously referred to as the graphical portion) and a control processing layer, each of which are distinct from a data processing layer (e.g., the controlled application).
- the graphical layer includes the visuals in the graphical user interface and the visual program in the VPL.
- the control processing layer includes the tasks, methods, underlying data structures (used in executing the methods), and code that executes the methods using the underlying data structures to effect the control flow specified by the visual programming language.
- the plan, subplan and graphical program elements include graphical entities that are part of a visual program, and the tasks and other functional modules of the plan are represented by the graphical entities and are controlled by the visual program called the "executable control flow graph". That is, the executable control flow graph does not specify control flow among graphical icons but controls the execution order of real data processing.
- the executable control flow graph includes a directed graph with nodes representing the functional modules, e.g., tasks, subplans, and so forth.
- the nodes are connected by directed links (also called “transitions" herein) representing control flow among the functional modules.
- directed links also called "transitions” herein
- each of the directed links is specified by data structures specifying control flow among the functional modules.
- execution of the plan itself causes execution of the underlying control processing layer represented by the node in the plan in accordance with the control flow specified by the plan.
- the plan may be run on one or multiple computing nodes (e.g., central processing units (CPUs)), e.g., in a distributed manner such that each graphical program element is run on a different one of the computing nodes, wherein the different computing nodes are communicatively interconnected by network connections.
- computing nodes e.g., central processing units (CPUs)
- CPUs central processing units
- the construction of an executable control flow graph can be highly technical in nature in some cases.
- the executable control flow graph may implement graph-based control flow among various subplans and tasks.
- the executable control flow graph is specified by data structures in a data storage, the executable control flow graph having a plurality of nodes being specified by the data structures and representing the subplans and/or tasks connected by one or more links, the links being specified by the data structures and representing data flows between the nodes.
- a runtime environment coupled to the data storage and being hosted on one or more computers may be used, the runtime environment including a pre-execution module configured to read the stored data structures specifying the executable control flow graph and to allocate and configure computing resources such as processes for performing the computation of the tasks and subplans that are assigned to the executable control flow graph by the pre-execution module, the runtime environment including an execution module to schedule and control execution of the assigned processes such that any one of the methods described herein is executed.
- a pre-execution module configured to read the stored data structures specifying the executable control flow graph and to allocate and configure computing resources such as processes for performing the computation of the tasks and subplans that are assigned to the executable control flow graph by the pre-execution module
- the runtime environment including an execution module to schedule and control execution of the assigned processes such that any one of the methods described herein is executed.
- a program task e.g., a task that represents a specified program, which is a process that is distinct from a process running the plan, and/or that enables automatic incorporation of executable code in the plan
- a plan task e.g., a task representing a child plan, which is a process (for execution of another plan) that is distinct from a process running the plan
- a graph task e.g., a task that represents a dataflow graph, which is also a process that is distinct from a process running the plan, and/or is configured to run a separate executable dataflow graph from within the plan
- a conditional task that implements conditional logic in a plan.
- each task represents an ordered series of actions to be executed on a computer system.
- the main action of a task is called its Perform method.
- the Perform method may be implemented to perform the main functionality of the task.
- each task can optionally execute other actions at specific times or in response to specific conditions - as described in further detail below.
- the Perform method gives the task its identity.
- the rest of the task supports the Perform method.
- Various optional actions prepare for or set-up the execution of the Perform method, report on its outcome, and clean up after it.
- a plan includes an underlying data structure that stores the logic representing the various tasks and subplans and the relationships among these various tasks and subplans.
- execution of the plan causes the underlying data structure to be executed or run, e.g., by instantiating appropriate objects for the various tasks and methods in a plan.
- the system stores the contents of a plan in a file that includes a hierarchical representation of the plan.
- the hierarchical representation includes nodes, with each node corresponding to an element (e.g., task, method, or subplan) of the plan.
- the system instantiates the plan by traversing the nodes in the hierarchical representation. For each node, the system instantiates an object for an element represented by that node. For example, when a node represents a task, the system instantiates a task object for that node. Additionally, when the plan specifies to run a method on that task, the system instantiates a method object for that method.
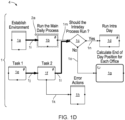
- plan 1 is a plan for processing data records to determine which actions (e.g., running an intraday process or calculating an end of day position) are appropriate for execution, e.g., based on the processing of those data records.
- the system executes plan 1 in a financial services setting as part of a procedure for determining intraday trade prices or closing out trading for the day, e.g., by determining whether to run a particular process (i.e., an intraday process) or to perform a particular calculation that determines end of day positions.
- Plan 1 includes graphical program elements 1a, 1b, 1c, 1d, 1e, 1f, 1g, 1h and transitions 1i, 1j, 1k, 11, 1m, 1o.
- the graphical program elements 1a, 1b, 1c, 1d, 1e, 1f, 1g, 1h represent respective tasks as introduced above and the transitions 1i, 1j, 1k, 1l, 1m, 1o represent control flow, as introduced above, that is specified by plan 1.
- plan 1 For the convenience of the reader, whenever reference signs indicating graphical program elements or transitions are referred to, the respective tasks and control flow, respectively, are directly referred to when describing the corresponding figures.
- plan 1 includes program tasks 1a and 1h, graph tasks 1b and 1d, conditional task 1c, plan tasks 1e and 1f and subplan 1g.
- program tasks 1a and 1h, graph tasks 1b and 1d, conditional task 1c, and plan tasks 1e and 1f may be referred to herein as a "task,” for purposes of convenience.
- task 1b can only execute after task 1a has completed.
- Task 1f can execute only after task 1e has completed.
- Plan 1 also shows that a condition specified in conditional task 1c is subsequently evaluated ("Should the intraday process run?"), and if found to be "No", then the end-of-day position is calculated, by the system, for each office by iterating over subplan 1g. If "Yes,” then the system executes task 1d to perform an intraday run.
- various tasks can also be triggered on the failure of other tasks - this is illustrated in plan 1 by the "Error Actions" task (i.e., task 1h), which is run if Task 2 (i.e., task 1f) fails for any reason.
- each of program tasks 1a, 1h points (or otherwise refers) to an external program, or to an external or embedded script.
- graph tasks 1b and 1d points (or otherwise refers) to an executable dataflow graph (e.g., that is stored in storage).
- an executable dataflow graph (also referred to as an executable graph) includes a directed dataflow graph, with vertices in the graph representing components (either data files or processes), and the links or "edges" in the graph indicating flows of data between components.
- a system for executing such graph-based computations is described in prior U.S. Pat. No. 5,966,072 , titled “EXECUTING COMPUTATIONS EXPRESSED AS GRAPHS,”.
- the construction of a dataflow graph can be highly technical in nature in some cases.
- the data flow graph may implement a graph-based computation performed on data flowing from one or more input data sets through a graph of processing graph components to one or more output data sets, wherein the data flow graph is specified by data structures in a data storage, the dataflow graph having a plurality of nodes being specified by the data structures and representing the graph components connected by one or more links, the links being specified by the data structures and representing data flows between the graph components.
- a runtime environment coupled to the data storage and being hosted on one or more computers may be used, the runtime environment including a pre-execution module configured to read the stored data structures specifying the data flow graph and to allocate and configure computing resources such as processes for performing the computation of the graph components that are assigned to the data flow graph by the pre-execution module, the runtime environment including an execution module to schedule and control execution of the assigned processes such that any one of the methods described herein is executed.
- the underlying structure and construction of the graph is determined based upon technical considerations. For example, graph components may be selected to maximize reusability, or to support parallel processing. On the other hand, how and where a graph is used may be largely a business decision.
- Some of the parameters associated with a parameterized dataflow graph can be used to enable business users to customize dataflow graphs without requiring the user to understand the technical complexities behind its implementation.
- the parameterized dataflow graphs simplify customization and facilitate reuse.
- plan tasks 1e, 1f points to a plan located in an external file.
- Conditional task 1c implements decision logic in plan 1 - based on a specified expression or program.
- Subplan 1g groups tasks (included in subplan 1g) as part of a plan, and allows these tasks to be run iteratively.
- Plan 1 also includes transitions 1i-1o that indicate a dependency among tasks, e.g., and thus control an execution order among tasks. That is, transitions 1i-1o represent connections among these tasks and thus specifies an execution dependency.
- a task provides a framework for executing methods, e.g., by the task specifying which controlled applications are to be executed and encapsulating information about the controlled applications (e.g., location, arguments, etc.).
- the programming code for the controlled applications can be stored in storage and referred to by the task. These methods perform the actions of the task. That is, the plan is not a visualization of an underlying code source. Rather, the plan itself is a visual program that can be run or executed and that also encapsulates information for or representing the various executables to be executed.
- a plan also includes attributes (e.g., parameters) for the passing of values among tasks.
- a change in parameters can affect subplans, methods and other tasks at the same (or different) hierarchical level of the task for which the parameter values are changed.
- a plan also has specified relationships that govern the order in which the tasks are run. The plan controls the sequence, relationships and communications among the tasks, in accordance with connections among the tasks and specification of the methods and parameters.
- diagram 1p illustrates that there are various locations at which a breakpoint may be inserted into the plan 1.
- a breakpoint includes an instruction (e.g., an indication, directive, or specification) to pause or stop an execution of the plan in an execution environment.
- the plan pauses to enable evaluation (e.g., automatic evaluation or user evaluation) of internal attributes of the plan (e.g., such as operational parameters and associated values of the plan, dynamic parameters that the plan is using and associated values, and if the breakpoint is before a graph or plan is launched, the input values that are going to be sent to that graph or plan) and/or evaluation of attributes that are external to the plan (such as attributes of the execution environment or system that is executing the plan and/or external states and resources (e.g., states of databases and repositories used by the execution environment when executing the plan)).
- evaluation e.g., automatic evaluation or user evaluation
- internal attributes of the plan e.g., such as operational parameters and associated values of the plan, dynamic parameters that the plan is using and associated values, and if the breakpoint is before a graph or plan is launched, the input values that are going to be sent to that graph or plan
- attributes that are external to the plan such as attributes of the execution environment or system that is executing the plan and/or external states
- breakpoints enable monitoring of the attributes, and thereby of the internal states of the underlying system (e.g., plan and/or execution environment), that are prevailing at the time when the executing plan encounters the breakpoint.
- a user is enabled to view the parameter values used for a task and also to change the functionality of that task (and other tasks that are downstream or dependent on that task), e.g., by changing the values of the parameters.
- the user is enabled to view aspects that are external to the plan, such as values of operational parameters of the execution environment indicating a performance (e.g., CPU usage, usage of primary memory, available or occupied data storage capacity, consumed or available network bandwidth, etc.) of the execution environment during the execution of the plan before the plan encountered the breakpoint.
- a performance e.g., CPU usage, usage of primary memory, available or occupied data storage capacity, consumed or available network bandwidth, etc.
- a breakpoint may be inserted at position 1q that represents a transition to a given functional module, namely, task 1b.
- a breakpoint may also be inserted at position 1r in task 1b.
- the setting of a breakpoint at position 1r interrupts execution of task 1b just before task 1b prepares to spawn the represented process (or task) that runs a program or before other functionality or actions.
- the setting of or insertion of a breakpoint by the system described herein refers to the recording of a breakpoint by the system. That is, position 1r represents a time just before or at which the execution of task 1b or some of its actions starts.
- a breakpoint may also be inserted at position 1s that represents a transition from task 1b (e.g., position 1s represents a time after the execution of the task 1b completed).
- diagram 3 includes breakpoint indicator 2a that illustrates that a breakpoint is recorded for task 1b in plan 1.
- Breakpoint indicator 2a specifies that one or more breakpoints have been recorded on task 1b (i.e., the breakpoints are associated with task 1b), but does not specify a position of the breakpoint as being before, in or after task 1b.
- the details of where the one or more breakpoints are set are available "on demand," e.g., by selecting or hovering on breakpoint indicator 2a.
- a breakpoint indicator is an indication of or a visual representation of the presence of one or more breakpoints.
- execution of plan 1 pauses when the system executes the breakpoint represented by breakpoint indicator 2a and an inspector user interface (e.g., referred to as a "Breakpoint Inspector") is presented.
- the Breakpoint Inspector is presented whenever plan execution is paused (e.g., either by break-on-failure mode, described below, being on and a failure occurring, or by a breakpoint that was set by the user being encountered during the course of plan execution).
- diagram 4 illustrates that plan 1 has encountered the breakpoint represented by breakpoint indicator 2a, as indicated by the dotted line around task 1b. That is, task 1b is stopped due to the breakpoint represented by breakpoint indicator 2a being reached, but the rest of plan 1 continues to run.
- arrows 1i, 1j, 11 are shown as thicker lines (e.g., relative to a thickness of the other arrows shown in FIG. 1D ) to represent that plan 1 executed tasks 1a, 1e, 1f.
- tasks 1a, 1e, 1f execute (e.g., in parallel or with task 1a executing in parallel with tasks 1e and 1f, which execute in serial order) and plan 1 progresses as far as it can given that plan execution pauses at task 1b.
- a graphical user interface e.g., the Breakpoint Inspector
- the display of the graphical user interface may be triggered or initiated in response to plan 1 encountering breakpoint indicator 2a.
- the graphical user interface may be displayed while the rest of plan 1, e.g. tasks 1e and 1f, continues to run. In this example, task 1c will not run until task 1b completes and succeeds, and task 1b will not complete while execution is stopped at the breakpoint represented by breakpoint indicator 2a.
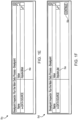
- graphical user interface 5c is displayed, e.g., when a point of execution (of plan 1 in FIG. 1D or of the underlying data structure representing plan 1) representing the specified position of the breakpoint represented by breakpoint indicator 2a ( FIG. 1D ) is reached.
- graphical user interface 5c displays the reason for the execution pause in the title, namely, "breakpoint" after the name of the task (i.e., "Run the Main Daily Process”).
- Graphical user interface 5c also includes data source portion 4a that specifies a data source for task 1b ( FIG. 1D ) in plan 1.
- graphical user interface 5d is a version of graphical user interface 5c after a correct data source has been entered into portion 5a (or portion 4a in FIG. 1E ).
- graphical user interface 5d displays continue control 5b, selection of which causes task 1b ( FIG. 1D ) to continue execution and, optionally, each of graphical user interfaces 5c, 5d to stop being displayed.
- This is an example of how changes are made to tasks while a plan continues to run.
- continue control 5b is selected.
- a graphical user interface is displayed to enable modification of various values (e.g., of parameters used by the task during its execution) and/or inputs used by the task.
- the graphical user interface displays a control to restart that failed task, e.g., while the rest of the plan still continues to run.
- a user may set a breakpoint (e.g., the breakpoint represented by breakpoint indicator 2a) at the start of task 1b. After doing so, the user executes a command, e.g., the "plan-admin restart ⁇ task>" command, in a command line to restart task 1b. Then, when task 1b pauses at the start, the value of the DATA SOURCE parameter can be changed, as described above, so that when task 1b restarts, it will use the corrected value. In this example, the new value is only in effect for that run of plan 1. To permanently change the value of the parameter, the plan itself is edited.
- a breakpoint e.g., the breakpoint represented by breakpoint indicator 2a
- diagram 6 shows re-execution of task 1b (e.g., following selection of continue control 5b in FIG. 1F or following execution of the command (e.g., the "plan-admin restart ⁇ task>" command, described above).
- task 1b uses the correct value of the DATA SOURCE parameter (based on task 1b pausing at the start due to the breakpoint represented by breakpoint indicator 2a and the value of the DATA SOURCE parameter being changed to the corrected value).
- plan 1 progresses through tasks 1b to conditional task 1c, as shown by the thickness of arrows 1m, 1l.
- control flow diagram 10 (also referred to as plan 10) includes graphical program elements 12, 14, 16 and transitions 18, 20.
- the graphical program elements represent respective tasks 12, 14, 16.
- the transitions 18, 20 represent the control flow specified by the plan 10.
- plan 10 includes connections 18, 20 that specify that task 12 is executed first, followed by execution of task 14 and then task 16.
- behavior of plan 10 can be modified to include one or more breakpoints that cause plan 10 to stop or pause execution, thereby allowing for review and/or modification of the plan, tasks, subplans and/or parameters.
- This plan debugging functionality provides flexibility on where breakpoints are set, e.g., by enabling the setting of breakpoints at various hierarchical levels. For example, the system can set a breakpoint at the level of the entire plan, at the level of the subplan, at the level of the task, or even at the level of a method of a task. Additionally, a breakpoint can be set at the following three positions: before the plan, subplan, task or method; in the plan, subplan, task or method, and after the plan, subplan, task or method, each of which are described in further detail below.
- a breakpoint can be recorded at position 22 before task 14.
- a breakpoint at position 22 stops execution of task 14 before it starts.
- resources e.g., a constrained element, such as, a specified number of available tokens
- this stopping of the execution also occurs before the graph is compiled for execution.
- a breakpoint can be recorded at position 24 in task 14.
- task 14 is configured to run computer program 28.
- the breakpoint at position 24 interrupts execution of task 14 before task 14 executes its Perform method.
- the breakpoint at position 24 provides for modification of environment variables of plan 10 and viewing and editing of input values (e.g., expressions for input parameters) to be used in program 28.
- a breakpoint can be recorded at position 26 after task 14 to stop the execution of task 14 after it finishes.
- the places where breakpoints can occur are very efficient places for checking whether breakpoints have been requested. As such, there is no (or only minimal) measurable increase in consumption of computing resources, such as CPU consumption, due to the checking for breakpoints. This is because the programming code that is used in the plan to check for breakpoints is minimal and thus not computationally expensive.
- the program is configured to check a hash table for an occurrence of a breakpoint each time the program progresses to a location in which a breakpoint could be inserted (e.g., at each location representing before, in or after a plan, subplan, task or method).
- a first plan (“plan A") includes a breakpoint before a first task ("task A").
- the hash table includes the following entry "/planA/taskA/before" to indicate that there is a breakpoint before task A, which is included in plan A.
- a look-up e.g., a string look-up
- the system executes a breakpoint before task A.
- the hash table is empty. In this example, the system does not check for entries specifying breakpoints.
- diagram 40 displays graphical program element 42 representing a task.
- graphical program element 42 is also referred to as task 42.
- a breakpoint can be recorded at position 44 before task 42, another breakpoint can be recorded at position 46 in task 42 and yet another breakpoint can be recorded at position 48 after task 42, as previously described.
- task 42 includes or references a script and further includes several methods (each method including one or more actions as previously described) that can be executed on a computer system (e.g., in an operating system of the system described herein). These methods are existing methods provided by the system described herein.
- task 42 is configured with "Trigger” method 49, "At Start” method 50, “Perform” method 52, “At Success” method 54, “At Failure” method 56, and “At Rollback” method 59, each of which executes one or more actions of task 42 or represents one or more states of task 42.
- Trigger method 49 may be implemented to represent the starting point of the task 42. It may include the condition for starting the execution. There may be various conditions, including, e.g., whether a specific file exists, whether a flag has been set to true, and so forth.
- Start method 50 sets-up execution to perform the actions of task 42.
- At Start method 50 may be implemented as a method that prepares the system for the Perform method, such as setting environmental variables to desired values, or setting up log files to log runtime information.
- Perform method 52 performs specified actions of the task, e.g., by running the executable represented by task 42.
- Perform method 52 may be implemented to perform the main functionality of task 42. If Perform method 52 succeeds during its execution, At Success method 54 is executed to exit task 42. If Perform method 52 fails during its execution, At Failure method 56 is executed to exit task 42. In this example, At Rollback method 59 is executed after At Failure method 56.
- the methods before and after the Perform method are referred to as "framework methods.”
- the framework methods before the Perform method set up the environment (and/or situation) for the controlled application to run, but are not part of the controlled application.
- the framework methods after the Perform method i.e., the At Failure, At Success and At Rollback methods
- the framework methods are also part of the plan and execute based on the result of the run of the controlled application.
- the framework methods are not performing the actions of the controlled application. These framework methods are part of the plan's control processing layer.
- breakpoints can be set before, in and after Trigger method 49, as specified by breakpoints 49a, 49b, 49c.
- breakpoints can be set before, in and after At Start method 50, as specified by positions 50a, 50b, 50c, respectively.
- a breakpoint at position 50a specifies that execution of task 42 is paused or interrupted before At Start method 50 starts.
- a breakpoint at position 50b specifies that execution of task 42 is paused or interrupted at the start of At Start method 50.
- a breakpoint at position 50c specifies that execution of task 42 is paused or interrupted at the completion of At Start method 50.
- Breakpoints can be recorded before, in and after Perform method 52, as specified by positions 52a, 52b, 52c. In this example, the recording of a breakpoint at position 46 in task 42 is the same as recording a breakpoint in position 52a before execution of Perform method 52.
- breakpoints can be recorded at positions 54a, 54b, 54c for At Success method 54 to interrupt the At Success method 54 before it performs the actions of the At Success method 54, while it is performing the actions of the At Success method 54, and after it performs the actions of the At Success method 54, respectively.
- breakpoints can be recorded at positions 56a, 56b, 56c - before, in or after (respectively) At Failure method 56.
- a breakpoint can be recorded at position 56a for At Failure method 56 to determine a setup of attributes of task 42 before At Failure method 56 runs.
- At Rollback method 59 rolls back failed tasks, e.g., by rolling back what has been done in reverse execution order starting at the point of failure.
- the system described herein may store a recovery file for a graph or a plan.
- the system uses that recovery file (along with the At Rollback methods) to clean up as necessary.
- breakpoints can be recorded at positions 59a, 59b, 59c representing before, in or after (respectively) At Rollback method 59.
- a breakpoint at position 59a specifies that execution of task 42 is paused or interrupted before At Rollback method 59 starts.
- a breakpoint at position 59b specifies that execution of task 42 is paused or interrupted at the start of At Rollback method 59.
- a breakpoint at position 59c specifies that execution of task 42 is paused or interrupted at the completion of At Rollback method 59.
- the At Success, At Failure and At Rollback methods are optional. As such, when those methods are not included in a task, then no breakpoints would be able to be set for those methods.
- a plan can also be run in break-on-failure mode, which causes execution of the plan to be interrupted when the plan encounters a failure. For example, if a Perform method for a graph, plan, or program task fails because the graph, child plan, or program that it ran failed, then the execution of the plan will pause after the Perform method finishes.
- break-on-failure mode causes execution of the plan to be interrupted when the plan encounters a failure. For example, if a Perform method for a graph, plan, or program task fails because the graph, child plan, or program that it ran failed, then the execution of the plan will pause after the Perform method finishes.
- the Breakpoint Inspector is displayed to enable a user to view a cause of the failure and attributes of the functional module for which the failure occurred.
- a user can set break-on-failure, wait for a task to fail (at the perform method's after breakpoint), diagnose the problem, fix the problem, then rerun the plan to avoid the failure.
- the system can execute a command to restart a task, e.g., any point of a task's lifetime. That is, even if the task is stopped at its "before" breakpoint, the command can still be issued successfully. Then, when the task has finally failed and finished, it will restart automatically, as follows: The system executes a plan in the break-on-failure mode (or sets a breakpoint after the Perform method). In cases where the breakpoint has been set, the system waits for the breakpoint to be encountered during plan execution.
- a user or the system examines the state to diagnose the reason for the failure. Following diagnosis, the user sets (or the system records) a "before" breakpoint on the task or Perform method. The user or the system issues a command to restart the task and the system waits for the "before" breakpoint to be encountered (when the task is automatically restarted). The user or the system corrects the cause of the failure (e.g., by overriding a parameter value, changing a file, and so forth) and continues on from the "before" breakpoint so that the task will succeed.
- break-on-failure mode does not specify this type of particular plan element and position. Rather, break-on-failure mode is a mode in which to execute a plan (and cause execution to pause upon failure) and does not specify a particular plan element. Instead, execution will automatically pause at a failed task. In some examples, break-on-failure mode always causes execution to pause at the after position of the Perform method of the failed task.
- graphical user interface 100 displays graphical layer 102 of a plan (collectively referred to herein as "plan 102," for purposes of convenience and without limitation), which includes graphical program elements 104, 106, 108, 110 representing respective tasks and also graphical program element 112 representing a subplan.
- plan 102 graphical program elements
- graphical program elements 104, 106, 108, 110 are referred to herein as tasks 104, 106, 108, 110, respectively
- graphical program element 112 is referred to herein as subplan 112.
- task 106 is a Move and Reformat Graph task (hereinafter also referred to as "Move and Reformat Graph task 106").
- Move and Reformat Graph task 106 is a functional module that includes or references an executable dataflow graph (e.g., a Move and Reformat Graph).
- the executed dataflow graph is part of the data processing layer, whereas Move and Reformat Graph task 106 is part of the graphical layer and encapsulates information about how to execute the dataflow graph.
- task 108 is a child plan, hereinafter also referred to as "Simple Dependency Plan 108."
- a child plan is a plan that is executed as a new process (i.e., a "child process") that is distinct from a process that is running the plan that executes the child plan.
- the dataflow graph e.g., the Move and Reformat Graph
- task 104 is a conditional task, including, e.g., a task that is configured to perform one or more first actions (e.g., by executing one or more methods) upon satisfaction of a condition and to perform one or more second actions (e.g., by executing one or more other methods) upon failure of satisfaction of the condition.
- every task can be configured as a conditional task.
- a conditional task may specify conditions other than success or failure - such, e.g., a specific value.
- task 104 checks whether a file exists.
- Task 104 is also hereinafter referred to as "Check if File Exists Task 104."
- Check if File Exists Task 104 is an implementation of conditional logic, directing the control to either Move and Reformat Graph 106, or Simple Dependency Plan 108 depending on whether a particular file exits.
- Subplan 112 is itself a control flow diagram and executes in the same process that is running plan 102.
- graphical user interface 120 includes controls 122, 124, 126, 128, 130 for setting a breakpoint.
- control 122 enables a user to set a breakpoint (generally for a plan) and control 124 enables a user to set the breakpoint before a plan starts.
- Control 126 enables a user to set the breakpoint in the plan and before the plan contents run.
- Control 128 enables a user to set the breakpoint before the plan exits.
- Control 130 enables the user to set a breakpoint for various methods and conditions.
- graphical user interface 140 provides controls for setting a breakpoint on a task.
- a user selects Check if File Exists task 104 ( FIG. 4 ) and selects the "Set Breakpoint" option 142 from debug menu 144.
- graphical user interface 140 displays controls 146, 148 to enable setting of a breakpoint before task 104 starts or after task 104 finishes, respectively.
- the user selects control 146 to set the breakpoint before task 104 starts.
- graphical user interface 160 displays plan 102, in which a breakpoint has been recorded (as indicated by breakpoint indicator 164a) on task 104.
- breakpoint indicator 164a specifies that one or more breakpoints has been set on task 104, but does not specify a position of the breakpoint as being before, in or after task 104.
- a breakpoint has been recorded (as indicated by breakpoint indicator 164b) on subplan 112, e.g., by selecting subplan 112 and then selecting the "Set Breakpoint" option 142 (in FIG. 6 ), which enables a user to specify whether to set a breakpoint before subplan 112 starts or after subplan 112 finishes.
- a breakpoint is set on subplan 112 before subplan 112 starts. More than one breakpoint can be encountered at the same time, e.g., causing execution of plan to be paused in different places of the plan simultaneously.
- the breakpoints represented by breakpoint indicators 164a, 164b can be encountered at the same time.
- the debug menu may provide a "Show All Breakpoints" control, selection of which displays a breakpoint editor dialog with a list of the breakpoints that have been set in the plan. Through this breakpoint editor dialog, a user can add, remove, edit and work with the set of breakpoints that have been defined.
- breakpoint reached pane an overlay or interface that lists the locations of plan 102 that are now paused due to execution of the various breakpoints.
- breakpoint reached user interface 170 is displayed (e.g., in proximity to or juxtaposed to graphical user interface 160 in FIG. 7A ), e.g., once one or more of the breakpoints represented by breakpoint indicators 164a, 164b are encountered. In this example, both of the breakpoints represented by breakpoint indicators 164a, 164b are encountered, e.g., at a same time.
- breakpoint reached user interface 170 includes portion 171a that specifies that plan 102 is currently paused at a particular functional module, namely, at task 104 due to a "before task starts" breakpoint (represented in area 172a of portion 171a) - as specified by breakpoint indicator 164a.
- Breakpoint reached user interface 170 also includes portion 171b that specifies that plan 102 is currently paused at another functional module, namely, subplan 112 due to a "before subplan starts” breakpoint (represented in area 172b of portion 171b) - as specified by breakpoint indicator 164b.
- a breakpoint inspector user interface is displayed and presents parameters, environment variables, and so forth for the functional module represented in the selected portion.
- graphical user interface 180 is displayed once a breakpoint is reached and is an example of a breakpoint inspector user interface.
- graphical user interface 180 is displayed once the breakpoint represented by breakpoint indicator 164a ( FIG. 7A ) is reached and following selection of portion 171a in breakpoint reached user interface 170 in FIG. 7B .
- graphical user interface 180 displays parameters tab 172 for displaying parameters and associated parameter values of the task (which in this case is task 104 in FIG. 7A ).
- controls 182, 184 provide for editing of various parameter values.
- selection of control 184 provides for editing of a parameter value that specifies a value for an expression, i.e., specifying whether the expression has a value of "0" or "1.”
- Graphical user interface 180 includes input values tab 174 that displays input values for task 104, environment tab 176 that displays execution environment variables or parameters and associated values for plan 102 ( FIG. 4 and FIG. 7A ) and evaluation tab 178, which provides controls and/or input boxes for writing expressions that are then evaluated against the state of execution of the plan and the current paused location.
- Each of tabs 172, 174, 176, 178 provides controls for editing appropriate values (e.g., of variables, parameters, input values and environment variables or parameters). Once a user is done editing values in one or more of tabs 172, 174, 176, 178, a user can specify (e.g., via selection of a control) to continue running the plan, e.g., from all of the breakpoint locations that might have been reached. In a variation, a user can select a particular breakpoint location and just continue from that breakpoint location.
- appropriate values e.g., of variables, parameters, input values and environment variables or parameters.
- Graphical user interface 190 is displayed following selection of control 184 ( FIG. 8 ).
- Graphical user interface 190 includes input portion 192 for modifying the values of the parameters or variables, e.g., for modifying a value of a parameter that specifies an expression.
- input portion 192 allows for entry and modification of a parameter value that specifies whether the expression evaluates to true (value of "1") or false (value of "0").
- breakpoint represented by breakpoint indicator 164a can be used to modify control flow, e.g., by forcing traversal from the process (or task) represented by task 104 to the process (or task) that is represented by task 106 (e.g., when the parameter expression is set to a value of "1") or by forcing traversal from task 104 to task 108 (e.g., when the parameter expression is set to a value of "0").
- graphical user interface 191 is displayed, e.g., following completion of editing in FIGS. 8 and 9A .
- graphical user interface 191 displays continue control 191a, selection of which continues execution of plan 102 from the breakpoint locations (i.e., represented by breakpoint indicators 164a, 164b) that are encountered.
- graphical user interface 192 also displays controls (or selectable portions of a user interface) that a user can select to continue plan execution from a particular breakpoint location.
- graphical user interface 192 includes breakpoint reached user interface 170 (previously shown in FIG. 7B ) with overlay 193. Selection of area 172a in portion 171a of breakpoint reached user interface 170, causes overlay 193 to be presented.
- Overlay 193 includes control 193a, selection of which instructs the system to continue plan 102 from the breakpoint represented in area 172a, namely, the breakpoint represented by breakpoint indicator 164a in FIG. 7A .
- execution environment 200 is hosted on one or more computers.
- Each element within execution environment 200 e.g., plan 202, subplan 204 and graphical program element 206 (that represents a task) included in plan 202) evaluates parameters as those parameters enter the scope of execution.
- plan 202 e.g., plan 202, subplan 204 and graphical program element 206 (that represents a task) included in plan 202) evaluates parameters as those parameters enter the scope of execution.
- the respective tasks are directly referred to when describing the following FIGS. 10-12 .
- graphical program element 206 is hereinafter referred to as task 206.
- breakpoints can be set to provide for viewing and modifying of these parameter values at various levels of a plan.
- a plan environment includes a computerized environment for execution and definition of a plan.
- Execution environment 200 includes execution environment parameters 208, including, e.g., parameters defined in a plan's environment, perhaps through the plan's sandbox or project. Execution environment parameters 208 are available to plan 202 before it begins to run.
- Plan 202 includes or accesses plan-level parameters 210, including, e.g., parameters that are declared at the plan level and evaluated when plan 202 starts running. Plan 202 may also reference parameters (i.e., execution environment parameters 208) from its execution environment (i.e., execution environment 200); these values are also resolved when plan 202 starts to run.
- plan 202 includes subplan 204 with subplan-level parameters 212, which the system resolves when subplan 204 starts running.
- subplan 204 is a looping subplan, as indicated by looping symbol 214.
- a looping subplan includes a subplan that is configured to loop a specified number of times or until a condition is satisfied.
- a looping subplan is a functional module that loops and can be repeated. As such, for each loop, a breakpoint can be set before, in or after that loop.
- the system (or an engine running on the system) also re-evaluates subplan-level parameters 212 each time subplan 204 starts a new loop.
- subplan 204 When subplan 204 loops, the values of its parameters can be made dynamic and passed from one loop to the next. By using breakpoints for subplan 204, the values of those parameters can be viewed and modified for use in a next loop. However, if subplan 204 is configured to loop concurrently, the parameter values remain private to each iteration.
- subplan 204 includes task 216 (with task-level resources 218) and plan 202 includes task 206 (with task-level resources 220).
- plan 202 includes task 206 (with task-level resources 220).
- task 206 includes Trigger method 222, At Start method 224, Perform method 226, and At Success method 228.
- Trigger method 222 and At Start method 224 set up the environment (and/or situation) for the controlled application to run.
- Perform method 226 causes the controlled application to run.
- Success method 228 runs, when the results of execution of the controlled application indicate a successful run of the controlled application.
- Trigger method 222 may be implemented to represent the starting point of task 206. Trigger method 222 may include various conditions for starting the execution. These various conditions include, e.g., whether a specific file exists, whether a flag has been set to true, and so forth.
- task 206 includes method-level parameters 230, 232, 234, 236. After resources have been acquired, the task's methods begin to enter execution scope. In this example, the system executes methods in a predetermined order. As such, the system described herein resolves method-level parameters in the same order.
- Trigger method 222 The first of a task's methods to enter the scope of execution is Trigger method 222. When this happens, the systems resolves method-level parameters 230 declared on or referenced by Trigger method 222. In this example, parameter values that are set by the system in Trigger method 222 can be passed on to methods that follow, e.g., by declaring those parameters as dynamic parameters. Assuming Trigger method 222 succeeds, the next method to enter the scope of execution is the At Start method 224, which includes method-level parameters 232, e.g., dynamic parameter values that were set in Trigger method 222.
- method-level parameters 234 of Perform method 226 are set in a user interface (e.g., in a task properties dialog parameters tab). The system evaluates these parameters when the Perform method 226 enters the scope of execution - after Trigger and At Start methods 222, 224, respectively, have run.
- a breakpoint can be set before Perform method 226 to enable modification of parameter values and to pass those modified values to subsequent methods, e.g., an At Failure method (not shown) and At Success method 228.
- Method-level parameters 236 of At Success method 228 have access to parameter values set by Perform method 226. In this example, when a task's methods finish running, their local parameter values are not saved.
- next task has access to plan parameters, as well as to any values exported to the execution environment.
- a task also leaves behind the altered values of any parameters that it declared to be dynamic. These can be seen by successor tasks.
- the system can be configured to set breakpoints, relative to where parameters get resolved, as described in FIGS. 11 and 12 .
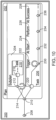
- diagram 300 illustrates that breakpoints for plan 308 or subplan 310 can be set (e.g., recorded by the system, as described above) at various positions, with each position providing for the ability to monitor or edit various types of parameter values, including those described above.
- execution environment parameters 302 are set before plan 308 is run.
- Plan 308 includes or accesses plan-level parameters 304.
- Subplan 310 includes or accesses subplan-level parameters 306.
- the system can set a breakpoint at position 312 to stop execution of plan 308 before it starts. The setting of the breakpoint at position 312 provides for modification of plan-level parameters 304.
- the system can set a breakpoint at position 314 (within plan 308) to stop execution of plan 308 just before it starts its contents.
- the system can also set a breakpoint at position 316 to stop the execution of plan 308 after it finishes and before it exits.
- the system can set a breakpoint at position 318 to stop execution of subplan 310 before it starts.
- the setting of the breakpoint at position 318 provides for modification of subplan-level parameters 306.
- the system can set a breakpoint at position 320 (within subplan 310) to stop execution of subplan 310 just before it starts its contents.
- the system (and/or a user) can also set a breakpoint at position 322 to stop the execution of subplan 310 after it finishes and before it exits.
- diagram 340 illustrates that breakpoints for task 342 can be set at five distinct positions 344, 345, 346, 348, 350.
- task 342 includes methods 349 (e.g., Trigger and At Start methods, each of which may be optional and are framework methods), Perform method 356 and methods 352 (e.g., an At Success method, an At Failure method and/or an At Rollback method, each of which may be optional and are also framework methods).
- methods 349 e.g., Trigger and At Start methods, each of which may be optional and are framework methods
- Perform method 356 e.g., an At Success method, an At Failure method and/or an At Rollback method, each of which may be optional and are also framework methods.
- Task 342 also includes task-level resources 358 and method level parameters 360.
- a breakpoint at position 344 stops the execution of task 342 before it starts.
- task 342 is a program, plan or graph task, this is before task-level resources 358 are acquired.
- For a graph task this is also before the graph is compiled.
- the setting of a breakpoint at position 344 enables modification of method parameters 360.
- position 345 is the "in" breakpoint position on task 342 (e.g., which is the same as "before" position 52a ( FIG. 3 ) on Perform method 52 ( FIG. 3 )). That is, the setting of a breakpoint at position 345 stops the execution of the Perform method (of task 342) before that Perform method starts (not right before the Perform method runs its script or executable).
- this breakpoint positon 345 causes a launching of a breakpoint inspector through which input expressions (used or executed by the graph and plan tasks) are editable. As such, these new expressions will be evaluated and sent to the launched graph or plan.
- the system may also set a breakpoint at position 346, in Perform method 356. That is, position 346 is the "in" position for Perform method 356 (e.g., the same as position 52b in FIG. 3 ).
- position 346 is the "in" position for Perform method 356 (e.g., the same as position 52b in FIG. 3 ).
- the breakpoint is set at position 346, the system stops the execution of a program task just before its Perform method runs its script or executable, stops the execution of a plan task just before its Perform method runs its child plan or stops the execution of a graph task just before its Perform method runs its graph.
- a breakpoint at position 346 enables modification of environment variables (e.g., the changing of environment variables for those processes that will be spawned for plan, graph and program tasks).
- a breakpoint at position 346 also enables viewing of the input values to be used for graph 354.
- Perform method 356 is configured to initiate or spawn graph 354. (In a variation, Perform method 356 may be configured to initiate a child plan, rather than a graph 354).
- a breakpoint can be set at position 348 to stop execution at the start of graph 354, and open that graph 354 in a new tab (e.g., window 370 that shows contents of graph 354).
- Window 370 displays contents of graph 354 (which in this example is graph 374) and shows that execution is paused, e.g., through visualization 372. From the opened graph or child plan, a user can inspect the current state, set additional breakpoints, or use a "continue control" to resume execution of the graph or child plan.
- breakpoint is referred to as "break within graph/child plan” or as a “within breakpoint.”
- this capability is useful when the graph or child plan to execute is determined dynamically as the plan runs - that is, when which graph or child plan to execute is not predetermined at edit time prior to the running of the plan, so no breakpoint can be set explicitly for it.
- the within breakpoint will result in stopping the execution of the graph or child plan that is actually run.
- a debugger for the launched process is automatically started, and the GDE essentially represents a relationship between what are two separate, individual processes. This is because one machine has the process of the parent plan and the process of the debugger for the parent plan. A second machine has the process of the launched graph or child plan. This second machine also has the process of the debugger for the launched graph or child plan. As such, one graph in a plan could be running on the system described herein and another graph could be running on another machine, and the user could use the graph debugger to investigate the local environment on that machine.
- the break within graph causes the GDE to switch over (the debugger) to view aspects and attributes of the graph (e.g., graph 374), rather than viewing aspects of the parent task (e.g., task 342).
- the graph or child plan (even though it is being executed as a distinct process from task 342) can be debugged in the same user interface and in the same graphical development environment (GDE) as task 342.
- the system can set a breakpoint at position 350 to stop execution of task 342 after it finishes.
- task 342 once task 342 is stopped, the user can specify whether task 342 should continue as though it has succeeded or as though it has failed.
- the system records these user changes and specifications and acts on them, e.g., by modifying the state of a task (or method) in accordance with the user changes, and by doing so, controlling which tasks or methods are executed next.
- the system implements control flow by changing the state of the method from success to failure and vice versa.
- a graphical user interface is presented (at an "after" breakpoint, e.g., breakpoint at position 350 on task 342) that enables modification of a record of whether the task succeeded or failed (which then affects where the control goes next).
- the user interface enables modification of records after execution of particular types of tasks or methods, e.g., a conditional task and after the Perform method of a graph task or a plan task.
- a plan or subplan may be a looping plan or a looping subplan (e.g., that is configured for serial loops or concurrent loops).
- a looping plan includes a plan that is configured to loop a specified number of times or until a condition is satisfied.
- a breakpoint can be set to pause on each iteration of the loop or an iteration-specific breakpoint ("iteration breakpoint") can be set that will pause only on a specified iteration.
- the system can specify that the pause in execution only happens for an instance of the plan/subplan/task/method that corresponds to a particular iteration of that loop (e.g., thereby specifying which instance of the plan/subplan/task/method the breakpoint applies to, given that the plan/subplan/task/method is within a loop and because of that there will be many separate instances of it that are executed).
- the system can be configured to set a conditional breakpoint, including, e.g., a breakpoint that is configured to interrupt execution of the plan, subplan or task only when a particular condition is satisfied.
- the breakpoint includes or is associated with an expression and the system is configured to execute the breakpoint only when the expression satisfies a specified value, such as "1" or "0."
- the system can set or otherwise specify a condition for any of the various types of breakpoints described herein to make a breakpoint stop only if a specified condition is true - thus making each of the various type of breakpoints a conditional breakpoint.
- an iteration breakpoint can have a condition specified for it. That is, a breakpoint set on the instance of a task that is part of a second loop execution, for example, can also specify that execution should only pause when a condition (that is independent of the looping) is satisfied.
- the system provides a command line version.
- the system can connect the command line debugger to a running plan and provide the various types of debugging that could be performed graphically.
- process 400 is implemented by the system in debugging a graphical control flow application that specifies control flow among a plurality of functional modules, with the control flow being represented as transitions among the plurality of functional modules and with each functional module being configured to execute one or more actions.
- the system specifyies (402) a position in the executable control flow graph at which execution of the executable control flow graph is to be interrupted.
- the specified position represents a transition to a given functional module, a transition to a state in which contents of the given functional module are executed or a transition from the given functional module.
- the system also starts (404) execution of the executable control flow graph in an execution environment.
- an execution environment is the environment provided to a plan or software by an operating system, e.g., at runtime.
- the system interrupts (406) execution of the executable control flow graph and provides (408) data representing one or more attributes of the execution or runtime environment in which the given functional module is executing, e.g., internal attributes of the execution or runtime environment running the plan (e.g., such as parameters and associated values, dynamic parameters that the plan is using and associated values and so forth) and external attributes of the execution or runtime environment running the plan (such as a local environment or system that is executing the plan and external states and resources (e.g., databases and repositories)).
- internal attributes of the execution or runtime environment running the plan e.g., such as parameters and associated values, dynamic parameters that the plan is using and associated values and so forth
- external attributes of the execution or runtime environment running the plan such as a local environment or system that is executing the plan and external states and resources (e.g., databases and repositories)).
- the executable control flow graph includes a graphical layer and a control processing layer, wherein the graphical layer includes visuals for a graphical user interface and a visual program in a visual programming language that is programmed with the visuals, with the visual programming language being for specifying the control flow, wherein the control processing layer includes functional modules, methods, underlying data structures used in executing the methods, and code that executes the methods using the underlying data structures to effect the control flow specified by the visual programming language.
- the method also includes executing the graphical layer by rendering the graphical user interface with the visuals; receiving, through the graphical user interface, data representing user manipulation of one or more of the visuals displayed in the graphical user interface, with the received data representing the visual program in the visual programming language; and executing the control processing layer in accordance with the visual program created in the graphical layer, with execution of the control processing layer including executing one or more functional modules specified by the visual program, with execution of a functional module causing execution of a method of that functional module by executing code using one or more data structures of the method to effect the control flow specified by the visual programming language.
- a particular functional module represents a controlled application included in a data processing layer, wherein the method further includes: executing a particular method of the particular functional module; and responsive to executing the particular method, launching the controlled application.
- the configuring (e.g., setting) of breakpoints can occur while the graphical control flow application is executing, in addition to or rather than configuring breakpoints prior to executing the graphical control flow application.
- the system described herein can be configured to single-step through breakpoints.
- a single-step is a control or other command that, when a breakpoint is hit, instructs the system to go to the next place where the plan execution can be interrupted, without having to explicitly set a breakpoint there.
- a user instructs the system to single-step through a plan.
- the system (or a user) would specify a given level (e.g., a task level or a method level) through which to single-step.
- a plan can have multiple paths of control flow, resulting in more than one "next" place. As such, the system would stop execution at all of those places.
- diagram 450 shows plan 452 - both being defined in portion 461a and being executed in portion 461b.
- plan 452 includes graphical program elements 454a ... 454n that are representing respective tasks.
- graphical program elements 454a ... 454n are hereinafter referred to as tasks 454a ... 454n.
- Each of tasks 454a ... 454n includes one or more methods, each method including one or more actions to be executed on a computer system.
- task 454a includes method 456 and task 454n includes method 458.
- Method 456 may be a same method or a different method from method 458.
- each of tasks 454a ... 454n inherit inherited method 460 from plan 452.
- an inherited method includes a method that is defined once at the plan level, and that applies to (is inherited by) the tasks within the plan. That is, inherited methods are actions defined at the plan (or subplan) level that apply to the tasks below that level. Through use of an inherited method, the system can apply the same method to the tasks in a plan.
- the inherited method is defined once for the whole plan rather than separately for every task, enabling assignment of the same action to many tasks at once.
- inherited method 460 executes in every task inside plan 452, namely, in each of tasks 454a ... 454n in plan 452.
- the system executes the methods in a different order depending on whether the methods occur before or after the task's Perform method.
- the system executes the inherited method first, followed by the analogous non-inherited method for that particular task.
- the system executes the non-inherited method first, followed by the analogous inherited method.
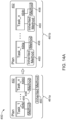
- diagram 470 illustrates that the plan debugger enables the setting of breakpoints on inherited methods.
- diagram 470 illustrates plan 452 - both being defined in portion 471a and being executed in portion 471b.
- Inherited method 460 is defined once on the plan level (shown in portion 471a).
- each element i.e., each of tasks 454a ... 454n
- plan 452 will inherit that method definition by creating a specific instance (i.e., instances 460a ... 460n) of the inherited method 460 for that particular element.
- a breakpoint - for an instance of inherited method 460 - is set or recorded per task, e.g., one or more of tasks 454a ... 454n. That is, a breakpoint can only be set on a specific instance of an inherited method.
- the system records a breakpoint before, in or after instance 460a of inherited method 460 of task 454a, by recording a breakpoint at one of positions 461a, 461b, 461c, respectively.
- the system may record a breakpoint at one or more of positions 461a, 461b, 461c (even though all of positions 461a, 461b, 461c are shown in FIG. 14B for purposes of completeness).
- the debugging techniques described herein may be implemented within system 500.
- the system 500 includes two graphical development environments, a GDE 512 used for dataflow graph development and a GDE 514 used for control flow diagram development.
- a GDE 512 used for dataflow graph development
- a GDE 514 used for control flow diagram development.
- one graphical development environment can be used for development of both dataflow graphs and control flow diagrams.
- a graphical development environment can be used for developing control flow diagrams and a command line user interface can be used for dataflow graphs, or vice versa.
- a data processing application 518 is built that includes a dataflow graph 580.
- a task managing application 516 is built that includes a control flow diagram 550.
- the system 500 also includes a database 520.
- the database 520 may be a scalable object-oriented database system that provides storage for various kinds of information (e.g., metadata) for the system 500.
- the database 520 may be, for example, an enterprise metadata database, which can support the development and execution of graph-based applications and the interchange of data between the graph-based applications and other systems, e.g., operating systems.
- the system 500 further includes an operating system 524.
- the operating system 524 may be, for example, a parallel operating environment.
- the operating system 524 provides support for running application development environments, such as GDE 512 and GDE 514, and provides for scalable parallel and distributed execution of the applications developed.
- a stream of input data 530 goes through the dataflow graph 580, as the data is being processed by the data processing application 518.
- the dataflow graph 580 includes a computation component, which is reformat component 584.
- the data flows from input dataset 582 to output dataset 586.
- the data flows out of the data processing application 518 and into the task managing application 516, and is used to drive the task managing application 516, which in turn drives the control flow diagram 550.
- the task scheduling application 516 will launch the control flow diagram 550.
- the control flow diagram 550 shows two tasks, task 552 and task 554, each of which may be programmed with breakpoints (before, in or after the task) as described herein.
- a task may be a computation performed, for example, by executing a dataflow graph or a script, such as a Perl script.
- a time sequence 556 shows the running sequence of the tasks specified in the control flow diagram 550. In this case, the task 552 is executed before the task 554.
- the task 552 in the control flow diagram 550 is a Perl script and the task 554 includes several methods that can be executed in an operating system 524 of the system described herein. These methods may be existing methods provided by the system described herein. The user can customize the behavior of these methods by specifying their own content for various parameters and scripts that makeup a method. Breakpoints may be inserted before, in or after each of these methods, as described herein. As shown in FIG. 15 as an example, the task 554 includes five methods: Trigger, At Start, Perform, At Failure, and At Success.
- the above five methods may be implemented as follows.
- Trigger method may be implemented to represent the starting point of the task 554. It may include various conditions for starting the execution, including, e.g., whether a specific file exists, whether a flag has been set to true, and so forth.
- Start method may be implemented as a method that prepares the system for the Perform method, such as setting environmental variables to desired values, or setting up log files to log runtime information.
- Perform method may be implemented to perform the main functionality of the task 554.
- Task 554 may also contain conditional logic to handle what happens after Perform method. If Perform method succeeds during its execution, At Success method is executed to exit task 554 with a return code of zero. If Perform method fails during its execution, At Failure method is executed to exit task 554 with a return code of non-zero.
- additional methods can be added for rollback, error handling, and recovery. For example, a method of rollback can be added to roll back what has been done in reverse execution order starting at the point of failure. Alternatively, a method of cleanup can be added to clean up the failed conditions, by resetting flags, registers, etc.
- a functional module encapsulates information for or representing a controlled application, wherein the controlled application is an instance of an executable computer program or an executable portion of the computer program, and wherein the functional module is configured to execute one or more actions on a computer system.
- the control flow is the order in which individual functional modules are executed or evaluated.
- a system and method debugs plans and subplans.
- a plan debugger is described herein to troubleshoot these plans - the debugger has both a command line and a graphical interface.
- the plan debugger enables execution of the plan to pause (or "break") at many key points within these plans.
- This plan operates in a distributed manner on heterogeneous machines and technologies.
- the debugger provides for debugging and debugger functionality, such as conditional breakpoints, or breaking on a particular iteration of a loop, or break-on-failure.
- the debugger enables breaking at different levels of the plan: plan, subplan, task or method.
- the break can be set (a) before, (b) after, or (c) in (in the case of tasks and methods) and within (in the case of controlled applications that are graphs and child plans) execution of any of the above - except as noted here.
- setting and running with breakpoints does not slow down the plan. Additionally, a plan does not need to be put into "debug mode" to use the debugger.
- a user can either set breakpoints before starting the plan or while the plan is running.
- the techniques described herein provide for numerous computation and resource allocation efficiencies. For example, by being able to set a breakpoint before, in and after a task and also before, in and after each of the methods of the task, the system is able to reduce a number of executions of a task required to debug a task and/or its methods. This is because rather than waiting for a task or plan to run to completion to identify failures, the techniques described herein provide for identification of a failure when it occurs and provide the ability to modify variable and/or parameter values that may be causing the failure. Once the values are modified, the plan or task can resume execution from the point at which is previously failed.
- the level of granularity provided by being able to set breakpoints before, in and after each of a task's methods provides for increased flexibility in the defining of the data structures that represent the task's methods, as well as increased flexibility in the investigation and control of execution behavior.
- the values of parameters and/or values for these data structures can be modified "on-the-fly" as a plan is being executed. These on the fly modifications provide for smaller memory requirements, as the plan does not need to be executed multiple times to assess the impact of these changes.
- the techniques described above can be implemented using software for execution on a computer.
- the software forms procedures in one or more computer programs that execute on one or more programmed or programmable computer systems (which can be of various architectures such as distributed, client/server, or grid) each including at least one processor, at least one data storage system (including volatile and non-volatile memory and/or storage elements), at least one input device or port, and at least one output device or port.
- the software can form one or more modules of a larger program, for example, that provides other services related to the design and configuration of charts and flowcharts.
- the nodes, links and elements of the chart can be implemented as data structures stored in a computer readable medium or other organized data conforming to a data model stored in a data repository.
- An apparatus can be implemented in a computer program product tangibly embodied or stored in a machine-readable storage device (e.g., a non-transitory machine-readable storage device, a machine-readable hardware storage device, and so forth) for execution by a programmable processor; and method actions can be performed by a programmable processor executing a program of instructions to perform functions by operating on input data and generating output.
- a machine-readable storage device e.g., a non-transitory machine-readable storage device, a machine-readable hardware storage device, and so forth
- inventions described herein, and other embodiments of the claims and the techniques described herein can be implemented advantageously in one or more computer programs that are executable on a programmable system including at least one programmable processor coupled to receive data and instructions from, and to transmit data and instructions to, a data storage system, at least one input device, and at least one output device.
- Each computer program can be implemented in a high-level procedural or object oriented programming language, or in assembly or machine language if desired; and in any case, the language can be a compiled or interpreted language.
- processors suitable for the execution of a computer program include, by way of example, both general and special purpose microprocessors, and any one or more processors of any kind of digital computer.
- a processor will receive instructions and data from a read-only memory or a random-access memory or both.
- the essential elements of a computer are a processor for executing instructions and one or more memory devices for storing instructions and data.
- a computer will also include, or be operatively coupled to receive data from or transfer data to, or both, one or more mass storage devices for storing data, e.g., magnetic, magneto optical disks, or optical disks.
- Computer readable media for embodying computer program instructions and data include all forms of non-volatile memory, including by way of example semiconductor memory devices, e.g., EPROM, EEPROM, and flash memory devices; magnetic disks, e.g., internal hard disks or removable disks; magneto optical disks; and CD ROM and DVD-ROM disks.
- semiconductor memory devices e.g., EPROM, EEPROM, and flash memory devices
- magnetic disks e.g., internal hard disks or removable disks
- magneto optical disks e.g., CD ROM and DVD-ROM disks.
- the processor and the memory can be supplemented by, or incorporated in special purpose logic circuitry. Any of the foregoing can be supplemented by, or incorporated in, ASICs (application-specific integrated circuits).
- ASICs application-specific integrated circuits
- embodiments can be implemented on a computer having a display device, e.g., a LCD (liquid crystal display) monitor, for displaying information to the user and a keyboard and a pointing device, e.g., a mouse or a trackball, by which the user can provide input to the computer.
- a display device e.g., a LCD (liquid crystal display) monitor
- a keyboard and a pointing device e.g., a mouse or a trackball
- Other kinds of devices can be used to provide for interaction with a user as well; for example, feedback provided to the user can be any form of sensory feedback, e.g., visual feedback, auditory feedback, or tactile feedback; and input from the user can be received in any form, including acoustic, speech, or tactile input.
- Embodiments can be implemented in a computing system that includes a back end component, e.g., as a data server, or that includes a middleware component, e.g., an application server, or that includes a front end component, e.g., a client computer having a graphical user interface or a Web browser through which a user can interact with an implementation of embodiments, or any combination of such back end, middleware, or front end components.
- the components of the system can be interconnected by any form or medium of digital data communication, e.g., a communication network. Examples of communication networks include a local area network (LAN) and a wide area network (WAN), e.g., the Internet.
- LAN local area network
- WAN wide area network
- the system and method or parts thereof may use the "World Wide Web” (Web or WWW), which is that collection of servers on the Internet that utilize the Hypertext Transfer Protocol (HTTP).
- HTTP is a known application protocol that provides users access to resources, which may be information in different formats such as text, graphics, images, sound, video, Hypertext Markup Language (HTML), as well as programs.
- the client computer Upon specification of a link by the user, the client computer makes a TCP/IP request to a Web server and receives information, which may be another Web page that is formatted according to HTML. Users can also access other pages on the same or other servers by following instructions on the screen, entering certain data, or clicking on selected icons.
- any type of selection device known to those skilled in the art such as check boxes, drop-down boxes, and the like, may be used for embodiments using web pages to allow a user to select options for a given component.
- Servers run on a variety of platforms, including UNIX machines, although other platforms, such as Windows 2000/2003, Windows NT, Sun, Linux, and Macintosh may also be used.
- Computer users can view information available on servers or networks on the Web through the use of browsing software, such as Firefox, Netscape Navigator, Microsoft Internet Explorer, or Mosaic browsers.
- the computing system can include clients and servers.
- a client and server are generally remote from each other and typically interact through a communication network. The relationship of client and server arises by virtue of computer programs running on the respective computers and having a client-server relationship to each other.
Landscapes
- Engineering & Computer Science (AREA)
- Theoretical Computer Science (AREA)
- Computer Hardware Design (AREA)
- Quality & Reliability (AREA)
- Physics & Mathematics (AREA)
- General Engineering & Computer Science (AREA)
- General Physics & Mathematics (AREA)
- Data Mining & Analysis (AREA)
- Stored Programmes (AREA)
- Debugging And Monitoring (AREA)
Applications Claiming Priority (2)
| Application Number | Priority Date | Filing Date | Title |
|---|---|---|---|
| US15/942,022 US10817406B2 (en) | 2018-03-30 | 2018-03-30 | Debugging an executable control flow graph that specifies control flow |
| PCT/US2019/022066 WO2019190750A1 (en) | 2018-03-30 | 2019-03-13 | Debugging an executable control flow graph that specifies control flow |
Publications (2)
| Publication Number | Publication Date |
|---|---|
| EP3776217A1 EP3776217A1 (en) | 2021-02-17 |
| EP3776217B1 true EP3776217B1 (en) | 2024-01-10 |
Family
ID=65952110
Family Applications (1)
| Application Number | Title | Priority Date | Filing Date |
|---|---|---|---|
| EP19713959.5A Active EP3776217B1 (en) | 2018-03-30 | 2019-03-13 | Debugging an executable control flow graph that specifies control flow |
Country Status (8)
| Country | Link |
|---|---|
| US (2) | US10817406B2 (https=) |
| EP (1) | EP3776217B1 (https=) |
| JP (2) | JP7385645B2 (https=) |
| CN (1) | CN112334883B (https=) |
| AU (1) | AU2019241905C1 (https=) |
| CA (1) | CA3095562A1 (https=) |
| SG (1) | SG11202009011UA (https=) |
| WO (1) | WO2019190750A1 (https=) |
Families Citing this family (12)
| Publication number | Priority date | Publication date | Assignee | Title |
|---|---|---|---|---|
| US10817406B2 (en) | 2018-03-30 | 2020-10-27 | Ab Initio Technology Llc | Debugging an executable control flow graph that specifies control flow |
| WO2020109269A1 (de) * | 2018-11-29 | 2020-06-04 | Merck Patent Gmbh | Elektronische vorrichtung |
| US12443449B2 (en) * | 2019-11-15 | 2025-10-14 | Nvidia Corporation | Techniques for modifying an executable graph to perform a workload associated with a new task graph |
| EP3855265B1 (en) * | 2020-01-21 | 2023-08-09 | Hexagon Technology Center GmbH | Ml for process monitoring |
| CN111506508A (zh) * | 2020-04-17 | 2020-08-07 | 北京百度网讯科技有限公司 | 边缘计算测试方法、装置、设备和可读存储介质 |
| CN113626332B (zh) * | 2021-08-13 | 2023-03-10 | 北京百度网讯科技有限公司 | 调试方法、装置、设备、存储介质以及计算机程序产品 |
| EP4394608A4 (en) * | 2021-09-26 | 2025-02-19 | Siemens Ltd. China | Application program monitoring method and apparatus, and readable storage medium |
| CN113935487B (zh) * | 2021-12-21 | 2022-03-22 | 广东粤港澳大湾区硬科技创新研究院 | 可视化卫星故障诊断知识的生成方法、装置及系统 |
| US12578931B2 (en) * | 2022-01-18 | 2026-03-17 | Harness Inc | Intelligent and efficient pipeline management |
| CN115543858A (zh) * | 2022-12-02 | 2022-12-30 | 北京大学 | 调试代码文件的方法及装置、非易失性存储介质 |
| KR20240099091A (ko) * | 2022-12-21 | 2024-06-28 | 가레나 온라인 프라이빗 리미티드 | 비디오 게임을 디버깅하기 위한 장치 및 방법 |
| US12131168B1 (en) * | 2023-04-18 | 2024-10-29 | Servicenow, Inc. | Outcome-oriented automation platform |
Family Cites Families (36)
| Publication number | Priority date | Publication date | Assignee | Title |
|---|---|---|---|---|
| US5038348A (en) | 1988-07-01 | 1991-08-06 | Sharp Kabushiki Kaisha | Apparatus for debugging a data flow program |
| JP3618419B2 (ja) | 1995-09-20 | 2005-02-09 | シャープ株式会社 | データ駆動型情報処理装置 |
| US5966072A (en) * | 1996-07-02 | 1999-10-12 | Ab Initio Software Corporation | Executing computations expressed as graphs |
| US5893105A (en) | 1996-11-12 | 1999-04-06 | Micrografx, Inc. | Executable flowchart |
| CA2205096C (en) * | 1997-05-09 | 2001-10-09 | Ibm Canada Limited-Ibm Canada Limitee | A system for remote debugging of client/server applications |
| US6016555A (en) | 1997-11-19 | 2000-01-18 | Texas Instruments Incorporated | Non-intrusive software breakpoints in a processor instruction execution pipeline |
| US6412106B1 (en) * | 1999-06-16 | 2002-06-25 | Intervoice Limited Partnership | Graphical system and method for debugging computer programs |
| JP2002288001A (ja) * | 2001-03-23 | 2002-10-04 | Ricoh Co Ltd | 汎用検査システムとプログラムおよびその検査方法 |
| US6748583B2 (en) * | 2000-12-27 | 2004-06-08 | International Business Machines Corporation | Monitoring execution of an hierarchical visual program such as for debugging a message flow |
| US7577942B2 (en) * | 2001-07-26 | 2009-08-18 | International Business Machines Corporation | Efficient monitoring of program variables under debug |
| US20030041315A1 (en) | 2001-08-21 | 2003-02-27 | International Business Machines Corporation | Debugger with automatic detection of control points influencing program behavior |
| JP2003076545A (ja) | 2001-08-31 | 2003-03-14 | Mitsubishi Electric Corp | プログラム開発支援装置 |
| US6996806B2 (en) * | 2001-09-21 | 2006-02-07 | International Business Machines Corporation | Graphical view of program structure during debugging session |
| US20040031019A1 (en) * | 2002-05-20 | 2004-02-12 | Richard Lamanna | Debugger for a graphical programming environment |
| US7155708B2 (en) | 2002-10-31 | 2006-12-26 | Src Computers, Inc. | Debugging and performance profiling using control-dataflow graph representations with reconfigurable hardware emulation |
| CA2420479A1 (en) | 2003-02-13 | 2004-08-13 | Ibm Canada Limited - Ibm Canada Limitee | Flow debugging software and method |
| CA2528996C (en) * | 2003-06-12 | 2016-10-11 | Reuters America Inc. | Business process automation |
| US7519960B2 (en) * | 2003-12-19 | 2009-04-14 | International Business Machines Corporation | Method and system for debugging business process flow |
| US7512934B2 (en) * | 2004-08-25 | 2009-03-31 | Microsoft Corporation | Parallel debugger |
| US9146832B2 (en) * | 2005-10-14 | 2015-09-29 | Oracle International Corporation | Debugging functionality embedded in an application |
| US20080209405A1 (en) * | 2007-02-28 | 2008-08-28 | Microsoft Corporation | Distributed debugging for a visual programming language |
| CN101295279B (zh) * | 2007-04-29 | 2012-05-09 | 国际商业机器公司 | 多线程环境下的调试程序的方法和系统 |
| US9823903B2 (en) * | 2008-07-18 | 2017-11-21 | Oracle International Corporation | Debugging software through visual representations mapped to computer code |
| US8479051B2 (en) * | 2009-01-23 | 2013-07-02 | Microsoft Corporation | System and method for customized error reporting |
| US8122292B2 (en) * | 2009-08-19 | 2012-02-21 | Oracle International Corporation | Debugging of business flows deployed in production servers |
| JP2011193118A (ja) * | 2010-03-12 | 2011-09-29 | Fuji Xerox Co Ltd | 画像形成装置及びその制御プログラム |
| US8745591B2 (en) | 2011-10-19 | 2014-06-03 | Microsoft Corporation | Data flow visualization and debugging |
| US9208058B2 (en) | 2013-01-31 | 2015-12-08 | Oracle International Corporation | Providing directional debugging breakpoints |
| US9164871B2 (en) * | 2013-05-17 | 2015-10-20 | International Business Machines Corporation | Evaluation of statement-level breakpoints |
| US9544399B2 (en) * | 2013-07-26 | 2017-01-10 | International Business Machines Corporation | Visually depicting cloud resource utilization during execution of an application |
| US9703681B2 (en) * | 2014-05-29 | 2017-07-11 | Microsoft Technology Licensing, Llc | Performance optimization tip presentation during debugging |
| US9612939B2 (en) * | 2014-10-29 | 2017-04-04 | Microsoft Technology Licensing, Llc. | Diagnostic workflow for production debugging |
| US9632915B2 (en) * | 2014-10-29 | 2017-04-25 | Microsoft Technology Licensing, Llc. | Historical control flow visualization in production diagnostics |
| US10521329B2 (en) * | 2015-05-08 | 2019-12-31 | Intergral GmbH | Debugging system |
| JP2017138901A (ja) | 2016-02-05 | 2017-08-10 | パナソニック デバイスSunx株式会社 | 検査支援装置、検査支援方法及び検査支援プログラム |
| US10817406B2 (en) | 2018-03-30 | 2020-10-27 | Ab Initio Technology Llc | Debugging an executable control flow graph that specifies control flow |
-
2018
- 2018-03-30 US US15/942,022 patent/US10817406B2/en active Active
-
2019
- 2019-03-13 CA CA3095562A patent/CA3095562A1/en active Pending
- 2019-03-13 AU AU2019241905A patent/AU2019241905C1/en active Active
- 2019-03-13 EP EP19713959.5A patent/EP3776217B1/en active Active
- 2019-03-13 JP JP2021502700A patent/JP7385645B2/ja active Active
- 2019-03-13 CN CN201980034483.8A patent/CN112334883B/zh active Active
- 2019-03-13 WO PCT/US2019/022066 patent/WO2019190750A1/en not_active Ceased
- 2019-03-13 SG SG11202009011UA patent/SG11202009011UA/en unknown
-
2020
- 2020-09-23 US US17/029,828 patent/US11782820B2/en active Active
-
2023
- 2023-11-10 JP JP2023192289A patent/JP7685578B2/ja active Active
Non-Patent Citations (1)
| Title |
|---|
| ANONYMOUS: "TIBCO ActiveMatrix BPM Tutorials Two-Second Advantage", 1 November 2015 (2015-11-01), XP055982779, Retrieved from the Internet <URL:https://docs.tibco.com/pub/amx-bpm/4.0.0/doc/pdf/TIB_amx-bpm_4.0_tutorials.pdf> [retrieved on 20221117] * |
Also Published As
| Publication number | Publication date |
|---|---|
| CN112334883A (zh) | 2021-02-05 |
| JP2021520587A (ja) | 2021-08-19 |
| US20210004319A1 (en) | 2021-01-07 |
| JP7385645B2 (ja) | 2023-11-22 |
| EP3776217A1 (en) | 2021-02-17 |
| US11782820B2 (en) | 2023-10-10 |
| JP7685578B2 (ja) | 2025-05-29 |
| AU2019241905A1 (en) | 2020-10-08 |
| US20190303271A1 (en) | 2019-10-03 |
| WO2019190750A1 (en) | 2019-10-03 |
| US10817406B2 (en) | 2020-10-27 |
| CA3095562A1 (en) | 2019-10-03 |
| SG11202009011UA (en) | 2020-10-29 |
| AU2019241905B2 (en) | 2024-03-14 |
| JP2024014931A (ja) | 2024-02-01 |
| CN112334883B (zh) | 2024-07-02 |
| AU2019241905C1 (en) | 2024-10-03 |
Similar Documents
| Publication | Publication Date | Title |
|---|---|---|
| EP3776217B1 (en) | Debugging an executable control flow graph that specifies control flow | |
| US20220138854A1 (en) | Virtualizing for User-Defined Algorithm Electronic Trading | |
| US9459846B2 (en) | User interface style guide compliance | |
| US5754760A (en) | Automatic software testing tool | |
| US8429622B2 (en) | Business process debugger with parallel-step debug operation | |
| US9841956B2 (en) | User interface style guide compliance reporting | |
| US9454351B2 (en) | Continuous deployment system for software development | |
| US20140282434A1 (en) | Testing functional correctness and idempotence of software automation scripts | |
| US20040168155A1 (en) | Flow debugging software and method | |
| EP2431869A1 (en) | Dry-run design time environment | |
| US20120198365A1 (en) | User interface style guide compliance | |
| US20120198367A1 (en) | User interface style guide compliance forecasting | |
| US11474931B2 (en) | Debugging a cross-technology and cross-environment execution | |
| HK40040320A (en) | Debugging an executable control flow graph that specifies control flow | |
| HK40040320B (en) | Debugging an executable control flow graph that specifies control flow | |
| Kent | Test automation: From record/playback to frameworks | |
| Sambe et al. | A Methodology for Enterprise Resource Planning Automation Testing Application to the Open Source ERP-ODOO. | |
| AU2019213331B2 (en) | User-defined algorithm electronic trading | |
| Molnár et al. | Amnis-Design and Implementation of an Adaptive Workflow Management System | |
| Chakravarthi et al. | Aimhelp: generating help for gui applications automatically | |
| Chen et al. | OS-MAP: How Far Can Computer Use Agents Go in Breadth and Depth? |
Legal Events
| Date | Code | Title | Description |
|---|---|---|---|
| STAA | Information on the status of an ep patent application or granted ep patent |
Free format text: STATUS: UNKNOWN |
|
| STAA | Information on the status of an ep patent application or granted ep patent |
Free format text: STATUS: THE INTERNATIONAL PUBLICATION HAS BEEN MADE |
|
| PUAI | Public reference made under article 153(3) epc to a published international application that has entered the european phase |
Free format text: ORIGINAL CODE: 0009012 |
|
| STAA | Information on the status of an ep patent application or granted ep patent |
Free format text: STATUS: REQUEST FOR EXAMINATION WAS MADE |
|
| 17P | Request for examination filed |
Effective date: 20200917 |
|
| AK | Designated contracting states |
Kind code of ref document: A1 Designated state(s): AL AT BE BG CH CY CZ DE DK EE ES FI FR GB GR HR HU IE IS IT LI LT LU LV MC MK MT NL NO PL PT RO RS SE SI SK SM TR |
|
| AX | Request for extension of the european patent |
Extension state: BA ME |
|
| DAV | Request for validation of the european patent (deleted) | ||
| DAX | Request for extension of the european patent (deleted) | ||
| REG | Reference to a national code |
Ref country code: HK Ref legal event code: DE Ref document number: 40040320 Country of ref document: HK |
|
| STAA | Information on the status of an ep patent application or granted ep patent |
Free format text: STATUS: EXAMINATION IS IN PROGRESS |
|
| 17Q | First examination report despatched |
Effective date: 20211029 |
|
| P01 | Opt-out of the competence of the unified patent court (upc) registered |
Effective date: 20230512 |
|
| GRAP | Despatch of communication of intention to grant a patent |
Free format text: ORIGINAL CODE: EPIDOSNIGR1 |
|
| STAA | Information on the status of an ep patent application or granted ep patent |
Free format text: STATUS: GRANT OF PATENT IS INTENDED |
|
| INTG | Intention to grant announced |
Effective date: 20230803 |
|
| GRAS | Grant fee paid |
Free format text: ORIGINAL CODE: EPIDOSNIGR3 |
|
| GRAA | (expected) grant |
Free format text: ORIGINAL CODE: 0009210 |
|
| STAA | Information on the status of an ep patent application or granted ep patent |
Free format text: STATUS: THE PATENT HAS BEEN GRANTED |
|
| AK | Designated contracting states |
Kind code of ref document: B1 Designated state(s): AL AT BE BG CH CY CZ DE DK EE ES FI FR GB GR HR HU IE IS IT LI LT LU LV MC MK MT NL NO PL PT RO RS SE SI SK SM TR |
|
| REG | Reference to a national code |
Ref country code: GB Ref legal event code: FG4D |
|
| REG | Reference to a national code |
Ref country code: CH Ref legal event code: EP |
|
| REG | Reference to a national code |
Ref country code: DE Ref legal event code: R096 Ref document number: 602019044836 Country of ref document: DE |
|
| REG | Reference to a national code |
Ref country code: IE Ref legal event code: FG4D |
|
| REG | Reference to a national code |
Ref country code: LT Ref legal event code: MG9D |
|
| REG | Reference to a national code |
Ref country code: NL Ref legal event code: MP Effective date: 20240110 |
|
| REG | Reference to a national code |
Ref country code: AT Ref legal event code: MK05 Ref document number: 1649440 Country of ref document: AT Kind code of ref document: T Effective date: 20240110 |
|
| PG25 | Lapsed in a contracting state [announced via postgrant information from national office to epo] |
Ref country code: NL Free format text: LAPSE BECAUSE OF FAILURE TO SUBMIT A TRANSLATION OF THE DESCRIPTION OR TO PAY THE FEE WITHIN THE PRESCRIBED TIME-LIMIT Effective date: 20240110 |
|
| PG25 | Lapsed in a contracting state [announced via postgrant information from national office to epo] |
Ref country code: NL Free format text: LAPSE BECAUSE OF FAILURE TO SUBMIT A TRANSLATION OF THE DESCRIPTION OR TO PAY THE FEE WITHIN THE PRESCRIBED TIME-LIMIT Effective date: 20240110 |
|
| PG25 | Lapsed in a contracting state [announced via postgrant information from national office to epo] |
Ref country code: IS Free format text: LAPSE BECAUSE OF FAILURE TO SUBMIT A TRANSLATION OF THE DESCRIPTION OR TO PAY THE FEE WITHIN THE PRESCRIBED TIME-LIMIT Effective date: 20240510 |
|
| PG25 | Lapsed in a contracting state [announced via postgrant information from national office to epo] |
Ref country code: LT Free format text: LAPSE BECAUSE OF FAILURE TO SUBMIT A TRANSLATION OF THE DESCRIPTION OR TO PAY THE FEE WITHIN THE PRESCRIBED TIME-LIMIT Effective date: 20240110 |
|
| PG25 | Lapsed in a contracting state [announced via postgrant information from national office to epo] |
Ref country code: GR Free format text: LAPSE BECAUSE OF FAILURE TO SUBMIT A TRANSLATION OF THE DESCRIPTION OR TO PAY THE FEE WITHIN THE PRESCRIBED TIME-LIMIT Effective date: 20240411 |
|
| PG25 | Lapsed in a contracting state [announced via postgrant information from national office to epo] |
Ref country code: HR Free format text: LAPSE BECAUSE OF FAILURE TO SUBMIT A TRANSLATION OF THE DESCRIPTION OR TO PAY THE FEE WITHIN THE PRESCRIBED TIME-LIMIT Effective date: 20240110 Ref country code: RS Free format text: LAPSE BECAUSE OF FAILURE TO SUBMIT A TRANSLATION OF THE DESCRIPTION OR TO PAY THE FEE WITHIN THE PRESCRIBED TIME-LIMIT Effective date: 20240410 |
|
| PG25 | Lapsed in a contracting state [announced via postgrant information from national office to epo] |
Ref country code: ES Free format text: LAPSE BECAUSE OF FAILURE TO SUBMIT A TRANSLATION OF THE DESCRIPTION OR TO PAY THE FEE WITHIN THE PRESCRIBED TIME-LIMIT Effective date: 20240110 |
|
| PG25 | Lapsed in a contracting state [announced via postgrant information from national office to epo] |
Ref country code: AT Free format text: LAPSE BECAUSE OF FAILURE TO SUBMIT A TRANSLATION OF THE DESCRIPTION OR TO PAY THE FEE WITHIN THE PRESCRIBED TIME-LIMIT Effective date: 20240110 |
|
| PG25 | Lapsed in a contracting state [announced via postgrant information from national office to epo] |
Ref country code: RS Free format text: LAPSE BECAUSE OF FAILURE TO SUBMIT A TRANSLATION OF THE DESCRIPTION OR TO PAY THE FEE WITHIN THE PRESCRIBED TIME-LIMIT Effective date: 20240410 Ref country code: NO Free format text: LAPSE BECAUSE OF FAILURE TO SUBMIT A TRANSLATION OF THE DESCRIPTION OR TO PAY THE FEE WITHIN THE PRESCRIBED TIME-LIMIT Effective date: 20240410 Ref country code: LT Free format text: LAPSE BECAUSE OF FAILURE TO SUBMIT A TRANSLATION OF THE DESCRIPTION OR TO PAY THE FEE WITHIN THE PRESCRIBED TIME-LIMIT Effective date: 20240110 Ref country code: IS Free format text: LAPSE BECAUSE OF FAILURE TO SUBMIT A TRANSLATION OF THE DESCRIPTION OR TO PAY THE FEE WITHIN THE PRESCRIBED TIME-LIMIT Effective date: 20240510 Ref country code: HR Free format text: LAPSE BECAUSE OF FAILURE TO SUBMIT A TRANSLATION OF THE DESCRIPTION OR TO PAY THE FEE WITHIN THE PRESCRIBED TIME-LIMIT Effective date: 20240110 Ref country code: GR Free format text: LAPSE BECAUSE OF FAILURE TO SUBMIT A TRANSLATION OF THE DESCRIPTION OR TO PAY THE FEE WITHIN THE PRESCRIBED TIME-LIMIT Effective date: 20240411 Ref country code: ES Free format text: LAPSE BECAUSE OF FAILURE TO SUBMIT A TRANSLATION OF THE DESCRIPTION OR TO PAY THE FEE WITHIN THE PRESCRIBED TIME-LIMIT Effective date: 20240110 Ref country code: BG Free format text: LAPSE BECAUSE OF FAILURE TO SUBMIT A TRANSLATION OF THE DESCRIPTION OR TO PAY THE FEE WITHIN THE PRESCRIBED TIME-LIMIT Effective date: 20240110 Ref country code: AT Free format text: LAPSE BECAUSE OF FAILURE TO SUBMIT A TRANSLATION OF THE DESCRIPTION OR TO PAY THE FEE WITHIN THE PRESCRIBED TIME-LIMIT Effective date: 20240110 |
|
| PG25 | Lapsed in a contracting state [announced via postgrant information from national office to epo] |
Ref country code: PL Free format text: LAPSE BECAUSE OF FAILURE TO SUBMIT A TRANSLATION OF THE DESCRIPTION OR TO PAY THE FEE WITHIN THE PRESCRIBED TIME-LIMIT Effective date: 20240110 Ref country code: PT Free format text: LAPSE BECAUSE OF FAILURE TO SUBMIT A TRANSLATION OF THE DESCRIPTION OR TO PAY THE FEE WITHIN THE PRESCRIBED TIME-LIMIT Effective date: 20240510 |
|
| PG25 | Lapsed in a contracting state [announced via postgrant information from national office to epo] |
Ref country code: SE Free format text: LAPSE BECAUSE OF FAILURE TO SUBMIT A TRANSLATION OF THE DESCRIPTION OR TO PAY THE FEE WITHIN THE PRESCRIBED TIME-LIMIT Effective date: 20240110 Ref country code: PT Free format text: LAPSE BECAUSE OF FAILURE TO SUBMIT A TRANSLATION OF THE DESCRIPTION OR TO PAY THE FEE WITHIN THE PRESCRIBED TIME-LIMIT Effective date: 20240510 Ref country code: PL Free format text: LAPSE BECAUSE OF FAILURE TO SUBMIT A TRANSLATION OF THE DESCRIPTION OR TO PAY THE FEE WITHIN THE PRESCRIBED TIME-LIMIT Effective date: 20240110 Ref country code: LV Free format text: LAPSE BECAUSE OF FAILURE TO SUBMIT A TRANSLATION OF THE DESCRIPTION OR TO PAY THE FEE WITHIN THE PRESCRIBED TIME-LIMIT Effective date: 20240110 |
|
| PG25 | Lapsed in a contracting state [announced via postgrant information from national office to epo] |
Ref country code: DK Free format text: LAPSE BECAUSE OF FAILURE TO SUBMIT A TRANSLATION OF THE DESCRIPTION OR TO PAY THE FEE WITHIN THE PRESCRIBED TIME-LIMIT Effective date: 20240110 |
|
| REG | Reference to a national code |
Ref country code: DE Ref legal event code: R097 Ref document number: 602019044836 Country of ref document: DE |
|
| PG25 | Lapsed in a contracting state [announced via postgrant information from national office to epo] |
Ref country code: SM Free format text: LAPSE BECAUSE OF FAILURE TO SUBMIT A TRANSLATION OF THE DESCRIPTION OR TO PAY THE FEE WITHIN THE PRESCRIBED TIME-LIMIT Effective date: 20240110 |
|
| PG25 | Lapsed in a contracting state [announced via postgrant information from national office to epo] |
Ref country code: CZ Free format text: LAPSE BECAUSE OF FAILURE TO SUBMIT A TRANSLATION OF THE DESCRIPTION OR TO PAY THE FEE WITHIN THE PRESCRIBED TIME-LIMIT Effective date: 20240110 Ref country code: EE Free format text: LAPSE BECAUSE OF FAILURE TO SUBMIT A TRANSLATION OF THE DESCRIPTION OR TO PAY THE FEE WITHIN THE PRESCRIBED TIME-LIMIT Effective date: 20240110 |
|
| PG25 | Lapsed in a contracting state [announced via postgrant information from national office to epo] |
Ref country code: SK Free format text: LAPSE BECAUSE OF FAILURE TO SUBMIT A TRANSLATION OF THE DESCRIPTION OR TO PAY THE FEE WITHIN THE PRESCRIBED TIME-LIMIT Effective date: 20240110 |
|
| PG25 | Lapsed in a contracting state [announced via postgrant information from national office to epo] |
Ref country code: SM Free format text: LAPSE BECAUSE OF FAILURE TO SUBMIT A TRANSLATION OF THE DESCRIPTION OR TO PAY THE FEE WITHIN THE PRESCRIBED TIME-LIMIT Effective date: 20240110 Ref country code: SK Free format text: LAPSE BECAUSE OF FAILURE TO SUBMIT A TRANSLATION OF THE DESCRIPTION OR TO PAY THE FEE WITHIN THE PRESCRIBED TIME-LIMIT Effective date: 20240110 Ref country code: RO Free format text: LAPSE BECAUSE OF FAILURE TO SUBMIT A TRANSLATION OF THE DESCRIPTION OR TO PAY THE FEE WITHIN THE PRESCRIBED TIME-LIMIT Effective date: 20240110 Ref country code: EE Free format text: LAPSE BECAUSE OF FAILURE TO SUBMIT A TRANSLATION OF THE DESCRIPTION OR TO PAY THE FEE WITHIN THE PRESCRIBED TIME-LIMIT Effective date: 20240110 Ref country code: DK Free format text: LAPSE BECAUSE OF FAILURE TO SUBMIT A TRANSLATION OF THE DESCRIPTION OR TO PAY THE FEE WITHIN THE PRESCRIBED TIME-LIMIT Effective date: 20240110 Ref country code: CZ Free format text: LAPSE BECAUSE OF FAILURE TO SUBMIT A TRANSLATION OF THE DESCRIPTION OR TO PAY THE FEE WITHIN THE PRESCRIBED TIME-LIMIT Effective date: 20240110 |
|
| REG | Reference to a national code |
Ref country code: CH Ref legal event code: PL |
|
| PLBE | No opposition filed within time limit |
Free format text: ORIGINAL CODE: 0009261 |
|
| STAA | Information on the status of an ep patent application or granted ep patent |
Free format text: STATUS: NO OPPOSITION FILED WITHIN TIME LIMIT |
|
| PG25 | Lapsed in a contracting state [announced via postgrant information from national office to epo] |
Ref country code: LU Free format text: LAPSE BECAUSE OF NON-PAYMENT OF DUE FEES Effective date: 20240313 |
|
| PG25 | Lapsed in a contracting state [announced via postgrant information from national office to epo] |
Ref country code: MC Free format text: LAPSE BECAUSE OF FAILURE TO SUBMIT A TRANSLATION OF THE DESCRIPTION OR TO PAY THE FEE WITHIN THE PRESCRIBED TIME-LIMIT Effective date: 20240110 |
|
| PG25 | Lapsed in a contracting state [announced via postgrant information from national office to epo] |
Ref country code: MC Free format text: LAPSE BECAUSE OF FAILURE TO SUBMIT A TRANSLATION OF THE DESCRIPTION OR TO PAY THE FEE WITHIN THE PRESCRIBED TIME-LIMIT Effective date: 20240110 Ref country code: LU Free format text: LAPSE BECAUSE OF NON-PAYMENT OF DUE FEES Effective date: 20240313 |
|
| PG25 | Lapsed in a contracting state [announced via postgrant information from national office to epo] |
Ref country code: IT Free format text: LAPSE BECAUSE OF FAILURE TO SUBMIT A TRANSLATION OF THE DESCRIPTION OR TO PAY THE FEE WITHIN THE PRESCRIBED TIME-LIMIT Effective date: 20240110 |
|
| REG | Reference to a national code |
Ref country code: BE Ref legal event code: MM Effective date: 20240331 |
|
| 26N | No opposition filed |
Effective date: 20241011 |
|
| PG25 | Lapsed in a contracting state [announced via postgrant information from national office to epo] |
Ref country code: IT Free format text: LAPSE BECAUSE OF FAILURE TO SUBMIT A TRANSLATION OF THE DESCRIPTION OR TO PAY THE FEE WITHIN THE PRESCRIBED TIME-LIMIT Effective date: 20240110 |
|
| PG25 | Lapsed in a contracting state [announced via postgrant information from national office to epo] |
Ref country code: BE Free format text: LAPSE BECAUSE OF NON-PAYMENT OF DUE FEES Effective date: 20240331 |
|
| PG25 | Lapsed in a contracting state [announced via postgrant information from national office to epo] |
Ref country code: IE Free format text: LAPSE BECAUSE OF NON-PAYMENT OF DUE FEES Effective date: 20240313 |
|
| PG25 | Lapsed in a contracting state [announced via postgrant information from national office to epo] |
Ref country code: IE Free format text: LAPSE BECAUSE OF NON-PAYMENT OF DUE FEES Effective date: 20240313 Ref country code: BE Free format text: LAPSE BECAUSE OF NON-PAYMENT OF DUE FEES Effective date: 20240331 Ref country code: CH Free format text: LAPSE BECAUSE OF NON-PAYMENT OF DUE FEES Effective date: 20240331 |
|
| PG25 | Lapsed in a contracting state [announced via postgrant information from national office to epo] |
Ref country code: SI Free format text: LAPSE BECAUSE OF FAILURE TO SUBMIT A TRANSLATION OF THE DESCRIPTION OR TO PAY THE FEE WITHIN THE PRESCRIBED TIME-LIMIT Effective date: 20240110 |
|
| PG25 | Lapsed in a contracting state [announced via postgrant information from national office to epo] |
Ref country code: CY Free format text: LAPSE BECAUSE OF FAILURE TO SUBMIT A TRANSLATION OF THE DESCRIPTION OR TO PAY THE FEE WITHIN THE PRESCRIBED TIME-LIMIT; INVALID AB INITIO Effective date: 20190313 |
|
| PG25 | Lapsed in a contracting state [announced via postgrant information from national office to epo] |
Ref country code: HU Free format text: LAPSE BECAUSE OF FAILURE TO SUBMIT A TRANSLATION OF THE DESCRIPTION OR TO PAY THE FEE WITHIN THE PRESCRIBED TIME-LIMIT; INVALID AB INITIO Effective date: 20190313 |
|
| PG25 | Lapsed in a contracting state [announced via postgrant information from national office to epo] |
Ref country code: FI Free format text: LAPSE BECAUSE OF FAILURE TO SUBMIT A TRANSLATION OF THE DESCRIPTION OR TO PAY THE FEE WITHIN THE PRESCRIBED TIME-LIMIT Effective date: 20240110 |
|
| PG25 | Lapsed in a contracting state [announced via postgrant information from national office to epo] |
Ref country code: TR Free format text: LAPSE BECAUSE OF FAILURE TO SUBMIT A TRANSLATION OF THE DESCRIPTION OR TO PAY THE FEE WITHIN THE PRESCRIBED TIME-LIMIT Effective date: 20240110 |
|
| PGFP | Annual fee paid to national office [announced via postgrant information from national office to epo] |
Ref country code: GB Payment date: 20260303 Year of fee payment: 8 |
|
| PGFP | Annual fee paid to national office [announced via postgrant information from national office to epo] |
Ref country code: DE Payment date: 20260305 Year of fee payment: 8 |
|
| PGFP | Annual fee paid to national office [announced via postgrant information from national office to epo] |
Ref country code: FR Payment date: 20260309 Year of fee payment: 8 |