EP3751447A1 - Methods of determining a classification of a signal and of determining an artefact in an image - Google Patents
Methods of determining a classification of a signal and of determining an artefact in an image Download PDFInfo
- Publication number
- EP3751447A1 EP3751447A1 EP19180304.8A EP19180304A EP3751447A1 EP 3751447 A1 EP3751447 A1 EP 3751447A1 EP 19180304 A EP19180304 A EP 19180304A EP 3751447 A1 EP3751447 A1 EP 3751447A1
- Authority
- EP
- European Patent Office
- Prior art keywords
- signal
- image
- artefact
- pixel
- determining
- Prior art date
- Legal status (The legal status is an assumption and is not a legal conclusion. Google has not performed a legal analysis and makes no representation as to the accuracy of the status listed.)
- Granted
Links
Images



Classifications
-
- G—PHYSICS
- G06—COMPUTING OR CALCULATING; COUNTING
- G06V—IMAGE OR VIDEO RECOGNITION OR UNDERSTANDING
- G06V10/00—Arrangements for image or video recognition or understanding
- G06V10/70—Arrangements for image or video recognition or understanding using pattern recognition or machine learning
- G06V10/82—Arrangements for image or video recognition or understanding using pattern recognition or machine learning using neural networks
-
- G—PHYSICS
- G06—COMPUTING OR CALCULATING; COUNTING
- G06V—IMAGE OR VIDEO RECOGNITION OR UNDERSTANDING
- G06V10/00—Arrangements for image or video recognition or understanding
- G06V10/98—Detection or correction of errors, e.g. by rescanning the pattern or by human intervention; Evaluation of the quality of the acquired patterns
- G06V10/993—Evaluation of the quality of the acquired pattern
Definitions
- the present invention relates to a method of determining a classification of a signal, a method of determining an artefact in an image, an apparatus configured to execute the method and a program storing instructions which, when executed by a computer, cause the computer to execute the method.
- Random telegraphic signals (RTS) noise is also referred to as random telegraph noise (RTN), burst noise, bi-stable noise or noise stable at a number of signal levels.
- RTS noise is a type of electronic noise that occurs in many modern semiconductors. It consists of sudden step-like transitions between several voltage or current levels at unpredictable times. The most commonly invoked cause for RTS noise is a random trapping and release of charge carriers at thin film interfaces or at defect sites in a bulk semiconductor crystal.
- Modern optical sensors often are made of semiconductor material and thus also are affected by the aforementioned RTS noise.
- Stray light is often defined as light in an optical system which was not upon designing the system not intended.
- the light may originate from an intended light source, but may follow paths other than intended. Alternatively, it may be from a light source other than the intended light source.
- Stray light may set a working limit on the dynamic range of the optical system, limit the signal-to-noise ratio (SNR) or contrast ratio.
- SNR signal-to-noise ratio
- stray light is an important factor to consider when using modern optical sensors in order to obtain a good imaging signal.
- the current invention provides methods for classifying a signal measured by a pixel comprised in an optical sensor as a normal signal or as a random telegraph signal and for detecting artefacts caused by stray light when obtaining an image using an image sensor.
- a method of determining a classification of a signal comprises acquiring pixel data.
- the pixel data describes a signal which was measured during a predetermined time interval using a pixel.
- the pixel is comprised in an optical sensor, for example an image sensor such as a camera sensor, a CCD or else.
- optical sensor user herein is to be understood as being a sensor configured to detect electromagnetic radiation, preferably in the infrared, ultra-violet and/or visible light range.
- the method further comprises automatically determining, based on the pixel data, a classification for the signal described by the pixel data.
- the classification is determined such that the signal is classified (automatically) as a normal signal or as a random telegraphic signal.
- a convolutional neural network is used.
- the convolutional neural network is for example trained beforehand using a training set comprising several training signals. These training signals are for example assigned to a given category such as "normal signal” or "random telegraph signal”. In case the training signals are assigned to the category "random telegraphic signal", they may also be assigned to a certain parameter which characterizes the random telegraphic signal.
- the method may further comprise automatically determining, based on the pixel data which describes a signal classified as a random telegraphic signal, at least one parameter.
- the at least one parameter characterizes the random telegraphic signal.
- the determining is for example performed using a convolutional neural network. In this case, those of the training signals used to train the convolutional neural network which are assigned to the category "random telegraphic signal" are also assigned to the parameter which characterizes the random telegraphic signal.
- the parameter is at least one of a number of levels of the random telegraphic signal, an amplitude of a level of the random telegraphic signal, an amplitude of each level of the random telegraphic signal, an occurrence frequency of a level of the random telegraphic signal and an occurrence frequency of each level of the random telegraphic signal.
- the method in one example further comprises measuring at least one electrical property of the pixel during the predetermined time interval as the signal. It may further comprise determining the pixel data describing the signal.
- the electrical property for example comprises at least one of an electrical voltage, an electrical current, an electrical resistance, an electrical power and an electrical capacitance.
- the measuring during the predetermined time interval for example comprises measuring the at least one electrical property at periodic intervals during the predetermined time interval. For example, several frames are acquired by the optical sensor and a pixel value at each of the frames is used to determine a time-dependent pixel signal as the signal described by the pixel data.
- the pixel data for example describes at least one additional signal measured during a predetermined time interval using an additional pixel comprised in the optical sensor.
- the pixel data describes a plurality of pixel signals for a plurality of pixels comprised in the optical sensor, for example for all pixels comprised in the optical sensor.
- the step of determining for example further comprises automatically determining a classification for the additional signal described by the pixel data such that the additional signal is classified automatically as a normal signal or as a random telegraphic signal, for example using the convolutional neural network.
- the classification may be performed for more than one signal, for example for all signals described by the pixel data. In each case, the same convolutional neural network can be used.
- the method in one example further comprises determining a pixel map.
- the pixel map for example indicates which of the pixels comprised in the optical sensor were used to measure a signal classified as a random telegraphic signal.
- the pixel map may be output on a display device and/or represented in the form of a matrix indicating column(s) and/or row(s) of the aforementioned pixel(s).
- Based on the determined classification of the individual signals it can be decided which pixel(s) are prone to generating a RTS. These pixels can then be neglected or the corresponding signals can be adjusted when obtaining measurements using the optical sensor. For example, any detected RTS-based transitions can be automatically removed. In other words, the RTS components contained in a signal may be removed / smoothed out.
- the determined parameter(s) describing the random telegraph signal can be used. Therefore, the influence of the RTS noise on measurements of the optical sensor can be minimized.
- a method of detecting an artefact in an image obtained by an image sensor comprises acquiring image data describing the image obtained by the image sensor.
- the image sensor is for example a camera, a CCD or else.
- the image sensor may be referred to as an optical sensor.
- the image data may be equal to the pixel data.
- the image data may be determined based on the pixel data. For example, an image is generated based on values of the signals comprised in the pixel data at a given point in time. For generating the image, at least one signal may be neglected which has been classified as a random telegraphic signal. Multiple images may be generated based on the pixel data for different points in time. After some of the pixels comprised in the optical sensor which were used to measure a signal classified as a random telegraphic signal have been identified, for example based on the pixel map, signals of these pixels may be discarded to generate the image described by the image data. In other words, signals of pixels which exhibit a random telegraphic signal may be neglected when obtaining the image. The resulting image data may then be used to detect an artefact in the image.
- the method further comprises automatically detecting, based on the image data, the artefact in the image.
- the artefact was caused by stray light when obtaining the image with the image sensor.
- the detecting is for example performed using a convolutional neural network.
- the convolutional neural network may be trained beforehand using training sets of reference data.
- the step of automatically detecting comprises automatically determining a shape and/or position of the artefact in the image. This determination may also be performed by the convolutional neural network.
- the shape may be an outline of the artefact.
- the position may be the position of a centre, a top, a left side, a right side and/or a bottom of the artefact.
- the image data describes a spatially resolved intensity of light having a fixed wavelength.
- the image may comprise a plurality of pixel values each of which indicates a certain intensity of a fixed wavelength.
- the image comprises a matrix of pixel values each of which indicate a light intensity at a wavelength of 350nm.
- other wavelengths such as 200nm, 1000nm or else are possible.
- the wavelength does not need to be in region of visible light but may lie in an infrared range, in a high-frequency range such as an ultra-violet range or else.
- the image data for example further describes an additional image.
- the step of automatically detecting the artefact may comprise automatically detecting an additional artefact in the at least one additional image.
- the convolutional neural network may be used for the detection of the additional artefact. The additional artefact was caused by stray light when obtaining the additional image.
- the image and the additional image were obtained by the image sensor at different points in time.
- the artefact and the additional artefact may thus be caused by stray light of the same source which falls onto the image sensor at each of the different points in time, possibly at different locations.
- the image data describing the image and the additional image for example describes a spatially resolved intensity of light having a fixed wavelength for each image, wherein the fixed wavelength is different from one image to the other.
- the image data describes a spatially resolved intensity of light having a fixed wavelength for the image and for the additional image, wherein the fixed wavelength is different from one image to the other.
- the image comprises a matrix of pixel values each of which indicate a light intensity at a wavelength of 350nm.
- the additional image comprises a matrix of pixel values each of which indicate a light intensity at a wavelength of 550nm.
- other wavelengths such as 200nm, 1000nm or else are possible.
- the wavelength does not need to be in region of visible light but may lie in an infrared range, in a high-frequency range such as an ultra-violet range or else.
- apparatus comprising a processing unit configured to execute one or both of the aforementioned methods.
- the apparatus further comprises the optical sensor.
- the apparatus in one example acquires the pixel data from the optical sensor. It may acquire the image data from the optical sensor.
- the apparatus may comprise a computer as the processing unit.
- a computer program comprising instructions which, when the program is executed by a computer, for example the computer comprised in the apparatus, cause the computer to perform the method steps of one or both of the aforementioned methods.
- a program storage medium on which the program is stored in particular in a non-transitory form, for example a program storage unit comprised in the apparatus.
- a data stream is provided carrying information which represents the program.
- optical sensor may comprise several pixels.
- a plurality of pixels arranged in columns 2 and in lines 3 is shown.
- Several frames 1 are indicated.
- the pixel data may describe a signal measured using a pixel comprised in the optical sensor.
- a voltage level of pixel 4 is measured for each of the frames in the plurality of frames 1.
- the measurement results in a plurality of voltage levels which can be ordered frame by frame.
- each of the frames is obtained at a different point in time.
- the frames 1 are obtained periodically.
- a time-dependent voltage signal for pixel 4 can be derived.
- This signal is shown in Fig. 2 .
- other units such as a number of electrons, a number or energy of photons, or binary units might be measured instead of the voltage level of pixel 4.
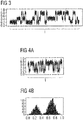
- Fig. 2 shows a signal described by the pixel data, which is a random telegraphic signal. As can be seen in Fig. 3 , the signal varies between three different levels. Each level is defined by a certain range of amplitude. In the given example, each level is defined by a given voltage range, for example 0.1 to 0.3, 0.3 to 0.6 and 0.6 to 0.9. Note that the amplitude shown in Fig. 2 , 3 , 4a and 5a is normalised to a range of 0 to 1 in the current example.
- the normalization of the pixel signal before classifying the signal is advantageous but not essential.
- a problem with the signal shown in Fig. 3 is that instead of a completely random noise, several specific voltage levels are present. This may result in an erroneous detection result, for example in a false positive signal. In order to avoid such an error, it is advantageous to determine which pixel exhibits a random telegraphic signal.
- a given signal can be classified as a normal signal or as a random telegraphic signal.
- parameters characterising the random telegraphic signal can be derived from the signal.
- a frequency distribution histogram can be derived from the random telegraphic signal.
- the histogram may show several distinguishable peaks as shown in Fig. 4B .
- the change between different voltage levels may not occur as often.
- a frequency distribution histogram can be derived from the signal, as shown in Fig. 5B . It is harder for a user to identify distinguishable peaks in the histogram shown in Fig.
- the convolutional neural network can be used to determine the aforementioned parameter characterising the random telegraphic signal. For example, an amplitude level, for example a voltage level, of the random telegraphic signal can be determined using the convolutional neural network. In addition or alternatively thereto, the number of levels and/or the occurrence of frequency on each level can be determined using the convolutional neural network.
- Fig. 6 shows a flow diagram of the method.
- a first step S1 pixel data is acquired.
- the pixel data describes a signal measured using a pixel comprised in the optical sensor.
- the pixel data describes the signal shown in Fig. 2 , 3 , 4a or 5A .
- the signal described by the pixel data was measured during a predetermined time interval, for example during a time interval comprising all frames 1.
- a classification for the signal is determined automatically. Thereby, the signal is classified as a normal signal or as a random telegraphic signal.
- a convolutional neural network can be used.
- the determination of the classification can be performed from multiple signals described by the pixel data.
- the pixel data describes a plurality of signals for a plurality of pixels comprised in the optical sensor.
- the classification of each of the signals measured using the plurality of pixels may be automatically determined based on the pixel data.
- a pixel map may be determined which indicates which of the pixels comprised in the optical sensor exhibit a random telegraphic signal, i.e which pixels were used to measure a signal classified as a random telegraphic signal.
- Fig. 7 shows a schematic overview of the method.
- the convolutional neural network comprises a first layer comprising 256 neurons and a second layer comprising 128 neurons.
- the convolutional neural network is denoted by the term "dense CNN".
- a training dataset is used.
- the training dataset comprises signals 10a, 10b, 10c, 10d and 10e. It may comprise further signals.
- Each of the training signals is associated with a category such as "normal signal” and "random telegraphic signal”.
- the signals comprised in the training dataset may be associated with one or more parameters characterising the random telegraphic signal.
- signals 10a, 10c and 10d are random telegraphic signals
- signals 10b and 10e are normal signals.
- the respective amplitude levels of the signals 10a, 10c and 10d can be used.
- the convolutional neural network After training the dense CNN with the training dataset, the convolutional neural network is able to automatically determine the classification for an input signal. Therefore, after pixel data is acquired describing a signal 11, the convolutional neural network automatically determines the classification for the signal 11. As noted above, the determination may be performed for a plurality of signals described by the pixel data, for example for a plurality of signals obtained by measurements using a plurality of pixels comprised in the optical sensor, for example all pixels. After having determined the classification for these signals, a pixel map can be determined as shown on the right in Fig. 7 . The pixel map may comprise a number of columns and rows of pixels which represent the individual pixels comprised in the optical sensor. Those pixels which show a random telegraphic signal can be highlighted in the RTS pixel map. These highlighted pixels are indicated as dark pixels in Fig. 7 .
- this identification of erroneous pixels can be used in order to obtain improved image data.
- the signals of the RTS pixels may be discarded or smoothed.
- the signals of the RTS pixels may be corrected using the at least one parameter determined as noted above. For example, a voltage may be subtracted from parts of the signal which are lying on a higher voltage level of a random telegraphic noise, whereas a voltage may be added to parts of the signal which are lying on a lower voltage level of a random telegraphic noise.
- a method of detecting artefacts in an image obtained by an image sensor is provided.
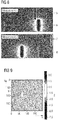
- Fig. 8 shows two images obtained by the image sensor. The images are described by image data.
- the upper image shown in Fig. 8 is referred to as "Measurement 1", whereas the lower image is referred to as "Measurement 2".
- an artefact 5 and an artefact 6 can be identified.
- an artefact 7 and an artefact 8 can be identified.
- These artefacts result from unwanted pathways of light rays onto the optical sensor. In other words, the artefacts were caused by stray light when obtaining the image. In this case, the artefacts may also be referred to as ghost images.
- the image data describing the image obtained by the image sensor i.e. the optical sensor
- the image data may be equal to the pixel data described above.
- the image data may be determined based on the pixel data, for example by discarding signals of pixels which have been classified as random telegraphic signals.
- Several images may be generated based on the pixel data for different points in time, using values of the signals at the different points in time, the signals being comprised in the pixel data.
- an artefact is automatically detected in the image. In the current case, artefacts 5, 6, 7 and 8 might be detected in the two images shown in Fig. 8 .
- the step of automatically detecting may comprise automatically determining a shape, for example an outline, a geometrical form, an area, a size and/or a position of the artefact in the image.
- the image may include a plurality of pixel values describing an intensity of electromagnetic radiation having a certain wavelength.
- the image data may describe a spatially resolved intensity of light having a fixed wavelength.
- the image may include a plurality of pixel values describing a spectrum of electromagnetic radiation.
- the fixed wavelength may be different from one image to another.
- the images may alternatively or additionally be obtained at different points in time.
- the method may comprise acquiring image data describing the several images and automatically detecting an artefact in each of the images.
- a convolutional neural network can be used.
- a possible convolutional neural network comprises or consists of 18 layers with 64 to 4096 neurons. After training the convolutional neural network with a training set, for example a plurality of images obtained at different points in time, wherein each of the images is associated with an artefact, for example a shape and position of the artefact, the convolutional neural network is able to automatically detect an artefact in an image.
- Information on the evolution of an artefact for example its movement, change in size, change in focus, change in intensity or else, may be used in order to predict the shape and/or position of the artefact in a subsequent image.
- the evolution of an artefact in an image can be predicted using the convolutional neural network. Therefore, the artefact can be detected more reliably in a subsequent image.
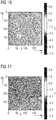
- Fig. 9 shows an exemplary image described by the image data.
- the artefact 9 has a given position in the coordinate system X, Y. It also has a certain intensity indicated on the scale Z.
- the convolutional neural network is able to detect the artefact 9 from the image shown in Fig. 9 .
- a subsequent image may also be obtained as shown in Fig. 10 . Also this image may be described by the image data.
- the image shown in Fig. 10 may have been obtained by the optical sensor at a later point in time than the image shown in Fig. 9 .
- the convolutional neural network may predict the shape and/or position of the artefact 9 in Fig. 10 based on the detection in the image shown in Fig. 9 . For example, it may be known that an artefact always move into a certain direction and always exhibits a certain shape and/or position.
- a further subsequent image may also be obtained as shown in Fig. 11 .
- the shape and/or position of the artefact may be determined using the convolutional neural network and the detection of the artefact in the image of Fig. 9 and/or Fig. 10 . This enables a tracking of the artefact in subsequent images.
- a different set of images can be used. For example, a first image representing intensity values at a first wavelength, a second image representing intensity values at a larger wavelength, and third image representing intensity values at an even larger wavelength can be used as the images described by the image data.
- the image data may be corrected.
- the artefacts may be removed from the image data using interpolation and/or extrapolation techniques.
- the artefact may also be tagged as a region in the image which may not be used for further processing such as object detection. Therefore, this method allows improving a detected image signal.
- Fig. 12 shows a flow diagram of the method of detecting an artefact in an image.
- image data is acquired which describes the image obtained by the image sensor.
- the artefact is automatically detected based on the image data.
- the convolutional neural network can be used.
- the method for determining a classification of a signal may be combined with the method of detecting an artefact. For example, at a first stage, the method for determining a classification of a signal is performed, for example to discard any RTS pixels. In a subsequent step, the method of detecting an artefact may be executed, for example in order to obtain an improved image.
- the image data may comprise the pixel data and/or the pixel data may comprise the image data.
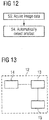
- Fig. 13 shows an apparatus according to an aspect of the invention.
- the apparatus comprises a processing unit 13 which can also be referred to as a computer. It also comprises an optical sensor 14, which can also be referred to as an image sensor, a camera or else. Also, the apparatus may comprise a storage medium 15 which may serve as a program storage medium. The apparatus is configured to execute one or both of the aforementioned methods alone or in combination.
Landscapes
- Engineering & Computer Science (AREA)
- Theoretical Computer Science (AREA)
- Quality & Reliability (AREA)
- Physics & Mathematics (AREA)
- General Physics & Mathematics (AREA)
- Multimedia (AREA)
- Evolutionary Computation (AREA)
- Artificial Intelligence (AREA)
- Health & Medical Sciences (AREA)
- Computer Vision & Pattern Recognition (AREA)
- Computing Systems (AREA)
- Databases & Information Systems (AREA)
- General Health & Medical Sciences (AREA)
- Medical Informatics (AREA)
- Software Systems (AREA)
- Image Analysis (AREA)
- Image Processing (AREA)
Abstract
Description
- The present invention relates to a method of determining a classification of a signal, a method of determining an artefact in an image, an apparatus configured to execute the method and a program storing instructions which, when executed by a computer, cause the computer to execute the method.
- Random telegraphic signals (RTS) noise is also referred to as random telegraph noise (RTN), burst noise, bi-stable noise or noise stable at a number of signal levels. RTS noise is a type of electronic noise that occurs in many modern semiconductors. It consists of sudden step-like transitions between several voltage or current levels at unpredictable times. The most commonly invoked cause for RTS noise is a random trapping and release of charge carriers at thin film interfaces or at defect sites in a bulk semiconductor crystal.
- Modern optical sensors often are made of semiconductor material and thus also are affected by the aforementioned RTS noise.
- Stray light is often defined as light in an optical system which was not upon designing the system not intended. The light may originate from an intended light source, but may follow paths other than intended. Alternatively, it may be from a light source other than the intended light source. Stray light may set a working limit on the dynamic range of the optical system, limit the signal-to-noise ratio (SNR) or contrast ratio.
- Thus, stray light is an important factor to consider when using modern optical sensors in order to obtain a good imaging signal.
- The current invention provides methods for classifying a signal measured by a pixel comprised in an optical sensor as a normal signal or as a random telegraph signal and for detecting artefacts caused by stray light when obtaining an image using an image sensor.
- According to a first aspect of the invention, a method of determining a classification of a signal is provided. The method comprises acquiring pixel data. The pixel data describes a signal which was measured during a predetermined time interval using a pixel. The pixel is comprised in an optical sensor, for example an image sensor such as a camera sensor, a CCD or else. The term "optical sensor" user herein is to be understood as being a sensor configured to detect electromagnetic radiation, preferably in the infrared, ultra-violet and/or visible light range. The method further comprises automatically determining, based on the pixel data, a classification for the signal described by the pixel data. The classification is determined such that the signal is classified (automatically) as a normal signal or as a random telegraphic signal. To this end, for example a convolutional neural network is used. The convolutional neural network is for example trained beforehand using a training set comprising several training signals. These training signals are for example assigned to a given category such as "normal signal" or "random telegraph signal". In case the training signals are assigned to the category "random telegraphic signal", they may also be assigned to a certain parameter which characterizes the random telegraphic signal.
- The method may further comprise automatically determining, based on the pixel data which describes a signal classified as a random telegraphic signal, at least one parameter. The at least one parameter characterizes the random telegraphic signal. The determining is for example performed using a convolutional neural network. In this case, those of the training signals used to train the convolutional neural network which are assigned to the category "random telegraphic signal" are also assigned to the parameter which characterizes the random telegraphic signal.
- The parameter is at least one of a number of levels of the random telegraphic signal, an amplitude of a level of the random telegraphic signal, an amplitude of each level of the random telegraphic signal, an occurrence frequency of a level of the random telegraphic signal and an occurrence frequency of each level of the random telegraphic signal.
The method in one example further comprises measuring at least one electrical property of the pixel during the predetermined time interval as the signal. It may further comprise determining the pixel data describing the signal. The electrical property for example comprises at least one of an electrical voltage, an electrical current, an electrical resistance, an electrical power and an electrical capacitance. - The measuring during the predetermined time interval for example comprises measuring the at least one electrical property at periodic intervals during the predetermined time interval. For example, several frames are acquired by the optical sensor and a pixel value at each of the frames is used to determine a time-dependent pixel signal as the signal described by the pixel data.
- The pixel data for example describes at least one additional signal measured during a predetermined time interval using an additional pixel comprised in the optical sensor. For example, the pixel data describes a plurality of pixel signals for a plurality of pixels comprised in the optical sensor, for example for all pixels comprised in the optical sensor.
- The step of determining for example further comprises automatically determining a classification for the additional signal described by the pixel data such that the additional signal is classified automatically as a normal signal or as a random telegraphic signal, for example using the convolutional neural network. In other words, the classification may be performed for more than one signal, for example for all signals described by the pixel data. In each case, the same convolutional neural network can be used.
- The method in one example further comprises determining a pixel map. The pixel map for example indicates which of the pixels comprised in the optical sensor were used to measure a signal classified as a random telegraphic signal. The pixel map may be output on a display device and/or represented in the form of a matrix indicating column(s) and/or row(s) of the aforementioned pixel(s). Based on the determined classification of the individual signals, it can be decided which pixel(s) are prone to generating a RTS. These pixels can then be neglected or the corresponding signals can be adjusted when obtaining measurements using the optical sensor. For example, any detected RTS-based transitions can be automatically removed. In other words, the RTS components contained in a signal may be removed / smoothed out. To this end, the determined parameter(s) describing the random telegraph signal can be used. Therefore, the influence of the RTS noise on measurements of the optical sensor can be minimized.
- According to another aspect of the present invention, a method of detecting an artefact in an image obtained by an image sensor is provided. The method comprises acquiring image data describing the image obtained by the image sensor. The image sensor is for example a camera, a CCD or else. The image sensor may be referred to as an optical sensor.
- This method of detecting an artefact in an image can be combined with the method for classifying a signal mentioned above. The image data may be equal to the pixel data. The image data may be determined based on the pixel data. For example, an image is generated based on values of the signals comprised in the pixel data at a given point in time. For generating the image, at least one signal may be neglected which has been classified as a random telegraphic signal. Multiple images may be generated based on the pixel data for different points in time. After some of the pixels comprised in the optical sensor which were used to measure a signal classified as a random telegraphic signal have been identified, for example based on the pixel map, signals of these pixels may be discarded to generate the image described by the image data. In other words, signals of pixels which exhibit a random telegraphic signal may be neglected when obtaining the image. The resulting image data may then be used to detect an artefact in the image.
- The method further comprises automatically detecting, based on the image data, the artefact in the image. The artefact was caused by stray light when obtaining the image with the image sensor. The detecting is for example performed using a convolutional neural network. As described above, the convolutional neural network may be trained beforehand using training sets of reference data.
- In one example, the step of automatically detecting comprises automatically determining a shape and/or position of the artefact in the image. This determination may also be performed by the convolutional neural network. The shape may be an outline of the artefact. The position may be the position of a centre, a top, a left side, a right side and/or a bottom of the artefact.
- For example, the image data describes a spatially resolved intensity of light having a fixed wavelength. In other words, the image may comprise a plurality of pixel values each of which indicates a certain intensity of a fixed wavelength. For example, the image comprises a matrix of pixel values each of which indicate a light intensity at a wavelength of 350nm. Of course, other wavelengths such as 200nm, 1000nm or else are possible. The wavelength does not need to be in region of visible light but may lie in an infrared range, in a high-frequency range such as an ultra-violet range or else.
- The image data for example further describes an additional image. In this case, the step of automatically detecting the artefact may comprise automatically detecting an additional artefact in the at least one additional image. Also for the detection of the additional artefact, the convolutional neural network may be used. The additional artefact was caused by stray light when obtaining the additional image.
- For example, the image and the additional image were obtained by the image sensor at different points in time. The artefact and the additional artefact may thus be caused by stray light of the same source which falls onto the image sensor at each of the different points in time, possibly at different locations.
- The image data describing the image and the additional image for example describes a spatially resolved intensity of light having a fixed wavelength for each image, wherein the fixed wavelength is different from one image to the other. In particular, the image data describes a spatially resolved intensity of light having a fixed wavelength for the image and for the additional image, wherein the fixed wavelength is different from one image to the other. For example, the image comprises a matrix of pixel values each of which indicate a light intensity at a wavelength of 350nm. For example, the additional image comprises a matrix of pixel values each of which indicate a light intensity at a wavelength of 550nm. Of course, other wavelengths such as 200nm, 1000nm or else are possible. The wavelength does not need to be in region of visible light but may lie in an infrared range, in a high-frequency range such as an ultra-violet range or else.
- According to an aspect of the invention apparatus is provided comprising a processing unit configured to execute one or both of the aforementioned methods. For example, the apparatus further comprises the optical sensor. The apparatus in one example acquires the pixel data from the optical sensor. It may acquire the image data from the optical sensor. Furthermore, the apparatus may comprise a computer as the processing unit.
- According to another aspect of the invention, a computer program is provided comprising instructions which, when the program is executed by a computer, for example the computer comprised in the apparatus, cause the computer to perform the method steps of one or both of the aforementioned methods. Also provided is a program storage medium on which the program is stored, in particular in a non-transitory form, for example a program storage unit comprised in the apparatus. Also, a data stream is provided carrying information which represents the program.
- In the following, several advantageous embodiments of the present invention will be disclosed with reference to the drawings, wherein:
- Fig. 1
- shows a schematic example of pixel data;
- Fig. 2
- shows a signal described by the pixel data;
- Fig. 3
- shows a second signal described by the pixel data;
- Fig. 4a
- shows a third signal described by the pixel data;
- Fig. 4b
- shows a histogram derived from the third signal shown in
Fig. 4a ; - Fig. 5a
- shows a fourth signal described by the pixel data;
- Fig. 5b
- shows a histogram derived from the fourth signal shown in
Fig. 5a ; - Fig. 6
- shows a flow diagram of a first method;
- Fig. 7
- shows a schematic overview of the first method;
- Fig. 8
- shows two images described by image data;
- Fig. 9
- shows a first image described by the image data;
- Fig. 10
- shows a second image described by the image data;
- Fig. 11
- shows a third image described by the image data;
- Fig. 12
- shows a flow diagram of a second method; and
- Fig. 13
- shows an apparatus according to an aspect of the invention.
- As is commonly known and optical sensor may comprise several pixels. In
Fig. 1 , a plurality of pixels arranged incolumns 2 and in lines 3 is shown.Several frames 1 are indicated. The pixel data may describe a signal measured using a pixel comprised in the optical sensor. For example, a voltage level of pixel 4 is measured for each of the frames in the plurality offrames 1. The measurement results in a plurality of voltage levels which can be ordered frame by frame. In the current case, each of the frames is obtained at a different point in time. In particular, theframes 1 are obtained periodically. Using the plurality of voltage levels and time information describing at which point in time the respective frame was obtained, a time-dependent voltage signal for pixel 4 can be derived. This signal is shown inFig. 2 . Of course, other units such as a number of electrons, a number or energy of photons, or binary units might be measured instead of the voltage level of pixel 4. - As can be seen from
Fig. 2 , the signal varies randomly during time. No specific voltage levels can be observed. In some cases however, a random telegraphic signal may be observed for a given pixel.Fig. 3 shows a signal described by the pixel data, which is a random telegraphic signal. As can be seen inFig. 3 , the signal varies between three different levels. Each level is defined by a certain range of amplitude. In the given example, each level is defined by a given voltage range, for example 0.1 to 0.3, 0.3 to 0.6 and 0.6 to 0.9. Note that the amplitude shown inFig. 2 ,3 ,4a and5a is normalised to a range of 0 to 1 in the current example. The normalization of the pixel signal before classifying the signal is advantageous but not essential. A problem with the signal shown inFig. 3 is that instead of a completely random noise, several specific voltage levels are present. This may result in an erroneous detection result, for example in a false positive signal. In order to avoid such an error, it is advantageous to determine which pixel exhibits a random telegraphic signal. - Using a convolution neural network, a given signal can be classified as a normal signal or as a random telegraphic signal. In addition, parameters characterising the random telegraphic signal can be derived from the signal. For example, a frequency distribution histogram can be derived from the random telegraphic signal. In case of a signal shown in
Fig. 4A , the histogram may show several distinguishable peaks as shown inFig. 4B . In some cases, as shown inFig. 5A , the change between different voltage levels may not occur as often. However, also in this case a frequency distribution histogram can be derived from the signal, as shown inFig. 5B . It is harder for a user to identify distinguishable peaks in the histogram shown inFig. 5B compared to the histogram ofFig. 5A . Therefore, it is useful to apply a convolutional neural network to determine whether the signal is a normal signal or a random telegraphic signal. In addition, the convolutional neural network can be used to determine the aforementioned parameter characterising the random telegraphic signal. For example, an amplitude level, for example a voltage level, of the random telegraphic signal can be determined using the convolutional neural network. In addition or alternatively thereto, the number of levels and/or the occurrence of frequency on each level can be determined using the convolutional neural network. -
Fig. 6 shows a flow diagram of the method. In a first step S1, pixel data is acquired. The pixel data describes a signal measured using a pixel comprised in the optical sensor. For example, the pixel data describes the signal shown inFig. 2 ,3 ,4a or5A . - The signal described by the pixel data was measured during a predetermined time interval, for example during a time interval comprising all frames 1. In the next step S2, a classification for the signal is determined automatically. Thereby, the signal is classified as a normal signal or as a random telegraphic signal. In order to automatically determine the classification, a convolutional neural network can be used.
- The determination of the classification can be performed from multiple signals described by the pixel data. For example, the pixel data describes a plurality of signals for a plurality of pixels comprised in the optical sensor. In this case, the classification of each of the signals measured using the plurality of pixels may be automatically determined based on the pixel data. Also, a pixel map may be determined which indicates which of the pixels comprised in the optical sensor exhibit a random telegraphic signal, i.e which pixels were used to measure a signal classified as a random telegraphic signal.
-
Fig. 7 shows a schematic overview of the method. The convolutional neural network comprises a first layer comprising 256 neurons and a second layer comprising 128 neurons. The convolutional neural network is denoted by the term "dense CNN". In order to train the convolutional neural network, a training dataset is used. In the shown example, the training dataset comprisessignals signals signals - After training the dense CNN with the training dataset, the convolutional neural network is able to automatically determine the classification for an input signal. Therefore, after pixel data is acquired describing a
signal 11, the convolutional neural network automatically determines the classification for thesignal 11. As noted above, the determination may be performed for a plurality of signals described by the pixel data, for example for a plurality of signals obtained by measurements using a plurality of pixels comprised in the optical sensor, for example all pixels. After having determined the classification for these signals, a pixel map can be determined as shown on the right inFig. 7 . The pixel map may comprise a number of columns and rows of pixels which represent the individual pixels comprised in the optical sensor. Those pixels which show a random telegraphic signal can be highlighted in the RTS pixel map. These highlighted pixels are indicated as dark pixels inFig. 7 . - Subsequently, this identification of erroneous pixels can be used in order to obtain improved image data. For example, the signals of the RTS pixels may be discarded or smoothed. Also, the signals of the RTS pixels may be corrected using the at least one parameter determined as noted above. For example, a voltage may be subtracted from parts of the signal which are lying on a higher voltage level of a random telegraphic noise, whereas a voltage may be added to parts of the signal which are lying on a lower voltage level of a random telegraphic noise.
- According to the second aspect, a method of detecting artefacts in an image obtained by an image sensor is provided.
Fig. 8 shows two images obtained by the image sensor. The images are described by image data. The upper image shown inFig. 8 is referred to as "Measurement 1", whereas the lower image is referred to as "Measurement 2". In the upper image, anartefact 5 and anartefact 6 can be identified. In the lower image, anartefact 7 and anartefact 8 can be identified. These artefacts result from unwanted pathways of light rays onto the optical sensor. In other words, the artefacts were caused by stray light when obtaining the image. In this case, the artefacts may also be referred to as ghost images. In order to improve the obtained images, it is useful to detect these artefacts. To this end, the image data describing the image obtained by the image sensor, i.e. the optical sensor, is acquired. The image data may be equal to the pixel data described above. The image data may be determined based on the pixel data, for example by discarding signals of pixels which have been classified as random telegraphic signals. Several images may be generated based on the pixel data for different points in time, using values of the signals at the different points in time, the signals being comprised in the pixel data. Subsequently, using a convolutional neural network, an artefact is automatically detected in the image. In the current case,artefacts Fig. 8 . - The step of automatically detecting may comprise automatically determining a shape, for example an outline, a geometrical form, an area, a size and/or a position of the artefact in the image. The image may include a plurality of pixel values describing an intensity of electromagnetic radiation having a certain wavelength. In other words, the image data may describe a spatially resolved intensity of light having a fixed wavelength. The image may include a plurality of pixel values describing a spectrum of electromagnetic radiation. In the case of a plurality of images, the fixed wavelength may be different from one image to another. The images may alternatively or additionally be obtained at different points in time.
- In the case of several images, the method may comprise acquiring image data describing the several images and automatically detecting an artefact in each of the images. For this purpose, a convolutional neural network can be used. A possible convolutional neural network comprises or consists of 18 layers with 64 to 4096 neurons. After training the convolutional neural network with a training set, for example a plurality of images obtained at different points in time, wherein each of the images is associated with an artefact, for example a shape and position of the artefact, the convolutional neural network is able to automatically detect an artefact in an image. Information on the evolution of an artefact, for example its movement, change in size, change in focus, change in intensity or else, may be used in order to predict the shape and/or position of the artefact in a subsequent image. The evolution of an artefact in an image can be predicted using the convolutional neural network. Therefore, the artefact can be detected more reliably in a subsequent image.
-
Fig. 9 shows an exemplary image described by the image data. Theartefact 9 has a given position in the coordinate system X, Y. It also has a certain intensity indicated on the scale Z. The convolutional neural network is able to detect theartefact 9 from the image shown inFig. 9 . - A subsequent image may also be obtained as shown in
Fig. 10 . Also this image may be described by the image data. The image shown inFig. 10 may have been obtained by the optical sensor at a later point in time than the image shown inFig. 9 . The convolutional neural network may predict the shape and/or position of theartefact 9 inFig. 10 based on the detection in the image shown inFig. 9 . For example, it may be known that an artefact always move into a certain direction and always exhibits a certain shape and/or position. - A further subsequent image may also be obtained as shown in
Fig. 11 . Also in this case, the shape and/or position of the artefact may be determined using the convolutional neural network and the detection of the artefact in the image ofFig. 9 and/orFig. 10 . This enables a tracking of the artefact in subsequent images. - Note that instead of images obtained at different points in time, a different set of images can be used. For example, a first image representing intensity values at a first wavelength, a second image representing intensity values at a larger wavelength, and third image representing intensity values at an even larger wavelength can be used as the images described by the image data.
- Based on the detected artefact, the image data may be corrected. For example, the artefacts may be removed from the image data using interpolation and/or extrapolation techniques. The artefact may also be tagged as a region in the image which may not be used for further processing such as object detection. Therefore, this method allows improving a detected image signal.
-
Fig. 12 shows a flow diagram of the method of detecting an artefact in an image. In step S3, image data is acquired which describes the image obtained by the image sensor. In a subsequent step S4, as described above, the artefact is automatically detected based on the image data. To this end, the convolutional neural network can be used. - The method for determining a classification of a signal may be combined with the method of detecting an artefact. For example, at a first stage, the method for determining a classification of a signal is performed, for example to discard any RTS pixels. In a subsequent step, the method of detecting an artefact may be executed, for example in order to obtain an improved image. In this case, the image data may comprise the pixel data and/or the pixel data may comprise the image data.
-
Fig. 13 shows an apparatus according to an aspect of the invention. The apparatus comprises aprocessing unit 13 which can also be referred to as a computer. It also comprises anoptical sensor 14, which can also be referred to as an image sensor, a camera or else. Also, the apparatus may comprise astorage medium 15 which may serve as a program storage medium. The apparatus is configured to execute one or both of the aforementioned methods alone or in combination.
Claims (15)
- A method of determining a classification of a signal, the method comprising:acquiring pixel data describing a signal, wherein the signal was measured during a predetermined time interval using a pixel comprised in an optical sensor (14);automatically determining, based on the pixel data, a classification for the signal described by the pixel data such that the signal is classified as a normal signal or as a random telegraphic signal, for example using a convolutional neural network.
- The method of claim 1, further comprising:
determining, based on the pixel data which describes a signal classified as a random telegraphic signal, at least one parameter automatically which characterizes the random telegraphic signal, for example using a convolutional neural network. - The method of claim 2, wherein the parameter is at least one of the following:- a number of levels of the random telegraphic signal;- an amplitude of a level of the random telegraphic signal;- an amplitude of each level of the random telegraphic signal;- an occurrence frequency of a level of the random telegraphic signal; and- an occurrence frequency of each level of the random telegraphic signal.
- The method of any of claims 1 to 3, further comprising:measuring at least one electrical property of the pixel during the predetermined time interval as the signal; anddetermining the pixel data describing the signal, whereinthe electrical property for example comprises at least one of an electrical voltage, an electrical current, an electrical resistance, an electrical power and an electrical capacitance.
- The method of any of claims 1 to 4, wherein
the measuring during the predetermined time interval comprises measuring the at least one electrical property at periodic intervals during the predetermined time interval. - The method of any of claims 1 to 5, wherein
the pixel data describes at least one additional signal measured during a predetermined time interval using an additional pixel comprised in the optical sensor (14), wherein
the step of determining further comprises automatically determining a classification for the additional signal described by the pixel data such that the additional signal is classified automatically as a normal signal or as a random telegraphic signal, for example using the convolutional neural network. - The method of claim 6, further comprising:
determining a pixel map indicating which of the pixels comprised in the optical sensor (14) were used to measure a signal classified as a random telegraphic signal. - A method of detecting an artefact (5, 6, 7, 8, 9) in an image obtained by an image sensor (14), the method comprising:acquiring image data describing the image obtained by the image sensor (14);automatically detecting, based on the image data, the artefact (5, 6, 7, 8, 9) in the image, wherein the artefact (5, 6, 7, 8, 9) was caused by stray light when obtaining the image and wherein the detecting is for example performed using a convolutional neural network.
- The method of claim 8, wherein the step of automatically detecting comprises:
automatically determining, for example by the convolutional neural network, a shape and/or position of the artefact (5, 6, 7, 8, 9) in the image. - The method of claim 8 or 9, wherein
the image data describes a spatially resolved intensity of light having a fixed wavelength. - The method of any of claims 8 to 10,
wherein the image data further describes an additional image and
wherein the step of automatically detecting the artefact (5, 6, 7, 8, 9) comprises:
automatically detecting an additional artefact in the at least one additional image, for example using the convolutional neural network, wherein the additional artefact was caused by stray light when obtaining the additional image. - The method of claim 11, wherein
the image and the additional image were obtained by the image sensor (14) at different points in time. - The method of claim 11 or 12, wherein
the image data describes a spatially resolved intensity of light having a fixed wavelength for the image and for the additional image, wherein the fixed wavelength is different from one image to the other. - An apparatus (12) comprising a processing unit (13) configured to execute the method of any of claims 1 to 13, the apparatus (12) optionally further comprising the optical sensor (14).
- A computer program comprising instructions which, when the program is executed by a computer (13), cause the computer (13) to perform the method steps of the method according to any one of claims 1 to 13 and/or a program storage medium (15) on which the program is stored, in particular in a non-transitory form and/or a data stream carrying information which represents the program.
Priority Applications (1)
| Application Number | Priority Date | Filing Date | Title |
|---|---|---|---|
| EP19180304.8A EP3751447B1 (en) | 2019-06-14 | 2019-06-14 | Methods of determining a classification of a signal and of determining an artefact in an image |
Applications Claiming Priority (1)
| Application Number | Priority Date | Filing Date | Title |
|---|---|---|---|
| EP19180304.8A EP3751447B1 (en) | 2019-06-14 | 2019-06-14 | Methods of determining a classification of a signal and of determining an artefact in an image |
Publications (3)
| Publication Number | Publication Date |
|---|---|
| EP3751447A1 true EP3751447A1 (en) | 2020-12-16 |
| EP3751447B1 EP3751447B1 (en) | 2025-11-19 |
| EP3751447C0 EP3751447C0 (en) | 2025-11-19 |
Family
ID=66867043
Family Applications (1)
| Application Number | Title | Priority Date | Filing Date |
|---|---|---|---|
| EP19180304.8A Active EP3751447B1 (en) | 2019-06-14 | 2019-06-14 | Methods of determining a classification of a signal and of determining an artefact in an image |
Country Status (1)
| Country | Link |
|---|---|
| EP (1) | EP3751447B1 (en) |
Cited By (1)
| Publication number | Priority date | Publication date | Assignee | Title |
|---|---|---|---|---|
| US12112515B2 (en) | 2020-06-26 | 2024-10-08 | Airbus Defence and Space GmbH | Technique for generating a labeled set of images |
-
2019
- 2019-06-14 EP EP19180304.8A patent/EP3751447B1/en active Active
Non-Patent Citations (4)
| Title |
|---|
| CANDEIAS HENRIQUE ET AL: "RTS effect detection in Sentinel-4 data", PROCEEDINGS OF SPIE; [PROCEEDINGS OF SPIE ISSN 0277-786X VOLUME 10524], SPIE, US, vol. 10402, 5 September 2017 (2017-09-05), pages 104021B - 104021B, XP060099197, ISBN: 978-1-5106-1533-5, DOI: 10.1117/12.2274310 * |
| JOSEPH W DEROSE ET AL: "AUTOMATED IMAGE ARTIFACT IDENTIFICATION IN DARK ENERGY SURVEY CCD EXPOSURES", 22 September 2017 (2017-09-22), XP055653926, Retrieved from the Internet <URL:http://cs229.stanford.edu/proj2015/149_report.pdf> [retrieved on 20191218] * |
| R. ZHENG ET AL: "A Real-time Auto-detection Method for Random Telegraph Signal (RTS) Noise Detection in CMOS Active pixel sensors", JOURNAL OF INSTRUMENTATION, vol. 10, no. 07, 21 July 2015 (2015-07-21), GB, XP055643501, ISSN: 1748-0221, DOI: 10.1088/1748-0221/10/07/C07013 * |
| VINCENT GOIFFON ET AL: "Investigation of Dark Current Random Telegraph Signal in Pinned PhotoDiode CMOS Image Sensors", ELECTRON DEVICES MEETING (IEDM), 2011 IEEE INTERNATIONAL, IEEE, 5 December 2011 (2011-12-05), pages 8.4.1 - 8.4.4, XP032095906, ISBN: 978-1-4577-0506-9, DOI: 10.1109/IEDM.2011.6131514 * |
Cited By (1)
| Publication number | Priority date | Publication date | Assignee | Title |
|---|---|---|---|---|
| US12112515B2 (en) | 2020-06-26 | 2024-10-08 | Airbus Defence and Space GmbH | Technique for generating a labeled set of images |
Also Published As
| Publication number | Publication date |
|---|---|
| EP3751447B1 (en) | 2025-11-19 |
| EP3751447C0 (en) | 2025-11-19 |
Similar Documents
| Publication | Publication Date | Title |
|---|---|---|
| TWI600897B (en) | Computer-implemented method, non-transitory computer-readable medium, and system for detecting defects on a wafer | |
| US8660335B2 (en) | Transient pixel defect detection and correction | |
| CN119941764B (en) | Real-time image segmentation method for gold wire bonding | |
| KR102556350B1 (en) | Method and Apparatus for Calculating Ratio of Lesion Area | |
| JP2004177139A (en) | Support program for preparation of inspection condition data, inspection device, and method of preparing inspection condition data | |
| CN114037771B (en) | A few-photon imaging method based on deep learning | |
| TW201510517A (en) | Method and system for improving wafer surface inspection sensitivity | |
| CN114387249A (en) | Detection method, detection device, equipment and storage medium | |
| KR101716111B1 (en) | System and method for detecting foreign substance | |
| EP3751447B1 (en) | Methods of determining a classification of a signal and of determining an artefact in an image | |
| JP4564967B2 (en) | Device and method for correcting defects in X-ray images | |
| EP1708496A2 (en) | Identifying a photoelectric sensor array size | |
| CN111050088B (en) | Mechanism to calibrate imaging brightness of camera for detecting die defects | |
| JP2011019591A (en) | X-ray equipment, interpolating method of lost pixel in x-ray detector, and method of creating deficit map in x-ray detector | |
| US8004564B1 (en) | Automated systems and methods for testing infrared cameras | |
| CN119359742A (en) | Method, device and electronic equipment for segmenting defective area of cable accessories | |
| WO2016092783A1 (en) | Information processing apparatus, method for processing information, discriminator generating apparatus, method for generating discriminator, and program | |
| WO2017221376A1 (en) | Image processing device, image processing method, and image processing program | |
| US20200304739A1 (en) | Image processing device, image processing method and storage medium | |
| KR100754969B1 (en) | Image inspecting apparatus, image inspecting method, and computer-readable storage medium | |
| CN116543022A (en) | Gas infrared image processing method, gas leak detector and storage medium | |
| JP5600159B2 (en) | Method for processing dynamic photon emission for analysis of integrated circuits and system for carrying out this method | |
| JPH05130512A (en) | Picture element defect measuring instrument for solid-state image pickup element | |
| Leung et al. | Analyzing the impact of ISO on digital imager defects with an automatic defect trace algorithm | |
| JP5272821B2 (en) | Radiation imaging device |
Legal Events
| Date | Code | Title | Description |
|---|---|---|---|
| PUAI | Public reference made under article 153(3) epc to a published international application that has entered the european phase |
Free format text: ORIGINAL CODE: 0009012 |
|
| STAA | Information on the status of an ep patent application or granted ep patent |
Free format text: STATUS: THE APPLICATION HAS BEEN PUBLISHED |
|
| AK | Designated contracting states |
Kind code of ref document: A1 Designated state(s): AL AT BE BG CH CY CZ DE DK EE ES FI FR GB GR HR HU IE IS IT LI LT LU LV MC MK MT NL NO PL PT RO RS SE SI SK SM TR |
|
| AX | Request for extension of the european patent |
Extension state: BA ME |
|
| STAA | Information on the status of an ep patent application or granted ep patent |
Free format text: STATUS: REQUEST FOR EXAMINATION WAS MADE |
|
| 17P | Request for examination filed |
Effective date: 20210121 |
|
| RBV | Designated contracting states (corrected) |
Designated state(s): AL AT BE BG CH CY CZ DE DK EE ES FI FR GB GR HR HU IE IS IT LI LT LU LV MC MK MT NL NO PL PT RO RS SE SI SK SM TR |
|
| STAA | Information on the status of an ep patent application or granted ep patent |
Free format text: STATUS: EXAMINATION IS IN PROGRESS |
|
| 17Q | First examination report despatched |
Effective date: 20220429 |
|
| REG | Reference to a national code |
Ref country code: DE Ref legal event code: R079 Free format text: PREVIOUS MAIN CLASS: G06K0009000000 Ipc: G06V0010820000 Ref document number: 602019078198 Country of ref document: DE |
|
| GRAP | Despatch of communication of intention to grant a patent |
Free format text: ORIGINAL CODE: EPIDOSNIGR1 |
|
| STAA | Information on the status of an ep patent application or granted ep patent |
Free format text: STATUS: GRANT OF PATENT IS INTENDED |
|
| RIC1 | Information provided on ipc code assigned before grant |
Ipc: G06V 10/82 20220101AFI20250610BHEP Ipc: G06V 10/98 20220101ALI20250610BHEP |
|
| INTG | Intention to grant announced |
Effective date: 20250701 |
|
| GRAS | Grant fee paid |
Free format text: ORIGINAL CODE: EPIDOSNIGR3 |
|
| GRAA | (expected) grant |
Free format text: ORIGINAL CODE: 0009210 |
|
| STAA | Information on the status of an ep patent application or granted ep patent |
Free format text: STATUS: THE PATENT HAS BEEN GRANTED |
|
| AK | Designated contracting states |
Kind code of ref document: B1 Designated state(s): AL AT BE BG CH CY CZ DE DK EE ES FI FR GB GR HR HU IE IS IT LI LT LU LV MC MK MT NL NO PL PT RO RS SE SI SK SM TR |
|
| REG | Reference to a national code |
Ref country code: CH Ref legal event code: F10 Free format text: ST27 STATUS EVENT CODE: U-0-0-F10-F00 (AS PROVIDED BY THE NATIONAL OFFICE) Effective date: 20251119 Ref country code: GB Ref legal event code: FG4D |
|
| REG | Reference to a national code |
Ref country code: DE Ref legal event code: R096 Ref document number: 602019078198 Country of ref document: DE |
|
| REG | Reference to a national code |
Ref country code: IE Ref legal event code: FG4D |
|
| U01 | Request for unitary effect filed |
Effective date: 20251210 |
|
| U07 | Unitary effect registered |
Designated state(s): AT BE BG DE DK EE FI FR IT LT LU LV MT NL PT RO SE SI Effective date: 20251217 |
|
| PG25 | Lapsed in a contracting state [announced via postgrant information from national office to epo] |
Ref country code: ES Free format text: LAPSE BECAUSE OF FAILURE TO SUBMIT A TRANSLATION OF THE DESCRIPTION OR TO PAY THE FEE WITHIN THE PRESCRIBED TIME-LIMIT Effective date: 20251119 |
|
| PG25 | Lapsed in a contracting state [announced via postgrant information from national office to epo] |
Ref country code: NO Free format text: LAPSE BECAUSE OF FAILURE TO SUBMIT A TRANSLATION OF THE DESCRIPTION OR TO PAY THE FEE WITHIN THE PRESCRIBED TIME-LIMIT Effective date: 20260219 |
|
| PG25 | Lapsed in a contracting state [announced via postgrant information from national office to epo] |
Ref country code: HR Free format text: LAPSE BECAUSE OF FAILURE TO SUBMIT A TRANSLATION OF THE DESCRIPTION OR TO PAY THE FEE WITHIN THE PRESCRIBED TIME-LIMIT Effective date: 20251119 |
|
| PG25 | Lapsed in a contracting state [announced via postgrant information from national office to epo] |
Ref country code: RS Free format text: LAPSE BECAUSE OF FAILURE TO SUBMIT A TRANSLATION OF THE DESCRIPTION OR TO PAY THE FEE WITHIN THE PRESCRIBED TIME-LIMIT Effective date: 20260219 |
|
| PG25 | Lapsed in a contracting state [announced via postgrant information from national office to epo] |
Ref country code: IS Free format text: LAPSE BECAUSE OF FAILURE TO SUBMIT A TRANSLATION OF THE DESCRIPTION OR TO PAY THE FEE WITHIN THE PRESCRIBED TIME-LIMIT Effective date: 20260319 |
|
| PG25 | Lapsed in a contracting state [announced via postgrant information from national office to epo] |
Ref country code: PL Free format text: LAPSE BECAUSE OF FAILURE TO SUBMIT A TRANSLATION OF THE DESCRIPTION OR TO PAY THE FEE WITHIN THE PRESCRIBED TIME-LIMIT Effective date: 20251119 |