EP3702778A1 - Method for relative quantitative analysis of polymer using maldi mass spectrometry - Google Patents
Method for relative quantitative analysis of polymer using maldi mass spectrometry Download PDFInfo
- Publication number
- EP3702778A1 EP3702778A1 EP19855631.8A EP19855631A EP3702778A1 EP 3702778 A1 EP3702778 A1 EP 3702778A1 EP 19855631 A EP19855631 A EP 19855631A EP 3702778 A1 EP3702778 A1 EP 3702778A1
- Authority
- EP
- European Patent Office
- Prior art keywords
- polymer
- sample
- specimen
- mask
- quantitative analysis
- Prior art date
- Legal status (The legal status is an assumption and is not a legal conclusion. Google has not performed a legal analysis and makes no representation as to the accuracy of the status listed.)
- Granted
Links
- 229920000642 polymer Polymers 0.000 title claims abstract description 221
- 238000000034 method Methods 0.000 title claims abstract description 49
- 238000004445 quantitative analysis Methods 0.000 title claims abstract description 33
- 238000004949 mass spectrometry Methods 0.000 title claims abstract description 15
- 238000001869 matrix assisted laser desorption--ionisation mass spectrum Methods 0.000 claims abstract description 53
- 239000011159 matrix material Substances 0.000 claims abstract description 48
- 238000011088 calibration curve Methods 0.000 claims abstract description 29
- 238000000816 matrix-assisted laser desorption--ionisation Methods 0.000 claims abstract description 19
- 230000001678 irradiating effect Effects 0.000 claims abstract description 10
- 239000000523 sample Substances 0.000 claims description 135
- 239000012488 sample solution Substances 0.000 claims description 34
- 229920001451 polypropylene glycol Polymers 0.000 claims description 30
- -1 poly(propylene glycol) Polymers 0.000 claims description 18
- 238000005507 spraying Methods 0.000 claims description 13
- 239000002904 solvent Substances 0.000 claims description 10
- 229910001220 stainless steel Inorganic materials 0.000 claims description 10
- 239000010935 stainless steel Substances 0.000 claims description 10
- 150000001875 compounds Chemical class 0.000 claims description 9
- 239000000203 mixture Substances 0.000 claims description 7
- 239000004205 dimethyl polysiloxane Substances 0.000 claims description 6
- 229920000435 poly(dimethylsiloxane) Polymers 0.000 claims description 6
- 229920001223 polyethylene glycol Polymers 0.000 claims description 6
- 238000007787 electrohydrodynamic spraying Methods 0.000 claims description 5
- XAGFODPZIPBFFR-UHFFFAOYSA-N aluminium Chemical compound [Al] XAGFODPZIPBFFR-UHFFFAOYSA-N 0.000 claims description 4
- 229910052782 aluminium Inorganic materials 0.000 claims description 4
- SWZOQAGVRGQLDV-UHFFFAOYSA-N 4-[2-(4-hydroxy-2,2,6,6-tetramethylpiperidin-1-yl)ethoxy]-4-oxobutanoic acid Chemical compound CC1(C)CC(O)CC(C)(C)N1CCOC(=O)CCC(O)=O SWZOQAGVRGQLDV-UHFFFAOYSA-N 0.000 claims description 3
- 239000004793 Polystyrene Substances 0.000 claims description 3
- 238000001228 spectrum Methods 0.000 abstract description 20
- 239000000243 solution Substances 0.000 description 28
- WYURNTSHIVDZCO-UHFFFAOYSA-N Tetrahydrofuran Chemical compound C1CCOC1 WYURNTSHIVDZCO-UHFFFAOYSA-N 0.000 description 19
- 239000007789 gas Substances 0.000 description 16
- OIASAVWSBWJWBR-UKTHLTGXSA-N trans-2-[3-(4-tert-butylphenyl)-2-methyl-2-propenylidene]malononitrile Chemical compound N#CC(C#N)=CC(/C)=C/C1=CC=C(C(C)(C)C)C=C1 OIASAVWSBWJWBR-UKTHLTGXSA-N 0.000 description 12
- YLQBMQCUIZJEEH-UHFFFAOYSA-N tetrahydrofuran Natural products C=1C=COC=1 YLQBMQCUIZJEEH-UHFFFAOYSA-N 0.000 description 9
- IJGRMHOSHXDMSA-UHFFFAOYSA-N Atomic nitrogen Chemical compound N#N IJGRMHOSHXDMSA-UHFFFAOYSA-N 0.000 description 8
- 150000002500 ions Chemical class 0.000 description 8
- 238000004519 manufacturing process Methods 0.000 description 7
- 238000002360 preparation method Methods 0.000 description 6
- 125000006850 spacer group Chemical group 0.000 description 5
- 238000002347 injection Methods 0.000 description 4
- 239000007924 injection Substances 0.000 description 4
- 239000000463 material Substances 0.000 description 4
- 238000012986 modification Methods 0.000 description 4
- 230000004048 modification Effects 0.000 description 4
- 230000000052 comparative effect Effects 0.000 description 3
- 238000009826 distribution Methods 0.000 description 3
- 230000000694 effects Effects 0.000 description 3
- 239000011521 glass Substances 0.000 description 3
- 238000003384 imaging method Methods 0.000 description 3
- 238000001840 matrix-assisted laser desorption--ionisation time-of-flight mass spectrometry Methods 0.000 description 3
- 229910052757 nitrogen Inorganic materials 0.000 description 3
- PCMORTLOPMLEFB-UHFFFAOYSA-N sinapinic acid Natural products COC1=CC(C=CC(O)=O)=CC(OC)=C1O PCMORTLOPMLEFB-UHFFFAOYSA-N 0.000 description 3
- 239000007921 spray Substances 0.000 description 3
- 239000013638 trimer Substances 0.000 description 3
- WXTMDXOMEHJXQO-UHFFFAOYSA-N 2,5-dihydroxybenzoic acid Chemical compound OC(=O)C1=CC(O)=CC=C1O WXTMDXOMEHJXQO-UHFFFAOYSA-N 0.000 description 2
- QGNCLSQOOODALH-UHFFFAOYSA-N 2-cyano-3-hydroxy-3-phenylprop-2-enoic acid Chemical compound OC(=O)C(C#N)=C(O)C1=CC=CC=C1 QGNCLSQOOODALH-UHFFFAOYSA-N 0.000 description 2
- HEDRZPFGACZZDS-UHFFFAOYSA-N Chloroform Chemical compound ClC(Cl)Cl HEDRZPFGACZZDS-UHFFFAOYSA-N 0.000 description 2
- CTQNGGLPUBDAKN-UHFFFAOYSA-N O-Xylene Chemical compound CC1=CC=CC=C1C CTQNGGLPUBDAKN-UHFFFAOYSA-N 0.000 description 2
- 238000004458 analytical method Methods 0.000 description 2
- 230000008901 benefit Effects 0.000 description 2
- 229910001873 dinitrogen Inorganic materials 0.000 description 2
- 238000011156 evaluation Methods 0.000 description 2
- 239000000178 monomer Substances 0.000 description 2
- 230000003287 optical effect Effects 0.000 description 2
- PCMORTLOPMLEFB-ONEGZZNKSA-N sinapic acid Chemical compound COC1=CC(\C=C\C(O)=O)=CC(OC)=C1O PCMORTLOPMLEFB-ONEGZZNKSA-N 0.000 description 2
- 239000008096 xylene Substances 0.000 description 2
- 0 CCC(C)(CC)OC1CC(C)(C)*(*)C(C)(C)C1 Chemical compound CCC(C)(CC)OC1CC(C)(C)*(*)C(C)(C)C1 0.000 description 1
- 230000008021 deposition Effects 0.000 description 1
- 238000001035 drying Methods 0.000 description 1
- 238000002474 experimental method Methods 0.000 description 1
- 239000012634 fragment Substances 0.000 description 1
- 238000010438 heat treatment Methods 0.000 description 1
- 239000003960 organic solvent Substances 0.000 description 1
- 239000002861 polymer material Substances 0.000 description 1
- 238000011002 quantification Methods 0.000 description 1
- UYCAUPASBSROMS-AWQJXPNKSA-M sodium;2,2,2-trifluoroacetate Chemical compound [Na+].[O-][13C](=O)[13C](F)(F)F UYCAUPASBSROMS-AWQJXPNKSA-M 0.000 description 1
- 230000003595 spectral effect Effects 0.000 description 1
- 239000012086 standard solution Substances 0.000 description 1
Images


Classifications
-
- G—PHYSICS
- G01—MEASURING; TESTING
- G01N—INVESTIGATING OR ANALYSING MATERIALS BY DETERMINING THEIR CHEMICAL OR PHYSICAL PROPERTIES
- G01N33/00—Investigating or analysing materials by specific methods not covered by groups G01N1/00 - G01N31/00
- G01N33/44—Resins; Plastics; Rubber; Leather
- G01N33/442—Resins; Plastics
-
- G—PHYSICS
- G01—MEASURING; TESTING
- G01N—INVESTIGATING OR ANALYSING MATERIALS BY DETERMINING THEIR CHEMICAL OR PHYSICAL PROPERTIES
- G01N27/00—Investigating or analysing materials by the use of electric, electrochemical, or magnetic means
- G01N27/62—Investigating or analysing materials by the use of electric, electrochemical, or magnetic means by investigating the ionisation of gases, e.g. aerosols; by investigating electric discharges, e.g. emission of cathode
- G01N27/64—Investigating or analysing materials by the use of electric, electrochemical, or magnetic means by investigating the ionisation of gases, e.g. aerosols; by investigating electric discharges, e.g. emission of cathode using wave or particle radiation to ionise a gas, e.g. in an ionisation chamber
-
- H—ELECTRICITY
- H01—ELECTRIC ELEMENTS
- H01J—ELECTRIC DISCHARGE TUBES OR DISCHARGE LAMPS
- H01J49/00—Particle spectrometers or separator tubes
- H01J49/0027—Methods for using particle spectrometers
- H01J49/0036—Step by step routines describing the handling of the data generated during a measurement
-
- H—ELECTRICITY
- H01—ELECTRIC ELEMENTS
- H01J—ELECTRIC DISCHARGE TUBES OR DISCHARGE LAMPS
- H01J49/00—Particle spectrometers or separator tubes
- H01J49/02—Details
- H01J49/10—Ion sources; Ion guns
- H01J49/16—Ion sources; Ion guns using surface ionisation, e.g. field-, thermionic- or photo-emission
- H01J49/161—Ion sources; Ion guns using surface ionisation, e.g. field-, thermionic- or photo-emission using photoionisation, e.g. by laser
- H01J49/164—Laser desorption/ionisation, e.g. matrix-assisted laser desorption/ionisation [MALDI]
Definitions
- the present invention relates to a method of relative quantitative analysis of a polymer using MALDI mass spectrometry, and more particularly, to a method of performing relative quantitative analysis by obtaining a MALDI spectrum for a polymer sample with a uniform thickness and preparing a quantitative calibration curve using the peak signal.
- Matrix-assisted laser desorption ionization is a technique that indirectly ionizes a specimen through a matrix, and is easy to use for mass spectrometry but difficult to use for quantitative analysis of polymer materials due to lack of spectrum reproducibility.
- the inventors have found that the thickness of the polymer specimen is a factor influencing the pattern of the MALDI spectrum, and have prepared a specimen having a uniform thickness by uniformly adjusting the thickness of the specimen through the electrospray applied with a mask (Korean Patent Application No. 10-2017-0130010, filed on October 11, 2017 , Applicant: LG Chem Co., Ltd.). All contents disclosed in the said patent document are incorporated as a part of this specification.
- the present inventors continued to study techniques for efficiently performing quantitative analysis of a polymer using a polymer specimen having a uniform thickness.
- the present inventors have found that a linear quantitative calibration curve can be obtained after attaining a reproducible MALDI mass spectrum from the polymer specimen having a uniform thickness by using the peaks of the materials appearing in the spectrum, thereby completing the present invention.
- an object of the present invention is to provide a method for relative quantitative analysis of a polymer comprising preparing polymer specimens having a uniform thickness made from polymer samples having various concentrations to obtain a reproducible MALDI mass spectrum and preparing a quantitative calibration curve by using peaks of the matrix or internal standard with the peak of the polymer sample appearing in the spectrum.
- a method for relative quantitative analysis of a polymer by MALDI mass spectrometry comprising the steps of:
- the polymer sample may comprise poly-(N- ⁇ -hydroxyethyl-2,2,6,6-tetramethyl-4-hydroxypiperidylsuccinate (Tinuvin 622), 2,2-bis(hydroxymethyl)butyric acid-poly(propylene glycol) (BHB-PPG), allylphenol-polydimethylsiloxane (AP-PDMS), H-polydimethylsiloxane (H-PDMS) or mixtures thereof.
- Teuvin 622 2,2-bis(hydroxymethyl)butyric acid-poly(propylene glycol)
- BHB-PPG 2,2-bis(hydroxymethyl)butyric acid-poly(propylene glycol)
- AP-PDMS allylphenol-polydimethylsiloxane
- H-PDMS H-polydimethylsiloxane
- the quantitative calibration curve may be prepared by calculating a signal intensity ratio of the polymer sample and the matrix from the peak result of the MALDI mass spectrum and plotting it according to the concentration of the polymer sample.
- the polymer specimen may be prepared by additionally adding an internal standard to the solution containing the polymer sample and the matrix.
- the quantitative calibration curve for the polymer specimen having the polymer sample and the matrix additionally added with the internal standard may be prepared by calculating a signal intensity ratio of the polymer sample and the internal standard from the MALDI mass spectrum obtained for the polymer specimen, and plotting it according to the concentration ratio of the polymer sample and the internal standard.
- the internal standard may be a polymer compound selected from poly(ethylene glycol) (PEG), poly(propylene glycol) (PPG), polystyrene (PS), and mixtures of two or more thereof.
- PEG poly(ethylene glycol)
- PPG poly(propylene glycol)
- PS polystyrene
- the preparing the polymer specimen by electrospray through the mask comprises the steps of (i) preparing an electrospray apparatus comprising a sample plate and an electrospray main nozzle and mounting a mask on the sample plate; and (ii) electrospraying a solution containing a polymer sample and a matrix onto the mask-mounted sample plate by the main nozzle, wherein the mask may comprise a hole through which the polymer sample solution electrosprayed from the main nozzle may pass onto the sample plate so as to obtain a polymer specimen having a small thickness variation on the sample plate.
- the electrospray may be performed after additionally adding an internal standard to the solution containing the polymer sample and the matrix.
- the diameter of the hole included in the mask may be 1 to 2 mm.
- the mask may be made of stainless steel or aluminum.
- the mounting of the mask on the sample plate may further comprise the step of adjusting the position of the mask in the direction of at least one of the x-axis, the y-axis and the z-axis.
- the electrospray apparatus may further comprise an auxiliary nozzle surrounding the main nozzle and coaxial with the main nozzle, and the electrospray of the polymer sample solution onto the sample plate by the main nozzle may further comprise the step of spraying a solvent by the auxiliary nozzle to prevent the matrix from being deposited around the main nozzle.
- the electrospray apparatus may further comprise a sheath gas supply pipe surrounding the auxiliary nozzle and coaxial with the auxiliary nozzle, and the electrospray of the polymer sample solution onto the sample plate by the main nozzle may further comprise the step of spraying a sheath gas from the sheath gas supply pipe to guide the solution so that the solution is sprayed to a predetermined position of the sample plate.
- the area where the polymer sample solution is electrosprayed on the sample plate may be 40 to 180 mm 2 , specifically 40 to 80 mm 2 .
- the polymer specimen may have a thickness in the range of 500 nm to 10 ⁇ m.
- the thickness variation of the polymer specimen may be 30% or less as measured at three or more spots on the same specimen (spot-to-spot).
- the relative standard deviation (RSD) range which indicates the error of the result of the MALDI mass spectrum measured on the polymer specimen, may be ⁇ 15% or less as measured at three or more spots on the same specimen (spot-to-spot).
- a uniform polymer specimen having a thickness variation of 30% or less is prepared by electrospray with a mask to obtain a reproducible MALDI mass spectrum and a quantitative calibration curve is prepared using a peak of a matrix or internal standard, thereby allowing for relative quantitative analysis of polymer samples having various concentrations.
- One embodiment of the invention relates to a method of relative quantitative analysis of a polymer using MALDI mass spectrometry, the method comprising the steps of preparing a polymer specimen (S1); obtaining a MALDI mass spectrum for the polymer specimen (S2); and preparing a quantitative calibration curve with a signal of a polymer sample from peak results of the MALDI mass spectrum (S3).
- a solution containing a polymer sample and a matrix is electrosprayed through a mask.
- the polymer specimen is prepared in plural with polymer samples having various concentrations, wherein the concentration of the matrix in each polymer specimen is constant.
- the polymer sample may be a polymer compound having a molecular weight of 1000 Da or more, such as 3000 to 4000 Da.
- the polymer sample has polydispersity.
- the polymer compound is a mixture of different molecular species having the same repeating unit but not the same molecular weight and the like, and such properties representing various molecular weight distributions are defined as polydipersity.
- the polymer samples have the same polydispersity means that the molecular weight distribution pattern is the same for two or more types of polymer samples which have polydispersity.
- the polymer sample in the present invention may comprise poly-(N- ⁇ -hydroxyethyl-2,2,6,6-tetramethyl-4-hydroxypiperidylsuccinate (Tinuvin 622), 2,2-bis(hydroxymethyl)butyric acid-poly(propylene glycol) (BHB-PPG), allylphenol-polydimethylsiloxane (AP-PDMS), H-polydimethylsiloxane (H-PDMS) or mixtures thereof.
- Teuvin 622 2,2-bis(hydroxymethyl)butyric acid-poly(propylene glycol)
- BHB-PPG 2,2-bis(hydroxymethyl)butyric acid-poly(propylene glycol)
- AP-PDMS allylphenol-polydimethylsiloxane
- H-PDMS H-polydimethylsiloxane
- the matrix used in preparing the polymer specimen refers to a material that absorbs energy from an energy source such as a laser and transfers the energy to the polymer sample to be analyzed, thereby heating and ionizing the polymer sample.
- the matrix is not particularly limited as long as it can detect a polymer sample, for example, DCTB (trans-2-[3-(4-tert-butylphenyl)-2-methyl-2-propenylidene]malononitrile), DHB (2,5-dihydroxybenzoic acid), CHCA ( ⁇ -cyano-hydroxycinnamic acid), SA (sinapic acid, 3,5-dimethoxy-4-hydroxycinnamic acid) and the like can be used.
- DCTB trans-2-[3-(4-tert-butylphenyl)-2-methyl-2-propenylidene]malononitrile
- DHB 2,5-dihydroxybenzoic acid
- CHCA ⁇ -cyano-hydroxycinnamic acid
- SA sinapic acid, 3,5-dimethoxy-4-hydroxycinnamic acid
- a polymer specimen may be prepared by additionally adding an internal standard to the solution including the polymer sample and the matrix.
- the internal standard is used for relatively quantitative analysis of polymer sample.
- “relative quantification” refers to quantifying the sample by adding a specific internal standard together with a polymer sample to prepare a polymer specimen, and measuring the relative value of the peak result of each sample to the peak result of the internal standard in the MALDI mass spectra of the specimens.
- the internal standard may be a polymer compound selected from poly(ethylene glycol) (PEG), poly(propylene glycol) (PPG), polystyrene (PS) and a mixture of two or more thereof.
- PEG poly(ethylene glycol)
- PPG poly(propylene glycol)
- PS polystyrene
- a polymer having the same main chain as the polymer sample but having a different terminal may be used as the internal standard.
- the polymer sample, the matrix and the internal standard may be used in the form of a solution dissolved in an organic solvent such as tetrahydrofuran (THF), xylene or chloroform, respectively, and the concentration thereof may be appropriately selected.
- the polymer sample may be used at each concentration within the range of 0.1 to 10 mg/ml in the specimen to be prepared.
- the matrix and the internal standard may be used at a constant concentration of 0.1 mg/ml and 10 mg/ml, respectively, in each specimen, but are not particularly limited thereto.
- the solution containing the polymer sample and the matrix, and optionally the internal standard as described above may be applied to a sample plate, for example, a stainless steel plate, to prepare a polymer specimen for MALDI mass spectrometry.
- the signal ratio of the sample to the matrix or to the internal standard in the MALDI mass spectrum depends on the temperature during the ion generation reaction by laser irradiation. Therefore, it is necessary to control the temperature of the ion generation reaction constantly. If the polymer specimen to be produced has a non-uniform thickness, the temperature may be not uniform when irradiating a laser to the specimen to cause the ion generation reaction, making it difficult to obtain a reproducible MALDI mass spectrum.
- Fig. 1 shows the difference in MALDI mass spectrum depending on the analysis position of the specimen for the specimen manufactured from the prior art. It can be found that from the results of MALDI spectra obtained from different positions the spectrum obtained from center of the specimen are different from the spectrum obtained from edge of the specimen. In other words, the spectra changes with tendency from center to edge of the specimen, and the spectra measured at similar positions show a relatively similar tendency.
- the spectra tend to coincide with each other when the temperature of the plume which is the vapor generated from the specimen by the laser pulses is the same, but the spectra tend to be different when the temperature of the plume is different.
- the result of Fig. 1 means that the temperature of the plume varies depending on the position in the specimen.
- the temperature of the plume is involved in the thickness of the specimen. As the thickness increases, the temperature of the plume tends to increase. Thus, from this general fact, it can be predicted that a factor affecting the MALDI spectrum pattern of polymer is the thickness of the specimen.
- Fig. 2 is a result showing the effect of the temperature change according to the thickness of the specimen on the ionization efficiency of the polymer. From the change in intensity of the spectrum according to the specimen position of the BHB-PPG + PPG sample in Fig. 2-1 ), it can be seen that the signal intensity ratio of the BHB-PPG to PPG is greater in the center than at the edge of the specimen. The cause of this can be predicted from the graph showing a change in Na+ binding energy according to the temperature.
- Fig. 2 is a graph illustrating a change in Na+ binding energy depending on the temperature. The lower the Na+ binding energy is, the higher the Na+ affinity is. Therefore, it can be predicted that the higher the temperature, the more ions generated by the BHB-PPG than the PPG. In the case of AP-PDMS + H-PDMS sample of Fig. 2-2 ), the experimental results can be sufficiently predicted by using the graph of Na+ binding energy according to the temperature.
- the temperature of the plume affects the ionization efficiency, and fluctuations in the temperature of the plume may result from differences in the specimen thickness, so that the specimen having a uniform thickness should be used in order to obtain a reproducible MALDI spectral result.
- the present invention uses an electrospray method using a mask to control the polymer specimen to have a small thickness variation at a plurality of spots in the manufacture of the polymer specimen, and specifically comprises the following steps:
- the electrospray may be performed by additionally adding an internal standard to the solution containing the polymer sample and the matrix in the step (ii).
- the mask may comprise a hole through which the polymer sample solution electrosprayed from the main nozzle may pass onto the sample plate so as to obtain a polymer specimen having a small thickness variation on the sample plate.
- the material of the mask is not particularly limited, but may be stainless steel or aluminum.
- the shape of the mask may also vary, including a rectangle, a circle, and the like, and the length of one side of the mask may be several cm in size.
- the length of one side may be 1 to 4 cm
- the diameter may be 1 to 4 cm.
- the holes provided in the mask may have a size of, for example, 1 to 2 mm in diameter.
- Electrospray through this mask is performed to spread the sample solution around the hole of the mask.
- the diameter of jetting hole for the sample solution may be 4 to 15 mm and the area in which the sample solution is sprayed may be in the range of 40 to 180 mm 2 , specifically 40 to 80 mm 2 . That is, the jetting area of the sample solution for electrospray according to the present invention is not limited to the size of the mask hole, but spraying may be carried out widely including the vicinity of the mask hole.
- the polymer sample solution passing through the hole may be applied on the sample plate with a uniform and thin thickness, and the solution not passing through the hole remains on the mask. If the jetting area is limited to the size of the mask hole, it may be difficult to produce a specimen of uniform thickness.
- the thickness of the polymer specimen manufactured by the spraying as described above may be 500 nm to 10 ⁇ m, such as 0.5 to 5 ⁇ m or 1 to 2 ⁇ m.
- a thickness range it is possible to maintain uniformity to minimize the thickness variation while ensuring a thickness capable of analyzing the polymer sample.
- the uniform polymer specimen may be manufactured by selecting only a portion having a small thickness variation from regions where the sample solution is sprayed onto the sample plate.
- the electrospray method generally has application to various fields from the viewpoint that the polymer sample can be sprayed and deposited more uniformly over a large area. Electrospray is easy to build a system because of the simple shape and structure of the nozzle, and very simple to produce droplets from hundreds of nanometers to tens of microns. In addition, since the droplets have a monodisperse distribution and the surface of the droplets are charged as well, there is the advantage that the droplets are hardly to bind to each other and thus easy to be controlled. In addition, it is possible to spray in a large area and to spray at atmospheric pressure. Also, it is possible to produce a specimen having more stable characteristics due to electrostatic effect.
- the nozzle portion 100 of the electrospray apparatus may comprise a main nozzle 110 for jetting a solution containing a polymer sample and a matrix, and optionally an additional internal standard, and an auxiliary nozzle 120 surrounding the main nozzle 110 and coaxial with the main nozzle 110, wherein the auxiliary nozzle 120 is adapted to spray a solvent (see Fig. 4a ).
- a main nozzle 110 for jetting a solution containing a polymer sample and a matrix and optionally an additional internal standard
- an auxiliary nozzle 120 surrounding the main nozzle 110 and coaxial with the main nozzle 110, wherein the auxiliary nozzle 120 is adapted to spray a solvent (see Fig. 4a ).
- a solid line arrow in the main nozzle 110 indicates a flow of a polymer sample sprayed from the main nozzle 110
- a dotted line arrow in the auxiliary nozzle 120 indicates a flow of a solvent sprayed from the auxiliary nozzle 120. That is, by additionally spraying the solvent from the auxiliary nozzle 120 surrounding the main nozzle 110 while spraying the polymer sample solution from the main nozzle 110, it is possible to prevent the phenomenon of the deposition of the matrix at the tip of the nozzle, which is a problem in the spraying process using the electrospray according to the prior art, thereby improving the reproducibility of electrospray of the polymer sample.
- Tetrahydrofuran (THF) may be used as the solvent to be sprayed through the auxiliary nozzle.
- the polymer sample solution electrosprayed from the main nozzle 110 is to be sprayed to a predetermined position.
- the inlet of the main nozzle 110 may protrude further toward the sample plate than the inlet of the auxiliary nozzle 120.
- the inlet of the main nozzle 110 may protrude about 1 mm to 2 mm toward the sample plate than the inlet of the auxiliary nozzle 120.
- the amount of solvent to be sprayed from the auxiliary nozzle 120 may be, for example, 30 to 60% of the amount of solvent sprayed from the main nozzle 110.
- a sheath gas is also sprayed to around the polymer sample when the polymer sample is sprayed from the main nozzle 110, so that the sheath gas guides the polymer sample to be sprayed to a predetermined position.
- the thick arrow in the sheath gas supply pipe 130 indicates the sheath gas sprayed from the sheath gas supply pipe 130.
- the solvent is sprayed from the auxiliary nozzle 120 surrounding the main nozzle 110 or the sheath gas is sprayed from the sheath gas supply pipe 130 surrounding the auxiliary nozzle 120 and coaxial with the auxiliary nozzle 120 to around the sample solution to be sprayed, while spraying the sample solution from the main nozzle 110. Accordingly, the sample solution electrosprayed from the main nozzle 110 can be sprayed to a predetermined position on the sample plate.
- Fig. 4b shows that the sample solution is loaded at a predetermined position when the sheath gas is used. For example, reproducibility was confirmed by repeating electrospray 10 times at 2 cm intervals,
- the mask position adjusting unit 300 may be used together with the mask 200 in the manufacture of the polymer specimen. That is, when the polymer sample solution is electrosprayed on the sample plate placed on the sample stage 210, the mask 200 is placed on the sample plate for electrospray so that only a portion having a small variation in thickness can be selected as a specimen from the regions where the polymer sample is sprayed on the sample plate placed on the sample stage 210. In addition, since the mask 200 is mounted in the mask position adjusting unit 300, the position of the mask 200 on the sample plate may be adjusted by the mask position adjusting unit 300.
- the center of the mask 200 includes a hole 200a that generally corresponds to the size of the specimen corresponding to the portion having the desired thickness variation. Samples that do not pass through the hole 200a among the samples to be electrosprayed remain on the mask 200.
- the mask 200 according to Fig. 4c is mounted on the sample plate with the improved reproducibility of the electrospray of the polymer sample as described with reference to Fig. 4a , the polymer sample to be electrosprayed may pass through the hole 200a of the mask 200 and be placed on the sample plate to produce a specimen having a desired thickness variation.
- Fig. 5 illustrates a process of manufacturing a specimen having a thickness of 1 ⁇ m by selecting a center of the specimen from a widely sprayed area using a mask according to an exemplary embodiment of the present invention. Through this process, a sample having a thickness variation of 30% or less, for example 25%, finally remains on the sample stage 210.
- the mask 200 may be made of stainless steel, aluminum, or the like and may have a rectangular or circular shape, and in addition various materials and shapes are possible.
- the length of one side may be 1 to 4 cm
- the diameter may be 1 to 4 cm.
- the diameter of hole 200a may be, for example, 1 to 2 mm.
- the mask position adjusting unit 300 may comprise a mask holder 310 on which the mask 200 can be mounted.
- the mask holder 310 may further comprise an opening 310a, in which the mask 200 may be mounted and the mounted mask 200 may move on one axis direction (e.g., y-axis).
- the opening 310a may have, for example, a rectangular shape and the width of one side of the rectangle of the opening 310a may match the width of the mask 200.
- the width of the other side of the opening 310a is larger than the width of the mask 200 so that the mask 200 mounted in the opening 310a can be moved and mounted.
- Both edges of the opening 310a may include a convex portion 310b, and thus the mask 200 may be placed on the convex portion 310b of the opening 310a.
- the mask position adjusting unit 300 comprises a linear motion rail 320 extending perpendicular to the length direction of the mask holder 310, and the mask holder 310 may be mounted to a mounting portion 320a of the linear motion rail 320.
- the mask holder 310 is fixed to the mounting portion 320a by, for example, a bolt, and can move on the x-axis on the rail portion 320b of the linear motion rail 320.
- the rail portion 320b may further comprise a ruler (see Fig. 4d ) to display how much the mask holder 310, that is, the mask 300 which is mounted on the mask holder 310 moves on the x-axis.
- the mask 300 may move in the y-axis direction within the opening 310a of the mask holder 310, as described above.
- the mask position adjusting unit 300 may adjust the height of the mask holder 310 in the z-axis direction (the direction perpendicular to the upper surface of the sample stage 210).
- various plates such as a stainless steel plate and an ITO glass may be used. Therefore, the height (the height in the z-axis) of the mask holder 310, i.e., the height of the mask 300 which is mounted on the mask holder 310 needs to be adjusted according to the height of the plate.
- a spacer 330 for adjusting the height of the mask holder 310 may be disposed between the mask holder 310 and the mounting portion 320a.
- a plurality of spacer may be provided and the number of spacers may be increased from 0 (zero) until the corresponding height is reached.
- each spacer having a height corresponding to the plate may be provided.
- the present invention is not limited to the above, and various modifications and changes are possible.
- the mask position adjusting unit 300 may further comprise a fixing unit 340 for fixing the mask holder 310 to the linear motion rail 320.
- the mask 200 is used as shown in Figs. 4b to 4c so that only a portion having a small thickness variation of 30% or less can be selected as a specimen from the regions where the polymer sample is widely sprayed on the sample plate.
- the movement in the z-axis direction of the mask holder 310 on which the mask 200 is mounted is controlled by the spacer 330 between the mask holder 310 and the linear motion rail 320
- the movement in the x-axis direction of the mask holder 310 on which the mask 200 is mounted is controlled by the linear motion rail 320
- the mask 200 may be moved in the y-axis direction within the opening 310a of the mask holder 310.
- the method of adjusting the position of the mask as described above is an embodiment of the method for manufacturing a specimen using the mask of the present invention.
- the present invention is not limited to the above, and various modifications and changes are possible with respect to the method of adjusting the position of the mask.
- the electrospray device 10 used in one embodiment of the present invention may further comprise a sample injection adjusting unit (not shown), and the sample injection adjusting unit may specifically comprises a pump 30a for adjusting the injection amount of the polymer sample supplied to the main nozzle 110 and a pump 30b for adjusting the injection amount of the solvent supplied to the auxiliary nozzle 120.
- the amount of the sheath gas supplied to the sheath gas supply pipe 130 may be adjusted by a sheath gas adjusting unit (not shown).
- polymer specimens having a uniform thickness of 30% or less, such as 25% or less, obtained by electrospray through a mask can be prepared.
- the polymer specimen thus prepared can be applied to commercial MALDI-TOF MS equipment to obtain a reproducible MALDI spectrum with an error of ⁇ 30% or less, for example, ⁇ 15% or less, thereby enabling quantitative analysis of the polymer sample.
- the MALDI mass spectrum is obtained by irradiating a laser to each of the plurality of polymer specimens having a small thickness variation, and the signal intensity ratio of the polymer sample to the matrix or the signal intensity ratio of the polymer sample to the internal standard are calculated from the peak results of the spectrum.
- the laser is a means for applying energy to the polymer specimen, and in particular, it may be a nitrogen laser or Nd: YAG laser.
- a plurality of ion spectra may be obtained by irradiating to a single spot of the specimen many times, or irradiating to a plurality of spots of the specimen.
- the MALDI mass spectrum may be obtained for several spots, for example, 20 to 80 spots at 50 to 2000 shots per spot of the specimen and thereafter an average value may be determined.
- experiments may be performed 3 times or more on specimens with the same conditions.
- a data acquisition process using Imaging S/W may be performed to obtain a MALDI mass spectrum.
- Imaging S/W e.g., Fleximaging, Bruker Daltonics, Germany
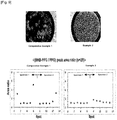
- Fig. 6 shows a data acquisition process from the MALDI mass spectrum obtained for the specimen manufactured according to one embodiment of the invention.
- a polymer specimen having a uniform thickness was produced by electrospray of the polymer sample through a mask, and spectrum data were collected using Imaging S/W for a plurality of spots in the same specimen, to determine an average value. It is found that a reproducible spectrum can be obtained at all spots.
- Data of the MALDI mass spectrum obtained by the above process may have a value of RSD (relative standard deviation) indicating an error of ⁇ 30% or less.
- RSD relative standard deviation
- a reproducible MALDI mass spectrum can be obtained in which an error may be ⁇ 15% or less when measured for three or more spots on the same specimen (spot-to-spot) and an error may be ⁇ 30% or less even when measured for three or more specimens manufactured under the same conditions (sample-to-sample).
- the ions appearing in the MALDI mass spectrum are a protonated polymer sample, a protonated matrix, a protonated internal standard and fragment products occurred in the ion source. Therefore, the peak pattern of the MALDI mass spectrum is determined by the number of ion, signal ratio and the like.
- a quantitative calibration curve may be prepared by plotting the signal intensity ratio calculated above.
- the quantitative calibration curve of the polymer specimen containing the polymer sample and the matrix may be prepared by plotting a signal intensity ratio of the polymer sample and the matrix from the MALDI mass spectrum obtained for the specimen according to the concentration of the polymer sample.
- the quantitative calibration curve of the polymer specimen additionally containing the internal standard together with the polymer sample and the matrix may be prepared by calculating the signal intensity ratio of the polymer sample and the internal standard from the MALDI mass spectrum obtained for the specimen and plotting it according to the concentration ratio of the polymer sample and the internal standard.
- the RSD (relative standard deviation) of each point in the calibration curve according to the present invention may be ⁇ 15% or less.
- Step 1 Preparation of polymer specimen
- a solution having Tinuvin® 622 (manufactured by BASF) dissolved in xylene as a polymer compound to be analyzed was prepared at each concentration of 0.1 mg/mL, 0.5 mg/mL, 1 mg/mL and 3 mg/mL.
- the said solution, a solution of DCTB (trans-2-[3-(4-tert-butylphenyl)-2-methyl-2-propenylidene]malononitrile) (10 mg/mL THF) as a matrix and a solution of NaTFA (sodium trifluoroacetate) (0.02 M in THF) were mixed in a volume ratio of 9:1:1 to prepare a polymer sample solution.
- the polymer compound solution was used for each concentration to prepare a plurality of polymer sample solutions.
- the plurality of polymer sample solutions prepared above were electrosprayed using the electrospray apparatus 10 and the mask 200 having a hole with a diameter of 2 mm in Fig. 4c , respectively, to prepare a plurality of polymer specimens.
- the polymer sample was electrosprayed for 10 minutes at a flow rate of 0.5 ⁇ L/min (1 st flow) on a stainless steel plate, and the thickness of the electrosprayed specimen was measured.
- the stainless steel plate has a rough surface such that it is not suitable to measure the thickness of the specimen. Therefore, in order to measure the thickness of the electrosprayed specimen, the polymer sample solution was again electrosprayed for 10 minutes at a flow rate of 0.5 ⁇ L/min (1 st flow) on an ITO glass, and then the thickness of the specimen was measured at 2 ⁇ m intervals using an optical profiler.
- the average thickness for the measured thickness profiles was about 1 ⁇ m (see Fig. 5 ).
- the spot size of the MALDI laser is 50 ⁇ m
- the standard deviation of the average of the 25 measured values was measured, and as a result the thickness variation was about 25%.
- Step 2 Obtainment of MALDI mass spectrum
- MALDI mass spectrometry was performed by irradiating with 337 nm nitrogen laser (MNL100, Lasertechnik Berlin, Berlin, Germany) to 20 spots at 2000 shots per spot for each polymer specimen manufactured in the step 1.
- Such mass spectrometry was performed in triplicate for each polymer specimen (i.e., for each concentration of polymer sample) to obtain a MALDI mass spectrum.
- a calibration curve was prepared by plotting signal intensity ratios of the Tinuvin® 622 and DCTB dimer peak or DCTB trimer peak calculated in the step 2 according to the concentration of Tinuvin® 622, and the results are shown in Fig. 7 .
- Step 1 Preparation of polymer specimen
- a solution having BHB-PPG dissolved in THF (tetrahydrofuran) as a polymer compound to be analyzed was prepared at each concentration of 0.1 mg/mL, 1 mg/mL, 2 mg/mL, 5 mg/mL and 10 mg/mL.
- a solution having PPG dissolved in THF (0.5 mg/mL) as an internal standard, a solution having DCTB (trans-2-[3-(4-tert-butylphenyl)-2-methyl-2-propenylidene]malononitrile) dissolved in THF (10 mg/mL) as a matrix and a solution of NaTFA (0.02 M in THF) were prepared.
- the matrix solution, the NaTFA solution, the polymer solution, and the internal standard solution were mixed in 9/1/0.5/0.5 (v/v/v/v). At this time, the polymer compound solution was used for each concentration to prepare a plurality of polymer sample solutions.
- the plurality of polymer sample solutions prepared above were electrosprayed using the electrospray apparatus 10 and the mask 200 having a hole with a diameter of 2 mm in Fig. 4c , respectively, to prepare a plurality of polymer specimens.
- the polymer sample was electrosprayed for 10 minutes at a flow rate of 0.5 ⁇ L/min (1 st flow) on a stainless steel plate, and the thickness of the electrosprayed specimen was measured.
- the stainless steel plate has a rough surface such that it is not suitable to measure the thickness of the specimen. Therefore, in order to measure the thickness of the electrosprayed specimen, the polymer sample solution was again electrosprayed for 10 minutes at a flow rate of 0.5 ⁇ L/min (1 st flow) on an ITO glass, and then the thickness of the specimen was measured at 2 ⁇ m intervals using an optical profiler.
- the average thickness for the measured thickness profiles was about 1 ⁇ m. Assuming that the spot size of the MALDI laser is 50 ⁇ m, the standard deviation of the average of the 25 measured values was measured, and as a result the thickness variation was about 25%.
- Step 2 Obtainment of MALDI mass spectrum
- MALDI mass spectrometry was performed by irradiating with 337 nm nitrogen laser (MNL100, Lasertechnik Berlin, Berlin, Germany) to 40 spots at 50 shots per spot (total 2000 shots) for each polymer specimen manufactured in the step 1.
- Imaging S/W Feximaging, Bruker Daltonics, Germany was used to collect the MALDI spectrum (see Fig. 6 ).
- Such mass spectrometry was performed in triplicate for each polymer specimen (i.e., for each concentration of polymer sample) to obtain a MALDI mass spectrum.
- a calibration curve was prepared by plotting signal intensity ratios of BHB-PPG and PPG calculated in the step 2 according to the concentration ratio of BHB-PPG to PPG, and the results are shown in Figs. 8a to 8c .
- Fig. 9 shows a result of the reproducibility evaluation of the MALDI mass spectrum for the specimens prepared in Example 2 and Comparative Example 1. It is found that the reproducibility of the spectrum is higher for the specimen of Example 2 prepared using the electrospray and the mask.
Landscapes
- Chemical & Material Sciences (AREA)
- Physics & Mathematics (AREA)
- Health & Medical Sciences (AREA)
- Analytical Chemistry (AREA)
- Life Sciences & Earth Sciences (AREA)
- General Health & Medical Sciences (AREA)
- Biochemistry (AREA)
- Pathology (AREA)
- Immunology (AREA)
- General Physics & Mathematics (AREA)
- Optics & Photonics (AREA)
- Engineering & Computer Science (AREA)
- Electrochemistry (AREA)
- Chemical Kinetics & Catalysis (AREA)
- Toxicology (AREA)
- Plasma & Fusion (AREA)
- Food Science & Technology (AREA)
- Medicinal Chemistry (AREA)
- Other Investigation Or Analysis Of Materials By Electrical Means (AREA)
Abstract
Description
- This application claims the benefit of priorities from Korean Patent Application Nos.
10-2018-0102447, filed on August 30, 2018 10-2019-0040021, filed on April 5, 2019 - The present invention relates to a method of relative quantitative analysis of a polymer using MALDI mass spectrometry, and more particularly, to a method of performing relative quantitative analysis by obtaining a MALDI spectrum for a polymer sample with a uniform thickness and preparing a quantitative calibration curve using the peak signal.
- Matrix-assisted laser desorption ionization (MALDI) is a technique that indirectly ionizes a specimen through a matrix, and is easy to use for mass spectrometry but difficult to use for quantitative analysis of polymer materials due to lack of spectrum reproducibility.
- Nevertheless, techniques for quantitative analysis of specimens using MALDI mass spectrometry have been developed. For example, it has been reported that if a spectrum is prepared by maintaining the temperature of a plume which is a vapor generated from a specimen by laser pulse in MALDI constant, the reproducibility of the spectrum can be attained and a quantitative calibration curve can be obtained, which allows for quantitative analysis.
- Meanwhile, the inventors have found that the thickness of the polymer specimen is a factor influencing the pattern of the MALDI spectrum, and have prepared a specimen having a uniform thickness by uniformly adjusting the thickness of the specimen through the electrospray applied with a mask (Korean Patent Application No.
10-2017-0130010, filed on October 11, 2017 - Furthermore, the present inventors continued to study techniques for efficiently performing quantitative analysis of a polymer using a polymer specimen having a uniform thickness. Thus, the present inventors have found that a linear quantitative calibration curve can be obtained after attaining a reproducible MALDI mass spectrum from the polymer specimen having a uniform thickness by using the peaks of the materials appearing in the spectrum, thereby completing the present invention.
- Accordingly, an object of the present invention is to provide a method for relative quantitative analysis of a polymer comprising preparing polymer specimens having a uniform thickness made from polymer samples having various concentrations to obtain a reproducible MALDI mass spectrum and preparing a quantitative calibration curve by using peaks of the matrix or internal standard with the peak of the polymer sample appearing in the spectrum.
- According to one aspect of the present invention, there is provided a method for relative quantitative analysis of a polymer by MALDI mass spectrometry, comprising the steps of:
- (S1) preparing a plurality of polymer specimens having a thickness variation of 30% or less by electrospray of a solution containing a polymer sample and a matrix through a mask for each concentration of the polymer sample;
- (S2) obtaining a MALDI mass spectrum by irradiating a laser to each of the plurality of polymer specimens; and
- (S3) preparing a quantitative calibration curve with a signal of a polymer sample from peak results of the MALDI mass spectrum.
- The polymer sample may comprise poly-(N-β-hydroxyethyl-2,2,6,6-tetramethyl-4-hydroxypiperidylsuccinate (Tinuvin 622), 2,2-bis(hydroxymethyl)butyric acid-poly(propylene glycol) (BHB-PPG), allylphenol-polydimethylsiloxane (AP-PDMS), H-polydimethylsiloxane (H-PDMS) or mixtures thereof.
- The quantitative calibration curve may be prepared by calculating a signal intensity ratio of the polymer sample and the matrix from the peak result of the MALDI mass spectrum and plotting it according to the concentration of the polymer sample.
- In the step (S1), the polymer specimen may be prepared by additionally adding an internal standard to the solution containing the polymer sample and the matrix. In this case, the quantitative calibration curve for the polymer specimen having the polymer sample and the matrix additionally added with the internal standard may be prepared by calculating a signal intensity ratio of the polymer sample and the internal standard from the MALDI mass spectrum obtained for the polymer specimen, and plotting it according to the concentration ratio of the polymer sample and the internal standard.
- The internal standard may be a polymer compound selected from poly(ethylene glycol) (PEG), poly(propylene glycol) (PPG), polystyrene (PS), and mixtures of two or more thereof.
- The preparing the polymer specimen by electrospray through the mask comprises the steps of (i) preparing an electrospray apparatus comprising a sample plate and an electrospray main nozzle and mounting a mask on the sample plate; and (ii) electrospraying a solution containing a polymer sample and a matrix onto the mask-mounted sample plate by the main nozzle, wherein the mask may comprise a hole through which the polymer sample solution electrosprayed from the main nozzle may pass onto the sample plate so as to obtain a polymer specimen having a small thickness variation on the sample plate.
- In the step (ii), the electrospray may be performed after additionally adding an internal standard to the solution containing the polymer sample and the matrix.
- The diameter of the hole included in the mask may be 1 to 2 mm. In addition, the mask may be made of stainless steel or aluminum.
- The mounting of the mask on the sample plate may further comprise the step of adjusting the position of the mask in the direction of at least one of the x-axis, the y-axis and the z-axis.
- The electrospray apparatus may further comprise an auxiliary nozzle surrounding the main nozzle and coaxial with the main nozzle, and the electrospray of the polymer sample solution onto the sample plate by the main nozzle may further comprise the step of spraying a solvent by the auxiliary nozzle to prevent the matrix from being deposited around the main nozzle.
- In addition, the electrospray apparatus may further comprise a sheath gas supply pipe surrounding the auxiliary nozzle and coaxial with the auxiliary nozzle, and the electrospray of the polymer sample solution onto the sample plate by the main nozzle may further comprise the step of spraying a sheath gas from the sheath gas supply pipe to guide the solution so that the solution is sprayed to a predetermined position of the sample plate.
- The area where the polymer sample solution is electrosprayed on the sample plate may be 40 to 180 mm2, specifically 40 to 80 mm2.
- The polymer specimen may have a thickness in the range of 500 nm to 10 µm.
- The thickness variation of the polymer specimen may be 30% or less as measured at three or more spots on the same specimen (spot-to-spot).
- The relative standard deviation (RSD) range, which indicates the error of the result of the MALDI mass spectrum measured on the polymer specimen, may be ± 15% or less as measured at three or more spots on the same specimen (spot-to-spot).
- According to the present invention, a uniform polymer specimen having a thickness variation of 30% or less is prepared by electrospray with a mask to obtain a reproducible MALDI mass spectrum and a quantitative calibration curve is prepared using a peak of a matrix or internal standard, thereby allowing for relative quantitative analysis of polymer samples having various concentrations.
-
-
Fig. 1 shows the difference in MALDI mass spectrum depending on the analysis position of the specimen for the specimen prepared from the prior art. -
Fig. 2 shows the difference in MALDI mass spectrum depending on the thickness of the specimen and the difference in ionization efficiency depending on the temperature of the plume. -
Fig. 3 shows a phenomenon that the matrix is deposited at the tip of the nozzle in the spraying process using the electrospray of the prior art. -
Figs. 4a to 4d schematically illustrate an electrospray apparatus with a mask for manufacturing a polymer specimen according to one embodiment of the present invention and an application process thereof. -
Fig. 5 illustrates a process of manufacturing a specimen having a thickness of 1 µm by selecting a center of the specimen from a wide area sprayed using a mask according to one embodiment of the present invention. -
Fig. 6 shows a data acquisition process from MALDI mass spectrum obtained for the specimen manufactured according to one embodiment of the invention. -
Fig. 7 shows a quantitative calibration curve prepared by plotting the signal intensity ratio of the polymer sample and the matrix according to the concentration of the polymer sample, from the results of the MALDI mass spectrum obtained for the polymer specimen manufactured according to Example 1. -
Figs. 8a to 8c are quantitative calibration curves prepared by plotting the signal intensity ratio of the polymer sample and the internal standard according to the concentration ratio of the polymer sample and the internal standard, from the results of the MALDI mass spectrum obtained for the polymer sample prepared according to Example 2 (wherein n represents the repeating unit of the monomer). -
Fig. 9 is a result showing the reproducibility evaluation of the MALDI mass spectrum for the specimen manufactured by electrospray through the mask according to Example 2, and the specimen manufactured by the natural drying method according to Comparative Example 1. - Since various modifications and variations can be made in the present invention, particular embodiments are illustrated in the drawings and will be described in detail in the detailed description. It should be understood, however, that the invention is not intended to be limited to the particular embodiments, but includes all modifications, equivalents, and alternatives falling within the spirit and scope of the invention.
- One embodiment of the invention relates to a method of relative quantitative analysis of a polymer using MALDI mass spectrometry, the method comprising the steps of preparing a polymer specimen (S1); obtaining a MALDI mass spectrum for the polymer specimen (S2); and preparing a quantitative calibration curve with a signal of a polymer sample from peak results of the MALDI mass spectrum (S3).
- Hereinafter, specific steps of the method will be described in detail with reference to the accompanying drawings.
- In the present invention, to prepare a polymer specimen for performing MALDI mass spectrometry, a solution containing a polymer sample and a matrix is electrosprayed through a mask. At this time, the polymer specimen is prepared in plural with polymer samples having various concentrations, wherein the concentration of the matrix in each polymer specimen is constant.
- In one embodiment of the invention, the polymer sample may be a polymer compound having a molecular weight of 1000 Da or more, such as 3000 to 4000 Da. In addition, the polymer sample has polydispersity. In the present specification, the polymer compound is a mixture of different molecular species having the same repeating unit but not the same molecular weight and the like, and such properties representing various molecular weight distributions are defined as polydipersity. In addition, the polymer samples have the same polydispersity means that the molecular weight distribution pattern is the same for two or more types of polymer samples which have polydispersity.
- The polymer sample in the present invention may comprise poly-(N-β-hydroxyethyl-2,2,6,6-tetramethyl-4-hydroxypiperidylsuccinate (Tinuvin 622), 2,2-bis(hydroxymethyl)butyric acid-poly(propylene glycol) (BHB-PPG), allylphenol-polydimethylsiloxane (AP-PDMS), H-polydimethylsiloxane (H-PDMS) or mixtures thereof.
- The matrix used in preparing the polymer specimen refers to a material that absorbs energy from an energy source such as a laser and transfers the energy to the polymer sample to be analyzed, thereby heating and ionizing the polymer sample.
- The matrix is not particularly limited as long as it can detect a polymer sample, for example, DCTB (trans-2-[3-(4-tert-butylphenyl)-2-methyl-2-propenylidene]malononitrile), DHB (2,5-dihydroxybenzoic acid), CHCA (α-cyano-hydroxycinnamic acid), SA (sinapic acid, 3,5-dimethoxy-4-hydroxycinnamic acid) and the like can be used.
- In addition, a polymer specimen may be prepared by additionally adding an internal standard to the solution including the polymer sample and the matrix.
- The internal standard is used for relatively quantitative analysis of polymer sample. Here, "relative quantification" refers to quantifying the sample by adding a specific internal standard together with a polymer sample to prepare a polymer specimen, and measuring the relative value of the peak result of each sample to the peak result of the internal standard in the MALDI mass spectra of the specimens.
- The internal standard may be a polymer compound selected from poly(ethylene glycol) (PEG), poly(propylene glycol) (PPG), polystyrene (PS) and a mixture of two or more thereof. In addition, a polymer having the same main chain as the polymer sample but having a different terminal may be used as the internal standard.
- The polymer sample, the matrix and the internal standard may be used in the form of a solution dissolved in an organic solvent such as tetrahydrofuran (THF), xylene or chloroform, respectively, and the concentration thereof may be appropriately selected. For example, the polymer sample may be used at each concentration within the range of 0.1 to 10 mg/ml in the specimen to be prepared. In addition, the matrix and the internal standard may be used at a constant concentration of 0.1 mg/ml and 10 mg/ml, respectively, in each specimen, but are not particularly limited thereto.
- The solution containing the polymer sample and the matrix, and optionally the internal standard as described above may be applied to a sample plate, for example, a stainless steel plate, to prepare a polymer specimen for MALDI mass spectrometry.
- Meanwhile, the signal ratio of the sample to the matrix or to the internal standard in the MALDI mass spectrum depends on the temperature during the ion generation reaction by laser irradiation. Therefore, it is necessary to control the temperature of the ion generation reaction constantly. If the polymer specimen to be produced has a non-uniform thickness, the temperature may be not uniform when irradiating a laser to the specimen to cause the ion generation reaction, making it difficult to obtain a reproducible MALDI mass spectrum.
- For example,
Fig. 1 shows the difference in MALDI mass spectrum depending on the analysis position of the specimen for the specimen manufactured from the prior art. It can be found that from the results of MALDI spectra obtained from different positions the spectrum obtained from center of the specimen are different from the spectrum obtained from edge of the specimen. In other words, the spectra changes with tendency from center to edge of the specimen, and the spectra measured at similar positions show a relatively similar tendency. - In MALDI, the spectra tend to coincide with each other when the temperature of the plume which is the vapor generated from the specimen by the laser pulses is the same, but the spectra tend to be different when the temperature of the plume is different. Thus, the result of
Fig. 1 means that the temperature of the plume varies depending on the position in the specimen. - In addition, the temperature of the plume is involved in the thickness of the specimen. As the thickness increases, the temperature of the plume tends to increase. Thus, from this general fact, it can be predicted that a factor affecting the MALDI spectrum pattern of polymer is the thickness of the specimen.
-
Fig. 2 is a result showing the effect of the temperature change according to the thickness of the specimen on the ionization efficiency of the polymer. From the change in intensity of the spectrum according to the specimen position of the BHB-PPG + PPG sample inFig. 2-1 ), it can be seen that the signal intensity ratio of the BHB-PPG to PPG is greater in the center than at the edge of the specimen. The cause of this can be predicted from the graph showing a change in Na+ binding energy according to the temperature.Fig. 2 is a graph illustrating a change in Na+ binding energy depending on the temperature. The lower the Na+ binding energy is, the higher the Na+ affinity is. Therefore, it can be predicted that the higher the temperature, the more ions generated by the BHB-PPG than the PPG. In the case of AP-PDMS + H-PDMS sample ofFig. 2-2 ), the experimental results can be sufficiently predicted by using the graph of Na+ binding energy according to the temperature. - As such, the temperature of the plume affects the ionization efficiency, and fluctuations in the temperature of the plume may result from differences in the specimen thickness, so that the specimen having a uniform thickness should be used in order to obtain a reproducible MALDI spectral result.
- Therefore, the present invention uses an electrospray method using a mask to control the polymer specimen to have a small thickness variation at a plurality of spots in the manufacture of the polymer specimen, and specifically comprises the following steps:
- (i) preparing an electrospray apparatus comprising a sample plate and an electrospray main nozzle and mounting a mask on the sample plate; and
- (ii) electrospraying a solution containing a polymer sample and a matrix (hereinafter referred to as "polymer sample solution" or "sample solution") onto the mask-mounted sample plate by the main nozzle.
- In addition, according to an embodiment of the present invention, the electrospray may be performed by additionally adding an internal standard to the solution containing the polymer sample and the matrix in the step (ii).
- The mask may comprise a hole through which the polymer sample solution electrosprayed from the main nozzle may pass onto the sample plate so as to obtain a polymer specimen having a small thickness variation on the sample plate.
- The material of the mask is not particularly limited, but may be stainless steel or aluminum. In addition, the shape of the mask may also vary, including a rectangle, a circle, and the like, and the length of one side of the mask may be several cm in size. For example, when the mask has a rectangular shape, the length of one side may be 1 to 4 cm, and when the mask has a circular shape, the diameter may be 1 to 4 cm. In this case, the holes provided in the mask may have a size of, for example, 1 to 2 mm in diameter.
- Electrospray through this mask is performed to spread the sample solution around the hole of the mask. For example, the diameter of jetting hole for the sample solution may be 4 to 15 mm and the area in which the sample solution is sprayed may be in the range of 40 to 180 mm2, specifically 40 to 80 mm2. That is, the jetting area of the sample solution for electrospray according to the present invention is not limited to the size of the mask hole, but spraying may be carried out widely including the vicinity of the mask hole.
- In this manner, the polymer sample solution passing through the hole may be applied on the sample plate with a uniform and thin thickness, and the solution not passing through the hole remains on the mask. If the jetting area is limited to the size of the mask hole, it may be difficult to produce a specimen of uniform thickness.
- In one embodiment of the present invention, the thickness of the polymer specimen manufactured by the spraying as described above may be 500 nm to 10 µm, such as 0.5 to 5 µm or 1 to 2 µm. When satisfying such a thickness range, it is possible to maintain uniformity to minimize the thickness variation while ensuring a thickness capable of analyzing the polymer sample.
- As such, the uniform polymer specimen may be manufactured by selecting only a portion having a small thickness variation from regions where the sample solution is sprayed onto the sample plate.
- The electrospray method generally has application to various fields from the viewpoint that the polymer sample can be sprayed and deposited more uniformly over a large area. Electrospray is easy to build a system because of the simple shape and structure of the nozzle, and very simple to produce droplets from hundreds of nanometers to tens of microns. In addition, since the droplets have a monodisperse distribution and the surface of the droplets are charged as well, there is the advantage that the droplets are hardly to bind to each other and thus easy to be controlled. In addition, it is possible to spray in a large area and to spray at atmospheric pressure. Also, it is possible to produce a specimen having more stable characteristics due to electrostatic effect.
- However, when spraying a solution containing a polymer sample and a matrix and, optionally, an additional internal standard in a spraying process using a general electrospray, a phenomenon may occur in which the matrix is deposited at the tip of the nozzle (see
Fig. 3 ). Due to the matrix deposited at the tip of the nozzle, there was a problem that the reproducibility of the electrospray of the sample was inferior. In other words, due to the matrix deposited at the tip of the nozzle, it was difficult for the sample to be sprayed to a certain position. - This problem may be overcome by using an auxiliary nozzle together with the main nozzle. For example, as can be seen in the electrospray apparatus used in the embodiment of the present invention of
Figs. 4a to 4d and its application process, thenozzle portion 100 of the electrospray apparatus may comprise amain nozzle 110 for jetting a solution containing a polymer sample and a matrix, and optionally an additional internal standard, and anauxiliary nozzle 120 surrounding themain nozzle 110 and coaxial with themain nozzle 110, wherein theauxiliary nozzle 120 is adapted to spray a solvent (seeFig. 4a ). InFig. 4a , a solid line arrow in themain nozzle 110 indicates a flow of a polymer sample sprayed from themain nozzle 110, and a dotted line arrow in theauxiliary nozzle 120 indicates a flow of a solvent sprayed from theauxiliary nozzle 120. That is, by additionally spraying the solvent from theauxiliary nozzle 120 surrounding themain nozzle 110 while spraying the polymer sample solution from themain nozzle 110, it is possible to prevent the phenomenon of the deposition of the matrix at the tip of the nozzle, which is a problem in the spraying process using the electrospray according to the prior art, thereby improving the reproducibility of electrospray of the polymer sample. Tetrahydrofuran (THF) may be used as the solvent to be sprayed through the auxiliary nozzle. - In addition, the polymer sample solution electrosprayed from the
main nozzle 110 is to be sprayed to a predetermined position. The inlet of themain nozzle 110 may protrude further toward the sample plate than the inlet of theauxiliary nozzle 120. For example, the inlet of themain nozzle 110 may protrude about 1 mm to 2 mm toward the sample plate than the inlet of theauxiliary nozzle 120. The amount of solvent to be sprayed from theauxiliary nozzle 120 may be, for example, 30 to 60% of the amount of solvent sprayed from themain nozzle 110. - Additionally or alternatively, by providing a sheath
gas supply pipe 130 surrounding theauxiliary nozzle 120 and coaxial with theauxiliary nozzle 120, a sheath gas is also sprayed to around the polymer sample when the polymer sample is sprayed from themain nozzle 110, so that the sheath gas guides the polymer sample to be sprayed to a predetermined position. InFig. 4a , the thick arrow in the sheathgas supply pipe 130 indicates the sheath gas sprayed from the sheathgas supply pipe 130. Thereby, the reproducibility of the electrospray of a polymer sample can be improved. As the sheath gas, for example, nitrogen gas (N2) may be used. For example, nitrogen gas may be released at 100 to 1000 cc/min, and in one embodiment 1000 cc/min. - As described above, in the present invention, the solvent is sprayed from the
auxiliary nozzle 120 surrounding themain nozzle 110 or the sheath gas is sprayed from the sheathgas supply pipe 130 surrounding theauxiliary nozzle 120 and coaxial with theauxiliary nozzle 120 to around the sample solution to be sprayed, while spraying the sample solution from themain nozzle 110. Accordingly, the sample solution electrosprayed from themain nozzle 110 can be sprayed to a predetermined position on the sample plate. -
Fig. 4b shows that the sample solution is loaded at a predetermined position when the sheath gas is used. For example, reproducibility was confirmed by repeatingelectrospray 10 times at 2 cm intervals, - In addition, referring to
Fig. 4c , in one embodiment of the present invention, the maskposition adjusting unit 300 may be used together with themask 200 in the manufacture of the polymer specimen. That is, when the polymer sample solution is electrosprayed on the sample plate placed on thesample stage 210, themask 200 is placed on the sample plate for electrospray so that only a portion having a small variation in thickness can be selected as a specimen from the regions where the polymer sample is sprayed on the sample plate placed on thesample stage 210. In addition, since themask 200 is mounted in the maskposition adjusting unit 300, the position of themask 200 on the sample plate may be adjusted by the maskposition adjusting unit 300. - The center of the
mask 200 includes ahole 200a that generally corresponds to the size of the specimen corresponding to the portion having the desired thickness variation. Samples that do not pass through thehole 200a among the samples to be electrosprayed remain on themask 200. When themask 200 according toFig. 4c is mounted on the sample plate with the improved reproducibility of the electrospray of the polymer sample as described with reference toFig. 4a , the polymer sample to be electrosprayed may pass through thehole 200a of themask 200 and be placed on the sample plate to produce a specimen having a desired thickness variation. -
Fig. 5 illustrates a process of manufacturing a specimen having a thickness of 1 µm by selecting a center of the specimen from a widely sprayed area using a mask according to an exemplary embodiment of the present invention. Through this process, a sample having a thickness variation of 30% or less, for example 25%, finally remains on thesample stage 210. - As described above, the
mask 200 may be made of stainless steel, aluminum, or the like and may have a rectangular or circular shape, and in addition various materials and shapes are possible. For example, when themask 200 has a rectangular shape, the length of one side may be 1 to 4 cm, and when themask 200 has a circular shape, the diameter may be 1 to 4 cm. In this case, the diameter ofhole 200a may be, for example, 1 to 2 mm. - In addition, referring to
Fig. 4d , the maskposition adjusting unit 300 may comprise amask holder 310 on which themask 200 can be mounted. - In one embodiment of the present invention, the
mask holder 310 may further comprise anopening 310a, in which themask 200 may be mounted and the mountedmask 200 may move on one axis direction (e.g., y-axis). Theopening 310a may have, for example, a rectangular shape and the width of one side of the rectangle of theopening 310a may match the width of themask 200. The width of the other side of theopening 310a is larger than the width of themask 200 so that themask 200 mounted in theopening 310a can be moved and mounted. Both edges of theopening 310a may include aconvex portion 310b, and thus themask 200 may be placed on theconvex portion 310b of theopening 310a. - The mask
position adjusting unit 300 comprises alinear motion rail 320 extending perpendicular to the length direction of themask holder 310, and themask holder 310 may be mounted to a mountingportion 320a of thelinear motion rail 320. Themask holder 310 is fixed to the mountingportion 320a by, for example, a bolt, and can move on the x-axis on therail portion 320b of thelinear motion rail 320. Therail portion 320b may further comprise a ruler (seeFig. 4d ) to display how much themask holder 310, that is, themask 300 which is mounted on themask holder 310 moves on the x-axis. - If the
mask holder 310 moves in the x-axis direction on thelinear motion rail 320, themask 300 may move in the y-axis direction within theopening 310a of themask holder 310, as described above. In addition, the maskposition adjusting unit 300 may adjust the height of themask holder 310 in the z-axis direction (the direction perpendicular to the upper surface of the sample stage 210). As the plate on which the specimen is placed, various plates such as a stainless steel plate and an ITO glass may be used. Therefore, the height (the height in the z-axis) of themask holder 310, i.e., the height of themask 300 which is mounted on themask holder 310 needs to be adjusted according to the height of the plate. When themask holder 310 is mounted on the mountingportion 320a of thelinear motion rail 320, aspacer 330 for adjusting the height of themask holder 310 may be disposed between themask holder 310 and the mountingportion 320a. For example, a plurality of spacer may be provided and the number of spacers may be increased from 0 (zero) until the corresponding height is reached. Alternatively, each spacer having a height corresponding to the plate may be provided. The present invention is not limited to the above, and various modifications and changes are possible. - In addition, in one embodiment of the present invention, the mask
position adjusting unit 300 may further comprise afixing unit 340 for fixing themask holder 310 to thelinear motion rail 320. - As described above, according to the process for manufacturing the polymer specimen according to the embodiment of the present invention, when the polymer sample solution is electrosprayed on the sample plate placed on the
sample stage 210, themask 200 is used as shown inFigs. 4b to 4c so that only a portion having a small thickness variation of 30% or less can be selected as a specimen from the regions where the polymer sample is widely sprayed on the sample plate. In order to adjust the position of themask 200, the movement in the z-axis direction of themask holder 310 on which themask 200 is mounted is controlled by thespacer 330 between themask holder 310 and thelinear motion rail 320, the movement in the x-axis direction of themask holder 310 on which themask 200 is mounted is controlled by thelinear motion rail 320, and themask 200 may be moved in the y-axis direction within theopening 310a of themask holder 310. However, the method of adjusting the position of the mask as described above is an embodiment of the method for manufacturing a specimen using the mask of the present invention. The present invention is not limited to the above, and various modifications and changes are possible with respect to the method of adjusting the position of the mask. - In addition, the
electrospray device 10 used in one embodiment of the present invention may further comprise a sample injection adjusting unit (not shown), and the sample injection adjusting unit may specifically comprises a pump 30a for adjusting the injection amount of the polymer sample supplied to themain nozzle 110 and a pump 30b for adjusting the injection amount of the solvent supplied to theauxiliary nozzle 120. In addition, the amount of the sheath gas supplied to the sheathgas supply pipe 130 may be adjusted by a sheath gas adjusting unit (not shown). - As described above, according to the present invention, polymer specimens having a uniform thickness of 30% or less, such as 25% or less, obtained by electrospray through a mask can be prepared. The polymer specimen thus prepared can be applied to commercial MALDI-TOF MS equipment to obtain a reproducible MALDI spectrum with an error of ± 30% or less, for example, ± 15% or less, thereby enabling quantitative analysis of the polymer sample.
- The MALDI mass spectrum is obtained by irradiating a laser to each of the plurality of polymer specimens having a small thickness variation, and the signal intensity ratio of the polymer sample to the matrix or the signal intensity ratio of the polymer sample to the internal standard are calculated from the peak results of the spectrum.
- The laser is a means for applying energy to the polymer specimen, and in particular, it may be a nitrogen laser or Nd: YAG laser.
- When irradiating the laser to the specimen, a plurality of ion spectra may be obtained by irradiating to a single spot of the specimen many times, or irradiating to a plurality of spots of the specimen. For example, in order to obtain a spectrum having a good S/N ratio (signal-to-noise ratio), the MALDI mass spectrum may be obtained for several spots, for example, 20 to 80 spots at 50 to 2000 shots per spot of the specimen and thereafter an average value may be determined. In addition, experiments may be performed 3 times or more on specimens with the same conditions.
- According to an embodiment of the present invention, a data acquisition process using Imaging S/W (e.g., Fleximaging, Bruker Daltonics, Germany) may be performed to obtain a MALDI mass spectrum.
-
Fig. 6 shows a data acquisition process from the MALDI mass spectrum obtained for the specimen manufactured according to one embodiment of the invention. Referring toFig. 6 , a polymer specimen having a uniform thickness was produced by electrospray of the polymer sample through a mask, and spectrum data were collected using Imaging S/W for a plurality of spots in the same specimen, to determine an average value. It is found that a reproducible spectrum can be obtained at all spots. - Data of the MALDI mass spectrum obtained by the above process may have a value of RSD (relative standard deviation) indicating an error of ±30% or less. For example, a reproducible MALDI mass spectrum can be obtained in which an error may be ± 15% or less when measured for three or more spots on the same specimen (spot-to-spot) and an error may be ± 30% or less even when measured for three or more specimens manufactured under the same conditions (sample-to-sample).
- The ions appearing in the MALDI mass spectrum are a protonated polymer sample, a protonated matrix, a protonated internal standard and fragment products occurred in the ion source. Therefore, the peak pattern of the MALDI mass spectrum is determined by the number of ion, signal ratio and the like.
- In order to quantify the polymer using the MALDI mass spectrum obtained for the polymer specimen according to the present invention, a quantitative calibration curve may be prepared by plotting the signal intensity ratio calculated above.
- For example, the quantitative calibration curve of the polymer specimen containing the polymer sample and the matrix may be prepared by plotting a signal intensity ratio of the polymer sample and the matrix from the MALDI mass spectrum obtained for the specimen according to the concentration of the polymer sample.
- The quantitative calibration curve of the polymer specimen additionally containing the internal standard together with the polymer sample and the matrix may be prepared by calculating the signal intensity ratio of the polymer sample and the internal standard from the MALDI mass spectrum obtained for the specimen and plotting it according to the concentration ratio of the polymer sample and the internal standard.
- All the calibration curves prepared according to one embodiment of the present invention appear linearity (R2 ≧ 0.98, see
Figs. 7 and8 ). - In addition, the RSD (relative standard deviation) of each point in the calibration curve according to the present invention may be ± 15% or less.
- Hereinafter, embodiments of the present invention will be described in detail so that those skilled in the art can easily carry out the present invention. The present invention may, however, be embodied in many different forms and should not be construed as limited to the embodiments set forth herein.
- A solution having Tinuvin® 622 (manufactured by BASF) dissolved in xylene as a polymer compound to be analyzed was prepared at each concentration of 0.1 mg/mL, 0.5 mg/mL, 1 mg/mL and 3 mg/mL. The said solution, a solution of DCTB (trans-2-[3-(4-tert-butylphenyl)-2-methyl-2-propenylidene]malononitrile) (10 mg/mL THF) as a matrix and a solution of NaTFA (sodium trifluoroacetate) (0.02 M in THF) were mixed in a volume ratio of 9:1:1 to prepare a polymer sample solution. At this time, the polymer compound solution was used for each concentration to prepare a plurality of polymer sample solutions.

- The plurality of polymer sample solutions prepared above were electrosprayed using the
electrospray apparatus 10 and themask 200 having a hole with a diameter of 2 mm inFig. 4c , respectively, to prepare a plurality of polymer specimens. - Specifically, the polymer sample was electrosprayed for 10 minutes at a flow rate of 0.5 µL/min (1st flow) on a stainless steel plate, and the thickness of the electrosprayed specimen was measured. However, the stainless steel plate has a rough surface such that it is not suitable to measure the thickness of the specimen. Therefore, in order to measure the thickness of the electrosprayed specimen, the polymer sample solution was again electrosprayed for 10 minutes at a flow rate of 0.5 µL/min (1st flow) on an ITO glass, and then the thickness of the specimen was measured at 2 µm intervals using an optical profiler. The average thickness for the measured thickness profiles was about 1 µm (see
Fig. 5 ). - In addition, assuming that the spot size of the MALDI laser is 50 µm, the standard deviation of the average of the 25 measured values was measured, and as a result the thickness variation was about 25%.
- Using a MALDI-TOF mass spectrometer (UltrafleXtreme, Bruker Daltonics, Germany), MALDI mass spectrometry was performed by irradiating with 337 nm nitrogen laser (MNL100, Lasertechnik Berlin, Berlin, Germany) to 20 spots at 2000 shots per spot for each polymer specimen manufactured in the
step 1. - Such mass spectrometry was performed in triplicate for each polymer specimen (i.e., for each concentration of polymer sample) to obtain a MALDI mass spectrum.
- Subsequently, signal intensity ratios were calculated and averaged using the signals of
Tinuvin® 622 as a polymer and the signals of the DCTB dimer peak and DCTB trimer peak as a matrix. - A calibration curve was prepared by plotting signal intensity ratios of the
Tinuvin® 622 and DCTB dimer peak or DCTB trimer peak calculated in thestep 2 according to the concentration ofTinuvin® 622, and the results are shown inFig. 7 . - As can be seen from
Fig. 7 , using the signals ofTinuvin® 622 and the signals of the DCTB dimer peak (Fig. 7A ) and DCTB trimer peak as a matrix (Fig. 7B ) from the spectra obtained by performing MALDI on the uniform polymer specimen with a small thickness variation of 25%, a linear calibration curve (R2 = 0.08 or more) having RSD (relative standard deviation) of each point within 15% was obtained. - A solution having BHB-PPG dissolved in THF (tetrahydrofuran) as a polymer compound to be analyzed was prepared at each concentration of 0.1 mg/mL, 1 mg/mL, 2 mg/mL, 5 mg/mL and 10 mg/mL. A solution having PPG dissolved in THF (0.5 mg/mL) as an internal standard, a solution having DCTB (trans-2-[3-(4-tert-butylphenyl)-2-methyl-2-propenylidene]malononitrile) dissolved in THF (10 mg/mL) as a matrix and a solution of NaTFA (0.02 M in THF) were prepared.
- The matrix solution, the NaTFA solution, the polymer solution, and the internal standard solution were mixed in 9/1/0.5/0.5 (v/v/v/v). At this time, the polymer compound solution was used for each concentration to prepare a plurality of polymer sample solutions.

- The plurality of polymer sample solutions prepared above were electrosprayed using the
electrospray apparatus 10 and themask 200 having a hole with a diameter of 2 mm inFig. 4c , respectively, to prepare a plurality of polymer specimens. - Specifically, the polymer sample was electrosprayed for 10 minutes at a flow rate of 0.5 µL/min (1st flow) on a stainless steel plate, and the thickness of the electrosprayed specimen was measured. However, the stainless steel plate has a rough surface such that it is not suitable to measure the thickness of the specimen. Therefore, in order to measure the thickness of the electrosprayed specimen, the polymer sample solution was again electrosprayed for 10 minutes at a flow rate of 0.5 µL/min (1st flow) on an ITO glass, and then the thickness of the specimen was measured at 2 µm intervals using an optical profiler. The average thickness for the measured thickness profiles was about 1 µm. Assuming that the spot size of the MALDI laser is 50 µm, the standard deviation of the average of the 25 measured values was measured, and as a result the thickness variation was about 25%.
- Using a MALDI-TOF mass spectrometer (UltrafleXtreme, Bruker Daltonics, Germany), MALDI mass spectrometry was performed by irradiating with 337 nm nitrogen laser (MNL100, Lasertechnik Berlin, Berlin, Germany) to 40 spots at 50 shots per spot (total 2000 shots) for each polymer specimen manufactured in the
step 1. Imaging S/W (Fleximaging, Bruker Daltonics, Germany) was used to collect the MALDI spectrum (seeFig. 6 ). - Such mass spectrometry was performed in triplicate for each polymer specimen (i.e., for each concentration of polymer sample) to obtain a MALDI mass spectrum.
- Subsequently, signal intensity ratios of the polymer sample (BHB-PPG) and the internal standard (PPG) were calculated and averaged.
- A calibration curve was prepared by plotting signal intensity ratios of BHB-PPG and PPG calculated in the
step 2 according to the concentration ratio of BHB-PPG to PPG, and the results are shown inFigs. 8a to 8c . -
Figs. 8a to 8c are linear calibration curves prepared using polymer peaks having the number of repeating unit of the monomer of n = 27, n = 33 and n = 38 in MALDI mass spectra obtained for each concentration of BHB-PPG/PPG. It is found that a linear calibration curve can be obtained for any of polymer peaks having any number of repeating units. In addition, it is found that RSD (relative standard deviation) of the average value of the MALDI spectrum for BHB-PPG/PPG is within 13%, which means that reproducibility is very high. - Using the polymer sample solution prepared in the
step 1 of Example 2, two specimens were prepared by a dried droplet method, and MALDI mass spectrometry was performed at 6 spots for each of the prepared specimens. -
Fig. 9 shows a result of the reproducibility evaluation of the MALDI mass spectrum for the specimens prepared in Example 2 and Comparative Example 1. It is found that the reproducibility of the spectrum is higher for the specimen of Example 2 prepared using the electrospray and the mask.
Claims (18)
- A method for relative quantitative analysis of a polymer by MALDI mass spectrometry, comprising the steps of:(S1) preparing a plurality of polymer specimens having a thickness variation of 30% or less by electrospray of a solution containing a polymer sample and a matrix through a mask for each concentration of the polymer sample;(S2) obtaining a MALDI mass spectrum by irradiating a laser to each of the plurality of polymer specimens; and(S3) preparing a quantitative calibration curve with a signal of a polymer sample from peak results of the MALDI mass spectrum.
- The method for relative quantitative analysis of a polymer according to claim 1, wherein the polymer sample comprises poly-(N-β-hydroxyethyl-2,2,6,6-tetramethyl-4-hydroxypiperidylsuccinate (Tinuvin 622), 2,2-bis(hydroxymethyl)butyric acid-poly(propylene glycol) (BHB-PPG), allylphenol-polydimethylsiloxane (AP-PDMS), H-polydimethylsiloxane (H-PDMS) or mixtures thereof.
- The method for relative quantitative analysis of a polymer according to claim 1, wherein the quantitative calibration curve is prepared by calculating a signal intensity ratio of the polymer sample and the matrix from the peak results of the MALDI mass spectrum and plotting it according to the concentration of the polymer sample.
- The method for relative quantitative analysis of a polymer according to claim 1, wherein in the step (S1), the polymer specimen is prepared by additionally adding an internal standard to the solution containing the polymer sample and the matrix.
- The method for relative quantitative analysis of a polymer according to claim 4, wherein the quantitative calibration curve for the polymer specimen having the polymer sample and the matrix additionally added with the internal standard is prepared by calculating a signal intensity ratio of the polymer sample and the internal standard from the MALDI mass spectrum obtained for the polymer specimen, and plotting it according to the concentration ratio of the polymer sample and the internal standard.
- The method for relative quantitative analysis of a polymer according to claim 4, wherein the internal standard is a polymer compound selected from poly(ethylene glycol) (PEG), poly(propylene glycol) (PPG), polystyrene (PS), and mixtures of two or more thereof.
- The method for relative quantitative analysis of a polymer according to claim 1, wherein the preparing the polymer specimen by electrospray through the mask comprises the steps of:(i) preparing an electrospray apparatus comprising a sample plate and an electrospray main nozzle and mounting the mask on the sample plate; and(ii) electrospraying the solution containing the polymer sample and the matrix onto the mask-mounted sample plate by the main nozzle,
wherein the mask comprises a hole through which the polymer sample solution electrosprayed from the main nozzle passes onto the sample plate so as to obtain a polymer specimen having a small thickness variation on the sample plate. - The method for relative quantitative analysis of a polymer according to claim 7, wherein in the step (ii), the electrospray is performed after additionally adding an internal standard to the solution containing the polymer sample and the matrix.
- The method for relative quantitative analysis of a polymer according to claim 7, wherein the diameter of the hole in the mask is 1 to 2 mm.
- The method for relative quantitative analysis of a polymer according to claim 7, wherein the mask is made of stainless steel or aluminum.
- The method for relative quantitative analysis of a polymer according to claim 7, wherein the mounting of the mask on the sample plate further comprises the step of adjusting the position of the mask in the direction of at least one of the x-axis, the y-axis and the z-axis.
- The method for relative quantitative analysis of a polymer according to claim 7, wherein the electrospray apparatus further comprises an auxiliary nozzle surrounding the main nozzle and coaxial with the main nozzle, and the electrospraying the polymer sample solution onto the sample plate by the main nozzle further comprises the step of spraying a solvent by the auxiliary nozzle to prevent the matrix from being deposited around the main nozzle.
- The method for relative quantitative analysis of a polymer according to claim 12, wherein the electrospray apparatus further comprises a sheath gas supply pipe surrounding the auxiliary nozzle and coaxial with the auxiliary nozzle, and the electrospraying the polymer sample solution onto the sample plate by the main nozzle further comprises the step of spraying a sheath gas from the sheath gas supply pipe to guide the solution so that the solution is sprayed to a predetermined position of the sample plate.
- The method for relative quantitative analysis of a polymer according to claim 7, wherein the area where the polymer sample solution is electrosprayed on the sample plate is 40 to 180 mm2.
- The method for relative quantitative analysis of a polymer according to claim 14, wherein the area where the polymer sample solution is electrosprayed on the sample plate is 40 to 80 mm2.
- The method for relative quantitative analysis of a polymer according to claim 1, wherein the polymer specimen has a thickness in the range of 500 nm to 10 µm.
- The method for relative quantitative analysis of a polymer according to claim 1, wherein the thickness variation of the polymer specimen is 30% or less as measured at three or more spots on the same specimen (spot-to-spot).
- The method for relative quantitative analysis of a polymer according to claim 1, wherein the relative standard deviation (RSD) range, which indicates the error of the result of the MALDI mass spectrum measured on the polymer specimen, is ± 15% or less as measured at three or more spots on the same specimen (spot-to-spot).
Applications Claiming Priority (3)
| Application Number | Priority Date | Filing Date | Title |
|---|---|---|---|
| KR20180102447 | 2018-08-30 | ||
| KR1020190040021A KR102362175B1 (en) | 2018-08-30 | 2019-04-05 | Method for relative quantitatification of polymers using maldi spectrtrometry |
| PCT/KR2019/008610 WO2020045821A1 (en) | 2018-08-30 | 2019-07-12 | Method for relative quantitative analysis of polymer using maldi mass spectrometry |
Publications (3)
| Publication Number | Publication Date |
|---|---|
| EP3702778A1 true EP3702778A1 (en) | 2020-09-02 |
| EP3702778A4 EP3702778A4 (en) | 2021-01-20 |
| EP3702778B1 EP3702778B1 (en) | 2023-03-22 |
Family
ID=69800868
Family Applications (1)
| Application Number | Title | Priority Date | Filing Date |
|---|---|---|---|
| EP19855631.8A Active EP3702778B1 (en) | 2018-08-30 | 2019-07-12 | Method for relative quantitative analysis of polymer using maldi mass spectrometry |
Country Status (5)
| Country | Link |
|---|---|
| US (1) | US11255818B2 (en) |
| EP (1) | EP3702778B1 (en) |
| JP (1) | JP7056837B2 (en) |
| KR (1) | KR102362175B1 (en) |
| CN (1) | CN111386463B (en) |
Family Cites Families (38)
| Publication number | Priority date | Publication date | Assignee | Title |
|---|---|---|---|---|
| GB2235528B (en) | 1989-08-23 | 1993-07-28 | Finnigan Mat Ltd | Method of preparing samples for laser spectrometry analysis |
| US6918309B2 (en) * | 2001-01-17 | 2005-07-19 | Irm Llc | Sample deposition method and system |
| WO2003040715A1 (en) | 2001-11-05 | 2003-05-15 | Irm, Llc. | Sample preparation methods for maldi mass spectrometry |
| US20040119010A1 (en) | 2002-11-01 | 2004-06-24 | The Regents Of The University Of Colorado | Quantitative analysis of protein isoforms using matrix-assisted laser desorption/ionization time of flight mass spectrometry |
| US6891156B2 (en) * | 2003-04-30 | 2005-05-10 | Perkin Elmer Instruments Llc | Sample plate for matrix-assisted laser desorption and ionization mass spectrometry |
| US7095018B2 (en) * | 2004-12-29 | 2006-08-22 | Wisconsin Alumni Research Foundation | Deposition of samples and sample matrix for enhancing the sensitivity of matrix assisted laser desorption/ionization mass spectrometry |
| JP2006226717A (en) | 2005-02-15 | 2006-08-31 | Shiseido Co Ltd | Quantification method of nonionic surfactant |
| JP2007263896A (en) | 2006-03-29 | 2007-10-11 | Univ Nagoya | Biological marker for estimating post-operative prediction of lung cancer patient, and method therefor |
| WO2008129850A1 (en) | 2007-04-12 | 2008-10-30 | Shimadzu Corporation | Ion trap mass spectrograph |
| CN102326073B (en) | 2009-03-05 | 2013-11-13 | 株式会社日立高新技术 | Analysis apparatus |
| JP2012032279A (en) | 2010-07-30 | 2012-02-16 | System Instruments Kk | Biopolymer analysis method and biopolymer recognition board |
| JP2012230801A (en) | 2011-04-26 | 2012-11-22 | Shimadzu Corp | Maldi mass spectrometry device |
| GB2493179B (en) * | 2011-07-26 | 2018-09-05 | Kratos Analytical Ltd | MALDI sample preparation methods and targets |
| CN102337341B (en) * | 2011-10-21 | 2014-01-08 | 马庆伟 | MALDI-TOF (Matrix-assisted laser desorption/ionization-Time-of-flight) mass spectrum double internal standard and quantitative detecting method thereof |
| CN103245717A (en) * | 2012-02-10 | 2013-08-14 | 华中师范大学 | High-pressure formed substrate film assisted laser desorption dissociation mass spectrum quantitative analysis method |
| EP2876434A4 (en) * | 2012-07-17 | 2016-05-04 | Snu R&Db Foundation | Method for improving mass spectrum reproducibility and quantitative analysis method using same |
| WO2014107043A1 (en) * | 2013-01-03 | 2014-07-10 | 서울대학교 산학협력단 | Method for obtaining mass spectrum of ions generated at constant temperature by measuring total ion count, and use of matrix for quantitative analysis using maldi mass spectrometry |
| US9349578B2 (en) * | 2013-01-03 | 2016-05-24 | Asta Co., Ltd. | Quantitative analysis method using mass spectrometry wherein laser pulse energy is adjusted |
| KR101434092B1 (en) | 2013-03-08 | 2014-08-26 | 성균관대학교산학협력단 | Apparatus for forming patterns |
| US9305756B2 (en) * | 2013-03-13 | 2016-04-05 | Agena Bioscience, Inc. | Preparation enhancements and methods of use for MALDI mass spectrometry |
| CN103901093B (en) * | 2014-03-13 | 2017-01-04 | 华东理工大学 | Prepare the alternate micro-array chip of hydrophobe and the method for mass spectrum imaging quantitative analysis thereof |
| CN104237175A (en) * | 2014-08-28 | 2014-12-24 | 中国科学院近代物理研究所 | Analyzer for synchronously measuring in-situ laser mass spectrum and light spectrum |
| CZ2014631A3 (en) | 2014-09-16 | 2016-03-30 | Petr Novák | Modification method of surfaces with proteins for preconcentration of analyte for desorption-ionization techniques of mass spectrometry and immunochemical assays |
| JP6264275B2 (en) | 2014-12-12 | 2018-01-24 | 株式会社島津製作所 | Matrix film forming equipment |
| CN104851774B (en) * | 2015-05-22 | 2017-02-01 | 华中师范大学 | Micro-fluidic three-dimensional focusing technology based nitrogen purging high-resolution mass spectrum electrospray ionization source and mass spectrum detection method |
| CN104897835B (en) * | 2015-05-28 | 2017-07-07 | 江南大学 | A kind of method that utilization UPLC Q TOF/MS technologies quickly determine Oligoguluronic Acids |
| CZ2015405A3 (en) | 2015-06-16 | 2016-12-28 | Petr Novák | Affinity board for determining haptoglobin phenotype, kit in which the affinity board is comprised and method of determining haptoglobin phenotype using the affinity boards in combination with mass spectrometry desorption-ionization techniques |
| KR101746535B1 (en) | 2015-07-27 | 2017-06-13 | 서강대학교산학협력단 | Quantitative Analysis for Oligomers in Polymer using MALDI-TOF Mass analysis |
| KR101752656B1 (en) * | 2015-08-17 | 2017-07-03 | 연세대학교 산학협력단 | Sample plate using MALDI-TOF mass spectrometer and manufacturing method of the sample plate |
| CN105223264B (en) * | 2015-09-21 | 2017-12-29 | 广东联捷生物科技有限公司 | A kind of simulation internal standard method, apparatus of mass spectrum quantitative analysis and application |
| CN107501591B (en) * | 2016-06-14 | 2020-07-24 | 中国石油化工股份有限公司 | Preparation and application of bisphenol A molecularly imprinted polymer membrane |
| CN105973974B (en) * | 2016-07-21 | 2019-01-11 | 浙江大学 | A kind of detection method of the MALDI-TOF-MS of polythiocarbonates class compound |
| KR101777105B1 (en) * | 2017-01-13 | 2017-09-11 | 서강대학교산학협력단 | Quantitative Analysis for Oligomers in Polymer using MALDI-TOF Mass analysis |
| CN108387634A (en) * | 2017-03-01 | 2018-08-10 | 北京毅新博创生物科技有限公司 | Mass spectrum substrate and preparation method and purposes |
| KR102180624B1 (en) * | 2017-10-11 | 2020-11-18 | 주식회사 엘지화학 | Method for quantitative analysis of polymer using maldi mass spectrometry and method of manufacturing a sample for quantitative analysis of polymer using maldi mass spectrometry |
| CN107884466A (en) * | 2017-10-31 | 2018-04-06 | 北京毅新博创生物科技有限公司 | Correct the method and product of the accuracy rate of Mass Spectrometer Method microbiological specimens |
| KR102121644B1 (en) | 2017-11-23 | 2020-06-10 | 주식회사 엘지화학 | Method for comparative quantitative analysis of polymers using maldi mass spectrometry |
| CN207689423U (en) * | 2017-12-19 | 2018-08-03 | 亿纳谱(浙江)生物科技有限公司 | Chip and mass spectrograph for Mass Spectrometer Method |
-
2019
- 2019-04-05 KR KR1020190040021A patent/KR102362175B1/en active IP Right Grant
- 2019-07-12 EP EP19855631.8A patent/EP3702778B1/en active Active
- 2019-07-12 JP JP2020528104A patent/JP7056837B2/en active Active
- 2019-07-12 US US16/766,913 patent/US11255818B2/en active Active
- 2019-07-12 CN CN201980005981.XA patent/CN111386463B/en active Active
Also Published As
| Publication number | Publication date |
|---|---|
| US11255818B2 (en) | 2022-02-22 |
| CN111386463A (en) | 2020-07-07 |
| KR20200026006A (en) | 2020-03-10 |
| EP3702778B1 (en) | 2023-03-22 |
| US20200371065A1 (en) | 2020-11-26 |
| EP3702778A4 (en) | 2021-01-20 |
| CN111386463B (en) | 2022-11-01 |
| JP2021505849A (en) | 2021-02-18 |
| KR102362175B1 (en) | 2022-02-11 |
| JP7056837B2 (en) | 2022-04-19 |
Similar Documents
| Publication | Publication Date | Title |
|---|---|---|
| Chapman | Practical organic mass spectrometry: a guide for chemical and biochemical analysis | |
| US6649907B2 (en) | Charge reduction electrospray ionization ion source | |
| Murray et al. | Aerosol matrix-assisted laser desorption ionization mass spectrometry | |
| KR101689255B1 (en) | Quantitative analysis method using mass spectrometry wherein laser pulse energy is adjusted | |
| Corr et al. | Design considerations for high speed quantitative mass spectrometry with MALDI ionization | |
| Bian et al. | Surface-assisted laser desorption/ionization time-of-flight mass spectrometry of small drug molecules and high molecular weight synthetic/biological polymers using electrospun composite nanofibers | |
| Kennedy et al. | Evaluation and performance of desorption electrospray ionization using a triple quadrupole mass spectrometer for quantitation of pharmaceuticals in plasma | |
| KR102121644B1 (en) | Method for comparative quantitative analysis of polymers using maldi mass spectrometry | |
| KR20170021398A (en) | Sample plate using MALDI-TOF mass spectrometer and manufacturing method of the sample plate | |
| EP3696529B1 (en) | Method for quantitative analysis of polymer using maldi mass spectrometry, and method for manufacturing sample for maldi mass spectrometry for quantitative analysis of polymer | |
| Schneider et al. | Ion sampling effects under conditions of total solvent consumption | |
| KR102362170B1 (en) | Method for relative quantitatification of polymers using maldi mass spectrometry | |
| EP3702778B1 (en) | Method for relative quantitative analysis of polymer using maldi mass spectrometry | |
| US20040217277A1 (en) | Apparatus and method for surface activation and selective ion generation for MALDI mass spectrometry | |
| JP2008535170A (en) | Mass spectrometer | |
| US20160148793A1 (en) | Method for obtaining mass spectrum of ions generated at constant temperature by measuring total ion count, and use of matrix for quantitative analysis using maldi mass spectrometry | |
| Dimzon et al. | MALDI–TOF MS for characterization of synthetic polymers in aqueous environment | |
| WO2020045821A1 (en) | Method for relative quantitative analysis of polymer using maldi mass spectrometry | |
| Goldschmidt et al. | Response saturation of polystyrene in MALDI-TOF-MS | |
| WO2011150070A2 (en) | System and method for controlled electrospray deposition | |
| Hardin | Laser desorption mass spectrometry of nonvolatile biomolecules | |
| Galhena | Implementation of an in-line surface-induced dissociation device in a quadrupole time-of-flight instrument and its performance | |
| Beck | Collision velocity dependence of products formed via surface induced dissociation |
Legal Events
| Date | Code | Title | Description |
|---|---|---|---|
| STAA | Information on the status of an ep patent application or granted ep patent |
Free format text: STATUS: THE INTERNATIONAL PUBLICATION HAS BEEN MADE |
|
| PUAI | Public reference made under article 153(3) epc to a published international application that has entered the european phase |
Free format text: ORIGINAL CODE: 0009012 |
|
| STAA | Information on the status of an ep patent application or granted ep patent |
Free format text: STATUS: REQUEST FOR EXAMINATION WAS MADE |
|
| 17P | Request for examination filed |
Effective date: 20200526 |
|
| AK | Designated contracting states |
Kind code of ref document: A1 Designated state(s): AL AT BE BG CH CY CZ DE DK EE ES FI FR GB GR HR HU IE IS IT LI LT LU LV MC MK MT NL NO PL PT RO RS SE SI SK SM TR |
|
| AX | Request for extension of the european patent |
Extension state: BA ME |
|
| A4 | Supplementary search report drawn up and despatched |
Effective date: 20201221 |
|
| RIC1 | Information provided on ipc code assigned before grant |
Ipc: G01N 27/64 20060101AFI20201215BHEP Ipc: H01J 49/16 20060101ALI20201215BHEP |
|
| DAV | Request for validation of the european patent (deleted) | ||
| DAX | Request for extension of the european patent (deleted) | ||
| REG | Reference to a national code |
Ref country code: DE Ref legal event code: R079 Ref document number: 602019026757 Country of ref document: DE Free format text: PREVIOUS MAIN CLASS: G01N0033440000 Ipc: G01N0027640000 |
|
| GRAP | Despatch of communication of intention to grant a patent |
Free format text: ORIGINAL CODE: EPIDOSNIGR1 |
|
| RIC1 | Information provided on ipc code assigned before grant |
Ipc: G01N 33/44 20060101ALI20221019BHEP Ipc: H01J 49/16 20060101ALI20221019BHEP Ipc: G01N 27/64 20060101AFI20221019BHEP |
|
| STAA | Information on the status of an ep patent application or granted ep patent |
Free format text: STATUS: GRANT OF PATENT IS INTENDED |
|
| INTG | Intention to grant announced |
Effective date: 20221124 |
|
| GRAS | Grant fee paid |
Free format text: ORIGINAL CODE: EPIDOSNIGR3 |
|
| GRAA | (expected) grant |
Free format text: ORIGINAL CODE: 0009210 |
|
| STAA | Information on the status of an ep patent application or granted ep patent |
Free format text: STATUS: THE PATENT HAS BEEN GRANTED |
|
| AK | Designated contracting states |
Kind code of ref document: B1 Designated state(s): AL AT BE BG CH CY CZ DE DK EE ES FI FR GB GR HR HU IE IS IT LI LT LU LV MC MK MT NL NO PL PT RO RS SE SI SK SM TR |
|
| REG | Reference to a national code |
Ref country code: GB Ref legal event code: FG4D |
|
| REG | Reference to a national code |
Ref country code: CH Ref legal event code: EP |
|
| REG | Reference to a national code |
Ref country code: DE Ref legal event code: R096 Ref document number: 602019026757 Country of ref document: DE |
|
| REG | Reference to a national code |
Ref country code: IE Ref legal event code: FG4D |
|
| REG | Reference to a national code |
Ref country code: AT Ref legal event code: REF Ref document number: 1555608 Country of ref document: AT Kind code of ref document: T Effective date: 20230415 |
|
| REG | Reference to a national code |
Ref country code: LT Ref legal event code: MG9D |
|
| REG | Reference to a national code |
Ref country code: NL Ref legal event code: MP Effective date: 20230322 |
|
| PG25 | Lapsed in a contracting state [announced via postgrant information from national office to epo] |
Ref country code: RS Free format text: LAPSE BECAUSE OF FAILURE TO SUBMIT A TRANSLATION OF THE DESCRIPTION OR TO PAY THE FEE WITHIN THE PRESCRIBED TIME-LIMIT Effective date: 20230322 Ref country code: NO Free format text: LAPSE BECAUSE OF FAILURE TO SUBMIT A TRANSLATION OF THE DESCRIPTION OR TO PAY THE FEE WITHIN THE PRESCRIBED TIME-LIMIT Effective date: 20230622 Ref country code: LV Free format text: LAPSE BECAUSE OF FAILURE TO SUBMIT A TRANSLATION OF THE DESCRIPTION OR TO PAY THE FEE WITHIN THE PRESCRIBED TIME-LIMIT Effective date: 20230322 Ref country code: LT Free format text: LAPSE BECAUSE OF FAILURE TO SUBMIT A TRANSLATION OF THE DESCRIPTION OR TO PAY THE FEE WITHIN THE PRESCRIBED TIME-LIMIT Effective date: 20230322 Ref country code: HR Free format text: LAPSE BECAUSE OF FAILURE TO SUBMIT A TRANSLATION OF THE DESCRIPTION OR TO PAY THE FEE WITHIN THE PRESCRIBED TIME-LIMIT Effective date: 20230322 |
|
| REG | Reference to a national code |
Ref country code: AT Ref legal event code: MK05 Ref document number: 1555608 Country of ref document: AT Kind code of ref document: T Effective date: 20230322 |
|
| PG25 | Lapsed in a contracting state [announced via postgrant information from national office to epo] |
Ref country code: SE Free format text: LAPSE BECAUSE OF FAILURE TO SUBMIT A TRANSLATION OF THE DESCRIPTION OR TO PAY THE FEE WITHIN THE PRESCRIBED TIME-LIMIT Effective date: 20230322 Ref country code: NL Free format text: LAPSE BECAUSE OF FAILURE TO SUBMIT A TRANSLATION OF THE DESCRIPTION OR TO PAY THE FEE WITHIN THE PRESCRIBED TIME-LIMIT Effective date: 20230322 Ref country code: GR Free format text: LAPSE BECAUSE OF FAILURE TO SUBMIT A TRANSLATION OF THE DESCRIPTION OR TO PAY THE FEE WITHIN THE PRESCRIBED TIME-LIMIT Effective date: 20230623 Ref country code: FI Free format text: LAPSE BECAUSE OF FAILURE TO SUBMIT A TRANSLATION OF THE DESCRIPTION OR TO PAY THE FEE WITHIN THE PRESCRIBED TIME-LIMIT Effective date: 20230322 |
|
| PG25 | Lapsed in a contracting state [announced via postgrant information from national office to epo] |
Ref country code: SM Free format text: LAPSE BECAUSE OF FAILURE TO SUBMIT A TRANSLATION OF THE DESCRIPTION OR TO PAY THE FEE WITHIN THE PRESCRIBED TIME-LIMIT Effective date: 20230322 Ref country code: RO Free format text: LAPSE BECAUSE OF FAILURE TO SUBMIT A TRANSLATION OF THE DESCRIPTION OR TO PAY THE FEE WITHIN THE PRESCRIBED TIME-LIMIT Effective date: 20230322 Ref country code: PT Free format text: LAPSE BECAUSE OF FAILURE TO SUBMIT A TRANSLATION OF THE DESCRIPTION OR TO PAY THE FEE WITHIN THE PRESCRIBED TIME-LIMIT Effective date: 20230724 Ref country code: ES Free format text: LAPSE BECAUSE OF FAILURE TO SUBMIT A TRANSLATION OF THE DESCRIPTION OR TO PAY THE FEE WITHIN THE PRESCRIBED TIME-LIMIT Effective date: 20230322 Ref country code: EE Free format text: LAPSE BECAUSE OF FAILURE TO SUBMIT A TRANSLATION OF THE DESCRIPTION OR TO PAY THE FEE WITHIN THE PRESCRIBED TIME-LIMIT Effective date: 20230322 Ref country code: AT Free format text: LAPSE BECAUSE OF FAILURE TO SUBMIT A TRANSLATION OF THE DESCRIPTION OR TO PAY THE FEE WITHIN THE PRESCRIBED TIME-LIMIT Effective date: 20230322 |
|
| PG25 | Lapsed in a contracting state [announced via postgrant information from national office to epo] |
Ref country code: SK Free format text: LAPSE BECAUSE OF FAILURE TO SUBMIT A TRANSLATION OF THE DESCRIPTION OR TO PAY THE FEE WITHIN THE PRESCRIBED TIME-LIMIT Effective date: 20230322 Ref country code: PL Free format text: LAPSE BECAUSE OF FAILURE TO SUBMIT A TRANSLATION OF THE DESCRIPTION OR TO PAY THE FEE WITHIN THE PRESCRIBED TIME-LIMIT Effective date: 20230322 Ref country code: IS Free format text: LAPSE BECAUSE OF FAILURE TO SUBMIT A TRANSLATION OF THE DESCRIPTION OR TO PAY THE FEE WITHIN THE PRESCRIBED TIME-LIMIT Effective date: 20230722 |
|
| PGFP | Annual fee paid to national office [announced via postgrant information from national office to epo] |
Ref country code: DE Payment date: 20230620 Year of fee payment: 5 |
|
| REG | Reference to a national code |
Ref country code: DE Ref legal event code: R097 Ref document number: 602019026757 Country of ref document: DE |
|
| PLBE | No opposition filed within time limit |
Free format text: ORIGINAL CODE: 0009261 |
|
| STAA | Information on the status of an ep patent application or granted ep patent |
Free format text: STATUS: NO OPPOSITION FILED WITHIN TIME LIMIT |
|
| PG25 | Lapsed in a contracting state [announced via postgrant information from national office to epo] |
Ref country code: SI Free format text: LAPSE BECAUSE OF FAILURE TO SUBMIT A TRANSLATION OF THE DESCRIPTION OR TO PAY THE FEE WITHIN THE PRESCRIBED TIME-LIMIT Effective date: 20230322 Ref country code: DK Free format text: LAPSE BECAUSE OF FAILURE TO SUBMIT A TRANSLATION OF THE DESCRIPTION OR TO PAY THE FEE WITHIN THE PRESCRIBED TIME-LIMIT Effective date: 20230322 Ref country code: CZ Free format text: LAPSE BECAUSE OF FAILURE TO SUBMIT A TRANSLATION OF THE DESCRIPTION OR TO PAY THE FEE WITHIN THE PRESCRIBED TIME-LIMIT Effective date: 20230322 |
|
| 26N | No opposition filed |
Effective date: 20240102 |
|
| PG25 | Lapsed in a contracting state [announced via postgrant information from national office to epo] |
Ref country code: MC Free format text: LAPSE BECAUSE OF FAILURE TO SUBMIT A TRANSLATION OF THE DESCRIPTION OR TO PAY THE FEE WITHIN THE PRESCRIBED TIME-LIMIT Effective date: 20230322 |
|
| PG25 | Lapsed in a contracting state [announced via postgrant information from national office to epo] |
Ref country code: MC Free format text: LAPSE BECAUSE OF FAILURE TO SUBMIT A TRANSLATION OF THE DESCRIPTION OR TO PAY THE FEE WITHIN THE PRESCRIBED TIME-LIMIT Effective date: 20230322 |
|
| REG | Reference to a national code |
Ref country code: CH Ref legal event code: PL |
|
| REG | Reference to a national code |
Ref country code: BE Ref legal event code: MM Effective date: 20230731 |
|
| PG25 | Lapsed in a contracting state [announced via postgrant information from national office to epo] |
Ref country code: LU Free format text: LAPSE BECAUSE OF NON-PAYMENT OF DUE FEES Effective date: 20230712 |
|
| PG25 | Lapsed in a contracting state [announced via postgrant information from national office to epo] |
Ref country code: LU Free format text: LAPSE BECAUSE OF NON-PAYMENT OF DUE FEES Effective date: 20230712 |
|
| REG | Reference to a national code |
Ref country code: IE Ref legal event code: MM4A |
|
| PG25 | Lapsed in a contracting state [announced via postgrant information from national office to epo] |
Ref country code: CH Free format text: LAPSE BECAUSE OF NON-PAYMENT OF DUE FEES Effective date: 20230731 |
|
| PG25 | Lapsed in a contracting state [announced via postgrant information from national office to epo] |
Ref country code: IT Free format text: LAPSE BECAUSE OF FAILURE TO SUBMIT A TRANSLATION OF THE DESCRIPTION OR TO PAY THE FEE WITHIN THE PRESCRIBED TIME-LIMIT Effective date: 20230322 Ref country code: BE Free format text: LAPSE BECAUSE OF NON-PAYMENT OF DUE FEES Effective date: 20230731 |
|
| PG25 | Lapsed in a contracting state [announced via postgrant information from national office to epo] |
Ref country code: IE Free format text: LAPSE BECAUSE OF NON-PAYMENT OF DUE FEES Effective date: 20230712 |
|
| PGFP | Annual fee paid to national office [announced via postgrant information from national office to epo] |
Ref country code: GB Payment date: 20240620 Year of fee payment: 6 |
|
| PG25 | Lapsed in a contracting state [announced via postgrant information from national office to epo] |
Ref country code: IE Free format text: LAPSE BECAUSE OF NON-PAYMENT OF DUE FEES Effective date: 20230712 |
|
| PGFP | Annual fee paid to national office [announced via postgrant information from national office to epo] |
Ref country code: FR Payment date: 20240624 Year of fee payment: 6 |