EP3662519B1 - Phosphor-converted white light emitting diodes having narrow-band green phosphors - Google Patents
Phosphor-converted white light emitting diodes having narrow-band green phosphors Download PDFInfo
- Publication number
- EP3662519B1 EP3662519B1 EP18840815.7A EP18840815A EP3662519B1 EP 3662519 B1 EP3662519 B1 EP 3662519B1 EP 18840815 A EP18840815 A EP 18840815A EP 3662519 B1 EP3662519 B1 EP 3662519B1
- Authority
- EP
- European Patent Office
- Prior art keywords
- phosphor
- light emitting
- emitting device
- equal
- fwhm
- Prior art date
- Legal status (The legal status is an assumption and is not a legal conclusion. Google has not performed a legal analysis and makes no representation as to the accuracy of the status listed.)
- Active
Links
Images





Classifications
-
- H—ELECTRICITY
- H10—SEMICONDUCTOR DEVICES; ELECTRIC SOLID-STATE DEVICES NOT OTHERWISE PROVIDED FOR
- H10H—INORGANIC LIGHT-EMITTING SEMICONDUCTOR DEVICES HAVING POTENTIAL BARRIERS
- H10H20/00—Individual inorganic light-emitting semiconductor devices having potential barriers, e.g. light-emitting diodes [LED]
- H10H20/80—Constructional details
- H10H20/85—Packages
- H10H20/851—Wavelength conversion means
- H10H20/8511—Wavelength conversion means characterised by their material, e.g. binder
- H10H20/8512—Wavelength conversion materials
- H10H20/8513—Wavelength conversion materials having two or more wavelength conversion materials
-
- H—ELECTRICITY
- H10—SEMICONDUCTOR DEVICES; ELECTRIC SOLID-STATE DEVICES NOT OTHERWISE PROVIDED FOR
- H10H—INORGANIC LIGHT-EMITTING SEMICONDUCTOR DEVICES HAVING POTENTIAL BARRIERS
- H10H20/00—Individual inorganic light-emitting semiconductor devices having potential barriers, e.g. light-emitting diodes [LED]
- H10H20/80—Constructional details
- H10H20/81—Bodies
- H10H20/811—Bodies having quantum effect structures or superlattices, e.g. tunnel junctions
- H10H20/812—Bodies having quantum effect structures or superlattices, e.g. tunnel junctions within the light-emitting regions, e.g. having quantum confinement structures
-
- H—ELECTRICITY
- H10—SEMICONDUCTOR DEVICES; ELECTRIC SOLID-STATE DEVICES NOT OTHERWISE PROVIDED FOR
- H10H—INORGANIC LIGHT-EMITTING SEMICONDUCTOR DEVICES HAVING POTENTIAL BARRIERS
- H10H20/00—Individual inorganic light-emitting semiconductor devices having potential barriers, e.g. light-emitting diodes [LED]
- H10H20/01—Manufacture or treatment
- H10H20/036—Manufacture or treatment of packages
- H10H20/0361—Manufacture or treatment of packages of wavelength conversion means
-
- H—ELECTRICITY
- H10—SEMICONDUCTOR DEVICES; ELECTRIC SOLID-STATE DEVICES NOT OTHERWISE PROVIDED FOR
- H10H—INORGANIC LIGHT-EMITTING SEMICONDUCTOR DEVICES HAVING POTENTIAL BARRIERS
- H10H20/00—Individual inorganic light-emitting semiconductor devices having potential barriers, e.g. light-emitting diodes [LED]
- H10H20/80—Constructional details
- H10H20/85—Packages
- H10H20/851—Wavelength conversion means
-
- H—ELECTRICITY
- H10—SEMICONDUCTOR DEVICES; ELECTRIC SOLID-STATE DEVICES NOT OTHERWISE PROVIDED FOR
- H10H—INORGANIC LIGHT-EMITTING SEMICONDUCTOR DEVICES HAVING POTENTIAL BARRIERS
- H10H20/00—Individual inorganic light-emitting semiconductor devices having potential barriers, e.g. light-emitting diodes [LED]
- H10H20/80—Constructional details
- H10H20/85—Packages
- H10H20/851—Wavelength conversion means
- H10H20/8511—Wavelength conversion means characterised by their material, e.g. binder
- H10H20/8512—Wavelength conversion materials
-
- H—ELECTRICITY
- H10—SEMICONDUCTOR DEVICES; ELECTRIC SOLID-STATE DEVICES NOT OTHERWISE PROVIDED FOR
- H10W—GENERIC PACKAGES, INTERCONNECTIONS, CONNECTORS OR OTHER CONSTRUCTIONAL DETAILS OF DEVICES COVERED BY CLASS H10
- H10W72/00—Interconnections or connectors in packages
- H10W72/851—Dispositions of multiple connectors or interconnections
- H10W72/874—On different surfaces
- H10W72/884—Die-attach connectors and bond wires
-
- Y—GENERAL TAGGING OF NEW TECHNOLOGICAL DEVELOPMENTS; GENERAL TAGGING OF CROSS-SECTIONAL TECHNOLOGIES SPANNING OVER SEVERAL SECTIONS OF THE IPC; TECHNICAL SUBJECTS COVERED BY FORMER USPC CROSS-REFERENCE ART COLLECTIONS [XRACs] AND DIGESTS
- Y02—TECHNOLOGIES OR APPLICATIONS FOR MITIGATION OR ADAPTATION AGAINST CLIMATE CHANGE
- Y02B—CLIMATE CHANGE MITIGATION TECHNOLOGIES RELATED TO BUILDINGS, e.g. HOUSING, HOUSE APPLIANCES OR RELATED END-USER APPLICATIONS
- Y02B20/00—Energy efficient lighting technologies, e.g. halogen lamps or gas discharge lamps
Definitions
- the invention relates generally to phosphor-converted white light emitting diodes comprising narrow-band green phosphors.
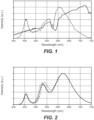
- Figure 1 shows normalized emission spectra of a Reveal ® incandescent bulb (solid line) and of a Reveal ® A19 LED bulb (dashed line), showing the effect of the neodymium oxide filters in these products.
- This methodology first creates photons and then removes a significant portion of the photons which have been created. This can be seen in the rated outputs of a 60W Reveal ® incandescent, 520 lumens, and Reveal ® LED A19, 570 lumens, compared with the benchmark 800 lumens for a 60W equivalent A19.
- the neodymium oxide filter used in the Reveal ® products introduces a dip in the emission spectra in the yellow region. Such a dip may be characterized by the residual intensity at its minimum when compared to the maximum intensity of the emission spectrum between 400 nm and 700 nm, for example about 25% for the incandescent version and about 33% for the LED A19 version.
- Red-green contrast does not have a clear metric in the CRI/Ra system, however it can be captured to some extent by the gamut index metric (Rg) of the IES TM-30-15 method.
- Rg gamut index metric
- Applicant measured an Rg of 109 for the Reveal ® incandescent versus 101 for a non-filtered incandescent.
- the Reveal ® LED bulb similarly measures at a high Rg value of 104. Surprisingly, despite the good gamut indices, these bulbs measure relatively poorly on the R9 deep red metric.
- a drawback of this method is that the neodymium filter used subtracts a significant amount of the light generated.
- Photons in the wavelength region impacted by these neodymium filters are especially particularly bright, typically ranging from 512 to 625 lumens per optical Watt compared with the maximum of 683 lumens per optical Watt.
- the Reveal ® LED bulb is rated to deliver 570 lumens using 10.5 W, while a similar Correlated Color Temperature (CCT) and CRI LED bulb from the Relax ® line delivers 800 lumens using those same 10.5 W.
- CCT Correlated Color Temperature
- white light emitting phosphor-converted LEDs comprise a two or sometimes three phosphor blend, with a combination of a broad green or yellow phosphor having a full width at half maximum (FWHM) of about 60 - 100 nm and a peak wavelength of about 500 - 570 nm and a broad red phosphor having a FWHM of about 70 - 100 nm and a peak wavelength of about 615 - 670 nm, or more usually about 625 - 650 nm.
- FWHM full width at half maximum
- a red phosphor with peak emission at 625-630 nm provides higher efficacy, due to the better overlap of the red phosphor emission and the photopic response curve of the typical human eye, but this choice of red phosphor emission is generally to the detriment of R9.
- a red phosphor with a peak emission closer to 650 nm provides better red rendering, however, but at a cost of efficacy because the longer wavelength red emission contributes little to the overall brightness of the LED.
- US2014/055982A1 discloses a white light illumination system comprising: a phosphor package; a first radiation source for providing co-excitation radiation to the phosphor package, the source emitting in wavelengths ranging from about 250 nm to about 410 nm; and a second radiation source for providing co-excitation radiation to the phosphor package, the source emitting in wavelengths ranging from about 410 nm to about 540 nm; wherein the phosphor package is configured to emit photoluminescence in wavelengths ranging from about 440 nm to about 700 nm upon co-excitation from the first and second radiation sources, and wherein the phosphor package comprises at least one narrow band green phosphor with a photoluminescence peak with a full width at half maximum of less than 60 nm, and wherein the narrow band green phosphor is configured to emit photoluminescence in wavelengths ranging from about 500 nm to about 550 nm.
- US2013/285104A1 relates to a semiconductor light-emitting device comprising a semiconductor light-emitting element that emits blue light, a green phosphor that absorbs the blue light and emits green light, and an orange phosphor that absorbs the blue light and emits orange light.
- WO 2016/039799 A1 and WO 2017/062314 A1 relate to a light emitting device combining a blue LED with a green and a red phosphors.
- phosphor converted white light LEDs comprising a narrow green phosphor rather than a conventional broad green phosphor may simultaneously exhibit high R9, high CRI, and high Luminance Efficacy of Radiation without use of a deep red phosphor to maintain desired red color rendering.
- the longest wavelength phosphor peak emission may be shorter than about 635 nm.
- phosphor converted white light LEDs comprising a narrow green phosphor rather than a conventional broad green phosphor may provide an emission spectrum exhibiting a significant dip in the yellow region of the spectrum and thereby provide high red-green contrast without use of a filter. Because this yellow dip is in the light emission, rather than caused by a filter, no emission power is lost to filtering. Further, Applicant has discovered that with use of narrow green phosphors the yellow dip may be shallower than in prior art products, and the device may therefore be brighter, while maintaining desired CRI and R9 (red color rendering). The minimum intensity in the yellow dip is, greater than about 25% of the peak intensity in the total emission spectrum of the device between about 400 nm and about 700 nm.
- Applicants have developed new families of phosphors that may be excited by a blue emitting LED and in response emit narrow band green light. These phosphors generally emit at a peak wavelength of about 500 nm to about 550 nm, with the peak having a FWHM of about 30 nm to about 50 nm. Examples of these phosphors are described later in this specification and also in U.S. Patent Application No. 15/591,629 titled "Phosphors With Narrow Green Emission" referred to above.
- Applicants have simulated total emission spectra from white light emitting phosphor-converted LEDs comprising a blue LED, a green phosphor excited by the blue LED, and a red phosphor excited by the blue LED.
- the blue LED has a peak emission at about 455 nm with a FWHM of about 20 nm.
- the green phosphor has a peak emission at about 500 nm to about 550 nm with a FWHM of about 30 nm to about 50 nm (as do various of Applicants' new narrow green phosphors); in some cases the green phosphor may be a blend of 2 or more slightly different phosphors.
- the red phosphor has a peak emission at about 630 nm with a FWHM of about 90 nm, generally corresponding to emission from Intematix Corporation ER6436 red phosphor or Mitsubishi Chemical BR-102C. In other simulations, the red phosphor has a peak emission at about 626 nm with a FWHM of about 80nm, generally corresponding to emission from Mitsubishi Chemical Corporation BR-102/Q red phosphor. No other light sources (e.g., no additional LEDs or additional phosphors) contribute to the total emission from the simulated devices. However, white light-emitting phosphor converted LEDs as described in this specification may in some embodiments optionally comprise additional phosphors, for example additional green emitting phosphors and/or additional red emitting phosphors.
- the red phosphor peak and bandwidth were held constant, the LED emission peak and bandwidth were held constant, the green phosphor emission peak and bandwidth were varied, the ratio of green phosphor emission intensity to blue LED emission intensity was varied, and the ratio of red phosphor emission intensity to blue LED emission intensity was varied.
- Varying the ratios of green and red phosphor emission intensity to blue LED emission intensity is analogous to varying phosphor concentration and loading in a phosphor-converted LED).
- the simulated spectra were characterized by calculating various parameters including for example CCT, Duv (distance in a CIE chromaticity diagram from the Planckian locus), CRI, R9, R11, LER, and the intensity at the minimum of a dip (depression) in the yellow region (e.g., about 550 nm to about 580 nm) of the spectrum measured as a percentage of the maximum intensity in the emission spectrum in the range from about 400 nm to about 700 nm.
- Table 1A characterizes three simulated spectra for a white light emitting phosphor converted LED comprising a blue LED, an ER6436 red phosphor, and a green phosphor having peak emission at 524 nm, 528 nm, or 534 nm and a FWHM of 35 nm.
- the CCT for these spectra is between 2600 K and 2850 K, nominally 2700 K, and the CRI is greater than 90.
- Table 1A 2700 K, green phosphor FWHM of 35 nm, red phosphor ER6436 Green phosphor Peak (FWHM) CRI Duv TM-30-15 Rg R9 R11 (strong green) LER Intensity and wavelength at minimum of yellow valley 524 nm (35 nm) 91 0.002 106 94 67 290 37% (563 nm) 528 nm (35 nm) 94 0.003 105 80 80 294 40% (560 nm) 534 nm (35 nm) 90 0.005 103 66 92 304 47% (566 nm)
- Table 1B characterizes three simulated spectra for a white light emitting phosphor converted LED comprising a blue LED, a BR102/Q red phosphor, and a green phosphor having peak emission at 522 nm, 526 nm, or 532 nm and a FWHM of 35 nm.
- the CCT for these spectra is between 2600 K and 2850 K, nominally 2700 K.
- Table 1B 2700 K, green phosphor FWHM of 35 nm, red phosphor BR102/Q Green phosphor Peak (FWHM) CRI Duv TM-30-15 Rg R9 R11 (strong green) LER Intensity and wavelength at minimum of yellow valley 522 nm (35 nm) 90 0.004 103 84 62 308 33% (561 nm) 526 nm (35 nm) 93 0.005 103 75 73 315 37% (565 nm) 532 nm (35 nm) 90 0.009 99 53 92 328 43% (564 nm)
- the narrower (ca. 80 nm FWHM) and slightly blue shifted (4 nm) BR102/Q has the expected result of slightly lowering the maximum achievable CRI and R9 while increasing the overall LER; additionally, the shifting of the red phosphor spectrum shifts the range of green phosphors that pair with it to give maximum values of R9, CRI and R11.
- the various trends outlined above are similar with the shifted red phosphor, though also shifted. For example, maximum R11 values are observed with phosphors of a 532 nm peak wavelength.
- R9 trends outlined above also hold true regarding the changing of R9 with CCT and duv, none of the phosphor blends examined show a relatively constant R9 as was observed with the 534 nm green and ER6436.
- Figure 2 shows normalized simulated spectra of 2700 K LEDs for green phosphor emission having a 35 nm FWHM peaking at 524 nm (dotted line,) 534 nm (dashed line), and 528 nm (solid line).
- Table 2 characterizes three simulated spectra for a white light emitting phosphor converted LED comprising a blue LED, an ER6436 red phosphor, and a green phosphor having peak emission at 520 nm, 526 nm, or 532 nm and a FWHM of 40 nm.
- the CCT for these spectra is between 2600 K and 2850 K, nominally 2700 K, and the CRI is greater than 90.
- Table 2 2700 K, green phosphor FWHM of 40 nm, red phosphor ER6436 Green phosphor Peak (FWHM) CRI Duv TM-30-15 Rg R9 R11 (strong green) LER Intensity and wavelength at minimum of yellow valley 520 nm (40 nm) 90 0.002 104 96 64 287 37% (559 nm) 526 nm (40 nm) 94 0.005 102 82 80 298 43% (565 nm) 532 nm (40 nm) 91 0.006 101 64 94 306 50% (570 nm)
- Figure 3 shows normalized simulated spectra of 2700 K LEDs for green phosphor emission having a 40 nm FWHM peaking at 520 nm (dotted line), 532 nm (dashed line), and 526 nm (solid line).
- CRI for a white light emitting phosphor-converted LED increases as the color point of a particular phosphor blend moves lower in CIE color space, usually characterized by a decreasing duv.
- Figure 4A plots duv on the vertical axis against CRI on the horizontal axis for simulated phosphor-converted LEDs comprising a blue LED, an ER6436 red phosphor, and a green phosphor having peak emission at 532 nm and a FWHM of 40 nm.
- the CCT for these spectra is between 2600 K and 2850 K, nominally 2700 K. This plot shows the expected trend of CRI increasing as duv decreases over a CRI range of about 90 to about 94.
- Figure 4B plots duv on the vertical axis against CRI on the horizontal axis for simulated phosphor-converted LEDs comprising a blue LED, an ER6436 red phosphor, and a green phosphor having peak emission at 528 nm and a FWHM of 40 nm.
- the CCT for these spectra is between 2600 K and 2850 K, nominally 2700 K. This plot shows a relatively consistent CRI of about 93 to about 94 across the entire range that would be considered "white light.”
- Table 3 characterizes three simulated spectra for a white light emitting phosphor converted LED comprising a blue LED, an ER6436 red phosphor, and a green phosphor having peak emission at 518 nm, 524 nm, or 530 nm and a FWHM of 45 nm.
- the CCT for these spectra is between 2600 K and 2850 K, nominally 2700 K, and the CRI is greater than 90.
- Figure 5 shows normalized simulated spectra of 2700 K LEDs for green phosphor emission having a 45 nm FWHM peaking at 518 nm (dotted line), 530 nm (dashed line), and 524 nm (solid line).
- simulated white light emitting phosphor-converted LEDs comprising green phosphors with 40 nm FWHM emission
- simulated white light emitting phosphor-converted LEDs comprising green phosphors with peak emission at 530 nm to 536 nm and 45 nm FWHM show expected trends, with CRI ranges of 4 across the 2700K white region.
- the CRI range begins to narrow, and with phosphors of 526 nm, the blends only create CRIs within 1 point across the white region.
- the blend shows the property of increasing CRI with increasing duv, and the CRI ranges approximately 3 points across the white region.
- Table 4A characterizes four simulated spectra for a white light emitting phosphor converted LED comprising a blue LED, an ER6436 red phosphor, and a green phosphor having peak emission at 514 nm, 516 nm, 518 nm, or 520 nm and a FWHM of 35 nm.
- the CCT for these spectra is between 2850 K and 3250 K, nominally 3000 K, and the CRI is greater than 80.
- Table 4A 3000 K, green phosphor FWHM of 35 nm, red phosphor ER6436 Green phosphor Peak (FWHM) CRI Duv TM-30-15 Rg R9 R11 (strong green) LER Intensity and wavelength at minimum of yellow valley 514 nm (35 nm) 80 0.006 99 83 43 282 30% (557 nm) 516 nm (35 nm) 83 0.006 100 86 46 285 31% (555 nm) 518 nm (35 nm) 85 0.006 102 89 51 288 33% (557 nm) 520 nm (35 nm) 87 0.006 102 94 56 291 34% (559 nm)
- Table 4B characterizes a simulated spectrum for a white light emitting phosphor converted LED comprising a blue LED having peak emission at 457 nm with a FWHM of 21 nm, a BR102/Q red phosphor, and a green phosphor having peak emission at 517 nm and a FWHM of 36 nm.
- the CCT for this spectrum is between 2850 K and 3250 K, nominally 3000 K.
- Table 4B 3000 K, green phosphor FWHM of 36 nm, red phosphor BR102/Q Green phosphor Peak (FWHM) CRI Duv TM-30-15 Rg R9 R11 (strong green) LER Intensity and wavelength at minimum of yellow valley 517 nm (36 nm) *BR102Q simulation 84 .001 103 92 50 297 31% (556 nm)
- Table 4C characterizes a measured spectrum for an example white light emitting phosphor converted LED (sample number JM388F9-28ma) comprising a blue LED having peak emission at 457 nm with a FWHM of 21 nm, a BR102/Q red phosphor, and a green phosphor (sample KB3-170-545) having peak emission at 517 nm and a FWHM of 36 nm.
- the CCT for this spectrum is between 2850 K and 3250 K, nominally 3000 K.
- Table 4C 3000 K, green phosphor FWHM of 36 nm, red phosphor BR102/Q - built Green phosphor Peak (FWHM) CRI Duv TM-30-15 Rg R9 R11 (strong green) LER Intensity and wavelength at minimum of yellow valley 517 nm (36 nm) 83 .001 104 92 45 296 27% (555 nm)
- Figure 6 shows normalized simulated spectra of 3000 K LEDs for green phosphor emission having a 35 nm FWHM peaking at 514 nm (long dashed line), 516 nm (dotted line), 518 nm (dashed line), and 520 nm (solid line).
- Figure 7 shows a simulated spectrum for a 3000 K LED for green phosphor emission having a 36 nm FWHM peaking at 517 nm (solid line), and a measured spectrum for the example phosphor-converted LED characterized in Table 4C (dashed line).
- Table 5A characterizes a simulated spectrum for a white light emitting phosphor converted LED comprising a blue LED, an ER6436 red phosphor, and a green phosphor having peak emission at 522 nm and a FWHM of 40 nm.
- a green phosphor having these spectral characteristics has been prepared as sample number YBG170620-1 (521-41).
- the CCT for this spectrum is between 2850 K and 3250 K, nominally 3000 K, and the CRI is greater than 90.
- Table 5B characterizes a simulated spectrum for a white light emitting phosphor converted LED comprising a blue LED, an ER6436 red phosphor, and a green phosphor having peak emission at 530 nm and a FWHM of 40 nm.
- a green phosphor having these spectral characteristics has been prepared as sample number KB3-123-486 (530-39).
- the CCT for this spectrum is between 2850 K and 3250 K, nominally 3000 K.
- Table 5B 3000 K, green phosphor FWHM of 40 nm, red phosphor ER6436 Green phosphor Peak (FWHM) CRI Duv TM-30-15 Rg R9 R11 (strong green) LER Intensity and wavelength at minimum of yellow valley 530 nm (40 nm) 92 .007 103 81 89 309 51% (569 nm)
- Table 5C characterizes a simulated spectrum for a white light emitting phosphor converted LED comprising a blue LED, an ER6436 red phosphor, and a green phosphor having peak emission at 534 nm and a FWHM of 40 nm.
- a green phosphor having these spectral characteristics has been prepared as sample number ELT-069 (533-41).
- the CCT for this spectrum is between 2850 K and 3250 K, nominally 3000 K.
- Table 5C 3000 K, green phosphor FWHM of 40 nm, red phosphor ER6436 Green phosphor Peak (FWHM) CRI Duv TM-30-15 Rg R9 R11 (strong green) LER Intensity and wavelength at minimum of yellow valley 534 nm (40 nm)) 90 .011 104 71 90 304 55% (573 nm)
- Figure 8 shows normalized simulated spectra of 3000 K LEDs for green phosphor emission having a 40 nm FWHM peaking at 522 nm (dotted line), 530 nm (dashed line), and 534 nm (solid line).
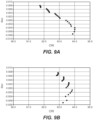
- Figure 9A plots duv on the vertical axis against CRI on the horizontal axis for simulated phosphor-converted LEDs comprising a blue LED, an ER6436 red phosphor, and a green phosphor having peak emission at 530 nm.
- CRI ranges from 92-94, increasing as duv decreases.
- Figure 9B plots duv on the vertical axis against CRI on the horizontal axis for simulated phosphor-converted LEDs comprising a blue LED, an ER6436 red phosphor, and a green phosphor having peak emission at 528 nm.
- the CRI is very consistent ranging only about 1 point through the entire white region of 3000K.
- Figure 9C plots duv on the vertical axis against CRI on the horizontal axis for simulated phosphor-converted LEDs comprising a blue LED, an ER6436 red phosphor, and a green phosphor having peak emission at 526 nm. This plots shows a tight grouping of CRI values similar to that in Figure 9B .
- Figure 9D plots duv on the vertical axis against CRI on the horizontal axis for simulated phosphor-converted LEDs comprising a blue LED, an ER6436 red phosphor, and a green phosphor having peak emission at 522 nm.
- CRI increases as duv increases.
- Table 6A characterizes two simulated spectra for a white light emitting phosphor converted LED comprising a blue LED, an ER6436 red phosphor, and a green phosphor having peak emission at 520 nm, or 524 nm and a FWHM of 45 nm.
- the CCT for these spectra is between 2850 K and 3250 K, nominally 3000 K, and the CRI is greater than 90.
- Table 6A 3000 K, green phosphor FWHM of 40 nm, red phosphor ER6436 Green phosphor Peak (FWHM) CRI Duv TM-30-15 Rg R9 R11 (strong green) LER Intensity and wavelength at minimum of yellow valley 520 nm (45 nm) 91 0.006 102 98 71 295 43% (563 nm) 524 nm (45 nm) 94 0.006 102 87 80 300 46% (563 nm)
- Table 6B characterizes a simulated spectrum for a white light emitting phosphor converted LED comprising a blue LED, an ER6436 red phosphor, and a green phosphor having peak emission at 530 nm and a FWHM of 45 nm.
- Green phosphors having these spectral characteristics have been prepared as sample numbers ELT047C (531-45) and YBG 170403-4B (530-44).
- the CCT for these spectra is between 2850 K and 3250 K, nominally 3000 K.
- Table 6B 3000 K, green phosphor FWHM of 40 nm, red phosphor ER6436 Green phosphor Peak (FWHM) CRI Duv TM-30-15 Rg R9 R11 (strong green) LER Intensity and wavelength at minimum of yellow valley 530 nm (45 nm) 92 0.006 101 71 93 308 53% (569 nm)
- R11 is a maximum at phosphor wavelengths of 530 and 532 nm. R11 values then decrease as peak wavelength increases to 534 nm or decreases down to 518 nm.
- the R9 value trend is very dependent upon not just green phosphor peak wavelength, but also CCT and duv. For peaks of 532 through 524 nm, R9 increases as duv decreases and as CCT increases. For green phosphors with peaks of 522 and 520 nm, R9 holds fairly constant through CCT and duv changes when CCT is around 3000K, also corresponding with some of the highest R9 values obtained (R9 > 95).
- Figure 10 shows normalized simulated spectra of 3000 K LEDs for green phosphor emission having a 45 nm FWHM peaking at 20 nm (dotted line,) 524 nm (dashed line), and 530 nm (solid line).
- Table 7A characterizes three simulated spectra for a white light emitting phosphor converted LED comprising a blue LED, an ER6436 red phosphor, and a green phosphor having peak emission at 516 nm, 518 nm, or 520 nm and a FWHM of 35 nm.
- the CCT for these spectra is between 3250 K and 3750 K, nominally 3500 K, and the CRI is greater than 80.
- Table 7A 3500 K, green phosphor FWHM of 35 nm, red phosphor ER6436 Green phosphor Peak (FWHM) CRI Duv TM-30-15 Rg R9 R11 (strong green) LER Intensity and wavelength at minimum of yellow valley 516 nm (35 nm) 80 0.004 105 65 44 282 33% (559 nm) 518 nm (35 nm) 83 0.006 104 70 50 287 35% (561 nm) 520 nm (35 nm) 84 0.006 105 74 54 290 37% (559 nm)
- Table 7B characterizes a simulated spectrum for a white light emitting phosphor converted LED comprising a blue LED having a peak emission at 457 nm with a FWHM of 21 nm, a BR102/Q red phosphor, and a green phosphor having peak emission at 517 nm and a FWHM of 36 nm.
- the CCT for these spectra is between 3250 K and 3750 K, nominally 3500 K.
- Table 7B 3500 K, green phosphor FWHM of 36 nm, red phosphor BR102/Q Green phosphor Peak (FWHM) CRI Duv TM-30-15 Rg R9 R11 (strong green) LER Intensity and wavelength at minimum of yellow valley 517 nm (36 nm) 84 -0.004 106 83 51 294 34% (559 nm)
- Table 7C characterizes a measured spectrum for an example white light emitting phosphor converted LED (sample JM388-E3-59) comprising a blue LED having peak emission at 457 nm with a FWHM of 21 nm, a BR102/Q red phosphor, and a green phosphor having peak emission at 517 nm and a FWHM of 36 nm.
- the CCT for this spectrum is between 3250 K and 3750 K, nominally 3500 K.
- Table 7C 3500 K, green phosphor FWHM of 36 nm, red phosphor BR102/Q - built Green phosphor Peak (FWHM) CRI Duv TM-30-15 Rg R9 R11 (strong green) LER Intensity and wavelength at minimum of yellow valley 517 nm (36 nm) 84 -0.004 107 86 49 291 33% (558 nm)
- Figure 11 shows normalized simulated spectra of 3500 K LEDs for green phosphor emission having a 35 nm FWHM peaking at 520 nm (dotted line), 518 nm (solid line) and 516 nm (dashed line).
- Figure 12 shows a simulated spectrum for a 3500 K LED for green phosphor emission having a 36 nm FWHM peaking at 517 nm (solid line), and a measured spectrum for the example phosphor converted LED characterized in Table 7C (dashed line).
- Table 9 characterizes three simulated spectra for a white light emitting phosphor converted LED comprising a blue LED, an ER6436 red phosphor, and a green phosphor having peak emission at 524 nm, 528 nm, or 532 nm and a FWHM of 40 nm.
- the CCT for these spectra is between 3250 K and 3750 K, nominally 3500 K, and the CRI is greater than 90.
- Table 9 3500 K, green phosphor FWHM of 40 nm, red phosphor ER6436 Green phosphor Peak (FWHM) CRI Duv TM-30-15 Rg R9 R11 (strong green) LER Intensity and wavelength at minimum of yellow valley 524 nm (40 nm) 90 0.003 105 89 72 295 46% (563 nm) 528 nm (40 nm) 91 0.005 104 99 83 303 52% (567 nm) 532 nm (40 nm) 91 0.003 104 89 89 306 56% (571 nm)
- R9 increases with distance above the Planckian locus and also R9 increases with decreasing CCT.
- CCT CRI versus duv follows the expected trend of increasing CRI with decreasing duv for phosphors of longer wavelength, such as 540-532 nm, with a range of 4 points across the region generally considered white.
- the CRI range compresses down to about 2 and shows no real correlation with duv for phosphors of peak wavelengths 526 and 528nm. Shorter wavelength phosphors show a wider range of CRI, but with the inverted trend of increased CRI with increased duv.
- Figure 13 shows normalized simulated spectra of 3500 K LEDs for green phosphor emission having a 40 nm FWHM peaking at 532 nm (dotted line), 528 nm (solid line), and 524 nm (dashed line).
- Table 10 characterizes three simulated spectra for a white light emitting phosphor converted LED comprising a blue LED, an ER6436 red phosphor, and a green phosphor having peak emission at 530 nm, 526 nm, or 522 nm and a FWHM of 45 nm.
- the CCT for these spectra is between 3250 K and 3750 K, nominally 3500 K, and the CRI is greater than 90.
- Table 10 3500 K, green phosphor FWHM of 45 nm, red phosphor ER6436 Green phosphor Peak (FWHM) CRI Duv TM-30-15 Rg R9 R11 (strong green) LER Intensity and wavelength at minimum of yellow valley 530 nm (45 nm) 92 0.003 103 86 90 306 58% (569 nm) 526 nm (45 nm) 92 0.005 104 99 84 302 53% (569 nm) 522 nm (45 nm) 90 0.003 105 85 73 293 48% (570 nm)
- R9 increases with distance above the Planckian locus and also R9 increases with decreasing CCT.
- CCT CRI
- R9 appears to show a relative maximum with the 526 nm phosphor.
- R11 and increased phosphor wavelength with the phosphors between 522 nm and 532 nm peak wavelength with a slight relative maximum with phosphors with a 530 nm peak wavelength.
- Figure 14 shows normalized simulated spectra of 3500 K LEDs for green phosphor emission with 45 nm FWHM peaking at 530 nm (dotted line), 526 nm (solid line), and 522 nm (dashed line).
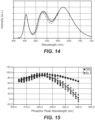
- Figure 15 plots CRI and R9 against green phosphor emission peak wavelength, on the horizontal axis, for simulated white light phosphor-converted LEDs comprising a blue LED, an ER6436 red phosphor, and a narrow green phosphor.
- the CCT for these simulated devices is nominally 3000 K with a duv of +0.003.
- the FWHM of the green phosphor emission varies. This plot shows that using a shorter peak wavelength green phosphor results in a higher value for R9.
- Figure 16 plots CRI against duv for simulated white light phosphor-converted LEDs comprising a blue LED, an ER6436 red phosphor, and narrow green phosphors with peak wavelength of 532 nm and varying FWHM.
- the CCT for these simulated devices is nominally 3000 K. This plot shows that at this wavelength of green phosphors, the CRI generally increases as duv decreases. This trend follows the generally accepted trend. Additionally, the plot shows that the range of obtained CRI values decreases with decreasing FWHM.
- Figure 17 plots CRI against duv for simulated white light phosphor-converted LEDs comprising a blue LED, an ER6436 red phosphor, and narrow green phosphors with peak wavelength of 522 nm and varying FWHM.
- the CCT for these simulated devices is nominally 3000 K. This plot shows that at this wavelength of green phosphors, the CRI generally increases as duv increases. This trend is opposite of the generally accepted trend where CRI generally decreases as duv increases. Additionally, the plot shows that the range of obtained CRI values decreases with decreasing FWHM.
- Table 11 characterizes several simulated spectra for a white light emitting phosphor converted LED comprising a blue LED having a peak emission wavelength between 450 nm and 470 nm, a red phosphor with a nominal 620 nm peak wavelength and a FWHM of 90 nm, and a green phosphor having peak emission between 508 nm and 534 nm, and a FWHM of between 40 nm and 50 nm.
- the CCT for these spectra is between 2850 K and 3250 K, nominally 3000 K.
- Table 12 characterizes several simulated spectra for a white light emitting phosphor converted LED comprising a blue LED having a peak emission wavelength between 430 nm and 455 nm, a red phosphor with a nominal 620 nm peak wavelength and a FWHM of 90 nm, and a green phosphor having peak emission between 504 nm and 524 nm, and a FWHM of between 35 nm and 50 nm.
- the CCT for these spectra is between 3750 K and 4250 K, nominally 4000 K.
- Table 12 4000 K with red phosphor peak 620 nm, FWHM 90 nm, Duv 0.003 Green phosphor Peak (FWHM) CRI Duv TM-30-15 Rg R9 R11 (strong green) LER Intensity and wavelength at minimum of yellow valley Wavelength of LED 504 nm (50 nm) 87 0.003 103 97 62 289 45% (557 nm) 440 506 nm (40 nm) 84 0.003 105 97 52 282 36% (554 nm) 430 506 nm (40 nm) 84 0.003 103 97 54 290 37% (554 nm) 440 506 nm (45 nm) 86 0.003 105 97 57 286 42% (554 nm) 435 506 nm (50 nm) 88 0.003 102 97 65 293 47% (559 nm) 445 508 nm (40 nm) 86
- Table 13 below shows the attributes of commercially available LEDs purchased and tested by the applicant. These LEDs utilize green-yellow phosphors significantly broader than those disclosed herein, and as such do not display a valley in the emission spectra.
- Table 13 commercially available LEDs
- CCT of Commercially Purchased LEDs CRI Duv TM-30-15 Rg R9 R11 (strong green) LER Intensity and wavelength at minimum of yellow valley 2700 82 -0.003 93 7 75 323 n/a 2700 91 -0.003 96 59 87 285 n/a 3000 82 -0.004 96 4 78 330 n/a 3000 91 0.000 98 55 90 297 n/a 3500 84 -0.003 93 22 76 318 n/a 3500 94 -0.002 96 72 91 290 n/a
- 0.523g Eu, 0.106g CaS, 0.886g Al 2 S 3 , 0.174g Ga 2 S 3 , 0.110g S and 0.090g AlCl 3 were ground and then divided into 4 quartz tubes sealed under vacuum.
- the tubes were heated together to 400 °C for one hour and then the temperature was increased to 900 °C and held for 6 hours.
- the furnace was cooled at 50 °C per hour.
- the tubes were opened under inert atmosphere and ground together to combine them.
- 0.562g Eu, 0.446g Al 2 S 3 , 0.412g Ga 2 S 3 , 0.112g S and 0.075g AlCl 3 were ground and then divided into 4 quartz tubes sealed under vacuum.
- the tubes were heated together to 400 °C for one hour and then the temperature was increased to 900 °C and held for 6 hours.
- the furnace was cooled at 50 °C per hour.
- the tubes were opened under inert atmosphere and their contents ground together to combine them.
- KB3-117-475a 529 nm peak, 41 nm FWHM. 0.225g Eu, 0.166g Al 2 S 3 , 0.209g Ga 2 S 3 , 0.020g S and 0.045g AlCl 3 were ground and then divided into 2 quartz tubes sealed under vacuum. One of the tubes was heated to 400 °C for one hour and then the temperature was increased to 900 °C and held for 6 hours. The furnace was cooled at 50 °C per hour.
- KB3-117-476a 539 nm peak, 42 nm FWHM.
- 0.215g Eu, 0.115g Al 2 S 3 , 0.270g Ga 2 S 3 , 0.020g S and 0.045g AlCl 3 were ground and then divided into 2 quartz tubes sealed under vacuum.
- One of the tubes was heated to 400 °C for one hour and then the temperature was increased to 900 °C and held for 6 hours.
- the furnace was cooled at 50 °C per hour.
- 0.006 g Mg, 0.113 g SrS, 0.010g Eu, 0.023g Al, 0.198g Ga 2 S 3 , and 0.071g S were ground and put into a quartz tube and sealed under vacuum.
- the sample was heated together to 400 °C for 6 hours and then the temperature was increased to 800 °C and held for 12 hours.
- the furnace was cooled in 6 hours.
- the sample was opened under inert atmosphere, ground and sealed in a new quartz tube. It was heated to 950 °C for 24 hours and cooled to room temperature over 6 hours.
- 0.117g Eu, 0.048g Al 2 S 3 , 0.114g Ga 2 S 3 , 0.031g S and 0.023g AlCl 3 were ground and then sealed in a quartz tube under vacuum. The sample was heated to 400 °C for one hour and then the temperature was increased to 850 °C and held for 6 hours. The furnace was cooled at 25 °C per hour.
- YBG170620-1 521 nm peak, 41 nm FWHM.
- Stoichiometric amount of Eu, Al, Ga 2 S 3 and 15 wt% excess S to form Eu(Al 1.85 Ga 0.26 )S 4.37 were thoroughly ground in a mortar with a pestle in the glove box and sealed in a quartz tube under vacuum. The mixtures were placed in dried silica tubes, which were evacuated and sealed at a length of about 5 in. Reactions were carried out in box furnaces. The temperature was raised to 400 °C and held for 2 hours and raised again to 900 °C and held for 8 - 12 hours then cooled to room temperature for 6 hours.
- ELTEAGS-012-B-2 516 nm peak, 36 nm FWHM.
- the reagents CaS, Eu, Al and S were combined in stoichiometric amounts to obtain the nominal composition CaAl 2.7 S 5.05 :8.5%Eu and loaded into an alumina crucible in a horizontal tube furnace. Following a 30-min purge with Ar, the mixture was heated to 400 °C, at which point H 2 S gas flow was started. After 1h at 400 °C, the furnace was heated to 1000 °C for 2h. Upon cooling, the H 2 S gas was turned off and the product was cooled to room temperature under flowing Ar.
- ELTAlS-067-B 516 nm peak, 35 nm FWHM.
- Eu(Al 1-x Ga x ) 2.7 S 5.05+y was prepared by combining Eu, Al 2 S 3 , Ga 2 S 3 and S in stoichiometric ratios. 3 wt% AlCl 3 and 10 mg excess S were added prior to firing. The mixture was sealed in an evacuated silica tube and heated to 400 °C for 2h, then heated to 850 °C for 6 h. The sample was cooled to room temperature at a rate of 50 °C/h.
- ELTEAGS-016-A-2 522 nm peak, 39 nm FWHM.
- CaAl 2.43 Ga 0.27 S 5.05 :8.5%Eu was prepared under flowing H 2 S/Ar from stoichiometric amounts of CaS, EuF 3 , Al, Ga 2 S 3 and S.
- the sample was homogenized in an Ar atmosphere then loaded into an alumina boat and placed in a horizontal tube furnace. Following a 1h purge with flowing Ar, the mixture was heated to 400 °C for 1h, at which point H 2 S gas flow was started. The sample was then heated to 1000 °C for 2h and cooled to room temperature. The H 2 S gas was switched off at 800 °C during the cool down.
- EuAlGaS 4 was synthesized by combining Eu, Al 2 S 3 , Ga 2 S 3 and S in stoichiometric amounts under Ar. The mixture was sealed in an evacuated quartz tube and heated to 400 °C (6h) then to 800 °C (12h). After grinding the product and adding 50 mg excess S, a second heat treatment was followed by heating to 400 °C (6h) then to 1000 °C (6h).
- ELTAlS-036-E 534 nm peak, 45 nm FWHM.
- EuAl 0.8 Ga 1.2 S 4 was synthesized from stoichiometric amounts of Eu, Al 2 S 3 , Ga metal, and S. The reactants were mixed under Ar then sealed in an evacuated quartz tube. Two heat treatments were followed to obtain the final product. Heat 1: 400 °C (12h), 800 °C (12h). Heat 2: 400 °C (12h), 1000 °C (6h). The sample was reground with 50 mg excess S and sealed in an evacuated quartz tube during the intermediate step.
- Eu(Al 0.4 Ga 0.6 ) 2 S 4 was synthesized from a pre-fired mixture of stoichiometric amounts of Eu, Al 2 S 3 , Ga 2 S 3 and S. The product was combined with 0.12 g I 2 (15 wt%) and 0.16 g S (20 wt%) before separating into two portions and sealed into two evacuated quartz tubes. Both samples were heated to 950 °C (2h) then quenched in either air or water.
- ELTAlS-037-B 550 nm peak, 51 nm FWHM.
- CaAl 0.675 Ga 2.025 S 5.05 :8.5%Eu was synthesized by combining CaS, Eu, Al 2 S 3 , Ga 2 S 3 and S in stoichiometric amounts. The mixture was homogenized using a mortar and pestle under Ar, then loaded into a carbon-coated silica tube which was subsequently evacuated and sealed under vacuum. Synthesis was carried out by a stepwise heating approach: 290 °C (17h), 770 °C (24h), 870 °C (24h) and cooled to room temperature over 9h. The product was recovered and manually reground with 50 mg S before adding to another carbon-coated silica tube and heated to 400 °C (6h) and 1000 °C (3h).
- Phosphor slurries were created by combining Dow Corning OE-6550 2 part silicone, red phosphor, BR102/Q and a green phosphor, such as KB3-163-537. Phosphor converted LEDs were fabricated using portions of this slurry and applying them to 2835 PLCC packages from Power Opto Co.; the silicone was cured overnight at ca. 100 °C.
Landscapes
- Led Device Packages (AREA)
- Luminescent Compositions (AREA)
Description
- The invention relates generally to phosphor-converted white light emitting diodes comprising narrow-band green phosphors.
- The ability of a light source to render deep red colors is measured by the metric R9. Unfiltered incandescent light sources by definition render those extremely well, typically greater than 97. Replacements for incandescent light sources have tended to struggle with faithful rendition of red colors. For example high pressure sodium lamps and older fluorescent lighting tubes often had negative values for R9, and reduced almost any red color to a rather dull orange appearance. Early light emitting diodes (LEDs) were notorious for poor rendering of red colors. The situation was so significant that many programs related to LED lighting only require R9 > 0. This contrasts with the requirements for the general color rendering index (CRI) which are usually CRI > 80.
- Generally speaking, general lighting can be made more pleasing by the increase of red-green contrast, for example by the removal of yellow light, which can wash out the appearance of many objects. This phenomenon has been known in the art for many years, dating back at least to
US 4,441,046 "Incandescent lamps with neodymium oxide vitreous coatings", in which a neodymium oxide coating filters out some of the green and lot of the yellow. Based on this work, in 1995 GE released the Enrich® line of incandescent light bulbs, and in 2001 renamed the line Reveal®. The incandescent Reveal® product line still exists today, along with an updated Reveal® LED product, still utilizing a neodymium based filter. -
Figure 1 shows normalized emission spectra of a Reveal® incandescent bulb (solid line) and of a Reveal® A19 LED bulb (dashed line), showing the effect of the neodymium oxide filters in these products. One of the largest drawbacks of this methodology is that it first creates photons and then removes a significant portion of the photons which have been created. This can be seen in the rated outputs of a 60W Reveal® incandescent, 520 lumens, and Reveal® LED A19, 570 lumens, compared with thebenchmark 800 lumens for a 60W equivalent A19. - Generally, it has been an industry goal to produce white light emitting phosphor-converted LEDs that have emission spectra that are relatively flat, sloped, and continuous in the region between about 500 nanometers (nm) and about 600 nm. This general shape roughly mirrors the reference illuminant, e.g. the emission spectra of black body radiators such as a standard incandescent. As shown in
Figure 1 , the neodymium oxide filter used in the Reveal® products introduces a dip in the emission spectra in the yellow region. Such a dip may be characterized by the residual intensity at its minimum when compared to the maximum intensity of the emission spectrum between 400 nm and 700 nm, for example about 25% for the incandescent version and about 33% for the LED A19 version. - Red-green contrast does not have a clear metric in the CRI/Ra system, however it can be captured to some extent by the gamut index metric (Rg) of the IES TM-30-15 method. Applicant measured an Rg of 109 for the Reveal® incandescent versus 101 for a non-filtered incandescent. The Reveal® LED bulb similarly measures at a high Rg value of 104. Surprisingly, despite the good gamut indices, these bulbs measure relatively poorly on the R9 deep red metric. A drawback of this method is that the neodymium filter used subtracts a significant amount of the light generated. Photons in the wavelength region impacted by these neodymium filters are especially particularly bright, typically ranging from 512 to 625 lumens per optical Watt compared with the maximum of 683 lumens per optical Watt. The Reveal® LED bulb is rated to deliver 570 lumens using 10.5 W, while a similar Correlated Color Temperature (CCT) and CRI LED bulb from the Relax® line delivers 800 lumens using those same 10.5 W.
- Typically, white light emitting phosphor-converted LEDs comprise a two or sometimes three phosphor blend, with a combination of a broad green or yellow phosphor having a full width at half maximum (FWHM) of about 60 - 100 nm and a peak wavelength of about 500 - 570 nm and a broad red phosphor having a FWHM of about 70 - 100 nm and a peak wavelength of about 615 - 670 nm, or more usually about 625 - 650 nm.
- A red phosphor with peak emission at 625-630 nm provides higher efficacy, due to the better overlap of the red phosphor emission and the photopic response curve of the typical human eye, but this choice of red phosphor emission is generally to the detriment of R9. Conversely, a red phosphor with a peak emission closer to 650 nm provides better red rendering, however, but at a cost of efficacy because the longer wavelength red emission contributes little to the overall brightness of the LED. There is generally an inverse relation between the deep red rendering of a light source as measured by R9 and the spectral efficiency or luminous efficacy of radiation (LER) of the spectrum.
-
US2014/055982A1 discloses a white light illumination system comprising: a phosphor package; a first radiation source for providing co-excitation radiation to the phosphor package, the source emitting in wavelengths ranging from about 250 nm to about 410 nm; and a second radiation source for providing co-excitation radiation to the phosphor package, the source emitting in wavelengths ranging from about 410 nm to about 540 nm; wherein the phosphor package is configured to emit photoluminescence in wavelengths ranging from about 440 nm to about 700 nm upon co-excitation from the first and second radiation sources, and wherein the phosphor package comprises at least one narrow band green phosphor with a photoluminescence peak with a full width at half maximum of less than 60 nm, and wherein the narrow band green phosphor is configured to emit photoluminescence in wavelengths ranging from about 500 nm to about 550 nm. -
US2013/285104A1 relates to a semiconductor light-emitting device comprising a semiconductor light-emitting element that emits blue light, a green phosphor that absorbs the blue light and emits green light, and an orange phosphor that absorbs the blue light and emits orange light.WO 2016/039799 A1 andWO 2017/062314 A1 relate to a light emitting device combining a blue LED with a green and a red phosphors. - In one aspect of the invention, Applicants have discovered that phosphor converted white light LEDs comprising a narrow green phosphor rather than a conventional broad green phosphor may simultaneously exhibit high R9, high CRI, and high Luminance Efficacy of Radiation without use of a deep red phosphor to maintain desired red color rendering. For example, in such devices the longest wavelength phosphor peak emission may be shorter than about 635 nm.
- In another aspect, Applicants have discovered that phosphor converted white light LEDs comprising a narrow green phosphor rather than a conventional broad green phosphor may provide an emission spectrum exhibiting a significant dip in the yellow region of the spectrum and thereby provide high red-green contrast without use of a filter. Because this yellow dip is in the light emission, rather than caused by a filter, no emission power is lost to filtering. Further, Applicant has discovered that with use of narrow green phosphors the yellow dip may be shallower than in prior art products, and the device may therefore be brighter, while maintaining desired CRI and R9 (red color rendering). The minimum intensity in the yellow dip is, greater than about 25% of the peak intensity in the total emission spectrum of the device between about 400 nm and about 700 nm.
- These and other embodiments, features and advantages of the present invention will become more apparent to those skilled in the art when taken with reference to the following more detailed description of the invention in conjunction with the accompanying drawings that are first briefly described.
-
-
Figure 1 shows normalized emission spectra of a Reveal® incandescent bulb (solid line) and of a Reveal® A19 LED bulb (dashed line). -
Figure 2 shows normalized simulated spectra of 2700 K LEDs for green phosphor emission having a 35 nm FWHM peaking at 524 nm (dotted line,) 534 nm (dashed line), and 528 nm (solid line). -
Figure 3 . shows normalized simulated spectra of 2700 K LEDs for green phosphor emission having a 40 nm FWHM peaking at 520 nm (dotted line), 532 nm (dashed line), and 526 nm (solid line). -
Figure 4A is a plot of duv (distance in a CIE chromaticity diagram from the Planckian locus) against CRI for simulated phosphor-converted LEDs comprising a blue LED, an ER6436 red phosphor, and a green phosphor having peak emission at 532 nm and a FWHM of 40 nm -
Figure 4B is a plot of duv against CRI for simulated phosphor-converted LEDs comprising a blue LED, an ER6436 red phosphor, and a green phosphor having peak emission at 528 nm and a FWHM of 40 nm. -
Figure 4C is a plot of duv against CRI for simulated phosphor-converted LEDs comprising a blue LED, an ER6436 red phosphor, and a green phosphor having peak emission at 526 nm and a FWHM of 40 nm. -
Figure 5 shows normalized simulated spectra of 2700 K LEDs for green phosphor emission having a 45 nm FWHM peaking at 518 nm (dotted line), 530 nm (dashed line), and 524 nm (solid line). -
Figure 6 shows normalized simulated spectra of 3000 K LEDs for green phosphor emission having a 35 nm FWHM peaking at 514 nm (long dashed line), 516 nm (dotted line), 518 nm (dashed line), and 520 nm (solid line). -
Figure 7 shows a simulated spectrum for a 3000 K LED for green phosphor emission having a 36 nm FWHM peaking at 517 nm (solid line), and a measured spectrum for the example phosphor-converted LED characterized in Table 4C (dashed line). -
Figure 8 shows normalized simulated spectra of 3000 k LEDs for green phosphor emission having a 40 nm FWHM peaking at 522 nm (dotted line), 530 nm (dashed line), and 534 nm (solid line). -
Figure 9A is a plot of duv against CRI for simulated phosphor-converted LEDs comprising a blue LED, an ER6436 red phosphor, and a green phosphor having peak emission at 530 nm. -
Figure 9B is a plot of duv against CRI for simulated phosphor-converted LEDs comprising a blue LED, an ER6436 red phosphor, and a green phosphor having peak emission at 528 nm. -
Figure 9C is a plot of duv against CRI for simulated phosphor-converted LEDs comprising a blue LED, an ER6436 red phosphor, and a green phosphor having peak emission at 526 nm. -
Figure 9D is a plot of duv against CRI for simulated phosphor-converted LEDs comprising a blue LED, an ER6436 red phosphor, and a green phosphor having peak emission at 522 nm. -
Figure 10 shows normalized simulated spectra of 3000 K LEDs for green phosphor emission having a 45 nm FWHM peaking at 520 nm (dotted line,) 524 nm (dashed line), and 530 nm (solid line). -
Figure 11 shows normalized simulated spectra of 3500 K LEDs for green phosphor emission having a 35 nm FWHM peaking at 520 nm (dotted line), 518 nm (solid line) and 516 nm (dashed line). -
Figure 12 shows a simulated spectrum for a 3500 K LED for green phosphor emission having a 36 nm FWHM peaking at 517 nm (solid line), and a measured spectrum for the example phosphor converted LED characterized in Table 7C (dashed line). -
Figure 13 shows normalized simulated spectra of 3500 K LEDs for green phosphor emission having a 40 nm FWHM peaking at 532 nm (dotted line), 528 nm (solid line), and 524 nm (dashed line). -
Figure 14 shows normalized simulated spectra of 3500 K LEDs for green phosphor emission with 45 nm FWHM peaking at 530 nm (dotted line), 526 nm (solid line), and 522 nm (dashed line). -
Figure 15 plots CRI and R9 against green phosphor emission peak wavelength, on the horizontal axis, for simulated white light phosphor-converted LEDs comprising a blue LED, an ER6436 red phosphor, and a narrow green phosphor. -
Figure 16 plots CRI against duv for simulated white light phosphor-converted LEDs comprising a blue LED, an ER6436 red phosphor, and narrow green phosphors with peak wavelength of 532 nm and varying FWHM. -
Figure 17 plots CRI against duv for simulated white light phosphor-converted LEDs comprising a blue LED, an ER6436 red phosphor, and narrow green phosphors with peak wavelength of 522 nm and varying FWHM. - The following detailed description should be read with reference to the drawings, in which identical reference numbers refer to like elements throughout the different figures. The drawings, which are not necessarily to scale, depict selective embodiments and are not intended to limit the scope of the invention. The detailed description illustrates by way of example, not by way of limitation, the principles of the invention. This description will clearly enable one skilled in the art to make and use the invention, and describes several embodiments, adaptations, variations, alternatives and uses of the invention. As used in this specification and in the claims, the term LED is intended to include light emitting diodes and semiconductor laser diodes.
- Applicants have developed new families of phosphors that may be excited by a blue emitting LED and in response emit narrow band green light. These phosphors generally emit at a peak wavelength of about 500 nm to about 550 nm, with the peak having a FWHM of about 30 nm to about 50 nm. Examples of these phosphors are described later in this specification and also in
U.S. Patent Application No. 15/591,629 titled "Phosphors With Narrow Green Emission" referred to above. - In addition, Applicants have simulated total emission spectra from white light emitting phosphor-converted LEDs comprising a blue LED, a green phosphor excited by the blue LED, and a red phosphor excited by the blue LED. In these simulations, the blue LED has a peak emission at about 455 nm with a FWHM of about 20 nm. The green phosphor has a peak emission at about 500 nm to about 550 nm with a FWHM of about 30 nm to about 50 nm (as do various of Applicants' new narrow green phosphors); in some cases the green phosphor may be a blend of 2 or more slightly different phosphors. In some simulations, the red phosphor has a peak emission at about 630 nm with a FWHM of about 90 nm, generally corresponding to emission from Intematix Corporation ER6436 red phosphor or Mitsubishi Chemical BR-102C. In other simulations, the red phosphor has a peak emission at about 626 nm with a FWHM of about 80nm, generally corresponding to emission from Mitsubishi Chemical Corporation BR-102/Q red phosphor. No other light sources (e.g., no additional LEDs or additional phosphors) contribute to the total emission from the simulated devices. However, white light-emitting phosphor converted LEDs as described in this specification may in some embodiments optionally comprise additional phosphors, for example additional green emitting phosphors and/or additional red emitting phosphors.
- In these simulations, the red phosphor peak and bandwidth were held constant, the LED emission peak and bandwidth were held constant, the green phosphor emission peak and bandwidth were varied, the ratio of green phosphor emission intensity to blue LED emission intensity was varied, and the ratio of red phosphor emission intensity to blue LED emission intensity was varied. (Varying the ratios of green and red phosphor emission intensity to blue LED emission intensity is analogous to varying phosphor concentration and loading in a phosphor-converted LED).
- The simulated spectra were characterized by calculating various parameters including for example CCT, Duv (distance in a CIE chromaticity diagram from the Planckian locus), CRI, R9, R11, LER, and the intensity at the minimum of a dip (depression) in the yellow region (e.g., about 550 nm to about 580 nm) of the spectrum measured as a percentage of the maximum intensity in the emission spectrum in the range from about 400 nm to about 700 nm.
- Some exemplary results of these simulations and some related measurements are presented below.
- Table 1A below characterizes three simulated spectra for a white light emitting phosphor converted LED comprising a blue LED, an ER6436 red phosphor, and a green phosphor having peak emission at 524 nm, 528 nm, or 534 nm and a FWHM of 35 nm. The CCT for these spectra is between 2600 K and 2850 K, nominally 2700 K, and the CRI is greater than 90.
Table 1A: 2700 K, green phosphor FWHM of 35 nm, red phosphor ER6436 Green phosphor Peak (FWHM) CRI Duv TM-30-15 Rg R9 R11 (strong green) LER Intensity and wavelength at minimum of yellow valley 524 nm (35 nm) 91 0.002 106 94 67 290 37% (563 nm) 528 nm (35 nm) 94 0.003 105 80 80 294 40% (560 nm) 534 nm (35 nm) 90 0.005 103 66 92 304 47% (566 nm) - The trend with green phosphors of 35 nm FWHM combined with a red phosphor with about 90 nm FWHM seems to be that R11 has a maximum at a phosphor wavelength of 534 nm. R11 values then decrease as peak wavelength decreases. The R9 value trend is very dependent upon not just green phosphor peak wavelength, but also CCT and duv. For this particular combination of CCT and CRI, R9 appears to show a relative maximum with the 522 - 524 nm phosphors, with the highest value of 94 being seen with the 524 nm peaked green phosphor. For peaks of 532 through 522 nm, R9 increases as CCT increases and to a lesser extent as duv decreases. For green phosphors with a peak of 534 nm, R9 holds fairly constant through CCT and duv changes when CCT is around 2700K.
- Table 1B below characterizes three simulated spectra for a white light emitting phosphor converted LED comprising a blue LED, a BR102/Q red phosphor, and a green phosphor having peak emission at 522 nm, 526 nm, or 532 nm and a FWHM of 35 nm. The CCT for these spectra is between 2600 K and 2850 K, nominally 2700 K.
Table 1B: 2700 K, green phosphor FWHM of 35 nm, red phosphor BR102/Q Green phosphor Peak (FWHM) CRI Duv TM-30-15 Rg R9 R11 (strong green) LER Intensity and wavelength at minimum of yellow valley 522 nm (35 nm) 90 0.004 103 84 62 308 33% (561 nm) 526 nm (35 nm) 93 0.005 103 75 73 315 37% (565 nm) 532 nm (35 nm) 90 0.009 99 53 92 328 43% (564 nm) - The narrower (ca. 80 nm FWHM) and slightly blue shifted (4 nm) BR102/Q has the expected result of slightly lowering the maximum achievable CRI and R9 while increasing the overall LER; additionally, the shifting of the red phosphor spectrum shifts the range of green phosphors that pair with it to give maximum values of R9, CRI and R11. The various trends outlined above are similar with the shifted red phosphor, though also shifted. For example, maximum R11 values are observed with phosphors of a 532 nm peak wavelength. R9 trends outlined above also hold true regarding the changing of R9 with CCT and duv, none of the phosphor blends examined show a relatively constant R9 as was observed with the 534 nm green and ER6436.
-
Figure 2 shows normalized simulated spectra of 2700 K LEDs for green phosphor emission having a 35 nm FWHM peaking at 524 nm (dotted line,) 534 nm (dashed line), and 528 nm (solid line). - Table 2 below characterizes three simulated spectra for a white light emitting phosphor converted LED comprising a blue LED, an ER6436 red phosphor, and a green phosphor having peak emission at 520 nm, 526 nm, or 532 nm and a FWHM of 40 nm. The CCT for these spectra is between 2600 K and 2850 K, nominally 2700 K, and the CRI is greater than 90.
Table 2: 2700 K, green phosphor FWHM of 40 nm, red phosphor ER6436 Green phosphor Peak (FWHM) CRI Duv TM-30-15 Rg R9 R11 (strong green) LER Intensity and wavelength at minimum of yellow valley 520 nm (40 nm) 90 0.002 104 96 64 287 37% (559 nm) 526 nm (40 nm) 94 0.005 102 82 80 298 43% (565 nm) 532 nm (40 nm) 91 0.006 101 64 94 306 50% (570 nm) - The trend with green phosphors of 40 nm FWHM seems to be that R11 has a maximum at phosphor wavelengths of 532 nm. R11 values then decrease as peak wavelength moves to 534 nm, or decreases to 520 nm. The R9 value trend is very dependent upon not just green phosphor peak wavelength, but also CCT and duv. For this particular combination of CCT and CRI, R9 appears to show a relative maximum with the 520 nm phosphor, with the highest value of 96. For peaks of 534 through 520 nm, R9 increases as CCT increases and to a lesser extent as duv decreases.
-
Figure 3 shows normalized simulated spectra of 2700 K LEDs for green phosphor emission having a 40 nm FWHM peaking at 520 nm (dotted line), 532 nm (dashed line), and 526 nm (solid line). - It is generally accepted that CRI for a white light emitting phosphor-converted LED increases as the color point of a particular phosphor blend moves lower in CIE color space, usually characterized by a decreasing duv.
Figure 4A plots duv on the vertical axis against CRI on the horizontal axis for simulated phosphor-converted LEDs comprising a blue LED, an ER6436 red phosphor, and a green phosphor having peak emission at 532 nm and a FWHM of 40 nm. The CCT for these spectra is between 2600 K and 2850 K, nominally 2700 K. This plot shows the expected trend of CRI increasing as duv decreases over a CRI range of about 90 to about 94. -
Figure 4B plots duv on the vertical axis against CRI on the horizontal axis for simulated phosphor-converted LEDs comprising a blue LED, an ER6436 red phosphor, and a green phosphor having peak emission at 528 nm and a FWHM of 40 nm. The CCT for these spectra is between 2600 K and 2850 K, nominally 2700 K. This plot shows a relatively consistent CRI of about 93 to about 94 across the entire range that would be considered "white light." -
Figure 4C plots duv on the vertical axis against CRI on the horizontal axis for simulated phosphor-converted LEDs comprising a blue LED, an ER6436 red phosphor, and a green phosphor having peak emission at 526 nm and a FWHM of 40 nm. The CCT for these spectra is between 2600 K and 2850 K, nominally 2700 K. This plot also shows a relatively consistent CRI of about 93 to about 94 across the entire range that would be considered "white light." - Table 3 below characterizes three simulated spectra for a white light emitting phosphor converted LED comprising a blue LED, an ER6436 red phosphor, and a green phosphor having peak emission at 518 nm, 524 nm, or 530 nm and a FWHM of 45 nm. The CCT for these spectra is between 2600 K and 2850 K, nominally 2700 K, and the CRI is greater than 90.
Table 3: 2700 K, green phosphor FWHM of 45 nm, red phosphor ER6436 Green phosphor Peak (FWHM) CRI Duv TM-30-15 Rg R9 R11 (strong green) LER Intensity and wavelength at minimum of yellow valley 518 nm (45 nm) 90 0.001 104 96 66 295 38% (559 nm) 524 nm (45 nm) 95 0.003 104 85 81 294 44% (565 nm) 530 nm (45 nm) 91 0.007 100 62 95 306 50% (570 nm) - The trend with green phosphors of 45 nm FWHM seems to be that R11 has a maximum at phosphor wavelengths of 530 nm. R11 values then decrease as peak wavelength moves to 532 nm, or decreases to 518 nm. The R9 value trend is very dependent upon not just green phosphor peak wavelength, but also CCT and duv. For this particular combination of CCT and CRI, R9 appears to show a relative maximum with the 518 nm phosphor, with the highest value of 96. For peaks of 532 through 518 nm, R9 increases as CCT increases and to a lesser extent as duv decreases.
-
Figure 5 shows normalized simulated spectra of 2700 K LEDs for green phosphor emission having a 45 nm FWHM peaking at 518 nm (dotted line), 530 nm (dashed line), and 524 nm (solid line). - Similar to the CRI versus duv trends discussed above for simulated white light emitting phosphor-converted LEDs comprising green phosphors with 40 nm FWHM emission, simulated white light emitting phosphor-converted LEDs comprising green phosphors with peak emission at 530 nm to 536 nm and 45 nm FWHM show expected trends, with CRI ranges of 4 across the 2700K white region. For green peak emission around 528 nm, the CRI range begins to narrow, and with phosphors of 526 nm, the blends only create CRIs within 1 point across the white region. Once the peak emission wavelength of the green phosphor decreases to 522 nm, the blend shows the property of increasing CRI with increasing duv, and the CRI ranges approximately 3 points across the white region.
- Table 4A below characterizes four simulated spectra for a white light emitting phosphor converted LED comprising a blue LED, an ER6436 red phosphor, and a green phosphor having peak emission at 514 nm, 516 nm, 518 nm, or 520 nm and a FWHM of 35 nm. The CCT for these spectra is between 2850 K and 3250 K, nominally 3000 K, and the CRI is greater than 80.
Table 4A: 3000 K, green phosphor FWHM of 35 nm, red phosphor ER6436 Green phosphor Peak (FWHM) CRI Duv TM-30-15 Rg R9 R11 (strong green) LER Intensity and wavelength at minimum of yellow valley 514 nm (35 nm) 80 0.006 99 83 43 282 30% (557 nm) 516 nm (35 nm) 83 0.006 100 86 46 285 31% (555 nm) 518 nm (35 nm) 85 0.006 102 89 51 288 33% (557 nm) 520 nm (35 nm) 87 0.006 102 94 56 291 34% (559 nm) - Table 4B below characterizes a simulated spectrum for a white light emitting phosphor converted LED comprising a blue LED having peak emission at 457 nm with a FWHM of 21 nm, a BR102/Q red phosphor, and a green phosphor having peak emission at 517 nm and a FWHM of 36 nm. The CCT for this spectrum is between 2850 K and 3250 K, nominally 3000 K.
Table 4B: 3000 K, green phosphor FWHM of 36 nm, red phosphor BR102/Q Green phosphor Peak (FWHM) CRI Duv TM-30-15 Rg R9 R11 (strong green) LER Intensity and wavelength at minimum of yellow valley 517 nm (36 nm) * BR102Q simulation 84 .001 103 92 50 297 31% (556 nm) - Table 4C below characterizes a measured spectrum for an example white light emitting phosphor converted LED (sample number JM388F9-28ma) comprising a blue LED having peak emission at 457 nm with a FWHM of 21 nm, a BR102/Q red phosphor, and a green phosphor (sample KB3-170-545) having peak emission at 517 nm and a FWHM of 36 nm. The CCT for this spectrum is between 2850 K and 3250 K, nominally 3000 K.
Table 4C: 3000 K, green phosphor FWHM of 36 nm, red phosphor BR102/Q - built Green phosphor Peak (FWHM) CRI Duv TM-30-15 Rg R9 R11 (strong green) LER Intensity and wavelength at minimum of yellow valley 517 nm (36 nm) 83 .001 104 92 45 296 27% (555 nm) - The trend with green phosphors of 35 nm FWHM seems to be that R11 has a maximum at phosphor wavelengths of 520 nm. R11 values then decrease as peak wavelength decreases. The R9 value trend is very dependent upon not just green phosphor peak wavelength, but also CCT and duv. For peaks of 520 through 516 nm, R9 increases as duv increases and as CCT decreases. For green phosphors with a peak of 514 nm, R9 holds fairly constant through CCT and duv changes when CCT is around 3000K. The highest R9 values were obtained with phosphors peaked at 520 nm and some with 518 nm (R9 > 90).
-
Figure 6 shows normalized simulated spectra of 3000 K LEDs for green phosphor emission having a 35 nm FWHM peaking at 514 nm (long dashed line), 516 nm (dotted line), 518 nm (dashed line), and 520 nm (solid line). -
Figure 7 shows a simulated spectrum for a 3000 K LED for green phosphor emission having a 36 nm FWHM peaking at 517 nm (solid line), and a measured spectrum for the example phosphor-converted LED characterized in Table 4C (dashed line). - Table 5A below characterizes a simulated spectrum for a white light emitting phosphor converted LED comprising a blue LED, an ER6436 red phosphor, and a green phosphor having peak emission at 522 nm and a FWHM of 40 nm. A green phosphor having these spectral characteristics has been prepared as sample number YBG170620-1 (521-41). The CCT for this spectrum is between 2850 K and 3250 K, nominally 3000 K, and the CRI is greater than 90.
Table 5A: 3000 K, green phosphor FWHM of 40 nm, red phosphor ER6436 Green phosphor Peak (FWHM) CRI Duv TM-30-15 Rg R9 R11 (strong green) LER Intensity and wavelength at minimum of yellow valley 522 nm (40 nm) 90 .009 102 98 69 300 42% (561 nm) - Table 5B below characterizes a simulated spectrum for a white light emitting phosphor converted LED comprising a blue LED, an ER6436 red phosphor, and a green phosphor having peak emission at 530 nm and a FWHM of 40 nm. A green phosphor having these spectral characteristics has been prepared as sample number KB3-123-486 (530-39). The CCT for this spectrum is between 2850 K and 3250 K, nominally 3000 K.
Table 5B: 3000 K, green phosphor FWHM of 40 nm, red phosphor ER6436 Green phosphor Peak (FWHM) CRI Duv TM-30-15 Rg R9 R11 (strong green) LER Intensity and wavelength at minimum of yellow valley 530 nm (40 nm) 92 .007 103 81 89 309 51% (569 nm) - Table 5C below characterizes a simulated spectrum for a white light emitting phosphor converted LED comprising a blue LED, an ER6436 red phosphor, and a green phosphor having peak emission at 534 nm and a FWHM of 40 nm. A green phosphor having these spectral characteristics has been prepared as sample number ELT-069 (533-41). The CCT for this spectrum is between 2850 K and 3250 K, nominally 3000 K.
Table 5C: 3000 K, green phosphor FWHM of 40 nm, red phosphor ER6436 Green phosphor Peak (FWHM) CRI Duv TM-30-15 Rg R9 R11 (strong green) LER Intensity and wavelength at minimum of yellow valley 534 nm (40 nm)) 90 .011 104 71 90 304 55% (573 nm) - The trend with green phosphors of 40 nm FWHM seems to be that R11 has a maximum at phosphor wavelengths of 532 nm. R11 values then decrease as peak wavelength increases to 534 nm or decreases down to 522 nm. The R9 value trend is very dependent upon not just green phosphor peak wavelength, but also CCT and duv. For peaks of 534 through 524 nm, R9 increases as duv decreases and as CCT increases. For green phosphors with a peak of 522 nm, R9 holds fairly constant through CCT and duv changes when CCT is around 3000 K, also corresponding with some of the highest R9 values obtained (R9 > 95).
-
Figure 8 shows normalized simulated spectra of 3000 K LEDs for green phosphor emission having a 40 nm FWHM peaking at 522 nm (dotted line), 530 nm (dashed line), and 534 nm (solid line). -
Figure 9A plots duv on the vertical axis against CRI on the horizontal axis for simulated phosphor-converted LEDs comprising a blue LED, an ER6436 red phosphor, and a green phosphor having peak emission at 530 nm. Through most of the white range CRI ranges from 92-94, increasing as duv decreases. -
Figure 9B plots duv on the vertical axis against CRI on the horizontal axis for simulated phosphor-converted LEDs comprising a blue LED, an ER6436 red phosphor, and a green phosphor having peak emission at 528 nm. The CRI is very consistent ranging only about 1 point through the entire white region of 3000K. -
Figure 9C plots duv on the vertical axis against CRI on the horizontal axis for simulated phosphor-converted LEDs comprising a blue LED, an ER6436 red phosphor, and a green phosphor having peak emission at 526 nm. This plots shows a tight grouping of CRI values similar to that inFigure 9B . -
Figure 9D plots duv on the vertical axis against CRI on the horizontal axis for simulated phosphor-converted LEDs comprising a blue LED, an ER6436 red phosphor, and a green phosphor having peak emission at 522 nm. In this plot CRI increases as duv increases. - Table 6A below characterizes two simulated spectra for a white light emitting phosphor converted LED comprising a blue LED, an ER6436 red phosphor, and a green phosphor having peak emission at 520 nm, or 524 nm and a FWHM of 45 nm. The CCT for these spectra is between 2850 K and 3250 K, nominally 3000 K, and the CRI is greater than 90.
Table 6A: 3000 K, green phosphor FWHM of 40 nm, red phosphor ER6436 Green phosphor Peak (FWHM) CRI Duv TM-30-15 Rg R9 R11 (strong green) LER Intensity and wavelength at minimum of yellow valley 520 nm (45 nm) 91 0.006 102 98 71 295 43% (563 nm) 524 nm (45 nm) 94 0.006 102 87 80 300 46% (563 nm) - Table 6B below characterizes a simulated spectrum for a white light emitting phosphor converted LED comprising a blue LED, an ER6436 red phosphor, and a green phosphor having peak emission at 530 nm and a FWHM of 45 nm. Green phosphors having these spectral characteristics have been prepared as sample numbers ELT047C (531-45) and YBG 170403-4B (530-44). The CCT for these spectra is between 2850 K and 3250 K, nominally 3000 K.
Table 6B: 3000 K, green phosphor FWHM of 40 nm, red phosphor ER6436 Green phosphor Peak (FWHM) CRI Duv TM-30-15 Rg R9 R11 (strong green) LER Intensity and wavelength at minimum of yellow valley 530 nm (45 nm) 92 0.006 101 71 93 308 53% (569 nm) - The trend here seems to be that R11 is a maximum at phosphor wavelengths of 530 and 532 nm. R11 values then decrease as peak wavelength increases to 534 nm or decreases down to 518 nm. The R9 value trend is very dependent upon not just green phosphor peak wavelength, but also CCT and duv. For peaks of 532 through 524 nm, R9 increases as duv decreases and as CCT increases. For green phosphors with peaks of 522 and 520 nm, R9 holds fairly constant through CCT and duv changes when CCT is around 3000K, also corresponding with some of the highest R9 values obtained (R9 > 95).
-
Figure 10 shows normalized simulated spectra of 3000 K LEDs for green phosphor emission having a 45 nm FWHM peaking at 20 nm (dotted line,) 524 nm (dashed line), and 530 nm (solid line). CCT 3500 K - Table 7A below characterizes three simulated spectra for a white light emitting phosphor converted LED comprising a blue LED, an ER6436 red phosphor, and a green phosphor having peak emission at 516 nm, 518 nm, or 520 nm and a FWHM of 35 nm. The CCT for these spectra is between 3250 K and 3750 K, nominally 3500 K, and the CRI is greater than 80.
Table 7A: 3500 K, green phosphor FWHM of 35 nm, red phosphor ER6436 Green phosphor Peak (FWHM) CRI Duv TM-30-15 Rg R9 R11 (strong green) LER Intensity and wavelength at minimum of yellow valley 516 nm (35 nm) 80 0.004 105 65 44 282 33% (559 nm) 518 nm (35 nm) 83 0.006 104 70 50 287 35% (561 nm) 520 nm (35 nm) 84 0.006 105 74 54 290 37% (559 nm) - Table 7B below characterizes a simulated spectrum for a white light emitting phosphor converted LED comprising a blue LED having a peak emission at 457 nm with a FWHM of 21 nm, a BR102/Q red phosphor, and a green phosphor having peak emission at 517 nm and a FWHM of 36 nm. The CCT for these spectra is between 3250 K and 3750 K, nominally 3500 K.
Table 7B: 3500 K, green phosphor FWHM of 36 nm, red phosphor BR102/Q Green phosphor Peak (FWHM) CRI Duv TM-30-15 Rg R9 R11 (strong green) LER Intensity and wavelength at minimum of yellow valley 517 nm (36 nm) 84 -0.004 106 83 51 294 34% (559 nm) - Table 7C below characterizes a measured spectrum for an example white light emitting phosphor converted LED (sample JM388-E3-59) comprising a blue LED having peak emission at 457 nm with a FWHM of 21 nm, a BR102/Q red phosphor, and a green phosphor having peak emission at 517 nm and a FWHM of 36 nm. The CCT for this spectrum is between 3250 K and 3750 K, nominally 3500 K.
Table 7C: 3500 K, green phosphor FWHM of 36 nm, red phosphor BR102/Q - built Green phosphor Peak (FWHM) CRI Duv TM-30-15 Rg R9 R11 (strong green) LER Intensity and wavelength at minimum of yellow valley 517 nm (36 nm) 84 -0.004 107 86 49 291 33% (558 nm) - As seen in Table 8 below, for example, the trend here seems to be that R9 increases with distance above the Planckian locus and also R9 increases with decreasing CCT. There is a clear trend of increased R11 and increased phosphor wavelength with the phosphors between 516 nm and 520 nm peak wavelength. Table 8 reports R9 values for selected CCT and duv for simulated spectra for a white light emitting phosphor-converted LED comprising a blue LED, an ER6436 red phosphor, and a green phosphor having peak emission at 520 nm and a FWHM of 35.
Table 8: R9 for selected CCT and duv 3680 - 3730K 3570 - 3580K 3440 - 3480K 3360 - 3390K 3270 - 3350K duv = 0.005 - 0.007 69 71 74 76 78 duv = 0.003 - 0.004 67 69 72 75 77 duv = 0.001 - 0.002 64 67 70 73 76 duv = -0.001--0.002 60 64 68 72 duv = -0.005 61 66 70 -
Figure 11 shows normalized simulated spectra of 3500 K LEDs for green phosphor emission having a 35 nm FWHM peaking at 520 nm (dotted line), 518 nm (solid line) and 516 nm (dashed line). -
Figure 12 shows a simulated spectrum for a 3500 K LED for green phosphor emission having a 36 nm FWHM peaking at 517 nm (solid line), and a measured spectrum for the example phosphor converted LED characterized in Table 7C (dashed line). - Table 9 below characterizes three simulated spectra for a white light emitting phosphor converted LED comprising a blue LED, an ER6436 red phosphor, and a green phosphor having peak emission at 524 nm, 528 nm, or 532 nm and a FWHM of 40 nm. The CCT for these spectra is between 3250 K and 3750 K, nominally 3500 K, and the CRI is greater than 90.
Table 9: 3500 K, green phosphor FWHM of 40 nm, red phosphor ER6436 Green phosphor Peak (FWHM) CRI Duv TM-30-15 Rg R9 R11 (strong green) LER Intensity and wavelength at minimum of yellow valley 524 nm (40 nm) 90 0.003 105 89 72 295 46% (563 nm) 528 nm (40 nm) 91 0.005 104 99 83 303 52% (567 nm) 532 nm (40 nm) 91 0.003 104 89 89 306 56% (571 nm) - The trend here seems to be that R9 increases with distance above the Planckian locus and also R9 increases with decreasing CCT. For this particular combination of CCT and CRI, R9 appears to show a relative maximum with the 528 nm phosphor. There is a clear trend of increased R11 and increased phosphor wavelength with the phosphors between 524 nm and 532 nm peak wavelength. CRI versus duv follows the expected trend of increasing CRI with decreasing duv for phosphors of longer wavelength, such as 540-532 nm, with a range of 4 points across the region generally considered white. The CRI range compresses down to about 2 and shows no real correlation with duv for phosphors of peak wavelengths 526 and 528nm. Shorter wavelength phosphors show a wider range of CRI, but with the inverted trend of increased CRI with increased duv.
-
Figure 13 shows normalized simulated spectra of 3500 K LEDs for green phosphor emission having a 40 nm FWHM peaking at 532 nm (dotted line), 528 nm (solid line), and 524 nm (dashed line). - Table 10 below characterizes three simulated spectra for a white light emitting phosphor converted LED comprising a blue LED, an ER6436 red phosphor, and a green phosphor having peak emission at 530 nm, 526 nm, or 522 nm and a FWHM of 45 nm. The CCT for these spectra is between 3250 K and 3750 K, nominally 3500 K, and the CRI is greater than 90.
Table 10: 3500 K, green phosphor FWHM of 45 nm, red phosphor ER6436 Green phosphor Peak (FWHM) CRI Duv TM-30-15 Rg R9 R11 (strong green) LER Intensity and wavelength at minimum of yellow valley 530 nm (45 nm) 92 0.003 103 86 90 306 58% (569 nm) 526 nm (45 nm) 92 0.005 104 99 84 302 53% (569 nm) 522 nm (45 nm) 90 0.003 105 85 73 293 48% (570 nm) - The trend here seems to be that R9 increases with distance above the Planckian locus and also R9 increases with decreasing CCT. For this particular combination of CCT and CRI, R9 appears to show a relative maximum with the 526 nm phosphor. There is a clear trend of increased R11 and increased phosphor wavelength with the phosphors between 522 nm and 532 nm peak wavelength with a slight relative maximum with phosphors with a 530 nm peak wavelength.
-
Figure 14 shows normalized simulated spectra of 3500 K LEDs for green phosphor emission with 45 nm FWHM peaking at 530 nm (dotted line), 526 nm (solid line), and 522 nm (dashed line). -
Figure 15 plots CRI and R9 against green phosphor emission peak wavelength, on the horizontal axis, for simulated white light phosphor-converted LEDs comprising a blue LED, an ER6436 red phosphor, and a narrow green phosphor. The CCT for these simulated devices is nominally 3000 K with a duv of +0.003. The FWHM of the green phosphor emission varies. This plot shows that using a shorter peak wavelength green phosphor results in a higher value for R9. -
Figure 16 plots CRI against duv for simulated white light phosphor-converted LEDs comprising a blue LED, an ER6436 red phosphor, and narrow green phosphors with peak wavelength of 532 nm and varying FWHM. The CCT for these simulated devices is nominally 3000 K. This plot shows that at this wavelength of green phosphors, the CRI generally increases as duv decreases. This trend follows the generally accepted trend. Additionally, the plot shows that the range of obtained CRI values decreases with decreasing FWHM. -
Figure 17 plots CRI against duv for simulated white light phosphor-converted LEDs comprising a blue LED, an ER6436 red phosphor, and narrow green phosphors with peak wavelength of 522 nm and varying FWHM. The CCT for these simulated devices is nominally 3000 K. This plot shows that at this wavelength of green phosphors, the CRI generally increases as duv increases. This trend is opposite of the generally accepted trend where CRI generally decreases as duv increases. Additionally, the plot shows that the range of obtained CRI values decreases with decreasing FWHM. - Table 11 below characterizes several simulated spectra for a white light emitting phosphor converted LED comprising a blue LED having a peak emission wavelength between 450 nm and 470 nm, a red phosphor with a nominal 620 nm peak wavelength and a FWHM of 90 nm, and a green phosphor having peak emission between 508 nm and 534 nm, and a FWHM of between 40 nm and 50 nm. The CCT for these spectra is between 2850 K and 3250 K, nominally 3000 K.
Table 11: 3000 K with red phosphor peak 620 nm, FWHM 90 nm Green phosphor Peak (FWHM) CRI Duv TM-30-15 Rg R9 R11 (strong green) LER Intensity and wavelength at minimum of yellow valley Wavelength of LED 508 nm (50 nm) 84 0.003 85 62 82 301 40% (551 nm) 470 510 nm (50 nm) 85 0.003 86 63 84 303 42% (549 nm) 470 512 nm (50 nm) 85 0.003 87 65 86 304 45% (551 nm) 470 514 nm (50 nm) 95 0.003 98 50 88 314 47% (553 nm) 455 514 nm (50 nm) 94 0.003 100 48 87 314 47% (553 nm) 450 514 nm (45 nm) 86 0.003 87 60 86 305 43% (553 nm) 470 516 nm (50 nm) 95 0.003 99 49 91 316 50% (555 nm) 455 516 nm (50 nm) 94 0.003 96 52 92 314 50% (555 nm) 460 516 nm (45 nm) 87 0.003 88 59 88 307 45% (555 nm) 470 518 nm (50 nm) 94 0.003 96 52 95 316 53% (557 nm) 460 518 nm (50 nm) 94 0.003 99 48 93 317 53% (557 nm) 455 518 nm (45 nm) 94 0.003 96 49 92 315 48% (557 nm) 460 532 nm (40 nm) 83 0.003 99 26 81 331 63% (564 nm) 455 532 nm (45 nm) 82 0.003 98 25 78 333 70% (564 nm) 455 532 nm (45 nm) 81 0.003 100 22 79 333 70% (564 nm) 450 532 nm (50 nm) 81 0.003 98 21 75 334 74% (571 nm) 455 532 nm (45 nm) 81 0.003 100 20 78 333 68% (564 nm) 450 532 nm (50 nm) 81 0.003 97 19 75 334 72% (564 nm) 455 534 nm (40 nm) 81 0.003 98 22 76 333 67% (566 nm) 455 - Table 12 below characterizes several simulated spectra for a white light emitting phosphor converted LED comprising a blue LED having a peak emission wavelength between 430 nm and 455 nm, a red phosphor with a nominal 620 nm peak wavelength and a FWHM of 90 nm, and a green phosphor having peak emission between 504 nm and 524 nm, and a FWHM of between 35 nm and 50 nm. The CCT for these spectra is between 3750 K and 4250 K, nominally 4000 K.
Table 12: 4000 K with red phosphor peak 620 nm, FWHM 90 nm, Duv 0.003 Green phosphor Peak (FWHM) CRI Duv TM-30-15 Rg R9 R11 (strong green) LER Intensity and wavelength at minimum of yellow valley Wavelength of LED 504 nm (50 nm) 87 0.003 103 97 62 289 45% (557 nm) 440 506 nm (40 nm) 84 0.003 105 97 52 282 36% (554 nm) 430 506 nm (40 nm) 84 0.003 103 97 54 290 37% (554 nm) 440 506 nm (45 nm) 86 0.003 105 97 57 286 42% (554 nm) 435 506 nm (50 nm) 88 0.003 102 97 65 293 47% (559 nm) 445 508 nm (40 nm) 86 0.003 106 97 54 288 38% (556 nm) 435 510 nm (35 nm) 85 0.003 108 97 48 289 32% (553 nm) 435 514 nm (35 nm) 89 0.003 105 97 58 297 37% (553 nm) 450 514 nm (50 nm) 95 0.003 103 80 78 306 55% (562 nm) 450 516 nm (40 nm) 93 0.003 105 88 69 304 49% (559 nm) 450 516 nm (45 nm) 93 0.003 106 77 73 308 55% (559 nm) 445 516 nm (50 nm) 93 0.003 105 76 78 308 58% (564 nm) 445 518 nm (40 nm) 94 0.003 102 84 76 307 52% (557 nm) 455 518 nm (50 nm) 96 0.003 100 74 87 311 60% (566 nm) 455 520 nm (35 nm) 94 0.003 103 84 73 309 46% (559 nm) 455 520 nm (40 nm) 94 0.003 105 76 77 311 55% (559 nm) 450 520 nm (45 nm) 94 0.003 104 71 82 313 60% (559 nm) 450 520 nm (50 nm) 93 0.003 103 66 87 314 63% (563 nm) 450 522 nm (40 nm) 90 0.003 107 70 77 314 57% (561 nm) 445 522 nm (40 nm) 88 0.003 108 67 75 313 57% (561 nm) 440 522 nm (45 nm) 90 0.003 105 64 82 317 63% (561 nm) 445 522 nm (45 nm) 87 0.003 107 61 80 316 63% (561 nm) 440 522 nm (50 nm) 89 0.003 105 59 86 318 67% (565 nm) 445 522 nm (50 nm) 87 0.003 106 57 84 317 67% (565 nm) 440 524 nm (35 nm) 89 0.003 107 70 75 316 49% (563 nm) 445 524 nm (35 nm) 87 0.003 109 67 73 315 49% (563 nm) 440 524 nm (40 nm) 94 0.003 101 67 88 317 59% (563 nm) 455 - Table 13 below shows the attributes of commercially available LEDs purchased and tested by the applicant. These LEDs utilize green-yellow phosphors significantly broader than those disclosed herein, and as such do not display a valley in the emission spectra.
Table 13: commercially available LEDs CCT of Commercially Purchased LEDs CRI Duv TM-30-15 Rg R9 R11 (strong green) LER Intensity and wavelength at minimum of yellow valley 2700 82 -0.003 93 7 75 323 n/a 2700 91 -0.003 96 59 87 285 n/a 3000 82 -0.004 96 4 78 330 n/a 3000 91 0.000 98 55 90 297 n/a 3500 84 -0.003 93 22 76 318 n/a 3500 94 -0.002 96 72 91 290 n/a - KB3-170-545, 517 nm peak, 36 nm FWHM. 0.523g Eu, 0.106g CaS, 0.886g Al2S3, 0.174g Ga2S3, 0.110g S and 0.090g AlCl3 were ground and then divided into 4 quartz tubes sealed under vacuum. The tubes were heated together to 400 °C for one hour and then the temperature was increased to 900 °C and held for 6 hours. The furnace was cooled at 50 °C per hour. The tubes were opened under inert atmosphere and ground together to combine them.
- KB3-163-537, 527 nm peak, 41 nm FWHM. 0.562g Eu, 0.446g Al2S3, 0.412g Ga2S3, 0.112g S and 0.075g AlCl3 were ground and then divided into 4 quartz tubes sealed under vacuum. The tubes were heated together to 400 °C for one hour and then the temperature was increased to 900 °C and held for 6 hours. The furnace was cooled at 50 °C per hour. The tubes were opened under inert atmosphere and their contents ground together to combine them.
- KB3-117-475a, 529 nm peak, 41 nm FWHM. 0.225g Eu, 0.166g Al2S3, 0.209g Ga2S3, 0.020g S and 0.045g AlCl3 were ground and then divided into 2 quartz tubes sealed under vacuum. One of the tubes was heated to 400 °C for one hour and then the temperature was increased to 900 °C and held for 6 hours. The furnace was cooled at 50 °C per hour.
- KB3-123-486, 530 nm peak, 39 nm FWHM. 0.562g Eu, 0.416g Al2S3, 0.522g Ga2S3, 0.050g S and 0.115g AlCl3 were ground and then divided into 4 quartz tubes sealed under vacuum. The tubes were heated together to 400 °C for one hour and then the temperature was increased to 900 °C and held for 6 hours. The furnace was cooled at 50 °C per hour. The tubes were opened under inert atmosphere and their contents ground together to combine them.
- KB3-117-476a, 539 nm peak, 42 nm FWHM. 0.215g Eu, 0.115g Al2S3, 0.270g Ga2S3, 0.020g S and 0.045g AlCl3 were ground and then divided into 2 quartz tubes sealed under vacuum. One of the tubes was heated to 400 °C for one hour and then the temperature was increased to 900 °C and held for 6 hours. The furnace was cooled at 50 °C per hour.
- KB3-080-430, 528 nm peak, 47 nm FWHM. 0.006 g Mg, 0.113 g SrS, 0.010g Eu, 0.023g Al, 0.198g Ga2S3, and 0.071g S were ground and put into a quartz tube and sealed under vacuum. The sample was heated together to 400 °C for 6 hours and then the temperature was increased to 800 °C and held for 12 hours. The furnace was cooled in 6 hours. The sample was opened under inert atmosphere, ground and sealed in a new quartz tube. It was heated to 950 °C for 24 hours and cooled to room temperature over 6 hours.
- KB3-121-481, 533 nm peak, 44 nm FWHM. 0.117g Eu, 0.048g Al2S3, 0.114g Ga2S3, 0.031g S and 0.023g AlCl3 were ground and then sealed in a quartz tube under vacuum. The sample was heated to 400 °C for one hour and then the temperature was increased to 850 °C and held for 6 hours. The furnace was cooled at 25 °C per hour.
- YBG170620-1, 521 nm peak, 41 nm FWHM. Stoichiometric amount of Eu, Al, Ga2S3 and 15 wt% excess S to form Eu(Al1.85Ga0.26)S4.37 were thoroughly ground in a mortar with a pestle in the glove box and sealed in a quartz tube under vacuum. The mixtures were placed in dried silica tubes, which were evacuated and sealed at a length of about 5 in. Reactions were carried out in box furnaces. The temperature was raised to 400 °C and held for 2 hours and raised again to 900 °C and held for 8 - 12 hours then cooled to room temperature for 6 hours.
- ELTEAGS-012-B-2, 516 nm peak, 36 nm FWHM. The reagents CaS, Eu, Al and S were combined in stoichiometric amounts to obtain the nominal composition CaAl2.7S5.05:8.5%Eu and loaded into an alumina crucible in a horizontal tube furnace. Following a 30-min purge with Ar, the mixture was heated to 400 °C, at which point H2S gas flow was started. After 1h at 400 °C, the furnace was heated to 1000 °C for 2h. Upon cooling, the H2S gas was turned off and the product was cooled to room temperature under flowing Ar.
- ELTAlS-067-B, 516 nm peak, 35 nm FWHM. Eu(Al1-xGax)2.7S5.05+y was prepared by combining Eu, Al2S3, Ga2S3 and S in stoichiometric ratios. 3 wt% AlCl3 and 10 mg excess S were added prior to firing. The mixture was sealed in an evacuated silica tube and heated to 400 °C for 2h, then heated to 850 °C for 6 h. The sample was cooled to room temperature at a rate of 50 °C/h.
- ELTAlS-073, 520 nm peak, 36 nm FWHM. CaS, Eu, Al and S were combined in stoichiometric amounts to obtain the nominal composition CaAl2.7S5.05:8.5%Eu. The mixture was homogenized in a mortar and pestle under Ar, then loaded into a carbon-coated silica tube which was subsequently evacuated and sealed under vacuum. Synthesis was carried out by a stepwise heating approach: 290 °C (17h), 770 °C (24h), 870 °C (24h) and slow-cooled over 20 h. The product was recovered and manually reground before returning to a new carbon-coated silica tube and heated to 400 °C (6h) and 1000 °C (3h)
- ELTEAGS-013-A-2, 520 nm peak, 40 nm FWHM. CaS, EuF3, Al, Ga2S3 and S were combined stoichiometrically to obtain the target composition CaAl2.565Ga0.135S5.05:%8.5Eu (5% Ga). The sample was homogenized under Ar then loaded into an alumina crucible and placed in a horizontal tube furnace. Following a 30-min purge with flowing Ar, the mixture was heated to 400 °C, at which point H2S gas flow was started. After holding at 400 °C for 1h, the sample was heated to 1000 °C for 2h. The H2S gas was switched off at 800 °C during the cool down to room temperature over 2h.
- ELTEAGS-016-A-2, 522 nm peak, 39 nm FWHM. CaAl2.43Ga0.27S5.05:8.5%Eu was prepared under flowing H2S/Ar from stoichiometric amounts of CaS, EuF3, Al, Ga2S3 and S. The sample was homogenized in an Ar atmosphere then loaded into an alumina boat and placed in a horizontal tube furnace. Following a 1h purge with flowing Ar, the mixture was heated to 400 °C for 1h, at which point H2S gas flow was started. The sample was then heated to 1000 °C for 2h and cooled to room temperature. The H2S gas was switched off at 800 °C during the cool down.
- ELTAlS-035-G, 533 nm peak, 41 nm FWHM. EuAlGaS4 was synthesized by combining Eu, Al2S3, Ga2S3 and S in stoichiometric amounts under Ar. The mixture was sealed in an evacuated quartz tube and heated to 400 °C (6h) then to 800 °C (12h). After grinding the product and adding 50 mg excess S, a second heat treatment was followed by heating to 400 °C (6h) then to 1000 °C (6h).
- ELTAlS-069, 533 nm peak, 41 nm FWHM. Reagents Eu, Al2S3, Ga2S3 and S were combined stoichiometrically to prepare EuAl1.35Ga1.35S5.05. Homogenization of the mixture was done in an Ar atmosphere in a mortar and pestle. 3wt% AlCl3 was used as a flux and the sample was sealed in an evacuated quartz tube. The reaction was done by heating the quartz ampoule to 400 °C (1h) then to 900 °C (6h). The product was recovered and manually ground with a mortar and pestle.
- ELTAlS-036-F, 528 nm peak, 45 nm FWHM. EuAl0.9Ga1.1S4 was synthesized from stoichiometric amounts of Eu, Al2S3, Ga metal, and S. The reactants were mixed under Ar then sealed in an evacuated quartz tube. Two heat treatments were followed to obtain the final product. Heat 1: 400 °C (12h), 800 °C (12h). Heat 2: 400 °C (12h), 1000 °C (6h). The sample was reground with 50 mg excess S and sealed in an evacuated quartz tube during the intermediate step.
- ELTAlS-036-E, 534 nm peak, 45 nm FWHM. EuAl0.8Ga1.2S4 was synthesized from stoichiometric amounts of Eu, Al2S3, Ga metal, and S. The reactants were mixed under Ar then sealed in an evacuated quartz tube. Two heat treatments were followed to obtain the final product. Heat 1: 400 °C (12h), 800 °C (12h). Heat 2: 400 °C (12h), 1000 °C (6h). The sample was reground with 50 mg excess S and sealed in an evacuated quartz tube during the intermediate step.
- ELTAlS-042E & F, 536 nm peak, 45 nm FWHM. Eu(Al0.4Ga0.6)2S4 was synthesized from a pre-fired mixture of stoichiometric amounts of Eu, Al2S3, Ga2S3 and S. The product was combined with 0.12 g I2 (15 wt%) and 0.16 g S (20 wt%) before separating into two portions and sealed into two evacuated quartz tubes. Both samples were heated to 950 °C (2h) then quenched in either air or water.
- ELTAlS-037-B, 550 nm peak, 51 nm FWHM. CaAl0.675Ga2.025S5.05:8.5%Eu was synthesized by combining CaS, Eu, Al2S3, Ga2S3 and S in stoichiometric amounts. The mixture was homogenized using a mortar and pestle under Ar, then loaded into a carbon-coated silica tube which was subsequently evacuated and sealed under vacuum. Synthesis was carried out by a stepwise heating approach: 290 °C (17h), 770 °C (24h), 870 °C (24h) and cooled to room temperature over 9h. The product was recovered and manually reground with 50 mg S before adding to another carbon-coated silica tube and heated to 400 °C (6h) and 1000 °C (3h).
- Phosphor slurries were created by combining Dow Corning OE-6550 2 part silicone, red phosphor, BR102/Q and a green phosphor, such as KB3-163-537. Phosphor converted LEDs were fabricated using portions of this slurry and applying them to 2835 PLCC packages from Power Opto Co.; the silicone was cured overnight at ca. 100 °C.
Claims (15)
- A light emitting device comprising:a semiconductor light source emitting blue light, wherein the blue light emitted by the semiconductor light source has a peak at from 430 nm to 465 nm and a full width at half maximum of 10 nm to 35 nm;a first phosphor arranged to be excited by the blue light emitted by the semiconductor light source and in response emit green light having a peak emission at from 500 nm to 550 nm with a full width at half maximum of 30 nm to 50 nm; anda second phosphor arranged to be excited by the blue light emitted by the semiconductor light source and in response emit red light having a peak emission at a wavelength from 620 nm and less than or equal to 635 nm, and a full width at half maximum of 70 nm to 100 nm;wherein an overall emission spectrum from the light emitting device has a depression between 550 nm and 580 nm, and the minimum intensity in the depression is greater than or equal to 25% and less than or equal to 75% of the maximum intensity in the overall emission spectrum in the range from 400 nm to 700 nm.
- The light emitting device of claim 1, wherein the green light emitted by the first phosphor has a full width at half maximum of less than or equal to about 45 nm.
- The light emitting device of claim 1, wherein the overall emission spectrum from the light emitting device has an R9 color rendering value of greater than or equal to 40; or wherein the overall emission spectrum from the light emitting device has a CRI greater than or equal to 80; orwherein the overall emission spectrum from the light emitting device has a luminous efficacy of radiation greater than or equal to 280 lumens per Watt; orwherein the overall emission spectrum from the light emitting device has an R9 color rendering value of greater than or equal to 50 and a luminous efficacy of radiation greater than or equal to 300 lumens per Watt.
- The light emitting device of claim 1, wherein the light emitting device does not comprise a phosphor emitting light having a peak emission greater than or equal to 635 nm.
- The light emitting device of claim 1, wherein:the first phosphor emits green light having a peak emission at from 500 nm to 540 nm; andthe overall emission spectrum from the light emitting device has an R9 color rendering value of greater than or equal to 40.
- The light emitting device of claim 5, wherein the first phosphor emits green light having a peak emission at from 520 nm to 540 nm; or
wherein the green light emitted by the first phosphor has a full width at half maximum of less than or equal to 45 nm. - The light emitting device of claim 5, wherein the overall emission spectrum from the light emitting device has a CRI greater than or equal to 80; orwherein the overall emission spectrum from the light emitting device has a luminous efficacy of radiation greater than or equal to 280 lumens per Watt; orwherein the overall emission spectrum from the light emitting device has an R9 color rendering value of greater than or equal to 50 and a luminous efficacy of radiation greater than or equal to 300 lumens per Watt.
- The light emitting device of claim 5, wherein the light emitting device does not comprise a phosphor emitting light having a peak emission greater than or equal to 635 nm.
- The light emitting device of claim 1, wherein the first phosphor emits green light having a peak emission at from 500 nm to 540 nm; the second phosphor emits red light having a peak emission equal to 620 nm; and
the overall emission spectrum from the light emitting device has an R9 color rendering value of greater than or equal to 0. - The light emitting device of claim 9, wherein the green light emitted by the first phosphor has a full width at half maximum of less than or equal to 45 nm.
- The light emitting device of claim 9, wherein the overall emission spectrum from the light emitting device has a CRI greater than or equal to 80; orwherein the overall emission spectrum from the light emitting device has a luminous efficacy of radiation greater than or equal to 280 lumens per Watt; orwherein the overall emission spectrum from the light emitting device has an R9 color rendering value of greater than or equal to 50 and a luminous efficacy of radiation greater than or equal to 300 lumens per Watt.
- The light emitting device of claim 9, wherein the light emitting device does not comprise a phosphor emitting light having a peak emission greater than or equal to 635 nm.
- The light emitting device of claim 1, wherein the first phosphor does not comprise quantum dots.
- The light emitting device of claim 1, wherein the first phosphor comprises quantum dots; or wherein the first phosphor is disposed directly on the semiconductor light source.
- The light emitting device of claim 1, wherein the light emitting device does not comprise a filter producing a depression between 550 nm and 590 nm.
Applications Claiming Priority (3)
| Application Number | Priority Date | Filing Date | Title |
|---|---|---|---|
| US201762539233P | 2017-07-31 | 2017-07-31 | |
| US15/679,021 US10056530B1 (en) | 2017-07-31 | 2017-08-16 | Phosphor-converted white light emitting diodes having narrow-band green phosphors |
| PCT/US2018/041638 WO2019027643A1 (en) | 2017-07-31 | 2018-07-11 | Phosphor-converted white light emitting diodes having narrow-band green phosphors |
Publications (3)
| Publication Number | Publication Date |
|---|---|
| EP3662519A1 EP3662519A1 (en) | 2020-06-10 |
| EP3662519A4 EP3662519A4 (en) | 2021-04-07 |
| EP3662519B1 true EP3662519B1 (en) | 2025-04-16 |
Family
ID=63143963
Family Applications (1)
| Application Number | Title | Priority Date | Filing Date |
|---|---|---|---|
| EP18840815.7A Active EP3662519B1 (en) | 2017-07-31 | 2018-07-11 | Phosphor-converted white light emitting diodes having narrow-band green phosphors |
Country Status (9)
| Country | Link |
|---|---|
| US (1) | US10056530B1 (en) |
| EP (1) | EP3662519B1 (en) |
| JP (1) | JP7332578B2 (en) |
| KR (1) | KR102396012B1 (en) |
| CN (1) | CN111164771B (en) |
| CA (1) | CA3107733C (en) |
| MX (1) | MX2020001321A (en) |
| TW (1) | TWI793145B (en) |
| WO (1) | WO2019027643A1 (en) |
Families Citing this family (6)
| Publication number | Priority date | Publication date | Assignee | Title |
|---|---|---|---|---|
| US10177287B1 (en) * | 2017-09-19 | 2019-01-08 | Eie Materials, Inc. | Gamut broadened displays with narrow band green phosphors |
| US11192494B2 (en) | 2020-02-07 | 2021-12-07 | Honeywell International Inc. | Systems and methods for search and landing light |
| JP7747658B2 (en) | 2020-04-14 | 2025-10-01 | ゼネラル・エレクトリック・カンパニイ | Ink compositions and films using narrow-band emitting phosphor materials |
| CN115667457A (en) * | 2020-04-14 | 2023-01-31 | 通用电气公司 | Green light emitting phosphor and device thereof |
| WO2022051302A1 (en) | 2020-09-01 | 2022-03-10 | General Electric Company | Devices compatible with night vision equipment |
| CN117296162A (en) | 2021-04-13 | 2023-12-26 | 通用电气公司 | Uranium-based phosphors and compositions for display and lighting applications |
Citations (1)
| Publication number | Priority date | Publication date | Assignee | Title |
|---|---|---|---|---|
| US20130285104A1 (en) * | 2011-01-18 | 2013-10-31 | Sharp Kabushiki Kaisha | Semiconductor light-emitting device |
Family Cites Families (51)
| Publication number | Priority date | Publication date | Assignee | Title |
|---|---|---|---|---|
| US3639254A (en) | 1969-07-01 | 1972-02-01 | Gte Laboratories Inc | Alkaline earth thiogallate phosphors |
| US3801702A (en) | 1971-04-30 | 1974-04-02 | Du Pont | Semiconducting europium-and/or ytterbium-containing sulfides and selenides of pseudo-orthorhombic crystal structure |
| US4441046A (en) | 1981-12-28 | 1984-04-03 | General Electric Company | Incandescent lamps with neodymium oxide vitreous coatings |
| JP2858397B2 (en) | 1994-09-07 | 1999-02-17 | 株式会社デンソー | Electroluminescence device and method of manufacturing the same |
| US6252254B1 (en) * | 1998-02-06 | 2001-06-26 | General Electric Company | Light emitting device with phosphor composition |
| JP3704057B2 (en) | 2000-07-07 | 2005-10-05 | ザ ウエステイム コーポレイション | Phosphor thin film and method for manufacturing the same, and EL panel |
| US6417019B1 (en) | 2001-04-04 | 2002-07-09 | Lumileds Lighting, U.S., Llc | Phosphor converted light emitting diode |
| US6627251B2 (en) | 2001-04-19 | 2003-09-30 | Tdk Corporation | Phosphor thin film, preparation method, and EL panel |
| US7005198B2 (en) | 2001-04-19 | 2006-02-28 | The Westaim Corporation | Phosphor thin film, preparation method, and EL panel |
| FR2826016B1 (en) | 2001-06-13 | 2004-07-23 | Rhodia Elect & Catalysis | COMPOUND BASED ON AN ALKALINE EARTH, SULFUR AND ALUMINUM, GALLIUM OR INDIUM, METHOD FOR PREPARING SAME AND USE THEREOF AS LUMINOPHORE |
| JP3704068B2 (en) | 2001-07-27 | 2005-10-05 | ザ ウエステイム コーポレイション | EL panel |
| US6806642B2 (en) * | 2001-09-04 | 2004-10-19 | Durel Corporation | Light source with cascading dyes and BEF |
| US7768189B2 (en) | 2004-08-02 | 2010-08-03 | Lumination Llc | White LEDs with tunable CRI |
| KR20050109528A (en) | 2003-03-04 | 2005-11-21 | 사르노프 코포레이션 | Efficient, size-selected green-emitting phosphors |
| US7125501B2 (en) | 2003-04-21 | 2006-10-24 | Sarnoff Corporation | High efficiency alkaline earth metal thiogallate-based phosphors |
| US7368179B2 (en) | 2003-04-21 | 2008-05-06 | Sarnoff Corporation | Methods and devices using high efficiency alkaline earth metal thiogallate-based phosphors |
| JP4740582B2 (en) * | 2004-03-19 | 2011-08-03 | 富士フイルム株式会社 | Electroluminescent device |
| JP2005321727A (en) * | 2004-05-11 | 2005-11-17 | Sony Corp | Backlight device and color liquid crystal display device |
| KR100658700B1 (en) * | 2004-05-13 | 2006-12-15 | 서울옵토디바이스주식회사 | Light emitting device combining RGB light emitting element and phosphor |
| WO2006001221A1 (en) * | 2004-06-29 | 2006-01-05 | Matsushita Electric Industrial Co., Ltd. | Illumination source |
| JP2008506011A (en) | 2004-07-06 | 2008-02-28 | サーノフ コーポレーション | Efficient green-emitting phosphor and combination with red-emitting phosphor |
| US7453195B2 (en) | 2004-08-02 | 2008-11-18 | Lumination Llc | White lamps with enhanced color contrast |
| US7497973B2 (en) | 2005-02-02 | 2009-03-03 | Lumination Llc | Red line emitting phosphor materials for use in LED applications |
| JP4104013B2 (en) * | 2005-03-18 | 2008-06-18 | 株式会社フジクラ | LIGHT EMITTING DEVICE AND LIGHTING DEVICE |
| JP2007056235A (en) | 2005-07-28 | 2007-03-08 | Sony Corp | Phosphor, optical device, and display device |
| WO2009093427A1 (en) * | 2008-01-21 | 2009-07-30 | Nichia Corporation | Light emitting device |
| US8740400B2 (en) | 2008-03-07 | 2014-06-03 | Intematix Corporation | White light illumination system with narrow band green phosphor and multiple-wavelength excitation |
| US20100289044A1 (en) * | 2009-05-12 | 2010-11-18 | Koninklijke Philips Electronics N.V. | Wavelength conversion for producing white light from high power blue led |
| US20110220920A1 (en) * | 2010-03-09 | 2011-09-15 | Brian Thomas Collins | Methods of forming warm white light emitting devices having high color rendering index values and related light emitting devices |
| US20120113671A1 (en) * | 2010-08-11 | 2012-05-10 | Sridhar Sadasivan | Quantum dot based lighting |
| US8921875B2 (en) | 2011-05-10 | 2014-12-30 | Cree, Inc. | Recipient luminophoric mediums having narrow spectrum luminescent materials and related semiconductor light emitting devices and methods |
| US9607821B2 (en) | 2011-09-13 | 2017-03-28 | Osram Sylvania Inc. | Modified spectrum incandescent lamp |
| US9123667B2 (en) * | 2011-10-04 | 2015-09-01 | Universal Display Corporation | Power-efficient RGBW OLED display |
| US9605815B2 (en) * | 2011-11-07 | 2017-03-28 | Kabushiki Kaisha Toshiba | White light source and white light source system including the same |
| US8884508B2 (en) * | 2011-11-09 | 2014-11-11 | Cree, Inc. | Solid state lighting device including multiple wavelength conversion materials |
| DE202013012940U1 (en) * | 2012-05-04 | 2023-01-19 | Soraa, Inc. | LED lamps with improved light quality |
| US8786179B2 (en) * | 2012-09-17 | 2014-07-22 | Universal Display Corporation | Light emitting device comprising phosphorescent materials for white light generation |
| JP6271301B2 (en) * | 2013-03-04 | 2018-01-31 | シチズン電子株式会社 | LIGHT EMITTING DEVICE AND LIGHT EMITTING DEVICE MANUFACTURING METHOD |
| US9243777B2 (en) | 2013-03-15 | 2016-01-26 | Cree, Inc. | Rare earth optical elements for LED lamp |
| JP6167913B2 (en) * | 2013-04-26 | 2017-07-26 | 日亜化学工業株式会社 | Phosphor and light emitting device using the same |
| MX362658B (en) * | 2013-09-09 | 2019-01-30 | Ge Lighting Solutions Llc | IMPROVED COLOR PREFERENCE LIGHT SOURCES. |
| JP6548104B2 (en) * | 2013-12-12 | 2019-07-24 | パナソニックIpマネジメント株式会社 | Light source module and light source unit |
| JP6323177B2 (en) | 2014-05-30 | 2018-05-16 | 日亜化学工業株式会社 | Semiconductor light emitting device |
| KR101467808B1 (en) * | 2014-07-14 | 2014-12-03 | 엘지전자 주식회사 | Phosphor emitting yellow light and light emitting device package using the same |
| JP2016042579A (en) | 2014-08-18 | 2016-03-31 | ソウル セミコンダクター カンパニー リミテッド | Light emitting diode package and manufacturing method thereof |
| JP6882164B2 (en) * | 2014-09-09 | 2021-06-02 | コンシューマー ライティング (ユー.エス.),エルエルシー | LED light source with improved color preference using LAG, nitride and PFS phosphor |
| CN104241507B (en) | 2014-09-18 | 2017-12-01 | 广东晶科电子股份有限公司 | Wide colour gamut LED and its backlight assembly |
| US9219201B1 (en) | 2014-10-31 | 2015-12-22 | Cree, Inc. | Blue light emitting devices that include phosphor-converted blue light emitting diodes |
| US9530944B2 (en) | 2015-01-27 | 2016-12-27 | Cree, Inc. | High color-saturation lighting devices with enhanced long wavelength illumination |
| US10479937B2 (en) * | 2015-10-09 | 2019-11-19 | Intematix Corporation | Narrow band red phosphor |
| KR20170073356A (en) * | 2015-12-18 | 2017-06-28 | 엘지이노텍 주식회사 | Phosphor, light emitting device having thereof and light unit having thereof |
-
2017
- 2017-08-16 US US15/679,021 patent/US10056530B1/en active Active
-
2018
- 2018-07-11 WO PCT/US2018/041638 patent/WO2019027643A1/en not_active Ceased
- 2018-07-11 CA CA3107733A patent/CA3107733C/en active Active
- 2018-07-11 KR KR1020207005855A patent/KR102396012B1/en active Active
- 2018-07-11 EP EP18840815.7A patent/EP3662519B1/en active Active
- 2018-07-11 CN CN201880056393.4A patent/CN111164771B/en active Active
- 2018-07-11 MX MX2020001321A patent/MX2020001321A/en unknown
- 2018-07-11 JP JP2020505415A patent/JP7332578B2/en active Active
- 2018-07-25 TW TW107125642A patent/TWI793145B/en active
Patent Citations (1)
| Publication number | Priority date | Publication date | Assignee | Title |
|---|---|---|---|---|
| US20130285104A1 (en) * | 2011-01-18 | 2013-10-31 | Sharp Kabushiki Kaisha | Semiconductor light-emitting device |
Also Published As
| Publication number | Publication date |
|---|---|
| KR102396012B1 (en) | 2022-05-10 |
| US10056530B1 (en) | 2018-08-21 |
| JP7332578B2 (en) | 2023-08-23 |
| WO2019027643A1 (en) | 2019-02-07 |
| EP3662519A4 (en) | 2021-04-07 |
| CA3107733A1 (en) | 2019-02-07 |
| CN111164771A (en) | 2020-05-15 |
| EP3662519A1 (en) | 2020-06-10 |
| KR20200036906A (en) | 2020-04-07 |
| TW201921731A (en) | 2019-06-01 |
| JP2020529733A (en) | 2020-10-08 |
| CN111164771B (en) | 2024-09-27 |
| MX2020001321A (en) | 2020-08-20 |
| TWI793145B (en) | 2023-02-21 |
| CA3107733C (en) | 2023-09-05 |
Similar Documents
| Publication | Publication Date | Title |
|---|---|---|
| CA3107733C (en) | Phosphor-converted white light emitting diodes having narrow-band green phosphors | |
| JP6448748B2 (en) | Equipment for exhibiting exhibits | |
| US7646032B2 (en) | White light LED devices with flat spectra | |
| JP2023058559A (en) | full spectrum white light emitting device | |
| KR101990475B1 (en) | Ultra-high color white light-emitting device with controlled emission spectrum and lighting device containing the same | |
| CN103339750B (en) | White light source | |
| EP2546897A1 (en) | White light illumination device | |
| KR20170134241A (en) | Light emitting device | |
| CN103649270A (en) | LED lighting device having a phosphor composition | |
| CA2487500C (en) | High lumen output fluorescent lamp with high color rendition | |
| CN104992895A (en) | Enhanced color contrast light source | |
| CN110915007A (en) | Low CCT LED design using PFS phosphors | |
| JP7237815B2 (en) | Semiconductor light emitting device and lighting device | |
| WO2020220689A1 (en) | Light-emitting system for healthy lighting, light bar and lamp | |
| WO2020220669A1 (en) | Novel light emitting lamp bead and lamp | |
| EP4717748A1 (en) | White light emitting devices with enhanced color quality | |
| GB2432041A (en) | A high lumen output fluorescent lamp with high colour rendition |
Legal Events
| Date | Code | Title | Description |
|---|---|---|---|
| STAA | Information on the status of an ep patent application or granted ep patent |
Free format text: STATUS: THE INTERNATIONAL PUBLICATION HAS BEEN MADE |
|
| PUAI | Public reference made under article 153(3) epc to a published international application that has entered the european phase |
Free format text: ORIGINAL CODE: 0009012 |
|
| STAA | Information on the status of an ep patent application or granted ep patent |
Free format text: STATUS: REQUEST FOR EXAMINATION WAS MADE |
|
| 17P | Request for examination filed |
Effective date: 20200218 |
|
| AK | Designated contracting states |
Kind code of ref document: A1 Designated state(s): AL AT BE BG CH CY CZ DE DK EE ES FI FR GB GR HR HU IE IS IT LI LT LU LV MC MK MT NL NO PL PT RO RS SE SI SK SM TR |
|
| AX | Request for extension of the european patent |
Extension state: BA ME |
|
| DAV | Request for validation of the european patent (deleted) | ||
| DAX | Request for extension of the european patent (deleted) | ||
| A4 | Supplementary search report drawn up and despatched |
Effective date: 20210304 |
|
| RIC1 | Information provided on ipc code assigned before grant |
Ipc: H01L 33/50 20100101AFI20210226BHEP |
|
| STAA | Information on the status of an ep patent application or granted ep patent |
Free format text: STATUS: EXAMINATION IS IN PROGRESS |
|
| 17Q | First examination report despatched |
Effective date: 20230313 |
|
| P01 | Opt-out of the competence of the unified patent court (upc) registered |
Effective date: 20230518 |
|
| GRAP | Despatch of communication of intention to grant a patent |
Free format text: ORIGINAL CODE: EPIDOSNIGR1 |
|
| STAA | Information on the status of an ep patent application or granted ep patent |
Free format text: STATUS: GRANT OF PATENT IS INTENDED |
|
| INTG | Intention to grant announced |
Effective date: 20241113 |
|
| GRAS | Grant fee paid |
Free format text: ORIGINAL CODE: EPIDOSNIGR3 |
|
| GRAA | (expected) grant |
Free format text: ORIGINAL CODE: 0009210 |
|
| STAA | Information on the status of an ep patent application or granted ep patent |
Free format text: STATUS: THE PATENT HAS BEEN GRANTED |
|
| AK | Designated contracting states |
Kind code of ref document: B1 Designated state(s): AL AT BE BG CH CY CZ DE DK EE ES FI FR GB GR HR HU IE IS IT LI LT LU LV MC MK MT NL NO PL PT RO RS SE SI SK SM TR |
|
| RAP3 | Party data changed (applicant data changed or rights of an application transferred) |
Owner name: CURRENT LIGHTING SOLUTIONS, LLC |
|
| REG | Reference to a national code |
Ref country code: GB Ref legal event code: FG4D |
|
| REG | Reference to a national code |
Ref country code: IE Ref legal event code: FG4D |
|
| REG | Reference to a national code |
Ref country code: DE Ref legal event code: R096 Ref document number: 602018081182 Country of ref document: DE |
|
| REG | Reference to a national code |
Ref country code: NL Ref legal event code: FP |
|
| REG | Reference to a national code |
Ref country code: AT Ref legal event code: MK05 Ref document number: 1786403 Country of ref document: AT Kind code of ref document: T Effective date: 20250416 |
|
| PG25 | Lapsed in a contracting state [announced via postgrant information from national office to epo] |
Ref country code: PT Free format text: LAPSE BECAUSE OF FAILURE TO SUBMIT A TRANSLATION OF THE DESCRIPTION OR TO PAY THE FEE WITHIN THE PRESCRIBED TIME-LIMIT Effective date: 20250818 Ref country code: ES Free format text: LAPSE BECAUSE OF FAILURE TO SUBMIT A TRANSLATION OF THE DESCRIPTION OR TO PAY THE FEE WITHIN THE PRESCRIBED TIME-LIMIT Effective date: 20250416 Ref country code: FI Free format text: LAPSE BECAUSE OF FAILURE TO SUBMIT A TRANSLATION OF THE DESCRIPTION OR TO PAY THE FEE WITHIN THE PRESCRIBED TIME-LIMIT Effective date: 20250416 |
|
| PGFP | Annual fee paid to national office [announced via postgrant information from national office to epo] |
Ref country code: DE Payment date: 20250620 Year of fee payment: 8 |
|
| REG | Reference to a national code |
Ref country code: LT Ref legal event code: MG9D |
|
| PG25 | Lapsed in a contracting state [announced via postgrant information from national office to epo] |
Ref country code: NO Free format text: LAPSE BECAUSE OF FAILURE TO SUBMIT A TRANSLATION OF THE DESCRIPTION OR TO PAY THE FEE WITHIN THE PRESCRIBED TIME-LIMIT Effective date: 20250716 Ref country code: GR Free format text: LAPSE BECAUSE OF FAILURE TO SUBMIT A TRANSLATION OF THE DESCRIPTION OR TO PAY THE FEE WITHIN THE PRESCRIBED TIME-LIMIT Effective date: 20250717 |
|
| PG25 | Lapsed in a contracting state [announced via postgrant information from national office to epo] |
Ref country code: PL Free format text: LAPSE BECAUSE OF FAILURE TO SUBMIT A TRANSLATION OF THE DESCRIPTION OR TO PAY THE FEE WITHIN THE PRESCRIBED TIME-LIMIT Effective date: 20250416 |
|
| PG25 | Lapsed in a contracting state [announced via postgrant information from national office to epo] |
Ref country code: BG Free format text: LAPSE BECAUSE OF FAILURE TO SUBMIT A TRANSLATION OF THE DESCRIPTION OR TO PAY THE FEE WITHIN THE PRESCRIBED TIME-LIMIT Effective date: 20250416 |
|
| PG25 | Lapsed in a contracting state [announced via postgrant information from national office to epo] |
Ref country code: HR Free format text: LAPSE BECAUSE OF FAILURE TO SUBMIT A TRANSLATION OF THE DESCRIPTION OR TO PAY THE FEE WITHIN THE PRESCRIBED TIME-LIMIT Effective date: 20250416 |
|
| PG25 | Lapsed in a contracting state [announced via postgrant information from national office to epo] |
Ref country code: AT Free format text: LAPSE BECAUSE OF FAILURE TO SUBMIT A TRANSLATION OF THE DESCRIPTION OR TO PAY THE FEE WITHIN THE PRESCRIBED TIME-LIMIT Effective date: 20250416 |
|
| PG25 | Lapsed in a contracting state [announced via postgrant information from national office to epo] |
Ref country code: RS Free format text: LAPSE BECAUSE OF FAILURE TO SUBMIT A TRANSLATION OF THE DESCRIPTION OR TO PAY THE FEE WITHIN THE PRESCRIBED TIME-LIMIT Effective date: 20250716 |
|
| PG25 | Lapsed in a contracting state [announced via postgrant information from national office to epo] |
Ref country code: IS Free format text: LAPSE BECAUSE OF FAILURE TO SUBMIT A TRANSLATION OF THE DESCRIPTION OR TO PAY THE FEE WITHIN THE PRESCRIBED TIME-LIMIT Effective date: 20250816 |
|
| PG25 | Lapsed in a contracting state [announced via postgrant information from national office to epo] |
Ref country code: LV Free format text: LAPSE BECAUSE OF FAILURE TO SUBMIT A TRANSLATION OF THE DESCRIPTION OR TO PAY THE FEE WITHIN THE PRESCRIBED TIME-LIMIT Effective date: 20250416 |
|
| PG25 | Lapsed in a contracting state [announced via postgrant information from national office to epo] |
Ref country code: DK Free format text: LAPSE BECAUSE OF FAILURE TO SUBMIT A TRANSLATION OF THE DESCRIPTION OR TO PAY THE FEE WITHIN THE PRESCRIBED TIME-LIMIT Effective date: 20250416 Ref country code: SM Free format text: LAPSE BECAUSE OF FAILURE TO SUBMIT A TRANSLATION OF THE DESCRIPTION OR TO PAY THE FEE WITHIN THE PRESCRIBED TIME-LIMIT Effective date: 20250416 |
|
| REG | Reference to a national code |
Ref country code: DE Ref legal event code: R097 Ref document number: 602018081182 Country of ref document: DE |
|
| PG25 | Lapsed in a contracting state [announced via postgrant information from national office to epo] |
Ref country code: CZ Free format text: LAPSE BECAUSE OF FAILURE TO SUBMIT A TRANSLATION OF THE DESCRIPTION OR TO PAY THE FEE WITHIN THE PRESCRIBED TIME-LIMIT Effective date: 20250416 |
|
| PG25 | Lapsed in a contracting state [announced via postgrant information from national office to epo] |
Ref country code: EE Free format text: LAPSE BECAUSE OF FAILURE TO SUBMIT A TRANSLATION OF THE DESCRIPTION OR TO PAY THE FEE WITHIN THE PRESCRIBED TIME-LIMIT Effective date: 20250416 |
|
| PG25 | Lapsed in a contracting state [announced via postgrant information from national office to epo] |
Ref country code: SK Free format text: LAPSE BECAUSE OF FAILURE TO SUBMIT A TRANSLATION OF THE DESCRIPTION OR TO PAY THE FEE WITHIN THE PRESCRIBED TIME-LIMIT Effective date: 20250416 Ref country code: RO Free format text: LAPSE BECAUSE OF FAILURE TO SUBMIT A TRANSLATION OF THE DESCRIPTION OR TO PAY THE FEE WITHIN THE PRESCRIBED TIME-LIMIT Effective date: 20250416 |
|
| PG25 | Lapsed in a contracting state [announced via postgrant information from national office to epo] |
Ref country code: IT Free format text: LAPSE BECAUSE OF FAILURE TO SUBMIT A TRANSLATION OF THE DESCRIPTION OR TO PAY THE FEE WITHIN THE PRESCRIBED TIME-LIMIT Effective date: 20250416 |
|
| PLBE | No opposition filed within time limit |
Free format text: ORIGINAL CODE: 0009261 |
|
| STAA | Information on the status of an ep patent application or granted ep patent |
Free format text: STATUS: NO OPPOSITION FILED WITHIN TIME LIMIT |
|
| REG | Reference to a national code |
Ref country code: CH Ref legal event code: H13 Free format text: ST27 STATUS EVENT CODE: U-0-0-H10-H13 (AS PROVIDED BY THE NATIONAL OFFICE) Effective date: 20260224 |
|
| REG | Reference to a national code |
Ref country code: CH Ref legal event code: L10 Free format text: ST27 STATUS EVENT CODE: U-0-0-L10-L00 (AS PROVIDED BY THE NATIONAL OFFICE) Effective date: 20260225 |
|
| PG25 | Lapsed in a contracting state [announced via postgrant information from national office to epo] |
Ref country code: LU Free format text: LAPSE BECAUSE OF NON-PAYMENT OF DUE FEES Effective date: 20250711 |
|
| 26N | No opposition filed |
Effective date: 20260119 |
|
| GBPC | Gb: european patent ceased through non-payment of renewal fee |
Effective date: 20250716 |
|
| REG | Reference to a national code |
Ref country code: BE Ref legal event code: MM Effective date: 20250731 |
|
| PG25 | Lapsed in a contracting state [announced via postgrant information from national office to epo] |
Ref country code: GB Free format text: LAPSE BECAUSE OF NON-PAYMENT OF DUE FEES Effective date: 20250716 |
|
| PG25 | Lapsed in a contracting state [announced via postgrant information from national office to epo] |
Ref country code: BE Free format text: LAPSE BECAUSE OF NON-PAYMENT OF DUE FEES Effective date: 20250731 |
|
| PG25 | Lapsed in a contracting state [announced via postgrant information from national office to epo] |
Ref country code: FR Free format text: LAPSE BECAUSE OF NON-PAYMENT OF DUE FEES Effective date: 20250731 |
|
| PG25 | Lapsed in a contracting state [announced via postgrant information from national office to epo] |
Ref country code: CH Free format text: LAPSE BECAUSE OF NON-PAYMENT OF DUE FEES Effective date: 20250731 |
|
| PG25 | Lapsed in a contracting state [announced via postgrant information from national office to epo] |
Ref country code: LT Free format text: LAPSE BECAUSE OF FAILURE TO SUBMIT A TRANSLATION OF THE DESCRIPTION OR TO PAY THE FEE WITHIN THE PRESCRIBED TIME-LIMIT Effective date: 20250416 |
|
| PG25 | Lapsed in a contracting state [announced via postgrant information from national office to epo] |
Ref country code: IE Free format text: LAPSE BECAUSE OF NON-PAYMENT OF DUE FEES Effective date: 20250711 |
|
| PG25 | Lapsed in a contracting state [announced via postgrant information from national office to epo] |
Ref country code: MC Free format text: LAPSE BECAUSE OF FAILURE TO SUBMIT A TRANSLATION OF THE DESCRIPTION OR TO PAY THE FEE WITHIN THE PRESCRIBED TIME-LIMIT Effective date: 20250416 |
|
| PGFP | Annual fee paid to national office [announced via postgrant information from national office to epo] |
Ref country code: NL Payment date: 20260622 Year of fee payment: 9 |
|
| PG25 | Lapsed in a contracting state [announced via postgrant information from national office to epo] |
Ref country code: CY Free format text: LAPSE BECAUSE OF FAILURE TO SUBMIT A TRANSLATION OF THE DESCRIPTION OR TO PAY THE FEE WITHIN THE PRESCRIBED TIME-LIMIT Effective date: 20250416 Ref country code: SE Free format text: LAPSE BECAUSE OF FAILURE TO SUBMIT A TRANSLATION OF THE DESCRIPTION OR TO PAY THE FEE WITHIN THE PRESCRIBED TIME-LIMIT Effective date: 20250416 |