EP3629936B1 - Systems and methods for automatic detection and visualization of turbulent blood flow using vector flow data - Google Patents
Systems and methods for automatic detection and visualization of turbulent blood flow using vector flow data Download PDFInfo
- Publication number
- EP3629936B1 EP3629936B1 EP18728569.7A EP18728569A EP3629936B1 EP 3629936 B1 EP3629936 B1 EP 3629936B1 EP 18728569 A EP18728569 A EP 18728569A EP 3629936 B1 EP3629936 B1 EP 3629936B1
- Authority
- EP
- European Patent Office
- Prior art keywords
- flow
- processor
- region
- display
- flow directions
- Prior art date
- Legal status (The legal status is an assumption and is not a legal conclusion. Google has not performed a legal analysis and makes no representation as to the accuracy of the status listed.)
- Active
Links
Images

Classifications
-
- A—HUMAN NECESSITIES
- A61—MEDICAL OR VETERINARY SCIENCE; HYGIENE
- A61B—DIAGNOSIS; SURGERY; IDENTIFICATION
- A61B8/00—Diagnosis using ultrasonic, sonic or infrasonic waves
- A61B8/06—Measuring blood flow
-
- A—HUMAN NECESSITIES
- A61—MEDICAL OR VETERINARY SCIENCE; HYGIENE
- A61B—DIAGNOSIS; SURGERY; IDENTIFICATION
- A61B8/00—Diagnosis using ultrasonic, sonic or infrasonic waves
- A61B8/46—Ultrasonic, sonic or infrasonic diagnostic devices with special arrangements for interfacing with the operator or the patient
- A61B8/461—Displaying means of special interest
-
- A—HUMAN NECESSITIES
- A61—MEDICAL OR VETERINARY SCIENCE; HYGIENE
- A61B—DIAGNOSIS; SURGERY; IDENTIFICATION
- A61B8/00—Diagnosis using ultrasonic, sonic or infrasonic waves
- A61B8/46—Ultrasonic, sonic or infrasonic diagnostic devices with special arrangements for interfacing with the operator or the patient
- A61B8/467—Ultrasonic, sonic or infrasonic diagnostic devices with special arrangements for interfacing with the operator or the patient characterised by special input means
- A61B8/469—Ultrasonic, sonic or infrasonic diagnostic devices with special arrangements for interfacing with the operator or the patient characterised by special input means for selection of a region of interest
-
- A—HUMAN NECESSITIES
- A61—MEDICAL OR VETERINARY SCIENCE; HYGIENE
- A61B—DIAGNOSIS; SURGERY; IDENTIFICATION
- A61B8/00—Diagnosis using ultrasonic, sonic or infrasonic waves
- A61B8/52—Devices using data or image processing specially adapted for diagnosis using ultrasonic, sonic or infrasonic waves
- A61B8/5215—Devices using data or image processing specially adapted for diagnosis using ultrasonic, sonic or infrasonic waves involving processing of medical diagnostic data
- A61B8/5238—Devices using data or image processing specially adapted for diagnosis using ultrasonic, sonic or infrasonic waves involving processing of medical diagnostic data for combining image data of patient, e.g. merging several images from different acquisition modes into one image
- A61B8/5246—Devices using data or image processing specially adapted for diagnosis using ultrasonic, sonic or infrasonic waves involving processing of medical diagnostic data for combining image data of patient, e.g. merging several images from different acquisition modes into one image combining images from the same or different imaging techniques, e.g. color Doppler and B-mode
-
- A—HUMAN NECESSITIES
- A61—MEDICAL OR VETERINARY SCIENCE; HYGIENE
- A61B—DIAGNOSIS; SURGERY; IDENTIFICATION
- A61B8/00—Diagnosis using ultrasonic, sonic or infrasonic waves
- A61B8/08—Clinical applications
- A61B8/0891—Clinical applications for diagnosis of blood vessels
-
- A—HUMAN NECESSITIES
- A61—MEDICAL OR VETERINARY SCIENCE; HYGIENE
- A61B—DIAGNOSIS; SURGERY; IDENTIFICATION
- A61B8/00—Diagnosis using ultrasonic, sonic or infrasonic waves
- A61B8/48—Diagnostic techniques
- A61B8/488—Diagnostic techniques involving Doppler signals
Definitions
- the present disclosure pertains to ultrasound systems and methods for automatic detection and visualization of turbulent blood flow using vector flow imaging.
- Ultrasound Doppler flow imaging has been used as a non-invasive diagnostic tool for assessment and quantification of blood flow hemodynamics.
- complex flow imaging is disclosed in US2015141832A1 .
- 2D) Color or Power Doppler imaging is first used to visually assess vessel patency, vessel stenosis, or intracardiac flow, which may be followed with Spectral Doppler for further quantitative measurement at specific sites. Spectral Doppler may provide higher accuracy velocity measurements.
- the present disclosure provides systems and methods for automatic detection and visualization of turbulent blood flow utilizing vector flow imaging data.
- systems and method according to the present disclosure use the vector flow data to determine localized variances of flow direction and speed, and display those variances in various ways on the user interface, for example in histogram displays.
- the determination of specific points to be localized and for which flow direction and/or speed is provided may be responsive to user inputs (e.g., a user selected region of interest) or automatic (e.g., responsive to a determination by the system of a suspicious region).
- techniques of the disclosure provide enhanced and more accurate flow pattern characterization and turbulent flow visualization to assist physicians in the diagnosis and monitoring of various cardiovascular conditions including artery stenosis and cardiac disorders.
- a system for visualization and quantification of ultrasound imaging data includes a display unit, and a processor communicatively coupled to the display unit and to an ultrasound imaging apparatus for generating an image from ultrasound data representative of a bodily structure and fluid flowing within the bodily structure.
- the processor is configured to estimate axial and lateral velocity components of the fluid flowing within the bodily structure, determine a plurality of flow directions within the image based on the axial and lateral velocity components, differentially encode the flow directions based on flow direction angle to generate a flow direction map, and cause the display unit to concurrently display the image including the bodily structure overlaid with the flow direction map.
- the processor is further configured to encode the flow directions using a color key including at least three distinct colors and to cause the display to display a visual representation of the color key.
- Each of the three distinct colors may be assigned to a specific flow direction. For example, a nominal zero orientation of flow may be selected, such as an orientation from the left to the right of the image and any velocity vectors aligned with this orientation may be referred to as having a zero-delta orientation from the nominal.
- the color red may be assigned to velocity vectors which have are angle 0 degrees to the nominal, that is, in this example a purely lateral velocity vector (i.e., having zero axial component) indicative of flow in a direction from left to right of the image.
- the color blue may then be assigned to an angle delta of 180 degrees, that is, in this example a purely lateral velocity vector (i.e., having zero axial component) indicative of flow in a direction from right to left of the image, and yellow may be assigned to either an angle delta of + 90 or to an angle delta of - 90, which in this example would be a purely axial velocity vector (i.e., having a zero lateral component) indicative of flow in a direction either from bottom to top of the image or from top to bottom of the image, respectively.
- the colors corresponding to all flow directions between purely lateral and/or axial velocity vectors may be assigned by generating a color gradient (e.g., using linear interpolation) between the primary colors.
- the visual representation of the color key may be in the form of a color bar which may be configured to show a color gradient and corresponding fluid flow directions.
- the visual representation of the color key may be in the form of a color wheel. The color wheel may be centered on an x-y coordinate frame with the positive x-axis aligned with the 0 degrees or nominal flow direction and the positive y-axis aligned with the + 90 degree relative to nominal flow direction. The color gradient may be superimposed onto the color wheel to provide a visual indication of colors corresponding with the different flow directions.
- the processor may be configured to perform statistical analysis on the flow directions obtained from the vector flow analysis and may be configured to identify a sub-region within the flow region that is exhibiting turbulent flow.
- the ROI may be automatically selected by the processor, e.g., to correspond to the identified sub-region of turbulent flow.
- the processor may be further configured to provide a visual indication of the ROI in the image.
- the user interface may provide user controls to enable the user to move and/or resize the ROI, for example an ROI automatically identified by the processor.
- the processor may be configured to cause the display unit to display additional quantitative information about the ROI, such as one or more histograms.
- the processor may be configured to perform statistical analysis using the multi-directional velocity data and may be configured to cause the display to display a histogram of the flow directions within the ROI or a statistical measure of variability of the flow directions within the ROI.
- the processor may be configured to cause the display to display a two-dimensional (2D) histogram displaying at least two of the flow directions at every pixel within the ROI, velocity magnitudes at every pixel within the ROI, and a statistical measure of variability of either the flow directions or velocity magnitudes associated with the ROI.
- the histograms may be displayed concurrently with flow visualization information (e.g., overlay images including a vector flow map or a color map of flow directions), while in other examples, the histograms may be displayed and/or output to a report regardless of whether visualization information of the fluid flow is displayed.
- flow visualization information e.g., overlay images including a vector flow map or a color map of flow directions
- the flow direction map, histogram displays and/or vector flow imaging information may be updated in real time.
- the processor may be configured to generate the histogram using time-averaged values, for example averaged over a pre-programmed or user-selected period of time such as over a given potion of the cardiac cycle (e.g., the duration of systole) or a fraction thereof.
- the system may receive an ECG signal to determine the period of time corresponding to the phase of the cardiac cycle over which data will be averaged.
- the processor may be configured to cause the display unit to concurrently display two or more ultrasound images and in some instances additionally, quantitative information about the fluid flow.
- the image including the flow direction map may be a first image, which may be displayed concurrently with an image including vector flow imaging (VFI) data also based on the axial and lateral velocity components. Similar to the image with the flow direction may, the VFI data may be overlaid on another background B-mode image of the bodily structure.
- the displays containing the flow direction may and the VFI data, for example when displaying the images in real-time, may be synchronized such that corresponding frames are displayed in each of the two vector flow visualization displays.
- the visualization and quantification system described herein may be incorporated with the ultrasound imaging apparatus. That is the processor and display units may be components of an ultrasound imaging system which also includes or is configured to be operably coupled to an ultrasound probe for acquiring the ultrasound image data.
- the processor may be further configured to automatically identify a flow sub-region comprising flow directions of statistical significance and to cause the display unit to display the image including the bodily structure and the identified statistically significant flow sub-region.
- the flow sub-region that includes flow directions of statistical significance may be a region or ROI within the flow region that includes flow directions associated with a moving average and/or standard deviation that exceeds or meets a threshold.
- the processor may be further configured to concurrently display a histogram of the flow directions within the automatically identified sub-region.
- the histogram may be a 2D histogram or a 3D histogram of flow directions and flow direction velocities within the sub-region.
- any of the methods in accordance with the present disclosure, or steps thereof, may be embodied in non-transitory computer-readable medium comprising executable instructions, which when executed may cause a processor of medical imaging system to perform method or steps embodied therein.
- Vector flow imaging can be used to visualize and quantify complex blood flow measurements in cardiovascular applications for better diagnosis of stenosis and other conditions of the vascular system. Since conventional Doppler ultrasound only allows velocity estimation along the axial direction (i.e., along the beam direction), new vector flow imaging techniques have been introduced to allow multi-directional (also referred to as beam-angle-independent) velocity estimations. Additionally, vector flow imaging techniques may be used to visualize the multi-directional velocity estimates using, for example, fixed-arrow-based, free-arrow-based, or pathlet-based visualization (see e.g., FIG. 3A ). For fixed-arrow-based visualization, the magnitude of flow velocity is encoded as color intensity, and is proportional to the length of the arrow.
- the direction of flow velocity is shown both by the arrow and color.
- the tail of the arrow is fixed in space.
- free arrow is used to dynamically track the blood flow.
- the magnitude of flow velocity is color encoded, and is proportional to the length of the arrow.
- the direction of flow velocity is indicated by the arrow.
- streamline may be defined as a family of curves that are instantaneously tangent to the velocity vector of the flow, and a pathline can be defined as a family of trajectories that the flow particles would faithfully follow during flow.
- pathlets-based (i.e. streamline, pathline) visualization dynamic curve tracing of the flow trajectory is achieved by curved pathlets.
- Pathlets can be seen as the short, frontal segments or parts of the pathlines, that start to fade out when distance from the tip exceeds a given threshold, which is defined as the pathlet length.
- the magnitude of flow velocity is color encoded, and is proportional to the length of the pathlets.
- the direction of flow velocity is indicated by the moving direction of pathlets.
- Additional shortcomings of existing VFI techniques may include the inability to perform point measurements of blood flow at certain locations of interest, which can further limit the capability of VFI to extract detailed spatiotemporal information of blood flow. Examples in accordance with the present disclosure may address one or more of the shortcomings of existing VFI systems and methods.
- VFI vector flow imaging
- Turbulent flow generally exhibits large variation in flow directions as well as speed.
- VFI techniques have been developed, which can overcome the limitations of conventional Doppler by their capability of obtaining beam-angle-independent, also referred to as multi-directional, velocity estimation.
- techniques such as fixed-arrow-based, free-arrow-based, and pathlet-based visualization may be used in some embodiments of the present disclosure for visualization of fluid flow velocity estimates, as will be further described.
- the present disclosure pertains to systems and methods which utilize VFI-based techniques for turbulent flow detection and assessment. The features can characterize flow patterns, visualize turbulent flows and assist physicians in diagnosis of artery stenosis, and cardiac disorders.
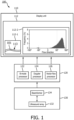
- FIG. 1 shows a block diagram of a system 100 according to embodiments of the present disclosure.
- a system 100 for visualization and quantification of ultrasound imaging data may include a display unit 110, and a processor 120 communicatively coupled to the display unit and to an ultrasound imaging apparatus 130 for generating an image from ultrasound data representative of a bodily structure 101 (e.g., a blood vessel) and fluid flowing within the bodily structure.
- the display unit 110 may be implemented using any type of suitable display technology such as passive or touch-sensitive LCD, LED, or OLED technologies.
- the ultrasound imaging apparatus 130 also referred to herein as ultrasound scanner, may include an ultrasound array 132 that may be housed in an external or an intravascular probe, and a beamformer 134, which may operate under the control of an imaging controller to direct ultrasound beams and receive ultrasound echoes from a subject (e.g., a patient) using the ultrasound array 132, which are then beam-formed and transmitted to one or more processors for further processing and image generation.
- the processor 120 and/or the display unit 110, or components thereof may be integrated with the ultrasound imaging apparatus 130, which may for example be any of the ultrasound imaging system, such as the SPRAQ or the EPIQ ultrasound system, provided by PHILIPS.
- the processor 120 may additionally or alternatively be configured to receive ultrasound imaging data, for example imaging data from an imaging session performed prior to visualization and quantification of the data by a clinician, and which has been stored in memory (e.g., memory storage device of a picture archiving and communication system (PACS)) for later access by the processor 120.
- memory e.g., memory storage device of a picture archiving and communication system (PACS)
- the processor 120 may be configured to generate ultrasound imaging data associated with two or more imaging modes (e.g., B-mode, Doppler imaging, Vector Flow imaging, etc.) for display on the display unit 110.
- the processor may include a B-mode processor 122 configured to generate B-mode images and a Doppler processor 124 configured to generate Doppler images (e.g., color-flow Doppler, spectral Doppler, and power Doppler such as Color Power Angio (CPA) images).
- Doppler images e.g., color-flow Doppler, spectral Doppler, and power Doppler such as Color Power Angio (CPA) images.
- images 112-1 may be displayed as overlays of imaging data obtained from multiple imaging modes.
- a gray-scale image of the anatomy i.e., a B-mode image
- color-flow Doppler data may be overplayed with color-flow Doppler data to provide, for example, a color-flow Doppler image.
- the processor 120 may be configured to generate vector field data including axial and lateral velocity components of the fluid flowing within the bodily structure.
- the processor 120 may include a vector flow processor 126 configured to generate beam-angle-independent velocity estimates from the beamformed RF signals received from the imaging apparatus 130.
- the processor 120 may be further configured to generate vector flow imaging (VFI) data based on the vector field data, which data may be overlaid on background B-mode images similar to B-mode/Doppler duplex imaging.
- VFI vector flow imaging
- the processor 120 may be configured to estimate beam-angle-independent velocities of fluid particles (e.g., axial, lateral, and in the case of 3D imaging elevational, velocity components of the fluid flowing within the bodily structure), also referred to as multi-directional velocity data or vector field data and display one or more images 112-1 including visualization data based on the multi-directional velocity data.
- the processor 120 is configured to determine a plurality of flow directions within the image based on the axial and lateral velocity components and to differentially encode the flow directions based on flow direction angle, such as to generate a flow direction map.
- the direction of flow at any given location within a flow region of the image may be obtained from the vector field data and may be used for further visualization and quantification, as described further below.
- the multi-directional velocity data e.g., axial and lateral velocity components
- the color map of the present disclosure is based on the beam-angle-independent velocity estimates, a more accurate visualization of parameters associated with the flow (e.g., the flow directions and/or quantitative information associated with the flow) may be achieved as would have otherwise been obtainable using conventional Colorflow Doppler which does not provide an accurate flow direction or make quantification of flow parameters possible.
- a variety of parameters including the flow direction at each pixel in an ROI, the magnitude at each pixel, or various statistical parameters (e.g., measures of statistical variability such as mean, median, standard deviation, or higher order statistical parameters) may be plotted on a 1D or 2D histogram in accordance with the present invention.
- the system 100 may display the flow distribution in the format of a histogram of flow direction and/or speed accompanied by statistical analysis (e.g., mean, standard deviation, and/or higher order statistics).
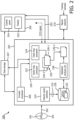
- FIG. 2 shows a block diagram of components of a system according to embodiments of the present disclosure.
- the components of system 200 will be described with reference also to FIGS. 3-6 , which show user interface windows provided by a system for visualization and quantification according to some examples herein. Multiple examples of screen captures of ultrasound images of a bodily structure are shown in FIGS. 3-6 to aid in better illustrating principles of the present invention.
- system 200 includes a processor 203 and a display unit 252.
- the processor 203 is configured to generate multi-directional velocity data and enable the user to visualize and quantify aspects of the multi-directional velocity data.
- the processor 203 may include a velocity vector estimator 210 and a visualization processor 220.
- the velocity vector estimator 210 may be configured to process received signals (e.g., quadrature or I/Q signals received from a signal processor of an ultrasound imaging apparatus) to estimate the beam-angle-independent velocity of the fluid in any given location within the flow region, interchangeably referred to as vector field data 215.
- the vector field data 215, in the context of this disclosure may include beam-angle-independent velocity estimates (e.g., axial, lateral and/or elevational velocity components) of the fluid flowing within the bodily structure.
- the velocity vector estimator 210 may output frames 232 of vector field data 215, which may be passed to the visualization processor 220 or temporarily stored in a frame buffer 230, e.g., until accessed by the visualization processor 220 for generating vector field visualization data 226 and/or statistical analysis.
- vector field data frames 232 may be stored in the buffer 230 until a sufficient number of frames have been obtained for generating time-averaged quantitative displays or histograms.
- the buffer 230 may store frames of visualization data (e.g., frames of vector flow maps or flow direction maps) until they are accessed for concurrent display with corresponding B-mode image frames.
- the frame buffer 230 may store frames of imaging data used at various stages of the visualization and quantification process, for example, frames of vector field data 215, frames of vector field visualization data (e.g., vector flow maps and/or flow direction maps), as well as quantitative information (e.g., histograms or other graphs or plots) of vector flow parameters or various parameters obtained through statistical analysis of the vector flow data, before such data is presented on a display to the user.
- the visualization and quantification data may additionally or alternatively be sent to a persistent storage device 207 (e.g., a memory device of a PACS server), where it can be stored for future access.
- the processor 203 may additionally or alternatively receive some or all of the ultrasound imaging data needed to generate images according to the present disclosure from the storage device 207. As described, the processor 203 may receive ultrasound imaging data 202 from a ultrasound imaging apparatus in real-time (e.g., while scanning the subject 201 and correspondingly the bodily structure 101), while in other embodiments, the processor 203 may retrieve previously-acquired ultrasound imaging data from the storage device 207 for generating images in accordance with the examples herein.
- the frames of vector field data may be coupled to a visualization processor 220 which is configured to provide different types of visual and quantitative information (e.g., image frames 226) based on the beam-angle-independent velocity data.
- the visualization processor 220 may include at least one of a vector map processor 222 and a color map processor 224, which are configured to generate color overlays for visualizing certain aspects of the vector flow data.
- the vector map processor 222 may generate visual representations of some or all of the velocity vectors associated with the flow region.
- These visual representations which may be interchangeably referred to herein as vector flow maps, may be in the form of fixed arrow visualizations, free arrow visualizations, pathlet-based visualizations, e.g., as shown in FIGS.
- the flow direction color maps and/or the vector maps may be overlaid with corresponding frames of background B-mode images of the anatomy (e.g., of bodily structure 101) to produce the ultrasound image frames 226-1, 226-2, which may be displayed on display unit 252 in real-time, or stored (e.g., in storage device 207) for later analysis.
- Multiple temporally sequential image frames may be displayed and/or stored for generating cineloops of vector flow visualization data overlaid on B-mode image data.
- the system 200 may generate one or more ultrasound images 226-2, which include a vector flow map overlaid on corresponding B-mode images, and may additionally or alternatively generate one or more ultrasound images 226-1, which include a color map of a flow variable (e.g., a flow direction map) overlaid on corresponding B-mode images.
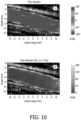
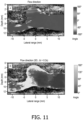
- the color map processor 224 may alternatively or additionally generate color maps of one or more different parameter associated with the flow, for example a statistical variability parameter obtained through statistical analysis based on the velocity vectors, such as a standard deviation of the flow direction, e.g. as shown in FIGS. 10 and 11 . For example, as shown in FIGS.
- a variety of other types of parameters associated with the flow can thus be presented visually to the user, e.g., to assist with appreciating blood flow hemodynamics and assist with diagnosis.
- the visualization processor 220 may further include a statistical analysis unit 228, which is configured to perform statistical analysis on the vector field data 215 to provide additional quantitative information 226-3 about the fluid flow.
- statistical analysis may be performed on data associated with a sub-region within the flow region for which vector flow was obtained.
- the sub-region also referred to as selected region of interest (ROI)
- ROI selected region of interest
- the selected ROI may be automatically defined by the processor 203, in some cases based on statistical analysis performed broadly over a portion or substantially all of the flow region.
- the flow in the flow region may be analyzed to identify areas of turbulent flow and the region associated with greatest turbulence may be selected as the initial selected ROI.
- the processor may be configured to receive subsequent user input to move and/or resize the processor-selected ROI.
- the processor may be configured to receive user input to select additional ROIs which may be concurrently analyzed and or visualized with the initially selected ROI.
- Quantitative information 226-3 may be generated and displayed for one or more ROIs within the flow region, as will be described further with reference to FIGS. 3-6 .
- the ROI selection may be based on vector flow visualization data provided either by the vector map processor 222 or the color map processor 224. That is, in some examples, the system may display only one type of overlay image and the user may select the ROI on the type of overlay provided. In other embodiments, the system may generate and display, in some cases concurrently, both a color map overlay 226-1 and a vector map overlay 226-2, and the user may select the ROI for quantification on either of the two images. In some examples, statistical analysis may be performed on the same flow parameter which is color coded in the color map overlay 226-1 (e.g., flow direction), such as when the user or the system select the ROI based on a displayed color map overlay image.
- flow parameter which is color coded in the color map overlay 226-1 (e.g., flow direction), such as when the user or the system select the ROI based on a displayed color map overlay image.
- the system may be configured to provide additional user controls (e.g., via the control panel 254) for specifying the flow parameter(s) for statistical analysis.
- additional user controls e.g., via the control panel 254
- the control panel 254 and display 252 are illustrated as separate components, it will be understood that in some embodiments, the control panel 254 or at least part of the functionality of the control panel for providing user controls may be integrated into and provided by a touch-sensitive display which also provides the function of displaying the images according to the examples herein.
- processor 203 may be communicatively coupled to a neural network 270 trained to identify a suspicious region from the larger imaged flow region.
- the statistical analysis unit 228 may receive input, such as thresholding parameters for comparison against the one or more measures of variability that may be computed by the statistical analysis unit 228 for identification of the selected ROI.
- the ROI identification may be performed substantially by the neural network, which may be trained to recognize certain flow patterns that may be indicative of vascular occlusions (e.g., vessel stenosis) or other types of vascular disease.
- the neural network 270 may be trained using training samples (e.g., prior patient screenings) from a diverse set of subjects that capture intra-patient and inter-patient variations, e.g., race, age, gender, etc. and other factors that may affect the suspicious region identification.
- the trained neural network 270 may then receive information about the subject (e.g., patient) being scanned and may identify or provide thresholds to the statistical analysis unit 228 for identifying a suspicious region for further quantification.
- Training samples may be retrieved from a data storage device (e.g., data storage 207 or the cloud).
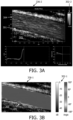
- FIGS. 3A and 3B show screen captures of ultrasound images 336-2, and 332-1, respectively, which show the blood flow through a bodily structure 401, in this case through a healthy carotid artery, at a given instance in time.
- the visualization of the velocity vector data is provided in the form of a vector flow map 304
- the visualization is provided in the form of a color map 306.
- the flow direction at any given location or pixel within the flow region is encoded in color and overlaid for display on a background image 305 of the anatomy.
- Each type of visualization data is associated and accompanied with a color key (e.g., color keys 302-2 and 302-1 as displayed concurrently with images 336-2 and 336-1, respectively).
- the magnitude of the velocity vectors may be encoded in color, for example by assigning two different colors to the minimum and maximum velocity (e.g., yellow for the minimum velocity magnitude of 0 cm/s and red for the maximum velocity, in this case 60 cm/s) and linearly interpolating a color gradient between the two colors associated with the minimum and maximum velocities and then assigning the corresponding color values to the pathlets in the vector flow map.
- the color gradient may be displayed as a gradient may be displayed as color key 302-2 alongside image 336-2.
- the mapped parameter in this case flow direction, may be encoded using a color key 302-1.
- the color key 302-1 associated with the color map may be defined by assigning at least three primary colors to three distinct flow directions and generating color gradients between each pair of adjacent primary colors to produce a color gradient for the full range of flow directions.
- the direction of flow at any given location may be defined in terms of the angle between a nominal direction (e.g., a nominal lateral direction going from the left side to the right side of the image) and the velocity vector as defined by the lateral and axial velocity components at that given location.
- the color blue may then be assigned to the 180 degree flow direction, that is, in this example to purely lateral velocity vectors oriented in a direction from right to left of the image, and yellow may be assigned to either the + 90 or - 90 degree direction, which in this example would be a purely axial velocity vector (i.e., having a zero lateral component) indicative of flow in a direction either from bottom to top of the image or from top to bottom of the image, respectively.
- a color gradient (e.g., by linearly interpolating between the primary colors) may be generated and respective colors assigned to each unique flow direction of the velocity vectors in the flow region in order to generate the color map. While the example in FIG.
- 3B shows a color map 306 that maps the flow directions at every location in the flow region
- a different parameter of variability of the vector field may be mapped instead, for example, the velocity magnitude at each pixel, or a statistical measure of variability of the flow direction or the magnitude in every location or pixel.
- the color key may be visually presented using different form factors.
- the color key may be in the form of a color bar, which is a familiar form factor that is also typically used to provide the grayscale key of a B-mode image identifying the range of amplitudes in the image.
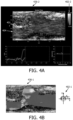
- the visual representation of the color key may be in the form of a color wheel, as shown in FIG. 4B .
- FIGS. 4A and 4B show screen captures of ultrasound images of a bodily structure, in this case showing a flow through a carotid artery with plaque.
- Each of the images 436-1 and 436-2 is overlaid with color data to provide a visualization of the velocity vector field.
- the image 436-1 is superimposed with a color map 406, again illustrating flow direction as the mapped parameter, and image 436-2 is superimposed with a vector flow map 404.
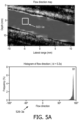
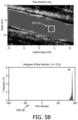
- FIGS. 5A and 5B shows example histograms (e.g., 526-3a and 526-3b) at two selected interrogation regions (or interchangeably, ROIs 503-1a and 503-1b) associated with the carotid flow shown in FIGS. 3A and 3B .
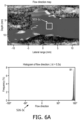
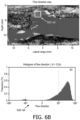
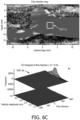
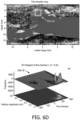
- FIGS. 6A and 6B shows example histograms (e.g., 526-3c and 526-3d) at two selected interrogation regions (or ROIs 503-1c and 503-1d) associated with the carotid flow shown in FIGS. 4A and 4B .
- an interrogation region or ROI may be selected, for example responsive to user inputs.
- the user may place a cursor on the vector flow visualization display (e.g., on either of the images 336-1 or 336-2) and outline the ROI by delineating a polygon shape with the cursor (or in the case of a touch sensitive display, may use a finger or stylus to select or outline the ROI on the display). Further quantification would then be performed by the system for the locations (i.e., pixels) in the selected ROI.
- the system may display the flow distribution in the ROI in the format of histogram of flow direction, speed, or statistical analysis (mean, standard deviation and/or higher order statistics) associated with the flow direction or speed.
- combination of parameters may be displayed using 2D histograms (e.g., as shown in FIGS. 6C and 6D ).
- the flow through a healthy carotid may be generally laminar thus resulting in a narrow-band histogram centered around the predominant direction of the flow.
- Both ROIs 503-1a and 503-1b produce similarly narrow-band histograms indicative of healthy laminar flow.
- the relatively narrow or tight distribution of the flow direction in the two selected regions 503-1a and 503-1b are indicative of a healthy fully opened lumen with a uniform cross-section.
- the histograms of the second selected region 503-1d show a wider distribution of flow directions and thus is indicative of greater variance and thus more turbulent flow, which may indicate a vessel occlusion such as plaque buildup or other reason for the flow disturbance that may indicate vessel disease.
- 2D histograms (e.g., 526-3e and 526-3f), which simultaneously plot multiple parameters and are presented for example in 3D fashion as shown in FIGS. 6C and 6D , may be generated.
- both flow direction and flow speed are displayed in the histograms 526-3e and 526-3f associated with the same two regions 503-1c and 503-1d, respectively that were shown also in FIGS. 6A and 6B .
- vector flow maps according to the present disclosure may be generated using pathlet-based visualization techniques, for example by generating and dynamically updating a visual representation of the frontal portion of the path traveled by the tracked particles.
- the vector flow image may provide a visual cue of the movement of the tracked particles (e.g., blood flow).
- Each pathlet begins fading out when a distance from the tip exceeds a given threshold.
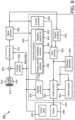
- the array 814 may be implemented using a plurality of patches, each comprising a sub-array of transducer elements and the array 814 may be configured to be conformably placed against the subject to be imaged.
- the array 814 is operable to transmit ultrasound toward a region of interest and to receive echoes for imaging the region of interest (ROI).
- ROI region of interest
- a variety of transducer arrays may be used, e.g., linear arrays, curved arrays, or phased arrays.
- the array 814 may include, for example, a two-dimensional array of transducer elements capable of scanning in both elevation and azimuth dimensions for 2D and/or 3D imaging.
- the scan converter 830 may arrange the echo signal into a two-dimensional (2D) sector-shaped format, or a pyramidal or otherwise shaped three dimensional (3D) format.
- the multiplanar reformatter 832 can convert echoes which are received from points in a common plane in a volumetric region of the body into an ultrasonic image (e.g., a B-mode image) of that plane, for example as described in U.S. Pat. No. 6,443,896 (Detmer ).
- a volume renderer 834 may generate an image of the 3D dataset as viewed from a given reference point, e.g., as described in U.S. Pat. No. 6,530,885 (Entrekin et al. ).
- signals from the signal processor 826 may be coupled to a Doppler processor 842, which may be configured to estimate the Doppler shift and generate Doppler image data.
- the Doppler image data may include colorflow data which may be overlaid with B-mode (or grayscale) image data for displaying a conventional duplex B-mode/Doppler image.
- the Doppler processor 842 may include a Doppler estimator such as an auto-correlator, in which velocity (Doppler frequency) estimation is based on the argument of the lag-one autocorrelation function and Doppler power estimation is based on the magnitude of the lag-zero autocorrelation function.
- Motion can also be estimated by known phase-domain (for example, parametric frequency estimators such as MUSIC, ESPRIT, etc.) or time-domain (for example, cross-correlation) signal processing techniques.
- Other estimators related to the temporal or spatial distributions of velocity such as estimators of acceleration or temporal and/or spatial velocity derivatives can be used instead of or in addition to velocity estimators.
- the velocity and power estimates may undergo threshold detection to reduce noise, as well as segmentation and post-processing such as filling and smoothing. The velocity and power estimates may then be mapped to a desired range of display colors in accordance with a color map.
- the color data also referred to as Doppler image data
- the vector flow processor 852 may also include a statistical analysis unit 854, which may perform statistical analysis using the vector field data to generate additional quantitative information about ROIs within the imaged tissue.
- the statistical analysis unit 854 may be operable to determine and display measures of flow variability within the ROI. Images output at this stage may be coupled to an image processor 836 for further enhancement, buffering and temporary storage before being displayed on an image display 854.
- the system may include a graphics processor 840, which may generate graphic overlays for display with the images. These graphic overlays may contain, e.g., standard identifying information such as patient name, date and time of the image, imaging parameters, and other annotations.
- the graphics processor may be configured to receive input from the user interface 824, such as a typed patient name.
- any of the processors herein may be incorporated into other processors (e.g., image processor 836 or volume renderer 834) resulting in a single or fewer number of discrete processing units.
- image processor 836 or volume renderer 834 e.g., volume renderer 836
- processing of the echo signals e.g., for purposes of generating B-mode images or Doppler images are discussed with reference to a B-mode processor and a Doppler processor, it will be understood that the functions of these processors may be integrated into a single processor, which may be combined with the functionality of the vector flow processing components.
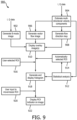
- FIG. 9 shows a flow diagram of a process 900 for visualizing and quantifying ultrasound imaging data in accordance with some embodiments of the present disclosure.
- the process 900 may be performed by a system (e.g., an ultrasound imaging system, analysis and visualization workstation, etc.) built in accordance with the principles of the present invention and as described further below, for example with reference to FIGS. 1-8 .
- ultrasound imaging data is acquired such as by scanning with an ultrasound imaging apparatus a subject and more specifically a bodily structure of the subject that contains a fluid throwing therethrough (e.g., a blood vessel).
- the ultrasound imaging apparatus is typically configured to process the acquired echo signals and extract quadrature components (i.e., I,Q data) of the echo signals.
- quadrature components i.e., I,Q data
- the quadrature components may be coupled in parallel paths to one or more processors (e.g., a B-mode processor, a Doppler processor, a Vector Flow processor) to extract relevant information (e.g., amplitude, Doppler shift estimates, velocity vector estimates, etc.) for producing different types of ultrasound images (e.g., B-mode images, color, power or spectral Doppler images, vector flow images, etc.).
- processors e.g., a B-mode processor, a Doppler processor, a Vector Flow processor
- relevant information e.g., amplitude, Doppler shift estimates, velocity vector estimates, etc.
- ultrasound images e.g., B-mode images, color, power or spectral Doppler images, vector flow images, etc.
- the process 900 may involve generating one or more grayscale (B-mode) images of the bodily structure (e.g., a vessel), as shown in block 902.
- B-mode grayscale
- beam-angle-independent velocity estimates i.e., axial, lateral and/or elevational velocity components
- the axial and lateral velocity estimates, and in the case of three-dimensional (3D) imaging the elevational, velocity estimates may be used to produce vector flow images (e.g., a visualization of the velocity vector field), as shown in block 906.
- the beam-angle-independent velocity estimates may be used to produce a flow direction map, as shown in block 908.
- the flow direction map may be visual representation of the flow directions for every spatial location within a flow region (e.g., the region inside the bodily structure that contains the fluid).
- the flow direction associated with every location in the flow region may be encoded in color and presented as a flow direction map (e.g., examples of which are shown in FIGS. 3-6 ).
- the process may continue by displaying one or more ultrasound images which include graphical representations of the beam-angle-independent velocity estimates overlaid on background images of the anatomy (e.g., B-mode images), as shown in block 910.
- the overlay ultrasound images may be dynamically updated in real-time. That is, in the case of the flow direction color map overlays, both the background B-mode image and the color overlay may be updated in real time, synchronously using the same refresh rate. In other examples, different refresh rates may apply to the two components of the overlay image, as may be appropriate based on computational resources.
- the process may continue by the system the receiving of a selection of a region of interest (ROI), which in some cases may be user-selected, as shown in block 916 or may be automatically-defined by the system, as shown in block 914.
- ROI region of interest
- the system may be configured to automatically identify a suspicious region by performing statistical analysis, as shown in block 912.
- the system may identify one or more regions exhibiting flow variability based on the statistical analysis and may designate the subset of pixels associated with greatest amount of flow variability as the ROI.
- multiple ROIs may be identified based on having identified multiple sub-regions associated with flow variability and these may be ranked and displayed along with the quantitative information (e.g., histograms) in sequence of diminishing severity.
- the processor may employ thresholding to exclude variability below a certain level from being designated as suspicious.
- the process may continue by generating and displaying graphical representations of quantitative information about the flow within the selected ROI. For example, histograms of the flow direction, velocity magnitude, combinations of the two, or statistical measures of variability or combinations of the statistical measures with the velocity parameters, may be displayed in either 2D or 3D fashion, as shown in block 918.
- the method may involve further user input to re-define quantification parameters, e.g., as shown in block 920. For example, the user may select additional ROIs, move or resize a current ROI, redefine temporal averaging windows, threshold parameters, etc.
- the system may also display an ROI indicator (also referred to as statistical analysis box), which provides feedback to the user as to the region that is being interrogated.
- ROI indicator also referred to as statistical analysis box
- a programmable device such as a computer-based system or programmable logic
- the above-described systems and methods can be implemented using any of various known or later developed programming languages, such as "C”, “C++”, “FORTRAN”, “Pascal”, “VHDL” and the like.
- various storage media such as magnetic computer disks, optical disks, electronic memories and the like, can be prepared that can contain information that can direct a device, such as a computer, to implement the above-described systems and/or methods.
- the storage media can provide the information and programs to the device, thus enabling the device to perform functions of the systems and/or methods described herein.
- the computer could receive the information, appropriately configure itself and perform the functions of the various systems and methods outlined in the diagrams and flowcharts above to implement the various functions. That is, the computer could receive various portions of information from the disk relating to different elements of the above-described systems and/or methods, implement the individual systems and/or methods and coordinate the functions of the individual systems and/or methods described above.
- processors described herein can be implemented in hardware, software and firmware. Further, the various methods and parameters are included by way of example only and not in any limiting sense. In view of this disclosure, those of ordinary skill in the art can implement the present teachings in determining their own techniques and needed equipment to affect these techniques, while remaining within the scope of the invention.
- the functionality of one or more of the processors described herein may be incorporated into a fewer number or a single processing unit (e.g., a CPU) and may be implemented using application specific integrated circuits (ASICs) or general-purpose processing circuits which are programmed responsive to executable instruction to perform the functions described herein.
- ASICs application specific integrated circuits
- the present system may have been described with particular reference to an ultrasound imaging system, it is also envisioned that the present system can be extended to other medical imaging systems where one or more images are obtained in a systematic manner. Accordingly, the present system may be used to obtain and/or record image information related to, but not limited to renal, testicular, breast, ovarian, uterine, thyroid, hepatic, lung, musculoskeletal, splenic, cardiac, arterial and vascular systems, as well as other imaging applications related to ultrasound-guided interventions. Further, the present system may also include one or more programs which may be used with conventional imaging systems so that they may provide features and advantages of the present system.
Landscapes
- Health & Medical Sciences (AREA)
- Life Sciences & Earth Sciences (AREA)
- Engineering & Computer Science (AREA)
- Heart & Thoracic Surgery (AREA)
- Molecular Biology (AREA)
- Nuclear Medicine, Radiotherapy & Molecular Imaging (AREA)
- Pathology (AREA)
- Radiology & Medical Imaging (AREA)
- Physics & Mathematics (AREA)
- Biomedical Technology (AREA)
- Veterinary Medicine (AREA)
- Medical Informatics (AREA)
- Biophysics (AREA)
- Surgery (AREA)
- Animal Behavior & Ethology (AREA)
- General Health & Medical Sciences (AREA)
- Public Health (AREA)
- Hematology (AREA)
- Computer Vision & Pattern Recognition (AREA)
- Ultra Sonic Daignosis Equipment (AREA)
Applications Claiming Priority (2)
| Application Number | Priority Date | Filing Date | Title |
|---|---|---|---|
| US201762510819P | 2017-05-25 | 2017-05-25 | |
| PCT/EP2018/063756 WO2018215641A1 (en) | 2017-05-25 | 2018-05-25 | Systems and methods for automatic detection and visualization of turbulent blood flow using vector flow data |
Publications (2)
| Publication Number | Publication Date |
|---|---|
| EP3629936A1 EP3629936A1 (en) | 2020-04-08 |
| EP3629936B1 true EP3629936B1 (en) | 2025-07-09 |
Family
ID=62492608
Family Applications (1)
| Application Number | Title | Priority Date | Filing Date |
|---|---|---|---|
| EP18728569.7A Active EP3629936B1 (en) | 2017-05-25 | 2018-05-25 | Systems and methods for automatic detection and visualization of turbulent blood flow using vector flow data |
Country Status (5)
| Country | Link |
|---|---|
| US (2) | US11534131B2 (enExample) |
| EP (1) | EP3629936B1 (enExample) |
| JP (2) | JP7304819B2 (enExample) |
| CN (1) | CN110678129B (enExample) |
| WO (1) | WO2018215641A1 (enExample) |
Families Citing this family (20)
| Publication number | Priority date | Publication date | Assignee | Title |
|---|---|---|---|---|
| WO2014063005A1 (en) | 2012-10-18 | 2014-04-24 | Washington University | Transcranialphotoacoustic/thermoacoustic tomography brain imaging informed by adjunct image data |
| WO2019169508A1 (en) | 2018-03-09 | 2019-09-12 | 1929803 Ontario Corp. D/B/A Flosonics Medical | Dynamically controllable patient fluid control device |
| US20190298304A1 (en) * | 2018-03-30 | 2019-10-03 | Canon Medical Systems Corporation | Medical diagnosis apparatus, medical image processing apparatus, and image processing method |
| CN109589136B (zh) * | 2018-12-29 | 2022-02-01 | 深圳开立生物医疗科技股份有限公司 | 一种显示设备和超声诊断系统 |
| US11602331B2 (en) * | 2019-09-11 | 2023-03-14 | GE Precision Healthcare LLC | Delivery of therapeutic neuromodulation |
| JP7379120B2 (ja) * | 2019-11-28 | 2023-11-14 | キヤノン株式会社 | 超音波診断装置、医用画像撮影装置、学習装置、超音波画像表示方法及びプログラム |
| JP7419081B2 (ja) * | 2020-01-24 | 2024-01-22 | キヤノン株式会社 | 超音波診断装置、画像処理方法、画像処理方法及びプログラム |
| WO2021217658A1 (zh) * | 2020-04-30 | 2021-11-04 | 深圳迈瑞生物医疗电子股份有限公司 | 血流向量速度、血流频谱的处理方法及超声设备 |
| WO2021223237A1 (zh) * | 2020-05-08 | 2021-11-11 | 深圳迈瑞生物医疗电子股份有限公司 | 确定血流形态的方法、超声装置及计算机存储介质 |
| CN115715171B (zh) * | 2020-06-23 | 2026-01-30 | 皇家飞利浦有限公司 | 根据短的欠采样信号群生成彩色多普勒图像的系统和方法 |
| US11619737B2 (en) * | 2020-07-01 | 2023-04-04 | Ge Precision Healthcare | Ultrasound imaging system and method for generating a volume-rendered image |
| WO2022008970A1 (en) | 2020-07-06 | 2022-01-13 | 1929803 Ontario Corp. D/B/A Flosonics Medical | Ultrasound patch with integrated flexible transducer assembly |
| CN116783509A (zh) * | 2020-12-18 | 2023-09-19 | 皇家飞利浦有限公司 | 具有基于解剖结构的声学设置的超声成像 |
| US12245890B2 (en) | 2021-02-11 | 2025-03-11 | Koninklijke Philips N.V. | Apparatuses, systems and methods for providing acquisition feedback |
| US20240225601A1 (en) * | 2021-05-14 | 2024-07-11 | The Board Of Trustees Of The Leland Stanford Junior University | Pediatric volumetric ultrasound scanner |
| US12504363B2 (en) | 2021-08-17 | 2025-12-23 | California Institute Of Technology | Three-dimensional contoured scanning photoacoustic imaging and virtual staining |
| US12357277B2 (en) * | 2021-11-23 | 2025-07-15 | GE Precision Healthcare LLC | Ultrasound imaging system and method for selecting an angular range for flow-mode images |
| CN114706822A (zh) * | 2022-03-16 | 2022-07-05 | 珞石(北京)科技有限公司 | 一种用于分析机械臂振动数据的平台 |
| US20230404520A1 (en) * | 2022-06-16 | 2023-12-21 | California Institute Of Technology | Methods and systems for photoacoustic computed tomography of blood flow |
| US12593986B2 (en) | 2023-04-12 | 2026-04-07 | California Institute Of Technology | Transmission mode-photoacoustic tomography of the human brain through an acoustic window |
Family Cites Families (28)
| Publication number | Priority date | Publication date | Assignee | Title |
|---|---|---|---|---|
| JPS62152439A (ja) * | 1985-12-26 | 1987-07-07 | アロカ株式会社 | 超音波画像形成装置 |
| JPH0833625A (ja) * | 1994-07-25 | 1996-02-06 | Hitachi Medical Corp | 超音波血流計測装置 |
| US5622173A (en) * | 1995-12-21 | 1997-04-22 | Hewlett-Packard Company | Color flow display with compensation for flow direction |
| WO2000068678A1 (en) | 1999-05-10 | 2000-11-16 | B-K Medical A/S | Estimation of vector velocity |
| US6530885B1 (en) | 2000-03-17 | 2003-03-11 | Atl Ultrasound, Inc. | Spatially compounded three dimensional ultrasonic images |
| US6443896B1 (en) | 2000-08-17 | 2002-09-03 | Koninklijke Philips Electronics N.V. | Method for creating multiplanar ultrasonic images of a three dimensional object |
| JP3771477B2 (ja) * | 2001-10-18 | 2006-04-26 | ジーイー・メディカル・システムズ・グローバル・テクノロジー・カンパニー・エルエルシー | 超音波画像表示方法および超音波診断装置 |
| US6589179B2 (en) * | 2001-11-27 | 2003-07-08 | Koninklijke Philips Electronics Nv | Three-dimensional doppler ultrasonic imaging system and method |
| JP2006520619A (ja) | 2003-02-13 | 2006-09-14 | コーニンクレッカ フィリップス エレクトロニクス エヌ ヴィ | 超音波カラーフロードプラ情報から合成されるフロースペクトログラム |
| JP5209213B2 (ja) * | 2006-01-10 | 2013-06-12 | 株式会社東芝 | 超音波診断装置及び超音波画像生成プログラム |
| CN101636113B (zh) * | 2007-04-27 | 2011-09-21 | 株式会社日立医药 | 超声波诊断装置 |
| JP5025400B2 (ja) * | 2007-09-28 | 2012-09-12 | 株式会社東芝 | 超音波診断装置、及び超音波画像処理装置 |
| US20110317881A1 (en) * | 2008-12-12 | 2011-12-29 | Koninklijke Philips Electronics N.V. | Flow sound in x-ray examination |
| US9204858B2 (en) * | 2010-02-05 | 2015-12-08 | Ultrasonix Medical Corporation | Ultrasound pulse-wave doppler measurement of blood flow velocity and/or turbulence |
| US9320496B2 (en) * | 2010-02-25 | 2016-04-26 | Siemens Medical Solutions Usa, Inc. | Volumetric is quantification for ultrasound diagnostic imaging |
| RU2610884C2 (ru) * | 2011-09-30 | 2017-02-17 | Конинклейке Филипс Н.В. | Ультразвуковая система с динамически автоматизированной установкой параметров потоковой допплерографии при движении контрольного объема |
| JP5972561B2 (ja) | 2011-12-08 | 2016-08-17 | 東芝メディカルシステムズ株式会社 | 超音波診断装置、画像処理装置及び画像処理プログラム |
| US9170330B2 (en) * | 2012-09-13 | 2015-10-27 | Analogic Corporation | Velocity estimation for vector flow imaging (VFI) in ultrasound |
| CN105120761B (zh) * | 2013-03-13 | 2020-02-07 | B-K医疗公司 | 具有曲线描迹的超声矢量流成像(vfi) |
| CN106456118B (zh) * | 2013-11-19 | 2019-12-31 | 港大科桥有限公司 | 超声流体向量成像装置及其方法 |
| WO2015076508A1 (en) * | 2013-11-21 | 2015-05-28 | Samsung Medison Co., Ltd. | Method and apparatus for displaying ultrasound image |
| US9977737B2 (en) * | 2013-12-25 | 2018-05-22 | Cavium, Inc. | Method and an apparatus for memory address allignment |
| US11112500B2 (en) | 2015-03-02 | 2021-09-07 | Bk Medical Aps | Ultrasound imaging flow vector velocity estimation with directional transverse oscillation |
| CN110013273B (zh) * | 2015-04-29 | 2022-07-29 | 深圳迈瑞生物医疗电子股份有限公司 | 超声血流成像显示方法及超声成像系统 |
| WO2016192114A1 (zh) * | 2015-06-05 | 2016-12-08 | 深圳迈瑞生物医疗电子股份有限公司 | 超声流体成像方法及超声流体成像系统 |
| CN107949331B (zh) * | 2016-06-30 | 2021-04-13 | 深圳迈瑞生物医疗电子股份有限公司 | 超声流体频谱多普勒成像方法和系统 |
| CN108882916B (zh) * | 2016-09-30 | 2022-06-10 | 深圳迈瑞生物医疗电子股份有限公司 | 超声血流的参数显示方法及其超声成像系统 |
| EP3600058B1 (en) | 2017-03-30 | 2021-02-17 | Koninklijke Philips N.V. | System and method for concurrent visualization and quantification of blood flow using ultrasound vector flow imaging |
-
2018
- 2018-05-25 CN CN201880034477.8A patent/CN110678129B/zh active Active
- 2018-05-25 US US16/616,753 patent/US11534131B2/en active Active
- 2018-05-25 EP EP18728569.7A patent/EP3629936B1/en active Active
- 2018-05-25 JP JP2019564518A patent/JP7304819B2/ja active Active
- 2018-05-25 WO PCT/EP2018/063756 patent/WO2018215641A1/en not_active Ceased
-
2022
- 2022-11-22 US US17/992,423 patent/US11969286B2/en active Active
-
2023
- 2023-04-28 JP JP2023073947A patent/JP7462816B2/ja active Active
Also Published As
| Publication number | Publication date |
|---|---|
| JP7462816B2 (ja) | 2024-04-05 |
| JP7304819B2 (ja) | 2023-07-07 |
| EP3629936A1 (en) | 2020-04-08 |
| US11969286B2 (en) | 2024-04-30 |
| JP2023100780A (ja) | 2023-07-19 |
| CN110678129A (zh) | 2020-01-10 |
| US20210145399A1 (en) | 2021-05-20 |
| WO2018215641A1 (en) | 2018-11-29 |
| US20230085700A1 (en) | 2023-03-23 |
| CN110678129B (zh) | 2023-01-03 |
| US11534131B2 (en) | 2022-12-27 |
| JP2020520732A (ja) | 2020-07-16 |
Similar Documents
| Publication | Publication Date | Title |
|---|---|---|
| US11969286B2 (en) | Systems and methods for automatic detection and visualization of turbulent blood flow using vector flow data | |
| US11398023B2 (en) | System and method for concurrent visualization and quantification of wall shear stress in blood vessels | |
| US20230329669A1 (en) | System and method for concurrent visualization and quantification of blood flow using ultrasound vector flow imaging | |
| KR102269467B1 (ko) | 의료 진단 이미징에서의 측정 포인트 결정 | |
| US11403778B2 (en) | Fetal development monitoring | |
| CN110381845A (zh) | 具有用于导出成像数据和组织信息的神经网络的超声成像系统 | |
| US20060058675A1 (en) | Three dimensional atrium-ventricle plane detection | |
| CN110446466A (zh) | 体积绘制的超声成像 | |
| EP3108456B1 (en) | Motion adaptive visualization in medical 4d imaging | |
| US20070255138A1 (en) | Method and apparatus for 3D visualization of flow jets | |
| EP3456265A1 (en) | Fetal development monitoring | |
| US9842427B2 (en) | Methods and systems for visualization of flow jets | |
| EP1876567A1 (en) | A method of determining the time dependent behavior of non rigid moving objects, particularly of biological tissues, from echographic ultrasound imaging data |
Legal Events
| Date | Code | Title | Description |
|---|---|---|---|
| STAA | Information on the status of an ep patent application or granted ep patent |
Free format text: STATUS: UNKNOWN |
|
| STAA | Information on the status of an ep patent application or granted ep patent |
Free format text: STATUS: THE INTERNATIONAL PUBLICATION HAS BEEN MADE |
|
| PUAI | Public reference made under article 153(3) epc to a published international application that has entered the european phase |
Free format text: ORIGINAL CODE: 0009012 |
|
| STAA | Information on the status of an ep patent application or granted ep patent |
Free format text: STATUS: REQUEST FOR EXAMINATION WAS MADE |
|
| 17P | Request for examination filed |
Effective date: 20200102 |
|
| AK | Designated contracting states |
Kind code of ref document: A1 Designated state(s): AL AT BE BG CH CY CZ DE DK EE ES FI FR GB GR HR HU IE IS IT LI LT LU LV MC MK MT NL NO PL PT RO RS SE SI SK SM TR |
|
| AX | Request for extension of the european patent |
Extension state: BA ME |
|
| DAV | Request for validation of the european patent (deleted) | ||
| DAX | Request for extension of the european patent (deleted) | ||
| STAA | Information on the status of an ep patent application or granted ep patent |
Free format text: STATUS: EXAMINATION IS IN PROGRESS |
|
| 17Q | First examination report despatched |
Effective date: 20221222 |
|
| GRAP | Despatch of communication of intention to grant a patent |
Free format text: ORIGINAL CODE: EPIDOSNIGR1 |
|
| STAA | Information on the status of an ep patent application or granted ep patent |
Free format text: STATUS: GRANT OF PATENT IS INTENDED |
|
| INTG | Intention to grant announced |
Effective date: 20250113 |
|
| GRAS | Grant fee paid |
Free format text: ORIGINAL CODE: EPIDOSNIGR3 |
|
| GRAA | (expected) grant |
Free format text: ORIGINAL CODE: 0009210 |
|
| STAA | Information on the status of an ep patent application or granted ep patent |
Free format text: STATUS: THE PATENT HAS BEEN GRANTED |
|
| AK | Designated contracting states |
Kind code of ref document: B1 Designated state(s): AL AT BE BG CH CY CZ DE DK EE ES FI FR GB GR HR HU IE IS IT LI LT LU LV MC MK MT NL NO PL PT RO RS SE SI SK SM TR |
|
| REG | Reference to a national code |
Ref country code: GB Ref legal event code: FG4D |
|
| REG | Reference to a national code |
Ref country code: CH Ref legal event code: EP |
|
| REG | Reference to a national code |
Ref country code: IE Ref legal event code: FG4D |
|
| REG | Reference to a national code |
Ref country code: DE Ref legal event code: R096 Ref document number: 602018083402 Country of ref document: DE |
|
| REG | Reference to a national code |
Ref country code: DE Ref legal event code: R084 Ref document number: 602018083402 Country of ref document: DE |
|
| REG | Reference to a national code |
Ref country code: NL Ref legal event code: MP Effective date: 20250709 |
|
| PG25 | Lapsed in a contracting state [announced via postgrant information from national office to epo] |
Ref country code: PT Free format text: LAPSE BECAUSE OF FAILURE TO SUBMIT A TRANSLATION OF THE DESCRIPTION OR TO PAY THE FEE WITHIN THE PRESCRIBED TIME-LIMIT Effective date: 20251110 |
|
| REG | Reference to a national code |
Ref country code: GB Ref legal event code: 746 Effective date: 20251118 |
|
| PG25 | Lapsed in a contracting state [announced via postgrant information from national office to epo] |
Ref country code: NL Free format text: LAPSE BECAUSE OF FAILURE TO SUBMIT A TRANSLATION OF THE DESCRIPTION OR TO PAY THE FEE WITHIN THE PRESCRIBED TIME-LIMIT Effective date: 20250709 |
|
| REG | Reference to a national code |
Ref country code: AT Ref legal event code: MK05 Ref document number: 1811050 Country of ref document: AT Kind code of ref document: T Effective date: 20250709 |
|
| PG25 | Lapsed in a contracting state [announced via postgrant information from national office to epo] |
Ref country code: IS Free format text: LAPSE BECAUSE OF FAILURE TO SUBMIT A TRANSLATION OF THE DESCRIPTION OR TO PAY THE FEE WITHIN THE PRESCRIBED TIME-LIMIT Effective date: 20251109 |
|
| PG25 | Lapsed in a contracting state [announced via postgrant information from national office to epo] |
Ref country code: NO Free format text: LAPSE BECAUSE OF FAILURE TO SUBMIT A TRANSLATION OF THE DESCRIPTION OR TO PAY THE FEE WITHIN THE PRESCRIBED TIME-LIMIT Effective date: 20251009 |
|
| REG | Reference to a national code |
Ref country code: LT Ref legal event code: MG9D |
|
| PG25 | Lapsed in a contracting state [announced via postgrant information from national office to epo] |
Ref country code: AT Free format text: LAPSE BECAUSE OF FAILURE TO SUBMIT A TRANSLATION OF THE DESCRIPTION OR TO PAY THE FEE WITHIN THE PRESCRIBED TIME-LIMIT Effective date: 20250709 |
|
| PG25 | Lapsed in a contracting state [announced via postgrant information from national office to epo] |
Ref country code: FI Free format text: LAPSE BECAUSE OF FAILURE TO SUBMIT A TRANSLATION OF THE DESCRIPTION OR TO PAY THE FEE WITHIN THE PRESCRIBED TIME-LIMIT Effective date: 20250709 |
|
| PG25 | Lapsed in a contracting state [announced via postgrant information from national office to epo] |
Ref country code: HR Free format text: LAPSE BECAUSE OF FAILURE TO SUBMIT A TRANSLATION OF THE DESCRIPTION OR TO PAY THE FEE WITHIN THE PRESCRIBED TIME-LIMIT Effective date: 20250709 |
|
| PG25 | Lapsed in a contracting state [announced via postgrant information from national office to epo] |
Ref country code: GR Free format text: LAPSE BECAUSE OF FAILURE TO SUBMIT A TRANSLATION OF THE DESCRIPTION OR TO PAY THE FEE WITHIN THE PRESCRIBED TIME-LIMIT Effective date: 20251010 |
|
| PG25 | Lapsed in a contracting state [announced via postgrant information from national office to epo] |
Ref country code: SE Free format text: LAPSE BECAUSE OF FAILURE TO SUBMIT A TRANSLATION OF THE DESCRIPTION OR TO PAY THE FEE WITHIN THE PRESCRIBED TIME-LIMIT Effective date: 20250709 |
|
| PG25 | Lapsed in a contracting state [announced via postgrant information from national office to epo] |
Ref country code: LV Free format text: LAPSE BECAUSE OF FAILURE TO SUBMIT A TRANSLATION OF THE DESCRIPTION OR TO PAY THE FEE WITHIN THE PRESCRIBED TIME-LIMIT Effective date: 20250709 |
|
| PG25 | Lapsed in a contracting state [announced via postgrant information from national office to epo] |
Ref country code: BG Free format text: LAPSE BECAUSE OF FAILURE TO SUBMIT A TRANSLATION OF THE DESCRIPTION OR TO PAY THE FEE WITHIN THE PRESCRIBED TIME-LIMIT Effective date: 20250709 Ref country code: PL Free format text: LAPSE BECAUSE OF FAILURE TO SUBMIT A TRANSLATION OF THE DESCRIPTION OR TO PAY THE FEE WITHIN THE PRESCRIBED TIME-LIMIT Effective date: 20250709 |
|
| PG25 | Lapsed in a contracting state [announced via postgrant information from national office to epo] |
Ref country code: RS Free format text: LAPSE BECAUSE OF FAILURE TO SUBMIT A TRANSLATION OF THE DESCRIPTION OR TO PAY THE FEE WITHIN THE PRESCRIBED TIME-LIMIT Effective date: 20251009 |
|
| PG25 | Lapsed in a contracting state [announced via postgrant information from national office to epo] |
Ref country code: ES Free format text: LAPSE BECAUSE OF FAILURE TO SUBMIT A TRANSLATION OF THE DESCRIPTION OR TO PAY THE FEE WITHIN THE PRESCRIBED TIME-LIMIT Effective date: 20250709 |
|
| PG25 | Lapsed in a contracting state [announced via postgrant information from national office to epo] |
Ref country code: SM Free format text: LAPSE BECAUSE OF FAILURE TO SUBMIT A TRANSLATION OF THE DESCRIPTION OR TO PAY THE FEE WITHIN THE PRESCRIBED TIME-LIMIT Effective date: 20250709 |
|
| PGFP | Annual fee paid to national office [announced via postgrant information from national office to epo] |
Ref country code: GB Payment date: 20260304 Year of fee payment: 9 |
|
| PG25 | Lapsed in a contracting state [announced via postgrant information from national office to epo] |
Ref country code: DK Free format text: LAPSE BECAUSE OF FAILURE TO SUBMIT A TRANSLATION OF THE DESCRIPTION OR TO PAY THE FEE WITHIN THE PRESCRIBED TIME-LIMIT Effective date: 20250709 |
|
| PG25 | Lapsed in a contracting state [announced via postgrant information from national office to epo] |
Ref country code: IT Free format text: LAPSE BECAUSE OF FAILURE TO SUBMIT A TRANSLATION OF THE DESCRIPTION OR TO PAY THE FEE WITHIN THE PRESCRIBED TIME-LIMIT Effective date: 20250709 |
|
| PG25 | Lapsed in a contracting state [announced via postgrant information from national office to epo] |
Ref country code: CZ Free format text: LAPSE BECAUSE OF FAILURE TO SUBMIT A TRANSLATION OF THE DESCRIPTION OR TO PAY THE FEE WITHIN THE PRESCRIBED TIME-LIMIT Effective date: 20250709 |
|
| REG | Reference to a national code |
Ref country code: CH Ref legal event code: W10 Free format text: ST27 STATUS EVENT CODE: U-0-0-W10-W00 (AS PROVIDED BY THE NATIONAL OFFICE) Effective date: 20260423 |
|
| PG25 | Lapsed in a contracting state [announced via postgrant information from national office to epo] |
Ref country code: EE Free format text: LAPSE BECAUSE OF FAILURE TO SUBMIT A TRANSLATION OF THE DESCRIPTION OR TO PAY THE FEE WITHIN THE PRESCRIBED TIME-LIMIT Effective date: 20250709 Ref country code: SK Free format text: LAPSE BECAUSE OF FAILURE TO SUBMIT A TRANSLATION OF THE DESCRIPTION OR TO PAY THE FEE WITHIN THE PRESCRIBED TIME-LIMIT Effective date: 20250709 |