EP3605066A1 - Method for measuring spectral radiation characteristics of fluorescence whitened sample, and device for measuring spectral radiation characteristics of fluorescence whitened sample - Google Patents
Method for measuring spectral radiation characteristics of fluorescence whitened sample, and device for measuring spectral radiation characteristics of fluorescence whitened sample Download PDFInfo
- Publication number
- EP3605066A1 EP3605066A1 EP18770285.7A EP18770285A EP3605066A1 EP 3605066 A1 EP3605066 A1 EP 3605066A1 EP 18770285 A EP18770285 A EP 18770285A EP 3605066 A1 EP3605066 A1 EP 3605066A1
- Authority
- EP
- European Patent Office
- Prior art keywords
- fluorescence
- spectral
- illumination light
- light
- spectral power
- Prior art date
- Legal status (The legal status is an assumption and is not a legal conclusion. Google has not performed a legal analysis and makes no representation as to the accuracy of the status listed.)
- Pending
Links
Images








Classifications
-
- G—PHYSICS
- G01—MEASURING; TESTING
- G01J—MEASUREMENT OF INTENSITY, VELOCITY, SPECTRAL CONTENT, POLARISATION, PHASE OR PULSE CHARACTERISTICS OF INFRARED, VISIBLE OR ULTRAVIOLET LIGHT; COLORIMETRY; RADIATION PYROMETRY
- G01J3/00—Spectrometry; Spectrophotometry; Monochromators; Measuring colours
- G01J3/02—Details
- G01J3/0205—Optical elements not provided otherwise, e.g. optical manifolds, diffusers, windows
- G01J3/0218—Optical elements not provided otherwise, e.g. optical manifolds, diffusers, windows using optical fibers
-
- G—PHYSICS
- G01—MEASURING; TESTING
- G01J—MEASUREMENT OF INTENSITY, VELOCITY, SPECTRAL CONTENT, POLARISATION, PHASE OR PULSE CHARACTERISTICS OF INFRARED, VISIBLE OR ULTRAVIOLET LIGHT; COLORIMETRY; RADIATION PYROMETRY
- G01J3/00—Spectrometry; Spectrophotometry; Monochromators; Measuring colours
- G01J3/02—Details
- G01J3/0205—Optical elements not provided otherwise, e.g. optical manifolds, diffusers, windows
- G01J3/0254—Spectrometers, other than colorimeters, making use of an integrating sphere
-
- G—PHYSICS
- G01—MEASURING; TESTING
- G01J—MEASUREMENT OF INTENSITY, VELOCITY, SPECTRAL CONTENT, POLARISATION, PHASE OR PULSE CHARACTERISTICS OF INFRARED, VISIBLE OR ULTRAVIOLET LIGHT; COLORIMETRY; RADIATION PYROMETRY
- G01J3/00—Spectrometry; Spectrophotometry; Monochromators; Measuring colours
- G01J3/28—Investigating the spectrum
- G01J3/44—Raman spectrometry; Scattering spectrometry ; Fluorescence spectrometry
- G01J3/4406—Fluorescence spectrometry
-
- G—PHYSICS
- G01—MEASURING; TESTING
- G01N—INVESTIGATING OR ANALYSING MATERIALS BY DETERMINING THEIR CHEMICAL OR PHYSICAL PROPERTIES
- G01N21/00—Investigating or analysing materials by the use of optical means, i.e. using sub-millimetre waves, infrared, visible or ultraviolet light
- G01N21/17—Systems in which incident light is modified in accordance with the properties of the material investigated
- G01N21/25—Colour; Spectral properties, i.e. comparison of effect of material on the light at two or more different wavelengths or wavelength bands
- G01N21/255—Details, e.g. use of specially adapted sources, lighting or optical systems
-
- G—PHYSICS
- G01—MEASURING; TESTING
- G01N—INVESTIGATING OR ANALYSING MATERIALS BY DETERMINING THEIR CHEMICAL OR PHYSICAL PROPERTIES
- G01N21/00—Investigating or analysing materials by the use of optical means, i.e. using sub-millimetre waves, infrared, visible or ultraviolet light
- G01N21/17—Systems in which incident light is modified in accordance with the properties of the material investigated
- G01N21/25—Colour; Spectral properties, i.e. comparison of effect of material on the light at two or more different wavelengths or wavelength bands
- G01N21/27—Colour; Spectral properties, i.e. comparison of effect of material on the light at two or more different wavelengths or wavelength bands using photo-electric detection ; circuits for computing concentration
- G01N21/274—Calibration, base line adjustment, drift correction
-
- G—PHYSICS
- G01—MEASURING; TESTING
- G01N—INVESTIGATING OR ANALYSING MATERIALS BY DETERMINING THEIR CHEMICAL OR PHYSICAL PROPERTIES
- G01N33/00—Investigating or analysing materials by specific methods not covered by groups G01N1/00 - G01N31/00
- G01N33/34—Paper
- G01N33/346—Paper sheets
-
- G—PHYSICS
- G01—MEASURING; TESTING
- G01N—INVESTIGATING OR ANALYSING MATERIALS BY DETERMINING THEIR CHEMICAL OR PHYSICAL PROPERTIES
- G01N21/00—Investigating or analysing materials by the use of optical means, i.e. using sub-millimetre waves, infrared, visible or ultraviolet light
- G01N21/62—Systems in which the material investigated is excited whereby it emits light or causes a change in wavelength of the incident light
- G01N21/63—Systems in which the material investigated is excited whereby it emits light or causes a change in wavelength of the incident light optically excited
- G01N21/64—Fluorescence; Phosphorescence
- G01N2021/6417—Spectrofluorimetric devices
-
- G—PHYSICS
- G01—MEASURING; TESTING
- G01N—INVESTIGATING OR ANALYSING MATERIALS BY DETERMINING THEIR CHEMICAL OR PHYSICAL PROPERTIES
- G01N21/00—Investigating or analysing materials by the use of optical means, i.e. using sub-millimetre waves, infrared, visible or ultraviolet light
- G01N21/62—Systems in which the material investigated is excited whereby it emits light or causes a change in wavelength of the incident light
- G01N21/63—Systems in which the material investigated is excited whereby it emits light or causes a change in wavelength of the incident light optically excited
- G01N21/64—Fluorescence; Phosphorescence
- G01N21/6428—Measuring fluorescence of fluorescent products of reactions or of fluorochrome labelled reactive substances, e.g. measuring quenching effects, using measuring "optrodes"
-
- G—PHYSICS
- G01—MEASURING; TESTING
- G01N—INVESTIGATING OR ANALYSING MATERIALS BY DETERMINING THEIR CHEMICAL OR PHYSICAL PROPERTIES
- G01N2201/00—Features of devices classified in G01N21/00
- G01N2201/06—Illumination; Optics
- G01N2201/062—LED's
-
- G—PHYSICS
- G01—MEASURING; TESTING
- G01N—INVESTIGATING OR ANALYSING MATERIALS BY DETERMINING THEIR CHEMICAL OR PHYSICAL PROPERTIES
- G01N2201/00—Features of devices classified in G01N21/00
- G01N2201/06—Illumination; Optics
- G01N2201/065—Integrating spheres
Definitions
- the present invention relates to a technology of measuring spectral radiation characteristics of a fluorescence whitened sample.
- a total spectral emissivity coefficient Bt(I, ⁇ ) represented by following equation (1) is used for measuring a color of the sample.
- the total spectral emissivity coefficient Bt(I, ⁇ ) is one of indices indicating the spectral radiation characteristics of the sample.
- a radiation light thereof is the sum of a reflected light and fluorescence, so that the total spectral emissivity coefficient Bt(I, ⁇ ) of the fluorescence whitened sample is represented by following equation (2).
- Br( ⁇ ) represents a spectral reflectivity coefficient.
- Bf(I, ⁇ ) represents a fluorescence spectral emissivity coefficient.
- a standard illumination light is required to obtain the total spectral emissivity coefficient Bt(I, ⁇ ) of the fluorescence whitened sample.
- a light source of the standard illumination light is not yet put into practical use.
- an approximation Bt(I, ⁇ ) of the total spectral emissivity coefficient Bt(I, ⁇ ) of the fluorescence whitened sample is obtained by an approximate measuring method.
- the conventional approximate measuring method obtains Bt(I, ⁇ ) using a specific bispectral fluorescence emissivity coefficient. For this reason, in a case where the fluorescence whitened sample the color of which is to be measured has a bispectral fluorescence emissivity coefficient different from the specific bispectral fluorescence emissivity coefficient, it is not possible to obtain a highly accurate approximation Bt(I, ⁇ ).
- Color characteristics of the sample are obtained using the total spectral emissivity coefficient.
- a radiation light from the sample illuminated and receiving light under a certain condition is set as a first radiation light
- a radiation light from a completely diffusing reflective surface (ideal white surface) illuminated and receiving light under the same condition is set as a second radiation light.
- the total spectral emissivity coefficient is a ratio between the first radiation light and the second radiation light for each wavelength.
- a reflectivity of the completely diffusing reflective surface is 1 over all the wavelengths, so that the total spectral emissivity coefficient is expressed by following equation (1) except for a proportional constant.
- Bt(I, ⁇ ) is the total spectral emissivity coefficient by an illumination light I.
- Rt(I, ⁇ ) is a spectral power distribution (SPD) of a sample radiation light by the illumination light I.
- I( ⁇ ) is a spectral power distribution of the illumination light I.
- B t I ⁇ R t I ⁇ I ⁇
- the total spectral emissivity coefficient Bt(I, ⁇ ) of the fluorescence whitened sample is the sum of the spectral reflectivity coefficient Br( ⁇ ) and the fluorescence spectral emissivity coefficient Bf(I, ⁇ ).
- the spectral reflectivity coefficient Br( ⁇ ) is a ratio for each wavelength between the reflected light from the sample illuminated and receiving light under a certain condition and the radiation light from the completely diffusing reflective surface illuminated and receiving light under the same condition.
- the spectral reflectivity coefficient Br( ⁇ ) does not depend on the illumination light, but the fluorescence spectral emissivity coefficient Bf(I, ⁇ ) provided by equations (3) and (4) depends on a bispectral fluorescence emissivity coefficient F( ⁇ , ⁇ ) of the sample and a spectral power distribution I( ⁇ ) of the illumination light, so that the total spectral emissivity coefficient Bt(I, ⁇ ) also depends on the spectral power distribution I( ⁇ ) of the illumination light.
- ⁇ represents an excitation wavelength included in a wavelength range of the illumination light
- ⁇ represents a fluorescence wavelength.
- Other than them represents a wavelength of the illumination light.
- Rf(I, ⁇ ) represents a spectral power distribution of fluorescence by the illumination light I.
- B f I ⁇ R f I ⁇ I ⁇
- R f I ⁇ ⁇ I ⁇ F ⁇ ⁇ d ⁇
- Patent Literature 1 The method of Patent Literature 1 is described.
- a fluorescence whitened sample x is illuminated with a first illumination light having a power in an ultraviolet range and a second illumination light having no power to obtain first and second total spectral emissivity coefficients Bt1( ⁇ ) and Bt2( ⁇ ) by the respective illumination lights, and the total spectral emissivity coefficients Bt1( ⁇ ) and Bt2( ⁇ ) are subjected to linear combination expressed by equation (5) by a weighting coefficient W( ⁇ ) set for each wavelength in advance, thereby obtaining a synthetic spectral emissivity coefficient Bt( ⁇ ) approximating the total spectral emissivity coefficient of the sample illuminated with the standard illumination light.
- W( ⁇ ) set for each wavelength in advance
- the above-described weighting coefficient W( ⁇ ) is set as follows.
- the total spectral emissivity coefficient of the fluorescence reference sample is Bt( ⁇ ).
- the fluorescence reference sample is illuminated with the first and second illumination lights, and the total spectral emissivity coefficients Bt1( ⁇ ) and Bt2( ⁇ ) by the respective illumination lights are measured.
- the weighting coefficient W( ⁇ ) is set for each wavelength such that linear combination W( ⁇ ) ⁇ Bt1( ⁇ ) + (1-W( ⁇ ))) ⁇ Bt2( ⁇ ) of Bt1( ⁇ ) and Bt2( ⁇ ) is equal to the spectral emissivity coefficient Bt( ⁇ ).
- Patent Literature 2 The method of Patent Literature 2 is described. This method is basically the same as the method of Patent Literature 1, but the fluorescence reference sample is not used when setting the weighting coefficient W( ⁇ ).
- a fluorescence spectral emissivity coefficient Bf1( ⁇ ) by a first illumination light is calculated by using equations (3) and (4) from a predetermined bispectral fluorescence emissivity coefficient of the fluorescence reference sample and a spectral power distribution of the first illumination light
- a fluorescence spectral emissivity coefficient Bf2( ⁇ ) by a second illumination light is calculated by using equations (3) and (4) from the bispectral fluorescence emissivity coefficient and a spectral power distribution of the second illumination light
- a fluorescence spectral emissivity coefficient Bf( ⁇ ) by a standard illumination light is calculated by using equations (3) and (4) from the bispectral fluorescence emissivity coefficient and the spectral power distribution of the standard illumination light, and a weighting coefficient W(
- An object of the present invention is to provide a method for measuring spectral radiation characteristics of a fluorescence whitened sample capable of improving an approximate measuring method, and a device for measuring spectral radiation characteristics of the fluorescence whitened sample.
- First step Spectral power distributions Rf(Ik, ⁇ ) of fluorescence are obtained from the spectral power distributions R(Ik, ⁇ ) by respective excitation lights Ik.
- Second step: The spectral power distributions Rf(Ik, ⁇ ) of fluorescence by the respective excitation lights Ik are linearly combined with a given weighting coefficient Wk, and an approximation Rf(Id, ⁇ ) of a spectral power distribution Rf(Id, ⁇ ) of fluorescence by the standard illumination light Id is obtained by following equation (6). [Math. 66] R f ′ I d ⁇ ⁇ k W k ⁇ R f I k ⁇
- Br( ⁇ ) is an approximation of a spectral reflectivity coefficient Br( ⁇ ).
- Bf(Id, ⁇ ) is an approximation of a fluorescence spectral emissivity coefficient Bf(Id, ⁇ ) by the standard illumination light Id.
- the approximations Br( ⁇ ) and Bf(Id, ⁇ ) are obtained without using a specific bispectral fluorescence emissivity coefficient F( ⁇ , ⁇ ).
- the approximation Bt(Id, ⁇ ) may be obtained without using the specific bispectral fluorescence emissivity coefficient F( ⁇ , ⁇ ).
- the approximation Bf(Id, ⁇ ) is obtained by using following equation (7).
- Id( ⁇ ) represents a spectral power distribution of the standard illumination light Id.
- Rf(Id, ⁇ ) represents an approximation of a spectral power distribution Rf(Id, ⁇ ) of fluorescence by the standard illumination light Id.
- This approximation Rf(Id, ⁇ ) is obtained by using following equation (6).
- Wk represents a weighting coefficient.
- the approximation Br( ⁇ ) is obtained by using following equation (16).
- Ivis( ⁇ ) represents a spectral power distribution of measuring range illumination light Ivis (visible range illumination light).
- Rr(Ivis, ⁇ ) represents a spectral power distribution of the sample reflected light by the measuring range illumination light Ivis.
- Rf(Ivis, ⁇ ) represents a spectral power distribution of fluorescence by the measuring range illumination light Ivis.
- Rf(Ivis, ⁇ ) is subtracted from R(Ivis, ⁇ ). Therefore, according to this approximation Br( ⁇ ), an effect of fluorescence may be removed, so that it is possible to meet requirements of the paper manufacturing industry.
- Br( ⁇ ) an effect of fluorescence may be removed, so that it is possible to meet requirements of the paper manufacturing industry.
- the embodiment uses an approximate measuring method.
- the embodiment is based on equation (2) in which the approximation Bf(Id, ⁇ ) of the fluorescence spectral emissivity coefficient Bf(Id, ⁇ ) by the standard illumination light Id and the approximation Br( ⁇ ) of the spectral reflectivity coefficient Br( ⁇ ) by the standard illumination light Id are obtained, and the sum of the approximation Bf(Id, ⁇ ) and the approximation Br( ⁇ ) is obtained.
- this sum is the approximation Bt(Id, ⁇ ) of the total spectral emissivity coefficient Bt(Id, ⁇ ) by the standard illumination light Id.
- the illumination light having the spectral power distribution approximating the spectral power distribution Id( ⁇ ) of the standard illumination light Id at least in the excitation range (300 to 420 nm) is required.
- the excitation range 300 to 420 nm
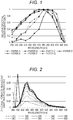
- Fig. 1 is a graph illustrating a relationship between a wavelength and a relative spectral quantum efficiency regarding seven types of common fluorescence whitened paper. As illustrated in Fig. 1 , there is similarity among the relative spectral quantum efficiencies of the commonly used fluorescence whitened paper and they may be classified into a plurality of appropriately set types.
- illumination light of the monochromatic LED may be used as the excitation light Ik. Sufficient accuracy may be obtained even with a small number of monochromatic illumination lights Ik by using the excitation light Ik of an appropriate wavelength.
- the radiation light (reflected light + fluorescence) is generated from the fluorescence whitened paper irradiated with the illumination light.
- a wavelength range of the reflected light and a wavelength range of the fluorescence have an overlapping range, not equation (6) but following equation (11) is used. This is hereinafter described in detail.
- Fig. 3 is a graph illustrating a relationship between wavelengths of various types of LEDs and the spectral power.
- a method of obtaining the approximation Rf(Id, ⁇ ) is described taking a case where two monochromatic illumination lights I1 and I2 having the LED with a central wavelength of 360 nm (UV360 in Fig. 3 ) and the LED with a central wavelength of 405 nm (V405 in Fig. 3 ) as light sources are used as an example for the sake of simplicity.
- Fig. 2 is a graph illustrating the spectral powers when the seven types of common fluorescence whitened paper are irradiated with the monochromatic light.
- the spectral power include the spectral power of the reflected light and the spectral power of the fluorescence.
- a fluorescence range of the common fluorescence whitened paper is 390 to 600 nm, but the excitation light having the power within the fluorescence range has the overlapping range where the fluorescence and the reflected light much stronger than the same coexist.
- the measuring range is set to a visible range of 400 to 700 nm.
- a spectral power distribution R(I1, ⁇ ) of 400 to 700 nm provides a spectral power distribution Rf(I1, ⁇ ) of fluorescence in the sample radiation light by the monochromatic illumination light I1 having the central wavelength of 360 nm and no overlapping range in the fluorescence range (390 to 600 nm) (the spectral power distribution Rf(Ik, ⁇ ) of fluorescence is obtained from the spectral power distribution R(Ik, ⁇ ) by each excitation light Ik: a spectral power distribution Rf(Ik1, ⁇ ) of fluorescence by a first type of excitation light Ik1 is provided by a spectral power distribution R(Ik1, ⁇ ) of a sample radiation light by the first type of excitation light Ik1).
- Rf(Ik, ⁇ ) included in equation (6) may be obtained (measured).
- Rf(Ik, ⁇ ) included in equation (6) may be obtained (measured).
- a spectral power distribution Rf(I2, ⁇ ) of fluorescence is provided outside the overlapping range (430 to 700 nm), but a spectral power distribution Rf(I2, ⁇ ) of fluorescence is not provided within the overlapping range (400 to 430 nm) due to an effect of the reflected light.
- a coefficient K for adjusting the power is provided by equation (8) by a ratio between the spectral power distributions Rf(I1, ⁇ r1) and Rf(I2, ⁇ r1) of fluorescence by the monochromatic illumination lights I1 and I2 at one or more reference wavelength ⁇ r1 outside the overlapping range (for example, 440 nm).
- the coefficient K may be reworded as a ratio between the spectral power distributions R(I1, ⁇ r1) and R(I2, ⁇ r1) of the sample radiation lights by the monochromatic illumination lights I1 and I2 at the reference wavelength ⁇ r1.
- K R f I 2 ⁇ r 1
- R f I 1 ⁇ r 1 R I 2 ⁇ r 1 R I 1 ⁇ r 1
- the fluorescence wavelength ⁇ introduces a correction coefficient C( ⁇ ) reflecting that this is always longer than the excitation wavelength ⁇ , and provides by equation (9) the approximation Rf(I2, ⁇ ) of the spectral power distribution Rf(I2, ⁇ ) of fluorescence by the monochromatic illumination light 12.
- Equation (9a) expresses a case within the overlapping range
- equation (9b) expresses a case outside the overlapping range. Outside the overlapping range, as described above, the spectral power distribution Rf(I2, ⁇ ) of fluorescence by the monochromatic illumination light 12 is provided, so that this is used as the approximation Rf(I2, ⁇ ).
- Rf(I1, ⁇ ) may be reworded as R(I1, ⁇ )
- Rf(I2, ⁇ ) may be reworded as R(I2, ⁇ ).
- the correction coefficient C( ⁇ ) is provided by equation (10).
- ⁇ represents the above-described excitation wavelength.
- ⁇ represents the fluorescence wavelength.
- Rf(Id, ⁇ ) of the spectral power distribution Rf(Id, ⁇ ) of fluorescence by the standard illumination light Id is provided by equation (11) by using the spectral power distribution of Rf(I1, ⁇ ) of fluorescence by the monochromatic illumination light I1 and the approximation Rf(I2, ⁇ ) of the spectral power distribution Rf(I2, ⁇ ) of fluorescence by the monochromatic illumination light 12.
- R f ′ I d ⁇ W 1 ⁇ R f I 1 ⁇ + W 2 ⁇ R f ′ I 2 ⁇
- the weighting coefficient Wk is set such that a spectral power distribution Id( ⁇ ) of a synthetic excitation light Id provided by equation (12) approximates the spectral power distribution Id( ⁇ ) of the standard illumination light Id (setting method 1).
- I d ′ ⁇ ⁇ k W k ⁇ I k ⁇
- the setting method 2 is described.
- the weighting coefficient Wk is optimized such that the spectral power distribution of synthetic fluorescence expressed by the right side of equation (6) for the common fluorescence whitened paper approximates the fluorescence spectral power distribution Rf(Id, ⁇ ) by the standard illumination light Id.
- Fig. 1 For example, the relative spectral quantum efficiencies of representative fluorescence whitened paper (paper A, paper B, paper C, paper D, paper E, paper F, and paper G) illustrated in Fig. 1 may be classified into four types illustrated in Fig. 4 .
- the weighting coefficient Wk is set such that the spectral power distribution Rf,T(Id, ⁇ ) of synthetic fluorescence obtained by linearly combining the spectral power distributions Rf,T(Ik, ⁇ ) of fluorescence by a plurality of excitation lights Ik by following equation (27) approximates the spectral power distribution Rf,T(Id, ⁇ ) of fluorescence by the standard illumination light Id for all of a plurality of bispectral fluorescence emissivity coefficients FT( ⁇ , ⁇ ).
- R f , T ′ I d ⁇ ⁇ k W k ⁇ R f , T I k ⁇
- the setting method 3 is described. As described above, the relative spectral power distribution of fluorescence does not depend on the excitation wavelength and is almost constant, so that it is possible to replace Rf,T(I1, ⁇ ), Rf,T(I2, ⁇ ), and Rf,T(Id, ⁇ ) described above with fluorescence powers Rf,T(I1, ⁇ r2), Rf,T(I2, ⁇ r2), and Rf,T(Id, ⁇ r2) at one or more wavelengths ⁇ r2 (for example, wavelength of 440 nm close to a peak not affected by reflection of the excitation light).
- the weighting coefficients W1 and W2 such that the sum of squares dRf ⁇ dRf of a difference between Rf,T(Id, ⁇ r2) and Rf,T(Id, ⁇ r2) of each type provided by equation (13) becomes the minimum may be obtained by a least square method (setting method 3).
- Rf,T(I1, ⁇ r2), Rf,T(I2, ⁇ r2), and Rf,T(Id, ⁇ r2) are obtained by equations (14) and (15) from a spectral quantum efficiency FT( ⁇ , ⁇ r2) for the fluorescence at the wavelength ⁇ r2 of each type obtained in advance and spectral power distributions I1( ⁇ ), I2( ⁇ ), and Id( ⁇ ) of each illumination light.
- the spectral quantum efficiency FT( ⁇ , ⁇ r2) for the fluorescence at the wavelength ⁇ r2 of each type is as follows.
- the spectral quantum efficiencies FT( ⁇ , ⁇ r2) for the fluorescence at the reference wavelength ⁇ r2 of the fluorescence whitened sample to be measured are classified into a plurality of types, and a plurality of different spectral quantum efficiencies is a plurality of types of spectral quantum efficiencies.
- the approximation Br( ⁇ ) of the spectral reflectivity coefficient Br( ⁇ ) is obtained by dividing the spectral power distribution Rr(Ivis, ⁇ ) of the sample reflected light by the measuring range illumination light Ivis by the spectral power distribution Ivis( ⁇ ) of the measuring range illumination light Ivis.
- the excitation range of the common fluorescence whitened paper extends to 430 nm, and most of fluorescence whitened paper has a high quantum efficiency at 390 to 410 nm.
- the spectral power distribution R(Ivis, ⁇ ) of the sample radiation light generated when the fluorescence whitened paper is illuminated with the visible range (measuring range) illumination light Ivis includes not only the spectral power distribution Rr(Ivis, ⁇ ) of the sample reflected light but also the spectral power distribution Rf(Ivis, ⁇ ) of fluorescence excited by a component of 430 nm or shorter of the visible range (measuring range) illumination light Ivis.
- the spectral power distribution Rr(Ivis, ⁇ ) of the sample reflected light by the visible range (measuring range) illumination light Ivis is obtained by subtracting the spectral power distribution Rf(Ivis, ⁇ ) of fluorescence by the visible range (measuring range) illumination light Ivis from the spectral power distribution R(Ivis, ⁇ ) of the sample radiation light by the visible range (measuring range) illumination light Ivis, and this is divided by the spectral power distribution Ivis( ⁇ ) of the visible range (measuring range) illumination light Ivis, thereby obtaining the approximation Br( ⁇ ) of the spectral reflectivity coefficient Br( ⁇ ).
- the visible range (measuring range) illumination light Ivis covering the visible range of 400 nm to 700 nm is synthesized by an illumination light Ivis1 not shorter than 430 nm not exciting fluorescence and an illumination light Ivis2 of 400 nm to 430 nm exciting the fluorescence.
- the former is a blue-excited white LED Iwb (Wb in Fig. 3 ) having the spectral power distribution illustrated in Fig. 3
- the latter is the monochromatic illumination light 12 having a central wavelength of 405 nm (V405 in Fig. 3 )
- the spectral power distribution Ivis( ⁇ ) of the visible range (measuring range) illumination light Ivis is provided by equation (17).
- I VIS ⁇ I Wb ⁇ + I 2 ⁇
- equation (17), and equation (18) are substituted into equation (16) to obtain the approximation Br( ⁇ ) of the spectral reflectivity coefficient Br( ⁇ ).
- the approximation Bt(Id, ⁇ ) of the total spectral emissivity coefficient Bt(Id, ⁇ ) by the standard illumination light Id is obtained.
- the approximation Rf(Id, ⁇ ) is obtained by using equation (11).
- the approximation Bf(Id, ⁇ ) is obtained by using the approximation Rf(Id, ⁇ ) and equation (7).
- the approximation Br( ⁇ ) is obtained by using equation (16).
- the sum of the approximation Bf(Id, ⁇ ) and the approximation Br( ⁇ ) is obtained. This is the approximation Bt(Id, ⁇ ).
- a different method is a method of obtaining an approximation Bt(Id, ⁇ ) of the total spectral emissivity coefficient Bt(Id, ⁇ ) by the standard illumination light Id without using the spectral reflectivity coefficient and the correction coefficient C( ⁇ ) expressed by equation (10) regarding the overlapping range.
- the approximation Bt(Id, ⁇ ) is obtained separately in the overlapping range (400 ⁇ ⁇ 430 nm) and outside the overlapping range ( ⁇ ⁇ 430 nm). This is hereinafter described in detail.
- Fig. 5 is a graph illustrating a relationship between a wavelength and spectral power for a D50 light source and a Id2 light source used in the different method.
- the Id2 light source is a light source which emits an overlapping range illumination light Id2 having a spectral power distribution approximating the standard illumination light Id (herein, D50 light source) in the overlapping range (400 to 430 nm).
- a total spectral reflectivity coefficient Bt(Id2, ⁇ ) of the overlapping range by the overlapping range illumination light Id2 is obtained (equation (19)) not as the sum of the fluorescence spectral emissivity coefficient and the spectral reflectivity coefficient but directly from a spectral power distribution R(Id2, ⁇ ) of the sample radiation light by the overlapping range illumination light Id2.
- B t I d 2 ⁇ R I d 2 ⁇ I d 2 ⁇ 400 ⁇ nm ⁇ ⁇ ⁇ 430 ⁇ nm
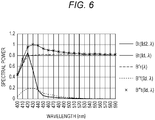
- Fig. 6 is a graph illustrating a relationship between a wavelength and spectral power for various coefficients used in the different method. Only a fluorescence spectral emissivity coefficient Bf(Id2, ⁇ ) by the overlapping range component Id2 of the standard illumination light Id is included in Bt(Id2, ⁇ ) of the overlapping range by equation (19). Therefore, as expressed in a first half of equation (20a), it is necessary to add a fluorescence spectral emissivity coefficient Bf(Id1, ⁇ ) by an excitation component (component of ⁇ 400 nm) Id1 other than the overlapping range component Id2 of the standard illumination light Id.
- Bf(Id1, ⁇ ) and Bt(Id2, ⁇ ) expressed by equation (19) is the approximation Bt(Id, ⁇ ) of the total spectral emissivity coefficient Bt(Id, ⁇ ) by the standard illumination light Id as expressed in the first half of equation (20a).
- Bf(Id1, ⁇ ) described above has a relative shape the same as that of the approximation Bf(Id, ⁇ ) obtained by equations (6) and (7). Therefore, as expressed in a latter half of equation (20a), it is possible to approximate by Bf(Id1, ⁇ ) with A as a power coefficient.
- the approximation Bt(Id, ⁇ ) of the total spectral emissivity coefficient Bt(Id, ⁇ ) by the standard illumination light Id is provided by equation (20b) on the basis of equation (2). That is, the approximation Bt(Id, ⁇ ) is the sum of the approximation Bf(Id, ⁇ ) obtained by equations (6) and (7) and the spectral reflectivity coefficient Br( ⁇ ) obtained by equation (20c).
- a method of obtaining Br( ⁇ ) is as follows.
- the measuring range illumination light Ivis may be replaced with the illumination light Ivis1 (measuring range illumination light not including the excitation range).
- the power coefficient A is provided by equation (21).
- ⁇ r3 represents one or more reference wavelengths (for example, 460 nm) not affected by the reflected light of the illumination light Ivis 2 (measuring range illumination light including the excitation range, illumination light of 400 to 430 nm).
- Bt(Id2, ⁇ r3) represents a total spectral emissivity coefficient by the overlapping range illumination light Id2.
- Bf(Id, ⁇ r3) represents an approximation of the fluorescence spectral emissivity coefficient by the standard illumination light Id.
- Fig. 7 is an illustrative diagram explaining a configuration of a device for measuring fluorescence whitened sample according to a first embodiment.
- the first embodiment uses two monochromatic excitation lights Ik, and is provided with an integrating sphere 4 having an inner wall with high diffusion and high reflectivity.
- a radiation light 1b of a blue-excited white LED 1 (illumination light Iwb radiated from the blue-excited white LED), a radiation light 2b of a ultraviolet LED 2 with a central wavelength of 360 nm (monochromatic illumination light I1), and a radiation light 3b of a violet LED 3 with a central wavelength of 405 nm (monochromatic illumination light 12) are incident, respectively.
- the white LED 1, the ultraviolet LED 2, and the violet LED 3 are sequentially lighted up by driving signals 1e, 2e, and 3e output by a control arithmetic device 10 (control arithmetic unit) via driving circuits 1d, 2d, and 3d, respectively.
- the radiation lights 1b, 2b, and 3b are multiply diffused and reflected by the inner wall of the integrating sphere 4 to be a diffused illumination light 4a, and the diffused illumination light 4a diffusely illuminates a sample 5 (fluorescence whitened sample) placed in a sample aperture 5a.
- a normal component 5b is converged to be incident on an incident end 7a of a sample optical fiber 7 by an objective lens 6 through a measuring aperture 5c of the integrating sphere 4, and is guided to a sample optical slit 7b of a dual channel spectrometer 9 (sample radiation light spectroscopic unit) by the sample optical fiber 7.
- This illumination light receiving system conforms to d:0°SCE geometry required by ISO 5631-1, 2, 3 regarding paper measurement.
- a part of the illumination light in the integrating sphere 4 is incident on a reference optical fiber 8 through a reference aperture 8a and is guided to a reference optical slit 8b of the dual channel spectrometer 9 by the reference optical fiber 8.
- the dual channel spectrometer 9 outputs spectral power distribution data 9a of the incident sample radiation light and reference light to the control arithmetic device 10.
- the control arithmetic device 10 controls and lights up the white LED 1, the ultraviolet LED 2, and the purple LED 3, and controls the dual channel spectrometer 9 to measure the spectral power distributions of the sample radiation light and the reference light, obtains an approximation of a fluorescence spectral emissivity coefficient of the sample 5 and an approximation of a spectral reflectivity coefficient by using the spectral power distribution data which is transmitted and given data, calculates an approximation of a total spectral emissivity coefficient therefrom, and outputs the approximation of the fluorescence spectral reflectivity coefficient, the approximation of the spectral reflectivity coefficient, and the approximation of the total spectral emissivity coefficient as output data 10a.
- the arithmetic control device 10 (arithmetic control unit) is realized by, for example, hardware processors such as a central processing unit (CPU), a random access memory (RAM), a read only memory (ROM), and a hard disk drive (HDD), and a program, data and the like for executing a function of the arithmetic control device 10.
- Some or all of functions of the arithmetic control device 10 may also be realized by processing by a digital signal processor (DSP) in place of or in addition to processing by the CPU.
- DSP digital signal processor
- some or all of the functions of the arithmetic control device 10 may be realized by processing by a dedicated hardware circuit in place of or in addition to processing by software.
- Fig. 8A is a flowchart illustrating a method for measuring spectral radiation characteristics of the fluorescence whitened sample according to the first embodiment.
- the standard illumination light Id is required. Only an excitation range contributes to generation of fluorescence, so that it is sufficient if a spectral component of the excitation range (300 to 420 nm) of the standard illumination light Id may be realized.
- the spectral component of the excitation range of the standard illumination light Id is realized by a light source (ultraviolet LED 2) of the monochromatic illumination light I1 having the central wavelength of 360 nm and a light source (purple LED 3) of the monochromatic illumination light I2 having the central wavelength of 405 nm.
- a light source in a visible range 400 to 700 nm
- the light source is realized by a light source (white LED 1) of the illumination light Iwb and a light source (violet LED 3) of the monochromatic illumination light 12 having the central wavelength of 405 nm.
- the control arithmetic device 10 lights up the light source (white LED 1) of the illumination light Iwb for a predetermined time (#1).
- the control arithmetic device 10 obtains a spectral power distribution Iwb( ⁇ ) of the illumination light Iwb and a spectral power distribution R(Iwb, ⁇ ) of the sample radiation light by the illumination light Iwb from the dual channel spectrometer 9 (#2).
- the control arithmetic device 10 lights up the light source (ultraviolet LED 2) of the monochromatic illumination light I1 having the central wavelength of 360 nm for a predetermined time (#3).
- the control arithmetic device 10 lights up the light source (violet LED 3) of the monochromatic illumination light I2 having the central wavelength of 405 nm for a predetermined time (#5).
- the control arithmetic device 10 obtains a spectral power distribution I2( ⁇ ) of the monochromatic illumination light I2 and a spectral power distribution R(I2, ⁇ ) of the sample radiation light by the monochromatic illumination light 12 (#6).
- the control arithmetic device 10 obtains a power coefficient K by R(I1, ⁇ ) obtained at #4, R(I2, ⁇ ) obtained at #6, and equation (8) (#7).
- the control arithmetic device 10 obtains a correction coefficient C( ⁇ ) by equation (10) (#8).
- the control arithmetic device 10 obtains an approximation Rf(I2, ⁇ ) of a spectral power distribution Rf(I2, ⁇ ) of fluorescence by the monochromatic illumination light 12 by K, C( ⁇ ), and equations (9a) and (9b) (#9).
- the control arithmetic device 10 executes a weighting coefficient optimizing subroutine by using the spectral power distribution I1( ⁇ ) of the monochromatic illumination light I1, the spectral power distribution I2( ⁇ ) of the monochromatic illumination light 12, and a spectral quantum efficiency FT( ⁇ ,440) of each type stored in advance, thereby obtaining weighting coefficients W1 and W2 (#10).
- the control arithmetic device 10 uses the obtained weighting coefficients W1 and W2 to obtain an approximation Rf(Id, ⁇ ) of a spectral power distribution Rf(Id, ⁇ ) of fluorescence by the standard illumination light Id by equation (11) (#11).
- the control arithmetic device 10 obtains an approximation Bf(Id, ⁇ ) of a fluorescence spectral emissivity coefficient Bf(Id, ⁇ ) by the standard illumination light Id by the approximation Rf (Id, ⁇ ), a spectral power distribution Id( ⁇ ) of the standard illumination light Id, and equation (7) (#12).
- the control arithmetic device 10 synthesizes a spectral power distribution Ivis( ⁇ ) of a measuring range illumination light Ivis and a spectral power distribution R(Ivis, ⁇ ) of the sample radiation light by the measuring range illumination light Ivis by the spectral power distribution Iwb( ⁇ ) of the illumination light Iwb, the spectral power distribution I2( ⁇ ) of the monochromatic illumination light 12, the spectral power distribution R(Iwb, ⁇ ) of the sample radiation light by the illumination light Iwb, the spectral power distribution R(I2, ⁇ ) of the sample radiation light by the monochromatic illumination light 12, equation (17), and equation (18) (#13).
- the control arithmetic device 10 obtains an approximation Br( ⁇ ) of a spectral reflectivity coefficient Br( ⁇ ) by using Ivis( ⁇ ) and R(Ivis, ⁇ ) obtained at #13, the approximation Rf(I2, ⁇ ) obtained at #9, and equation (16) (#14).
- a reason that the approximation Rf(I2, ⁇ ) obtained at #9 may be used as the spectral power distribution Rf(Ivis, ⁇ ) of fluorescence by the measuring range illumination light Ivis included in equation (16) is described. Since the illumination light Iwb has no wavelength component in the excitation range, fluorescence is generated by the monochromatic illumination light 12.
- the control arithmetic device 10 adds the approximation Br( ⁇ ) obtained at #14 to the approximation Bf(Id, ⁇ ) obtained at #12 to obtain an approximation Bt(Id, ⁇ ) of a total spectral emissivity coefficient Bt(Id, ⁇ ) by the standard illumination light Id (#15).
- the control arithmetic device 10 outputs the approximations Bf(Id, ⁇ ), Br( ⁇ ), and Bt(Id, ⁇ ) (#16).
- Fig. 8B is a flowchart illustrating this subroutine.
- ⁇ r2 is set to 440 nm.
- the control arithmetic device 10 obtains fluorescence powers Rf,T(I1,440) and Rf,T(I2,440) by the monochromatic illumination lights I1 and I2 of each type T by using FT( ⁇ ,440), the spectral power distribution I1( ⁇ ) of the monochromatic illumination light I1, the spectral power distribution I2( ⁇ ) of the monochromatic illumination light 12, and equation (14) (#21).
- the control arithmetic device 10 sets the weighting coefficients W1 and W2 to an initial value 1 (#22).
- the control arithmetic device 10 linearly combines Rf,T(I1,440) and Rf,T(I2,440) obtained at #21 by the weighting coefficients W1 and W2 by equation (11) to obtain a synthetic power Rf,T(Id,440) (#23).
- the control arithmetic device 10 obtains the sum of squares dRf ⁇ dRf of a difference between Rf,T(Id,440) of each type T and Rf,T(Id,440) described above stored in advance by equation (13) (#24).
- the control arithmetic device 10 determines whether the sum of squares dRf ⁇ dRf is smaller than a given threshold ⁇ (#25).
- control arithmetic device 10 In a case where the sum of squares dRf ⁇ dRf is smaller than the given threshold ⁇ (Yes), the control arithmetic device 10 returns the weighting coefficient W1 and W2 used at #23 to a main routine (#26).
- control arithmetic device 10 In a case where the sum of squares dRf ⁇ dRf is equal to or larger than the given threshold ⁇ (No), the control arithmetic device 10 returns to #23 to correct the weighting coefficient W1 and W2 (#27).
- the weighting coefficient set and stored at the time of manufacture or before measurement may be used.
- a spectral power distribution of a monochromatic LED depends on element temperature, and a forward voltage of the LED driven at constant current also depends on the element temperature. Therefore, the control arithmetic device 10 may obtain in advance correlation characteristics between the forward voltage at the time of constant current driving and the spectral power distribution and estimate the spectral power distribution of the monochromatic LED from the forward voltage detected at the time of measurement under the same driving condition.
- the driving circuit 1d drives the white LED 1 (monochromatic LED) at the constant current.
- the driving circuit 2d driving unit) drives the ultraviolet LED 2 (monochromatic LED) at the constant current.
- the driving circuit 3d drives the violet LED 3 (monochromatic LED) at the constant current.
- control arithmetic device 10 may obtain in advance a table illustrating a relationship between the forward voltage (that is, the element temperature) of the monochromatic LED and the weighting coefficients W1 and W2 in the spectral power distributions I1( ⁇ ) and I2( ⁇ ) at the forward voltage and obtain the weighting coefficient at the forward voltage at the time of measurement by interpolation or the like.
- the driving circuit 1d is provided with a voltage measuring circuit which measures the forward voltage of the white LED 1 (monochromatic LED).
- the driving circuit 2d is provided with a voltage measuring circuit which measures the forward voltage of the ultraviolet LED 2 (monochromatic LED).
- the driving circuit 3d is provided with a voltage measuring circuit which measures the forward voltage of the violet LED 3 (monochromatic LED).
- Each of these voltage measuring circuits is formed of an operational amplifier and an AD converter.
- a noninverting input terminal of the operational amplifier is connected to a cathode of the monochromatic LED.
- An inverting input terminal and an output terminal of the operational amplifier are connected.
- the output terminal of the operational amplifier is connected to an input terminal of the AD converter.
- Fig. 9 is an illustrative diagram explaining a configuration of a device for measuring a fluorescence whitened sample according to a second embodiment.
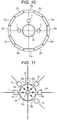
- Fig. 10 is a plan view of an illumination optical system provided in the device for measuring the fluorescence whitened sample according to the second embodiment. The second embodiment is different from the first embodiment only in an illumination light receiving optical system.
- An illumination system of the second embodiment is provided with a small integrating sphere 24, and as in the first embodiment, a radiation light 1b of a blue-excited white LED 1 (Iwb), a radiation light 2b of a ultraviolet LED 2 with a central wavelength of 360 m (I1), and a radiation light 3b of a violet LED 3 with a central wavelength of 405 nm (12) are incident from apertures 1a, 2a, and 3a.
- the radiation lights 1b, 2b, and 3b are diffused and radiated from a radiating aperture 24a after multiple diffusion/reflection on an inner wall of the small integrating sphere 24.
- An optical axis 24x of the illumination light receiving optical system coincides with a normal to a radiating aperture plane passing through the center of the radiating aperture plane.
- a radiation light component 24b near 45° from the optical axis 24x is reflected by 12 plane mirrors 25a to 251 ( Fig. 10 ) arranged in axial symmetry with respect to the optical axis 24x. Reflected light fluxes illuminate a sample 5 from 12 directions as illumination light 24c centered at 45° from the optical axis 24x.
- a normal component 5b of a sample radiation light by this illumination is converged and incident on an incident end 7a of a sample optical fiber 7 by an objective lens 26, and is guided to a sample optical slit 7b of a dual channel spectrometer 9 by the sample optical fiber 7.
- This illumination light receiving system conforms to a 45°c:0° geometry required by ISO 13655 regarding measurement of a printed matter.
- a part of the illumination light in the small integrating sphere 24 is incident on a reference optical fiber 8 through a reference aperture 8a and is guided to a reference optical slit 8b of the dual channel spectrometer 9 by the reference optical fiber 8.
- the dual channel spectrometer 9 outputs spectral power distribution data 9a of the incident sample light and reference light to a control arithmetic device 10. Control of the white LED 1, the ultraviolet LED 2, and the violet LED 3 and processing of the spectral power distribution data are performed by a flow in Figs. 8A and 8B .
- Fig. 11 is a plan view illustrating a radiation light incident on a small integrating sphere in a third embodiment.
- a method for measuring a fluorescence whitened sample according to the third embodiment basically has the same configuration as that of the second embodiment, but as illustrated in Fig.
- a radiation light 1b (Iwb) of a blue-excited white LED 1 a radiation light 31b (I1) of an LED 31 having a central wavelength of 355 nm, a radiation light 32b (I2) of an LED 32 of 375 nm, a radiation light 33b (I3) of an LED 33 of 385 nm, a radiation light 34b (14) of an LED 34 of 395 nm, and a radiation light 35b (15) of an LED 35 of 405 nm are incident on a small integrating sphere 44 from corresponding apertures.
- Fig. 12 is a graph illustrating spectral powers of the radiation lights (Iwb, I1, I2, I3, I4, and I5) used in the third embodiment.
- weighting coefficients W1 to W5 of five excitation lights I1 to I5 cannot be optimized on the basis of four types of spectral quantum efficiencies Ff,T( ⁇ ,440) in Fig. 4 . Therefore, in the third embodiment, the weighting coefficients W2 to W5 of the excitation lights 12 to 15 are set by the setting method 1. Furthermore, in order to reflect excitation outside the excitation lights I1 to I5 ( ⁇ 355 nm and 405 nm ⁇ ), the weighting coefficient W1 of the excitation light I1 and the weighting coefficient W5 of the excitation light I5 are set by the setting method 3 (weighting coefficient W5 is reset).
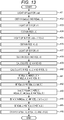
- Fig. 13 is a flowchart illustrating a method for measuring spectral radiation characteristics of the fluorescence whitened sample according to the third embodiment.
- a control arithmetic device 10 lights up a light source (white LED 1) of the illumination light Iwb for the time ⁇ wb (#31).
- the control arithmetic device 10 obtains a spectral power distribution Iwb( ⁇ ) of the illumination light Iwb and a spectral power distribution R(Iwb, ⁇ ) of a sample radiation light by the illumination light Iwb from a dual channel spectrometer 9 (#32).
- the control arithmetic device 10 lights up a light source (LED) of the excitation light I1 having a central wavelength of 355 nm for a time ⁇ 1 (#33).
- LED light source
- the control arithmetic device 10 lights up a light source (LED) of the excitation light I2 having a central wavelength of 375 nm for a time ⁇ 2, a light source (LED) of the excitation light I3 having a central wavelength of 385nm for a time ⁇ 3, and a light source (LED) of the excitation light I4 having a central wavelength of 395 nm for a time ⁇ 4 (#35).
- LED light source
- LED light source of the excitation light I2 having a central wavelength of 375 nm for a time ⁇ 2
- a light source (LED) of the excitation light I3 having a central wavelength of 385nm for a time ⁇ 3
- a light source (LED) of the excitation light I4 having a central wavelength of 395 nm for a time ⁇ 4 (#35).
- the control arithmetic device 10 obtains a spectral power distribution R(I2_4, ⁇ ) of a sample radiation light by the excitation lights I2+I3+I4 (#36).
- the control arithmetic device 10 lights up a light source (LED) of the excitation light 15 having a central wavelength of 405 nm for a time ⁇ 5 (#37).
- LED light source
- the control arithmetic device 10 obtains a spectral power distribution I5( ⁇ ) of the excitation light I5 and a spectral power distribution R(I5, ⁇ ) of a sample radiation light by the excitation light 15 (#38).
- the control arithmetic device 10 obtains power coefficients K2_4 and K5 by equation (8) (#39).
- the control arithmetic device 10 obtains an approximation Rf(I2_4, ⁇ ) of a spectral power distribution Rf(I2_4, ⁇ ) of fluorescence by the excitation light I2_4, and an approximation Rf(I5, ⁇ ) of a spectral power distribution Rf(I5, ⁇ ) of fluorescence by the excitation light 15 by K2_4, K5, C2_4( ⁇ ), C5( ⁇ ), equation (9a), and equation (9b) (#40).
- the control arithmetic device 10 adds R(I1, ⁇ ) and the approximations R(I2_4, ⁇ ) and Rf(I5, ⁇ ) to obtain an approximation Rf(Id, ⁇ ) of a spectral power distribution Rf(Id, ⁇ ) of fluorescence by a standard illumination light Id (#41).
- the control arithmetic device 10 obtains an approximation Bf(Id, ⁇ ) of a fluorescence spectral emissivity coefficient Bf(Id, ⁇ ) by the standard illumination light Id by the approximation Rf (Id, ⁇ ), the spectral power distribution Id( ⁇ ) of the standard illumination light Id, and equation (7) (#42).
- the control arithmetic device 10 synthesizes a spectral power distribution Ivis( ⁇ ) of a measuring range illumination light Ivis and a spectral power distribution R(Ivis, ⁇ ) of a sample radiation light by the measuring range illumination light Ivis by the spectral power distribution Iwb( ⁇ ) of the illumination light Iwb, the spectral power distribution I5( ⁇ ) of the excitation light 15, the spectral power distribution R(Iwb, ⁇ ) of the sample radiation light by the illumination light Iwb, the spectral power distribution R(I5, ⁇ ) of the sample radiation light by the excitation light 15, equation (17), and equation (18) (#43).
- the control arithmetic device 10 adds the approximation Br( ⁇ ) obtained at #44 to the approximation Bf(Id, ⁇ ) obtained at #42 to obtain the approximation Bt(Id, ⁇ ) of the total spectral emissivity coefficient Bt(Id, ⁇ ) by the standard illumination light Id (#45).
- the control arithmetic device 10 outputs the approximation Bf(Id, ⁇ ), the approximation Br( ⁇ ), and the approximation Bt(Id, ⁇ ) (#46).
- the control arithmetic device 10 may obtain a spectral power distribution Ik( ⁇ ) for each measurement, and obtain ⁇ k and ik for next measurement.
- individual spectral power distribution Ik( ⁇ ) cannot be measured, but it is possible to obtain the individual spectral power distribution Ik( ⁇ ) in a case where the LED is driven at constant current and the spectral power distribution is estimated from forward voltage as described above.
- a fourth embodiment uses a different method to calculate an approximation Bt(Id, ⁇ ) of a total spectral reflectivity coefficient.
- the fourth embodiment is basically the same in configuration as the third embodiment, but a central wavelength of a monochromatic light incident on a small integrating sphere 44 of an illumination light receiving system illustrated in Fig. 11 is different.
- a radiation light 1b (Iwb) of a blue-excited white LED 1 and a radiation light 31b (I1) of an LED 31 having a central wavelength of 355 nm do not change, central wavelengths of a radiation light 32b (12) of an LED 32, a radiation light 33b (13) of an LED 33, a radiation light 34b (14) of an LED 34, and a radiation light 35b (15) of an LED 35 are 395nm, 405nm, 415nm, and 425nm, respectively.
- Fig. 14 is a graph illustrating spectral powers of the radiation lights (Iwb, I1, I2, I3, I4, and 15) used in the fourth embodiment.
- Weighting coefficients W2 to W5 of the excitation lights 12 to 15 are set by the setting method 1 as in the third embodiment, and only a weighting coefficient W1 of the excitation light I1 is set by the setting method 3.
- a spectral power distribution Id2( ⁇ ) of an illumination light Id2 synthesized by W2 ⁇ I2( ⁇ )+W3 ⁇ I3( ⁇ )+W4 ⁇ I4( ⁇ )+W5 ⁇ I5( ⁇ ) approximates D50 at 400 to 430 nm as illustrated in Fig. 5 .
- Each of all the illumination lights (four illumination lights) forming the illumination light Id2 is any one of the five excitation lights I1 to I5, but it is sufficient that at least one of a plurality of illumination lights is any one of a plurality of excitation lights.
- Fig. 15 is a flowchart illustrating a method for measuring spectral radiation characteristics of a fluorescence whitened sample according to the fourth embodiment.
- weighting of linear combination is performed by controlling a lighting time ⁇ k of the LED.
- the lighting time ⁇ k of an excitation light Ik and a lighting time ⁇ wb of the illumination light Iwb based on a weighting coefficient Wk are provided in advance.
- a control arithmetic device 10 lights up the light source (white LED 1) of the illumination light Iwb for the time ⁇ wb (#51).
- the control arithmetic device 10 obtains a spectral power distribution Iwb( ⁇ ) of the illumination light Iwb and a spectral power distribution R(Iwb, ⁇ ) of a sample radiation light by the illumination light Iwb from a dual channel spectrometer 9 (#52).
- the control arithmetic device 10 lights up a light source (LED) of the excitation light I1 having the central wavelength of 355 nm for a time ⁇ 1 (#53).
- LED light source
- the control arithmetic device 10 lights up a light source (LED) of the excitation light I2 having the central wavelength of 395 nm for a time ⁇ 2, a light source (LED) of the excitation light I3 having the central wavelength of 405nm for a time ⁇ 3, a light source (LED) of the excitation light I4 having the central wavelength of 415 nm for a time ⁇ 4, and a light source (LED) of the excitation light I5 having the central wavelength of 425 nm for a time ⁇ 5 (#55).
- LED light source
- the control arithmetic device 10 obtains a spectral power distribution R(I2_5, ⁇ ) of a sample radiation light by the excitation lights I2 + I3 + I4 + I5 (#56).
- the control arithmetic device 10 obtains a power coefficient K2_5 by equation (8) (#57).
- the control arithmetic device 10 obtains an approximation Rf(I2_5, ⁇ ) of a spectral power distribution Rf(I2_5, ⁇ ) of fluorescence by an excitation light I2_5 by K2_5, and equations (9a) and (9b) (#58).
- the control arithmetic device 10 adds R(I1, ⁇ ) and an approximation R(I2_5, ⁇ ) to obtain an approximation Rf(Id, ⁇ ) of a spectral power distribution Rf(Id, ⁇ ) of fluorescence by a standard illumination light Id (#59).
- the control arithmetic device 10 obtains an approximation Bf(Id, ⁇ ) of a fluorescence spectral emissivity coefficient Bf(Id, ⁇ ) by the standard illumination light Id by the approximation Rf (Id, ⁇ ), a spectral power distribution Id( ⁇ ) of the standard illumination light Id, and equation (7) (#60).
- the control arithmetic device 10 obtains a total spectral emissivity coefficient Bt(Id2, ⁇ ) of an overlapping range by the overlapping range illumination light Id2 using equation (19) (#61).
- the overlapping range is 400 nm ⁇ ⁇ ⁇ 430 nm.
- the overlapping range illumination light Id2 approximates D50.
- the control arithmetic device 10 obtains an approximation Bt(Id, ⁇ ) of a total spectral emissivity coefficient Bt(Id, ⁇ ) of the overlapping range by the standard illumination light Id using equation (20a) (#63).
- the control arithmetic device 10 obtains a spectral reflectivity coefficient Br( ⁇ ) outside the overlapping range by using equation (20c) (#64). Outside the overlapping range is ⁇ ⁇ 430 nm.
- the control arithmetic device 10 obtains an approximation Bt(Id, ⁇ ) of a total spectral emissivity coefficient Bt(Id, ⁇ ) outside the overlapping range by the standard illumination light Id using equation (20b) (#65).
- the control arithmetic device 10 outputs the approximation Bt(Id, ⁇ ) in an entire visible range, that is, the approximations Bt(Id, ⁇ ) and Bt(Id, ⁇ ) of the overlapping range and outside the overlapping range, respectively (#66).
- a fifth embodiment is described.
- the fifth embodiment differs from the first to fourth embodiments in an illumination optical system.
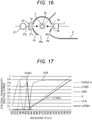
- Fig. 16 is an illustrative diagram for explaining a relationship between a small integrating sphere and a radiation light incident on the small integrating sphere in an illumination light receiving system of the fifth embodiment.
- a small integrating sphere 24 illustrated in Fig. 16 is different from the small integrating sphere 24 illustrated in Fig. 9 in that a white light source 21 and a short wavelength cut filter 22 are provided in place of a white LED 1.
- the white light source 21 (for example, an incandescent lamp) has a power in an entire visible range.
- a radiation light of a blue-excited white LED is a component Ivis2 which does not excite fluorescence of a visible range illumination light Ivis.
- a radiation light 21a of the white light source 21 transmitted through the short wavelength cut filter 22 is allowed to be incident on the small integrating sphere 24.
- Fig. 17 is a graph for explaining optical characteristics of the white light source 21 and the short wavelength cut filter 22.
- the graph illustrates a relative spectral power distribution (A in the drawing) of an incandescent lamp (illuminant A) with color temperature of 2855.6 K, a spectral transmissivity (L435) of a sharp cut filter L435 with a cutoff wavelength of 435 nm, and a spectral power distribution (L435 & A) of the illumination light obtained by combining them.
- This graph also illustrates a spectral quantum efficiency for 440 nm fluorescence of fluorescence whitened paper (Paper H).
- Embodiments may also be provided with a measuring range illuminating unit. This is to be described.
- the measuring range illuminating unit illuminates the fluorescence whitened sample with a measuring range illumination light Ivis having a power in an entire measuring range (400 to 700 nm).
- a control arithmetic unit lights up the measuring range illuminating unit, allow a sample radiation light spectroscopic unit (dual channel spectrometer 9) to measure a spectral distribution Rr(Ivis, ⁇ ) of a sample reflected light by the measuring range illumination light Ivis, obtains an approximation Br( ⁇ ) of a spectral reflectivity coefficient Br( ⁇ ) from a spectral power distribution Ivis( ⁇ ) of the measuring range illumination light and the spectral power distribution Rr(Ivis, ⁇ ) of the sample reflected light (equation (16)), and obtains an approximation Bt(Id, ⁇ ) of a total spectral emissivity coefficient Bt(Id, ⁇ ) by a standard illumination light by the sum of the approximation Br( ⁇ ) and an approximation Bf(Id, ⁇ ) of a fluorescence spectral emissivity coefficient Bf(Id, ⁇ ) by the standard illumination light.
- a sample radiation light spectroscopic unit
- a first example of the measuring range illuminating unit includes a blue-excited white LED (white LED 1) and one or more monochromatic LEDs (purple LED 3) having a power in a measuring range where the blue-excited white LED does not have power, and the measuring range illumination light Ivis is formed of a radiation light of the blue-excited white LED and a radiation light of one or more monochromatic LEDs.
- a second example of the measuring range illuminating unit includes a white light source (white light source 21), a fluorescence excitation wavelength band cut filter (short wavelength cur filter 22), and one or more monochromatic LEDs having power in a fluorescence excitation light wavelength band (violet LED 3 illustrated in Fig. 16 , and UV360 and V405 illustrated in Fig. 17 ), and the measuring range illumination light Ivis is formed of a radiation light of the white light source passing through the fluorescence excitation wavelength band cut filter and one or more monochromatic LEDs.
- Fig. 18 is a graph illustrating spectral radiation characteristics of fluorescence whitened paper (paper A).
- Fig. 19 is a graph illustrating spectral radiation characteristics of fluorescence whitened paper (paper G). The wavelength is plotted along the abscissa axis of these graphs. Bt(Id, ⁇ ), Bt(Id, ⁇ ), Br( ⁇ ), and Br( ⁇ ) are plotted along the left ordinate axis of the graph, and dBt( ⁇ ) and dBr( ⁇ ) are plotted along the right ordinate axis. Bt(Id, ⁇ ) and Br( ⁇ ) are measured values measured by the method for measuring the embodiment.
- Bt(Id, ⁇ ) and Br( ⁇ ) are reference values.
- dBt( ⁇ ) indicates a difference between Bt(Id, ⁇ ) and Bt(Id, ⁇ ).
- dBr( ⁇ ) indicates a difference between Br( ⁇ ) and Br( ⁇ ). In any case, it may be seen that the measured value coincides well to a reference value.
- the spectral reflectivity coefficient a reflectivity coefficient of 420 nm or shorter which cannot be obtained by a conventional method (method in accordance with ISO 2470) of removing a component of 420 nm or shorter of the illumination light is obtained.
- JP 2017-054885 A filed on March 21, 2017 is entirely incorporated herein by reference.
- the present invention it is possible to provide the method for measuring the spectral radiation characteristics of the fluorescence whitened sample and the device for measuring the spectral radiation characteristics of the fluorescence whitened sample.
Landscapes
- Physics & Mathematics (AREA)
- Spectroscopy & Molecular Physics (AREA)
- Health & Medical Sciences (AREA)
- General Physics & Mathematics (AREA)
- Chemical & Material Sciences (AREA)
- Life Sciences & Earth Sciences (AREA)
- Immunology (AREA)
- General Health & Medical Sciences (AREA)
- Analytical Chemistry (AREA)
- Biochemistry (AREA)
- Pathology (AREA)
- Engineering & Computer Science (AREA)
- Medicinal Chemistry (AREA)
- Food Science & Technology (AREA)
- Chemical Kinetics & Catalysis (AREA)
- Optics & Photonics (AREA)
- Nuclear Medicine, Radiotherapy & Molecular Imaging (AREA)
- Mathematical Physics (AREA)
- Theoretical Computer Science (AREA)
- Investigating, Analyzing Materials By Fluorescence Or Luminescence (AREA)
- Spectrometry And Color Measurement (AREA)
Abstract
Description
- The present invention relates to a technology of measuring spectral radiation characteristics of a fluorescence whitened sample.
- A total spectral emissivity coefficient Bt(I,λ) represented by following equation (1) is used for measuring a color of the sample. The total spectral emissivity coefficient Bt(I,λ) is one of indices indicating the spectral radiation characteristics of the sample. In a case of the fluorescence whitened sample, a radiation light thereof is the sum of a reflected light and fluorescence, so that the total spectral emissivity coefficient Bt(I,λ) of the fluorescence whitened sample is represented by following equation (2). Br(λ) represents a spectral reflectivity coefficient. Bf(I,λ) represents a fluorescence spectral emissivity coefficient. Note that, in this specification, subscripts are used in mathematical expressions, and the subscripts are not used except for the mathematical expressions, but both have the same meaning (this is also applicable in claims). For example, although "t" included in equation (1) is a subscript, this is a normal character in the specification (Bt(I,λ)), and both have the same meaning.
- A standard illumination light is required to obtain the total spectral emissivity coefficient Bt(I,λ) of the fluorescence whitened sample. At present, although there is a light source of an illumination light that approximates the standard illumination light, a light source of the standard illumination light is not yet put into practical use.
- Therefore, an approximation Bt(I, λ) of the total spectral emissivity coefficient Bt(I,λ) of the fluorescence whitened sample is obtained by an approximate measuring method. The conventional approximate measuring method obtains Bt(I, λ) using a specific bispectral fluorescence emissivity coefficient. For this reason, in a case where the fluorescence whitened sample the color of which is to be measured has a bispectral fluorescence emissivity coefficient different from the specific bispectral fluorescence emissivity coefficient, it is not possible to obtain a highly accurate approximation Bt(I, λ).
- The above-described details are hereinafter described until the object of the invention. Note that, an outline of the embodiment is described at the beginning of the "Description of embodiments".
- Color characteristics of the sample are obtained using the total spectral emissivity coefficient. A radiation light from the sample illuminated and receiving light under a certain condition is set as a first radiation light, and a radiation light from a completely diffusing reflective surface (ideal white surface) illuminated and receiving light under the same condition is set as a second radiation light. The total spectral emissivity coefficient is a ratio between the first radiation light and the second radiation light for each wavelength. A reflectivity of the completely diffusing reflective surface is 1 over all the wavelengths, so that the total spectral emissivity coefficient is expressed by following equation (1) except for a proportional constant. Bt(I,λ) is the total spectral emissivity coefficient by an illumination light I. Rt(I,λ) is a spectral power distribution (SPD) of a sample radiation light by the illumination light I. I(λ) is a spectral power distribution of the illumination light I.
[Math. 1]
- Today, most of printing paper is whitened with a fluorescence whitening agent (FWA) which converts components from ultraviolet to purple ranges of the illumination light into blue-range fluorescence. The radiation light of a fluorescence sample is the sum of the reflected light and the fluorescence. Therefore, as illustrated in
Fig. 20 , the total spectral emissivity coefficient Bt(I,λ) of the fluorescence whitened sample is the sum of the spectral reflectivity coefficient Br(λ) and the fluorescence spectral emissivity coefficient Bf(I,λ). The spectral reflectivity coefficient Br(λ) is a ratio for each wavelength between the reflected light from the sample illuminated and receiving light under a certain condition and the radiation light from the completely diffusing reflective surface illuminated and receiving light under the same condition. The fluorescence spectral emissivity coefficient Bf(I,λ) by the illumination light I is a ratio for each wavelength between fluorescence from the sample illuminated and receiving light under a certain condition and the radiation light from a completely diffusing reflective surface illuminated and receiving light under the same condition. Therefore, the total spectral emissivity coefficient Bt(I,λ) of the fluorescence whitened sample may be expressed by following equation (2).
[Math. 2]
- The spectral reflectivity coefficient Br(λ) does not depend on the illumination light, but the fluorescence spectral emissivity coefficient Bf(I,λ) provided by equations (3) and (4) depends on a bispectral fluorescence emissivity coefficient F(µ,λ) of the sample and a spectral power distribution I(µ) of the illumination light, so that the total spectral emissivity coefficient Bt(I,λ) also depends on the spectral power distribution I(µ) of the illumination light. Here, µ represents an excitation wavelength included in a wavelength range of the illumination light, and λ represents a fluorescence wavelength. Other than them (for example, λ in equations (1) to (3)) represents a wavelength of the illumination light. Note that Rf(I,λ) represents a spectral power distribution of fluorescence by the illumination light I.
[Math. 3]
[Math. 4]
- Therefore, in a case where the color of the fluorescence whitened sample (for example, fluorescence whitened paper and a printing surface using this as a sheet of paper) is measured, it is necessary to define the spectral power distribution of the illumination light. As for paper, ISO 5631-1, 2, and 3 require standard illuminants C, D65, and D50 defined by CIE (International Commission on Illumination), respectively, and as for a printed matter, an M1 condition of ISO 13655 requires D50. That is, a measuring illumination light needs to have a relative spectral power distribution which approximates these standard illumination lights Id. However, since it is difficult to realize this practically, an approximate measuring method is generally used. As the approximate measuring method, there are, for example, a method of Görtner-Griesser, and a method of replacing this with numerical operation (for example,
Patent Literatures 1 and 2). The contents ofPatent Literatures - On the other hand, in the paper manufacturing industry, a spectral reflectivity coefficient without a fluorescence whitening effect is often required. At present, in order to suppress fluorescence excitation, an ISO 2470 method for removing a component of 420 nm or shorter of the measuring illumination light is generally used. However, this method has a disadvantage that a reflectivity coefficient of 420 nm or shorter an effect of which on whiteness is not ignorable cannot be obtained.
- The method of
Patent Literature 1 is described. In this method, a fluorescence whitened sample x is illuminated with a first illumination light having a power in an ultraviolet range and a second illumination light having no power to obtain first and second total spectral emissivity coefficients Bt1(λ) and Bt2(λ) by the respective illumination lights, and the total spectral emissivity coefficients Bt1(λ) and Bt2(λ) are subjected to linear combination expressed by equation (5) by a weighting coefficient W(λ) set for each wavelength in advance, thereby obtaining a synthetic spectral emissivity coefficient Bt(λ) approximating the total spectral emissivity coefficient of the sample illuminated with the standard illumination light.
[Math. 5]
- The above-described weighting coefficient W(λ) is set as follows. When a fluorescence reference sample having excitation/fluorescence characteristics approximating the sample is illuminated with the standard illumination light, the total spectral emissivity coefficient of the fluorescence reference sample is Bt(λ). The fluorescence reference sample is illuminated with the first and second illumination lights, and the total spectral emissivity coefficients Bt1(λ) and Bt2(λ) by the respective illumination lights are measured. The weighting coefficient W(λ) is set for each wavelength such that linear combination W(λ)·Bt1(λ) + (1-W(λ)))·Bt2(λ) of Bt1(λ) and Bt2(λ) is equal to the spectral emissivity coefficient Bt(λ).
- The method of
Patent Literature 2 is described. This method is basically the same as the method ofPatent Literature 1, but the fluorescence reference sample is not used when setting the weighting coefficient W(λ). According to the method ofPatent Literature 2, a fluorescence spectral emissivity coefficient Bf1(λ) by a first illumination light is calculated by using equations (3) and (4) from a predetermined bispectral fluorescence emissivity coefficient of the fluorescence reference sample and a spectral power distribution of the first illumination light, a fluorescence spectral emissivity coefficient Bf2(λ) by a second illumination light is calculated by using equations (3) and (4) from the bispectral fluorescence emissivity coefficient and a spectral power distribution of the second illumination light, a fluorescence spectral emissivity coefficient Bf(λ) by a standard illumination light is calculated by using equations (3) and (4) from the bispectral fluorescence emissivity coefficient and the spectral power distribution of the standard illumination light, and a weighting coefficient W(λ) is set such that a linear combination W(λ)·Bf1(λ) + (1-W(λ)))·Bf2(λ) of Bf1(λ) and Bf2(λ) equals to Bf(λ). - As described above, since there is a problem with the conventional approximate measuring method, improvement of the approximate measuring method is required.
-
- Patent Literature 1:
JP 08-313349 A - Patent Literature 2:
JP 2006-292510 A - An object of the present invention is to provide a method for measuring spectral radiation characteristics of a fluorescence whitened sample capable of improving an approximate measuring method, and a device for measuring spectral radiation characteristics of the fluorescence whitened sample.
- In order to realize the object described above, a method for measuring spectral radiation characteristics of a fluorescence whitened sample reflecting an aspect of the present invention is a method for measuring spectral radiation characteristics of a fluorescence whitened sample illuminated with a standard illumination light Id, the method provided with:
obtaining an approximation Bf(Id, λ) of a fluorescence spectral emissivity coefficient Bf(Id,λ) by the standard illumination light Id at following first to third steps from spectral power distributions R(Ik,λ) of sample radiation lights generated when the fluorescence whitened sample is sequentially illuminated with a plurality of excitation lights Ik (k = 1 to n) having different spectral power distributions and a spectral power distribution Id(λ) of the standard illumination light Id. First step: Spectral power distributions Rf(Ik,λ) of fluorescence are obtained from the spectral power distributions R(Ik,λ) by respective excitation lights Ik. Second step: The spectral power distributions Rf(Ik,λ) of fluorescence by the respective excitation lights Ik are linearly combined with a given weighting coefficient Wk, and an approximation Rf(Id, λ) of a spectral power distribution Rf(Id,λ) of fluorescence by the standard illumination light Id is obtained by following equation (6).
[Math. 66]
- Third step: The approximation Bf(Id, λ) is obtained by following equation (7) from the approximation Rf(Id, λ) and the spectral power distribution Id(λ) of the standard illumination light Id.
[Math. 67]
- Advantages and features provided by one or a plurality embodiments of the invention are fully understood from the detailed description provided below and the accompanying drawings. These detailed descriptions and the accompanying drawings are provided by way of example only and are not intended as a definition of the limitations of the invention.
-
-
Fig. 1 is a graph illustrating a relationship between a wavelength and a relative spectral quantum efficiency regarding seven types of common fluorescence whitened paper. -
Fig. 2 is a graph illustrating spectral powers when the seven types of common fluorescence whitened paper are irradiated with monochromatic light. -
Fig. 3 is a graph illustrating spectral powers of various illumination lights used in an embodiment. -
Fig. 4 is a view illustrating fluorescence whitened paper divided into four types. -
Fig. 5 is a graph illustrating the spectral power of the illumination light approximating D50 in an overlapping range. -
Fig. 6 is a graph illustrating a relationship between a wavelength and a spectral power for various coefficients used in a different method. -
Fig. 7 is an illustrative diagram explaining a configuration of a device for measuring a fluorescence whitened sample according to a first embodiment. -
Fig. 8A is a flowchart illustrating a method for measuring spectral radiation characteristics of the fluorescence whitened sample according to the first embodiment. -
Fig. 8B is a flowchart illustrating a weighting coefficient optimizing subroutine at #10. -
Fig. 9 is an illustrative diagram explaining a configuration of a device for measuring a fluorescence whitened sample according to a second embodiment. -
Fig. 10 is a plan view of an illumination optical system provided in the device for measuring the fluorescence whitened sample according to the second embodiment. -
Fig. 11 is a plan view illustrating a radiation light incident on a small integrating sphere in a third embodiment. -
Fig. 12 is a graph illustrating spectral powers of radiation lights (Iwb, I1, I2, I3, I4, and I5) used in the third embodiment. -
Fig. 13 is a flowchart illustrating a method for measuring spectral radiation characteristics of the fluorescence whitened sample according to the third embodiment. -
Fig. 14 is a graph illustrating spectral power of each of radiation lights (Iwb, I1, I2, I3, I4, and I5) used in a fourth embodiment. -
Fig. 15 is a flowchart illustrating a method for measuring spectral radiation characteristics of a fluorescence whitened sample according to the fourth embodiment. -
Fig. 16 is an illustrative diagram for explaining a relationship between a small integrating sphere and a radiation light incident on the small integrating sphere in an illumination light receiving system of a fifth embodiment. -
Fig. 17 is a graph for explaining optical characteristics of a white light source and a short wavelength cut filter. -
Fig. 18 is a graph illustrating spectral radiation characteristics of a first example of fluorescence whitened paper. -
Fig. 19 is a graph illustrating spectral radiation characteristics of a second example of the fluorescence whitened paper. -
Fig. 20 is a graph illustrating a relationship among a total spectral emissivity coefficient Bt(I,λ), a spectral reflectivity coefficient Br(λ), and a fluorescence spectral emissivity coefficient Bf(I,λ). - One or a plurality of embodiments of the present invention is hereinafter described with reference to the drawings. However, the scope of the invention is not limited to the disclosed embodiment.
- An outline of the embodiment is described. In the embodiment, an approximation Bt(Id, λ) of a total spectral emissivity coefficient Bt(Id,λ) by a standard illumination light Id is obtained using the following equation. Note that the "approximation" may be reworded as an "approximation value".

- Br(λ) is an approximation of a spectral reflectivity coefficient Br(λ). Bf(Id, λ) is an approximation of a fluorescence spectral emissivity coefficient Bf(Id,λ) by the standard illumination light Id. As described next, the approximations Br(λ) and Bf(Id, λ) are obtained without using a specific bispectral fluorescence emissivity coefficient F(µ,λ). As a result, the approximation Bt(Id, λ) may be obtained without using the specific bispectral fluorescence emissivity coefficient F(µ,λ). According to the embodiment, it is possible to improve accuracy of the approximations Br(λ) and Bf(Id, λ), thereby improving accuracy of the approximation Bt(Id, λ).
- The approximation Bf(Id, λ) is obtained by using following equation (7). Id(λ) represents a spectral power distribution of the standard illumination light Id. Rf(Id, λ) represents an approximation of a spectral power distribution Rf(Id,λ) of fluorescence by the standard illumination light Id. This approximation Rf(Id, λ) is obtained by using following equation (6). Rf(Ik,λ) represents spectral power distributions of fluorescence by a plurality of illumination lights (excitation lights) Ik (k = 1 to n). Wk represents a weighting coefficient.
- In this manner, in order to obtain the approximation Bf(Id, λ), not the specific bispectral fluorescence emissivity coefficient but the standard illumination light Id is used. Since no fluorescence is generated from a wavelength range outside an excitation range, the wavelength range outside the excitation range is not necessary to obtain the approximation Bf(Id, λ). Therefore, it is sufficient that a spectral component of the excitation range (300 to 420 nm) coincides with a spectral component of 300 to 420 nm of the standard illumination light. The inventor focuses on the fact that such a light source may be realized by a small number of monochromatic LEDs (a small number of illumination lights Ik described above).
- The approximation Br(λ) is obtained by using following equation (16). Ivis(λ) represents a spectral power distribution of measuring range illumination light Ivis (visible range illumination light). R(Ivis,λ) represents a spectral power distribution of a sample radiation light (= sample reflected light + fluorescence) by the measuring range illumination light Ivis. Rr(Ivis,λ) represents a spectral power distribution of the sample reflected light by the measuring range illumination light Ivis. Rf(Ivis,λ) represents a spectral power distribution of fluorescence by the measuring range illumination light Ivis. As expressed in a latter half of equation (16), Rf(Ivis,λ) is subtracted from R(Ivis,λ). Therefore, according to this approximation Br(λ), an effect of fluorescence may be removed, so that it is possible to meet requirements of the paper manufacturing industry. Hereinafter, the embodiment is described in detail.
- The embodiment uses an approximate measuring method. The embodiment is based on equation (2) in which the approximation Bf(Id, λ) of the fluorescence spectral emissivity coefficient Bf(Id,λ) by the standard illumination light Id and the approximation Br(λ) of the spectral reflectivity coefficient Br(λ) by the standard illumination light Id are obtained, and the sum of the approximation Bf(Id, λ) and the approximation Br(λ) is obtained. In the embodiment, this sum is the approximation Bt(Id, λ) of the total spectral emissivity coefficient Bt(Id,λ) by the standard illumination light Id.
- In order to obtain the fluorescence spectral emissivity coefficient Bf(Id,λ) by the standard illumination light Id for fluorescence whitened paper having various bispectral fluorescence emissivity coefficients, the illumination light having the spectral power distribution approximating the spectral power distribution Id(λ) of the standard illumination light Id at least in the excitation range (300 to 420 nm) is required. However, it is difficult to practically realize this. Therefore, as expressed by equation (6), it is considered to approximate the spectral power distribution Rf(Id,λ) of fluorescence by the standard illumination light Id by using a spectral power distribution of synthetic fluorescence obtained by linearly combining the spectral power distributions Rf(Ik,λ) of fluorescence by a plurality of illumination lights (excitation lights) Ik (k = 1 to n) having different spectral power distributions in the excitation wavelength range by an appropriate weighting coefficient Wk (right side in equation (6) (left side in equation (6)).
[Math. 26]
-
Fig. 1 is a graph illustrating a relationship between a wavelength and a relative spectral quantum efficiency regarding seven types of common fluorescence whitened paper. As illustrated inFig. 1 , there is similarity among the relative spectral quantum efficiencies of the commonly used fluorescence whitened paper and they may be classified into a plurality of appropriately set types. In a case where the illumination light (excitation light) Ik suitable for the set type is selected and the weighting coefficient Wk is optimized, the right side of equation (6) (synthetic fluorescence spectral power distribution) becomes an excellent approximation (Rf(Id, λ)) of the spectral power distribution Rf(Id,λ) of fluorescence by the standard illumination light Id as for the fluorescence whitened paper which may be classified into the type. From the approximation Rf(Id, λ) and the known spectral power distribution Id(λ) of the standard illumination light Id, the approximation Bf(Id, λ) of the fluorescence spectral emissivity coefficient Bf(Id,λ) by the standard illumination light Id is obtained by equation (7). As described above, the approximation Bf(Id, λ) is obtained without using the specific bispectral fluorescence emissivity coefficient F(µ,λ).
[Math. 27]
- Commercially available illumination light of the monochromatic LED may be used as the excitation light Ik. Sufficient accuracy may be obtained even with a small number of monochromatic illumination lights Ik by using the excitation light Ik of an appropriate wavelength.
- The radiation light (reflected light + fluorescence) is generated from the fluorescence whitened paper irradiated with the illumination light. In a case where a wavelength range of the reflected light and a wavelength range of the fluorescence have an overlapping range, not equation (6) but following equation (11) is used. This is hereinafter described in detail.
-
Fig. 3 is a graph illustrating a relationship between wavelengths of various types of LEDs and the spectral power. A method of obtaining the approximation Rf(Id, λ) is described taking a case where two monochromatic illumination lights I1 and I2 having the LED with a central wavelength of 360 nm (UV360 inFig. 3 ) and the LED with a central wavelength of 405 nm (V405 inFig. 3 ) as light sources are used as an example for the sake of simplicity. -
Fig. 2 is a graph illustrating the spectral powers when the seven types of common fluorescence whitened paper are irradiated with the monochromatic light. The spectral power include the spectral power of the reflected light and the spectral power of the fluorescence. As illustrated inFig. 2 , a fluorescence range of the common fluorescence whitened paper is 390 to 600 nm, but the excitation light having the power within the fluorescence range has the overlapping range where the fluorescence and the reflected light much stronger than the same coexist. The measuring range is set to a visible range of 400 to 700 nm. A spectral power distribution R(I1,λ) of 400 to 700 nm provides a spectral power distribution Rf(I1,λ) of fluorescence in the sample radiation light by the monochromatic illumination light I1 having the central wavelength of 360 nm and no overlapping range in the fluorescence range (390 to 600 nm) (the spectral power distribution Rf(Ik,λ) of fluorescence is obtained from the spectral power distribution R(Ik,λ) by each excitation light Ik: a spectral power distribution Rf(Ik1,λ) of fluorescence by a first type of excitation light Ik1 is provided by a spectral power distribution R(Ik1,λ) of a sample radiation light by the first type of excitation light Ik1). That is, in a case of the monochromatic illumination light I1, since there is no wavelength range of the reflected light in the wavelength range of the fluorescence, Rf(Ik,λ) included in equation (6) may be obtained (measured). On the other hand, in the sample radiation light by themonochromatic illumination light 12 having a central wavelength of 405 nm and the overlapping range (390 to 430 nm) in the fluorescence range (390 to 600 nm), a spectral power distribution Rf(I2,λ) of fluorescence is provided outside the overlapping range (430 to 700 nm), but a spectral power distribution Rf(I2,λ) of fluorescence is not provided within the overlapping range (400 to 430 nm) due to an effect of the reflected light. That is, in a case of themonochromatic illumination light 12, Rf(Ik,λ) included in equation (6) cannot be obtained within the overlapping range. Therefore, in a case of the monochromatic illumination light I2, an approximation Rf(I2, λ) is obtained. When this is described in detail, as illustrated inFig. 2 , the relative spectral power distribution of fluorescence does not depend on the excitation wavelength and is almost constant, so that it is possible to replace the spectral power distribution in the overlapping range of fluorescence by the monochromatic illumination light 12 with K·I1(λ) by using a spectral power distribution Rf(I1,λr1) of fluorescence by the monochromatic illumination light I1. However, a coefficient K for adjusting the power is provided by equation (8) by a ratio between the spectral power distributions Rf(I1,λr1) and Rf(I2,λr1) of fluorescence by the monochromatic illumination lights I1 and I2 at one or more reference wavelength λr1 outside the overlapping range (for example, 440 nm). The coefficient K may be reworded as a ratio between the spectral power distributions R(I1,λr1) and R(I2,λr1) of the sample radiation lights by the monochromatic illumination lights I1 and I2 at the reference wavelength λr1.
[Math. 28]
- Furthermore, the fluorescence wavelength λ introduces a correction coefficient C(λ) reflecting that this is always longer than the excitation wavelength µ, and provides by equation (9) the approximation Rf(I2, λ) of the spectral power distribution Rf(I2,λ) of fluorescence by the
monochromatic illumination light 12. Equation (9a) expresses a case within the overlapping range, and equation (9b) expresses a case outside the overlapping range. Outside the overlapping range, as described above, the spectral power distribution Rf(I2,λ) of fluorescence by themonochromatic illumination light 12 is provided, so that this is used as the approximation Rf(I2, λ). Note that, in equation (9a), Rf(I1,λ) may be reworded as R(I1,λ), and in equation (9b), Rf(I2,λ) may be reworded as R(I2,λ).
[Math. 29]
- Herein, the correction coefficient C(λ) is provided by equation (10). µ represents the above-described excitation wavelength. In a case of the correction coefficient C(λ), λ represents the fluorescence wavelength.
[Math. 30]
- The approximation Rf(Id, λ) of the spectral power distribution Rf(Id,λ) of fluorescence by the standard illumination light Id is provided by equation (11) by using the spectral power distribution of Rf(I1,λ) of fluorescence by the monochromatic illumination light I1 and the approximation Rf(I2, λ) of the spectral power distribution Rf(I2,λ) of fluorescence by the
monochromatic illumination light 12.
[Math. 31]
- There are setting
methods 1 to 3 as setting methods of the weighting coefficient Wk. This is hereinafter described in detail. In a case where a sufficient number of monochromatic excitation lights Ik are distributed in the excitation range, the weighting coefficient Wk is set such that a spectral power distribution Id(λ) of a synthetic excitation light Id provided by equation (12) approximates the spectral power distribution Id(λ) of the standard illumination light Id (setting method 1).
[Math. 32]
- The
setting method 2 is described. In a case where a sufficient number of monochromatic excitation lights Ik are not distributed in the excitation range, it is not possible to approximate the spectral power distribution Id(λ) of the standard illumination light Id. In this case, the weighting coefficient Wk is optimized such that the spectral power distribution of synthetic fluorescence expressed by the right side of equation (6) for the common fluorescence whitened paper approximates the fluorescence spectral power distribution Rf(Id,λ) by the standard illumination light Id. - For example, the relative spectral quantum efficiencies of representative fluorescence whitened paper (paper A, paper B, paper C, paper D, paper E, paper F, and paper G) illustrated in
Fig. 1 may be classified into four types illustrated inFig. 4 . Bispectral fluorescence emissivity coefficients FT(µ,λ) of the whitened paper (paper D, paper E, paper F, and paper G) representing respective types T (T = 1 to 4) are obtained (the bispectral fluorescence emissivity coefficients FT(µ,λ) of the fluorescence whitened samples to be measured are classified into a plurality of types, and a plurality of different bispectral fluorescence emissivity coefficients is a plurality of types of bispectral fluorescence emissivity coefficients). Then, W1 and W2 are set such that the spectral power distribution of synthetic fluorescence (= Rf,T(Id, λ)) obtained by linearly combining the spectral power distribution Rf,T(I1,λ) of fluorescence by the monochromatic illumination light I1 and the spectral power distribution Rf,T(I2,λ) of fluorescence by the monochromatic illumination light I2, Rf,T(I1,λ) and Rf,T(I2,λ) of each type obtained by equation (4) by equation (36) approximates the spectral power distribution Rf,T(Id,λ) of fluorescence by the standard illumination light Id (setting method 2).
[Math. 65]
- A generalized description of the
setting method 2 is as follows. Spectral power distributions Rf,T(Ik,λ) of fluorescence by a plurality of excitation lights Ik and a spectral power distribution Rf,T(Id,λ) of fluorescence by the standard illumination light Id are obtained by following equations (25) and (26) from a plurality of different bispectral fluorescence emissivity coefficients FT(µ,λ)(T = 1 to N), the spectral power distributions Ik(λ) of a plurality of excitation lights Ik, and the spectral power distribution Id(λ) of the standard illumination light Id. In a case of the bispectral fluorescence emissivity coefficient FT(µ,λ), µ represents the excitation wavelength and λ represents the fluorescence wavelength.
[Math. 33]
[Math. 34]
- Then, the weighting coefficient Wk is set such that the spectral power distribution Rf,T(Id, λ) of synthetic fluorescence obtained by linearly combining the spectral power distributions Rf,T(Ik,λ) of fluorescence by a plurality of excitation lights Ik by following equation (27) approximates the spectral power distribution Rf,T(Id,λ) of fluorescence by the standard illumination light Id for all of a plurality of bispectral fluorescence emissivity coefficients FT(µ,λ).
[Math. 35]
- The
setting method 3 is described. As described above, the relative spectral power distribution of fluorescence does not depend on the excitation wavelength and is almost constant, so that it is possible to replace Rf,T(I1,λ), Rf,T(I2,λ), and Rf,T(Id,λ) described above with fluorescence powers Rf,T(I1,λr2), Rf,T(I2,λr2), and Rf,T(Id,λr2) at one or more wavelengths λr2 (for example, wavelength of 440 nm close to a peak not affected by reflection of the excitation light). Therefore, the weighting coefficients W1 and W2 such that the sum of squares dRf × dRf of a difference between Rf,T(Id, λr2) and Rf,T(Id,λr2) of each type provided by equation (13) becomes the minimum may be obtained by a least square method (setting method 3). Rf,T(I1,λr2), Rf,T(I2,λr2), and Rf,T(Id,λr2) are obtained by equations (14) and (15) from a spectral quantum efficiency FT(µ,λr2) for the fluorescence at the wavelength λr2 of each type obtained in advance and spectral power distributions I1(µ), I2(µ), and Id(µ) of each illumination light. Note that the spectral quantum efficiency FT(µ,λr2) for the fluorescence at the wavelength λr2 of each type is as follows. The spectral quantum efficiencies FT(µ,λr2) for the fluorescence at the reference wavelength λr2 of the fluorescence whitened sample to be measured are classified into a plurality of types, and a plurality of different spectral quantum efficiencies is a plurality of types of spectral quantum efficiencies.
[Math. 36]
[Math. 37]
[Math. 38]
- Although one set of weighting coefficients Wk for one standard illumination light Id is set above, it is possible to set M sets of weighting coefficients Wk,m for M standard illumination lights Id,m (m = 1 to M) selected from a plurality of standard illumination lights Id (for example, A, C, D50, and D65), apply the weighting coefficients Wk,m to the same spectral power distribution Rf(Ik,λ) of fluorescence, obtain the approximation Rf(Id, λ) by using equation (6), and obtain an approximation Bf(Id,m, λ) of a fluorescence spectral emissivity coefficient Bf(Id,m,λ) by the selected standard illumination light Id,m and an approximation Bt(Id,m, λ) of a total spectral emissivity coefficient Bt(Id,m,λ) by the selected standard illumination light Id,m.
- As expressed in a first half of equation (16), the approximation Br(λ) of the spectral reflectivity coefficient Br(λ) is obtained by dividing the spectral power distribution Rr(Ivis,λ) of the sample reflected light by the measuring range illumination light Ivis by the spectral power distribution Ivis(λ) of the measuring range illumination light Ivis. On the other hand, as illustrated in
Fig. 1 , the excitation range of the common fluorescence whitened paper extends to 430 nm, and most of fluorescence whitened paper has a high quantum efficiency at 390 to 410 nm. For this reason, the spectral power distribution R(Ivis,λ) of the sample radiation light generated when the fluorescence whitened paper is illuminated with the visible range (measuring range) illumination light Ivis includes not only the spectral power distribution Rr(Ivis,λ) of the sample reflected light but also the spectral power distribution Rf(Ivis,λ) of fluorescence excited by a component of 430 nm or shorter of the visible range (measuring range) illumination light Ivis. Therefore, as expressed in a latter half of equation (16), the spectral power distribution Rr(Ivis,λ) of the sample reflected light by the visible range (measuring range) illumination light Ivis is obtained by subtracting the spectral power distribution Rf(Ivis,λ) of fluorescence by the visible range (measuring range) illumination light Ivis from the spectral power distribution R(Ivis,λ) of the sample radiation light by the visible range (measuring range) illumination light Ivis, and this is divided by the spectral power distribution Ivis(λ) of the visible range (measuring range) illumination light Ivis, thereby obtaining the approximation Br(λ) of the spectral reflectivity coefficient Br(λ).
[Math. 39]
- In order to estimate Rf(Ivis,λ), the visible range (measuring range) illumination light Ivis covering the visible range of 400 nm to 700 nm is synthesized by an illumination light Ivis1 not shorter than 430 nm not exciting fluorescence and an illumination light Ivis2 of 400 nm to 430 nm exciting the fluorescence. Specifically, the former is a blue-excited white LED Iwb (Wb in
Fig. 3 ) having the spectral power distribution illustrated inFig. 3 , and the latter is themonochromatic illumination light 12 having a central wavelength of 405 nm (V405 inFig. 3 ), and the spectral power distribution Ivis(λ) of the visible range (measuring range) illumination light Ivis is provided by equation (17).
[Math. 40]
- In this case, the spectral power distribution R(Ivis,λ) of the sample radiation light by the visible range (measuring range) illumination light Ivis is provided by equation (18).
[Math. 41]
- The spectral power distribution Rf(Ivis,λ) of fluorescence by the visible range (measuring range) illumination light Ivis is approximated by Rf(I2, λ) provided by equation (9a). That is, Rf(Ivis,λ) is used as Rf(I2, λ) (since Ivis = I2 in 400 nm to 430 nm, it is possible to approximate). The same, equation (17), and equation (18) are substituted into equation (16) to obtain the approximation Br(λ) of the spectral reflectivity coefficient Br(λ).
- As in equation (2), the approximation Bt(Id, λ) of the total spectral emissivity coefficient Bt(Id,λ) by the standard illumination light Id is obtained. Specifically, the approximation Rf(Id, λ) is obtained by using equation (11). The approximation Bf(Id, λ) is obtained by using the approximation Rf(Id, λ) and equation (7). The approximation Br(λ) is obtained by using equation (16). The sum of the approximation Bf(Id, λ) and the approximation Br(λ) is obtained. This is the approximation Bt(Id, λ).
- A different method is a method of obtaining an approximation Bt(Id, λ) of the total spectral emissivity coefficient Bt(Id,λ) by the standard illumination light Id without using the spectral reflectivity coefficient and the correction coefficient C(λ) expressed by equation (10) regarding the overlapping range. As expressed by following equations (20a) and (20b), the approximation Bt(Id, λ) is obtained separately in the overlapping range (400 ≤ λ<430 nm) and outside the overlapping range (λ ≥ 430 nm). This is hereinafter described in detail.
- As described in the measurement principle [A], an overlapping range component of the spectral power distribution Rf(I2,λ) of fluorescence by the monochromatic illumination light 12 (excitation light) in the overlapping range where the fluorescence range and the excitation range overlap is not obtained from the spectral power distribution R(I2,λ) of the radiation light including the fluorescence by the excitation light and the reflected light. Therefore, the approximation Rf(I2, λ) of the spectral power distribution Rf(I2,λ) of fluorescence by the monochromatic illumination light 12 (excitation light) is obtained by equations (8), (9a), and (10). In equation (9a), the correction coefficient C(λ) reflecting that the fluorescence wavelength λ is always longer than the excitation wavelength µ is also introduced. This different method is proposed to avoid such troublesome handling of the overlapping range.
Fig. 5 is a graph illustrating a relationship between a wavelength and spectral power for a D50 light source and a Id2 light source used in the different method. The Id2 light source is a light source which emits an overlapping range illumination light Id2 having a spectral power distribution approximating the standard illumination light Id (herein, D50 light source) in the overlapping range (400 to 430 nm). Since the overlapping range (400 to 430 nm) is a relatively narrow wavelength range, it is possible to realize the Id2 light source only by combining a small number of LEDs. In the different method, a total spectral reflectivity coefficient Bt(Id2,λ) of the overlapping range by the overlapping range illumination light Id2 is obtained (equation (19)) not as the sum of the fluorescence spectral emissivity coefficient and the spectral reflectivity coefficient but directly from a spectral power distribution R(Id2,λ) of the sample radiation light by the overlapping range illumination light Id2.
[Math. 42]
-
Fig. 6 is a graph illustrating a relationship between a wavelength and spectral power for various coefficients used in the different method. Only a fluorescence spectral emissivity coefficient Bf(Id2,λ) by the overlapping range component Id2 of the standard illumination light Id is included in Bt(Id2,λ) of the overlapping range by equation (19). Therefore, as expressed in a first half of equation (20a), it is necessary to add a fluorescence spectral emissivity coefficient Bf(Id1,λ) by an excitation component (component of <400 nm) Id1 other than the overlapping range component Id2 of the standard illumination light Id. The sum of Bf(Id1,λ) and Bt(Id2,λ) expressed by equation (19) is the approximation Bt(Id, λ) of the total spectral emissivity coefficient Bt(Id,λ) by the standard illumination light Id as expressed in the first half of equation (20a). Bf(Id1,λ) described above has a relative shape the same as that of the approximation Bf(Id, λ) obtained by equations (6) and (7). Therefore, as expressed in a latter half of equation (20a), it is possible to approximate by Bf(Id1, λ) with A as a power coefficient. - Outside the overlapping range, the approximation Bt(Id, λ) of the total spectral emissivity coefficient Bt(Id,λ) by the standard illumination light Id is provided by equation (20b) on the basis of equation (2). That is, the approximation Bt(Id, λ) is the sum of the approximation Bf(Id, λ) obtained by equations (6) and (7) and the spectral reflectivity coefficient Br(λ) obtained by equation (20c). A method of obtaining Br(λ) is as follows. Herein, since only outside the overlapping range is the target, the measuring range illumination light Ivis may be replaced with the illumination light Ivis1 (measuring range illumination light not including the excitation range). Since the illumination light Ivis1 does not excite the fluorescence, it is obtained by equation (20c) as R(Ivis1,λ) = Rr(Ivis1,λ) and Rf(Ivis1,λ) = 0. Also, since a target of equations (20a) and (20b) is fluorescence of a long wavelength by the excitation light, the correction coefficient C(λ) included in equation (9a) becomes unnecessary.
[Math. 43]

- The power coefficient A is provided by equation (21). λr3 represents one or more reference wavelengths (for example, 460 nm) not affected by the reflected light of the illumination light Ivis 2 (measuring range illumination light including the excitation range, illumination light of 400 to 430 nm). Bt(Id2,λr3) represents a total spectral emissivity coefficient by the overlapping range illumination light Id2. Bf(Id, λr3) represents an approximation of the fluorescence spectral emissivity coefficient by the standard illumination light Id.
[Math. 44]
- The measurement principle is heretofore described.
-
Fig. 7 is an illustrative diagram explaining a configuration of a device for measuring fluorescence whitened sample according to a first embodiment. The first embodiment uses two monochromatic excitation lights Ik, and is provided with an integratingsphere 4 having an inner wall with high diffusion and high reflectivity. Fromapertures sphere 4, aradiation light 1b of a blue-excited white LED 1 (illumination light Iwb radiated from the blue-excited white LED), aradiation light 2b of aultraviolet LED 2 with a central wavelength of 360 nm (monochromatic illumination light I1), and aradiation light 3b of aviolet LED 3 with a central wavelength of 405 nm (monochromatic illumination light 12) are incident, respectively. Thewhite LED 1, theultraviolet LED 2, and theviolet LED 3 are sequentially lighted up by drivingsignals circuits sphere 4 to be a diffusedillumination light 4a, and the diffusedillumination light 4a diffusely illuminates a sample 5 (fluorescence whitened sample) placed in asample aperture 5a. Out of the radiation light radiated from thesample 5 by the illumination, anormal component 5b is converged to be incident on anincident end 7a of a sampleoptical fiber 7 by anobjective lens 6 through a measuringaperture 5c of the integratingsphere 4, and is guided to a sampleoptical slit 7b of a dual channel spectrometer 9 (sample radiation light spectroscopic unit) by the sampleoptical fiber 7. This illumination light receiving system conforms to d:0°SCE geometry required by ISO 5631-1, 2, 3 regarding paper measurement. In contrast, a part of the illumination light in the integratingsphere 4 is incident on a referenceoptical fiber 8 through areference aperture 8a and is guided to a referenceoptical slit 8b of thedual channel spectrometer 9 by the referenceoptical fiber 8. Thedual channel spectrometer 9 outputs spectralpower distribution data 9a of the incident sample radiation light and reference light to the controlarithmetic device 10. The controlarithmetic device 10 controls and lights up thewhite LED 1, theultraviolet LED 2, and thepurple LED 3, and controls thedual channel spectrometer 9 to measure the spectral power distributions of the sample radiation light and the reference light, obtains an approximation of a fluorescence spectral emissivity coefficient of thesample 5 and an approximation of a spectral reflectivity coefficient by using the spectral power distribution data which is transmitted and given data, calculates an approximation of a total spectral emissivity coefficient therefrom, and outputs the approximation of the fluorescence spectral reflectivity coefficient, the approximation of the spectral reflectivity coefficient, and the approximation of the total spectral emissivity coefficient asoutput data 10a. - The arithmetic control device 10 (arithmetic control unit) is realized by, for example, hardware processors such as a central processing unit (CPU), a random access memory (RAM), a read only memory (ROM), and a hard disk drive (HDD), and a program, data and the like for executing a function of the
arithmetic control device 10. Some or all of functions of thearithmetic control device 10 may also be realized by processing by a digital signal processor (DSP) in place of or in addition to processing by the CPU. Also, some or all of the functions of thearithmetic control device 10 may be realized by processing by a dedicated hardware circuit in place of or in addition to processing by software. -
Fig. 8A is a flowchart illustrating a method for measuring spectral radiation characteristics of the fluorescence whitened sample according to the first embodiment. In order to obtain an approximation Bf(Id,λ) of a fluorescence spectral emissivity coefficient Bf(Id,λ) by the standard illumination light Id, the standard illumination light Id is required. Only an excitation range contributes to generation of fluorescence, so that it is sufficient if a spectral component of the excitation range (300 to 420 nm) of the standard illumination light Id may be realized. In the first embodiment, the spectral component of the excitation range of the standard illumination light Id is realized by a light source (ultraviolet LED 2) of the monochromatic illumination light I1 having the central wavelength of 360 nm and a light source (purple LED 3) of the monochromatic illumination light I2 having the central wavelength of 405 nm. In order to obtain an approximation Br(λ) of a spectral reflectivity coefficient Br(λ), a light source in a visible range (400 to 700 nm) is required. In the first embodiment, the light source is realized by a light source (white LED 1) of the illumination light Iwb and a light source (violet LED 3) of themonochromatic illumination light 12 having the central wavelength of 405 nm. Hereinafter, a method for measuring the spectral radiation characteristics is described with reference toFigs. 7 and8A . - The control
arithmetic device 10 lights up the light source (white LED 1) of the illumination light Iwb for a predetermined time (#1). - The control
arithmetic device 10 obtains a spectral power distribution Iwb(λ) of the illumination light Iwb and a spectral power distribution R(Iwb,λ) of the sample radiation light by the illumination light Iwb from the dual channel spectrometer 9 (#2). - The control
arithmetic device 10 lights up the light source (ultraviolet LED 2) of the monochromatic illumination light I1 having the central wavelength of 360 nm for a predetermined time (#3). - The control
arithmetic device 10 obtains a spectral power distribution I1(λ) of the monochromatic illumination light I1 and a spectral power distribution R(I1,λ)(= Rf(I1,λ)) of the sample radiation light by the monochromatic illumination light I1 (#4). - The control
arithmetic device 10 lights up the light source (violet LED 3) of the monochromatic illumination light I2 having the central wavelength of 405 nm for a predetermined time (#5). - The control
arithmetic device 10 obtains a spectral power distribution I2(λ) of the monochromatic illumination light I2 and a spectral power distribution R(I2,λ) of the sample radiation light by the monochromatic illumination light 12 (#6). - The control
arithmetic device 10 obtains a power coefficient K by R(I1,λ) obtained at #4, R(I2,λ) obtained at #6, and equation (8) (#7). - The control
arithmetic device 10 obtains a correction coefficient C(λ) by equation (10) (#8). - The control
arithmetic device 10 obtains an approximation Rf(I2, λ) of a spectral power distribution Rf(I2,λ) of fluorescence by themonochromatic illumination light 12 by K, C(λ), and equations (9a) and (9b) (#9). - The control
arithmetic device 10 executes a weighting coefficient optimizing subroutine by using the spectral power distribution I1(λ) of the monochromatic illumination light I1, the spectral power distribution I2(λ) of themonochromatic illumination light 12, and a spectral quantum efficiency FT(µ,440) of each type stored in advance, thereby obtaining weighting coefficients W1 and W2 (#10). - The control
arithmetic device 10 uses the obtained weighting coefficients W1 and W2 to obtain an approximation Rf(Id, λ) of a spectral power distribution Rf(Id,λ) of fluorescence by the standard illumination light Id by equation (11) (#11). - The control
arithmetic device 10 obtains an approximation Bf(Id, λ) of a fluorescence spectral emissivity coefficient Bf(Id,λ) by the standard illumination light Id by the approximation Rf (Id, λ), a spectral power distribution Id(λ) of the standard illumination light Id, and equation (7) (#12). - The control
arithmetic device 10 synthesizes a spectral power distribution Ivis(λ) of a measuring range illumination light Ivis and a spectral power distribution R(Ivis,λ) of the sample radiation light by the measuring range illumination light Ivis by the spectral power distribution Iwb(λ) of the illumination light Iwb, the spectral power distribution I2(λ) of themonochromatic illumination light 12, the spectral power distribution R(Iwb,λ) of the sample radiation light by the illumination light Iwb, the spectral power distribution R(I2,λ) of the sample radiation light by themonochromatic illumination light 12, equation (17), and equation (18) (#13). - The control
arithmetic device 10 obtains an approximation Br(λ) of a spectral reflectivity coefficient Br(λ) by using Ivis(λ) and R(Ivis,λ) obtained at #13, the approximation Rf(I2, λ) obtained at #9, and equation (16) (#14). A reason that the approximation Rf(I2, λ) obtained at #9 may be used as the spectral power distribution Rf(Ivis,λ) of fluorescence by the measuring range illumination light Ivis included in equation (16) is described. Since the illumination light Iwb has no wavelength component in the excitation range, fluorescence is generated by themonochromatic illumination light 12. Therefore, with regard to fluorescence, the measuring range illumination light Ivis may be regarded as the monochromatic illumination light I2. Therefore, approximation Rf(I2, λ) = approximation Rf(Ivis, λ) ≈ Rf(Ivis,λ) is satisfied. - The control
arithmetic device 10 adds the approximation Br(λ) obtained at #14 to the approximation Bf(Id, λ) obtained at #12 to obtain an approximation Bt(Id, λ) of a total spectral emissivity coefficient Bt(Id,λ) by the standard illumination light Id (#15). - The control
arithmetic device 10 outputs the approximations Bf(Id, λ), Br(λ), and Bt(Id, λ) (#16). - Hereinafter, a flow of the weighting coefficient optimizing subroutine at #10 is described.
Fig. 8B is a flowchart illustrating this subroutine. λr2 is set to 440 nm. With reference toFigs. 7 and8B , in the controlarithmetic device 10, the spectral quantum efficiency FT(µ,440) for 440 nm fluorescence of each type T (T = 1 to 4) obtained in advance, and fluorescence power Rf,T(Id,440) at 440 nm by the standard illumination light Id obtained by FT(µ,440), Id(µ), and equation (15) are stored. - The control
arithmetic device 10 obtains fluorescence powers Rf,T(I1,440) and Rf,T(I2,440) by the monochromatic illumination lights I1 and I2 of each type T by using FT(µ,440), the spectral power distribution I1(λ) of the monochromatic illumination light I1, the spectral power distribution I2(λ) of themonochromatic illumination light 12, and equation (14) (#21). - The control
arithmetic device 10 sets the weighting coefficients W1 and W2 to an initial value 1 (#22). - The control
arithmetic device 10 linearly combines Rf,T(I1,440) and Rf,T(I2,440) obtained at #21 by the weighting coefficients W1 and W2 by equation (11) to obtain a synthetic power Rf,T(Id,440) (#23). - The control
arithmetic device 10 obtains the sum of squares dRf × dRf of a difference between Rf,T(Id,440) of each type T and Rf,T(Id,440) described above stored in advance by equation (13) (#24). - The control
arithmetic device 10 determines whether the sum of squares dRf × dRf is smaller than a given threshold δ (#25). - In a case where the sum of squares dRf × dRf is smaller than the given threshold δ (Yes), the control
arithmetic device 10 returns the weighting coefficient W1 and W2 used at #23 to a main routine (#26). - In a case where the sum of squares dRf × dRf is equal to or larger than the given threshold δ (No), the control
arithmetic device 10 returns to #23 to correct the weighting coefficient W1 and W2 (#27). - In the flow illustrated in
Figs. 8A and8B , the weighting coefficients W1 and W2 are reset in the weighting coefficient optimizing subroutine at #10 on the basis of the spectral power distribution I1(λ) of the monochromatic illumination light I1 and the spectral power distribution I2(λ) of the monochromatic illumination light 12 obtained for each measurement in consideration of the fact that temperature dependency of the spectral power distribution of the LED radiation light is large (that is, a weighting coefficient Wk for setting the powers of a plurality of excitation lights Ik (k = 1 to n) is obtained on the basis of a spectral power distribution Ik(µ) of an excitation light Ik obtained in the most recent measurement). However, in a case where the spectral power distributions I1(λ) and I2(λ) are stable or change is ignorable, the weighting coefficient set and stored at the time of manufacture or before measurement may be used. - A spectral power distribution of a monochromatic LED depends on element temperature, and a forward voltage of the LED driven at constant current also depends on the element temperature. Therefore, the control
arithmetic device 10 may obtain in advance correlation characteristics between the forward voltage at the time of constant current driving and the spectral power distribution and estimate the spectral power distribution of the monochromatic LED from the forward voltage detected at the time of measurement under the same driving condition. The drivingcircuit 1d (driving unit) drives the white LED 1 (monochromatic LED) at the constant current. The drivingcircuit 2d (driving unit) drives the ultraviolet LED 2 (monochromatic LED) at the constant current. The drivingcircuit 3d (driving unit) drives the violet LED 3 (monochromatic LED) at the constant current. - Furthermore, the control
arithmetic device 10 may obtain in advance a table illustrating a relationship between the forward voltage (that is, the element temperature) of the monochromatic LED and the weighting coefficients W1 and W2 in the spectral power distributions I1(λ) and I2(λ) at the forward voltage and obtain the weighting coefficient at the forward voltage at the time of measurement by interpolation or the like. The drivingcircuit 1d is provided with a voltage measuring circuit which measures the forward voltage of the white LED 1 (monochromatic LED). The drivingcircuit 2d is provided with a voltage measuring circuit which measures the forward voltage of the ultraviolet LED 2 (monochromatic LED). The drivingcircuit 3d is provided with a voltage measuring circuit which measures the forward voltage of the violet LED 3 (monochromatic LED). Each of these voltage measuring circuits (forward voltage measuring units) is formed of an operational amplifier and an AD converter. A noninverting input terminal of the operational amplifier is connected to a cathode of the monochromatic LED. An inverting input terminal and an output terminal of the operational amplifier are connected. The output terminal of the operational amplifier is connected to an input terminal of the AD converter. - Also, at #7 to #9, regarding the spectral power distribution Rf(I2, λ) of fluorescence by the monochromatic illumination light I2, a case of a component in an overlapping range is obtained by equation (9a), and a case of a component outside the overlapping range is obtained by equation (9b). However, also a case of the component outside the overlapping range may be obtained by equation (9a). In this case, the correction coefficient C(λ) = 1 represented by equation (10) is satisfied.
-
Fig. 9 is an illustrative diagram explaining a configuration of a device for measuring a fluorescence whitened sample according to a second embodiment.Fig. 10 is a plan view of an illumination optical system provided in the device for measuring the fluorescence whitened sample according to the second embodiment. The second embodiment is different from the first embodiment only in an illumination light receiving optical system. An illumination system of the second embodiment is provided with a small integratingsphere 24, and as in the first embodiment, aradiation light 1b of a blue-excited white LED 1 (Iwb), aradiation light 2b of aultraviolet LED 2 with a central wavelength of 360 m (I1), and aradiation light 3b of aviolet LED 3 with a central wavelength of 405 nm (12) are incident fromapertures aperture 24a after multiple diffusion/reflection on an inner wall of the small integratingsphere 24. Anoptical axis 24x of the illumination light receiving optical system coincides with a normal to a radiating aperture plane passing through the center of the radiating aperture plane. Aradiation light component 24b near 45° from theoptical axis 24x is reflected by 12 plane mirrors 25a to 251 (Fig. 10 ) arranged in axial symmetry with respect to theoptical axis 24x. Reflected light fluxes illuminate asample 5 from 12 directions asillumination light 24c centered at 45° from theoptical axis 24x. Anormal component 5b of a sample radiation light by this illumination is converged and incident on anincident end 7a of a sampleoptical fiber 7 by anobjective lens 26, and is guided to a sampleoptical slit 7b of adual channel spectrometer 9 by the sampleoptical fiber 7. This illumination light receiving system conforms to a 45°c:0° geometry required by ISO 13655 regarding measurement of a printed matter. On the other hand, a part of the illumination light in the small integratingsphere 24 is incident on a referenceoptical fiber 8 through areference aperture 8a and is guided to a referenceoptical slit 8b of thedual channel spectrometer 9 by the referenceoptical fiber 8. Thedual channel spectrometer 9 outputs spectralpower distribution data 9a of the incident sample light and reference light to a controlarithmetic device 10. Control of thewhite LED 1, theultraviolet LED 2, and theviolet LED 3 and processing of the spectral power distribution data are performed by a flow inFigs. 8A and8B . - Since the radiation light from the radiating
aperture 24a of the small integratingsphere 24 haslight distribution 24d of a COS characteristic, a change in illuminance on a sample surface is suppressed even whenvariation 5c occurs in a distance between the illumination optical system and the sample 5 (sample surface) as disclosed in Literatures (US Patent No. 7,365,843 ,JP 2010-281808 A -
Fig. 11 is a plan view illustrating a radiation light incident on a small integrating sphere in a third embodiment. A method for measuring a fluorescence whitened sample according to the third embodiment basically has the same configuration as that of the second embodiment, but as illustrated inFig. 11 , aradiation light 1b (Iwb) of a blue-excitedwhite LED 1, aradiation light 31b (I1) of anLED 31 having a central wavelength of 355 nm, aradiation light 32b (I2) of anLED 32 of 375 nm, aradiation light 33b (I3) of anLED 33 of 385 nm, aradiation light 34b (14) of anLED 34 of 395 nm, and aradiation light 35b (15) of anLED 35 of 405 nm are incident on a small integratingsphere 44 from corresponding apertures.Fig. 12 is a graph illustrating spectral powers of the radiation lights (Iwb, I1, I2, I3, I4, and I5) used in the third embodiment. In thesetting method 3, weighting coefficients W1 to W5 of five excitation lights I1 to I5 cannot be optimized on the basis of four types of spectral quantum efficiencies Ff,T(µ,440) inFig. 4 . Therefore, in the third embodiment, the weighting coefficients W2 to W5 of the excitation lights 12 to 15 are set by thesetting method 1. Furthermore, in order to reflect excitation outside the excitation lights I1 to I5 (∼355 nm and 405 nm∼), the weighting coefficient W1 of the excitation light I1 and the weighting coefficient W5 of the excitation light I5 are set by the setting method 3 (weighting coefficient W5 is reset). -
Fig. 13 is a flowchart illustrating a method for measuring spectral radiation characteristics of the fluorescence whitened sample according to the third embodiment. Weighting of linear combination performed by arithmetic operation in a flow inFig. 8A andFig. 8B is performed by controlling a lighting time τk of the LED such that the power of the excitation lights Ik (k = 1 to n) is proportional to a weighting coefficient Wk in this flow. The lighting time τk of the excitation light Ik and a lighting time τwb of an illumination light Iwb based on the weighting coefficient Wk are provided in advance, and four types of illumination lights of Iwb, I1, I2_4 (= I2 + I3 + I4), and I5 are used. Since a correction coefficient C2_4(λ) of I2_4 and a correction coefficient C5(λ) of I5 depend only on spectral power distributions thereof, they may be obtained at this stage according to equation (10). - A control
arithmetic device 10 lights up a light source (white LED 1) of the illumination light Iwb for the time τwb (#31). - The control
arithmetic device 10 obtains a spectral power distribution Iwb(λ) of the illumination light Iwb and a spectral power distribution R(Iwb,λ) of a sample radiation light by the illumination light Iwb from a dual channel spectrometer 9 (#32). - The control
arithmetic device 10 lights up a light source (LED) of the excitation light I1 having a central wavelength of 355 nm for a time τ1 (#33). - The control
arithmetic device 10 obtains a spectral power distribution R(I1,λ) (= Rf(I1,λ)) of a sample radiation light by the excitation light I1 (#34). - The control
arithmetic device 10 lights up a light source (LED) of the excitation light I2 having a central wavelength of 375 nm for a time τ2, a light source (LED) of the excitation light I3 having a central wavelength of 385nm for a time τ3, and a light source (LED) of the excitation light I4 having a central wavelength of 395 nm for a time τ4 (#35). - The control
arithmetic device 10 obtains a spectral power distribution R(I2_4,λ) of a sample radiation light by the excitation lights I2+I3+I4 (#36). - The control
arithmetic device 10 lights up a light source (LED) of theexcitation light 15 having a central wavelength of 405 nm for a time τ5 (#37). - The control
arithmetic device 10 obtains a spectral power distribution I5(λ) of the excitation light I5 and a spectral power distribution R(I5,λ) of a sample radiation light by the excitation light 15 (#38). - The control
arithmetic device 10 obtains power coefficients K2_4 and K5 by equation (8) (#39). - The control
arithmetic device 10 obtains an approximation Rf(I2_4, λ) of a spectral power distribution Rf(I2_4,λ) of fluorescence by the excitation light I2_4, and an approximation Rf(I5, λ) of a spectral power distribution Rf(I5,λ) of fluorescence by theexcitation light 15 by K2_4, K5, C2_4(λ), C5(λ), equation (9a), and equation (9b) (#40). - The control
arithmetic device 10 adds R(I1,λ) and the approximations R(I2_4, λ) and Rf(I5, λ) to obtain an approximation Rf(Id, λ) of a spectral power distribution Rf(Id,λ) of fluorescence by a standard illumination light Id (#41). - The control
arithmetic device 10 obtains an approximation Bf(Id, λ) of a fluorescence spectral emissivity coefficient Bf(Id,λ) by the standard illumination light Id by the approximation Rf (Id, λ), the spectral power distribution Id(λ) of the standard illumination light Id, and equation (7) (#42). - The control
arithmetic device 10 synthesizes a spectral power distribution Ivis(λ) of a measuring range illumination light Ivis and a spectral power distribution R(Ivis,λ) of a sample radiation light by the measuring range illumination light Ivis by the spectral power distribution Iwb(λ) of the illumination light Iwb, the spectral power distribution I5(λ) of theexcitation light 15, the spectral power distribution R(Iwb,λ) of the sample radiation light by the illumination light Iwb, the spectral power distribution R(I5,λ) of the sample radiation light by theexcitation light 15, equation (17), and equation (18) (#43). - The control
arithmetic device 10 obtains an approximation Br(λ) of a spectral reflectivity coefficient Br(λ) by using Ivis,(λ) and R(Ivis,λ) obtained at #43, the approximation Rf(I5, λ)(= Rf(Ivis, λ)) obtained at #40, and equation (16) (#44). - The control
arithmetic device 10 adds the approximation Br(λ) obtained at #44 to the approximation Bf(Id, λ) obtained at #42 to obtain the approximation Bt(Id, λ) of the total spectral emissivity coefficient Bt(Id,λ) by the standard illumination light Id (#45). - The control
arithmetic device 10 outputs the approximation Bf(Id, λ), the approximation Br(λ), and the approximation Bt(Id, λ) (#46). - Although the power is provided by the lighting time τk above, it is also possible to provide this by a driving current amount ik of the LED. Although τk and ik must be known before measurement, in a case of continuous measurement as in scan measurement, the control
arithmetic device 10 may obtain a spectral power distribution Ik(λ) for each measurement, and obtain τk and ik for next measurement. In a case of simultaneous lighting, individual spectral power distribution Ik(λ) cannot be measured, but it is possible to obtain the individual spectral power distribution Ik(λ) in a case where the LED is driven at constant current and the spectral power distribution is estimated from forward voltage as described above. - A fourth embodiment uses a different method to calculate an approximation Bt(Id, λ) of a total spectral reflectivity coefficient. The fourth embodiment is basically the same in configuration as the third embodiment, but a central wavelength of a monochromatic light incident on a small integrating
sphere 44 of an illumination light receiving system illustrated inFig. 11 is different. That is, although aradiation light 1b (Iwb) of a blue-excitedwhite LED 1 and aradiation light 31b (I1) of anLED 31 having a central wavelength of 355 nm do not change, central wavelengths of aradiation light 32b (12) of anLED 32, aradiation light 33b (13) of anLED 33, aradiation light 34b (14) of anLED 34, and aradiation light 35b (15) of anLED 35 are 395nm, 405nm, 415nm, and 425nm, respectively.Fig. 14 is a graph illustrating spectral powers of the radiation lights (Iwb, I1, I2, I3, I4, and 15) used in the fourth embodiment. Weighting coefficients W2 to W5 of the excitation lights 12 to 15 are set by thesetting method 1 as in the third embodiment, and only a weighting coefficient W1 of the excitation light I1 is set by thesetting method 3. By this, a spectral power distribution Id2(λ) of an illumination light Id2 synthesized by W2·I2(λ)+W3·I3(λ)+W4·I4(λ)+W5·I5(λ) approximates D50 at 400 to 430 nm as illustrated inFig. 5 . Each of all the illumination lights (four illumination lights) forming the illumination light Id2 is any one of the five excitation lights I1 to I5, but it is sufficient that at least one of a plurality of illumination lights is any one of a plurality of excitation lights. -
Fig. 15 is a flowchart illustrating a method for measuring spectral radiation characteristics of a fluorescence whitened sample according to the fourth embodiment. Herein also, weighting of linear combination is performed by controlling a lighting time τk of the LED. The lighting time τk of an excitation light Ik and a lighting time τwb of the illumination light Iwb based on a weighting coefficient Wk are provided in advance. - A control
arithmetic device 10 lights up the light source (white LED 1) of the illumination light Iwb for the time τwb (#51). - The control
arithmetic device 10 obtains a spectral power distribution Iwb(λ) of the illumination light Iwb and a spectral power distribution R(Iwb,λ) of a sample radiation light by the illumination light Iwb from a dual channel spectrometer 9 (#52). - The control
arithmetic device 10 lights up a light source (LED) of the excitation light I1 having the central wavelength of 355 nm for a time τ1 (#53). - The control
arithmetic device 10 obtains a spectral power distribution R(I1,λ) (= Rf(I1,λ)) of a sample radiation light by the excitation light I1 (#54). - The control
arithmetic device 10 lights up a light source (LED) of the excitation light I2 having the central wavelength of 395 nm for a time τ2, a light source (LED) of the excitation light I3 having the central wavelength of 405nm for a time τ3, a light source (LED) of the excitation light I4 having the central wavelength of 415 nm for a time τ4, and a light source (LED) of the excitation light I5 having the central wavelength of 425 nm for a time τ5 (#55). - The control
arithmetic device 10 obtains a spectral power distribution R(I2_5,λ) of a sample radiation light by the excitation lights I2 + I3 + I4 + I5 (#56). - The control
arithmetic device 10 obtains a power coefficient K2_5 by equation (8) (#57). - The control
arithmetic device 10 obtains an approximation Rf(I2_5, λ) of a spectral power distribution Rf(I2_5,λ) of fluorescence by an excitation light I2_5 by K2_5, and equations (9a) and (9b) (#58). - The control
arithmetic device 10 adds R(I1,λ) and an approximation R(I2_5, λ) to obtain an approximation Rf(Id, λ) of a spectral power distribution Rf(Id,λ) of fluorescence by a standard illumination light Id (#59). - The control
arithmetic device 10 obtains an approximation Bf(Id, λ) of a fluorescence spectral emissivity coefficient Bf(Id,λ) by the standard illumination light Id by the approximation Rf (Id, λ), a spectral power distribution Id(λ) of the standard illumination light Id, and equation (7) (#60). - The control
arithmetic device 10 obtains a total spectral emissivity coefficient Bt(Id2,λ) of an overlapping range by the overlapping range illumination light Id2 using equation (19) (#61). The overlapping range is 400 nm ≤ λ < 430 nm. The overlapping range illumination light Id2 approximates D50. - The control
arithmetic device 10 sets λr3 = 460 nm, and obtains a power coefficient A2_5 using equation (21) (#62). - The control
arithmetic device 10 obtains an approximation Bt(Id, λ) of a total spectral emissivity coefficient Bt(Id,λ) of the overlapping range by the standard illumination light Id using equation (20a) (#63). - The control
arithmetic device 10 obtains a spectral reflectivity coefficient Br(λ) outside the overlapping range by using equation (20c) (#64). Outside the overlapping range is λ ≥ 430 nm. - The control
arithmetic device 10 obtains an approximation Bt(Id, λ) of a total spectral emissivity coefficient Bt(Id,λ) outside the overlapping range by the standard illumination light Id using equation (20b) (#65). - The control
arithmetic device 10 outputs the approximation Bt(Id, λ) in an entire visible range, that is, the approximations Bt(Id, λ) and Bt(Id, λ) of the overlapping range and outside the overlapping range, respectively (#66). - In a case of scanning and measuring a large number of printing patches for evaluating a printer, a short measuring time is required. In this embodiment, since the excitation lights 12 to 15 are simultaneously lighted up (a plurality of excitation lights Ik is simultaneously applied), the measuring time is shortened.
- A fifth embodiment is described. The fifth embodiment differs from the first to fourth embodiments in an illumination optical system.
Fig. 16 is an illustrative diagram for explaining a relationship between a small integrating sphere and a radiation light incident on the small integrating sphere in an illumination light receiving system of the fifth embodiment. A small integratingsphere 24 illustrated inFig. 16 is different from the small integratingsphere 24 illustrated inFig. 9 in that awhite light source 21 and a shortwavelength cut filter 22 are provided in place of awhite LED 1. The white light source 21 (for example, an incandescent lamp) has a power in an entire visible range. In the first to fourth embodiments, a radiation light of a blue-excited white LED is a component Ivis2 which does not excite fluorescence of a visible range illumination light Ivis. On the other hand, in the fifth embodiment, as illustrated inFig. 16 , aradiation light 21a of thewhite light source 21 transmitted through the shortwavelength cut filter 22 is allowed to be incident on the small integratingsphere 24.Fig. 17 is a graph for explaining optical characteristics of thewhite light source 21 and the shortwavelength cut filter 22. The graph illustrates a relative spectral power distribution (A in the drawing) of an incandescent lamp (illuminant A) with color temperature of 2855.6 K, a spectral transmissivity (L435) of a sharp cut filter L435 with a cutoff wavelength of 435 nm, and a spectral power distribution (L435 & A) of the illumination light obtained by combining them. This graph also illustrates a spectral quantum efficiency for 440 nm fluorescence of fluorescence whitened paper (Paper H). - Embodiments may also be provided with a measuring range illuminating unit. This is to be described. The measuring range illuminating unit illuminates the fluorescence whitened sample with a measuring range illumination light Ivis having a power in an entire measuring range (400 to 700 nm). A control arithmetic unit (control arithmetic device 10) lights up the measuring range illuminating unit, allow a sample radiation light spectroscopic unit (dual channel spectrometer 9) to measure a spectral distribution Rr(Ivis,λ) of a sample reflected light by the measuring range illumination light Ivis, obtains an approximation Br(λ) of a spectral reflectivity coefficient Br(λ) from a spectral power distribution Ivis(λ) of the measuring range illumination light and the spectral power distribution Rr(Ivis,λ) of the sample reflected light (equation (16)), and obtains an approximation Bt(Id, λ) of a total spectral emissivity coefficient Bt(Id,λ) by a standard illumination light by the sum of the approximation Br(λ) and an approximation Bf(Id, λ) of a fluorescence spectral emissivity coefficient Bf(Id,λ) by the standard illumination light.
- A first example of the measuring range illuminating unit includes a blue-excited white LED (white LED 1) and one or more monochromatic LEDs (purple LED 3) having a power in a measuring range where the blue-excited white LED does not have power, and the measuring range illumination light Ivis is formed of a radiation light of the blue-excited white LED and a radiation light of one or more monochromatic LEDs. A second example of the measuring range illuminating unit includes a white light source (white light source 21), a fluorescence excitation wavelength band cut filter (short wavelength cur filter 22), and one or more monochromatic LEDs having power in a fluorescence excitation light wavelength band (
violet LED 3 illustrated inFig. 16 , and UV360 and V405 illustrated inFig. 17 ), and the measuring range illumination light Ivis is formed of a radiation light of the white light source passing through the fluorescence excitation wavelength band cut filter and one or more monochromatic LEDs. - Next, effects of the embodiment are described by data.
Fig. 18 is a graph illustrating spectral radiation characteristics of fluorescence whitened paper (paper A).Fig. 19 is a graph illustrating spectral radiation characteristics of fluorescence whitened paper (paper G). The wavelength is plotted along the abscissa axis of these graphs. Bt(Id,λ), Bt(Id, λ), Br(λ), and Br(λ) are plotted along the left ordinate axis of the graph, and dBt(λ) and dBr(λ) are plotted along the right ordinate axis. Bt(Id, λ) and Br(λ) are measured values measured by the method for measuring the embodiment. Bt(Id,λ) and Br(λ) are reference values. dBt(λ) indicates a difference between Bt(Id, λ) and Bt(Id,λ). dBr(λ) indicates a difference between Br(λ) and Br(λ). In any case, it may be seen that the measured value coincides well to a reference value. As for the spectral reflectivity coefficient, a reflectivity coefficient of 420 nm or shorter which cannot be obtained by a conventional method (method in accordance with ISO 2470) of removing a component of 420 nm or shorter of the illumination light is obtained. -
- [1] One aspect of an embodiment is a method for measuring spectral radiation characteristics of a fluorescence whitened sample illuminated with a standard illumination light Id, the method provided with obtaining an approximation Bf(Id, λ) of a fluorescence spectral emissivity coefficient Bf(Id,λ) by the standard illumination light Id at following first to third steps from spectral power distributions R(Ik,λ) of sample radiation lights generated when the fluorescence whitened sample is sequentially illuminated with a plurality of excitation lights Ik (k = 1 to n) having different spectral power distributions and a spectral power distribution Id(λ) of the standard illumination light Id.
- First step: Spectral power distributions Rf(Ik,λ) of fluorescence are obtained from the spectral power distributions R(Ik,λ) by respective excitation lights Ik.
- Second step: The spectral power distributions Rf(Ik,λ) of fluorescence by the respective excitation lights Ik are linearly combined with a given weighting coefficient Wk, and an approximation Rf(Id, λ) of a spectral power distribution Rf(Id,λ) of fluorescence by the standard illumination light Id is obtained by following equation (6).
[Math. 6]
- Third step: The approximation Bf(Id, λ) is obtained by following equation (7) from the approximation Rf(Id, λ) and the spectral power distribution Id(λ) of the standard illumination light Id.
[Math. 7]
These steps make it possible to improve accuracy of the approximation Bf(Id, λ) of the fluorescence spectral emissivity coefficient Bf(Id,λ) by the standard illumination light Id for the fluorescence whitened paper having various bispectral fluorescence emissivity coefficients. - [2] In the above-described configuration, the plurality of excitation lights Ik is monochromatic excitation lights.
According to this configuration, a weighted linear combination of the spectral power distributions Rf(Ik,λ) of fluorescence by the plurality of excitation lights Ik is obtained, and it is possible to improve accuracy of the approximation Rf(Id, λ) of spectral power distributions Rf(Id,λ) of fluorescence by various standard illumination lights Id. - [3] In the above-described configuration, the monochromatic excitation lights are monochromatic LED radiation lights.
According to this configuration, the monochromatic excitation light of sufficient power may be obtained with high efficiency and at a low cost. - [4] In the above-described configuration, a plurality of sets of weighting coefficients Wk corresponding to a plurality of standard illumination lights Id, respectively, is set, and the approximation Rf(Id, λ) is obtained by applying a set of weighting coefficients Wk corresponding to each standard illumination light Id (<measurement principle> [B]).
According to this configuration, the approximation Rf(Id, λ) of the spectral power distributions Rf(Id,λ) of fluorescence by a plurality of standard illumination lights Id may be obtained by one measurement. - [5] In the above-described configuration, the plurality of excitation lights Ik includes a first type of excitation light Ik1 (monochromatic illumination light I1 having a central wavelength of 360 nm) outside an overlapping range of a reflected light range and a fluorescence range, and a second type of excitation light Ik2 (monochromatic illumination light 12 having a central wavelength of 405 nm) within the overlapping range, at the first step, a spectral power distribution Rf(Ik1,λ) of fluorescence by the first type of excitation light Ik1 is obtained from a spectral power distribution R(Ik1,λ) of a sample radiation light by the first type of excitation light Ik1 (since the central wavelength of the first type of excitation light Ik1 is outside the overlapping range, Rf(Ik1,λ) is equal to R(Ik1,λ)), an approximation Rf(Ik2, λ) of at least a part of a spectral power distribution Rf(Ik2,λ) of fluorescence by the second type of excitation light Ik2 is estimated on the basis of the spectral power distribution R(Ik1,λ) of the sample radiation light by the first type of excitation light Ik1 (within the overlapping range, an approximation Rf(I2, λ) of a spectral power distribution Rf(I2,λ) of fluorescence by the monochromatic illumination light I2 is obtained by using equation (9a)), and a remaining part is obtained from the spectral power distribution R(Ik2,λ) of the sample radiation light by the second type of excitation light Ik2 (outside the overlapping range, equation (9b) is used. Note that, it is not R(I2,λ) but Rf(I2,λ) in equation (9b), a coefficient K expressed in equation (8) may be reworded as a ratio between spectral power distributions R(I1,λr1) and R(I2,λr1) of sample radiation lights by the monochrome illumination lights I1 and I2 at a reference wavelength λr1. Therefore, Rf(I2,λ) in equation (9b) may be rewarded as R(I2,λ)).
According to this configuration, it is possible to improve accuracy of the approximation Rf(Ik2, λ) of the spectral power distribution Rf(Ik2,λ) of fluorescence by the second type of excitation light Ik2 even in the wavelength range in which the spectral power distribution of the sample radiation light by the second type of excitation light Ik2 R(Ik2,λ) = Rf(Ik2, λ) is not satisfied. - [6] In the above-described configuration, the approximation Rf(Ik2, λ) of at least a part of the spectral power distribution Rf(Ik2,λ) of fluorescence by the second type of excitation light Ik2 as the estimation at following fourth to sixth steps.
- Fourth step: A ratio K of powers of the sample radiation lights by the first and second types of excitation lights Ik1 and Ik2 at one or more reference wavelengths λr1 outside the overlapping range is obtained by following equation (22). Equation (22) corresponds to equation (8).
[Math. 8]
- Fifth step: A correction coefficient C(λ) reflecting that a fluorescence wavelength λ is longer than an excitation wavelength µ is obtained.
- Sixth step: The approximation Rf(Ik2, λ) is obtained by following equation (23) from the spectral power distribution R(Ik1,λ) of the sample radiation light by the first type of excitation light Ik1, the ratio K of the powers, and the correction coefficient C(λ). Equation (23) corresponds to equation (9a).
[Math. 9]
According to this configuration, it is possible to improve accuracy of the approximation Rf(Ik2, λ) of the spectral power distribution Rf(Ik2,λ) of fluorescence by the second type of excitation light Ik2 also in the above-described part. - Fourth step: A ratio K of powers of the sample radiation lights by the first and second types of excitation lights Ik1 and Ik2 at one or more reference wavelengths λr1 outside the overlapping range is obtained by following equation (22). Equation (22) corresponds to equation (8).
- [7] In the above-described configuration, the spectral power distribution of the second type of excitation light Ik2 is obtained from Ik2(µ), and the correction coefficient C(λ) is obtained by following equation (24). Equation (24) corresponds to equation (10).
[Math. 10]
According to this configuration, it is possible to improve accuracy of the approximation Rf(Ik2, λ) of the spectral power distribution Rf(Ik2,λ) of fluorescence by the second type of excitation light Ik2 also in the above-described part. - [8] In the above-described configuration, the part includes the overlapping range.
According to this configuration, it is possible to improve accuracy of the approximation Rf(Ik2, λ) of the spectral power distribution Rf(Ik2,λ) of fluorescence by the second type of excitation light Ik2 also in the wavelength range in which the reflected light and fluorescence of the second type of excitation light Ik2 overlap. - [9] In the above-described configuration, powers of the plurality of excitation lights Ik (k = 1 to n) are proportional to the weighting coefficient Wk (third embodiment).
According to this configuration, since a plurality of excitation lights may be simultaneously applied, a measuring time may be shortened. - [10] In the above-described configuration, powers of the plurality of excitation lights Ik (k = 1 to n) are controlled by an irradiation time (third embodiment).
According to this configuration, it is possible to control the excitation light power with a simple LED driving circuit. - [11] In the above-described configuration, two or more excitation lights Ik (excitation lights I2 to I4) out of the plurality of excitation lights Ik (k = 1 to n) are simultaneously applied (third embodiment).
According to this configuration, the measuring time may be shortened. - [12] In the above-described configuration, the weighting coefficient Wk for setting the powers of the plurality of excitation lights Ik (k = 1 to n) is obtained on the basis of a spectral power distribution Ik(µ) of the excitation light Ik obtained at most recent measurement (first embodiment).
According to this configuration, prior measurement of the spectral power distribution Ik(µ) of the excitation light Ik for setting the Wk becomes unnecessary. Especially, the effect is large in continuous measurement of a large number of samples. - [13] In the above-described configuration, each of the plurality of excitation lights Ik (k = 1 to n) is a radiation light of a monochrome LED driven at constant current, and the spectral power distribution Ik(µ) of each of the plurality of excitation lights Ik is obtained on the basis of a forward voltage when driving the monochrome LED and known correlation characteristics of forward voltage-spectral power distribution (first embodiment).
According to this configuration, even if a plurality of monochromatic LEDs is simultaneously lighted up, it is possible to estimate the spectral power distribution Ik(µ) of each excitation light Ik from the forward voltage of each LED individually detected and provide the same for Wk setting. - [14] In the above-described configuration, the weighting coefficient Wk is set such that a spectral power distribution Id(λ) of a synthetic excitation light Id obtained by linearly combining the spectral power distributions of the plurality of excitation lights Ik by following equation (12) approximates the spectral power distribution Id(λ) of the standard illumination light Id (<measurement principle> [B] (setting method 1).
[Math. 11]
According to this configuration, the weighting coefficient Wk for a large number of excitation lights Ik may be set on the basis of the spectral power distribution Ik(λ) of the excitation lights Ik and the spectral power distribution Id(λ) of the standard illumination light Id. - [15] In the above-described configuration, the weighting coefficient Wk is set at following seventh and eighth steps from the spectral power distributions Ik(λ) of the plurality of excitation lights Ik, the spectral power distribution Id(λ) of the standard illumination light Id, and a plurality of different bispectral fluorescence emissivity coefficients FT(µ,λ) (T = 1 to N, µ represents an excitation wavelength and λ represents a fluorescence wavelength) (<measurement principle> [B] (setting method 2).
- Seventh step: Spectral power distributions Rf,T(Ik,λ) of fluorescence by the plurality of excitation lights Ik and a spectral power distribution Rf,T(Id,λ) of fluorescence by the standard illumination light Id are obtained by following equations (25) and (26) from the plurality of bispectral fluorescence emissivity coefficients FT(µ,λ), the spectral power distributions Ik(µ) of the plurality of excitation lights Ik, and a spectral power distribution Id(λ) of the standard illumination light Id.
[Math. 12]
[Math. 13]
- Eighth step: The weighting coefficient Wk is set such that a spectral power distribution Rf,T(Id, λ) of synthetic fluorescence obtained by linearly combining the spectral power distributions Rf,T(Ik,λ) of fluorescence by the plurality of excitation lights Ik by following equation (27) approximates the spectral power distribution Rf,T(Id,λ) of fluorescence by the standard illumination light Id for all of the plurality of bispectral fluorescence emissivity coefficients FT(µ,λ).
[Math. 14]
According to this configuration, the approximation Rf,T(Id, λ) of the spectral power distribution Rf,T(Id,λ) of fluorescence by the standard illumination light Id may be synthesized also in a case where the number of excitation lights Ik is small. - Seventh step: Spectral power distributions Rf,T(Ik,λ) of fluorescence by the plurality of excitation lights Ik and a spectral power distribution Rf,T(Id,λ) of fluorescence by the standard illumination light Id are obtained by following equations (25) and (26) from the plurality of bispectral fluorescence emissivity coefficients FT(µ,λ), the spectral power distributions Ik(µ) of the plurality of excitation lights Ik, and a spectral power distribution Id(λ) of the standard illumination light Id.
- [16] In the above-described configuration, the weighting coefficient Wk is set at following ninth and tenth steps from the spectral power distributions Ik(λ) of the plurality of excitation lights Ik, the spectral power distribution Id(λ) of the standard illumination light Id, and a plurality of different spectral quantum efficiencies FT(µ,λr2) (T = 1 to N, µ represents an excitation wavelength) for fluorescence at a reference wavelength λr2 (<measurement principle> [B] (setting method 3).
- Ninth step: Fluorescence powers Rf,T(Ik,λr2) at the reference wavelength λr2 by the plurality of excitation lights Ik and fluorescence power Rf,T(Id,λr2) at the reference wavelength λr2 by the standard illumination light Id are obtained by following equations (28) and (29) from the plurality of spectral quantum efficiencies FT(µ,λr2), the spectral power distributions Ik(µ) of the plurality of excitation lights Ik, and the spectral power distribution Id(µ) of the standard illumination light Id.
[Math. 15]
[Math. 16]
- Tenth step: The weighting coefficient Wk is set such that a synthetic fluorescence power Rf,T(Id, λr2) obtained by linearly combining the fluorescence powers Rf,T(Ik,λr2) by following equation (30) approximates the fluorescence power Rf,T(Id,λr2) by the standard illumination light Id for all of the plurality of spectral quantum efficiencies FT(µ,λr2).
[Math. 17]
According to this configuration, an appropriate weighting coefficient Wk may be set with a much smaller amount of data and shorter processing time than those in the method in [12]. - Ninth step: Fluorescence powers Rf,T(Ik,λr2) at the reference wavelength λr2 by the plurality of excitation lights Ik and fluorescence power Rf,T(Id,λr2) at the reference wavelength λr2 by the standard illumination light Id are obtained by following equations (28) and (29) from the plurality of spectral quantum efficiencies FT(µ,λr2), the spectral power distributions Ik(µ) of the plurality of excitation lights Ik, and the spectral power distribution Id(µ) of the standard illumination light Id.
- [17] Apart of the weighting coefficients Wk set by the method in [14] is reset by the method in [15] or [16].
According to this configuration, even in a case where there is a wavelength range in which the excitation light Ik does not exist, and the spectral power distribution Id(λ) of the standard illumination light Id cannot be sufficiently approximated by this, it is possible to set an appropriate weighting coefficient Wk. - [18] In the above-described configuration, the bispectral fluorescence emissivity coefficients FT(µ,λ) of the fluorescence whitened sample to be measured are classified into a plurality of types (
Fig. 4 ), the plurality of different bispectral fluorescence emissivity coefficients being the plurality of types of bispectral fluorescence emissivity coefficients, or spectral quantum efficiencies FT(µ,λr2) for fluorescence at the reference wavelength λr2 of the fluorescence whitened sample to be measured are classified into a plurality of types, the plurality of different spectral quantum efficiencies being the plurality of types of spectral quantum efficiencies.
According to this configuration, the set weighting coefficient may provide a highly accurate fluorescence spectral emissivity coefficient for the classified sample to be measured (measurement target). - [19] In the above-described configuration, an approximation Br(λ) of a spectral reflectivity coefficient Br(λ) is obtained from a spectral power distribution Ivis(λ) of a measuring range illumination light Ivis having a power in an entire measuring range and a spectral power distribution Rr(Ivis,λ) of a sample reflected light by the measuring range illumination light Ivis (first half of equation (16)), and an approximation Bt(Id, λ) of a total spectral emissivity coefficient Bt(Id,λ) by the standard illumination light Id is obtained by a sum of the approximation Br(λ) and the approximation Bf(Id, λ).
According to this configuration, it is possible to improve the accuracy of the approximation of the total spectral emissivity coefficient for the fluorescence whitened paper having various bispectral fluorescence emissivity coefficients. The entire measuring range is, for example, the wavelength range (visible range) of 400 to 700 nm. - [20] In the above-described configuration, a spectral reflectivity coefficient Br(λ) outside the overlapping range is obtained from a spectral power distribution Ivis1(λ) of an illumination light Ivis1 outside the overlapping range having a power in the entire measuring range outside the overlapping range and a spectral power distribution Rr(Ivis1,λ) of a sample reflected light by the illumination light Ivis1 outside the overlapping range (equation (20c)), an approximation Bt(Id, λ) of a total spectral emissivity coefficient outside the overlapping range by the standard illumination light Id is provided by a sum of the spectral reflectivity coefficient Br(λ) and the approximation Bf(Id, λ) (equation (20b)), and the approximation Bt(Id, λ) of the total spectral emissivity coefficient of the overlapping range by the standard illumination light Id is obtained by a sum of a total spectral emissivity coefficient Bt(Id2,λ) of the overlapping range by the overlapping range illumination light Id2 obtained from a spectral power distribution Id2(λ) of an overlapping range illumination light Id2 having a spectral power distribution approximating the standard illumination light Id in the overlapping range and a spectral power distribution R(Id2,λ) of a sample radiation light by the overlapping range illumination light Id2 (equation (19)) and a fluorescence spectral emissivity coefficient Bf(Id1,λ) by an excitation component Id1 other than an overlapping range component of the standard illumination light Id (first half of equation (20a)).
According to this configuration, it is possible to avoid an approximation error of the overlapping range which tends to be larger and improve the accuracy of the approximation of the total spectral emissivity coefficient for the fluorescence whitened paper having various bispectral fluorescence emissivity coefficients. - [21] In the above-described configuration, the overlapping range illumination light Id2 having a spectral power distribution approximating the standard illumination light Id in the overlapping range is provided by weighted linear combination of a plurality of illumination lights (fourth embodiment: illumination light Id2 synthesized by W2·I2(λ) + W3·I3(λ) + W4·I4(λ) + W5·I5(λ).
Since the overlapping range is limited, it is possible to obtain an approximating illumination light with sufficient accuracy by lighting up a small number of monochromatic LEDs with an appropriate power, for example. - [22] In the above-described configuration, at least one of the plurality of illumination lights is any of the plurality of excitation lights Ik.
According to this configuration, it is possible to suppress the number of illumination lights required as an entire illumination system. - [23] In the above-described configuration, the Bf(Id1,λ) being a component not by the overlapping range illumination light Id2 of the approximation Bf(Id,λ) is obtained at following eleventh and twelfth steps.
- Eleventh step: A power coefficient A is obtained by following equation (21) from a total spectral emissivity coefficient Bt(Id2,λr3) by the overlapping range illumination light Id2 at one or more reference wavelengths λr3 not affected by a reflected light of the overlapping range illumination light Id2, and an approximation Bf(Id, λr3) of a fluorescence emissivity coefficient by the standard illumination light Id.
[Math. 18]
- Twelfth step: The Bf(Id1,λ) is obtained by following equation (35) from the approximation Bf(Id, λ) of the fluorescence spectral emissivity coefficient by the standard illumination light Id and the power coefficient A.
[Math. 19]
According to this configuration, it is possible to avoid the approximation error of the overlapping range which tends to be large and to provide highly accurate approximation of the total spectral emissivity coefficient by simple operation. - Eleventh step: A power coefficient A is obtained by following equation (21) from a total spectral emissivity coefficient Bt(Id2,λr3) by the overlapping range illumination light Id2 at one or more reference wavelengths λr3 not affected by a reflected light of the overlapping range illumination light Id2, and an approximation Bf(Id, λr3) of a fluorescence emissivity coefficient by the standard illumination light Id.
- [24] In the above-described configuration, the spectral power distribution Rr(Ivis,λ) of the sample reflected light is obtained by subtracting a spectral power distribution Rf(Ivis,λ) of fluorescence by the measuring range illumination light Ivis from a spectral power distribution R(Ivis,λ) of a sample radiation light by the measuring range illumination light Ivis (equation (16)).
By using the spectral power distribution Rr(Ivis,λ) of the sample reflected light by the measuring range illumination light Ivis, the accuracy of the approximation Bt(Id, λ) of the total spectral emissivity coefficient Bt(Id,λ) by the standard illumination light Id may be improved. - [25] In the above-described configuration,
the measuring range illumination light Ivis is formed of a first measuring range illumination light Ivis1 not including an excitation range and a second measuring range illumination light Ivis2 including the excitation range, and
the approximation Br(λ) of the spectral reflectivity coefficient Br(λ) of the fluorescence whitened sample is obtained by following thirteenth to sixteenth steps from
a spectral power distribution Ivis1(λ) of the first measuring range illumination light Ivis1 and a spectral power distribution R(Ivis1,λ) of the sample radiation light by the first measuring range illumination light, and
a spectral power distribution Ivis2(λ) of the second measuring range illumination light Ivis2 and a spectral power distribution R(Ivis2,λ) of the sample radiation light by the second measuring range illumination light.- Thirteenth step: The spectral power distribution Ivis(λ) of the measuring range illumination light Ivis is provided by a sum of the spectral power distributions Ivis1 (λ) and Ivis2(λ) of the first and second measuring range illumination lights (equation (17)).
- Fourteenth step: The spectral power distribution R(Ivis,λ) of the sample radiation light by the measuring range illumination light Ivis is provided by a sum of R(Ivis1,λ) and R(Ivis2,λ) by the first and second measuring range illumination lights (equation (18)).
- Fifteenth step: A spectral power distribution Rf(Ivis2,λ) of fluorescence by the second measuring range illumination light Ivis2 is obtained.
- Sixteenth step: The approximation Br(λ) is obtained by following equation (31) while setting the Rf(Ivis2,λ) as Rf(Ivis,λ).
[Math. 20]
It is possible to obtain the approximation of the total spectral emissivity coefficient with high accuracy using the approximation Br(λ) obtained by this configuration. Since the first measuring range illumination light Ivis1 does not excite the fluorescence, Rf(Ivis2,λ) is equal to Rf(Ivis,λ). - [26] In the above-described configuration, the spectral power distribution Rf(Ivis2,λ) of fluorescence by the second measuring range illumination light is obtained at following seventeenth to twentieth steps from the spectral power distribution Ivis2(λ) of the second measuring range illumination light, the spectral power distribution R(Ivis2,λ) of the sample radiation light by the second measuring range illumination light, the spectral power distribution Ik1(λ) of the first type of excitation light outside the overlapping range of the reflected light range and the fluorescence range, and the spectral power distribution R(Ik1,λ) of the sample radiation light by the first type of excitation light.
- Seventeenth step: A component outside the overlapping range of the spectral power distribution Rf(Ivis2,λ) of fluorescence by the second measuring range illumination light is obtained from the spectral power distribution R(Ivis2,λ) of the sample radiation light by the second measuring range illumination light. Since Rf(Ivis2,λ) equals to R(Ivis2,λ) outside the overlapping range, R(Ivis2,λ) may be made Rf(Ivis2,λ)
- Eighteenth step: A ratio K between a spectral power distribution R(Ik1, λr4) of the sample radiation light by the first type of excitation light and a spectral power distribution R(Ivis2,λr4) of the sample radiation light by the second measuring range illumination light at one or more reference wavelengths λr4 outside the overlapping range is obtained by following equation (32).
[Math. 21]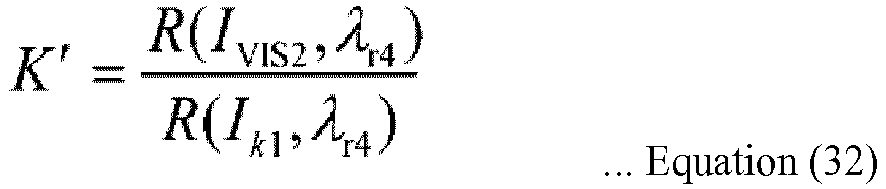
- Nineteenth step: A correction coefficient C(λ) reflecting that the fluorescence wavelength λ is longer than the excitation wavelength µ is obtained.
- Twentieth step: An approximation Rf(Ivis2, λ) of a component in the overlapping range of the spectral power distribution Rf(Ivis2,λ) of fluorescence by the second measuring range illumination light is obtained by following equation (33) from the spectral power distribution R(Ik1,λ) of the sample radiation light by the first type of excitation light, the power ratio K, and the correction coefficient C(λ). In the overlapping range, the approximation Rf(Ivis2, λ) is regarded as Rf(Ivis2,λ)
[Math. 22]
It is possible to obtain the approximation of the total spectral emissivity coefficient with high accuracy using the approximation Rf(Ivis2, λ) obtained by this configuration. Equation (32) means equation (8). Equation (33) means equation (9a). Ivis2 corresponds to I2, Ik1 corresponds to I1, and λr4 corresponds to λr1. - [27] In the above-described configuration, the correction coefficient C(λ) is obtained by following equation (34) from the spectral power distribution Ivis2(λ) of the second measuring range illumination light.
[Math. 23]
According to this configuration, the accuracy of the approximation Rf(Ivis2, λ) of the fluorescence spectral power distribution by the second measuring range illumination light Ivis2 is improved. Equation (34) means equation (10). - [28] A device for measuring spectral radiation characteristics of a fluorescence whitened sample according to another aspect of the embodiment is provided with: a plurality of excitation light illuminating units for illuminating the fluorescence whitened sample with a plurality of excitation lights Ik (k = 1 to n) having different spectral power distributions; a sample radiation light spectroscopic unit (dual channel spectroscope 9) for measuring spectral power distributions R(Ik,λ) of sample radiation lights being radiation lights radiated from the fluorescence whitened sample illuminated by the excitation lights Ik; and a control arithmetic unit,
in which the control arithmetic unit sequentially lights up the plurality of excitation light illuminating units to allow the sample radiation light spectroscopic unit to measure the spectral power distributions R(Ik,λ) of the sample radiation lights, obtains spectral power distributions Rf(Ik,λ) of fluorescence from the spectral power distributions R(Ik,λ) of the sample radiation lights, obtains an approximation Rf(Id, λ) of a spectral power distribution Rf(Id,λ) of fluorescence by a standard illumination light Id by using the spectral power distributions Rf(Ik,λ) of fluorescence and a given weighting coefficient Wk by following equation (6)
[Math. 24]
and
obtains an approximation Bf(Id, λ) of a fluorescence spectral emissivity coefficient Bf(Id,λ) by the standard illumination light Id from the approximation Rf(Id, λ) and a known spectral power distribution Id(λ) of the standard illumination light Id by following equation (7).
[Math. 25]
According to a second aspect of the present invention, it is possible to improve accuracy of an approximation Bf(Id, λ) of a fluorescence spectral emissivity coefficient Bf(Id,λ) by the standard illumination light Id for the fluorescence whitened paper having various bispectral fluorescence emissivity coefficients. - [29] In the above-described configuration, each of the plurality of excitation lights Ik is a radiation light of a monochromatic LED.
According to this configuration, a highly efficient excitation light illuminating unit may be realized at a low cost. - [30] In the above-described configuration, an excitation light spectroscopic unit (dual channel spectrometer 9) is further provided, in which the control arithmetic unit allows the excitation light spectroscopic unit to measure the spectral power distributions Ik(λ) of the excitation lights Ik, and obtains the weighting coefficient Wk on the basis of the spectral power distributions Ik(λ) (equation (12)).
According to this configuration, it is possible to set the weighting coefficient Wk corresponding to variation of the spectral power distribution Ik (λ) of the excitation light Ik. - [31] In the above-described configuration, a driving unit which drives the monochrome LED at a constant current, and a forward voltage measuring unit which measures a forward voltage of the monochrome LED at the time of driving are further provided, in which the control arithmetic unit estimates the spectral power distributions Ik(λ) of the excitation lights Ik on the basis of the forward voltage measured by the forward voltage measuring unit, and obtains the weighting coefficient Wk on the basis of the estimated spectral power distributions Ik(λ).
According to this configuration, it is possible to set the weighting coefficient Wk corresponding to the variation of the spectral power distribution Ik(λ) of the excitation light Ik without providing an excitation light spectroscopic unit. - [32] In the above-described configuration, a measuring range illuminating unit which illuminates the fluorescence whitened sample with a measuring range illumination light Ivis having a power in an entire measuring range is further provided, in which the control arithmetic unit lights up the measuring range illuminating unit to allow the sample radiation light spectroscopic unit to measure a spectral power distribution Rr(Ivis,λ) of a sample reflected light by the measuring range illumination light, obtains an approximation Br(λ) of a spectral reflectivity coefficient Br(λ) from a spectral power distribution Ivis(λ) of the measuring range illumination light and the spectral power distribution Rr(Ivis,λ) of the sample reflected light (equation (16)), and obtains an approximation Bt(Id, λ) of a total spectral emissivity coefficient Bt(Id,λ) by the standard illumination light Id by a sum of the approximation Br(λ) and the approximation Bf(Id, λ) of the fluorescence spectral emissivity coefficient Bf(Id,λ) by the standard illumination light.
According to this configuration, it is possible to obtain a highly accurate approximation of the total spectral emissivity coefficient for fluorescence whitened paper having various bispectral fluorescence emissivity coefficients. - [33] In the above-described configuration, the measuring range illuminating unit includes a blue-excited white LED and one or more monochrome LEDs having a power in a measuring range where the blue-excited white LED does not have power, and the measuring range illumination light Ivis is formed of a radiation light of the blue-excited white LED and a radiation light of the one or more monochrome LEDs.
According to this configuration, highly efficient measuring range illumination means may be realized at a low cost. - [34] In the above-described configuration, the measuring range illuminating unit includes a white light source, a fluorescence excitation wavelength band cut filter, and one or more monochromatic LEDs having a power in a fluorescence excitation light wavelength band, and the measuring range illumination light Ivis is formed of a radiation light of the white light source passing through the fluorescence excitation wavelength band cut filter and the one or more monochromatic LEDs.
- According to this configuration, it is possible to realize the measuring range illumination light having a spectral power distribution with less unevenness.
- Although embodiments of the present invention are illustrated and described in detail, it is to be understood that such examples are illustrative only and not restrictive. The scope of the present invention should be construed by the language of appended claims.
- The disclosure of
JP 2017-054885 A filed on March 21, 2017 - According to the present invention, it is possible to provide the method for measuring the spectral radiation characteristics of the fluorescence whitened sample and the device for measuring the spectral radiation characteristics of the fluorescence whitened sample.
Claims (34)
- A method for measuring spectral radiation characteristics of a fluorescence whitened sample illuminated with a standard illumination light Id, the method comprising:
obtaining an approximation Bf(Id, λ) of a fluorescence spectral emissivity coefficient Bf(Id,λ) by the standard illumination light Id at following first to third steps from spectral power distributions R(Ik,λ) of sample radiation lights radiated from the fluorescence whitened sample when the fluorescence whitened sample is sequentially illuminated with a plurality of excitation lights Ik (k = 1 to n) having different spectral power distributions and a spectral power distribution Id(λ) of the standard illumination light Id, wherein the first to third steps are as follows:First step: Spectral power distributions Rf(Ik,λ) of fluorescence are obtained from the spectral power distributions R(Ik,λ) by respective excitation lights Ik;Second step: The spectral power distributions Rf(Ik,λ) of fluorescence by the respective excitation lights Ik are linearly combined with a given weighting coefficient Wk, and an approximation Rf(Id, λ) of a spectral power distribution Rf(Id,λ) of fluorescence by the standard illumination light Id is obtained by following equation (6):
[Math. 45] Third step: The approximation Bf(Id, λ) is obtained by following equation (7) from the approximation Rf(Id, λ) and the spectral power distribution Id(λ) of the standard illumination light Id
[Math. 46]
- The method for measuring the spectral radiation characteristics of the fluorescence whitened sample according to claim 1,
wherein the plurality of excitation lights Ik is monochromatic excitation lights. - The method for measuring the spectral radiation characteristics of the fluorescence whitened sample according to claim 2,
wherein the monochromatic excitation lights are monochromatic LED radiation lights. - The method for measuring the spectral radiation characteristics of the fluorescence whitened sample according to claim 1, comprising:setting a plurality of sets of weighting coefficients Wk corresponding to a plurality of standard illumination lights Id, respectively; andobtaining the approximation Rf(Id, λ) by applying a set of weighting coefficients Wk corresponding to each standard illumination light Id.
- The method for measuring the spectral radiation characteristics of the fluorescence whitened sample according to any one of claims 1 to 3,
wherein the plurality of excitation lights Ik includes a first type of excitation light Ik1 outside an overlapping range of a reflected light range and a fluorescence range, and a second type of excitation light Ik2 within the overlapping range,
at the first step, a spectral power distribution Rf(Ik1,λ) of fluorescence by the first type of excitation light Ik1 is obtained from a spectral power distribution R(Ik1,λ) of a sample radiation light by the first type of excitation light Ik1,
an approximation Rf(Ik2, λ) of at least a part of a spectral power distribution Rf(Ik2,λ) of fluorescence by the second type of excitation light Ik2 is estimated on the basis of the spectral power distribution R(Ik1,λ) of the sample radiation light by the first type of excitation light Ik1, and a remaining part is obtained from the spectral power distribution R(Ik2,λ) of the sample radiation light by the second type of excitation light Ik2. - The method for measuring the spectral radiation characteristics of the fluorescence whitened sample according to claim 5, comprising:
obtaining the approximation Rf(Ik2, λ) of at least a part of the spectral power distribution Rf(Ik2,λ) of fluorescence by the second type of excitation light Ik2 as the estimation at following fourth to sixth steps:Fourth step: A ratio K of powers of the sample radiation lights by the first and second types of excitation lights Ik1 and Ik2 at one or more reference wavelengths λr1 outside the overlapping range is obtained by following equation (22):
[Math. 47] Fifth step: A correction coefficient C(λ) reflecting that a fluorescence wavelength λ is longer than an excitation wavelength µ is obtained; andSixth step: The approximation Rf(Ik2, λ) is obtained by following equation (23) from the spectral power distribution R(Ik1,λ) of the sample radiation light by the first type of excitation light Ik1, the ratio K of the powers, and the correction coefficient C(λ)
[Math. 48]
- The method for measuring the spectral radiation characteristics of the fluorescence whitened sample according to claim 6,
wherein the spectral power distribution of the second type of excitation light Ik2 is obtained from Ik2(µ), and the correction coefficient C(λ) is obtained by following equation (24):
[Math. 49]
- The method for measuring the spectral radiation characteristics of the fluorescence whitened sample according to any one of claims 5 to 7, wherein the part includes the overlapping range.
- The method for measuring the spectral radiation characteristics of the fluorescence whitened sample according to any one of claims 1 to 8,
wherein powers of the plurality of excitation lights Ik (k = 1 to n) are proportional to the weighting coefficient Wk. - The method for measuring the spectral radiation characteristics of the fluorescence whitened sample according to claim 9,
wherein the powers of the plurality of excitation lights Ik (k = 1 to n) are controlled by an irradiation time. - The method for measuring the spectral radiation characteristics of the fluorescence whitened sample according to claim 9,
wherein two or more excitation lights Ik out of the plurality of excitation lights Ik (k = 1 to n) are simultaneously applied. - The method for measuring the spectral radiation characteristics of the fluorescence whitened sample according to any one of claims 1 to 8,
wherein the weighting coefficient Wk for setting the powers of the plurality of excitation lights Ik (k = 1 to n) is obtained on the basis of a spectral power distribution Ik(µ) of the excitation light Ik obtained at most recent measurement. - The method for measuring the spectral radiation characteristics of the fluorescence whitened sample according to claim 12,
wherein each of the plurality of excitation lights Ik (k = 1 to n) is a radiation light of a monochromatic LED driven at constant current, and
the spectral power distribution Ik(µ) of each of the plurality of excitation lights Ik is obtained on the basis of a forward voltage when driving the monochromatic LED and known correlation characteristics of forward voltage-spectral power distribution. - The method for measuring the spectral radiation characteristics of the fluorescence whitened sample according to any one of claims 1 to 13, comprising:
setting the weighting coefficient Wk such that a spectral power distribution Id(λ) of a synthetic excitation light Id obtained by linearly combining the spectral power distributions of the plurality of excitation lights Ik by following equation (12) approximates the spectral power distribution Id(λ) of the standard illumination light Id
[Math. 50]
- The method for measuring the spectral radiation characteristics of the fluorescence whitened sample according to any one of claims 1 to 13, comprising:setting the weighting coefficient Wk at following seventh and eighth steps fromthe spectral power distributions Ik(λ) of the plurality of excitation lights Ik,the spectral power distribution Id(λ) of the standard illumination light Id, anda plurality of different bispectral fluorescence emissivity coefficients FT(µ,λ) (T = 1 to N, µ represents an excitation wavelength and λ represents a fluorescence wavelength), wherein the seventh and eighth steps are as follows:Seventh step: Spectral power distributions Rf,T(Ik,λ) of fluorescence by the plurality of excitation lights Ik and a spectral power distribution Rf,T(Id,λ) of fluorescence by the standard illumination light Id are obtained by following equations (25) and (26) from the plurality of bispectral fluorescence emissivity coefficients FT(µ,λ), the spectral power distributions Ik(µ) of the plurality of excitation lights Ik, and a spectral power distribution Id(µ) of the standard illumination light Id
[Math. 51]
 Eighth step: The weighting coefficient Wk is set such that a spectral power distribution Rf,T(Id, λ) of synthetic fluorescence obtained by linearly combining the spectral power distributions Rf,T(Ik,λ) of fluorescence by the plurality of excitation lights Ik by following equation (27) approximates the spectral power distribution Rf,T(Id,λ) of fluorescence by the standard illumination light Id for all of the plurality of bispectral fluorescence emissivity coefficients FT(µ,λ)
[Math. 53]
- The method for measuring the spectral radiation characteristics of the fluorescence whitened sample according to any one of claims 1 to 13, comprising:setting the weighting coefficient Wk at following ninth and tenth steps fromthe spectral power distributions Ik(λ) of the plurality of excitation lights Ik,the spectral power distribution Id(λ) of the standard illumination light Id, anda plurality of different spectral quantum efficiencies FT(µ,λr2) (T = 1 to N, µ represents an excitation wavelength) for fluorescence at a reference wavelength of λr2, wherein the ninth and tenth steps are as follows:Ninth step: Fluorescence powers Rf,T(Ik,λr2) at the reference wavelength λr2 by the plurality of excitation lights Ik and fluorescence powers Rf,T(Id,λr2) at the reference wavelength λr2 by the standard illumination light Id are obtained by following equations (28) and (29) from the plurality of spectral quantum efficiencies FT(µ,λr2), the spectral power distributions Ik(µ) of the plurality of excitation lights Ik, and the spectral power distribution Id(µ) of the standard illumination light Id
[Math. 54]
 Tenth step: The weighting coefficient Wk is set such that a synthetic fluorescence power Rf,T(Id, λr2) obtained by linearly combining the fluorescence powers Rf,T(Ik,λr2) by following equation (30) approximates the fluorescence power Rf,T(Id,λr2) by the standard illumination light Id for all of the plurality of spectral quantum efficiencies FT(µ,λr2)
[Math. 56]
- The method for measuring the spectral radiation characteristics of the fluorescence whitened sample according to claim 14,
wherein a part of the set weighting coefficients Wk is reset by the method according to claim 15 or 16. - The method for measuring the spectral radiation characteristics of the fluorescence whitened sample according to claim 15 or 16,
wherein the bispectral fluorescence emissivity coefficients FT(µ,λ) of the fluorescence whitened sample to be measured are classified into a plurality of types, the plurality of different bispectral fluorescence emissivity coefficients being the plurality of types of bispectral fluorescence emissivity coefficients, or spectral quantum efficiencies FT(µ,λr2) for fluorescence at the reference wavelength λr2 of the fluorescence whitened sample to be measured are classified into a plurality of types, the plurality of different spectral quantum efficiencies being the plurality of types of spectral quantum efficiencies. - The method for measuring the spectral radiation characteristics of the fluorescence whitened sample according to any one of claims 1 to 18, comprising:obtaining an approximation Br(λ) of a spectral reflectivity coefficient Br(λ) from a spectral power distribution Ivis(λ) of a measuring range illumination light Ivis having a power in an entire measuring range, anda spectral power distribution Rr(Ivis,λ) of a sample reflected light by the measuring range illumination light Ivis, andobtaining an approximation Bt(Id, λ) of a total spectral emissivity coefficient Bt(Id,λ) by the standard illumination light Id by a sum of the approximation Br(λ) and the approximation Bf(Id, λ).
- The method for measuring the spectral radiation characteristics of the fluorescence whitened sample according to any one of claims 5, 8, and 9 to 18 depending from claim 8, comprising:obtaining a spectral reflectivity coefficient Br(λ) outside the overlapping range from a spectral power distribution Ivis1 (λ) of an illumination light Ivis1 outside the overlapping range having a power in the entire measuring range outside the overlapping range and a spectral power distribution Rr(Ivis1,λ) of a sample reflected light by the illumination light Ivis1 outside the overlapping range;providing an approximation Bt(Id, λ) of a total spectral emissivity coefficient outside the overlapping range by the standard illumination light Id by a sum of the spectral reflectivity coefficient Br(λ) and the approximation Bf(Id, λ); andobtaining the approximation Bt(Id, λ) of the total spectral emissivity coefficient of the overlapping range by the standard illumination light Id by a sum of a total spectral emissivity coefficient Bt(Id2,λ) of the overlapping range by the overlapping range illumination light Id2 obtained from a spectral power distribution Id2(λ) of an overlapping range illumination light Id2 having a spectral power distribution approximating the standard illumination light Id in the overlapping range and a spectral power distribution R(Id2,λ) of a sample radiation light by the overlapping range illumination light Id2,and a fluorescence spectral emissivity coefficient Bf(Id1,λ) by an excitation component Id1 other than an overlapping range component of the standard illumination light Id.
- The method for measuring the spectral radiation characteristics of the fluorescence whitened sample according to claim 20,
wherein the overlapping range illumination light Id2 having a spectral power distribution approximating the standard illumination light Id in the overlapping range is provided by weighted linear combination of a plurality of illumination lights. - The method for measuring the spectral radiation characteristics of the fluorescence whitened sample according to claim 21,
wherein at least one of the plurality of illumination lights is any of the plurality of excitation lights Ik. - The method for measuring the spectral radiation characteristics of the fluorescence whitened sample according to claim 20,
wherein the Bf(Id1,λ) being a component not by the overlapping range illumination light Id2 of the approximation Bf(Id, λ) is obtained at following eleventh and twelfth steps:Eleventh step: A power coefficient A is obtained by following equation (21) from a total spectral emissivity coefficient Bt(Id2,λr3) by the overlapping range illumination light Id2 at one or more reference wavelengths λr3 not affected by a reflected light of the overlapping range illumination light Id2, and an approximation Bf(Id, λr3) of a fluorescence emissivity coefficient by the standard illumination light Id
[Math. 57] Twelfth step: The Bf(Id1,λ) is obtained by following equation (35) from the approximation Bf(Id, λ) of the fluorescence spectral emissivity coefficient by the standard illumination light Id, and the power coefficient A
[Math. 58]
- The method for measuring the spectral radiation characteristics of the fluorescence whitened sample according to claim 19, comprising:
obtaining the spectral power distribution Rr(Ivis,λ) of the sample reflected light by subtracting a spectral power distribution Rf(Ivis,λ) of fluorescence by the measuring range illumination light Ivis from a spectral power distribution R(Ivis,λ) of a sample radiation light by the measuring range illumination light Ivis. - The method of measuring the spectral radiation characteristics of the fluorescence whitened sample according to claim 24,
wherein the measuring range illumination light Ivis is formed of a first measuring range illumination light Ivis1 not including an excitation range and a second measuring range illumination light Ivis2 including the excitation range, and
the approximation Br(λ) of the spectral reflectivity coefficient Br(λ) of the fluorescence whitened sample is obtained by following thirteenth to sixteenth steps from
a spectral power distribution Ivis1(λ) of the first measuring range illumination light Ivis1 and a spectral power distribution R(Ivis1,λ) of the sample radiation light by the first measuring range illumination light, and
a spectral power distribution Ivis2(λ) of the second measuring range illumination light Ivis2 and a spectral power distribution R(Ivis2,λ) of the sample radiation light by the second measuring range illumination light, wherein the thirteenth to sixteenth steps are as follows:Thirteenth step: The spectral power distribution Ivis(λ) of the measuring range illumination light Ivis is provided by a sum of the spectral power distributions Ivis1 (λ) and Ivis2(λ) of the first and second measuring range illumination lights;Fourteenth step: The spectral power distribution R(Ivis,λ) of the sample radiation light by the measuring range illumination light Ivis is provided by a sum of R(Ivis1,λ) and R(Ivis2,λ) by the first and second measuring range illumination lights;Fifteenth step: A spectral power distribution Rf(Ivis2,λ) of fluorescence by the second measuring range illumination light Ivis2 is obtained; andSixteenth step: The approximation Br(λ) is obtained by following equation (31) while setting the Rf(Ivis2,λ) as Rf(Ivis,λ)
[Math. 59]
- The method for measuring the spectral radiation characteristics of the fluorescence whitened sample according to claim 25 not depending from claim 5, comprising:
obtaining the spectral power distribution Rf(Ivis2,λ) of fluorescence by the second measuring range illumination light at following seventeenth to twentieth steps from the spectral power distribution Ivis2(λ) of the second measuring range illumination light, the spectral power distribution R(Ivis2,λ) of the sample radiation light by the second measuring range illumination light, the spectral power distribution Ik1(λ) of the first type of excitation light outside the overlapping range of the reflected light range and the fluorescence range, and the spectral power distribution R(Ik1,λ) of the sample radiation light by the first type of excitation light, wherein the seventeenth to twentieth steps are as follows:Seventeenth step: A component outside the overlapping range of the spectral power distribution Rf(Ivis2,λ) of fluorescence by the second measuring range illumination light is obtained from the spectral power distribution R(Ivis2,λ) of the sample radiation light by the second measuring range illumination light;Eighteenth step: A ratio K between a spectral power distribution R(Ik1, λr4) of the sample radiation light by the first type of excitation light and a spectral power distribution R(Ivis2,λr4) of the sample radiation light by the second measuring range illumination light at one or more reference wavelengths λr4 outside the overlapping range is obtained by following equation (32);
[Math. 60] Nineteenth step: A correction coefficient C(λ) reflecting that the fluorescence wavelength λ is longer than the excitation wavelength µ is obtained; andTwentieth step: An approximation Rf(Ivis2, λ) of a component in the overlapping range of the spectral power distribution Rf(Ivis2,λ) of fluorescence by the second measuring range illumination light is obtained by following equation (33) from the spectral power distribution R(Ik1,λ) of the sample radiation light by the first type of excitation light, the power ratio K, and the correction coefficient C(λ)
[Math. 61]
- The method for measuring the spectral radiation characteristics of the fluorescence whitened sample according to claim 26,
wherein the correction coefficient C(λ) is obtained from the spectral power distribution Ivis2(λ) of the second measuring range illumination light by following equation (34):
[Math. 62]
- A device for measuring a spectral radiation characteristics of a fluorescence whitened sample, comprising
a plurality of excitation light illuminating units for illuminating the fluorescence whitened sample with a plurality of excitation lights Ik (k = 1 to n) having different spectral power distributions;
a sample radiation light spectroscopic unit for measuring spectral power distributions R(Ik,λ) of sample radiation lights being radiation lights radiated from the fluorescence whitened sample illuminated by the excitation lights Ik; and
a control arithmetic unit,
wherein the control arithmetic unit sequentially lights up the plurality of excitation light illuminating units to allow the sample radiation light spectroscopic unit to measure the spectral power distributions R(Ik,λ) of the sample radiation lights,
obtains spectral power distributions Rf(Ik,λ) of fluorescence from the spectral power distributions R(Ik,λ) of the sample radiation lights,
obtains an approximation Rf(Id, λ) of a spectral power distribution Rf(Id,λ) of fluorescence by a standard illumination light Id by using the spectral power distributions Rf(Ik,λ) of fluorescence and a given weighting coefficient Wk by following equation (6):
[Math. 63]
obtains an approximation Bf(Id, λ) of a fluorescence spectral emissivity coefficient Bf(Id,λ) by the standard illumination light Id from the approximation Rf(Id, λ) and a known spectral power distribution Id(λ) of the standard illumination light Id by following equation (7):
[Math. 64]
- The device for measuring the spectral radiation characteristics of the fluorescence whitened sample according to claim 28,
wherein each of the plurality of excitation lights Ik is a radiation light of a monochromatic LED. - The device for measuring the spectral radiation characteristics of the fluorescence whitened sample according to claim 28 or 29, further comprising:an excitation light spectroscopic unit,wherein the control arithmetic unit allows the excitation light spectroscopic unit to measure the spectral power distributions Ik(λ) of the excitation lights Ik, and obtains the weighting coefficient Wk on the basis of the spectral power distributions Ik(λ).
- The device for measuring the spectral radiation characteristics of the fluorescence whitened sample according to claim 29, further comprising:a driving unit which drives the monochromatic LED at a constant current; anda forward voltage measuring unit which measures a forward voltage of the monochromatic LED at the time of driving,wherein the control arithmetic unit estimates the spectral power distributions Ik(λ) of the excitation lights Ik on the basis of the forward voltage measured by the forward voltage measuring unit, andobtains the weighting coefficient Wk on the basis of the estimated spectral power distributions Ik(λ).
- The device for measuring the spectral radiation characteristics of the fluorescence whitened sample according to any one of claims 29 to 31, further comprising:a measuring range illuminating unit which illuminates the fluorescence whitened sample with a measuring range illumination light Ivis having a power in an entire measuring range,wherein the control arithmetic unit lights up the measuring range illuminating unit to allow the sample reflected light spectroscopic unit to measure a spectral power distribution Rr(Ivis,λ) of a sample radiation light by the measuring range illumination light,obtains an approximation Br(λ) of a spectral reflectivity coefficient Br(λ) from a spectral power distribution Ivis(λ) of the measuring range illumination light andthe spectral power distribution Rr(Ivis,λ) of the sample reflected light, andobtains an approximation Bt(Id, λ) of a total spectral emissivity coefficient Bt(Id,λ) by the standard illumination light by a sum of the approximation Br(λ) and the approximation Bf(Id, λ) of the fluorescence spectral emissivity coefficient Bf(Id,λ) by the standard illumination light.
- The device for measuring the spectral radiation characteristics of the fluorescence whitened sample according to claim 32,
wherein the measuring range illuminating unit includes a blue-excited white LED and one or more monochromatic LEDs having a power in a measuring range where the blue-excited white LED does not have power, and the measuring range illumination light Ivis is formed of a radiation light of the blue-excited white LED and a radiation light of the one or more monochromatic LEDs. - The device for measuring the spectral radiation characteristics of the fluorescence whitened sample according to claim 32,
wherein the measuring range illuminating unit includes a white light source, a fluorescence excitation wavelength band cut filter, and one or more monochromatic LEDs having a power in a fluorescence excitation light wavelength band, and the measuring range illumination light Ivis is formed of a radiation light of the white light source passing through the fluorescence excitation wavelength band cut filter and a radiation light of the one or more monochromatic LEDs.
Applications Claiming Priority (2)
| Application Number | Priority Date | Filing Date | Title |
|---|---|---|---|
| JP2017054885 | 2017-03-21 | ||
| PCT/JP2018/007824 WO2018173680A1 (en) | 2017-03-21 | 2018-03-01 | Method for measuring spectral radiation characteristics of fluorescence whitened sample, and device for measuring spectral radiation characteristics of fluorescence whitened sample |
Publications (2)
| Publication Number | Publication Date |
|---|---|
| EP3605066A1 true EP3605066A1 (en) | 2020-02-05 |
| EP3605066A4 EP3605066A4 (en) | 2020-03-18 |
Family
ID=63585432
Family Applications (1)
| Application Number | Title | Priority Date | Filing Date |
|---|---|---|---|
| EP18770285.7A Pending EP3605066A4 (en) | 2017-03-21 | 2018-03-01 | METHOD FOR MEASURING SPECTRAL RADIATION CHARACTERISTICS OF A WHITE FLUORESCENCE SAMPLE AND DEVICE FOR MEASURING SPECTRAL RADIATION CHARACTERISTICS OF A WHITE FLUORESCENCE SAMPLE |
Country Status (4)
| Country | Link |
|---|---|
| US (1) | US11428631B2 (en) |
| EP (1) | EP3605066A4 (en) |
| JP (1) | JP6984651B2 (en) |
| WO (1) | WO2018173680A1 (en) |
Families Citing this family (2)
| Publication number | Priority date | Publication date | Assignee | Title |
|---|---|---|---|---|
| EP4127678B1 (en) * | 2020-03-26 | 2025-03-19 | Innovative Photonic Solutions, Inc. | Method for selection of raman excitation wavelengths in multi-source raman probe |
| US12055641B2 (en) * | 2020-10-01 | 2024-08-06 | Woods Hole Oceanographic Institution | Methods and apparatus for direct calibration |
Family Cites Families (10)
| Publication number | Priority date | Publication date | Assignee | Title |
|---|---|---|---|---|
| JPH0650817A (en) * | 1992-07-29 | 1994-02-25 | Minolta Camera Co Ltd | Measuring device for optical characteristic of sample |
| JP3346095B2 (en) | 1995-05-17 | 2002-11-18 | ミノルタ株式会社 | Spectrophotometer |
| JPH11118603A (en) * | 1997-10-15 | 1999-04-30 | Minolta Co Ltd | Spectral characteristic measuring apparatus of fluorescent specimen and its measuring method |
| JP4061765B2 (en) | 1999-02-09 | 2008-03-19 | コニカミノルタセンシング株式会社 | Apparatus for measuring spectral characteristics of fluorescent sample and measuring method thereof |
| EP1507134B1 (en) | 2003-07-23 | 2007-06-13 | Gretag-Macbeth AG | Spectrophotometer and measuring head therefor |
| JP4660691B2 (en) | 2005-04-08 | 2011-03-30 | コニカミノルタセンシング株式会社 | Optical property measuring method of fluorescent sample and optical property measuring apparatus using the same |
| JP2008145225A (en) * | 2006-12-08 | 2008-06-26 | Konica Minolta Sensing Inc | Optical characteristic measurement method and optical characteristic measuring device |
| JP5239442B2 (en) | 2008-03-25 | 2013-07-17 | コニカミノルタオプティクス株式会社 | Method and apparatus for measuring optical properties of fluorescent sample |
| JP2010281808A (en) | 2009-05-01 | 2010-12-16 | Konica Minolta Sensing Inc | Illumination apparatus and reflective characteristic measuring apparatus employing the same |
| JP2017054885A (en) | 2015-09-08 | 2017-03-16 | トヨタ自動車株式会社 | Semiconductor device |
-
2018
- 2018-03-01 JP JP2019507487A patent/JP6984651B2/en active Active
- 2018-03-01 US US16/492,845 patent/US11428631B2/en active Active
- 2018-03-01 EP EP18770285.7A patent/EP3605066A4/en active Pending
- 2018-03-01 WO PCT/JP2018/007824 patent/WO2018173680A1/en not_active Ceased
Also Published As
| Publication number | Publication date |
|---|---|
| WO2018173680A1 (en) | 2018-09-27 |
| US20210140884A1 (en) | 2021-05-13 |
| EP3605066A4 (en) | 2020-03-18 |
| US11428631B2 (en) | 2022-08-30 |
| JPWO2018173680A1 (en) | 2020-01-23 |
| JP6984651B2 (en) | 2021-12-22 |
Similar Documents
| Publication | Publication Date | Title |
|---|---|---|
| JP5233529B2 (en) | Spectral characteristic measuring apparatus, calibration method thereof, and spectral characteristic measuring system | |
| US8288739B2 (en) | Method and apparatus for measuring optical property of fluorescent sample | |
| US7675620B2 (en) | Optical property measuring method and optical property measuring apparatus | |
| JP3555400B2 (en) | Reflection characteristic measuring device | |
| TW201224430A (en) | Reflectivity measuring device, reflectivity measuring method, membrane thickness measuring device, and membrane thickness measuring method | |
| JP5534046B2 (en) | SPECTRUM CHARACTERISTIC MEASURING DEVICE, SPECTRICAL CHARACTERISTIC MEASURING DEVICE CORRECTION METHOD, AND PROGRAM | |
| JP4660691B2 (en) | Optical property measuring method of fluorescent sample and optical property measuring apparatus using the same | |
| US20190387133A1 (en) | Image processing apparatus, method and storage medium | |
| EP3605066A1 (en) | Method for measuring spectral radiation characteristics of fluorescence whitened sample, and device for measuring spectral radiation characteristics of fluorescence whitened sample | |
| CN102680097A (en) | Spectral characteristic measurement method and spectral characteristic measurement apparatus | |
| EP1960749B1 (en) | Apparatus and method for illuminator-independent color measurements | |
| US8481973B2 (en) | Fluorescent estimating apparatus, fluorescent estimating method, and fluorescent measuring apparatus | |
| JP4483496B2 (en) | Spectral reflectance prediction apparatus and spectral reflectance prediction method | |
| EP4286808A1 (en) | Colorimeter and chromaticity measurement method | |
| JPWO2016181746A1 (en) | Spectral colorimetry apparatus and spectral reflectance calculation method | |
| US10839271B2 (en) | Image processing apparatus, method and storage medium | |
| JP5585722B2 (en) | Reflection characteristic measuring device | |
| JP2022054350A (en) | Array waveguide diffraction grating, broadband light source device, and spectroscopic measurement device | |
| JP4799628B2 (en) | Skin transparency evaluation device | |
| JP4617436B2 (en) | Optical property measuring method of fluorescent sample and optical property measuring apparatus using the same | |
| US20250334396A1 (en) | Light irradiation device, measurement device, observation device, and film thickness measurement device | |
| WO2025028033A1 (en) | Light source device and light measurement device | |
| JPH10300583A (en) | Meter and method for spectrophotometric colorimetery | |
| JPWO2016181750A1 (en) | Spectral colorimetry apparatus and conversion rule setting method | |
| JP2013088292A (en) | Measuring instrument and measuring method |
Legal Events
| Date | Code | Title | Description |
|---|---|---|---|
| STAA | Information on the status of an ep patent application or granted ep patent |
Free format text: STATUS: THE INTERNATIONAL PUBLICATION HAS BEEN MADE |
|
| PUAI | Public reference made under article 153(3) epc to a published international application that has entered the european phase |
Free format text: ORIGINAL CODE: 0009012 |
|
| STAA | Information on the status of an ep patent application or granted ep patent |
Free format text: STATUS: REQUEST FOR EXAMINATION WAS MADE |
|
| 17P | Request for examination filed |
Effective date: 20191016 |
|
| AK | Designated contracting states |
Kind code of ref document: A1 Designated state(s): AL AT BE BG CH CY CZ DE DK EE ES FI FR GB GR HR HU IE IS IT LI LT LU LV MC MK MT NL NO PL PT RO RS SE SI SK SM TR |
|
| AX | Request for extension of the european patent |
Extension state: BA ME |
|
| A4 | Supplementary search report drawn up and despatched |
Effective date: 20200219 |
|
| RIC1 | Information provided on ipc code assigned before grant |
Ipc: G01N 33/34 20060101ALI20200213BHEP Ipc: G01N 21/25 20060101ALI20200213BHEP Ipc: G01J 3/443 20060101ALI20200213BHEP Ipc: G01N 21/64 20060101AFI20200213BHEP Ipc: G01J 3/46 20060101ALI20200213BHEP Ipc: G01N 21/27 20060101ALI20200213BHEP |
|
| DAV | Request for validation of the european patent (deleted) | ||
| DAX | Request for extension of the european patent (deleted) | ||
| STAA | Information on the status of an ep patent application or granted ep patent |
Free format text: STATUS: EXAMINATION IS IN PROGRESS |
|
| 17Q | First examination report despatched |
Effective date: 20220901 |
|
| P01 | Opt-out of the competence of the unified patent court (upc) registered |
Effective date: 20230510 |