EP3568080B1 - Système et procédé de cartographie de confiance d'imagerie par ondes de cisaillement - Google Patents
Système et procédé de cartographie de confiance d'imagerie par ondes de cisaillement Download PDFInfo
- Publication number
- EP3568080B1 EP3568080B1 EP18707847.2A EP18707847A EP3568080B1 EP 3568080 B1 EP3568080 B1 EP 3568080B1 EP 18707847 A EP18707847 A EP 18707847A EP 3568080 B1 EP3568080 B1 EP 3568080B1
- Authority
- EP
- European Patent Office
- Prior art keywords
- confidence
- values
- image
- shear wave
- ultrasound
- Prior art date
- Legal status (The legal status is an assumption and is not a legal conclusion. Google has not performed a legal analysis and makes no representation as to the accuracy of the status listed.)
- Active
Links
- 238000003384 imaging method Methods 0.000 title claims description 43
- 238000000034 method Methods 0.000 title claims description 32
- 238000013507 mapping Methods 0.000 title 1
- 238000002604 ultrasonography Methods 0.000 claims description 86
- 238000012285 ultrasound imaging Methods 0.000 claims description 38
- 239000000523 sample Substances 0.000 claims description 15
- 238000006073 displacement reaction Methods 0.000 claims description 10
- 230000033001 locomotion Effects 0.000 claims description 10
- 238000001514 detection method Methods 0.000 claims description 6
- 239000003086 colorant Substances 0.000 claims description 5
- 238000002592 echocardiography Methods 0.000 claims description 4
- 210000001519 tissue Anatomy 0.000 description 104
- 238000005259 measurement Methods 0.000 description 19
- 210000000232 gallbladder Anatomy 0.000 description 8
- 238000003745 diagnosis Methods 0.000 description 6
- 210000004185 liver Anatomy 0.000 description 6
- 238000012545 processing Methods 0.000 description 5
- 238000003491 array Methods 0.000 description 4
- 230000008901 benefit Effects 0.000 description 4
- 230000005540 biological transmission Effects 0.000 description 4
- 238000012544 monitoring process Methods 0.000 description 4
- 230000008569 process Effects 0.000 description 4
- 210000003484 anatomy Anatomy 0.000 description 3
- 238000004364 calculation method Methods 0.000 description 3
- 238000001914 filtration Methods 0.000 description 3
- 239000012530 fluid Substances 0.000 description 3
- 210000005228 liver tissue Anatomy 0.000 description 3
- 230000009467 reduction Effects 0.000 description 3
- 238000004458 analytical method Methods 0.000 description 2
- 238000001574 biopsy Methods 0.000 description 2
- 210000004204 blood vessel Anatomy 0.000 description 2
- 238000012512 characterization method Methods 0.000 description 2
- 238000013329 compounding Methods 0.000 description 2
- 238000002059 diagnostic imaging Methods 0.000 description 2
- 238000010586 diagram Methods 0.000 description 2
- 201000010099 disease Diseases 0.000 description 2
- 208000037265 diseases, disorders, signs and symptoms Diseases 0.000 description 2
- 230000008030 elimination Effects 0.000 description 2
- 238000003379 elimination reaction Methods 0.000 description 2
- 238000000926 separation method Methods 0.000 description 2
- 238000002099 shear wave elastography Methods 0.000 description 2
- 206010016654 Fibrosis Diseases 0.000 description 1
- 239000008280 blood Substances 0.000 description 1
- 210000004369 blood Anatomy 0.000 description 1
- 230000017531 blood circulation Effects 0.000 description 1
- 210000000481 breast Anatomy 0.000 description 1
- 230000003139 buffering effect Effects 0.000 description 1
- 230000000747 cardiac effect Effects 0.000 description 1
- 230000008859 change Effects 0.000 description 1
- 230000007882 cirrhosis Effects 0.000 description 1
- 208000019425 cirrhosis of liver Diseases 0.000 description 1
- 230000001419 dependent effect Effects 0.000 description 1
- 230000000881 depressing effect Effects 0.000 description 1
- 210000004177 elastic tissue Anatomy 0.000 description 1
- 230000002440 hepatic effect Effects 0.000 description 1
- 208000019423 liver disease Diseases 0.000 description 1
- 210000004072 lung Anatomy 0.000 description 1
- 230000000873 masking effect Effects 0.000 description 1
- 238000012986 modification Methods 0.000 description 1
- 230000004048 modification Effects 0.000 description 1
- 238000005457 optimization Methods 0.000 description 1
- 230000002611 ovarian Effects 0.000 description 1
- 210000002307 prostate Anatomy 0.000 description 1
- 230000029058 respiratory gaseous exchange Effects 0.000 description 1
- 230000003393 splenic effect Effects 0.000 description 1
- 230000002381 testicular Effects 0.000 description 1
- 210000001685 thyroid gland Anatomy 0.000 description 1
- 238000012546 transfer Methods 0.000 description 1
- 230000002792 vascular Effects 0.000 description 1
- 238000012800 visualization Methods 0.000 description 1
Images


Classifications
-
- A—HUMAN NECESSITIES
- A61—MEDICAL OR VETERINARY SCIENCE; HYGIENE
- A61B—DIAGNOSIS; SURGERY; IDENTIFICATION
- A61B8/00—Diagnosis using ultrasonic, sonic or infrasonic waves
- A61B8/08—Detecting organic movements or changes, e.g. tumours, cysts, swellings
- A61B8/0833—Detecting organic movements or changes, e.g. tumours, cysts, swellings involving detecting or locating foreign bodies or organic structures
- A61B8/085—Detecting organic movements or changes, e.g. tumours, cysts, swellings involving detecting or locating foreign bodies or organic structures for locating body or organic structures, e.g. tumours, calculi, blood vessels, nodules
-
- A—HUMAN NECESSITIES
- A61—MEDICAL OR VETERINARY SCIENCE; HYGIENE
- A61B—DIAGNOSIS; SURGERY; IDENTIFICATION
- A61B8/00—Diagnosis using ultrasonic, sonic or infrasonic waves
- A61B8/08—Detecting organic movements or changes, e.g. tumours, cysts, swellings
- A61B8/0858—Detecting organic movements or changes, e.g. tumours, cysts, swellings involving measuring tissue layers, e.g. skin, interfaces
-
- A—HUMAN NECESSITIES
- A61—MEDICAL OR VETERINARY SCIENCE; HYGIENE
- A61B—DIAGNOSIS; SURGERY; IDENTIFICATION
- A61B8/00—Diagnosis using ultrasonic, sonic or infrasonic waves
- A61B8/13—Tomography
- A61B8/14—Echo-tomography
-
- A—HUMAN NECESSITIES
- A61—MEDICAL OR VETERINARY SCIENCE; HYGIENE
- A61B—DIAGNOSIS; SURGERY; IDENTIFICATION
- A61B8/00—Diagnosis using ultrasonic, sonic or infrasonic waves
- A61B8/46—Ultrasonic, sonic or infrasonic diagnostic devices with special arrangements for interfacing with the operator or the patient
- A61B8/461—Displaying means of special interest
- A61B8/463—Displaying means of special interest characterised by displaying multiple images or images and diagnostic data on one display
-
- A—HUMAN NECESSITIES
- A61—MEDICAL OR VETERINARY SCIENCE; HYGIENE
- A61B—DIAGNOSIS; SURGERY; IDENTIFICATION
- A61B8/00—Diagnosis using ultrasonic, sonic or infrasonic waves
- A61B8/48—Diagnostic techniques
- A61B8/483—Diagnostic techniques involving the acquisition of a 3D volume of data
-
- A—HUMAN NECESSITIES
- A61—MEDICAL OR VETERINARY SCIENCE; HYGIENE
- A61B—DIAGNOSIS; SURGERY; IDENTIFICATION
- A61B8/00—Diagnosis using ultrasonic, sonic or infrasonic waves
- A61B8/48—Diagnostic techniques
- A61B8/485—Diagnostic techniques involving measuring strain or elastic properties
-
- A—HUMAN NECESSITIES
- A61—MEDICAL OR VETERINARY SCIENCE; HYGIENE
- A61B—DIAGNOSIS; SURGERY; IDENTIFICATION
- A61B8/00—Diagnosis using ultrasonic, sonic or infrasonic waves
- A61B8/52—Devices using data or image processing specially adapted for diagnosis using ultrasonic, sonic or infrasonic waves
- A61B8/5207—Devices using data or image processing specially adapted for diagnosis using ultrasonic, sonic or infrasonic waves involving processing of raw data to produce diagnostic data, e.g. for generating an image
-
- A—HUMAN NECESSITIES
- A61—MEDICAL OR VETERINARY SCIENCE; HYGIENE
- A61B—DIAGNOSIS; SURGERY; IDENTIFICATION
- A61B8/00—Diagnosis using ultrasonic, sonic or infrasonic waves
- A61B8/52—Devices using data or image processing specially adapted for diagnosis using ultrasonic, sonic or infrasonic waves
- A61B8/5215—Devices using data or image processing specially adapted for diagnosis using ultrasonic, sonic or infrasonic waves involving processing of medical diagnostic data
- A61B8/5238—Devices using data or image processing specially adapted for diagnosis using ultrasonic, sonic or infrasonic waves involving processing of medical diagnostic data for combining image data of patient, e.g. merging several images from different acquisition modes into one image
- A61B8/5246—Devices using data or image processing specially adapted for diagnosis using ultrasonic, sonic or infrasonic waves involving processing of medical diagnostic data for combining image data of patient, e.g. merging several images from different acquisition modes into one image combining images from the same or different imaging techniques, e.g. color Doppler and B-mode
- A61B8/5253—Devices using data or image processing specially adapted for diagnosis using ultrasonic, sonic or infrasonic waves involving processing of medical diagnostic data for combining image data of patient, e.g. merging several images from different acquisition modes into one image combining images from the same or different imaging techniques, e.g. color Doppler and B-mode combining overlapping images, e.g. spatial compounding
-
- A—HUMAN NECESSITIES
- A61—MEDICAL OR VETERINARY SCIENCE; HYGIENE
- A61B—DIAGNOSIS; SURGERY; IDENTIFICATION
- A61B8/00—Diagnosis using ultrasonic, sonic or infrasonic waves
- A61B8/52—Devices using data or image processing specially adapted for diagnosis using ultrasonic, sonic or infrasonic waves
- A61B8/5269—Devices using data or image processing specially adapted for diagnosis using ultrasonic, sonic or infrasonic waves involving detection or reduction of artifacts
- A61B8/5276—Devices using data or image processing specially adapted for diagnosis using ultrasonic, sonic or infrasonic waves involving detection or reduction of artifacts due to motion
Definitions
- Shear wave imaging is a technique for measuring tissue stiffness.
- an initial ultrasound pulse referred to as a push pulse
- the tissue may respond to the force of the push pulse by deforming. This deformation may propagate through the tissue as one or more waves, referred to as shear waves.
- the propagation of the shear wave or waves through the tissue is monitored by additional ultrasound pulses, referred to as tracking pulses.
- Other methods of shear wave imaging may also be used.
- the tissue may be deformed by using external vibration, such as by physically depressing the tissue, and rapidly acquiring images of the surrounding tissue. The images are then analyzed to detect and monitor the resulting shear wave or waves.
- a stiffness value of the tissue is calculated.
- An example of a stiffness value is the elastic modulus (E), typically measured in kPa.
- E the elastic modulus
- Other methods of calculating a stiffness value of the tissue may be used. For example, the shear wave propagation velocity alone may be used as a measure of tissue stiffness.
- Tissue stiffness measurements may be useful in disease diagnosis and/or monitoring. For example, in cirrhosis of the liver, diseased liver tissue has a higher stiffness than healthy liver tissue. Accordingly, shear wave imaging may be used to diagnose or monitor liver disease. This may allow for improved diagnosis, monitoring and/or a reduction in the number of biopsies required. Similarly, shear wave imaging may be used to diagnose or monitor other diseases.
- Shear wave imaging is still a relatively new technique. Many ultrasound technicians and/or clinicians may be unfamiliar with how to acquire reliable shear wave measurements and/or how to interpret shear wave measurement results. Furthermore, in some areas of the world (e.g., developing countries), there is a shortage of skilled ultrasound technicians to assist clinicians in acquiring and interpreting ultrasound images such as ultrasound images that include shear wave data. Thus, there is a need for tools that can assist ultrasound technicians and clinicians in utilizing shear wave imaging, which may improve patient care.
- US 2015/164480 A1 discloses an ultrasonic diagnosis apparatus in which a transmission unit causes an ultrasonic probe to transmit a displacement-producing ultrasonic wave and a displacement-observing ultrasonic wave, and in which a reception unit generates reflected-wave data based on a reflected wave received by the probe.
- the apparatus includes a generator that calculates displacement at each of a plurality of positions in the scan area over a plurality of time phases, based on the reflected-wave data, determines a time phase when the calculated displacement is substantially maximum, for each of the positions, and generates image data representing positions where the determined time phases are substantially the same as each other, among the positions. Finally, an image based on the image data is superimposed on a medical image corresponding to an area including the scan area.
- US 2013/218011 A1 relates to a technique for visualization of associated information in ultrasound shear wave imaging, such that more information than just a shear wave image can be provided for diagnosis.
- the associated information that is displayed relates to shear calculation, such as the quality or variables used to determine shear. This additional information assists the user in determining whether the shear information can be trusted to indicate tissue characteristics or whether the shear calculation is unreliable.
- WO 2016/067072 A1 it is there disclosed a method for performing shear wave elastography imaging of an observation field in a medium, comprising a plurality of shear wave imaging steps to acquire a plurality of sets of shear wave propagation parameters. Then the method determines a reliability indicator of the shear wave elastography imaging of the observation field.
- an ultrasound imaging system according to claim 1 is provided.
- a method according to claim 11 is provided.
- an ultrasound technician may recognize poor image quality or artifacts and know when to attempt to reacquire an image.
- the experienced ultrasound technician may also know not to collect measurements in a certain area to avoid unreliable data.
- an inexperienced user may not recognize poor image quality or areas where data is unreliable. This may lead to the inexperienced user to acquiring images of poor diagnostic value or collecting misleading measurements.
- an ultrasound imaging system may provide graphical representations of data and/or graphical representations of confidence in the data to assist users in recognizing when imaging may need to be repeated and/or where reliable measurements can be acquired.
- FIG. 1 shows an example screen shot 100 of ultrasound images 105, 110 of a liver that includes shear wave data, which may be generated and displayed by an ultrasound imaging system according to the present disclosure.
- Ultrasound images generated by systems according to the present disclosure may display tissue stiffness values, for example as discrete values at any given (e.g., user selected) location in the imaged region or as a color-coded map over a user-selected region of interest (ROI) within the imaged region.
- ROI region of interest
- ultrasound image 105 includes two pointers A and B.
- the pointers A, B may have been placed on the respective image responsive to input by a user, such as an ultrasound technician or a clinician.
- the ultrasound imaging system may be configured to calculate tissue stiffness values and may provide an indication of the tissue stiffness values (e.g., in the form of a color map, or by displaying discrete values) on a display (e.g., as an overlay or adjacent to a grayscale (i.e., B-mode) ultrasound image).
- tissue stiffness values in kPa
- the indication may be provided differently (e.g., by annotating the value next to each selected location corresponding to pointers A, B).
- the tissue at the location of pointer A has a stiffness value of 5.10kPa and the tissue at the location of pointer B has a stiffness value of 2.78kPa.
- the stiffness values may be calculated from shear wave data acquired by an ultrasound imaging system according to the present disclosure.
- the ultrasound imaging system may be configured to generate ultrasound images which include an indication of the reliability of the stiffness values (e.g., discrete or overlaid as a color coded map on the image).
- the indication of the reliability may be provided in the form of a confidence map (not shown in FIG. 1 but described in further detail below).
- the ultrasound image 110 includes a graphical overlay 120 of tissue stiffness values, in the form of a color map, which are calculated based on the shear wave data.
- tissue stiffness values may be represented by different colors and/or different grayscale values.
- low stiffness values may be represented by blue pixels while high stiffness values may be represented as orange or red pixels.
- the color-coded map representing the tissue stiffness values for the ROI may be associated with a color scale bar 125, which is displayed with the image for interpreting the color-coded map.
- the graphical overlay of stiffness values may provide the user with a qualitative overview of tissue stiffness over a large area.
- the pointers A and B may provide the user with quantitative stiffness values at specific points.
- a measure of confidence e.g., an indication of the reliability
- the user is left to independently decide whether or not a quality image and/or reliable measurement has been obtained.
- An experienced ultrasound user may notice that pointer A is positioned on liver tissue, but pointer B is positioned over the gall bladder.
- the gall bladder is an inappropriate location to measure tissue stiffness because shear waves may not propagate through the fluid of the gall bladder as they do through tissue.
- an inexperienced user may mistake the gall bladder as a suspicious area in the liver or may not know stiffness values at the gall bladder are unreliable.
- Neither the ultrasound images 105, 110 nor the graphical overlay 120 of stiffness values provides feedback to the inexperienced user as to which locations in the image include reliable tissue stiffness measurements.
- an ultrasound system may analyze acquired ultrasound images and/or shear wave data to determine the quality of the image and/or reliability of the shear wave data.
- the ultrasound system may provide an indication of the reliability of the displayed image data and/or information to guide the user in reacquiring an image, which may enable the acquisition of better images and more accurate measurements for patient diagnosis and/or monitoring.
- an ultrasound system may provide a graphical overlay on an ultrasound image that indicates confidence values for tissue stiffness values calculated from shear wave data.
- the confidence values may be presented to the user in a similar format as the calculated tissue stiffness values.
- the display may be configured to provide the discrete confidence value associated with any discrete tissue stiffness value on the image.
- the confidence values may be provided as a graphical overlay (e.g., a color map) which may be overlaid onto the anatomy image (e.g., a B-mode image, image reconstructed from shear wave measurements). This graphical overlay of confidence values may be referred to as a confidence map.
- the confidence map may allow a user to easily perceive where tissue stiffness values are most reliable and to take measurements in those areas or reacquire the image if measurements need to be obtained in areas indicated as having unreliable tissue stiffness characterization in the present image.
- the display may be configured to display a single image, which may include a color-map of either the tissue stiffness values as shown on the right-hand side image 110 of FIG. 1 or representative of the confidence values, as shown in other figures.
- two images, one including the color-map of the stiffness values and one image including the color map of the confidence values are displayed side by side.
- the confidence values may be used to filter out the tissue characterization data to exclude from displaying tissue stiffness that is below a minimum reliability measure.
- the confidence map may be used to mask portions of the tissue stiffness values graphical overlay (e.g., exclude those portions of the tissue stiffness map from being displayed) where confidence in the tissue stiffness values is below a certain threshold value (e.g., 60%).
- the threshold confidence value may be pre-programmed in the ultrasound system or set by the user.
- the confidence map masking may guide the user to regions with more reliable tissue stiffness values and/or prevent a user from viewing tissue stiffness values in regions where the confidence value is below the threshold.
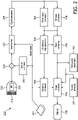
- the ultrasound imaging system 210 may include an ultrasound imaging device configured to receive a shear wave signal for performing shear wave imaging.
- the ultrasound imaging device may include processing components (e.g., beamformer, signal processor, etc.) communicatively coupled to an ultrasound probe operable to transmit ultrasound and receive echoes from a subject.
- processing components e.g., beamformer, signal processor, etc.
- an ultrasound probe 212 includes a transducer array 214 for transmitting ultrasonic waves and receiving echo information.
- transducer arrays are well known in the art, e.g., linear arrays, convex arrays or phased arrays.
- the transducer array 214 can include a two dimensional array (as shown) of transducer elements capable of scanning in both elevation and azimuth dimensions for 2D and/or 3D imaging.
- the transducer array 214 is coupled to a microbeamformer 216 in the probe 212 which controls transmission and reception of signals by the transducer elements in the array.
- the microbeamformer is coupled by the probe cable to a transmit/receive (T/R) switch 218, which switches between transmission and reception and protects the main beamformer 222 from high energy transmit signals.
- T/R switch 218 and other elements in the system can be included in the transducer probe rather than in a separate ultrasound system base.
- the transmission of ultrasonic beams from the transducer array 214 under control of the microbeamformer 216 is directed by the transmit controller 220 coupled to the T/R switch 218 and the beamformer 222, which receives input from the user's operation of the user interface or control panel 224.
- One of the functions controlled by the transmit controller 220 is the direction in which beams are steered. Beams may be steered straight ahead from (orthogonal to) the transducer array, or at different angles for a wider field of view.
- the partially beamformed signals produced by the microbeamformer 216 are coupled to a main beamformer 222 where partially beamformed signals from individual patches of transducer elements are combined into a fully beamformed signal.
- the beamformed signals are coupled to a signal processor 226.
- the signal processor 226 can process the received echo signals in various ways, such as bandpass filtering, decimation, I and Q component separation, and harmonic signal separation.
- the signal processor 226 may also perform additional signal enhancement such as speckle reduction, signal compounding, and noise elimination.
- the processed signals are coupled to a B mode processor 228, which can employ amplitude detection for the imaging of structures in the body.
- the signals produced by the B mode processor are coupled to a scan converter 230 and a multiplanar reformatter 232.
- the scan converter 230 arranges the echo signals in the spatial relationship from which they were received in a desired image format.
- the scan converter 30 may arrange the echo signal into a two dimensional (2D) sector-shaped format, or a pyramidal three dimensional (3D) image.
- the multiplanar reformatter 232 can convert echoes which are received from points in a common plane in a volumetric region of the body into an ultrasonic image of that plane, as described in U.S. Pat. No. 6,443,896 (Detmer ).
- a volume renderer 234 converts the echo signals of a 3D data set into a projected 3D image as viewed from a given reference point, e.g., as described in U.S. Pat. No. 6,530,885 (Entrekin et al.
- the 2D or 3D images are coupled from the scan converter 230, multiplanar reformatter 232, and volume renderer 234 to an image processor 236 for further enhancement, buffering and temporary storage for display on an image display 238.
- the graphics processor 236 can generate graphic overlays for display with the ultrasound images. These graphic overlays can contain, e.g., standard identifying information such as patient name, date and time of the image, imaging parameters, and the like. For these purposes the graphics processor receives input from the user interface 224, such as a typed patient name.
- the user interface can also be coupled to the multiplanar reformatter 232 for selection and control of a display of multiple multiplanar reformatted (MPR) images.
- MPR multiplanar reformatted
- the transducer array 214 is configured to transmit, responsive to control by the transmit controller 220, push pulses to generate a shear wave in tissue.
- the transducer array 214 may further be operable to transmit and receiving tracking pulses to monitor the shear wave in the tissue.
- the ultrasound system 210 may acquire shear wave imaging data concurrently with or at a different time (before or after) acquiring or in lieu of B-mode imaging data.
- the ultrasound system 10 may perform shear wave imaging before or after acquiring a B-mode image.
- the ultrasound system 210 may perform shear wave and B-mode imaging at the same time.
- the ultrasound system 210 may perform shear wave imaging and B-mode imaging in an interleaved manner.
- the ultrasound system 210 may display an image based on shear wave imaging rather than B-mode imaging.
- the ultrasound system 210 may generate a ultrasound image based on both the shear wave and B-mode imaging data.
- the partially beamformed shear wave signals produced by the microbeamformer 216 are coupled to the main beamformer 222 where partially beamformed signals from individual patches of transducer elements are combined into a fully beamformed shear wave signal.
- the beamformed signals are coupled to the signal processor 226.
- the signal processor 226 can process the received shear wave signals in various ways, such as bandpass filtering, decimation, signal compounding, and/or noise elimination.
- the processed shear wave signals may be provided to a shear wave processor 242.
- the shear wave processor 242 may calculate tissue stiffness values (e.g., shear wave velocity in tissue, elastic modulus) from the shear wave data included in the shear wave signals. A tissue stiffness value may be calculated for each pixel in an ultrasound image.
- Processed ultrasound image and/or shear wave signals from the signal processor 226, and/or tissue stiffness values from the shear wave processor 242 may be provided to a confidence map generator 244.
- the confidence map generator 244 may calculate a confidence value for each tissue stiffness value based on one or more confidence factors. Each confidence factor has a value between 0 and 1, which represents a confidence from 0-100%.
- the confidence map generator 244 may calculate a confidence factor for each pixel in an ultrasound image to determine a confidence value (with the calculation of only one confidence factor for each pixel not being part of the invention). According to the invention, two or more confidence factors are calculated for each pixel and combined to generate a confidence value for the pixel. In some embodiments not forming part of the invention, the confidence map generator 244 calculates the confidence factors and multiplies the confidence factors together to generate a confidence value for the pixel. In some embodiments not forming part of the invention, the confidence factors are given different weights when multiplied together. The weights may be selected by a user or predetermined by the ultrasound imaging system. In some embodiments not forming part of the invention, all of the weights are the same or are omitted.
- W 1 through W n are omitted from Equation 1. That is, each confidence factor is given equal weight.
- a modified equation 1 may be used in which a single overall scaling factor is applied the product of the individual confidence factors.
- the confidence map generator 244 compares the value of each confidence factor and selects the confidence factor with the lowest value as the confidence value for the pixel.
- the confidence value for a given pixel is calculated as the minimum of the confidence factors CF 1 through CF n associated with that pixel and Wi through W n are the weights applied to each confidence factor.
- W 1 through W n are omitted from Equation 2 such that each confidence factor is given equal weight.
- Any number of confidence factors for example two or more confidence factors, may be used in embodiments of the present disclosure, wherein only one confidence factor for each pixel does not form part of the invention.
- Other relationships may be used to define a confidence value in terms of a plurality of confidence factors. If only one confidence factor is used (not forming part of the invention), the value of the confidence factor may correspond to the confidence value.
- Confidence factors may include, but are not limited to, signal-to-noise ratio, flow, flash, shear wave displacement amplitude, reconstruction confidence, range estimate, and/or energy ratio.
- the signal-to-noise ratio may be calculated by any appropriate method. For example, for each pixel in an ultrasound image, a noise floor may be modeled and the average power of a shear wave tracking signal may be determined. The noise model and the tracking signal power may be converted to decibel units (dB) and subtracted. A certain dB value may be chosen as low confidence and a higher dB value may be chosen as high confidence. For example, 20dB may correspond to 0% confidence and 80dB may correspond to 100% confidence. In some applications, when the confidence factors are weighted, the SNR confidence factor may be given the most weight.
- dB decibel units
- Flow and flash are both modes of motion detection.
- Image processing techniques may be used to detect motion during the tracking time of shear wave imaging. If the motion is consistently in one direction, it is considered flow. That is, it is most likely a consistent flow of fluid such as blood in a vessel. If the motion is inconsistent and/or large in magnitude in any direction, it is considered flash. Flash may be caused by either patient or probe movement. Detection of either flash or flow returns low confidence values.
- Displacement amplitude is the magnitude of the shear wave as it propagates through tissue in the tracking field. A high magnitude may correspond to high confidence whereas a low magnitude may correspond to a low confidence. What is considered high or low magnitude of a shear wave may depend on the type of tissue that is being examined. In some embodiments, displacement amplitude may be given less weight than SNR and/or motion confidence factors.
- the ultrasound system may have one or more operation settings that may optimize shear wave imaging based on range estimate of expected tissue stiffness values (e.g., 5-20kPa, 30-50kPa).
- the range estimate may be provided by a user. Optimizations may include, but are not limited to, the strength, timing, spacing and/or shape of push pulses and/or tracking pulses. If the stiffness values calculated by the shear wave processor 242 fall outside the range estimate provided by the user, confidence values may be reduced.
- the energy ratio is a measure of the strength of the shear wave signal.
- One method of calculating the energy ratio includes filtering tissue displacement data to extract the shear wave in the tissue from noise. If the energy remaining in the shear wave signal is low compared to the energy of the unfiltered signal, it may indicate that most of the shear wave data was noise. Accordingly, a low energy ratio corresponds to low confidence and a high energy ratio corresponds to high confidence. In some embodiments, the energy ratio may be converted to decibel units.
- all confidence factors may be used to calculate a confidence value.
- only a subset of the confidence factors may be used. For example, in some applications, only SNR, flow, and flash may be used to calculate confidence values. In some applications, where it is unknown if the tissue type is amenable to shear wave analysis, displacement amplitude may be used as a confidence factor. In applications where shear wave amplitudes tend to be low, the energy ratio may be used as a confidence factor.
- the confidence factors used and/or method of combining the confidence factors to calculate confidence values may be selected by a user or may be predetermined by the ultrasound system.
- the confidence values output by the confidence map generator 244 may be coupled to the scan converter 230 and/or to the graphics processor 240 to generate a confidence map, i.e., a graphical overlay representing that confidence values at any given pixel within the ROI, which may be superimposed over a background ultrasound image (e.g., a B-mode image or shear wave image).
- the tissue stiffness values calculated by the shear wave processor 242 may also be provided to the graphics processor 240 to generate a graphical overlay based on tissue stiffness values.
- the graphics processor 240 may combine the confidence map and the tissue stiffness values to generate a graphical overlay that masks out tissue stiffness values that have a confidence value below a threshold value (e.g., 60%, 80%, 90%).
- the confidence map generator 244 combines the confidence values and tissues stiffness values and provides instructions to the graphics processor 240 regarding which pixels should be masked in the graphical overlay. For example, the confidence map generator 244 may provide only a subset of the tissue stiffness values for the region of interest, which may be selected based on the respective confidence values, to the graphics processor 240 for generating the graphical overlay.
- FIG. 2 shows the shear wave processor 242, B-mode processor 228, confidence map generator 244, graphics processor 240, and image processor 236 as separate processors.
- processors may be implemented using a specifically programmed central processing unit, graphical processing unit, and/or application specific integrated circuit.
- the functionality of two or more processors may be combined into one processor.
- the functionality of the image processor 236 and graphics processor 240 may be combined into a single processor.
- the functionality of the shear wave processor, B-mode processor, and confidence map generator may be combined into a single processor. Other combinations of functionality may also exist.
- ultrasound imaging system 210 may include an ultrasound imaging device (e.g., array 214) that may be configured to generate shear wave signals responsive to shear wave tracking echoes received by an ultrasound probe 212 communicatively coupled to the ultrasound device.
- the ultrasound imaging system 210 may include a processor integral with or communicatively coupled to the ultrasound imaging device.
- the processor may include the shear wave processor 242 configured to calculate tissue stiffness values based, at least in part, on the shear wave, the confidence map generator 244 configured to calculate confidence values based on at least one confidence factor, an image processor 236 configured to generate an ultrasound image including a graphical overlay of tissue stiffness values for one or more pixels within a region of interest, and provide, based on the calculated confidence values, an indication of reliability of the tissue stiffness values within the region of interest.
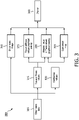
- FIG. 3 is a flow chart 300 that illustrates the flow of data between processing components of the ultrasound imaging system for generating images according to embodiments of the present disclosure.
- Shear wave data 305 may be passed to the shear wave processor 242 for generating tissue stiffness values 315 and a shear wave image 310, and to the confidence map generator 244 for generating confidence values 320.
- the shear wave image 310 may additionally or alternatively use a B-mode imaging data for generating the background image (i.e., an image of the anatomy).
- Tissue stiffness values 315 may be used to generate (e.g., by a graphics processor 240) a graphical overlay of tissue stiffness values 325, such as the graphical overlay shown in FIG. 1 .
- the confidence values 320 may be used to generate (e.g., by confidence map generator 244) a graphical overlay of confidence values, referred to as a confidence map 335.
- the tissue stiffness values 315 and confidence values 320 may be combined (e.g., by confidence map generator 244 or by graphics processor 240) to generate a masked tissue stiffness value graphical overlay 330.
- Each of these three overlays may be combined with the shear wave image 310 (e.g., a gray-scale image) to be provided on a display 340, such as display 238 shown in FIG. 2 .
- FIG. 4 shows an example screen shots 400 of ultrasound images 405, 410, 435, and 440 and graphical overlays 420,445, and 465 that include shear wave data, which may be generated and displayed by an ultrasound imaging system according to the present disclosure (e.g., ultrasound imaging system 210 of FIG. 2 ).
- Ultrasound image 405 is an image the liver with blood vessels and the gall bladder. Ultrasound image 405 may have been generated by shear wave imaging data, B-mode imaging data, or a combination thereof. Ultrasound image 405 includes two pointers A and B. The pointers A, B may have been placed on the respective image responsive to input by a user, such as an ultrasound technician or a clinician. The user may have provided the input via a user interface, such as user interface 224 of FIG. 2 .
- the ultrasound imaging system may be configured to calculate tissue stiffness values and may provide an indication of the tissue stiffness values on a display (e.g., display 238 of FIG. 2 ).
- tissue stiffness values in kPa
- tissue stiffness values (in kPa) for locations in the tissue that correspond to pointers A and B are provided in a box 415, e.g., in the lower left corner of the image.
- the indication may be provided differently (e.g., by annotating the value next to each selected location corresponding to pointers A, B).
- the tissue at the location of pointer A has a stiffness value of 5.12kPa and the tissue at the location of pointer B has a stiffness value of 3.73kPa.
- the stiffness values may have been calculated from the shear wave data by a shear wave processor (e.g., shear wave processor 242 in FIG. 2 ).
- the shear wave data may have been acquired by an ultrasound imaging device including an ultrasound probe (e.g., ultrasound probe 212 in FIG. 2 ).
- the ultrasound image 410 includes a graphical overlay of tissue stiffness values 420 over a region of interest (ROI).
- the ROI may have been selected by a user in some examples.
- the graphical overlay of tissue stiffness values 420 in the form of a color map, which are calculated based on the shear wave data, superimposed.
- different tissue stiffness values may be represented by different colors and/or different grayscale values. For example, low stiffness values may be represented by blue pixels while high stiffness values may be represented as orange or red pixels.
- the color-coded map representing the tissue stiffness values for the ROI may be associated with a color scale bar 425, which is displayed with the image for interpreting the color-coded map.
- the graphical overlay of stiffness values 420 may provide the user with a qualitative overview of tissue stiffness over a large area. In contrast, the pointers A and B may provide the user with quantitative stiffness values at specific points.
- Ultrasound image 435 includes a confidence map 445 superimposed on the ultrasound image in the ROI.
- the confidence map may have been generated in part from confidence values calculated by a confidence map generator in some examples (e.g., confidence map generator 244 in FIG. 2 ). Similar to the graphical overlay for tissue stiffness values 420, different confidence values may be displayed in different colors (e.g., green for high confidence, yellow for medium confidence, and red for low confidence) or grayscale values. In the example shown in FIG. 4 , the color-coded confidence map representing the confidence values for the ROI may be associated with a color scale bar 450, which is displayed with the image for interpreting the color-coded confidence map.
- the confidence map 445 a user may see that there are low confidence values at the site of the blood vessel 455 and the gall bladder 460. Even if the user does not recognize the anatomy in the image, the user may be alerted by the ultrasound system not to collect tissue stiffness measurements at those sites.
- Ultrasound image 440 is the ultrasound image with a masked graphical overlay of tissue stiffness values 465 superimposed over the ROI.
- the masked graphical overlay 465 shows tissue stiffness values from the graphical overlay of tissue stiffness values 420 for the areas that have medium to high confidence, based at least in part on the confidence values. However, the tissue stiffness values in low confidence areas have been masked out. Which areas of the graphical overlay of tissue stiffness values 420 are masked out based on the confidence values is determined by a threshold value (e.g., 60%).
- the threshold value may be pre-set by the ultrasound system or by the user.
- the masked graphical overlay may have been generated by a graphics processor and/or an image processor for display (e.g., graphics processor 240 and image processor 236 of FIG. 2 ) based at least in part on the tissue stiffness values and/or confidence values.
- a graphics processor and/or an image processor for display e.g., graphics processor 240 and image processor 236 of FIG. 2
- the ultrasound system may prevent the user from collecting stiffness measurements in the masked areas.
- all ultrasound images 405, 410, 435, and 440 may be concurrently presented on a display (e.g., display 238 of FIG.2 ). In some embodiments, only one of the ultrasound images may be displayed, and a user may toggle between the images. In some embodiments, two or more images may be displayed concurrently. For example, images 435 and 440 may be concurrently displayed. In another example, images 405 and 440 may be concurrently displayed. Other combinations of images may also be displayed. A user may control which images are displayed and the orientation of the images via a user interface such as user interface 224 shown in FIG. 2 .
- FIG. 5 shows another a series of example screen shots 500 ultrasound images 505, 510, 535, and 540 and example graphical overlays 520, 545, and 565according to embodiments of the disclosure.
- the far left image 505 is an ultrasound image of the liver and the middle left image 510 is the ultrasound image with a graphical overlay of tissue stiffness values 520 superimposed.
- the patient moved during the imaging. An inexperienced user may not recognize that the image is overwhelmed by motion artifacts and should be reacquired.
- the confidence map 545 shows that nearly the entire region has low confidence values.
- the masked graphical overlay 565 of tissue stiffness values displayed on the far right image 540 shows that nearly all of the tissue stiffness values are masked out. Neither pointer A or B is on a valid data point. Both the confidence map and the masked graphical overlay provide feedback to the user that the image should be reacquired.
- the confidence map will display a majority of low confidence values and a majority of tissue stiffness values will be masked out in the graphical overlay. This may alert the user that one or more settings of the ultrasound imaging system should be adjusted.
- the confidence map will display low confidence values in the area of the shadow, alerting the user to the obstruction. The rib may be detected because it is outside the estimated tissue stiffness value range and/or another detection method such as low displacement amplitude of shear waves.
- Confidence maps and/or masked graphical overlays of tissue stiffness values may provide feedback to user on the quality of images and/or measurements.
- the feedback may be especially useful to inexperienced users who may be unfamiliar with anatomical landmarks and/or have difficulty recognizing image artifacts.
- the feedback may also alert users when they have inadvertently input incorrect settings for a shear wave imaging exam (e.g., forgot to change settings when examining a different type of tissue).
- the confidence maps and/or masked graphical overlays of tissue stiffness values may assist users in acquiring more accurate measurements. This may allow for more reliable patient diagnosis, monitoring, and/or reduction in the number of biopsies required.
- the images 105, 110, 405, 410, 435, 440, 505, 510, 535, and/or 540 may be shown on displays, such as display 238 shown in FIG. 2 , may also illustrate user selections which may include, for example, icons or menu items which may be selected by the user to, for example, scan, file, print, transfer images (e.g., from one display to another), mute, transcribe, and/or use a headpiece, as desired. Further, one or more menus as is known in the art may be provided for a user's convenience.
- the displayed images and associated data may be saved at any time during an exam or during subsequent analysis.
- a history mode may be activated to gather information indicative of when data may have been added and/or edited so that a user may refer back to original information and/or determine when and/or who made certain changes to information which may be saved in, for example, a generated report. Further, the changes may also be stored for later use.
- the present system may be extended to other ultrasound transducers. Additionally, the present system may be used to obtain and/or record image information related to, but not limited to renal, testicular, prostate, breast, ovarian, uterine, thyroid, hepatic, lung, musculoskeletal, splenic, nervous, cardiac, arterial and vascular systems, as well as other imaging applications related to ultrasound-guided interventions and other interventions which may be guided by real-time medical imaging. Further, the present system may also include one or more elements which may be used with non-ultrasound imaging systems with or without real-time imaging components so that they may provide features and advantages of the present system.
- Suitable ultrasonic imaging systems may include a Philips ® ultrasound system which may, for example, support a conventional broadband linear array transducer that may be suitable for small-parts imaging.
Landscapes
- Health & Medical Sciences (AREA)
- Life Sciences & Earth Sciences (AREA)
- Engineering & Computer Science (AREA)
- Heart & Thoracic Surgery (AREA)
- Molecular Biology (AREA)
- Biophysics (AREA)
- Nuclear Medicine, Radiotherapy & Molecular Imaging (AREA)
- Pathology (AREA)
- Radiology & Medical Imaging (AREA)
- Biomedical Technology (AREA)
- Veterinary Medicine (AREA)
- Medical Informatics (AREA)
- Physics & Mathematics (AREA)
- Surgery (AREA)
- Animal Behavior & Ethology (AREA)
- General Health & Medical Sciences (AREA)
- Public Health (AREA)
- Computer Vision & Pattern Recognition (AREA)
- Vascular Medicine (AREA)
- Ultra Sonic Daignosis Equipment (AREA)
Claims (14)
- Système d'imagerie par ultrasons (210) comprenant:un dispositif d'imagerie par ultrasons configuré pour générer des signaux d'onde de cisaillement en réponse à des échos de suivi d'onde de cisaillement reçus par une sonde à ultrasons (212) couplée en communication au dispositif d'imagerie par ultrasons; etun processeur solidaire de ou couplé en communication avec le dispositif d'imagerie par ultrasons, dans lequel le processeur inclut:un processeur d'onde de cisaillement (242) configuré pour calculer des valeurs de rigidité de tissu (315) sur la base, au moins en partie, des signaux d'onde de cisaillement;un processeur d'image (236) configuré pour générer une image par ultrasons (110, 410, 440, 510, 540) incluant une superposition graphique (120, 325, 420, 465, 520, 565) de valeurs de rigidité de tissu pour un ou plusieurs pixels au sein d'une région d'intérêt, et un générateur de carte de confiance (244) configuré pour calculer une pluralité de facteurs de confiance pour chacun d'une pluralité de pixels de l'image par ultrasons, chaque facteur de confiance étant représenté comme une confiance entre 0 et 100%, etcalculer une valeur de confiance (320) pour chacun des pixels sur la base de la pluralité de facteurs de confiance; dans lequel l'image par ultrasons est configurée pour fournir, sur la base des valeurs de confiance calculées, une indication de fiabilité des valeurs de rigidité de tissu (315) au sein de la région d'intérêt, etdans lequel le calcul de la valeur de confiance (320) pour chacun de la pluralité de pixels consiste à comparer la pluralité de facteurs de confiance et sélectionner un facteur de confiance minimum comme valeur de confiance.
- Système d'imagerie par ultrasons (210) selon la revendication 1, dans lequel le processeur d'image est en outre configuré pour générer une superposition graphique masquée (330, 465, 565) de valeurs de rigidité de tissu (315), dans lequel les valeurs de rigidité de tissu présentant une valeur de confiance inférieure à une valeur seuil sont masqués.
- Système d'imagerie par ultrasons (210) selon la revendication 2, dans lequel la valeur seuil est définie par un utilisateur.
- Système d'imagerie par ultrasons (210) selon la revendication 2, comprenant en outre un affichage (238, 340) couplé en communication au processeur d'image (236), dans lequel, en réponse au processeur d'image, l'affichage est configuré pour afficher simultanément: l'image (440, 540) avec la superposition graphique masquée (465, 565) des valeurs de rigidité de tissu superposées; et l'image (435, 535) avec une carte de confiance (445, 545) superposée, dans lequel la carte de confiance est basée, au moins en partie, sur les valeurs de confiance.
- Système d'imagerie par ultrasons (210) selon la revendication 2, dans lequel le système d'imagerie par ultrasons empêche la collecte de valeurs de rigidité de tissu (315) où les valeurs de confiance (320) sont inférieures à la valeur seuil.
- Système d'imagerie par ultrasons (210) selon la revendication 1, dans lequel les valeurs de rigidité de tissu (315) sont représentées par différentes couleurs dans la superposition graphique (120, 325, 420, 465, 520, 565).
- Système d'imagerie par ultrasons (210) selon la revendication 1, dans lequel les facteurs de confiance sont calculés sur la base d'un rapport signal-bruit, d'une détection de mouvement, d'une amplitude de déplacement, d'une estimation de plage de valeurs de rigidité de tissu attendues, ou d'un rapport d'énergie, le rapport d'énergie correspondant à un rapport de l'énergie d'un signal d'onde de cisaillement filtré par le bruit à l'énergie du signal d'onde de cisaillement non filtré correspondant.
- Système d'imagerie par ultrasons (210) selon la revendication 7, dans lequel l'estimation de plage est définie par un utilisateur.
- Système d'imagerie par ultrasons (210) selon la revendication 7, dans lequel la détection de mouvement inclut au moins un parmi flash et flux.
- Système d'imagerie par ultrasons (210) selon la revendication 1, dans lequel la sonde à ultrasons (212) est en outre configurée pour réaliser une imagerie en mode B.
- Procédé consistant à:acquérir une image d'onde de cisaillement (310);calculer une valeur de rigidité de tissu (315) pour chaque pixel dans l'image d'onde de cisaillement;calculer une pluralité de facteurs de confiance pour chacun de la pluralité de pixels, chaque facteur de confiance étant représenté comme une confiance entre 0-100%;déterminer une valeur de confiance (320) pour chacun de la pluralité de pixels sur la base de la pluralité correspondante de facteurs de confiance, dans lequel les valeurs de confiance correspondent à la confiance dans les valeurs de rigidité de tissu; générer une carte de confiance (335) basée, au moins en partie, sur les valeurs de confiance,dans lequel le calcul de la valeur de confiance (320) pour chacun de la pluralité de pixels consiste à comparer la pluralité de facteurs de confiance et sélectionner un facteur de confiance minimum comme valeur de confiance.
- Procédé selon la revendication 11, dans lequel un sous-ensemble de la pluralité de facteurs de confiance est comparé pour déterminer les valeurs de confiance (320).
- Procédé selon la revendication 12, dans lequel le sous-ensemble de la pluralité de facteurs de confiance est sélectionné par un utilisateur.
- Procédé selon la revendication 11, dans lequel la carte de confiance (335) représente différentes valeurs de confiance (320) avec différentes couleurs.
Applications Claiming Priority (3)
| Application Number | Priority Date | Filing Date | Title |
|---|---|---|---|
| US201762444403P | 2017-01-10 | 2017-01-10 | |
| US201762475962P | 2017-03-24 | 2017-03-24 | |
| PCT/EP2018/050405 WO2018130503A1 (fr) | 2017-01-10 | 2018-01-09 | Systèmes, procédés et appareils de cartographie de confiance d'imagerie par ondes de cisaillement |
Publications (2)
| Publication Number | Publication Date |
|---|---|
| EP3568080A1 EP3568080A1 (fr) | 2019-11-20 |
| EP3568080B1 true EP3568080B1 (fr) | 2022-09-07 |
Family
ID=61521464
Family Applications (1)
| Application Number | Title | Priority Date | Filing Date |
|---|---|---|---|
| EP18707847.2A Active EP3568080B1 (fr) | 2017-01-10 | 2018-01-09 | Système et procédé de cartographie de confiance d'imagerie par ondes de cisaillement |
Country Status (3)
| Country | Link |
|---|---|
| US (3) | US11304678B2 (fr) |
| EP (1) | EP3568080B1 (fr) |
| WO (1) | WO2018130503A1 (fr) |
Families Citing this family (4)
| Publication number | Priority date | Publication date | Assignee | Title |
|---|---|---|---|---|
| WO2016067072A1 (fr) * | 2014-10-28 | 2016-05-06 | Super Sonic Imagine | Procédés et appareils d'imagerie permettant de réaliser une imagerie par élastographie par ondes de cisaillement |
| US11304678B2 (en) * | 2017-01-10 | 2022-04-19 | Koninklijke Philips N.V. | Systems, methods, and apparatuses for confidence mapping of shear wave imaging |
| CN111772677B (zh) * | 2020-07-07 | 2023-06-13 | 意领科技有限公司 | 具有维度的生物组织弹性检测方法,检测系统和存储介质 |
| WO2024068347A1 (fr) * | 2022-09-28 | 2024-04-04 | Koninklijke Philips N.V. | Procédé et système pour effectuer des mesures de rigidité à l'aide d'élastographie par ondes de cisaillement ultrasonores |
Family Cites Families (8)
| Publication number | Priority date | Publication date | Assignee | Title |
|---|---|---|---|---|
| US6530885B1 (en) | 2000-03-17 | 2003-03-11 | Atl Ultrasound, Inc. | Spatially compounded three dimensional ultrasonic images |
| US6443896B1 (en) | 2000-08-17 | 2002-09-03 | Koninklijke Philips Electronics N.V. | Method for creating multiplanar ultrasonic images of a three dimensional object |
| US9468421B2 (en) * | 2012-02-16 | 2016-10-18 | Siemens Medical Solutions Usa, Inc. | Visualization of associated information in ultrasound shear wave imaging |
| GB2507987A (en) * | 2012-11-15 | 2014-05-21 | Imp Innovations Ltd | Method of automatically processing an ultrasound image |
| JP6462340B2 (ja) * | 2013-12-13 | 2019-01-30 | キヤノンメディカルシステムズ株式会社 | 超音波診断装置、画像処理装置及び画像処理方法 |
| WO2016067072A1 (fr) * | 2014-10-28 | 2016-05-06 | Super Sonic Imagine | Procédés et appareils d'imagerie permettant de réaliser une imagerie par élastographie par ondes de cisaillement |
| CN104605891B (zh) * | 2014-12-31 | 2017-05-31 | 中国科学院苏州生物医学工程技术研究所 | 检测剪切波在生物组织中传播速度的方法、检测生物组织弹性的方法及生物组织弹性成像方法 |
| US11304678B2 (en) * | 2017-01-10 | 2022-04-19 | Koninklijke Philips N.V. | Systems, methods, and apparatuses for confidence mapping of shear wave imaging |
-
2018
- 2018-01-09 US US16/476,785 patent/US11304678B2/en active Active
- 2018-01-09 EP EP18707847.2A patent/EP3568080B1/fr active Active
- 2018-01-09 WO PCT/EP2018/050405 patent/WO2018130503A1/fr unknown
-
2022
- 2022-03-18 US US17/698,535 patent/US11883237B2/en active Active
-
2023
- 2023-12-20 US US18/390,786 patent/US20240122574A1/en active Pending
Also Published As
| Publication number | Publication date |
|---|---|
| US11883237B2 (en) | 2024-01-30 |
| US20240122574A1 (en) | 2024-04-18 |
| US11304678B2 (en) | 2022-04-19 |
| EP3568080A1 (fr) | 2019-11-20 |
| US20220202396A1 (en) | 2022-06-30 |
| WO2018130503A1 (fr) | 2018-07-19 |
| US20190357886A1 (en) | 2019-11-28 |
Similar Documents
| Publication | Publication Date | Title |
|---|---|---|
| JP7132925B2 (ja) | イメージングデータ及び組織情報を導出するためのニューラルネットワークを用いた超音波イメージングシステム | |
| US11883237B2 (en) | Systems, methods, and apparatuses for confidence mapping of shear wave imaging | |
| RU2667617C2 (ru) | Система и способ эластографических измерений | |
| US7092749B2 (en) | System and method for adapting the behavior of a diagnostic medical ultrasound system based on anatomic features present in ultrasound images | |
| EP3213108B1 (fr) | Procédés et appareils d'imagerie permettant de réaliser une imagerie par élastographie par ondes de cisaillement | |
| EP2919033B1 (fr) | Procédé et appareil pour afficher une pluralité d'images différentes d'un objet | |
| CN109310399B (zh) | 医学超声图像处理设备 | |
| EP1679038A2 (fr) | Dispositif et procédé de diagnostic à ultrason pour la formation d'images en mode m arbitraire | |
| US20190216423A1 (en) | Ultrasound imaging apparatus and method of controlling the same | |
| US11403778B2 (en) | Fetal development monitoring | |
| EP2253275A1 (fr) | Appareil de diagnostic à ultrasons, appareil de traitement d'images à ultrasons et procédé de traitement d'images à ultrasons | |
| EP1977694A1 (fr) | Système et procédé à ultrasons pour former une image ultrasonore | |
| CN110446466B (zh) | 体积绘制的超声成像 | |
| EP3541290B1 (fr) | Système à ultrasons et procédé de détection de calculs rénaux à l'aide d'un artefact de scintillement | |
| US20180168550A1 (en) | Ultrasound imaging apparatus and method of controlling the same | |
| EP3364881B1 (fr) | Appareil d'imagerie par ultrasons et son procédé de commande | |
| JP2008073423A (ja) | 超音波診断装置、診断パラメータ計測装置及び診断パラメータ計測方法 | |
| CN112839590A (zh) | 用于确定补充超声视图的方法和系统 | |
| JP2005143733A (ja) | 超音波診断装置、3次元画像データ表示装置及び3次元画像データ表示方法 | |
| KR20140132839A (ko) | 초음파 영상 장치 및 그 영상 표시 방법 | |
| US20050075566A1 (en) | Ultrasonice diagnosing apparatus | |
| EP4183349A1 (fr) | Traitement d'image f tale par ultrasons | |
| EP3685753A1 (fr) | Appareil d'imagerie à ultrasons et procédé de commande correspondant | |
| KR101956460B1 (ko) | 초음파 의료영상 장치를 이용한 미세석회화 조직 검출 방법 및 그 초음파 의료영상 장치 | |
| JP2006020801A (ja) | 超音波診断装置 |
Legal Events
| Date | Code | Title | Description |
|---|---|---|---|
| STAA | Information on the status of an ep patent application or granted ep patent |
Free format text: STATUS: UNKNOWN |
|
| STAA | Information on the status of an ep patent application or granted ep patent |
Free format text: STATUS: THE INTERNATIONAL PUBLICATION HAS BEEN MADE |
|
| PUAI | Public reference made under article 153(3) epc to a published international application that has entered the european phase |
Free format text: ORIGINAL CODE: 0009012 |
|
| STAA | Information on the status of an ep patent application or granted ep patent |
Free format text: STATUS: REQUEST FOR EXAMINATION WAS MADE |
|
| 17P | Request for examination filed |
Effective date: 20190812 |
|
| AK | Designated contracting states |
Kind code of ref document: A1 Designated state(s): AL AT BE BG CH CY CZ DE DK EE ES FI FR GB GR HR HU IE IS IT LI LT LU LV MC MK MT NL NO PL PT RO RS SE SI SK SM TR |
|
| AX | Request for extension of the european patent |
Extension state: BA ME |
|
| RAP1 | Party data changed (applicant data changed or rights of an application transferred) |
Owner name: KONINKLIJKE PHILIPS N.V. |
|
| DAV | Request for validation of the european patent (deleted) | ||
| DAX | Request for extension of the european patent (deleted) | ||
| STAA | Information on the status of an ep patent application or granted ep patent |
Free format text: STATUS: EXAMINATION IS IN PROGRESS |
|
| 17Q | First examination report despatched |
Effective date: 20200612 |
|
| STAA | Information on the status of an ep patent application or granted ep patent |
Free format text: STATUS: EXAMINATION IS IN PROGRESS |
|
| GRAP | Despatch of communication of intention to grant a patent |
Free format text: ORIGINAL CODE: EPIDOSNIGR1 |
|
| STAA | Information on the status of an ep patent application or granted ep patent |
Free format text: STATUS: GRANT OF PATENT IS INTENDED |
|
| INTG | Intention to grant announced |
Effective date: 20220517 |
|
| GRAS | Grant fee paid |
Free format text: ORIGINAL CODE: EPIDOSNIGR3 |
|
| GRAA | (expected) grant |
Free format text: ORIGINAL CODE: 0009210 |
|
| STAA | Information on the status of an ep patent application or granted ep patent |
Free format text: STATUS: THE PATENT HAS BEEN GRANTED |
|
| AK | Designated contracting states |
Kind code of ref document: B1 Designated state(s): AL AT BE BG CH CY CZ DE DK EE ES FI FR GB GR HR HU IE IS IT LI LT LU LV MC MK MT NL NO PL PT RO RS SE SI SK SM TR |
|
| REG | Reference to a national code |
Ref country code: GB Ref legal event code: FG4D |
|
| REG | Reference to a national code |
Ref country code: CH Ref legal event code: EP Ref country code: AT Ref legal event code: REF Ref document number: 1516415 Country of ref document: AT Kind code of ref document: T Effective date: 20220915 |
|
| REG | Reference to a national code |
Ref country code: IE Ref legal event code: FG4D |
|
| REG | Reference to a national code |
Ref country code: DE Ref legal event code: R096 Ref document number: 602018040308 Country of ref document: DE |
|
| REG | Reference to a national code |
Ref country code: DE Ref legal event code: R084 Ref document number: 602018040308 Country of ref document: DE |
|
| REG | Reference to a national code |
Ref country code: GB Ref legal event code: 746 Effective date: 20221128 |
|
| REG | Reference to a national code |
Ref country code: LT Ref legal event code: MG9D |
|
| REG | Reference to a national code |
Ref country code: NL Ref legal event code: MP Effective date: 20220907 |
|
| PG25 | Lapsed in a contracting state [announced via postgrant information from national office to epo] |
Ref country code: SE Free format text: LAPSE BECAUSE OF FAILURE TO SUBMIT A TRANSLATION OF THE DESCRIPTION OR TO PAY THE FEE WITHIN THE PRESCRIBED TIME-LIMIT Effective date: 20220907 Ref country code: RS Free format text: LAPSE BECAUSE OF FAILURE TO SUBMIT A TRANSLATION OF THE DESCRIPTION OR TO PAY THE FEE WITHIN THE PRESCRIBED TIME-LIMIT Effective date: 20220907 Ref country code: NO Free format text: LAPSE BECAUSE OF FAILURE TO SUBMIT A TRANSLATION OF THE DESCRIPTION OR TO PAY THE FEE WITHIN THE PRESCRIBED TIME-LIMIT Effective date: 20221207 Ref country code: LV Free format text: LAPSE BECAUSE OF FAILURE TO SUBMIT A TRANSLATION OF THE DESCRIPTION OR TO PAY THE FEE WITHIN THE PRESCRIBED TIME-LIMIT Effective date: 20220907 Ref country code: LT Free format text: LAPSE BECAUSE OF FAILURE TO SUBMIT A TRANSLATION OF THE DESCRIPTION OR TO PAY THE FEE WITHIN THE PRESCRIBED TIME-LIMIT Effective date: 20220907 Ref country code: FI Free format text: LAPSE BECAUSE OF FAILURE TO SUBMIT A TRANSLATION OF THE DESCRIPTION OR TO PAY THE FEE WITHIN THE PRESCRIBED TIME-LIMIT Effective date: 20220907 |
|
| REG | Reference to a national code |
Ref country code: AT Ref legal event code: MK05 Ref document number: 1516415 Country of ref document: AT Kind code of ref document: T Effective date: 20220907 |
|
| PG25 | Lapsed in a contracting state [announced via postgrant information from national office to epo] |
Ref country code: HR Free format text: LAPSE BECAUSE OF FAILURE TO SUBMIT A TRANSLATION OF THE DESCRIPTION OR TO PAY THE FEE WITHIN THE PRESCRIBED TIME-LIMIT Effective date: 20220907 Ref country code: GR Free format text: LAPSE BECAUSE OF FAILURE TO SUBMIT A TRANSLATION OF THE DESCRIPTION OR TO PAY THE FEE WITHIN THE PRESCRIBED TIME-LIMIT Effective date: 20221208 |
|
| PG25 | Lapsed in a contracting state [announced via postgrant information from national office to epo] |
Ref country code: SM Free format text: LAPSE BECAUSE OF FAILURE TO SUBMIT A TRANSLATION OF THE DESCRIPTION OR TO PAY THE FEE WITHIN THE PRESCRIBED TIME-LIMIT Effective date: 20220907 Ref country code: RO Free format text: LAPSE BECAUSE OF FAILURE TO SUBMIT A TRANSLATION OF THE DESCRIPTION OR TO PAY THE FEE WITHIN THE PRESCRIBED TIME-LIMIT Effective date: 20220907 Ref country code: PT Free format text: LAPSE BECAUSE OF FAILURE TO SUBMIT A TRANSLATION OF THE DESCRIPTION OR TO PAY THE FEE WITHIN THE PRESCRIBED TIME-LIMIT Effective date: 20230109 Ref country code: ES Free format text: LAPSE BECAUSE OF FAILURE TO SUBMIT A TRANSLATION OF THE DESCRIPTION OR TO PAY THE FEE WITHIN THE PRESCRIBED TIME-LIMIT Effective date: 20220907 Ref country code: CZ Free format text: LAPSE BECAUSE OF FAILURE TO SUBMIT A TRANSLATION OF THE DESCRIPTION OR TO PAY THE FEE WITHIN THE PRESCRIBED TIME-LIMIT Effective date: 20220907 Ref country code: AT Free format text: LAPSE BECAUSE OF FAILURE TO SUBMIT A TRANSLATION OF THE DESCRIPTION OR TO PAY THE FEE WITHIN THE PRESCRIBED TIME-LIMIT Effective date: 20220907 |
|
| PG25 | Lapsed in a contracting state [announced via postgrant information from national office to epo] |
Ref country code: SK Free format text: LAPSE BECAUSE OF FAILURE TO SUBMIT A TRANSLATION OF THE DESCRIPTION OR TO PAY THE FEE WITHIN THE PRESCRIBED TIME-LIMIT Effective date: 20220907 Ref country code: PL Free format text: LAPSE BECAUSE OF FAILURE TO SUBMIT A TRANSLATION OF THE DESCRIPTION OR TO PAY THE FEE WITHIN THE PRESCRIBED TIME-LIMIT Effective date: 20220907 Ref country code: IS Free format text: LAPSE BECAUSE OF FAILURE TO SUBMIT A TRANSLATION OF THE DESCRIPTION OR TO PAY THE FEE WITHIN THE PRESCRIBED TIME-LIMIT Effective date: 20230107 Ref country code: EE Free format text: LAPSE BECAUSE OF FAILURE TO SUBMIT A TRANSLATION OF THE DESCRIPTION OR TO PAY THE FEE WITHIN THE PRESCRIBED TIME-LIMIT Effective date: 20220907 |
|
| REG | Reference to a national code |
Ref country code: DE Ref legal event code: R097 Ref document number: 602018040308 Country of ref document: DE |
|
| PG25 | Lapsed in a contracting state [announced via postgrant information from national office to epo] |
Ref country code: NL Free format text: LAPSE BECAUSE OF FAILURE TO SUBMIT A TRANSLATION OF THE DESCRIPTION OR TO PAY THE FEE WITHIN THE PRESCRIBED TIME-LIMIT Effective date: 20220907 Ref country code: AL Free format text: LAPSE BECAUSE OF FAILURE TO SUBMIT A TRANSLATION OF THE DESCRIPTION OR TO PAY THE FEE WITHIN THE PRESCRIBED TIME-LIMIT Effective date: 20220907 |
|
| PLBE | No opposition filed within time limit |
Free format text: ORIGINAL CODE: 0009261 |
|
| STAA | Information on the status of an ep patent application or granted ep patent |
Free format text: STATUS: NO OPPOSITION FILED WITHIN TIME LIMIT |
|
| PG25 | Lapsed in a contracting state [announced via postgrant information from national office to epo] |
Ref country code: DK Free format text: LAPSE BECAUSE OF FAILURE TO SUBMIT A TRANSLATION OF THE DESCRIPTION OR TO PAY THE FEE WITHIN THE PRESCRIBED TIME-LIMIT Effective date: 20220907 |
|
| 26N | No opposition filed |
Effective date: 20230608 |
|
| PG25 | Lapsed in a contracting state [announced via postgrant information from national office to epo] |
Ref country code: SI Free format text: LAPSE BECAUSE OF FAILURE TO SUBMIT A TRANSLATION OF THE DESCRIPTION OR TO PAY THE FEE WITHIN THE PRESCRIBED TIME-LIMIT Effective date: 20220907 |
|
| REG | Reference to a national code |
Ref country code: CH Ref legal event code: PL |
|
| PG25 | Lapsed in a contracting state [announced via postgrant information from national office to epo] |
Ref country code: LU Free format text: LAPSE BECAUSE OF NON-PAYMENT OF DUE FEES Effective date: 20230109 |
|
| REG | Reference to a national code |
Ref country code: BE Ref legal event code: MM Effective date: 20230131 |
|
| PG25 | Lapsed in a contracting state [announced via postgrant information from national office to epo] |
Ref country code: LI Free format text: LAPSE BECAUSE OF NON-PAYMENT OF DUE FEES Effective date: 20230131 Ref country code: CH Free format text: LAPSE BECAUSE OF NON-PAYMENT OF DUE FEES Effective date: 20230131 |
|
| PG25 | Lapsed in a contracting state [announced via postgrant information from national office to epo] |
Ref country code: FR Free format text: LAPSE BECAUSE OF NON-PAYMENT OF DUE FEES Effective date: 20230131 Ref country code: BE Free format text: LAPSE BECAUSE OF NON-PAYMENT OF DUE FEES Effective date: 20230131 |
|
| PG25 | Lapsed in a contracting state [announced via postgrant information from national office to epo] |
Ref country code: IE Free format text: LAPSE BECAUSE OF NON-PAYMENT OF DUE FEES Effective date: 20230109 |
|
| PGFP | Annual fee paid to national office [announced via postgrant information from national office to epo] |
Ref country code: DE Payment date: 20240129 Year of fee payment: 7 Ref country code: GB Payment date: 20240123 Year of fee payment: 7 |