EP3559668B1 - Methods and apparatus for magnetic multi-bead assays - Google Patents
Methods and apparatus for magnetic multi-bead assays Download PDFInfo
- Publication number
- EP3559668B1 EP3559668B1 EP17884358.7A EP17884358A EP3559668B1 EP 3559668 B1 EP3559668 B1 EP 3559668B1 EP 17884358 A EP17884358 A EP 17884358A EP 3559668 B1 EP3559668 B1 EP 3559668B1
- Authority
- EP
- European Patent Office
- Prior art keywords
- bead
- magnetic
- functionalized
- beads
- type
- Prior art date
- Legal status (The legal status is an assumption and is not a legal conclusion. Google has not performed a legal analysis and makes no representation as to the accuracy of the status listed.)
- Active
Links
- 239000011324 bead Substances 0.000 title claims description 633
- 230000005291 magnetic effect Effects 0.000 title claims description 253
- 238000000034 method Methods 0.000 title claims description 57
- 238000003556 assay Methods 0.000 title claims description 55
- 239000012491 analyte Substances 0.000 claims description 125
- 239000000523 sample Substances 0.000 claims description 80
- 238000003384 imaging method Methods 0.000 claims description 63
- 239000012488 sample solution Substances 0.000 claims description 41
- 229910003460 diamond Inorganic materials 0.000 claims description 38
- 239000010432 diamond Substances 0.000 claims description 37
- 238000000387 optically detected magnetic resonance Methods 0.000 claims description 26
- 230000003287 optical effect Effects 0.000 claims description 25
- 239000000758 substrate Substances 0.000 claims description 25
- 239000000463 material Substances 0.000 claims description 19
- 229920000307 polymer substrate Polymers 0.000 claims description 13
- 230000005283 ground state Effects 0.000 claims description 10
- 102000004169 proteins and genes Human genes 0.000 claims description 10
- 108090000623 proteins and genes Proteins 0.000 claims description 9
- 230000007704 transition Effects 0.000 claims description 9
- 230000015572 biosynthetic process Effects 0.000 claims description 8
- 230000005294 ferromagnetic effect Effects 0.000 claims description 8
- 239000002122 magnetic nanoparticle Substances 0.000 claims description 8
- 238000000799 fluorescence microscopy Methods 0.000 claims description 7
- 238000012634 optical imaging Methods 0.000 claims description 6
- 230000005281 excited state Effects 0.000 claims description 5
- 150000007523 nucleic acids Chemical group 0.000 claims description 5
- 239000003302 ferromagnetic material Substances 0.000 claims description 4
- 108091028043 Nucleic acid sequence Proteins 0.000 claims description 3
- XUIMIQQOPSSXEZ-UHFFFAOYSA-N Silicon Chemical compound [Si] XUIMIQQOPSSXEZ-UHFFFAOYSA-N 0.000 claims description 3
- 241000700605 Viruses Species 0.000 claims description 3
- 229910052710 silicon Inorganic materials 0.000 claims description 3
- 239000010703 silicon Substances 0.000 claims description 3
- HBMJWWWQQXIZIP-UHFFFAOYSA-N silicon carbide Chemical compound [Si+]#[C-] HBMJWWWQQXIZIP-UHFFFAOYSA-N 0.000 claims description 3
- 229910010271 silicon carbide Inorganic materials 0.000 claims description 3
- 230000005415 magnetization Effects 0.000 description 39
- 230000003993 interaction Effects 0.000 description 24
- 238000007885 magnetic separation Methods 0.000 description 21
- 239000008188 pellet Substances 0.000 description 20
- 239000000725 suspension Substances 0.000 description 19
- 230000027455 binding Effects 0.000 description 17
- 239000002245 particle Substances 0.000 description 14
- 230000008569 process Effects 0.000 description 12
- 239000000696 magnetic material Substances 0.000 description 11
- 238000005259 measurement Methods 0.000 description 11
- 230000008859 change Effects 0.000 description 10
- 238000001514 detection method Methods 0.000 description 10
- 239000007788 liquid Substances 0.000 description 10
- 239000003446 ligand Substances 0.000 description 9
- 239000000203 mixture Substances 0.000 description 9
- 230000035945 sensitivity Effects 0.000 description 9
- UQSXHKLRYXJYBZ-UHFFFAOYSA-N Iron oxide Chemical compound [Fe]=O UQSXHKLRYXJYBZ-UHFFFAOYSA-N 0.000 description 8
- 230000005284 excitation Effects 0.000 description 8
- 238000002156 mixing Methods 0.000 description 8
- 239000002105 nanoparticle Substances 0.000 description 8
- 238000002965 ELISA Methods 0.000 description 7
- 238000006243 chemical reaction Methods 0.000 description 7
- 239000000306 component Substances 0.000 description 7
- 230000006870 function Effects 0.000 description 7
- IUVCFHHAEHNCFT-INIZCTEOSA-N 2-[(1s)-1-[4-amino-3-(3-fluoro-4-propan-2-yloxyphenyl)pyrazolo[3,4-d]pyrimidin-1-yl]ethyl]-6-fluoro-3-(3-fluorophenyl)chromen-4-one Chemical compound C1=C(F)C(OC(C)C)=CC=C1C(C1=C(N)N=CN=C11)=NN1[C@@H](C)C1=C(C=2C=C(F)C=CC=2)C(=O)C2=CC(F)=CC=C2O1 IUVCFHHAEHNCFT-INIZCTEOSA-N 0.000 description 6
- 238000013459 approach Methods 0.000 description 6
- 239000000872 buffer Substances 0.000 description 6
- 239000000539 dimer Substances 0.000 description 6
- 230000004044 response Effects 0.000 description 6
- 238000004435 EPR spectroscopy Methods 0.000 description 5
- 102000007066 Prostate-Specific Antigen Human genes 0.000 description 5
- 108010072866 Prostate-Specific Antigen Proteins 0.000 description 5
- 238000009792 diffusion process Methods 0.000 description 5
- 238000009826 distribution Methods 0.000 description 5
- 238000002073 fluorescence micrograph Methods 0.000 description 5
- 230000006872 improvement Effects 0.000 description 5
- 238000002360 preparation method Methods 0.000 description 5
- 238000000926 separation method Methods 0.000 description 5
- 239000012131 assay buffer Substances 0.000 description 4
- 239000012141 concentrate Substances 0.000 description 4
- 239000013078 crystal Substances 0.000 description 4
- 230000007423 decrease Effects 0.000 description 4
- 238000010790 dilution Methods 0.000 description 4
- 239000012895 dilution Substances 0.000 description 4
- 230000010355 oscillation Effects 0.000 description 4
- 239000000243 solution Substances 0.000 description 4
- 229910000859 α-Fe Inorganic materials 0.000 description 4
- 102000004190 Enzymes Human genes 0.000 description 3
- 108090000790 Enzymes Proteins 0.000 description 3
- 239000012472 biological sample Substances 0.000 description 3
- 210000004369 blood Anatomy 0.000 description 3
- 239000008280 blood Substances 0.000 description 3
- 238000011088 calibration curve Methods 0.000 description 3
- 210000004027 cell Anatomy 0.000 description 3
- 229910017052 cobalt Inorganic materials 0.000 description 3
- 239000010941 cobalt Substances 0.000 description 3
- GUTLYIVDDKVIGB-UHFFFAOYSA-N cobalt atom Chemical compound [Co] GUTLYIVDDKVIGB-UHFFFAOYSA-N 0.000 description 3
- 230000009918 complex formation Effects 0.000 description 3
- 239000000356 contaminant Substances 0.000 description 3
- 238000001035 drying Methods 0.000 description 3
- 238000005516 engineering process Methods 0.000 description 3
- 239000006249 magnetic particle Substances 0.000 description 3
- 238000000386 microscopy Methods 0.000 description 3
- 239000000178 monomer Substances 0.000 description 3
- -1 polyethylene Polymers 0.000 description 3
- 229920000642 polymer Polymers 0.000 description 3
- 230000008685 targeting Effects 0.000 description 3
- YBJHBAHKTGYVGT-ZKWXMUAHSA-N (+)-Biotin Chemical compound N1C(=O)N[C@@H]2[C@H](CCCCC(=O)O)SC[C@@H]21 YBJHBAHKTGYVGT-ZKWXMUAHSA-N 0.000 description 2
- 108091032973 (ribonucleotides)n+m Proteins 0.000 description 2
- 230000005653 Brownian motion process Effects 0.000 description 2
- 239000004698 Polyethylene Substances 0.000 description 2
- 238000004458 analytical method Methods 0.000 description 2
- 239000012503 blood component Substances 0.000 description 2
- 238000005537 brownian motion Methods 0.000 description 2
- 239000007853 buffer solution Substances 0.000 description 2
- 210000001175 cerebrospinal fluid Anatomy 0.000 description 2
- 239000003153 chemical reaction reagent Substances 0.000 description 2
- 239000011248 coating agent Substances 0.000 description 2
- 238000000576 coating method Methods 0.000 description 2
- 238000001362 electron spin resonance spectrum Methods 0.000 description 2
- SZVJSHCCFOBDDC-UHFFFAOYSA-N ferrosoferric oxide Chemical compound O=[Fe]O[Fe]O[Fe]=O SZVJSHCCFOBDDC-UHFFFAOYSA-N 0.000 description 2
- 230000005484 gravity Effects 0.000 description 2
- 238000011068 loading method Methods 0.000 description 2
- 238000012986 modification Methods 0.000 description 2
- 230000004048 modification Effects 0.000 description 2
- 230000009871 nonspecific binding Effects 0.000 description 2
- 102000039446 nucleic acids Human genes 0.000 description 2
- 108020004707 nucleic acids Proteins 0.000 description 2
- 238000005457 optimization Methods 0.000 description 2
- 229920003229 poly(methyl methacrylate) Polymers 0.000 description 2
- 229920000573 polyethylene Polymers 0.000 description 2
- 239000004926 polymethyl methacrylate Substances 0.000 description 2
- 229920001343 polytetrafluoroethylene Polymers 0.000 description 2
- 239000004810 polytetrafluoroethylene Substances 0.000 description 2
- 210000002966 serum Anatomy 0.000 description 2
- 238000009987 spinning Methods 0.000 description 2
- 238000003756 stirring Methods 0.000 description 2
- 239000000126 substance Substances 0.000 description 2
- 239000006228 supernatant Substances 0.000 description 2
- 210000001519 tissue Anatomy 0.000 description 2
- 238000012935 Averaging Methods 0.000 description 1
- 229910002518 CoFe2O4 Inorganic materials 0.000 description 1
- 108020004414 DNA Proteins 0.000 description 1
- 108060003951 Immunoglobulin Proteins 0.000 description 1
- PWHULOQIROXLJO-UHFFFAOYSA-N Manganese Chemical compound [Mn] PWHULOQIROXLJO-UHFFFAOYSA-N 0.000 description 1
- 108091005461 Nucleic proteins Proteins 0.000 description 1
- 108020004511 Recombinant DNA Proteins 0.000 description 1
- 206010039101 Rhinorrhoea Diseases 0.000 description 1
- 230000004075 alteration Effects 0.000 description 1
- 238000004166 bioassay Methods 0.000 description 1
- 238000001574 biopsy Methods 0.000 description 1
- 229960002685 biotin Drugs 0.000 description 1
- 235000020958 biotin Nutrition 0.000 description 1
- 239000011616 biotin Substances 0.000 description 1
- 210000001124 body fluid Anatomy 0.000 description 1
- 238000004113 cell culture Methods 0.000 description 1
- 238000005119 centrifugation Methods 0.000 description 1
- 230000000295 complement effect Effects 0.000 description 1
- 239000002131 composite material Substances 0.000 description 1
- 239000012470 diluted sample Substances 0.000 description 1
- 238000012850 discrimination method Methods 0.000 description 1
- 238000006073 displacement reaction Methods 0.000 description 1
- 238000010494 dissociation reaction Methods 0.000 description 1
- 230000005593 dissociations Effects 0.000 description 1
- 239000000428 dust Substances 0.000 description 1
- 230000000694 effects Effects 0.000 description 1
- 230000008030 elimination Effects 0.000 description 1
- 238000003379 elimination reaction Methods 0.000 description 1
- 238000000295 emission spectrum Methods 0.000 description 1
- 230000007613 environmental effect Effects 0.000 description 1
- 230000002255 enzymatic effect Effects 0.000 description 1
- 238000000695 excitation spectrum Methods 0.000 description 1
- 230000001747 exhibiting effect Effects 0.000 description 1
- 238000001914 filtration Methods 0.000 description 1
- 239000012530 fluid Substances 0.000 description 1
- 238000001917 fluorescence detection Methods 0.000 description 1
- 239000007850 fluorescent dye Substances 0.000 description 1
- 230000007274 generation of a signal involved in cell-cell signaling Effects 0.000 description 1
- 210000004251 human milk Anatomy 0.000 description 1
- 235000020256 human milk Nutrition 0.000 description 1
- 238000003018 immunoassay Methods 0.000 description 1
- 102000018358 immunoglobulin Human genes 0.000 description 1
- 229940072221 immunoglobulins Drugs 0.000 description 1
- 238000011534 incubation Methods 0.000 description 1
- WTFXARWRTYJXII-UHFFFAOYSA-N iron(2+);iron(3+);oxygen(2-) Chemical compound [O-2].[O-2].[O-2].[O-2].[Fe+2].[Fe+3].[Fe+3] WTFXARWRTYJXII-UHFFFAOYSA-N 0.000 description 1
- JEIPFZHSYJVQDO-UHFFFAOYSA-N iron(III) oxide Inorganic materials O=[Fe]O[Fe]=O JEIPFZHSYJVQDO-UHFFFAOYSA-N 0.000 description 1
- 238000002372 labelling Methods 0.000 description 1
- 239000006194 liquid suspension Substances 0.000 description 1
- 230000005381 magnetic domain Effects 0.000 description 1
- 238000002465 magnetic force microscopy Methods 0.000 description 1
- 229910052748 manganese Inorganic materials 0.000 description 1
- 239000011572 manganese Substances 0.000 description 1
- 229910044991 metal oxide Inorganic materials 0.000 description 1
- 150000004706 metal oxides Chemical class 0.000 description 1
- 229940031182 nanoparticles iron oxide Drugs 0.000 description 1
- 239000002073 nanorod Substances 0.000 description 1
- 208000010753 nasal discharge Diseases 0.000 description 1
- 210000003463 organelle Anatomy 0.000 description 1
- 239000012466 permeate Substances 0.000 description 1
- 239000004033 plastic Substances 0.000 description 1
- 229920003023 plastic Polymers 0.000 description 1
- 102000004196 processed proteins & peptides Human genes 0.000 description 1
- 108090000765 processed proteins & peptides Proteins 0.000 description 1
- 238000012545 processing Methods 0.000 description 1
- 239000000047 product Substances 0.000 description 1
- 238000005086 pumping Methods 0.000 description 1
- 239000012521 purified sample Substances 0.000 description 1
- 238000011002 quantification Methods 0.000 description 1
- 238000011160 research Methods 0.000 description 1
- 238000002271 resection Methods 0.000 description 1
- 210000003296 saliva Anatomy 0.000 description 1
- 150000003839 salts Chemical class 0.000 description 1
- 239000012723 sample buffer Substances 0.000 description 1
- 229920006395 saturated elastomer Polymers 0.000 description 1
- 210000000582 semen Anatomy 0.000 description 1
- 239000004065 semiconductor Substances 0.000 description 1
- 238000011896 sensitive detection Methods 0.000 description 1
- 239000007787 solid Substances 0.000 description 1
- 238000001228 spectrum Methods 0.000 description 1
- 230000002194 synthesizing effect Effects 0.000 description 1
- 210000001138 tear Anatomy 0.000 description 1
- 230000036962 time dependent Effects 0.000 description 1
- 238000004448 titration Methods 0.000 description 1
- 238000009827 uniform distribution Methods 0.000 description 1
- 210000002700 urine Anatomy 0.000 description 1
- 239000011534 wash buffer Substances 0.000 description 1
Images


Classifications
-
- G—PHYSICS
- G01—MEASURING; TESTING
- G01N—INVESTIGATING OR ANALYSING MATERIALS BY DETERMINING THEIR CHEMICAL OR PHYSICAL PROPERTIES
- G01N33/00—Investigating or analysing materials by specific methods not covered by groups G01N1/00 - G01N31/00
- G01N33/48—Biological material, e.g. blood, urine; Haemocytometers
- G01N33/50—Chemical analysis of biological material, e.g. blood, urine; Testing involving biospecific ligand binding methods; Immunological testing
- G01N33/53—Immunoassay; Biospecific binding assay; Materials therefor
- G01N33/543—Immunoassay; Biospecific binding assay; Materials therefor with an insoluble carrier for immobilising immunochemicals
- G01N33/54313—Immunoassay; Biospecific binding assay; Materials therefor with an insoluble carrier for immobilising immunochemicals the carrier being characterised by its particulate form
- G01N33/54326—Magnetic particles
-
- G—PHYSICS
- G01—MEASURING; TESTING
- G01N—INVESTIGATING OR ANALYSING MATERIALS BY DETERMINING THEIR CHEMICAL OR PHYSICAL PROPERTIES
- G01N24/00—Investigating or analyzing materials by the use of nuclear magnetic resonance, electron paramagnetic resonance or other spin effects
- G01N24/10—Investigating or analyzing materials by the use of nuclear magnetic resonance, electron paramagnetic resonance or other spin effects by using electron paramagnetic resonance
-
- G—PHYSICS
- G01—MEASURING; TESTING
- G01N—INVESTIGATING OR ANALYSING MATERIALS BY DETERMINING THEIR CHEMICAL OR PHYSICAL PROPERTIES
- G01N33/00—Investigating or analysing materials by specific methods not covered by groups G01N1/00 - G01N31/00
- G01N33/48—Biological material, e.g. blood, urine; Haemocytometers
- G01N33/50—Chemical analysis of biological material, e.g. blood, urine; Testing involving biospecific ligand binding methods; Immunological testing
- G01N33/53—Immunoassay; Biospecific binding assay; Materials therefor
- G01N33/536—Immunoassay; Biospecific binding assay; Materials therefor with immune complex formed in liquid phase
-
- G—PHYSICS
- G01—MEASURING; TESTING
- G01N—INVESTIGATING OR ANALYSING MATERIALS BY DETERMINING THEIR CHEMICAL OR PHYSICAL PROPERTIES
- G01N33/00—Investigating or analysing materials by specific methods not covered by groups G01N1/00 - G01N31/00
- G01N33/48—Biological material, e.g. blood, urine; Haemocytometers
- G01N33/50—Chemical analysis of biological material, e.g. blood, urine; Testing involving biospecific ligand binding methods; Immunological testing
- G01N33/53—Immunoassay; Biospecific binding assay; Materials therefor
- G01N33/543—Immunoassay; Biospecific binding assay; Materials therefor with an insoluble carrier for immobilising immunochemicals
- G01N33/551—Immunoassay; Biospecific binding assay; Materials therefor with an insoluble carrier for immobilising immunochemicals the carrier being inorganic
- G01N33/553—Metal or metal coated
-
- G—PHYSICS
- G01—MEASURING; TESTING
- G01N—INVESTIGATING OR ANALYSING MATERIALS BY DETERMINING THEIR CHEMICAL OR PHYSICAL PROPERTIES
- G01N27/00—Investigating or analysing materials by the use of electric, electrochemical, or magnetic means
- G01N27/72—Investigating or analysing materials by the use of electric, electrochemical, or magnetic means by investigating magnetic variables
- G01N27/74—Investigating or analysing materials by the use of electric, electrochemical, or magnetic means by investigating magnetic variables of fluids
- G01N27/745—Investigating or analysing materials by the use of electric, electrochemical, or magnetic means by investigating magnetic variables of fluids for detecting magnetic beads used in biochemical assays
-
- G—PHYSICS
- G01—MEASURING; TESTING
- G01R—MEASURING ELECTRIC VARIABLES; MEASURING MAGNETIC VARIABLES
- G01R33/00—Arrangements or instruments for measuring magnetic variables
- G01R33/20—Arrangements or instruments for measuring magnetic variables involving magnetic resonance
- G01R33/24—Arrangements or instruments for measuring magnetic variables involving magnetic resonance for measuring direction or magnitude of magnetic fields or magnetic flux
- G01R33/26—Arrangements or instruments for measuring magnetic variables involving magnetic resonance for measuring direction or magnitude of magnetic fields or magnetic flux using optical pumping
-
- G—PHYSICS
- G01—MEASURING; TESTING
- G01R—MEASURING ELECTRIC VARIABLES; MEASURING MAGNETIC VARIABLES
- G01R33/00—Arrangements or instruments for measuring magnetic variables
- G01R33/20—Arrangements or instruments for measuring magnetic variables involving magnetic resonance
- G01R33/28—Details of apparatus provided for in groups G01R33/44 - G01R33/64
- G01R33/32—Excitation or detection systems, e.g. using radio frequency signals
- G01R33/323—Detection of MR without the use of RF or microwaves, e.g. force-detected MR, thermally detected MR, MR detection via electrical conductivity, optically detected MR
Definitions
- Enzyme linked immunosorbent assay has been an industry wide standard research technique used for measuring protein analytes from biological matrices since its introduction in the 1960s.
- two antibodies immunoglobulins
- the resulting immunocomplex is identified and measured using an enzyme and reporter buffer.
- the enzyme is typically bound to one of the antibodies through covalent binding.
- the enzyme when incubated in the presence of the reporter buffer, converts the substrate to a functional reporter which can be measured analytically by spectrophotometric means.
- Single-bead-based ELISAs have one antibody that is bound to a solid surface, typically a bead, and the second antibody is labeled with biotin.
- the capture bead contains material that allows it to be easily manipulated by an applied magnetic field, including separating the bead and any analytes bound to the bead from a sample suspension. This process, called magnetic separation, is well known in the art and may be used to concentrate the target analyte and to remove unbound material such as unwanted proteins that may contribute to signal background.
- magnetic separation is well known in the art and may be used to concentrate the target analyte and to remove unbound material such as unwanted proteins that may contribute to signal background.
- single-bead-based ELISAs can provide improved sensitivity to target analytes with lower background and in a shorter amount of time.
- Various embodiments disclosed herein relate to methods and apparatus for detecting a complex including an analyte in a sample by observing complexes containing two or more distinguishable beads (i.e ., beads of different types) that are bound by the analyte.
- a bead-based magnetic assay system for detecting a complex including an analyte based on optically detected magnetic resonance (ODMR) includes a plurality of functionalized beads of a first type, which are magnetic functionalized beads and are functionalized to include a first moiety that associates with an analyte under suitable conditions, a plurality of functionalized beads of a second type, which are functionalized to include a second moiety that associates with the analyte under suitable conditions, a substrate including at least one ODMR center, a light source configured to generate incident light that excites electrons within the at least one ODMR center from a ground state to an excited state, a magnet for applying a bias magnetic field on a complex disposed over the at least one ODMR center, the complex including one of the first type of functionalized bead, the analyte, and one of the second type of functionalized bead.
- ODMR optically detected magnetic resonance
- the system further includes a microwave source configured to generate a microwave field incident on the at least one ODMR center, the microwave source being further configured to generate the microwave field with frequencies that correspond to ground state transitions in the at least one ODMR center, in which the at least one ODMR center produces emitted light when illuminated by the incident light, characteristics of the emitted light being influenced by the microwave field and by the magnetic functionalized bead associated with the analyte in the complex, and an optical photodetector that detects light emitted by the at least one ODMR center.
- the at least one ODMR center can be a silicon vacancy center in a silicon carbide lattice.
- the at least one ODMR center can be a silicon vacancy center in a diamond lattice. In still other embodiments, the at least one ODMR center can be a nitrogen-vacancy center in a diamond lattice. In certain embodiments, the at least one ODMR center can be formed in an upper surface of the substrate. In some embodiments, the at least one ODMR center can be a plurality of ODMR centers formed in the upper surface of the substrate. In these embodiments, the optical photodetector can be an optical imaging system having an imaging sensor that images the emitted light from the plurality of ODMR centers. In certain embodiments, each of the first and the second moiety can be a receptor, protein, antibody, cell, virus, or nucleic acid sequence.
- the functionalized beads of the first type can be superparamagnetic functionalized beads including a superparamagnetic material.
- the functionalized beads of the first type can include a nonmagnetic layer encapsulating the superparamagnetic material.
- the superparamagnetic functionalized beads can include iron oxide particles.
- the functionalized beads of the first type can comprise magnetic nanoparticles disposed within a polymer substrate.
- the functionalized beads of the first type can comprise magnetic nanoparticles disposed on a surface of a polymer substrate.
- the functionalized beads of the second type can be fluorescent functionalized beads.
- the functionalized beads of the second type can be magnetic functionalized beads including a quantity of magnetic material distinguishable from the functionalized beads of the first type.
- the functionalized beads of the second type can be magnetic functionalized beads, the second type of functionalized beads including a magnetic property distinguishable from the functionalized beads of the first type.
- the functionalized beads of the first type can be superparamagnetic functionalized beads including a superparamagnetic material.
- the functionalized beads of the first type can include a nonmagnetic layer encapsulating the superparamagnetic material.
- the functionalized beads of the second type can be ferromagnetic functionalized beads including a ferromagnetic material.
- the functionalized beads of the second type can include a nonmagnetic layer encapsulating the ferromagnetic material.
- each of the first type of functionalized beads and the second type of functionalized beads can have a diameter in a range of between 50 nm and 10 ⁇ m.
- each of the diameters of the functionalized beads of the first type and the second type can be in a range of between 0.5 ⁇ m and 5 ⁇ m.
- the diameter of the functionalized beads of the first type can be similar to the diameter of the functionalized beads of the second type.
- the diameter of the functionalized beads of the first type can be different from the diameter of the functionalized beads of the second type by at least 50%.
- the system can further include a plurality of functionalized beads of at least a third type, functionalized to include at least the second moiety that associates with at least a second analyte under suitable conditions.
- the system can further include a plurality of functionalized beads of a fourth type, functionalized to include the second moiety that associates with the second analyte under suitable conditions.
- the functionalized beads of the first and/or second type can further include at least one additional moiety that associates with the second analyte under suitable conditions.
- the system can further include a third moiety that associates with a third analyte under suitable conditions, wherein the functionalized beads of the first type are further functionalized to include the second moiety, and the functionalized beads of the second type are further functionalized to include the third moiety.
- a method of detecting a complex including an analyte includes contacting a sample in a solution with a population of functionalized beads of a first type, which are magnetic functionalized beads and are functionalized to include a first moiety that associates with an analyte under suitable conditions, contacting the sample solution with a population of functionalized beads of a second type, which are functionalized to include a second moiety that associates with the analyte under suitable conditions, contact resulting in formation of a complex including one of the first type of functionalized bead, the analyte, and one of the second type of functionalized bead, and detecting the complex including the analyte by detecting magnetic fields produced by the magnetic functionalized bead and by detecting the functionalized bead of the second type associated with the analyte in the complex.
- the method can further include disposing the sample solution including the complex over a substrate that includes at least one optically detected magnetic resonance (ODMR) center formed in the substrate, exciting electrons within the at least one ODMR center from a ground state to an excited state with incident light, applying a bias magnetic field on the complex, and generating a microwave field incident on the at least one ODMR center, the microwave field including frequencies that correspond to ground state transitions in the at least one ODMR center, wherein detecting the complex including the analyte further includes analyzing light emitted by the at least one ODMR center, characteristics of the emitted light being influenced by the microwave field and by the magnetic functionalized bead associated with the analyte in the complex.
- ODMR optically detected magnetic resonance
- the at least one ODMR center can be a nitrogen-vacancy center in a diamond lattice. In certain embodiments, the at least one ODMR center can be formed in an upper surface of the substrate. In some embodiments, the at least one ODMR center can be a plurality of ODMR centers formed in the upper surface of the substrate. In these embodiments, analyzing light emitted by the plurality of ODMR centers includes imaging the emitted light. In certain embodiments, the method can further include applying a magnetic field gradient to the sample solution after contacting the sample with the population of functionalized beads of the first type. In some embodiments, applying the magnetic field gradient to the sample solution can be performed after contacting the sample solution with the population of functionalized beads of the second type.
- the population of functionalized beads of the first type and the population of functionalized beads of the second type can be added to the sample solution sequentially.
- the functionalized beads of the second type can be fluorescent functionalized beads, and the method can further include illuminating the complex with incident light that excites fluorescence within the functionalized beads of the second type and fluorescence imaging of the complex.
- the functionalized beads of the second type can be magnetic functionalized beads, including a magnetic property distinguishable from the functionalized beads of the first type.
- the method can further include applying a magnetic field gradient to the sample solution after contacting the sample solution with the functionalized beads of the first and second types.
- the method can further include varying the magnetic field gradient applied to the sample solution.
- the method can further include concentrating the sample solution after contacting the sample solution with the population of functionalized beads of the second type. In certain embodiments, the method can further include agglomerating a plurality of functionalized beads of the first and second types, after contacting the sample solution with the population of functionalized beads of the second type, before detecting the complex. In some embodiments, the method can further include dehydrating the sample solution after disposing the sample solution over the diamond substrate.
- a bead-based assay system for detecting a complex including an analyte includes a plurality of functionalized beads of a first type, which are magnetic functionalized beads and are functionalized to include a first moiety that associates with an analyte under suitable conditions, a plurality of functionalized beads of a second type, which are fluorescent functionalized beads, and are functionalized to include an unlabeled moiety that associates with the analyte under suitable conditions, a light source configured to generate incident light that excites fluorescence within the functionalized beads of the second type, and an optical fluorescence detector that detects fluorescence emitted by the functionalized beads of the second type associated with the analyte in a complex including one of the first type of functionalized bead, the analyte, and one of the second type of functionalized bead.
- the fluorescent functionalized beads can comprise a polymer substrate impregnated with a fluorescent material.
- the optical fluorescence detector can include a spectrophotometer.
- the optical fluorescence detector can include an optical imaging sensor that images the fluorescence emitted by the functionalized beads of the second type associated with the analyte in the complex.
- the functionalized beads of the first type can be superparamagnetic functionalized beads.
- the superparamagnetic functionalized beads can include iron oxide particles.
- the functionalized beads of the first type can include magnetic nanoparticles disposed within the polymer substrate.
- the functionalized beads of the first type can include magnetic nanoparticles disposed on a surface of the polymer substrate.
- a method of detecting a complex including an analyte includes contacting a sample in a solution with a population of functionalized beads of a first type, which are magnetic functionalized beads and are functionalized to include a first moiety that associates with an analyte under suitable conditions, contacting the sample solution with a population of functionalized beads of a second type, which comprise a polymer substrate impregnated with a fluorescent material, and are functionalized to include an unlabeled moiety that associates with the analyte under suitable conditions, contact resulting in formation of a complex including one of the first type of functionalized bead, the analyte, and one of the second type of functionalized bead, illuminating the complex with incident light that excites fluorescence within the functionalized beads of the second type, and detecting the complex including the analyte by analyzing fluorescence emitted by the functionalized beads of the second type associated with the analyte in the complex.
- the method can further include applying a magnetic field gradient to the sample solution after contacting the sample with the population of functionalized beads of the first type. In certain embodiments, applying the magnetic field gradient to the sample solution can be performed after contacting the sample solution with the population of functionalized beads of the second type. In some embodiments, the method can further include concentrating the sample solution after contacting the sample solution with the population of functionalized beads of the second type, before detecting the complex. In certain embodiments, the method can further include agglomerating a plurality of functionalized beads of the first and second types, after contacting the sample solution with the population of functionalized beads of the second type, before detecting the complex. In some embodiments, the method can further include dehydrating the sample solution before detecting the complex.
- Magnetic multi-bead assays improve upon bead-based ELISAs by detecting target analytes bound in complexes, such as immunocomplexes. By combining the convenience and simplicity of magnetic separation with robust and sensitive detection of beads, magnetic multi-bead assays provide excellent sensitivity with a simple, rapid process.
- various embodiments disclosed herein relate to methods and apparatus for detecting a complex including an analyte in a sample by observing complexes containing two or more distinguishable beads (i.e., beads of different types) that are bound by the analyte.
- At least one of the bead types is magnetic and can be concentrated in a liquid suspension by means of magnetic forces exerted with an applied magnetic field.
- a fully-magnetic assay may also be implemented by using diamond magnetic imaging to distinguish between magnetic bead types with distinct magnetic properties.
- wide-field magnetic imaging using nitrogen-vacancy (NV) centers in diamond can be used to provide a platform on which to implement a multi-bead assay that is fully magnetic, eliminating the need to detect fluorescence from the sample.
- Magnetic beads provide strong, stable signals by means of the magnetic fields they produce, which permeate through biological sample matrices and contaminants and allow for unambiguous detection. Magnetic beads can further be manipulated to accelerate assay kinetics and enable rapid sample preparation with minimal hardware.
- the fully magnetic assay can be deployed with a small-footprint instrument and low reagent volumes, delivering rapid assay results at low cost.
- Magnetic multi-bead assays make use of distinct bead types to determine analyte concentration in a sample by detecting the formation of bead complexes that are bound by the analyte.
- One bead type has magnetic properties that allow for separation of beads and bound material from a suspension of beads in liquid with the application of a magnetic field gradient. This process, called magnetic separation, is commonly used to isolate or concentrate target analytes, including cells, proteins, and nucleic acids.
- the sensitivity of the magnetic multi-bead assay stems in part from three features:
- the analyte must bind to at least two distinguishable beads to form a complex, so that the presence of both beads can be detected.
- the beads may be coated with binding ligands, herein also denoted as moieties, such as antibodies, that bind specifically to and thereby associate with a certain region of a certain target analyte.
- binding ligands herein also denoted as moieties, such as antibodies, that bind specifically to and thereby associate with a certain region of a certain target analyte.
- Each bead in the multi-bead assay may be coated with one or more different types of binding ligands. Different bead types used in the multi-bead assay may have the same binding ligand types, overlapping sets of binding ligand types, or distinct binding ligand types.
- bead A and bead B are coated with antibodies, with antibody X on bead A and antibody Y on bead B.
- Antibody X binds specifically to a different region of the target analyte than antibody Y so that the target analyte may be bound to both simultaneously.
- the complex such as an immunocomplex
- the complex may be formed under suitable conditions, such as by incubating the sample with a suspension of bead A and bead B.
- Target analytes in the sample will encounter a bead surface as they diffuse through the sample, and bind to it.
- the sample may be mixed, shaken, or otherwise agitated to accelerate this process.
- the beads As the beads also move through the sample, they will encounter analytes bound to beads of the opposite type and will additionally bind to those analytes, forming heterogeneous bead complexes of the form A-B, A-B-A, B-A-B, and other combinations.
- the beads and bead complexes are then concentrated together by magnetic separation.
- a magnetic field gradient is applied that exerts a magnetic force on bead A. Any bead A and bead complex containing bead A will be separated from the sample.
- bead B may also be magnetic and experience a similar magnetic force, forming a "pellet" of magnetic material and bound analytes. Unbound sample components, referred to here as "background material,” will not be separated and therefore may be discarded with the supernatant above the pellet.
- the magnetic gradient may then be removed and the beads may be re-suspended in the same or different buffer solution. This process may be repeated to reduce the concentration of background material. Magnetic separation may be performed by hand or automated with a commercial plate washer.
- complex formation can also be performed in discrete steps, which may reduce signal background caused by nonspecific binding of beads into complexes in the absence of the target analyte.
- Bead A may first be added to the sample to capture the target analyte, followed by magnetic separation to reduce the concentration of background material.
- Bead B can then be added separately to this purified sample. Whether bead A and bead B are added together or sequentially will be determined empirically and will depend on the antibodies utilized and whether nonspecific binding is significantly reduced using sequential binding steps.
- bead B is less magnetic than bead A, or nonmagnetic
- magnetic separation may be used after forming complexes to reduce signal background associated with unbound bead B.
- a less-magnetic bead B will be separated from the sample suspension more slowly than bead A, so that magnetic separation can be terminated at a point at which bead A has been suitably separated into a pellet while the separation of bead B remains incomplete. If at this point the supernatant above the pellet is discarded, a significant fraction of bead B will be removed, but bead A will be preserved, including complexes containing bead A.
- the diameters of bead A and bead B may be in a range of between 50 nm and 10 ⁇ m, such as between 0.5 ⁇ m and 5 ⁇ m.
- Bead A and bead B may be chosen to have different diameters, such that the diameter of the functionalized beads of the first type is different from the diameter of the functionalized beads of the second type by at least 50%, so that the two bead types may be distinguished by the spatial distribution of their respective magnetic field signals.
- bead A and bead B may be chosen to have similar diameters, that is, diameters different by less than 50%, so that they exhibit similar surface area, move similarly in the liquid sample suspension, occupy a similar amount of space in the detection region, and provide similar signal magnitudes.
- Bead diameters in the range of 0.5 ⁇ m to 5 ⁇ m may allow for rapid magnetic separation (in a matter of seconds) and a large quantity of binding ligands on each bead.
- bead diameters in this range are similar to or slightly larger than the typical diffraction-limited imaging resolution of an optical microscope or wide-field diamond magnetic imaging system.
- the measurement of complexes containing the analyte can be calibrated with a range of calibration samples of known analyte concentration so that a given measurement of complexes implies a certain analyte concentration.
- the measurements of the range of calibration samples is collectively referred to as a calibration curve. Detection of complexes, by the methods and apparatus described herein, enables measuring analyte concentration in combination with a calibration curve.
- Example A1 Magnetic-fluorescent assay with plate reader
- Suitable superparamagnetic materials include, for example, iron oxide, Fe 2 O 3 or Fe 3 O 4 , manganese ferrites (MnFe 2 O 4 ), or cobalt ferrites (CoFe 2 O 4 ), in the form of single crystal nanoparticles less than about 20 nm in size, typically in a range of between 5 nm and 10 nm.
- the magnetic nanoparticles are engineered to be small enough that they exhibit no remanent magnetization in the absence of an applied field (superparamagnetism). When a field is applied, the particles magnetize in the direction of the field, producing a bead magnetization sufficient for magnetic separation.
- Bead B to be a fluorescent functionalized bead including a polymer substrate impregnated with fluorescent material.
- Bead B is nonmagnetic, such that unbound bead B is left behind during magnetic separation.
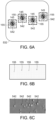
- a bead-based assay system 100 for detecting a complex including an analyte includes, as shown in FIG. 1A , a plurality of functionalized beads 110 of a first type (bead A), which are magnetic functionalized beads and are functionalized to include a first moiety X 115 that associates with an analyte 120 under suitable conditions, a plurality of functionalized beads 130 of a second type (bead B), which are fluorescent functionalized beads, and are functionalized to include an unlabeled moiety Y 135 that associates with the analyte 120 under suitable conditions, and, as shown in FIG.
- an optical photodetector 140 that detects light 155 emitted by the functionalized beads 130 of the second type associated with the analyte 120 in a complex 145, shown in FIG. 1B , including the first type of functionalized bead 110, the analyte 120, and the second type of functionalized bead 130.
- the optical photodetector 140 is a spectrophotometer 140 that detects fluorescence 155 emitted by the functionalized beads 130 of the second type that fluoresce when illuminated by light from a filtered lamp 150.
- Each of the first 115 and second 135 moiety can be a receptor, protein, antibody, cell (eukaryotic or prokaryotic), organelle, virus, or nucleic acid sequence.
- the second moiety 135 is unlabeled, that is, not labeled with a fluorophore.
- the fluorescent functionalized beads can comprise a polymer substrate impregnated with a fluorescent material.
- fluorophores are sensitive to light, temperature, pH, salt and other environmental conditions associated with biological assays. As such, the fluorophores impregnated into the bead are sheltered and protected from the chemical environment, which results in brighter and more robust detection. Fourth, for fluorophores to be conjugated or covalently bound to surface attached moieties, they must undergo a chemical reaction that can alter the state of the fluorophore (such as its 3D structure, charge, polarity) that can negatively affect the function of the fluorophore.
- the magnetic multi-bead assay is performed as described below. After complex formation, a magnetic separation step or series of repeated steps is used to reduce the unbound bead B population. After magnetic separation, the continued presence of bead B indicates successful binding of the target analyte both to bead A and to bead B - otherwise either the analyte or bead B or both would likely have been discarded during magnetic separation. Detecting bead B in the sample suspension is therefore sufficient to establish co-presence of both beads in complexes.
- a method 200 of detecting a complex including an analyte includes contacting 210 a sample in a solution with a population of magnetic functionalized beads of a first type, contacting 220 the sample solution with a population of fluorescent functionalized beads of a second type, illuminating 230 the complex with incident light that excites fluorescence within the functionalized beads of the second type, and detecting 240 the complex including the analyte by analyzing the fluorescence.
- the sample suspension may be analyzed using a fluorescent plate reader or similar device that uses a spectrophotometer to optically excite and measure fluorescence from each plate well.
- the suspension may be transferred to low-fluorescence black plates prior to measurement to reduce signal background produced by the plate. While it is possible that the reactions could be performed in the black plates originally, reactions may be more efficiently performed in roundbottom plates that may be unavailable in black plastic.
- bead B fluorescence may be both induced and recorded through optical band pass filters. A titration of bead B and a well containing no bead B may be separately measured to calibrate the observed fluorescence signal to a known bead concentration under similar buffer conditions.
- fluorescent plate readers can be configured with standard excitation and emission filters, dichroic or band pass filters, and proper gain settings or photo multiplier tube (PMT) adjustments to satisfactorily depress autofluorescence of sample buffer and amplify true fluorescent signal from the ensemble fluorescent beads.
- the wavelength of measured fluorescence will depend upon the choice of fluorophore incorporated into the bead. It should be noted that low fluorophore concentration or weak fluorophores may depress the fluorescent signal and reduce the sensitivity of the assay.
- prostate specific antigen As shown in FIG. 1D , prostate specific antigen (PSA) as low as 0.1 pg/mL can be measured with little optimization of the plate reader conditions. As few as 250 fluorescent beads can be measured at the minimum signal level, considered to be the fluorescence measurement background mean plus triple its standard deviation. Longer read times, changes in photomultiplier tube (PMT) gain settings, or adjustments in the scanned region of each well all may contribute to improved sensitivity. Optimization of these parameters depends upon the features of any given plate reader.
- PSA prostate specific antigen
- Example B2 Magnetic-fluorescent assay with fluorescence imaging
- Example A1 Consider bead A and bead B to be of the same types described in Example A1 above. Further consider that, as in Example A1, a final magnetic separation step or series of steps is performed to reduce the concentration of bead B.
- bead B fluorescence may be measured by fluorescence imaging rather than with a spectrophotometer.
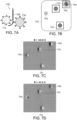
- the sample suspension or a portion of it may be dispersed on a microscope slide 305.
- bead B fluorescence may be imaged by a microscopy system onto a camera sensor 340 through an optical band pass filter 348 that blocks the excitation light from the filtered lamp 150.
- individual beads may be resolved, identified, and counted (as illustrated in FIG. 3B ).
- the total number of beads B counted in the image provides a measurement of the number of analytes present in the sample, since the observation of bead B fluorescence 155 implies co-presence of both bead A and bead B bound to the target analyte in the complex 145.
- Fluorescence imaging may provide an improvement in sensitivity above the plate reader measurement described above in Example A1. This improvement arises from the ability to reject confounding signals, including:
- Rejecting false signals allows for a lower signal background, as shown in FIG. 3C , where the imager 340 yields a lower signal level for the same PSA concentration as compared to the plate reader 140, and a correspondingly improved sensitivity to low complex concentrations that result from low analyte concentrations.
- Imaging of bead B may be performed with a liquid sample suspension, such as a droplet on a microscope slide under a coverslip, or after drying a representative droplet of the liquid sample. After drying, fluorescent bead B remains bright and no longer moves under diffusion or due to flow of the sample on the slide, which enables longer exposure times and lower excitation light intensity.
- the buffer solution is chosen to preserve immunocomplexes against dissociation during drying, to disperse beads relatively uniformly over the dried region, and to avoid leaving solute crystals or other residue that may impede imaging.
- Example C3 Magnetic-fluorescent assay with magnetic and fluorescence imaging
- Example A1 Consider bead A and bead B to be of the same types described in Example A1 above. Further consider that, as in Example A1, a final magnetic separation step or series of steps is performed to reduce the concentration of bead B and that bead B is counted by imaging the sample with a fluorescence microscopy system.
- a method 400 of detecting a complex including an analyte includes contacting 410 a sample in a solution with a population of magnetic functionalized beads of a first type, contacting 420 the sample solution with a population of functionalized beads of a second type, and detecting 430 the complex including the analyte by detecting magnetic fields produced by the magnetic functionalized bead and by detecting the functionalized bead of the second type associated with the analyte in the complex.
- detecting magnetic fields includes using any magnetic imaging technology, such as magnetic force microscopy or a scanning Hall probe.
- detecting the functionalized beads of the second type includes detecting fluorescence as described in Examples A1 or B2 above.
- the microscopy system may include a wide-field diamond magnetic imaging system that allows for imaging of bead A, which is superparamagnetic.
- Wide-field diamond magnetic imaging with nitrogen-vacancy (NV) centers in diamond is capable of rapidly imaging magnetic fields disposed over the surface of a diamond sensor, at room temperature, with sub-micron resolution.
- Magnetic images may be co-registered to conventional optical fluorescence or bright-field images acquired for the same field of view with the same imaging system. Adjustments to the imaging system may be made between magnetic and optical imaging to optimize performance, such as changing optical filters or correcting focal position.
- a bead-based magnetic assay system 500 for detecting a complex including an analyte based on optically detected magnetic resonance (ODMR) includes, as shown in FIG. 1A and described above, a plurality of functionalized beads 110 of a first type, which are magnetic functionalized beads and are functionalized to include a first moiety 115 that associates with an analyte 120 under suitable conditions, a plurality of functionalized beads 130 of a second type, which are functionalized to include a second moiety 135 that associates with the analyte 120 under suitable conditions, and, as shown in FIG. 5 , a substrate 532 including at least one ODMR center 540 (a plurality of ODMR centers 540 shown in FIG.
- ODMR optically detected magnetic resonance
- a light source 536 configured to generate incident light that excites electrons within the at least one ODMR center 540 from a ground state to an excited state, a magnet 534 for applying a bias magnetic field on a complex 530 disposed over the at least one ODMR center 540, the complex 530 including one of the first type of functionalized bead 110, the analyte 120, and one of the second type of functionalized bead 130, and a microwave source 538 configured to generate a microwave field incident on the at least one ODMR center 540, the microwave source 538 being further configured to generate the microwave field with frequencies that correspond to ground state transitions in the at least one ODMR center 540, in which the at least one ODMR center 540 produces emitted light 542 when illuminated by the incident light 536, characteristics of the emitted light 542 being influenced by the microwave field and by the magnetic functionalized bead 110 associated with the analyte 120 in the complex 330.
- the plurality of ODMR centers 540 are nitrogen-vacancy (NV) centers in a diamond lattice, formed in an upper surface of the diamond substrate 532.
- the plurality of ODMR centers can be silicon-vacancy centers in a silicon carbide lattice, or in a diamond lattice.
- fluorescence 542 emitted from a thin layer of ODMR centers 540 near the surface of the diamond substrate 532 is imaged onto an optical photodetector array 544, that is an optical imaging system having an imaging sensor such as a charge-coupled device (CCD) or complementary metal oxide semiconductor (CMOS) camera.
- CCD charge-coupled device
- CMOS complementary metal oxide semiconductor
- the variation of ODMR center fluorescence under microwave excitation reveals the ODMR electron spin resonance (ESR) frequency, and hence the magnetic field shift of the ODMR spin sublevels.
- ESR electron spin resonance
- the spatial structure of the magnetic field at the diamond surface created by the sample (i.e., complex) 530 can thus be determined from images of ODMR center fluorescence 542, whose characteristics are influenced by the microwave field and by the magnetic field created by the magnetic functionalized bead 110 associated with the analyte 120 in the complex 530.
- An applied magnetic field induces magnetization in bead A and an associated magnetic field from the bead.
- a magnetic field in the range of 0.5 to 10 mT which may be generated with permanent magnets or an electromagnet, is sufficient to resolve features in the electron spin resonance spectrum of the diamond imaging sensor.
- the diamond magnetic imager images these bead fields directly, allowing for individual bead detection and location. Beads of similar composition and magnetization produce similar magnetic field patterns that may be identified as characteristic features 542 in a magnetic image corresponding to the location of each bead A.
- a representative image is shown in FIG. 6C .
- An image processing algorithm may identify the locations both of bead A features 542 in the magnetic image, shown in FIG. 6C , and bead B features 155 in the fluorescence image shown in FIG. 6B . Additional images may be acquired in either detection channel (magnetic or fluorescent) to improve signal fidelity. The resulting bead locations identified in each detection channel may then be compared to identify co-presence of both bead types, and hence of complexes 145 containing the target analyte, illustrated in FIG. 6A .
- Adding the magnetic imaging channel to detect bead A in addition to detecting bead B in the bead fluorescence channel allows for identification of unbound bead B, which may persist after magnetic separation or which may dissociate from bead complexes that are weakly bound by nonspecific interactions. Unbound bead B may be rejected during analysis so that only bead B associated with complexes are counted.
- Example D4 Fully magnetic assay with magnetic imaging
- bead A 710 and bead B 730 are both magnetic, but with distinguishable magnetic properties. Magnetic imaging with single-bead spatial resolution is used to identify bead A 710, as in Example C3, and also to identify bead B 730, distinguishing between the two. Bead A 710 has magnetic properties suitable for magnetic separation, as in Examples A1, B2, and C3 described above.
- Beads A 710 and B 730 may, for example, differ in the shape and magnitude of their single-axis magnetization curves, which describe bead magnetization as a function of an applied magnetizing field. Beads A 710 and B 730 may differ in the degree of hysteresis in their magnetization curves and in properties such as remanent magnetization and coercivity. Beads A 710 and B 730 may have different degrees of asymmetry, with different magnetization curves observed when the field axis is changed. Beads A 710 and B 730 may respond differently to a time-varying magnetic field, such as an alternating or rotating field.
- magnetic imaging for identifying and locating bead A 710, bead B 730, and complexes 745 including the analyte 720 enables elimination of the optical fluorescence detection channel, simplifying the assay system significantly. Additionally, magnetic imaging is particularly insensitive to signal backgrounds due to unwanted light, detector noise, and sample contaminants that fluoresce, scatter, or absorb light. Magnetic signal backgrounds are extremely low in biological samples and they do not impede the ability to measure even modestly magnetic beads.
- Wide-field diamond magnetic imaging provides a means to directly image the vector magnetic field produced by a magnetic bead under a wide range of magnetic conditions.
- This general-purpose tool may be used to distinguish between magnetic bead types over a wide range of different properties.
- bead A 710 and bead B 730 are distinguished by measuring magnetic susceptibility and magnetic remanence at low applied field after first magnetizing the beads with a large magnetic field.
- Bead A 710 is superparamagnetic.
- bead A 710 may be composed of superparamagnetic iron oxide nanoparticles 5-10 nm in size dispersed within a spherical polymer substrate approximately 1 ⁇ m in diameter.
- Bead A 710 may contain a quantity of iron oxide such that the magnitude of the average induced magnetization of bead A 710 with an applied bias field of 4 mT is approximately 3 ⁇ 10 -15 A m 2 .
- Bead B 730 is ferromagnetic.
- bead B 730 may be composed of ferromagnetic cobalt ferrite nanoparticles 30 nm in size dispersed over the surface of a spherical polymer substrate approximately 1 ⁇ m in diameter and adhered to the surface with an additional polymer layer.
- Bead B 730 has a remanent magnetization fraction of greater than 50%, such that, after being magnetized in a field of at least 300 mT and once the magnetizing field has been removed, bead B 730 retains a large proportion of its saturated magnetization value.
- Bead B 730 may contain a quantity of cobalt ferrite such that the magnitude of the average remanent magnetization of bead B 730 after the magnetizing field is removed is approximately 2 ⁇ 10 -15 A m 2 .
- a magnetic imaging procedure is described below for identifying complexes 745 containing the target analyte 720, bead A 710 and bead B 730.
- complexes 745 After forming complexes 745 in a sample suspension, a representative portion of the sample is disposed over and dried on the surface 732, shown in FIG. 7B , of a diamond magnetic imaging sensor shown in FIG. 5 .
- the sensor's imaging surface is a ⁇ 100 ⁇ face and this surface contains a thin layer approximately 1- ⁇ m thick that is rich in nitrogen-vacancy (NV) centers.
- NV nitrogen-vacancy
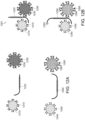
- FIGS. 7B-7D after magnetic imaging, complexes 745 are identified by identifying bead A 710 and bead B 730 in close proximity to one another, including close enough to be spatially unresolved in the images.
- a magnetizing field Prior to magnetic imaging, a magnetizing field is applied in a direction normal to the horizontal diamond surface.
- a field of greater than 200 mT applied for a period of several seconds is sufficient to magnetize the magnetic material in bead B.
- the dried sample is then magnetically imaged twice with a bias magnetic field of 4 mT applied parallel to one crystal axis of the diamond sensor, which is oriented at an angle of approximately 35 degrees with respect to the imaging surface.
- the 4 mT imaging field is reversed between acquiring the two magnetic images, shown in FIGS. 7C and 7D , termed the positive ( FIG. 7C ) and negative ( FIG. 7D ) images, denoting the +4 mT and -4 mT imaging fields, respectively.
- the magnetic images measure the projection of the sample magnetic field vector onto the axis of the imaging field.
- bead A 710 is superparamagnetic, the greater than 200 mT magnetizing field does not leave bead A 710 with significant remanent magnetization. In both the positive and negative images, the magnetization of bead A is only that which is induced in the superparamagnetic beads by the 4 mT imaging field. Bead A 710 produces the same feature 741 in both magnetic images, since the bead A 710 magnetization is in both cases parallel to the imaging field.
- bead B 730 strongly magnetized in the vertical direction, oriented up with respect to the horizontal diamond sensor imaging surface.
- the weaker 4 mT imaging field does not significantly change the magnetization of bead B 730, since the magnetic susceptibility of bead B 730 near zero magnetic field, when previously magnetized along the same axis, is low. Therefore, bead B 730 produces an image feature 742 that inverts sign between the positive and negative magnetic images, with positive magnetic field projection changing to negative and vice versa, as illustrated in FIGS. 7B, 7C, and 7D .
- Bead complexes 745 will be assigned magnetization values that reflect the complex composition.
- bead dimers of the form A-A or B-B will generally be assigned larger values with the same sign of bead A or bead B monomers, respectively.
- Bead dimers 745 of the form A-B or larger heterogeneous bead complexes will be assigned values of smaller magnitude in the negative image than in the positive image, reflecting oppositely-magnetized beads within the complex, as shown in FIGS. 7C and 7D .
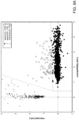
- All magnetic objects in the magnetic images may be represented on a scatter plot whose axes are the sum and difference, respectively, of the positive and negative image magnetization values. This sum and difference may also be termed the susceptibility and remanence of the single-bead magnetization curve, as they are approximately proportional to these properties.
- a scatter plot whose axes are the sum and difference, respectively, of the positive and negative image magnetization values. This sum and difference may also be termed the susceptibility and remanence of the single-bead magnetization curve, as they are approximately proportional to these properties.
- bead A and bead complexes containing only bead A will be clustered near one axis, with large susceptibility and zero remanence; bead B and bead complexes containing only bead B will be clustered near the other axis, with large remanence and near-zero susceptibility.
- the complex may be identified by separately identifying beads within the complex and determining their spatial separation to be consistent with that of a bound complex, and not significantly greater than the bead diameters.
- A-B dimers may form even in the absence of the target analyte, due to attractive magnetic interactions. These magnetic interactions may be limited in strength by limiting the amount of magnetic material in each bead. Magnetic bead signals may be measured even in cases in which magnetic interactions between beads are too weak to overcome forces associated with Brownian motion or sample mixing, so that magnetic interactions may play no role.
- the magnetic material within bead A and bead B may be composed of nanoparticles disposed within or on the surface of a polymer or other nonmagnetic substrate. If the nanoparticles are uniformly disposed within or on the surface of the substrate, then the strength of magnetic interactions between beads can be reduced relative to having aggregated nanoparticles, since magnetic fields near aggregated magnetic nanoparticles may be stronger. Using nanoparticles that are much smaller than the substrate radius may allow for more uniform distribution, relative to larger nanoparticles that produce stronger local magnetic fields.
- Magnetic interactions may also be suppressed by adding a nonmagnetic layer encapsulating the magnetic material.
- Suitable materials for the nonmagnetic layer include polymers, such as polyethylene (PE), polytetrafluoroethylene (PTFE), and polymethylmethacrylate (PMMA). Since magnetic interactions weaken rapidly with increasing separation between beads, even a nonmagnetic layer significantly thinner than the original bead radius can dramatically reduce dimer formation due to magnetic interactions.
- the magnetic image signal for a magnetic bead can be analyzed to determine the magnetic moment (magnetization ⁇ volume) of the bead, assuming knowledge of the bead size and a spherically symmetric distribution of magnetic material in the bead.
- the magnetic moment can be used to distinguish between bead A, bead B, and bead complexes.
- there must be low enough variation of magnetic moment, size, and spherical symmetry of each bead such that each measurement can be clearly associated with one distribution.
- the A-B complex having larger size than each individual bead, may not produce a signal equal to the sum of signals from bead A and bead B. Nevertheless, the bead A and bead B magnetic moments may still be chosen such that the mean A-B complex signal is distinct from that of bead A, bead B, the A-A complex, the B-B complex, etc. It is not necessary to resolve spatial differences between candidate signals to discriminate them by magnetic moment; it is sufficient to evaluate each signal only by magnitude, e.g. magnitude of convolution with a characteristic image signal.
- bead A and B have different size
- a similar discrimination approach may be used that ignores this size difference when evaluating the magnitude of candidate signals and applies the same single-parameter quantification strategy to all signals. This may produce signals for bead A, bead B and complexes that are not proportional to their magnetic moments, but are distinct and allow for accurate discrimination.
- Magnetic particles may exhibit an anisotropic response to a magnetic field, due to preferential magnetization along certain crystal axes in a single magnetic domain or along certain directions in a multi-domain particle or a composite magnetic bead containing many particles.
- Rod-shaped nanoparticles typically can be magnetized more easily along the rod axis. Synthesizing a spherical bead containing oriented magnetic nanorods would produce an anisotropic magnetic susceptibility in the bead.
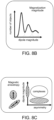
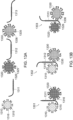
- the magnetic anisotropy of a bead can be probed by imaging immobilized beads multiple times, using multiple directions of an applied magnetic field. As shown in FIG. 8C , a metric for magnetic anisotropy can be constructed from the difference in magnetic signals obtained from the different orientations. Imaging at three distinct directions is sufficient to determine the orientation and degree of anisotropy for a particle even if the particle orientation is not known in advance. If bead A and bead B have zero and nonzero magnetic anisotropy, respectively, then images acquired with the imaging magnetic field rotated in different directions will produce identical signals for bead A, but different signals for bead B. Complex signals will have nonzero anisotropy, but less than that of bead B.
- magnetized ferromagnetic beads can be re-magnetized in a different direction by applying a field larger than the coercivity.
- Discrimination between two types of ferromagnetic beads, bead A and bead B can be achieved using this sequence: (1) first magnetize both beads with a strong magnetic field in one direction; (2) image the bead magnetization; (3) apply a magnetic field in the opposite direction that is strong enough to reverse the magnetization of bead A, but not strong enough to reverse the magnetization of bead B; (4) image the magnetic bead signals and compare them to those in the first image.
- Bead A signals will reverse direction; bead B signals will change modestly, if at all; complex signals will change significantly in magnitude as one bead in the complex reverses magnetization while the other does not.
- magnetic particles change their magnetization direction in response to a change in magnetic field direction.
- the time scale for a particle to change direction may depend on the particle composition and size and may vary over a wide range from below 1 ⁇ s to well over 1 s. If an oscillating or rotating AC magnetic field of constant amplitude is applied to the particle, the particle magnetization will oscillate in response.
- An oscillating magnetization may be measured by a magnetic imaging technology that is sensitive to AC magnetic fields, such as a wide-field ODMR center magnetic imaging system that employs pulsed optical excitation of ODMR centers or timegated camera exposures.
- the magnitude of the oscillating magnetization will decrease as the oscillation period decreases below the time scale required for the particle to change magnetization direction.
- the cutoff frequency is defined as the oscillation frequency corresponding to this change in response.
- bead A and bead B contain magnetic material with different cutoff frequencies
- measuring the oscillating magnetization at multiple oscillation frequencies provides a method to discriminate between the beads. If bead A has a high cutoff frequency compared to bead B, then imaging at an intermediate frequency will observe a weak bead B signal compared to imaging at a low frequency, but little change in the bead A signal.
- a complex will exhibit a decrease in signal at the intermediate frequency that is smaller than that of bead B. Discrimination can be improved by adding additional images at additional frequencies. While bead A and bead B will have a single cutoff frequency, the complex will exhibit two cutoff frequencies. Signals obtained at low oscillation frequency and at two or more intermediate frequencies will reveal qualitatively different behavior for bead A, bead B, and complexes.
- the magnetization M of a superparamagnetic particle saturates with sufficiently high magnetic field H. Even at field strengths below saturation, the magnetic susceptibility (slope of the magnetization curve) is reduced. If the magnetizations of superparamagnetic bead A and bead B saturate at different field strengths H 1 and H 2 , then the beads may be distinguished by imaging at two magnetic field strengths, one of which is large enough to observe a change in magnetic susceptibility in one of the beads. The ratio of signals in these two images will be significantly different for bead A and bead B. Complexes will have an intermediate ratio distinct from that of bead A or bead B.
- Magnetic beads of different size, but similar composition may produce magnetic image signals that are distinguishable by their spatial scale. This may allow for discrimination between bead A, bead B, and complexes, despite bead A and bead B having nominally identical magnetic properties.
- FIG. 9 is an image of two beads, approximately 1 micron (top) and 3 microns (bottom) in diameter, with their centers spaced approximately 9 microns apart.
- the larger bead produces a magnetic signal with broader spatial features. In this case, the larger bead also contains more magnetic material and produces a larger magnitude of signal, but this need not be the case.
- spatial scale of magnetic image signals may be used not only to discriminate between the two, but also to identify A-B complexes. Complexes have spatially broad signals that also contain shorter-scale spatial components.
- One method for identifying complexes is to first identify all broad signals (including both bead B and complex signals) and then subtract a characteristic bead B signal (such as the mean of many bead B signals imaged separately) from each. Variations in imaging accuracy and in the uniformity of bead B magnetization will cause this difference to be nonzero for bead B signals, however the difference will generally have broad spatial scale. For the complex signals, however, subtracting the characteristic bead B signal will leave behind the sharper bead A signal. These cases may be distinguished by spatial filtering of the signal differences.
- FIGS. 10A-1, 10B-1, and 10C-1 show example bead B images.
- the difference signal images after subtracting the characteristic bead B signal shown in 10A-2, 10B-2, and 10C-2 have a gray scale amplified by a factor of 2.
- FIGS. 11A-1, 11B-1, and 11C-1 show example complex images, showing sharp bead A signals circled in the difference images shown in 11A-2, 11B-2, and 11C-2, which are again amplified by a factor of 2 relative to the image signals.
- bead discrimination approaches described herein may also be used in combination to enhance discrimination performance or to discriminate between more than two bead types and their combinations.
- the number of complexes present within an imaging field of view after disposing the sample over the imaging sensor may vary due to differences in the manner in which the sample was disposed.
- the sample may be disposed over the sensor by adding a liquid droplet to the sensor surface and allowing it to dry, such that variations in the droplet volume or its initial contact area with the sensor lead to variations in bead complex density in the dried sample over the sensor surface.
- the sample density variations may be measured and accounted for.
- Dividing the number of complexes by the number of bead A yields a quantity that is less sensitive to variations in sample density, and thus may provide a more precise measurement of the total number of bead complexes in the sample and of the analyte concentration determined from a calibration curve obtained as described above.
- immunoassays must allow time for target analytes in a liquid sample to bind to antibodies that enable detection of the target analytes.
- reagent concentration and sample conditions such as temperature, viscosity, and process for agitating or mixing the sample
- several minutes may be required for most analytes to become bound, even when there is a large excess of binding sites available, due to the time needed for the analyte to move through the sample by diffusion or active shaking or stirring.
- the rate of interactions between different beads in the sample suspension may determine multi-bead assay speed, since bead diffusion is generally slower than diffusion of smaller molecular analytes. Since a beadbound target analyte may also occupy a relatively small fraction of the bead's surface area, when the bead to which the analyte is bound interacts with a second bead, the analyte may not be exposed to the second bead in a manner conducive for binding (e.g., the interaction occurs on the side of the first bead opposite to where the analyte is located). Several bead interactions may be required on average to form an immunocomplex.
- the multi-bead assay time may be shortened by performing processes to induce bead-bead interactions that lead to immunocomplex formation, accelerating bead kinetics beyond what may be expected for diffusion or stirring alone.
- bead-bead interactions may be induced by agglomerating a plurality of functionalized beads of the first and second types, after contacting the sample solution with the population of functionalized beads of the second type, before detecting the complex, by means of spinning the sample suspension on a centrifuge to concentrate the beads into a pellet in the sample tube.
- This process can be performed in less than a minute with standard benchtop centrifuge systems. Beads in the pellet may be closely spaced or in contact with one another, resulting in many bead interactions in the pellet. The pellet may be re-suspended by mixing the suspension. This centrifuge process may be repeated as necessary to ensure sufficient interactions between beads to form immunocomplexes containing the target analyte.
- both bead A and bead B are magnetic
- magnetic separation may be used to form a pellet of beads in the sample suspension and induce bead-bead interactions by applying a magnetic field gradient to the sample solution after contacting the sample solution with the functionalized beads of the first and second types.
- this magnetic approach to accelerating bead kinetics can be performed in less than a minute and repeated as necessary to form immunocomplexes containing the target analyte.
- the magnetic approach may be performed with permanent magnets for a simple, inexpensive, and compact process with minimal power consumption.
- An electromagnet may also be used to apply the magnetic field with no moving parts.
- a bead pellet produced by magnetic separation of a sample suspension can be agitated without removing the magnetic field, but by varying or otherwise changing the magnetic field gradient applied to the sample solution with respect to the beads.
- the field magnitude, direction, or spatial distribution may be changed or oscillated to apply different magnetic forces on the beads.
- the sample tube may be moved with respect to the magnetic field. For example, rotating the tube may move the pellet away from its equilibrium position so that the pellet will be dragged by the magnetic field gradient to a new position. These changes will cause beads in the pellet to move with respect to each other and may induce additional bead interactions and immunocomplex formation.
- a permanent magnet may be moved relative to a tube containing a sample suspension with magnetic beads of multiple types.
- the magnet may follow a fixed pattern of motion.
- Exemplary cases include the magnet orbiting the sample tube in a circle, rotating on its own axis, or rocking back and forth between two points.
- the motion may be continuous, in which case the bead pellet will continuously move through the tube, subjecting the beads to shear forces from the liquid, tube walls, and other beads. This motion and the associated forces on the beads will agitate the pellet continuously to drive bead-bead interactions.
- the motion may occur in discrete periods separated by periods of rest, in which the bead pellet may concentrate to a higher bead density than is achieved during continuous motion. If the different bead types respond significantly differently to the field of the permanent magnet, then the periods of rest will allow the multiple bead types to co-localize more effectively than during continuous motion.
- a plurality of permanent magnets may be moved relative to a plurality of samples in separate wells of a plate, such that the sample in each well is subjected to a magnetic field profile in time and space that is substantially similar. This approach allows for driving bead-bead interactions in parallel over a plurality of samples for improved sample preparation throughput.
- Accelerating bead kinetics and the rate of bead-bead interactions in sample suspension decreases the time required to bind target analytes into detectable multi-bead complexes. This method enables a rapid assay.
- This method may also allow for a lower quantity of binding ligands to be used on the bead surfaces, since the likelihood of a given ligand to bind to the target analyte may be increased by the increased frequency of bead-bead interactions. Using fewer binding ligands may reduce the cost of the assay significantly.
- a multiplexed assay measures distinct target analytes by associating a distinct signal with each target, so that the analyte signals may be distinguished in the assay measurement.
- the magnetic dual-bead assay may be generalized to a multiplexed multi-bead assay by using more than two distinguishable bead types. Different analytes may be specifically detected by observing the formation of analyte-specific complexes including a plurality of functionalized beads of at least a third type, functionalized to include at least a third moiety that can specifically associate with at least a second analyte under appropriate conditions.
- FIGS. 12A and 12B consider a plurality of functionalized beads of the third type 1240 functionalized to include at least a third moiety 1245 that associates with the second analyte 1250 under suitable conditions, and a plurality of functionalized beads of a fourth type 1260, functionalized to include a fourth moiety 1265 that associates with the second analyte 1250 under suitable conditions, resulting in four distinguishable bead types: bead A 1210, bead B 1230, bead C 1240, and bead D 1260.
- Complexes of the form A-B 1201 or C-D 1202 may be formed through binding of two distinct analytes, first analyte X 1220 and second analyte Y 1250, to moieties coating each bead.
- bead A 1210 and bead B 1230 are coated with moieties 1215 and 1235, respectively, targeting two distinct regions X1 and X2 of analyte X 1220;
- bead C 1240 and bead D 1260 are coated with moieties 1245 and 1265, respectively, targeting two distinct regions Y1 and Y2 of analyte Y 1250.
- the moieties on each bead are unique to that bead.
- the A-B 1201 and C-D 1202 complexes may be distinguished from each other and from the monomer beads from their distinct magnetic properties.
- FIGS. 13A and 13B consider three distinguishable bead types: bead A 1310, bead B 1320, and bead C 1330.
- Complexes of the form A-B 1301, B-C 1302, or A-C 1303 may be formed through binding of three distinct analytes, analyte X 1311, analyte Y 1312, and analyte Z 1313, to moieties coating each bead.
- the functionalized beads of the first type A 1310 further include at least one additional moiety 1316 that associates with the second analyte 1312 under suitable conditions.
- the functionalized beads of the second type B 1320 further include a moiety 1326 that associates with the third analyte Z 1313 under suitable conditions.
- the functionalized beads of the third type C 1330 are functionalized to include a moiety 1335 and a moiety 1336, and therefore each bead is coated with two distinct moiety types targeting two different analytes: bead A 1310 is coated with moieties for analyte X 1315 and for analyte Y 1316; bead B 1320 is coated with moieties for analyte X 1325 and for analyte Z 1326; bead C 1330 is coated with moieties for analyte Y 1335 and for analyte Z 1336.
- the moieties on each bead are unique to that bead.
- the A-B 1301, B-C 1302, and A-C 1303 complexes may be distinguished from each other and from the monomer beads from their distinct magnetic properties.
- Multiplexed assays must have a means of discriminating between signals associated with distinct target analytes, which in the case of multiplexed bead assays means that the beads must be distinguishable.
- Bead fluorescence may be used to discriminate between bead types with different excitation and/or emission spectra. For example, three bead types may emit blue, yellow, or red fluorescence that may be distinguished using optical filters. Different bead types may also be prepared to fluoresce with different intensities, so that the different types may be distinguished in a fluorescence image by discrete levels of brightness, where difference between the levels exceeds variation within the distribution of each bead type.
- Distinct magnetic bead types may be distinguished by preparing bead types with different magnetic properties that can be distinguished by magnetic imaging.
- the distinct bead types may be prepared by loading each bead type with specific and distinguishable quantities of magnetic material.
- distinct bead types may be prepared by loading each bead type with different magnetic material exhibiting different properties.
- the fully magnetic multi-bead assay described above discriminates between two bead types in this manner.
- a multiplexed assay may be implemented by adding additional distinguishable beads using distinct combinations of the properties described above.
- bead A may be superparamagnetic, while bead B and C are ferromagnetic with different coercivities derived from bead B and bead C comprising different ferromagnetic materials.
- the beads may be distinguished by measuring magnetic remanence after magnetization, and then also measuring whether this remanence is reversed upon application of a demagnetizing field that exceeds the coercivity of bead B, but not that of bead C.
- the three beads in this case may be used to implement a multiplexed assay for three analytes using an embodiment described above.
- sample preparation for the multi-bead assay is to combine a few drops of blood with the multi-bead mixture, incubate for a few minutes with accelerated kinetic mixing and deposit the sample solution on the diamond surface to dry followed by magnetic imaging.
- the sample solution can be partially or completely dehydrated before detecting the complex.
- a suitable sample preparation proceeds as follows: plasma or serum is diluted in assay buffer 10-fold by adding 5 ⁇ L sample into 45 ⁇ L assay buffer and briefly vortex mixed. This diluted sample is further diluted 2x with 50 ⁇ L of bead mix for a final of 100 ⁇ L.
- the bead mix includes ⁇ 100,000 capture beads and ⁇ 100,000 detector beads.
- the final assay reaction is 20-fold dilution of sample in 100 ⁇ L.
- the assay reaction is incubated with vortex mixing (800 rpm) for 15 minutes at room temperature.
- the samples are then placed in a centrifuge and spun at 1500 g for 3 minutes, followed by pulse vortex mixing.
- the centrifugation and mixing cycle is repeated twice more, after which the sample is placed against a permanent magnet (magnetic field ⁇ 300 mT) for 30 seconds to pellet the magnetic beads against the sidewall of the reaction tube.
- the assay volume is removed by pipette leaving the bead pellet intact on the side wall against the magnet.
- the tube is removed from the magnet and the pellet is suspended in 500 ⁇ L of wash buffer by vortex mixing.
- the tube is pulse spun at 1500 g for 3 seconds to remove fluid from the cap, and placed on the magnet for 30 seconds.
- the wash cycle is repeated 2 more times for a total of 3 washes.
- the pellet is washed 1 time with 200 ⁇ L of imaging buffer and finally suspended in ⁇ 4 ⁇ L imaging buffer. ⁇ 2 ⁇ L is applied to the diamond sensor for magnetic imaging.
- the sample may be any chemical or biological sample, such as whole blood, blood components (plasma, serum), tissue culture, cell culture, bodily fluids (cerebral spinal fluid (CSF), tears, saliva, breast milk, urine, semen, nasal discharge), tissue samples (oral swabs, biopsies, surgical resections), recombinant DNA, RNA or protein, endogenous DNA, RNA or protein, synthetic nucleic acids or protein peptides.
- sample requirements may include volumes of sample types from 0.1 ⁇ L to 1000 ⁇ L.
- sample requirements may include dilution of sample types and volume into assay buffers. Dilutions of sample types may include dilution by a factor of 10-1,000. Assay buffers may be determined empirically for optimized signal generation and minimized non-specific background, or false binding of any kind.
- Samples may be combined in various ways including, for example, with multi-bead mixtures in blood collection tubes, assay tubes, assay plates/wells, microfluidic devices, reaction chambers, incubation chambers, lateral flow devices, blood component separation devices, or other liquid handling or manipulation devices.
- Samples may be mixed in various ways including, for example, by magnetic fields, centrifugal force, gravity, sound induced, light induced, electric induced, ionic interactions, van der Waals induced, Brownian motion, spinning, or other mechanical means.
- Samples may be mixed with multi-bead mixtures for times necessary to capture targets of interest ranging from, for example, a second to several hours.
- Samples may be introduced to the magnetic imaging device in various ways including, for example, by pipette, capillary flow tube or device, sample handling device, liquid handling device, integrated device, lateral flow device, disposable or reusable device.
- Samples may be deposited on the diamond surface by several modes of application including, for example, pipetting, pouring, dripping, capillary flow, pumping, gravity induced flow, magnetic induced flow, ionic induced flow, sound induced flow, light induced flow, mechanical vibration induced flow, sheath flow, centrifuge induced, and thermal induced flow.
- Samples may be magnetically imaged in a dry, dehydrated (i.e., partially dry or gel), or wet state.
Description
- This application claims priority from
U.S. Provisional Patent Application No. 62/438,593 filed on December 23, 2016 - Enzyme linked immunosorbent assay (ELISA) has been an industry wide standard research technique used for measuring protein analytes from biological matrices since its introduction in the 1960s. In its basic conception, two antibodies (immunoglobulins) are used to capture a single protein analyte. The resulting immunocomplex is identified and measured using an enzyme and reporter buffer. The enzyme is typically bound to one of the antibodies through covalent binding. The enzyme, when incubated in the presence of the reporter buffer, converts the substrate to a functional reporter which can be measured analytically by spectrophotometric means.
- Current state of the art ELISA-related technologies are replacing the plate-based format with a single-bead-based format. Single-bead-based ELISAs have one antibody that is bound to a solid surface, typically a bead, and the second antibody is labeled with biotin. The capture bead contains material that allows it to be easily manipulated by an applied magnetic field, including separating the bead and any analytes bound to the bead from a sample suspension. This process, called magnetic separation, is well known in the art and may be used to concentrate the target analyte and to remove unbound material such as unwanted proteins that may contribute to signal background. Compared to traditional ELISAs, single-bead-based ELISAs can provide improved sensitivity to target analytes with lower background and in a shorter amount of time.
- Nevertheless, there is a need for continuing improvement in sensitivity and specificity to target analytes.
- Various embodiments disclosed herein relate to methods and apparatus for detecting a complex including an analyte in a sample by observing complexes containing two or more distinguishable beads (i.e., beads of different types) that are bound by the analyte. In accordance with one or more embodiments, a bead-based magnetic assay system for detecting a complex including an analyte based on optically detected magnetic resonance (ODMR) includes a plurality of functionalized beads of a first type, which are magnetic functionalized beads and are functionalized to include a first moiety that associates with an analyte under suitable conditions, a plurality of functionalized beads of a second type, which are functionalized to include a second moiety that associates with the analyte under suitable conditions, a substrate including at least one ODMR center, a light source configured to generate incident light that excites electrons within the at least one ODMR center from a ground state to an excited state, a magnet for applying a bias magnetic field on a complex disposed over the at least one ODMR center, the complex including one of the first type of functionalized bead, the analyte, and one of the second type of functionalized bead. The system further includes a microwave source configured to generate a microwave field incident on the at least one ODMR center, the microwave source being further configured to generate the microwave field with frequencies that correspond to ground state transitions in the at least one ODMR center, in which the at least one ODMR center produces emitted light when illuminated by the incident light, characteristics of the emitted light being influenced by the microwave field and by the magnetic functionalized bead associated with the analyte in the complex, and an optical photodetector that detects light emitted by the at least one ODMR center. In some embodiments, the at least one ODMR center can be a silicon vacancy center in a silicon carbide lattice. In other embodiments, the at least one ODMR center can be a silicon vacancy center in a diamond lattice. In still other embodiments, the at least one ODMR center can be a nitrogen-vacancy center in a diamond lattice. In certain embodiments, the at least one ODMR center can be formed in an upper surface of the substrate. In some embodiments, the at least one ODMR center can be a plurality of ODMR centers formed in the upper surface of the substrate. In these embodiments, the optical photodetector can be an optical imaging system having an imaging sensor that images the emitted light from the plurality of ODMR centers. In certain embodiments, each of the first and the second moiety can be a receptor, protein, antibody, cell, virus, or nucleic acid sequence. In some embodiments, the functionalized beads of the first type can be superparamagnetic functionalized beads including a superparamagnetic material. In certain embodiments, the functionalized beads of the first type can include a nonmagnetic layer encapsulating the superparamagnetic material. In some embodiments, the superparamagnetic functionalized beads can include iron oxide particles. In certain embodiments, the functionalized beads of the first type can comprise magnetic nanoparticles disposed within a polymer substrate. In other embodiments, the functionalized beads of the first type can comprise magnetic nanoparticles disposed on a surface of a polymer substrate. In some embodiments, the functionalized beads of the second type can be fluorescent functionalized beads. In other embodiments, the functionalized beads of the second type can be magnetic functionalized beads including a quantity of magnetic material distinguishable from the functionalized beads of the first type. In still other embodiments, the functionalized beads of the second type can be magnetic functionalized beads, the second type of functionalized beads including a magnetic property distinguishable from the functionalized beads of the first type. In some embodiments, the functionalized beads of the first type can be superparamagnetic functionalized beads including a superparamagnetic material. In certain embodiments, the functionalized beads of the first type can include a nonmagnetic layer encapsulating the superparamagnetic material. In some embodiments, the functionalized beads of the second type can be ferromagnetic functionalized beads including a ferromagnetic material. In certain embodiments, the functionalized beads of the second type can include a nonmagnetic layer encapsulating the ferromagnetic material. In some embodiments, each of the first type of functionalized beads and the second type of functionalized beads can have a diameter in a range of between 50 nm and 10 µm. In certain embodiments, each of the diameters of the functionalized beads of the first type and the second type can be in a range of between 0.5 µm and 5 µm. In some embodiments, the diameter of the functionalized beads of the first type can be similar to the diameter of the functionalized beads of the second type. In other embodiments, the diameter of the functionalized beads of the first type can be different from the diameter of the functionalized beads of the second type by at least 50%. In some embodiments, the system can further include a plurality of functionalized beads of at least a third type, functionalized to include at least the second moiety that associates with at least a second analyte under suitable conditions. In certain embodiments, the system can further include a plurality of functionalized beads of a fourth type, functionalized to include the second moiety that associates with the second analyte under suitable conditions. In some embodiments, the functionalized beads of the first and/or second type can further include at least one additional moiety that associates with the second analyte under suitable conditions. In certain embodiments, the system can further include a third moiety that associates with a third analyte under suitable conditions, wherein the functionalized beads of the first type are further functionalized to include the second moiety, and the functionalized beads of the second type are further functionalized to include the third moiety.
- In accordance with one or more embodiments, a method of detecting a complex including an analyte includes contacting a sample in a solution with a population of functionalized beads of a first type, which are magnetic functionalized beads and are functionalized to include a first moiety that associates with an analyte under suitable conditions, contacting the sample solution with a population of functionalized beads of a second type, which are functionalized to include a second moiety that associates with the analyte under suitable conditions, contact resulting in formation of a complex including one of the first type of functionalized bead, the analyte, and one of the second type of functionalized bead, and detecting the complex including the analyte by detecting magnetic fields produced by the magnetic functionalized bead and by detecting the functionalized bead of the second type associated with the analyte in the complex. In some embodiments, the method can further include disposing the sample solution including the complex over a substrate that includes at least one optically detected magnetic resonance (ODMR) center formed in the substrate, exciting electrons within the at least one ODMR center from a ground state to an excited state with incident light, applying a bias magnetic field on the complex, and generating a microwave field incident on the at least one ODMR center, the microwave field including frequencies that correspond to ground state transitions in the at least one ODMR center, wherein detecting the complex including the analyte further includes analyzing light emitted by the at least one ODMR center, characteristics of the emitted light being influenced by the microwave field and by the magnetic functionalized bead associated with the analyte in the complex. In some embodiments, the at least one ODMR center can be a nitrogen-vacancy center in a diamond lattice. In certain embodiments, the at least one ODMR center can be formed in an upper surface of the substrate. In some embodiments, the at least one ODMR center can be a plurality of ODMR centers formed in the upper surface of the substrate. In these embodiments, analyzing light emitted by the plurality of ODMR centers includes imaging the emitted light. In certain embodiments, the method can further include applying a magnetic field gradient to the sample solution after contacting the sample with the population of functionalized beads of the first type. In some embodiments, applying the magnetic field gradient to the sample solution can be performed after contacting the sample solution with the population of functionalized beads of the second type. In certain embodiments, the population of functionalized beads of the first type and the population of functionalized beads of the second type can be added to the sample solution sequentially. In some embodiments, the functionalized beads of the second type can be fluorescent functionalized beads, and the method can further include illuminating the complex with incident light that excites fluorescence within the functionalized beads of the second type and fluorescence imaging of the complex. In other embodiments, the functionalized beads of the second type can be magnetic functionalized beads, including a magnetic property distinguishable from the functionalized beads of the first type. In some embodiments, the method can further include applying a magnetic field gradient to the sample solution after contacting the sample solution with the functionalized beads of the first and second types. In certain embodiments, the method can further include varying the magnetic field gradient applied to the sample solution. In some embodiments, the method can further include concentrating the sample solution after contacting the sample solution with the population of functionalized beads of the second type. In certain embodiments, the method can further include agglomerating a plurality of functionalized beads of the first and second types, after contacting the sample solution with the population of functionalized beads of the second type, before detecting the complex. In some embodiments, the method can further include dehydrating the sample solution after disposing the sample solution over the diamond substrate.
- In accordance with one or more embodiments, a bead-based assay system for detecting a complex including an analyte includes a plurality of functionalized beads of a first type, which are magnetic functionalized beads and are functionalized to include a first moiety that associates with an analyte under suitable conditions, a plurality of functionalized beads of a second type, which are fluorescent functionalized beads, and are functionalized to include an unlabeled moiety that associates with the analyte under suitable conditions, a light source configured to generate incident light that excites fluorescence within the functionalized beads of the second type, and an optical fluorescence detector that detects fluorescence emitted by the functionalized beads of the second type associated with the analyte in a complex including one of the first type of functionalized bead, the analyte, and one of the second type of functionalized bead. In certain embodiments, the fluorescent functionalized beads can comprise a polymer substrate impregnated with a fluorescent material. In some embodiments, the optical fluorescence detector can include a spectrophotometer. In other embodiments, the optical fluorescence detector can include an optical imaging sensor that images the fluorescence emitted by the functionalized beads of the second type associated with the analyte in the complex. In some embodiments, the functionalized beads of the first type can be superparamagnetic functionalized beads. In certain embodiments, the superparamagnetic functionalized beads can include iron oxide particles. In some embodiments, the functionalized beads of the first type can include magnetic nanoparticles disposed within the polymer substrate. In other embodiments, the functionalized beads of the first type can include magnetic nanoparticles disposed on a surface of the polymer substrate.
- In accordance with one or more embodiments, a method of detecting a complex including an analyte includes contacting a sample in a solution with a population of functionalized beads of a first type, which are magnetic functionalized beads and are functionalized to include a first moiety that associates with an analyte under suitable conditions, contacting the sample solution with a population of functionalized beads of a second type, which comprise a polymer substrate impregnated with a fluorescent material, and are functionalized to include an unlabeled moiety that associates with the analyte under suitable conditions, contact resulting in formation of a complex including one of the first type of functionalized bead, the analyte, and one of the second type of functionalized bead, illuminating the complex with incident light that excites fluorescence within the functionalized beads of the second type, and detecting the complex including the analyte by analyzing fluorescence emitted by the functionalized beads of the second type associated with the analyte in the complex. In some embodiments, the method can further include applying a magnetic field gradient to the sample solution after contacting the sample with the population of functionalized beads of the first type. In certain embodiments, applying the magnetic field gradient to the sample solution can be performed after contacting the sample solution with the population of functionalized beads of the second type. In some embodiments, the method can further include concentrating the sample solution after contacting the sample solution with the population of functionalized beads of the second type, before detecting the complex. In certain embodiments, the method can further include agglomerating a plurality of functionalized beads of the first and second types, after contacting the sample solution with the population of functionalized beads of the second type, before detecting the complex. In some embodiments, the method can further include dehydrating the sample solution before detecting the complex.
- Magnetic multi-bead assays improve upon bead-based ELISAs by detecting target analytes bound in complexes, such as immunocomplexes. By combining the convenience and simplicity of magnetic separation with robust and sensitive detection of beads, magnetic multi-bead assays provide excellent sensitivity with a simple, rapid process.
- The foregoing will be apparent from the following more particular description of example embodiments, as illustrated in the accompanying drawings in which like reference characters refer to the same parts throughout the different views. The drawings are not necessarily to scale, emphasis instead being placed upon illustrating embodiments.
-
FIG. 1A schematically illustrates a functionalized bead of a first type, a first moiety, a functionalized bead of a second type, a second moiety, and an analyte in accordance with one or more embodiments. -
FIG. 1B schematically illustrates a complex that includes one of a functionalized bead of a first type, a first moiety, one of a functionalized bead of a second type, a second moiety, and an analyte in accordance with one or more embodiments. -
FIG. 1C schematically illustrates a bead-based assay system for detecting a complex including a spectrophotometer that detects fluorescence emitted by the functionalized beads of the second type in accordance with one or more embodiments. -
FIG. 1D illustrates a plot of relative fluorescence units (RFU) as a function of PSA (pM) in accordance with one or more embodiments. -
FIG. 2 illustrates a method of detecting a complex including an analyte in accordance with one or more embodiments. -
FIG. 3A schematically illustrates a bead-based assay system for detecting a complex including an optical imaging sensor that images fluorescence emitted by the functionalized beads of the second type in accordance with one or more embodiments. -
FIG. 3B illustrates a fluorescence image in accordance with one or more embodiments. -
FIG. 3C illustrates a plot of signal as a function of PSA concentration (pM) in accordance with one or more embodiments. -
FIG. 4 illustrates another method of detecting a complex including an analyte in accordance with one or more embodiments. -
FIG. 5 schematically illustrates a wide-field diamond magnetic imaging apparatus in accordance with one or more embodiments. -
FIG. 6A schematically illustrates several complexes including magnetic beads and fluorescent beads in accordance with one or more embodiments. -
FIG. 6B illustrates a fluorescence image of the complexes shown inFIG. 6A in accordance with one or more embodiments. -
FIG. 6C illustrates a magnetic image of the complexes shown inFIG. 6A in accordance with one or more embodiments. -
FIG. 7A schematically illustrates a complex that includes a magnetic functionalized bead of a first type, a magnetic functionalized bead of a second type, and an analyte in accordance with one or more embodiments. -
FIG. 7B schematically illustrates a complex including magnetic beads of the first and second types in accordance with one or more embodiments. -
FIG. 7C illustrates a positive magnetic image of the magnetic beads shown inFIG. 7B in accordance with one or more embodiments. -
FIG. 7D illustrates a negative magnetic image of the magnetic beads shown inFIG. 7B in accordance with one or more embodiments. -
FIG. 8A illustrates magnetic bead discrimination based on remanence and susceptibility in accordance with one or more embodiments. -
FIG. 8B illustrates magnetic bead discrimination based on magnetization magnitude in accordance with one or more embodiments. -
FIG. 8C illustrates magnetic bead discrimination based on magnetic anisotropy in accordance with one or more embodiments. -
FIG. 8D illustrates magnetic bead discrimination based on magnetic coercivity in accordance with one or more embodiments. -
FIG. 8E illustrates magnetic bead discrimination based on AC magnetic response in accordance with one or more embodiments. -
FIG. 8F illustrates magnetic bead discrimination based on magnetic saturation in accordance with one or more embodiments. -
FIG. 9 illustrates a magnetic image of two beads of different sizes in accordance with one or more embodiments. -
FIGS. 10A-1, 10B-1, and 10C-1 illustrate magnetic images of the image signal of three beads B in accordance with one or more embodiments. -
FIGS. 10A-2, 10B-2, and 10C-2 illustrate magnetic images of the difference signal after subtracting the characteristic signal of three beads B in accordance with one or more embodiments. -
FIGS. 11A-1, 11B-1, and 11C-1 illustrate magnetic images of the image signal of three dimers of beads A and B in accordance with one or more embodiments. -
FIGS. 11A-2, 11B-2, and 11C-2 illustrate magnetic images of the difference signal of three dimers beads A and B after subtracting the characteristic bead B signal in accordance with one or more embodiments. -
FIG. 12A schematically illustrates a multiplexed assay including four distinguishable bead types in accordance with one or more embodiments. -
FIG. 12B schematically illustrates complexes including four distinguishable bead types in accordance with one or more embodiments. -
FIG. 13A schematically illustrates a multiplexed assay including three distinguishable bead types in accordance with one or more embodiments. -
FIG. 13B schematically illustrates complexes including three distinguishable bead types in accordance with one or more embodiments. - As stated above, various embodiments disclosed herein relate to methods and apparatus for detecting a complex including an analyte in a sample by observing complexes containing two or more distinguishable beads (i.e., beads of different types) that are bound by the analyte. At least one of the bead types is magnetic and can be concentrated in a liquid suspension by means of magnetic forces exerted with an applied magnetic field. A fully-magnetic assay may also be implemented by using diamond magnetic imaging to distinguish between magnetic bead types with distinct magnetic properties.
- In accordance with one or more embodiments, wide-field magnetic imaging using nitrogen-vacancy (NV) centers in diamond can be used to provide a platform on which to implement a multi-bead assay that is fully magnetic, eliminating the need to detect fluorescence from the sample. Magnetic beads provide strong, stable signals by means of the magnetic fields they produce, which permeate through biological sample matrices and contaminants and allow for unambiguous detection. Magnetic beads can further be manipulated to accelerate assay kinetics and enable rapid sample preparation with minimal hardware. The fully magnetic assay can be deployed with a small-footprint instrument and low reagent volumes, delivering rapid assay results at low cost.
- Magnetic multi-bead assays make use of distinct bead types to determine analyte concentration in a sample by detecting the formation of bead complexes that are bound by the analyte. One bead type has magnetic properties that allow for separation of beads and bound material from a suspension of beads in liquid with the application of a magnetic field gradient. This process, called magnetic separation, is commonly used to isolate or concentrate target analytes, including cells, proteins, and nucleic acids.
- The sensitivity of the magnetic multi-bead assay stems in part from three features:
- (1) The assay measures co-presence of at least two distinguishable beads, such that detection of the target analyte only results from the analyte binding to at least two distinct antibodies on at least two distinguishable bead types. This assay provides enhanced target specificity through the combined specificity of multiple antibodies, which in turn provides better sensitivity.
- (2) Confounding effects, such as signal backgrounds, caused by sample components other than the target analyte can be reduced or eliminated by purifying the sample using magnetic separation.
- (3) Beads can be detected rapidly and with high accuracy and precision. Bead signals can be stronger and more stable and can be detected more quickly than signals from molecular reporters including fluorescent dyes and fluorescent products of enzymatic activity.
- To measure a target analyte in a multi-bead assay, the analyte must bind to at least two distinguishable beads to form a complex, so that the presence of both beads can be detected. The beads may be coated with binding ligands, herein also denoted as moieties, such as antibodies, that bind specifically to and thereby associate with a certain region of a certain target analyte. Each bead in the multi-bead assay may be coated with one or more different types of binding ligands. Different bead types used in the multi-bead assay may have the same binding ligand types, overlapping sets of binding ligand types, or distinct binding ligand types. In the simplest case, two distinct bead types are used - hereafter denoted bead A and bead B. (In other embodiments, three or more distinct bead types can be used.) In the two-bead example, bead A and bead B are coated with antibodies, with antibody X on bead A and antibody Y on bead B. Antibody X binds specifically to a different region of the target analyte than antibody Y so that the target analyte may be bound to both simultaneously.
- The complex, such as an immunocomplex, may be formed under suitable conditions, such as by incubating the sample with a suspension of bead A and bead B. Target analytes in the sample will encounter a bead surface as they diffuse through the sample, and bind to it. The sample may be mixed, shaken, or otherwise agitated to accelerate this process. As the beads also move through the sample, they will encounter analytes bound to beads of the opposite type and will additionally bind to those analytes, forming heterogeneous bead complexes of the form A-B, A-B-A, B-A-B, and other combinations.
- The beads and bead complexes are then concentrated together by magnetic separation. First, a magnetic field gradient is applied that exerts a magnetic force on bead A. Any bead A and bead complex containing bead A will be separated from the sample. In some embodiments, bead B may also be magnetic and experience a similar magnetic force, forming a "pellet" of magnetic material and bound analytes. Unbound sample components, referred to here as "background material," will not be separated and therefore may be discarded with the supernatant above the pellet. The magnetic gradient may then be removed and the beads may be re-suspended in the same or different buffer solution. This process may be repeated to reduce the concentration of background material. Magnetic separation may be performed by hand or automated with a commercial plate washer.
- Alternately, complex formation can also be performed in discrete steps, which may reduce signal background caused by nonspecific binding of beads into complexes in the absence of the target analyte. Bead A may first be added to the sample to capture the target analyte, followed by magnetic separation to reduce the concentration of background material. Bead B can then be added separately to this purified sample. Whether bead A and bead B are added together or sequentially will be determined empirically and will depend on the antibodies utilized and whether nonspecific binding is significantly reduced using sequential binding steps.
- If bead B is less magnetic than bead A, or nonmagnetic, then magnetic separation may be used after forming complexes to reduce signal background associated with unbound bead B. For example, a less-magnetic bead B will be separated from the sample suspension more slowly than bead A, so that magnetic separation can be terminated at a point at which bead A has been suitably separated into a pellet while the separation of bead B remains incomplete. If at this point the supernatant above the pellet is discarded, a significant fraction of bead B will be removed, but bead A will be preserved, including complexes containing bead A.
- In accordance with one or more embodiments, the diameters of bead A and bead B may be in a range of between 50 nm and 10 µm, such as between 0.5 µm and 5 µm. Bead A and bead B may be chosen to have different diameters, such that the diameter of the functionalized beads of the first type is different from the diameter of the functionalized beads of the second type by at least 50%, so that the two bead types may be distinguished by the spatial distribution of their respective magnetic field signals. Alternatively bead A and bead B may be chosen to have similar diameters, that is, diameters different by less than 50%, so that they exhibit similar surface area, move similarly in the liquid sample suspension, occupy a similar amount of space in the detection region, and provide similar signal magnitudes. Bead diameters in the range of 0.5 µm to 5 µm may allow for rapid magnetic separation (in a matter of seconds) and a large quantity of binding ligands on each bead. In addition, bead diameters in this range are similar to or slightly larger than the typical diffraction-limited imaging resolution of an optical microscope or wide-field diamond magnetic imaging system.
- Once complexes, such as immunocomplexes, have been formed (heterogeneous bead complexes containing bead A and bead B bound by the analyte), they are measured by detecting the co-presence of both bead types. Several methods of detecting the co-presence of both bead types that can be implemented to achieve this goal are described further below.
- The measurement of complexes containing the analyte can be calibrated with a range of calibration samples of known analyte concentration so that a given measurement of complexes implies a certain analyte concentration. The measurements of the range of calibration samples is collectively referred to as a calibration curve. Detection of complexes, by the methods and apparatus described herein, enables measuring analyte concentration in combination with a calibration curve.
- Consider bead A to be superparamagnetic, composed of magnetic nanoparticles of a superparamagnetic material dispersed within or on the surface of a polymer substrate. Suitable superparamagnetic materials include, for example, iron oxide, Fe2O3 or Fe3O4, manganese ferrites (MnFe2O4), or cobalt ferrites (CoFe2O4), in the form of single crystal nanoparticles less than about 20 nm in size, typically in a range of between 5 nm and 10 nm. The magnetic nanoparticles are engineered to be small enough that they exhibit no remanent magnetization in the absence of an applied field (superparamagnetism). When a field is applied, the particles magnetize in the direction of the field, producing a bead magnetization sufficient for magnetic separation.
- Consider bead B to be a fluorescent functionalized bead including a polymer substrate impregnated with fluorescent material. Bead B is nonmagnetic, such that unbound bead B is left behind during magnetic separation.
- As shown in
FIGS. 1A-1C , a bead-basedassay system 100 for detecting a complex including an analyte, shown inFIG. 1C , includes, as shown inFIG. 1A , a plurality offunctionalized beads 110 of a first type (bead A), which are magnetic functionalized beads and are functionalized to include afirst moiety X 115 that associates with ananalyte 120 under suitable conditions, a plurality offunctionalized beads 130 of a second type (bead B), which are fluorescent functionalized beads, and are functionalized to include anunlabeled moiety Y 135 that associates with theanalyte 120 under suitable conditions, and, as shown inFIG. 1C , anoptical photodetector 140 that detects light 155 emitted by the functionalizedbeads 130 of the second type associated with theanalyte 120 in a complex 145, shown inFIG. 1B , including the first type offunctionalized bead 110, theanalyte 120, and the second type offunctionalized bead 130. As shown inFIG. 1C , theoptical photodetector 140 is aspectrophotometer 140 that detectsfluorescence 155 emitted by the functionalizedbeads 130 of the second type that fluoresce when illuminated by light from a filteredlamp 150. Each of the first 115 and second 135 moiety can be a receptor, protein, antibody, cell (eukaryotic or prokaryotic), organelle, virus, or nucleic acid sequence. Thesecond moiety 135 is unlabeled, that is, not labeled with a fluorophore. In some embodiments, the fluorescent functionalized beads can comprise a polymer substrate impregnated with a fluorescent material. Several improvements arise from having the fluorescent material impregnated inside the functionalized beads B and using an unlabeledsecond moiety 135. First, the volume of the bead allows for much greater quantities of fluorophores to be included and measured, as compared to surface attachment, because the volume of the bead is significantly greater than its surface area. Second, in other methods whereby the surface bound moiety is labeled with a fluorophore, the quantity of fluorophore is further reduced as the moieties do not cover the entire surface, resulting in even further reduced labeling. Third, fluorophores are sensitive to light, temperature, pH, salt and other environmental conditions associated with biological assays. As such, the fluorophores impregnated into the bead are sheltered and protected from the chemical environment, which results in brighter and more robust detection. Fourth, for fluorophores to be conjugated or covalently bound to surface attached moieties, they must undergo a chemical reaction that can alter the state of the fluorophore (such as its 3D structure, charge, polarity) that can negatively affect the function of the fluorophore. - Due to the superparamagnetic nature of the capture bead A, extra bead A will be included in the final read. However, since this bead is in a different fluorescent channel (wavelength) or not fluorescent at all, it will not negatively affect the positive signal of the detector bead B or provide additional non-specific (fluorescent) background.
- In one embodiment, the magnetic multi-bead assay is performed as described below. After complex formation, a magnetic separation step or series of repeated steps is used to reduce the unbound bead B population. After magnetic separation, the continued presence of bead B indicates successful binding of the target analyte both to bead A and to bead B - otherwise either the analyte or bead B or both would likely have been discarded during magnetic separation. Detecting bead B in the sample suspension is therefore sufficient to establish co-presence of both beads in complexes.
- Accordingly, as shown in
FIG. 2 , amethod 200 of detecting a complex including an analyte includes contacting 210 a sample in a solution with a population of magnetic functionalized beads of a first type, contacting 220 the sample solution with a population of fluorescent functionalized beads of a second type, illuminating 230 the complex with incident light that excites fluorescence within the functionalized beads of the second type, and detecting 240 the complex including the analyte by analyzing the fluorescence. - The sample suspension may be analyzed using a fluorescent plate reader or similar device that uses a spectrophotometer to optically excite and measure fluorescence from each plate well. The suspension may be transferred to low-fluorescence black plates prior to measurement to reduce signal background produced by the plate. While it is possible that the reactions could be performed in the black plates originally, reactions may be more efficiently performed in roundbottom plates that may be unavailable in black plastic. During the fluorescence measurement, bead B fluorescence may be both induced and recorded through optical band pass filters. A titration of bead B and a well containing no bead B may be separately measured to calibrate the observed fluorescence signal to a known bead concentration under similar buffer conditions.
- Most commercially available fluorescent plate readers can be configured with standard excitation and emission filters, dichroic or band pass filters, and proper gain settings or photo multiplier tube (PMT) adjustments to satisfactorily depress autofluorescence of sample buffer and amplify true fluorescent signal from the ensemble fluorescent beads. The wavelength of measured fluorescence will depend upon the choice of fluorophore incorporated into the bead. It should be noted that low fluorophore concentration or weak fluorophores may depress the fluorescent signal and reduce the sensitivity of the assay.
- As shown in
FIG. 1D , prostate specific antigen (PSA) as low as 0.1 pg/mL can be measured with little optimization of the plate reader conditions. As few as 250 fluorescent beads can be measured at the minimum signal level, considered to be the fluorescence measurement background mean plus triple its standard deviation. Longer read times, changes in photomultiplier tube (PMT) gain settings, or adjustments in the scanned region of each well all may contribute to improved sensitivity. Optimization of these parameters depends upon the features of any given plate reader. - Consider bead A and bead B to be of the same types described in Example A1 above. Further consider that, as in Example A1, a final magnetic separation step or series of steps is performed to reduce the concentration of bead B.
- In another embodiment employing a bead-based
assay system 300, shown inFIG. 3A , bead B fluorescence may be measured by fluorescence imaging rather than with a spectrophotometer. The sample suspension or a portion of it may be dispersed on amicroscope slide 305. Under appropriate optical excitation, bead B fluorescence may be imaged by a microscopy system onto acamera sensor 340 through an opticalband pass filter 348 that blocks the excitation light from the filteredlamp 150. In the resulting bead B fluorescence image, and provided suitable resolution of the microscopy system, individual beads may be resolved, identified, and counted (as illustrated inFIG. 3B ). The total number of beads B counted in the image provides a measurement of the number of analytes present in the sample, since the observation ofbead B fluorescence 155 implies co-presence of both bead A and bead B bound to the target analyte in the complex 145. - Fluorescence imaging may provide an improvement in sensitivity above the plate reader measurement described above in Example A1. This improvement arises from the ability to reject confounding signals, including:
- (1) optical detector backgrounds, such as arise from optical filter leakage and optical sensor noise;
- (2) diffuse fluorescence backgrounds, such as autofluorescence from buffer components;
- (3) fluorescence from contaminants, such as dust particles, that may be clearly distinguished in images from bead B signals.
- Rejecting false signals allows for a lower signal background, as shown in
FIG. 3C , where theimager 340 yields a lower signal level for the same PSA concentration as compared to theplate reader 140, and a correspondingly improved sensitivity to low complex concentrations that result from low analyte concentrations. - Imaging of bead B may be performed with a liquid sample suspension, such as a droplet on a microscope slide under a coverslip, or after drying a representative droplet of the liquid sample. After drying, fluorescent bead B remains bright and no longer moves under diffusion or due to flow of the sample on the slide, which enables longer exposure times and lower excitation light intensity. The buffer solution is chosen to preserve immunocomplexes against dissociation during drying, to disperse beads relatively uniformly over the dried region, and to avoid leaving solute crystals or other residue that may impede imaging.
- Consider bead A and bead B to be of the same types described in Example A1 above. Further consider that, as in Example A1, a final magnetic separation step or series of steps is performed to reduce the concentration of bead B and that bead B is counted by imaging the sample with a fluorescence microscopy system.
- In accordance with one or more embodiments, as shown in
FIG. 4 , amethod 400 of detecting a complex including an analyte includes contacting 410 a sample in a solution with a population of magnetic functionalized beads of a first type, contacting 420 the sample solution with a population of functionalized beads of a second type, and detecting 430 the complex including the analyte by detecting magnetic fields produced by the magnetic functionalized bead and by detecting the functionalized bead of the second type associated with the analyte in the complex. In some embodiments, detecting magnetic fields includes using any magnetic imaging technology, such as magnetic force microscopy or a scanning Hall probe. In certain embodiments, detecting the functionalized beads of the second type includes detecting fluorescence as described in Examples A1 or B2 above. - In another embodiment, the microscopy system may include a wide-field diamond magnetic imaging system that allows for imaging of bead A, which is superparamagnetic. Wide-field diamond magnetic imaging with nitrogen-vacancy (NV) centers in diamond is capable of rapidly imaging magnetic fields disposed over the surface of a diamond sensor, at room temperature, with sub-micron resolution. Magnetic images may be co-registered to conventional optical fluorescence or bright-field images acquired for the same field of view with the same imaging system. Adjustments to the imaging system may be made between magnetic and optical imaging to optimize performance, such as changing optical filters or correcting focal position.
- As shown in
FIG. 5 , a bead-basedmagnetic assay system 500 for detecting a complex including an analyte based on optically detected magnetic resonance (ODMR) includes, as shown inFIG. 1A and described above, a plurality of functionalized beads 110 of a first type, which are magnetic functionalized beads and are functionalized to include a first moiety 115 that associates with an analyte 120 under suitable conditions, a plurality of functionalized beads 130 of a second type, which are functionalized to include a second moiety 135 that associates with the analyte 120 under suitable conditions, and, as shown inFIG. 5 , a substrate 532 including at least one ODMR center 540 (a plurality of ODMR centers 540 shown inFIG. 5 ), a light source 536 configured to generate incident light that excites electrons within the at least one ODMR center 540 from a ground state to an excited state, a magnet 534 for applying a bias magnetic field on a complex 530 disposed over the at least one ODMR center 540, the complex 530 including one of the first type of functionalized bead 110, the analyte 120, and one of the second type of functionalized bead 130, and a microwave source 538 configured to generate a microwave field incident on the at least one ODMR center 540, the microwave source 538 being further configured to generate the microwave field with frequencies that correspond to ground state transitions in the at least one ODMR center 540, in which the at least one ODMR center 540 produces emitted light 542 when illuminated by the incident light 536, characteristics of the emitted light 542 being influenced by the microwave field and by the magnetic functionalized bead 110 associated with the analyte 120 in the complex 330. In the embodiment shown inFIG. 5 , the plurality of ODMR centers 540 are nitrogen-vacancy (NV) centers in a diamond lattice, formed in an upper surface of thediamond substrate 532. In another aspect, the plurality of ODMR centers can be silicon-vacancy centers in a silicon carbide lattice, or in a diamond lattice. Turning back toFIG. 5 , underoptical excitation 536,fluorescence 542 emitted from a thin layer of ODMR centers 540 near the surface of thediamond substrate 532 is imaged onto anoptical photodetector array 544, that is an optical imaging system having an imaging sensor such as a charge-coupled device (CCD) or complementary metal oxide semiconductor (CMOS) camera. The variation of ODMR center fluorescence under microwave excitation reveals the ODMR electron spin resonance (ESR) frequency, and hence the magnetic field shift of the ODMR spin sublevels. The spatial structure of the magnetic field at the diamond surface created by the sample (i.e., complex) 530 can thus be determined from images ofODMR center fluorescence 542, whose characteristics are influenced by the microwave field and by the magnetic field created by the magneticfunctionalized bead 110 associated with theanalyte 120 in the complex 530. - Briefly, the process to acquire a magnetic image is as follows:
- 1. Dispose a magnetic sample (i.e., complex) 530 to be imaged over, onto, or near to the sensing surface of the
diamond substrate 532. An intermediate layer (not shown) may be interposed between thesample 530 and thediamond substrate 532. - 2. Apply a
magnetic bias field 534 in an arbitrary direction. - 3. Illuminate the ODMR centers 540 in the diamond center with green light 536 (near 532 nm wavelength).
- 4. Apply a microwave field from a
source 538 to the diamond, with frequency near one of the ODMR center ESR transitions. - 5. Acquire an image of
ODMR center fluorescence 542 emitted from thesensing surface 540 atoptical detector array 544 throughimaging objective 546 andoptical filter 548. - 6. Repeat steps 4-5 using different microwave frequencies that span one or more ranges around one or more NV center ESR transitions. The result is a stack of images, each corresponding to a different microwave frequency.
- 7. Repeat steps 4-6 one or more times, averaging the results to reduce imaging noise in the image stack.
- 8. For each image pixel in the image stack, construct an ESR spectrum from that pixel's value across all images in the stack. Analyze this spectrum to determine the frequencies of one or more ESR transitions.
- 9. For each image pixel in the image stack, compute the magnetic field based on the frequencies of observed ESR transitions at that pixel.
- Additional details of the operation of the wide-field diamond magnetic imaging apparatus are described in PCT Patent Application No.
PCT/US2017/057628 filed on October 20, 2017 and entitled METHODS AND APPARATUS FOR MAGNETIC PARTICLE ANALYSIS USING DIAMOND MAGNETIC IMAGING. - An applied magnetic field induces magnetization in bead A and an associated magnetic field from the bead. A magnetic field in the range of 0.5 to 10 mT, which may be generated with permanent magnets or an electromagnet, is sufficient to resolve features in the electron spin resonance spectrum of the diamond imaging sensor. The diamond magnetic imager images these bead fields directly, allowing for individual bead detection and location. Beads of similar composition and magnetization produce similar magnetic field patterns that may be identified as
characteristic features 542 in a magnetic image corresponding to the location of each bead A. A representative image is shown inFIG. 6C . - An image processing algorithm may identify the locations both of bead A features 542 in the magnetic image, shown in
FIG. 6C , and bead B features 155 in the fluorescence image shown inFIG. 6B . Additional images may be acquired in either detection channel (magnetic or fluorescent) to improve signal fidelity. The resulting bead locations identified in each detection channel may then be compared to identify co-presence of both bead types, and hence ofcomplexes 145 containing the target analyte, illustrated inFIG. 6A . - Adding the magnetic imaging channel to detect bead A in addition to detecting bead B in the bead fluorescence channel allows for identification of unbound bead B, which may persist after magnetic separation or which may dissociate from bead complexes that are weakly bound by nonspecific interactions. Unbound bead B may be rejected during analysis so that only bead B associated with complexes are counted.
- In another embodiment shown in
FIGS. 7A-7D ,bead A 710 andbead B 730 are both magnetic, but with distinguishable magnetic properties. Magnetic imaging with single-bead spatial resolution is used to identifybead A 710, as in Example C3, and also to identifybead B 730, distinguishing between the two.Bead A 710 has magnetic properties suitable for magnetic separation, as in Examples A1, B2, and C3 described above. - Beads A 710 and
B 730 may, for example, differ in the shape and magnitude of their single-axis magnetization curves, which describe bead magnetization as a function of an applied magnetizing field. Beads A 710 andB 730 may differ in the degree of hysteresis in their magnetization curves and in properties such as remanent magnetization and coercivity. Beads A 710 andB 730 may have different degrees of asymmetry, with different magnetization curves observed when the field axis is changed. Beads A 710 andB 730 may respond differently to a time-varying magnetic field, such as an alternating or rotating field. - Using only magnetic imaging for identifying and locating
bead A 710,bead B 730, andcomplexes 745 including theanalyte 720 enables elimination of the optical fluorescence detection channel, simplifying the assay system significantly. Additionally, magnetic imaging is particularly insensitive to signal backgrounds due to unwanted light, detector noise, and sample contaminants that fluoresce, scatter, or absorb light. Magnetic signal backgrounds are extremely low in biological samples and they do not impede the ability to measure even modestly magnetic beads. - Wide-field diamond magnetic imaging provides a means to directly image the vector magnetic field produced by a magnetic bead under a wide range of magnetic conditions. This general-purpose tool may be used to distinguish between magnetic bead types over a wide range of different properties.
- In one embodiment,
bead A 710 andbead B 730 are distinguished by measuring magnetic susceptibility and magnetic remanence at low applied field after first magnetizing the beads with a large magnetic field.Bead A 710 is superparamagnetic. For example,bead A 710 may be composed of superparamagnetic iron oxide nanoparticles 5-10 nm in size dispersed within a spherical polymer substrate approximately 1 µm in diameter.Bead A 710 may contain a quantity of iron oxide such that the magnitude of the average induced magnetization ofbead A 710 with an applied bias field of 4 mT is approximately 3 × 10-15 A m2.Bead B 730 is ferromagnetic. In one embodiment,bead B 730 may be composed of ferromagnetic cobalt ferrite nanoparticles 30 nm in size dispersed over the surface of a spherical polymer substrate approximately 1 µm in diameter and adhered to the surface with an additional polymer layer.Bead B 730 has a remanent magnetization fraction of greater than 50%, such that, after being magnetized in a field of at least 300 mT and once the magnetizing field has been removed,bead B 730 retains a large proportion of its saturated magnetization value.Bead B 730 may contain a quantity of cobalt ferrite such that the magnitude of the average remanent magnetization ofbead B 730 after the magnetizing field is removed is approximately 2 × 10-15 A m2. - A magnetic imaging procedure is described below for identifying
complexes 745 containing thetarget analyte 720,bead A 710 andbead B 730. - After forming
complexes 745 in a sample suspension, a representative portion of the sample is disposed over and dried on thesurface 732, shown inFIG. 7B , of a diamond magnetic imaging sensor shown inFIG. 5 . The sensor's imaging surface is a {100} face and this surface contains a thin layer approximately 1-µm thick that is rich in nitrogen-vacancy (NV) centers. Turning back toFIGS. 7B-7D , after magnetic imaging,complexes 745 are identified by identifyingbead A 710 andbead B 730 in close proximity to one another, including close enough to be spatially unresolved in the images. Prior to magnetic imaging, a magnetizing field is applied in a direction normal to the horizontal diamond surface. A field of greater than 200 mT applied for a period of several seconds is sufficient to magnetize the magnetic material in bead B. The dried sample is then magnetically imaged twice with a bias magnetic field of 4 mT applied parallel to one crystal axis of the diamond sensor, which is oriented at an angle of approximately 35 degrees with respect to the imaging surface. The 4 mT imaging field is reversed between acquiring the two magnetic images, shown inFIGS. 7C and 7D , termed the positive (FIG. 7C ) and negative (FIG. 7D ) images, denoting the +4 mT and -4 mT imaging fields, respectively. The magnetic images measure the projection of the sample magnetic field vector onto the axis of the imaging field. - Since
bead A 710 is superparamagnetic, the greater than 200 mT magnetizing field does not leavebead A 710 with significant remanent magnetization. In both the positive and negative images, the magnetization of bead A is only that which is induced in the superparamagnetic beads by the 4 mT imaging field.Bead A 710 produces thesame feature 741 in both magnetic images, since thebead A 710 magnetization is in both cases parallel to the imaging field. - In contrast, the greater than 200 mT magnetizing field leaves
bead B 730 strongly magnetized in the vertical direction, oriented up with respect to the horizontal diamond sensor imaging surface. Once the magnetizing field is removed, the weaker 4 mT imaging field does not significantly change the magnetization ofbead B 730, since the magnetic susceptibility ofbead B 730 near zero magnetic field, when previously magnetized along the same axis, is low. Therefore,bead B 730 produces animage feature 742 that inverts sign between the positive and negative magnetic images, with positive magnetic field projection changing to negative and vice versa, as illustrated inFIGS. 7B, 7C, and 7D . - All magnetic objects identified in the magnetic image field of view are quantified by magnetization, such that
bead A 710 is assigned a positive value in both images andbead B 730 is assigned a positive and negative value in the positive and negative images, respectively.Bead complexes 745 will be assigned magnetization values that reflect the complex composition. For example, bead dimers of the form A-A or B-B will generally be assigned larger values with the same sign of bead A or bead B monomers, respectively.Bead dimers 745 of the form A-B or larger heterogeneous bead complexes will be assigned values of smaller magnitude in the negative image than in the positive image, reflecting oppositely-magnetized beads within the complex, as shown inFIGS. 7C and 7D . - All magnetic objects in the magnetic images may be represented on a scatter plot whose axes are the sum and difference, respectively, of the positive and negative image magnetization values. This sum and difference may also be termed the susceptibility and remanence of the single-bead magnetization curve, as they are approximately proportional to these properties. As shown in
FIG. 8A , bead A and bead complexes containing only bead A will be clustered near one axis, with large susceptibility and zero remanence; bead B and bead complexes containing only bead B will be clustered near the other axis, with large remanence and near-zero susceptibility. Complexes containing both bead A and bead B will exhibit significant susceptibility and remanence, so they may be identified as the objects in the scatter plot in a region sufficiently separated from both axes. This region is unlikely to contain signals from bead A or bead B alone, or from homogeneous bead complexes such as those of the form A-A or B-B. - If the magnetic imaging spatial resolution is sufficient to resolve individual magnetic beads within a complex, then the complex may be identified by separately identifying beads within the complex and determining their spatial separation to be consistent with that of a bound complex, and not significantly greater than the bead diameters.
- If both bead A and bead B are sufficiently magnetic, and either bead A or bead B is ferromagnetic, A-B dimers may form even in the absence of the target analyte, due to attractive magnetic interactions. These magnetic interactions may be limited in strength by limiting the amount of magnetic material in each bead. Magnetic bead signals may be measured even in cases in which magnetic interactions between beads are too weak to overcome forces associated with Brownian motion or sample mixing, so that magnetic interactions may play no role.
- The magnetic material within bead A and bead B may be composed of nanoparticles disposed within or on the surface of a polymer or other nonmagnetic substrate. If the nanoparticles are uniformly disposed within or on the surface of the substrate, then the strength of magnetic interactions between beads can be reduced relative to having aggregated nanoparticles, since magnetic fields near aggregated magnetic nanoparticles may be stronger. Using nanoparticles that are much smaller than the substrate radius may allow for more uniform distribution, relative to larger nanoparticles that produce stronger local magnetic fields.
- Magnetic interactions may also be suppressed by adding a nonmagnetic layer encapsulating the magnetic material. Suitable materials for the nonmagnetic layer include polymers, such as polyethylene (PE), polytetrafluoroethylene (PTFE), and polymethylmethacrylate (PMMA). Since magnetic interactions weaken rapidly with increasing separation between beads, even a nonmagnetic layer significantly thinner than the original bead radius can dramatically reduce dimer formation due to magnetic interactions.
- As shown in
FIG. 8B , the magnetic image signal for a magnetic bead can be analyzed to determine the magnetic moment (magnetization × volume) of the bead, assuming knowledge of the bead size and a spherically symmetric distribution of magnetic material in the bead. For bead A and bead B of similar size, the magnetic moment can be used to distinguish between bead A, bead B, and bead complexes. To be effective, there must be low enough variation of magnetic moment, size, and spherical symmetry of each bead such that each measurement can be clearly associated with one distribution. The A-B complex, having larger size than each individual bead, may not produce a signal equal to the sum of signals from bead A and bead B. Nevertheless, the bead A and bead B magnetic moments may still be chosen such that the mean A-B complex signal is distinct from that of bead A, bead B, the A-A complex, the B-B complex, etc. It is not necessary to resolve spatial differences between candidate signals to discriminate them by magnetic moment; it is sufficient to evaluate each signal only by magnitude, e.g. magnitude of convolution with a characteristic image signal. - If bead A and B have different size, a similar discrimination approach may be used that ignores this size difference when evaluating the magnitude of candidate signals and applies the same single-parameter quantification strategy to all signals. This may produce signals for bead A, bead B and complexes that are not proportional to their magnetic moments, but are distinct and allow for accurate discrimination.
- Magnetic particles may exhibit an anisotropic response to a magnetic field, due to preferential magnetization along certain crystal axes in a single magnetic domain or along certain directions in a multi-domain particle or a composite magnetic bead containing many particles. Rod-shaped nanoparticles, for example, typically can be magnetized more easily along the rod axis. Synthesizing a spherical bead containing oriented magnetic nanorods would produce an anisotropic magnetic susceptibility in the bead.
- The magnetic anisotropy of a bead can be probed by imaging immobilized beads multiple times, using multiple directions of an applied magnetic field. As shown in
FIG. 8C , a metric for magnetic anisotropy can be constructed from the difference in magnetic signals obtained from the different orientations. Imaging at three distinct directions is sufficient to determine the orientation and degree of anisotropy for a particle even if the particle orientation is not known in advance. If bead A and bead B have zero and nonzero magnetic anisotropy, respectively, then images acquired with the imaging magnetic field rotated in different directions will produce identical signals for bead A, but different signals for bead B. Complex signals will have nonzero anisotropy, but less than that of bead B. - As shown in
FIG. 8D , magnetized ferromagnetic beads can be re-magnetized in a different direction by applying a field larger than the coercivity. Discrimination between two types of ferromagnetic beads, bead A and bead B, can be achieved using this sequence: (1) first magnetize both beads with a strong magnetic field in one direction; (2) image the bead magnetization; (3) apply a magnetic field in the opposite direction that is strong enough to reverse the magnetization of bead A, but not strong enough to reverse the magnetization of bead B; (4) image the magnetic bead signals and compare them to those in the first image. Bead A signals will reverse direction; bead B signals will change modestly, if at all; complex signals will change significantly in magnitude as one bead in the complex reverses magnetization while the other does not. - As shown in
FIG. 8E , magnetic particles change their magnetization direction in response to a change in magnetic field direction. For a given field strength, the time scale for a particle to change direction may depend on the particle composition and size and may vary over a wide range from below 1 µs to well over 1 s. If an oscillating or rotating AC magnetic field of constant amplitude is applied to the particle, the particle magnetization will oscillate in response. An oscillating magnetization may be measured by a magnetic imaging technology that is sensitive to AC magnetic fields, such as a wide-field ODMR center magnetic imaging system that employs pulsed optical excitation of ODMR centers or timegated camera exposures. The magnitude of the oscillating magnetization will decrease as the oscillation period decreases below the time scale required for the particle to change magnetization direction. The cutoff frequency is defined as the oscillation frequency corresponding to this change in response. - If bead A and bead B contain magnetic material with different cutoff frequencies, measuring the oscillating magnetization at multiple oscillation frequencies provides a method to discriminate between the beads. If bead A has a high cutoff frequency compared to bead B, then imaging at an intermediate frequency will observe a weak bead B signal compared to imaging at a low frequency, but little change in the bead A signal. A complex will exhibit a decrease in signal at the intermediate frequency that is smaller than that of bead B. Discrimination can be improved by adding additional images at additional frequencies. While bead A and bead B will have a single cutoff frequency, the complex will exhibit two cutoff frequencies. Signals obtained at low oscillation frequency and at two or more intermediate frequencies will reveal qualitatively different behavior for bead A, bead B, and complexes.
- As shown in
FIG. 8F , the magnetization M of a superparamagnetic particle saturates with sufficiently high magnetic field H. Even at field strengths below saturation, the magnetic susceptibility (slope of the magnetization curve) is reduced. If the magnetizations of superparamagnetic bead A and bead B saturate at different field strengths H1 and H2, then the beads may be distinguished by imaging at two magnetic field strengths, one of which is large enough to observe a change in magnetic susceptibility in one of the beads. The ratio of signals in these two images will be significantly different for bead A and bead B. Complexes will have an intermediate ratio distinct from that of bead A or bead B. - Magnetic beads of different size, but similar composition, may produce magnetic image signals that are distinguishable by their spatial scale. This may allow for discrimination between bead A, bead B, and complexes, despite bead A and bead B having nominally identical magnetic properties.
- When the sample solution is disposed on a surface, most beads will come to rest against the surface, so that the center of each bead is spaced apart from the surface by its radius. Larger beads are thus centered further from the sensing surface than smaller beads. This spacing determines the spatial scale of the magnetic field at the sensing surface, since the same lateral displacements along the surface are relatively larger for closely-spaced beads than for more distant beads, and therefore result in larger relative changes in magnetic field.
-
FIG. 9 is an image of two beads, approximately 1 micron (top) and 3 microns (bottom) in diameter, with their centers spaced approximately 9 microns apart. The larger bead produces a magnetic signal with broader spatial features. In this case, the larger bead also contains more magnetic material and produces a larger magnitude of signal, but this need not be the case. - If bead A and bead B have different size, but similar magnetic properties, then spatial scale of magnetic image signals may be used not only to discriminate between the two, but also to identify A-B complexes. Complexes have spatially broad signals that also contain shorter-scale spatial components.
- One method for identifying complexes is to first identify all broad signals (including both bead B and complex signals) and then subtract a characteristic bead B signal (such as the mean of many bead B signals imaged separately) from each. Variations in imaging accuracy and in the uniformity of bead B magnetization will cause this difference to be nonzero for bead B signals, however the difference will generally have broad spatial scale. For the complex signals, however, subtracting the characteristic bead B signal will leave behind the sharper bead A signal. These cases may be distinguished by spatial filtering of the signal differences.
-
FIGS. 10A-1, 10B-1, and 10C-1 show example bead B images. The difference signal images after subtracting the characteristic bead B signal shown in 10A-2, 10B-2, and 10C-2 have a gray scale amplified by a factor of 2. -
FIGS. 11A-1, 11B-1, and 11C-1 show example complex images, showing sharp bead A signals circled in the difference images shown in 11A-2, 11B-2, and 11C-2, which are again amplified by a factor of 2 relative to the image signals. - The bead discrimination approaches described herein may also be used in combination to enhance discrimination performance or to discriminate between more than two bead types and their combinations.
- For a given number of bead complexes containing the target analyte in a liquid sample suspension, the number of complexes present within an imaging field of view after disposing the sample over the imaging sensor may vary due to differences in the manner in which the sample was disposed. For example, the sample may be disposed over the sensor by adding a liquid droplet to the sensor surface and allowing it to dry, such that variations in the droplet volume or its initial contact area with the sensor lead to variations in bead complex density in the dried sample over the sensor surface. By measuring the total number of bead A in the field of view, including the unbound beads not contained in complexes, the sample density variations may be measured and accounted for. Dividing the number of complexes by the number of bead A yields a quantity that is less sensitive to variations in sample density, and thus may provide a more precise measurement of the total number of bead complexes in the sample and of the analyte concentration determined from a calibration curve obtained as described above.
- It is known in the art that immunoassays must allow time for target analytes in a liquid sample to bind to antibodies that enable detection of the target analytes. Depending on the reagent concentration and sample conditions (such as temperature, viscosity, and process for agitating or mixing the sample), several minutes may be required for most analytes to become bound, even when there is a large excess of binding sites available, due to the time needed for the analyte to move through the sample by diffusion or active shaking or stirring.
- The rate of interactions between different beads in the sample suspension may determine multi-bead assay speed, since bead diffusion is generally slower than diffusion of smaller molecular analytes. Since a beadbound target analyte may also occupy a relatively small fraction of the bead's surface area, when the bead to which the analyte is bound interacts with a second bead, the analyte may not be exposed to the second bead in a manner conducive for binding (e.g., the interaction occurs on the side of the first bead opposite to where the analyte is located). Several bead interactions may be required on average to form an immunocomplex. The multi-bead assay time may be shortened by performing processes to induce bead-bead interactions that lead to immunocomplex formation, accelerating bead kinetics beyond what may be expected for diffusion or stirring alone.
- In one embodiment, bead-bead interactions may be induced by agglomerating a plurality of functionalized beads of the first and second types, after contacting the sample solution with the population of functionalized beads of the second type, before detecting the complex, by means of spinning the sample suspension on a centrifuge to concentrate the beads into a pellet in the sample tube. This process can be performed in less than a minute with standard benchtop centrifuge systems. Beads in the pellet may be closely spaced or in contact with one another, resulting in many bead interactions in the pellet. The pellet may be re-suspended by mixing the suspension. This centrifuge process may be repeated as necessary to ensure sufficient interactions between beads to form immunocomplexes containing the target analyte.
- In another embodiment, if both bead A and bead B are magnetic, then magnetic separation may be used to form a pellet of beads in the sample suspension and induce bead-bead interactions by applying a magnetic field gradient to the sample solution after contacting the sample solution with the functionalized beads of the first and second types. As with the centrifuge process, this magnetic approach to accelerating bead kinetics can be performed in less than a minute and repeated as necessary to form immunocomplexes containing the target analyte. The magnetic approach may be performed with permanent magnets for a simple, inexpensive, and compact process with minimal power consumption. An electromagnet may also be used to apply the magnetic field with no moving parts.
- In another embodiment, a bead pellet produced by magnetic separation of a sample suspension can be agitated without removing the magnetic field, but by varying or otherwise changing the magnetic field gradient applied to the sample solution with respect to the beads. For example, the field magnitude, direction, or spatial distribution may be changed or oscillated to apply different magnetic forces on the beads. Alternatively, or additionally, the sample tube may be moved with respect to the magnetic field. For example, rotating the tube may move the pellet away from its equilibrium position so that the pellet will be dragged by the magnetic field gradient to a new position. These changes will cause beads in the pellet to move with respect to each other and may induce additional bead interactions and immunocomplex formation.
- In an embodiment, a permanent magnet may be moved relative to a tube containing a sample suspension with magnetic beads of multiple types. The magnet may follow a fixed pattern of motion. Exemplary cases include the magnet orbiting the sample tube in a circle, rotating on its own axis, or rocking back and forth between two points. The motion may be continuous, in which case the bead pellet will continuously move through the tube, subjecting the beads to shear forces from the liquid, tube walls, and other beads. This motion and the associated forces on the beads will agitate the pellet continuously to drive bead-bead interactions. In another exemplary case, the motion may occur in discrete periods separated by periods of rest, in which the bead pellet may concentrate to a higher bead density than is achieved during continuous motion. If the different bead types respond significantly differently to the field of the permanent magnet, then the periods of rest will allow the multiple bead types to co-localize more effectively than during continuous motion.
- In another embodiment, a plurality of permanent magnets may be moved relative to a plurality of samples in separate wells of a plate, such that the sample in each well is subjected to a magnetic field profile in time and space that is substantially similar. This approach allows for driving bead-bead interactions in parallel over a plurality of samples for improved sample preparation throughput.
- Accelerating bead kinetics and the rate of bead-bead interactions in sample suspension decreases the time required to bind target analytes into detectable multi-bead complexes. This method enables a rapid assay.
- This method may also allow for a lower quantity of binding ligands to be used on the bead surfaces, since the likelihood of a given ligand to bind to the target analyte may be increased by the increased frequency of bead-bead interactions. Using fewer binding ligands may reduce the cost of the assay significantly.
- It is often useful for an assay to measure concentration of multiple distinct analytes in a single sample. A multiplexed assay measures distinct target analytes by associating a distinct signal with each target, so that the analyte signals may be distinguished in the assay measurement. The magnetic dual-bead assay may be generalized to a multiplexed multi-bead assay by using more than two distinguishable bead types. Different analytes may be specifically detected by observing the formation of analyte-specific complexes including a plurality of functionalized beads of at least a third type, functionalized to include at least a third moiety that can specifically associate with at least a second analyte under appropriate conditions.
- In one embodiment, shown in
FIGS. 12A and 12B , consider a plurality of functionalized beads of thethird type 1240 functionalized to include at least athird moiety 1245 that associates with thesecond analyte 1250 under suitable conditions, and a plurality of functionalized beads of afourth type 1260, functionalized to include afourth moiety 1265 that associates with thesecond analyte 1250 under suitable conditions, resulting in four distinguishable bead types:bead A 1210,bead B 1230,bead C 1240, andbead D 1260. Complexes of theform A-B 1201 or C-D 1202 may be formed through binding of two distinct analytes,first analyte X 1220 andsecond analyte Y 1250, to moieties coating each bead. In this case,bead A 1210 andbead B 1230 are coated withmoieties analyte X 1220;bead C 1240 andbead D 1260 are coated withmoieties analyte Y 1250. The moieties on each bead are unique to that bead. The A-B 1201 and C-D 1202 complexes may be distinguished from each other and from the monomer beads from their distinct magnetic properties. - In another embodiment, shown in
FIGS. 13A and 13B , consider three distinguishable bead types:bead A 1310,bead B 1320, andbead C 1330. Complexes of theform A-B 1301, B-C 1302, or A-C 1303 may be formed through binding of three distinct analytes,analyte X 1311,analyte Y 1312, andanalyte Z 1313, to moieties coating each bead. The functionalized beads of thefirst type A 1310 further include at least oneadditional moiety 1316 that associates with thesecond analyte 1312 under suitable conditions. The functionalized beads of thesecond type B 1320 further include amoiety 1326 that associates with thethird analyte Z 1313 under suitable conditions. The functionalized beads of thethird type C 1330 are functionalized to include amoiety 1335 and amoiety 1336, and therefore each bead is coated with two distinct moiety types targeting two different analytes:bead A 1310 is coated with moieties for analyte X 1315 and foranalyte Y 1316;bead B 1320 is coated with moieties for analyte X 1325 and foranalyte Z 1326;bead C 1330 is coated with moieties foranalyte Y 1335 and foranalyte Z 1336. The moieties on each bead are unique to that bead. TheA-B 1301, B-C 1302, and A-C 1303 complexes may be distinguished from each other and from the monomer beads from their distinct magnetic properties. - Multiplexed assays must have a means of discriminating between signals associated with distinct target analytes, which in the case of multiplexed bead assays means that the beads must be distinguishable. Bead fluorescence may be used to discriminate between bead types with different excitation and/or emission spectra. For example, three bead types may emit blue, yellow, or red fluorescence that may be distinguished using optical filters. Different bead types may also be prepared to fluoresce with different intensities, so that the different types may be distinguished in a fluorescence image by discrete levels of brightness, where difference between the levels exceeds variation within the distribution of each bead type.
- Distinct magnetic bead types may be distinguished by preparing bead types with different magnetic properties that can be distinguished by magnetic imaging. In an exemplary case, the distinct bead types may be prepared by loading each bead type with specific and distinguishable quantities of magnetic material. In another exemplary case, distinct bead types may be prepared by loading each bead type with different magnetic material exhibiting different properties. The fully magnetic multi-bead assay described above discriminates between two bead types in this manner. A multiplexed assay may be implemented by adding additional distinguishable beads using distinct combinations of the properties described above. For example, bead A may be superparamagnetic, while bead B and C are ferromagnetic with different coercivities derived from bead B and bead C comprising different ferromagnetic materials. In this case, the beads may be distinguished by measuring magnetic remanence after magnetization, and then also measuring whether this remanence is reversed upon application of a demagnetizing field that exceeds the coercivity of bead B, but not that of bead C. The three beads in this case may be used to implement a multiplexed assay for three analytes using an embodiment described above.
- One example of suitable conditions for sample preparation for the multi-bead assay is to combine a few drops of blood with the multi-bead mixture, incubate for a few minutes with accelerated kinetic mixing and deposit the sample solution on the diamond surface to dry followed by magnetic imaging. The sample solution can be partially or completely dehydrated before detecting the complex.
- A suitable sample preparation proceeds as follows: plasma or serum is diluted in assay buffer 10-fold by adding 5 µL sample into 45 µL assay buffer and briefly vortex mixed. This diluted sample is further diluted 2x with 50 µL of bead mix for a final of 100 µL. The bead mix includes ~100,000 capture beads and ~100,000 detector beads. The final assay reaction is 20-fold dilution of sample in 100 µL. The assay reaction is incubated with vortex mixing (800 rpm) for 15 minutes at room temperature. The samples are then placed in a centrifuge and spun at 1500 g for 3 minutes, followed by pulse vortex mixing. The centrifugation and mixing cycle is repeated twice more, after which the sample is placed against a permanent magnet (magnetic field ~300 mT) for 30 seconds to pellet the magnetic beads against the sidewall of the reaction tube. The assay volume is removed by pipette leaving the bead pellet intact on the side wall against the magnet. The tube is removed from the magnet and the pellet is suspended in 500 µL of wash buffer by vortex mixing. The tube is pulse spun at 1500 g for 3 seconds to remove fluid from the cap, and placed on the magnet for 30 seconds. The wash cycle is repeated 2 more times for a total of 3 washes. The pellet is washed 1 time with 200 µL of imaging buffer and finally suspended in ~4 µL imaging buffer. ~2 µL is applied to the diamond sensor for magnetic imaging.
- The sample may be any chemical or biological sample, such as whole blood, blood components (plasma, serum), tissue culture, cell culture, bodily fluids (cerebral spinal fluid (CSF), tears, saliva, breast milk, urine, semen, nasal discharge), tissue samples (oral swabs, biopsies, surgical resections), recombinant DNA, RNA or protein, endogenous DNA, RNA or protein, synthetic nucleic acids or protein peptides.
- Further sample requirements may include volumes of sample types from 0.1 µL to 1000 µL.
- Further sample requirements may include dilution of sample types and volume into assay buffers. Dilutions of sample types may include dilution by a factor of 10-1,000. Assay buffers may be determined empirically for optimized signal generation and minimized non-specific background, or false binding of any kind.
- Samples may be combined in various ways including, for example, with multi-bead mixtures in blood collection tubes, assay tubes, assay plates/wells, microfluidic devices, reaction chambers, incubation chambers, lateral flow devices, blood component separation devices, or other liquid handling or manipulation devices.
- Samples may be mixed in various ways including, for example, by magnetic fields, centrifugal force, gravity, sound induced, light induced, electric induced, ionic interactions, van der Waals induced, Brownian motion, spinning, or other mechanical means.
- Samples may be mixed with multi-bead mixtures for times necessary to capture targets of interest ranging from, for example, a second to several hours.
- Samples may be introduced to the magnetic imaging device in various ways including, for example, by pipette, capillary flow tube or device, sample handling device, liquid handling device, integrated device, lateral flow device, disposable or reusable device.
- Samples may be deposited on the diamond surface by several modes of application including, for example, pipetting, pouring, dripping, capillary flow, pumping, gravity induced flow, magnetic induced flow, ionic induced flow, sound induced flow, light induced flow, mechanical vibration induced flow, sheath flow, centrifuge induced, and thermal induced flow.
- Samples may be magnetically imaged in a dry, dehydrated (i.e., partially dry or gel), or wet state.
- Having thus described several illustrative embodiments, it is to be appreciated that various alterations, modifications, and improvements will readily occur to those skilled in the art. While some examples presented herein involve specific combinations of functions or structural elements, it should be understood that those functions and elements may be combined in other ways according to the present disclosure to accomplish the same or different objectives. In particular, acts, elements, and features discussed in connection with one embodiment are not intended to be excluded from similar or other roles in other embodiments. Additionally, elements and components described herein may be further divided into additional components or joined together to form fewer components for performing the same functions.
- The foregoing description of example embodiments has been presented for the purposes of illustration and description. It is not intended to be exhaustive or to limit the present disclosure to the precise forms disclosed. Many modifications and variations are possible in light of this disclosure. It is intended that the scope of the present disclosure be limited not by this detailed description, but rather by the claims appended hereto. Future filed applications claiming priority to this application may claim the disclosed subject matter in a different manner, and may generally include any set of one or more limitations as variously disclosed or otherwise demonstrated herein.
Claims (23)
- A bead-based magnetic assay system (500) for detecting a complex including an analyte based on optically detected magnetic resonance (ODMR), the system comprising:(a) a plurality of functionalized beads (110) of a first type, which are magnetic functionalized beads and are functionalized to include a first moiety (115) that associates with an analyte (120) under suitable conditions;(b) a plurality of functionalized beads (130) of a second type, which are functionalized to include a second moiety (135) that associates with the analyte (120) under suitable conditions;(c) a substrate (532) including at least one ODMR center (540);(d) a light source (536) configured to generate incident light that excites electrons within the at least one ODMR center (540) from a ground state to an excited state;(e) a magnet (534) for applying a bias magnetic field on a complex (530) disposed over the at least one ODMR center (540), the complex (530) including one of the first type of functionalized bead (110), the analyte (120), and one of the second type of functionalized bead (130);(f) a microwave source (538) configured to generate a microwave field incident on the at least one ODMR center (540), the microwave source being further configured to generate the microwave field with frequencies which correspond to ground state transitions in the at least one ODMR center (540), in which the at least one ODMR center (540) produces emitted light (542) when illuminated by the incident light (536), characteristics of the emitted light (542) being influenced by the microwave field and by the magnetic functionalized bead (110) associated with the analyte (120) in the complex (530); and(g) an optical photodetector (544) that detects light (542) emitted by the at least one ODMR center (540).
- The system of claim 1, wherein the at least one ODMR center (540) is a silicon vacancy center in a silicon carbide lattice, or in a diamond lattice.
- The system of claim 1, wherein the at least one ODMR center (540) is a nitrogen-vacancy center in a diamond lattice.
- The system of claim 3, wherein the at least one ODMR center (540) is formed in an upper surface of the substrate (532), or the at least one ODMR center (540) is a plurality of ODMR centers formed in the upper surface of the diamond substrate (532).
- The system of claim 4, wherein the optical photodetector (544) is an optical imaging system having an imaging sensor that images the emitted light from the plurality of ODMR centers.
- The system of any one of the preceding claims, wherein each of the first (115) and the second (135) moiety is a receptor, protein, antibody, cell, virus, or nucleic acid sequence.
- The system of any one of the preceding claims, wherein the functionalized beads (110) of the first type comprise magnetic nanoparticles disposed within a polymer substrate, or on a surface of the polymer substrate.
- The system of any one of the preceding claims, wherein the functionalized beads (130) of the second type are fluorescent functionalized beads.
- The system of claim 1, wherein the functionalized beads (130) of the second type are magnetic functionalized beads, the second type of functionalized beads (130) including a magnetic property distinguishable from the functionalized beads of the first type (110).
- The system of claim 9, wherein the functionalized beads (110) of the first type are superparamagnetic functionalized beads including a superparamagnetic material.
- The system of claim 9, wherein the functionalized beads (130) of the second type are ferromagnetic functionalized beads including a ferromagnetic material.
- The system of any one of the preceding claims, further including a plurality of functionalized beads of at least a third type (1240), functionalized to include at least the second moiety (135, 1235) that associates with at least a second analyte (1250) under suitable conditions.
- A method (400) of detecting a complex including an analyte, the method comprising:(a) contacting (410) a sample in a solution with a population of functionalized beads of a first type, which are magnetic functionalized beads and are functionalized to include a first moiety that can specifically associate with an analyte under appropriate conditions;(b) contacting (420) the sample solution with a population of functionalized beads of a second type, which are functionalized to include a second moiety that associates with the analyte under suitable conditions, contact resulting in formation of a complex including one of the first type of functionalized bead, the analyte, and one of the second type of functionalized bead; and(c) detecting (430) the complex including the analyte by detecting magnetic fields produced by the magnetic functionalized bead and by detecting the functionalized bead of the second type associated with the analyte in the complex, said detecting of magnetic fields produced by the magnetic functionalized bead including disposing the sample solution including the complex over a substrate that includes at least one optically detected magnetic resonance (ODMR) center formed in the substrate; exciting electrons within the at least one ODMR center from a ground state to an excited state with incident light; applying a bias magnetic field on the complex; and generating a microwave field incident on the at least one ODMR center, the microwave field including frequencies that correspond to ground state transitions in the at least one ODMR center, wherein detecting the complex including the analyte further includes analyzing light emitted by the at least one ODMR center, characteristics of the emitted light being influenced by the microwave field and by the magnetic functionalized bead associated with the analyte in the complex.
- The method of claim 13, wherein the at least one ODMR center is a nitrogen-vacancy center in a diamond lattice.
- The method of claim 14, wherein the at least one ODMR center is formed in an upper surface of the substrate, or the at least one ODMR center is a plurality of ODMR centers formed in the upper surface of the substrate.
- The method of claim 15, wherein analyzing light emitted by the plurality of ODMR centers includes imaging the emitted light.
- The method of any one of claims 13 to 16, wherein the functionalized beads of the second type are fluorescent functionalized beads, and the method further includes illuminating the complex with incident light that excites fluorescence within the functionalized beads of the second type and fluorescence imaging of the complex.
- The method of any one of claims 13 to 16, wherein the functionalized beads of the second type are magnetic functionalized beads, including a magnetic property distinguishable from the functionalized beads of the first type.
- The method of any one of claims 13 to 18, further including applying a magnetic field gradient to the sample solution after contacting the sample solution with the functionalized beads of the first and second types.
- The method of claim 19, further including varying the magnetic field gradient applied to the sample solution.
- The method of any one of claims 13 to 20, further including concentrating the sample solution after contacting the sample solution with the population of functionalized beads of the second type.
- The method of any one of claims 13 to 21, further including agglomerating a plurality of functionalized beads of the first and second types, after contacting the sample solution with the population of functionalized beads of the second type, before detecting the complex.
- The method of any one of claims 13 to 22, further including dehydrating the sample solution after disposing the sample solution over the diamond substrate.
Applications Claiming Priority (2)
| Application Number | Priority Date | Filing Date | Title |
|---|---|---|---|
| US201662438593P | 2016-12-23 | 2016-12-23 | |
| PCT/US2017/068126 WO2018119367A1 (en) | 2016-12-23 | 2017-12-22 | Methods and apparatus for magnetic multi-bead assays |
Publications (3)
| Publication Number | Publication Date |
|---|---|
| EP3559668A1 EP3559668A1 (en) | 2019-10-30 |
| EP3559668A4 EP3559668A4 (en) | 2020-07-22 |
| EP3559668B1 true EP3559668B1 (en) | 2023-07-19 |
Family
ID=62627136
Family Applications (1)
| Application Number | Title | Priority Date | Filing Date |
|---|---|---|---|
| EP17884358.7A Active EP3559668B1 (en) | 2016-12-23 | 2017-12-22 | Methods and apparatus for magnetic multi-bead assays |
Country Status (5)
| Country | Link |
|---|---|
| US (2) | US11513115B2 (en) |
| EP (1) | EP3559668B1 (en) |
| JP (1) | JP7249281B2 (en) |
| CA (1) | CA3046849A1 (en) |
| WO (1) | WO2018119367A1 (en) |
Families Citing this family (11)
| Publication number | Priority date | Publication date | Assignee | Title |
|---|---|---|---|---|
| EP3529595B1 (en) | 2016-10-20 | 2023-05-31 | Quantum Diamond Technologies Inc. | Methods and apparatus for magnetic particle analysis using wide-field diamond magnetic imaging |
| WO2018119367A1 (en) | 2016-12-23 | 2018-06-28 | Quantum Diamond Technologies Inc. | Methods and apparatus for magnetic multi-bead assays |
| ES2932362T3 (en) | 2017-07-31 | 2023-01-18 | Quantum Diamond Tech Inc | Sensor system comprising a sample cartridge including a flexible membrane to support a sample |
| JP7417220B2 (en) * | 2019-05-24 | 2024-01-18 | 国立大学法人大阪大学 | Imaging device and imaging method |
| JP7392336B2 (en) * | 2019-09-06 | 2023-12-06 | 株式会社島津製作所 | Magnetic resonance spectrometer and magnetic resonance spectroscopy measurement method |
| JP2023500413A (en) * | 2019-11-12 | 2023-01-05 | クアンタム ダイヤモンド テクノロジーズ インク. | Bead system, method and apparatus for magnetic bead-based analyte detection |
| KR102313685B1 (en) * | 2020-07-13 | 2021-10-18 | 한양대학교 산학협력단 | Fluorescence detection system using diamond nitrogen vacancy center |
| US11585870B2 (en) * | 2020-09-15 | 2023-02-21 | Massachusetts Institute Of Technology | Absorption-based diamond spin microscopy on a plasmonic quantum metasurface |
| FR3120127B1 (en) * | 2021-02-24 | 2023-09-15 | Magia Diagnostics | METHOD AND DEVICE FOR ANALYZING A LIQUID LIKELY TO CONTAIN AN ANALYTE |
| WO2023141319A1 (en) * | 2022-01-24 | 2023-07-27 | Amgen Inc. | Methods for detecting antibody self-association |
| JP2024018233A (en) * | 2022-07-29 | 2024-02-08 | スミダコーポレーション株式会社 | Measuring device and method |
Family Cites Families (79)
| Publication number | Priority date | Publication date | Assignee | Title |
|---|---|---|---|---|
| GB2045431B (en) | 1979-02-26 | 1983-04-20 | Technicon Instr | Immunoassay utilising two particulate reagents |
| US4628037A (en) | 1983-05-12 | 1986-12-09 | Advanced Magnetics, Inc. | Binding assays employing magnetic particles |
| US4695392A (en) | 1983-05-12 | 1987-09-22 | Advanced Magnetics Inc. | Magnetic particles for use in separations |
| US5145784A (en) | 1988-05-04 | 1992-09-08 | Cambridge Biotech Corporation | Double capture assay method employing a capillary flow device |
| CA2013014A1 (en) | 1989-11-30 | 1991-05-31 | Linda A. Mauck | Dry immunoassay analytical element comprising monodispersed beads |
| US5547555A (en) | 1993-02-22 | 1996-08-20 | Ohmicron Technology, Inc. | Electrochemical sensor cartridge |
| US5648124A (en) | 1993-07-09 | 1997-07-15 | Seradyn, Inc. | Process for preparing magnetically responsive microparticles |
| JP3854680B2 (en) | 1997-02-26 | 2006-12-06 | キヤノン株式会社 | Pressure partition and exposure apparatus using the same |
| US5998224A (en) | 1997-05-16 | 1999-12-07 | Abbott Laboratories | Magnetically assisted binding assays utilizing a magnetically responsive reagent |
| US6050138A (en) | 1997-10-22 | 2000-04-18 | Exponent, Inc. | System and method for performing bulge testing of films, coatings and/or layers |
| US6979424B2 (en) | 1998-03-17 | 2005-12-27 | Cepheid | Integrated sample analysis device |
| CN1565749A (en) | 1998-06-17 | 2005-01-19 | 俄亥俄州立大学 | Membrane electrostatic precipitator |
| US6178033B1 (en) | 1999-03-28 | 2001-01-23 | Lucent Technologies | Micromechanical membrane tilt-mirror switch |
| US6602714B1 (en) | 1999-11-09 | 2003-08-05 | Sri International | Viscosity and mass sensor for the high-throughput synthesis, screening and characterization of combinatorial libraries |
| US7635571B2 (en) | 2000-12-07 | 2009-12-22 | Siemens Healthcare Diagnostics Products Gmbh | Amplified signal in binding assays |
| US6896850B2 (en) | 2001-03-26 | 2005-05-24 | Kumetrix, Inc. | Silicon nitride window for microsampling device and method of construction |
| US7474180B2 (en) | 2002-11-01 | 2009-01-06 | Georgia Tech Research Corp. | Single substrate electromagnetic actuator |
| US7086288B2 (en) | 2002-11-27 | 2006-08-08 | Northwestern University | Thin membrane transducer |
| DE10309132A1 (en) * | 2003-02-28 | 2004-11-18 | Forschungszentrum Jülich GmbH | Method and device for the selective detection of magnetic particles |
| US7780918B2 (en) | 2003-05-14 | 2010-08-24 | Nantero, Inc. | Sensor platform using a horizontally oriented nanotube element |
| US7279286B2 (en) | 2003-09-11 | 2007-10-09 | Sanofi-Aventis Deutschland Gmbh | High-throughput-assay with high sensitivity for measuring of the activity of β-adrenergic receptor kinase and for determining the impact of test substances on such activity |
| US7531366B2 (en) * | 2004-07-23 | 2009-05-12 | Platypus Technologies, Llc | Bead based assays using a liquid crystal reporter |
| EP1662256A1 (en) | 2004-11-25 | 2006-05-31 | Spinomix S.A. | Tailored magnetic particles and method to produce same |
| US7489593B2 (en) | 2004-11-30 | 2009-02-10 | Vermon | Electrostatic membranes for sensors, ultrasonic transducers incorporating such membranes, and manufacturing methods therefor |
| US8828740B2 (en) | 2005-01-31 | 2014-09-09 | Koninklijke Philips N.V. | Rapid and sensitive biosensing |
| US7637149B2 (en) | 2005-06-17 | 2009-12-29 | Georgia Tech Research Corporation | Integrated displacement sensors for probe microscopy and force spectroscopy |
| US20070103697A1 (en) | 2005-06-17 | 2007-05-10 | Degertekin Fahrettin L | Integrated displacement sensors for probe microscopy and force spectroscopy |
| US8220318B2 (en) | 2005-06-17 | 2012-07-17 | Georgia Tech Research Corporation | Fast microscale actuators for probe microscopy |
| EP1960306A4 (en) | 2005-11-22 | 2014-04-02 | Mycrolab Diagnostics Pty Ltd | Microfluidic structures |
| WO2008004572A1 (en) | 2006-07-05 | 2008-01-10 | Aida Engineering, Ltd. | Micro passage chip, and fluid transferring method |
| US20080108122A1 (en) | 2006-09-01 | 2008-05-08 | State of Oregon acting by and through the State Board of Higher Education on behalf of Oregon | Microchemical nanofactories |
| EP2064710A4 (en) | 2006-09-06 | 2011-05-04 | Univ Illinois | Controlled buckling structures in semiconductor interconnects and nanomembranes for stretchable electronics |
| JP5221549B2 (en) | 2006-10-12 | 2013-06-26 | コーニンクレッカ フィリップス エレクトロニクス エヌ ヴィ | High-speed biosensor with reagent layer |
| US10529003B2 (en) | 2008-04-07 | 2020-01-07 | Mohammad A. Mazed | Optical biomodule for detection of diseases at an early onset |
| WO2008101196A1 (en) | 2007-02-15 | 2008-08-21 | Osmetech Molecular Diagnostics | Fluidics devices |
| US20090134481A1 (en) | 2007-11-28 | 2009-05-28 | Analog Devices, Inc. | Molded Sensor Package and Assembly Method |
| EP2108938A1 (en) | 2008-04-09 | 2009-10-14 | Koninklijke Philips Electronics N.V. | A carrier for optical detection in small sample volumes |
| US8500637B2 (en) | 2008-07-14 | 2013-08-06 | Ecole Polytechnique Federale De Lausanne (Epfl) | Viscosimetric biosensor for monitoring analyte levels |
| US8222047B2 (en) | 2008-09-23 | 2012-07-17 | Quanterix Corporation | Ultra-sensitive detection of molecules on single molecule arrays |
| US8766630B2 (en) | 2008-11-04 | 2014-07-01 | The University Of Melbourne | Method and apparatus for monitoring a property of a sample |
| JP5715068B2 (en) | 2009-01-30 | 2015-05-07 | マイクロニクス, インコーポレイテッド | Portable high gain fluorescence detection system |
| US8059271B2 (en) | 2009-02-04 | 2011-11-15 | The United States Of America As Represented By The Secretary Of The Army | Reusable sample holding device permitting ready loading of very small wet samples |
| US8691557B2 (en) | 2009-02-06 | 2014-04-08 | The Ohio State University | Magnetic platforms for biomolecule trappings, manipulations, and sorting |
| FI122507B (en) | 2009-05-26 | 2012-02-29 | Outotec Oyj | Array of analyzer measurement window |
| EP2457078A4 (en) | 2009-07-23 | 2014-07-30 | Insight Nanofluidics Inc | Nanofluidic cell |
| TW201113523A (en) * | 2009-08-31 | 2011-04-16 | Mbio Diagnostics Inc | Integrated sample preparation and analyte detection |
| US8193808B2 (en) * | 2009-09-11 | 2012-06-05 | Hewlett-Packard Development Company, L.P. | Optically integrated biosensor based on optically detected magnetic resonance |
| FR2950153B1 (en) | 2009-09-15 | 2011-12-23 | Commissariat Energie Atomique | OPTICAL DEVICE WITH DEFORMABLE MEMBRANE WITH PIEZOELECTRIC ACTUATION |
| US8236574B2 (en) | 2010-03-01 | 2012-08-07 | Quanterix Corporation | Ultra-sensitive detection of molecules or particles using beads or other capture objects |
| US20110262989A1 (en) * | 2010-04-21 | 2011-10-27 | Nanomr, Inc. | Isolating a target analyte from a body fluid |
| EP2596356A1 (en) * | 2010-07-23 | 2013-05-29 | Merck Patent GmbH | Method of performing an assay |
| GB201014805D0 (en) | 2010-09-07 | 2010-10-20 | Multi Sense Technologies Ltd | Microfluidics based assay device |
| JP2012121748A (en) | 2010-12-07 | 2012-06-28 | Sumitomo Electric Ind Ltd | Diamond and magnetic sensor using the same |
| WO2012103511A2 (en) | 2011-01-27 | 2012-08-02 | Invisible Sentinel, Inc. | Analyte detection devices, multiplex and tabletop devices for detection of analytes, and uses thereof |
| US8989354B2 (en) | 2011-05-16 | 2015-03-24 | Brigham Young University | Carbon composite support structure |
| GB201108644D0 (en) * | 2011-05-24 | 2011-07-06 | Element Six Ltd | Diamond sensors, detectors, and quantum devices |
| GB2497317A (en) * | 2011-12-06 | 2013-06-12 | Univ Dublin | System and method for the detection of analytes using rod-shaped nanoparticles |
| WO2013059404A1 (en) | 2011-10-19 | 2013-04-25 | The Trustees Of Columbia University In The City Of New York | Systems and methods for deterministic emitter switch microscopy |
| US9632045B2 (en) * | 2011-10-19 | 2017-04-25 | The Trustees Of Columbia University In The City Of New York | Systems and methods for deterministic emitter switch microscopy |
| KR20130051647A (en) | 2011-11-10 | 2013-05-21 | 한국전자통신연구원 | Method for analysis of biomaterials using magnetic bead |
| US9797817B2 (en) | 2012-05-03 | 2017-10-24 | The Regents Of The University Of Michigan | Multi-mode separation for target detection |
| US20150184235A1 (en) | 2012-07-10 | 2015-07-02 | Lexogen Gmbh | Flexible sensor carrier and method |
| WO2014051886A1 (en) | 2012-08-22 | 2014-04-03 | President And Fellows Of Harvard College | Nanoscale scanning sensors |
| JP2014095025A (en) | 2012-11-08 | 2014-05-22 | Osaka Univ | Diamond composite particles |
| US9551704B2 (en) * | 2012-12-19 | 2017-01-24 | Dna Electronics, Inc. | Target detection |
| EP2869922B1 (en) | 2013-01-09 | 2019-11-20 | Tecan Trading AG | Disposable cartridge for microfluidics systems |
| WO2014210486A1 (en) | 2013-06-28 | 2014-12-31 | Dirk Robert Englund | Wide-field sensing using nitrogen vacancies |
| US9778329B2 (en) | 2014-02-19 | 2017-10-03 | Infinitum Solutions, Inc. | Integrated optical nanoscale probe measurement of electric fields from electric charges in electronic devices |
| US9910105B2 (en) | 2014-03-20 | 2018-03-06 | Lockheed Martin Corporation | DNV magnetic field detector |
| JP6298728B2 (en) | 2014-06-26 | 2018-03-20 | ルネサスエレクトロニクス株式会社 | Magnetic measuring device |
| US9435791B2 (en) | 2014-06-27 | 2016-09-06 | Verily Life Sciences, LLC | Method for using nanodiamonds to detect nearby magnetic nanoparticles |
| EP3248021A4 (en) | 2015-01-23 | 2018-12-12 | Lockheed Martin Corporation | Dnv magnetic field detector |
| JP2016188828A (en) | 2015-03-30 | 2016-11-04 | 東ソー株式会社 | Measuring method of target substance utilizing magnetic signal |
| JP6655415B2 (en) | 2016-02-16 | 2020-02-26 | ルネサスエレクトロニクス株式会社 | Magnetic measuring device |
| EP3529595B1 (en) | 2016-10-20 | 2023-05-31 | Quantum Diamond Technologies Inc. | Methods and apparatus for magnetic particle analysis using wide-field diamond magnetic imaging |
| WO2018119367A1 (en) | 2016-12-23 | 2018-06-28 | Quantum Diamond Technologies Inc. | Methods and apparatus for magnetic multi-bead assays |
| IT201700017061A1 (en) | 2017-02-15 | 2018-08-15 | Technoprobe Spa | Improved measurement card for high frequency applications |
| ES2932362T3 (en) | 2017-07-31 | 2023-01-18 | Quantum Diamond Tech Inc | Sensor system comprising a sample cartridge including a flexible membrane to support a sample |
| JP2023500413A (en) | 2019-11-12 | 2023-01-05 | クアンタム ダイヤモンド テクノロジーズ インク. | Bead system, method and apparatus for magnetic bead-based analyte detection |
-
2017
- 2017-12-22 WO PCT/US2017/068126 patent/WO2018119367A1/en unknown
- 2017-12-22 JP JP2019534665A patent/JP7249281B2/en active Active
- 2017-12-22 US US16/467,474 patent/US11513115B2/en active Active
- 2017-12-22 CA CA3046849A patent/CA3046849A1/en active Pending
- 2017-12-22 EP EP17884358.7A patent/EP3559668B1/en active Active
-
2022
- 2022-11-07 US US17/981,658 patent/US20230071162A1/en active Pending
Also Published As
| Publication number | Publication date |
|---|---|
| EP3559668A4 (en) | 2020-07-22 |
| US20230071162A1 (en) | 2023-03-09 |
| US11513115B2 (en) | 2022-11-29 |
| JP2020514709A (en) | 2020-05-21 |
| JP7249281B2 (en) | 2023-03-30 |
| US20190331674A1 (en) | 2019-10-31 |
| EP3559668A1 (en) | 2019-10-30 |
| WO2018119367A1 (en) | 2018-06-28 |
| CA3046849A1 (en) | 2018-06-28 |
Similar Documents
| Publication | Publication Date | Title |
|---|---|---|
| EP3559668B1 (en) | Methods and apparatus for magnetic multi-bead assays | |
| JP5970153B2 (en) | Aggregation parameter measurement | |
| Aytur et al. | A novel magnetic bead bioassay platform using a microchip-based sensor for infectious disease diagnosis | |
| JP5311445B2 (en) | Fast and sensitive biosensing | |
| US8697435B2 (en) | Integrated sample preparation and analyte detection | |
| EP3270160A1 (en) | Method for detecting test substance and reagent kit used in said method | |
| US20120119727A1 (en) | Sensor with high frequency ac magnetic field | |
| US20130157283A1 (en) | Rapid pathogen diagnostic device and method | |
| EP2960651B1 (en) | Bioanalysis device and biomolecule analyser | |
| Moser et al. | On-chip immuno-agglutination assay with analyte capture by dynamic manipulation of superparamagnetic beads | |
| JP2009186459A (en) | Rapid particle detection assay | |
| HU225636B1 (en) | Method for detecting analyte(s) in fluid | |
| US20120262565A1 (en) | Sensor device with imaging optics | |
| CN114923886A (en) | Single-molecule fluorescence detection method based on grating and magnetic array | |
| CN101627297B (en) | Measuring agglutination parameters | |
| US20220397572A1 (en) | Bead systems, methods, and apparatus for magnetic bead-based analyte detection | |
| CN115667928A (en) | Methods, systems, articles of manufacture, kits and uses thereof for detection of biomolecules, biological organelles, biological particles, cells and microorganisms |
Legal Events
| Date | Code | Title | Description |
|---|---|---|---|
| STAA | Information on the status of an ep patent application or granted ep patent |
Free format text: STATUS: THE INTERNATIONAL PUBLICATION HAS BEEN MADE |
|
| PUAI | Public reference made under article 153(3) epc to a published international application that has entered the european phase |
Free format text: ORIGINAL CODE: 0009012 |
|
| STAA | Information on the status of an ep patent application or granted ep patent |
Free format text: STATUS: REQUEST FOR EXAMINATION WAS MADE |
|
| 17P | Request for examination filed |
Effective date: 20190627 |
|
| AK | Designated contracting states |
Kind code of ref document: A1 Designated state(s): AL AT BE BG CH CY CZ DE DK EE ES FI FR GB GR HR HU IE IS IT LI LT LU LV MC MK MT NL NO PL PT RO RS SE SI SK SM TR |
|
| AX | Request for extension of the european patent |
Extension state: BA ME |
|
| DAV | Request for validation of the european patent (deleted) | ||
| DAX | Request for extension of the european patent (deleted) | ||
| A4 | Supplementary search report drawn up and despatched |
Effective date: 20200622 |
|
| RIC1 | Information provided on ipc code assigned before grant |
Ipc: G01N 33/543 20060101AFI20200616BHEP Ipc: G01N 27/72 20060101ALI20200616BHEP Ipc: G01N 24/00 20060101ALI20200616BHEP Ipc: G01N 33/553 20060101ALI20200616BHEP Ipc: G01N 33/536 20060101ALI20200616BHEP |
|
| GRAP | Despatch of communication of intention to grant a patent |
Free format text: ORIGINAL CODE: EPIDOSNIGR1 |
|
| STAA | Information on the status of an ep patent application or granted ep patent |
Free format text: STATUS: GRANT OF PATENT IS INTENDED |
|
| INTG | Intention to grant announced |
Effective date: 20210521 |
|
| GRAJ | Information related to disapproval of communication of intention to grant by the applicant or resumption of examination proceedings by the epo deleted |
Free format text: ORIGINAL CODE: EPIDOSDIGR1 |
|
| STAA | Information on the status of an ep patent application or granted ep patent |
Free format text: STATUS: REQUEST FOR EXAMINATION WAS MADE |
|
| INTC | Intention to grant announced (deleted) | ||
| GRAP | Despatch of communication of intention to grant a patent |
Free format text: ORIGINAL CODE: EPIDOSNIGR1 |
|
| STAA | Information on the status of an ep patent application or granted ep patent |
Free format text: STATUS: GRANT OF PATENT IS INTENDED |
|
| GRAJ | Information related to disapproval of communication of intention to grant by the applicant or resumption of examination proceedings by the epo deleted |
Free format text: ORIGINAL CODE: EPIDOSDIGR1 |
|
| GRAP | Despatch of communication of intention to grant a patent |
Free format text: ORIGINAL CODE: EPIDOSNIGR1 |
|
| STAA | Information on the status of an ep patent application or granted ep patent |
Free format text: STATUS: GRANT OF PATENT IS INTENDED |
|
| INTG | Intention to grant announced |
Effective date: 20211012 |
|
| INTG | Intention to grant announced |
Effective date: 20211027 |
|
| INTG | Intention to grant announced |
Effective date: 20211104 |
|
| GRAJ | Information related to disapproval of communication of intention to grant by the applicant or resumption of examination proceedings by the epo deleted |
Free format text: ORIGINAL CODE: EPIDOSDIGR1 |
|
| STAA | Information on the status of an ep patent application or granted ep patent |
Free format text: STATUS: REQUEST FOR EXAMINATION WAS MADE |
|
| STAA | Information on the status of an ep patent application or granted ep patent |
Free format text: STATUS: EXAMINATION IS IN PROGRESS |
|
| INTC | Intention to grant announced (deleted) | ||
| 17Q | First examination report despatched |
Effective date: 20220303 |
|
| GRAP | Despatch of communication of intention to grant a patent |
Free format text: ORIGINAL CODE: EPIDOSNIGR1 |
|
| STAA | Information on the status of an ep patent application or granted ep patent |
Free format text: STATUS: GRANT OF PATENT IS INTENDED |
|
| INTG | Intention to grant announced |
Effective date: 20221117 |
|
| GRAS | Grant fee paid |
Free format text: ORIGINAL CODE: EPIDOSNIGR3 |
|
| GRAA | (expected) grant |
Free format text: ORIGINAL CODE: 0009210 |
|
| STAA | Information on the status of an ep patent application or granted ep patent |
Free format text: STATUS: THE PATENT HAS BEEN GRANTED |
|
| P01 | Opt-out of the competence of the unified patent court (upc) registered |
Effective date: 20230526 |
|
| AK | Designated contracting states |
Kind code of ref document: B1 Designated state(s): AL AT BE BG CH CY CZ DE DK EE ES FI FR GB GR HR HU IE IS IT LI LT LU LV MC MK MT NL NO PL PT RO RS SE SI SK SM TR |
|
| REG | Reference to a national code |
Ref country code: GB Ref legal event code: FG4D |
|
| REG | Reference to a national code |
Ref country code: CH Ref legal event code: EP |
|
| REG | Reference to a national code |
Ref country code: DE Ref legal event code: R096 Ref document number: 602017071629 Country of ref document: DE |
|
| REG | Reference to a national code |
Ref country code: IE Ref legal event code: FG4D |
|
| REG | Reference to a national code |
Ref country code: LT Ref legal event code: MG9D |
|
| REG | Reference to a national code |
Ref country code: NL Ref legal event code: MP Effective date: 20230719 |
|
| REG | Reference to a national code |
Ref country code: AT Ref legal event code: MK05 Ref document number: 1589957 Country of ref document: AT Kind code of ref document: T Effective date: 20230719 |
|
| RAP4 | Party data changed (patent owner data changed or rights of a patent transferred) |
Owner name: QUANTUM DIAMOND TECHNOLOGIES INC. |
|
| PG25 | Lapsed in a contracting state [announced via postgrant information from national office to epo] |
Ref country code: NL Free format text: LAPSE BECAUSE OF FAILURE TO SUBMIT A TRANSLATION OF THE DESCRIPTION OR TO PAY THE FEE WITHIN THE PRESCRIBED TIME-LIMIT Effective date: 20230719 |
|
| REG | Reference to a national code |
Ref country code: DE Ref legal event code: R081 Ref document number: 602017071629 Country of ref document: DE Owner name: QUANTUM DIAMOND TECHNOLOGIES INC., WALTHAM, US Free format text: FORMER OWNER: QUANTUM DIAMOND TECHNOLOGIES INC., SOMERVILLE, MA, US |
|
| PG25 | Lapsed in a contracting state [announced via postgrant information from national office to epo] |
Ref country code: GR Free format text: LAPSE BECAUSE OF FAILURE TO SUBMIT A TRANSLATION OF THE DESCRIPTION OR TO PAY THE FEE WITHIN THE PRESCRIBED TIME-LIMIT Effective date: 20231020 |
|
| PGFP | Annual fee paid to national office [announced via postgrant information from national office to epo] |
Ref country code: GB Payment date: 20231102 Year of fee payment: 7 |
|
| PG25 | Lapsed in a contracting state [announced via postgrant information from national office to epo] |
Ref country code: IS Free format text: LAPSE BECAUSE OF FAILURE TO SUBMIT A TRANSLATION OF THE DESCRIPTION OR TO PAY THE FEE WITHIN THE PRESCRIBED TIME-LIMIT Effective date: 20231119 |
|
| PG25 | Lapsed in a contracting state [announced via postgrant information from national office to epo] |
Ref country code: SE Free format text: LAPSE BECAUSE OF FAILURE TO SUBMIT A TRANSLATION OF THE DESCRIPTION OR TO PAY THE FEE WITHIN THE PRESCRIBED TIME-LIMIT Effective date: 20230719 Ref country code: RS Free format text: LAPSE BECAUSE OF FAILURE TO SUBMIT A TRANSLATION OF THE DESCRIPTION OR TO PAY THE FEE WITHIN THE PRESCRIBED TIME-LIMIT Effective date: 20230719 Ref country code: PT Free format text: LAPSE BECAUSE OF FAILURE TO SUBMIT A TRANSLATION OF THE DESCRIPTION OR TO PAY THE FEE WITHIN THE PRESCRIBED TIME-LIMIT Effective date: 20231120 Ref country code: NO Free format text: LAPSE BECAUSE OF FAILURE TO SUBMIT A TRANSLATION OF THE DESCRIPTION OR TO PAY THE FEE WITHIN THE PRESCRIBED TIME-LIMIT Effective date: 20231019 Ref country code: LV Free format text: LAPSE BECAUSE OF FAILURE TO SUBMIT A TRANSLATION OF THE DESCRIPTION OR TO PAY THE FEE WITHIN THE PRESCRIBED TIME-LIMIT Effective date: 20230719 Ref country code: LT Free format text: LAPSE BECAUSE OF FAILURE TO SUBMIT A TRANSLATION OF THE DESCRIPTION OR TO PAY THE FEE WITHIN THE PRESCRIBED TIME-LIMIT Effective date: 20230719 Ref country code: IS Free format text: LAPSE BECAUSE OF FAILURE TO SUBMIT A TRANSLATION OF THE DESCRIPTION OR TO PAY THE FEE WITHIN THE PRESCRIBED TIME-LIMIT Effective date: 20231119 Ref country code: HR Free format text: LAPSE BECAUSE OF FAILURE TO SUBMIT A TRANSLATION OF THE DESCRIPTION OR TO PAY THE FEE WITHIN THE PRESCRIBED TIME-LIMIT Effective date: 20230719 Ref country code: GR Free format text: LAPSE BECAUSE OF FAILURE TO SUBMIT A TRANSLATION OF THE DESCRIPTION OR TO PAY THE FEE WITHIN THE PRESCRIBED TIME-LIMIT Effective date: 20231020 Ref country code: FI Free format text: LAPSE BECAUSE OF FAILURE TO SUBMIT A TRANSLATION OF THE DESCRIPTION OR TO PAY THE FEE WITHIN THE PRESCRIBED TIME-LIMIT Effective date: 20230719 Ref country code: AT Free format text: LAPSE BECAUSE OF FAILURE TO SUBMIT A TRANSLATION OF THE DESCRIPTION OR TO PAY THE FEE WITHIN THE PRESCRIBED TIME-LIMIT Effective date: 20230719 |
|
| PGFP | Annual fee paid to national office [announced via postgrant information from national office to epo] |
Ref country code: FR Payment date: 20231211 Year of fee payment: 7 Ref country code: DE Payment date: 20231031 Year of fee payment: 7 |
|
| PG25 | Lapsed in a contracting state [announced via postgrant information from national office to epo] |
Ref country code: PL Free format text: LAPSE BECAUSE OF FAILURE TO SUBMIT A TRANSLATION OF THE DESCRIPTION OR TO PAY THE FEE WITHIN THE PRESCRIBED TIME-LIMIT Effective date: 20230719 |