EP3559628B1 - System und verfahren zur probenverarbeitung - Google Patents
System und verfahren zur probenverarbeitung Download PDFInfo
- Publication number
- EP3559628B1 EP3559628B1 EP17832141.0A EP17832141A EP3559628B1 EP 3559628 B1 EP3559628 B1 EP 3559628B1 EP 17832141 A EP17832141 A EP 17832141A EP 3559628 B1 EP3559628 B1 EP 3559628B1
- Authority
- EP
- European Patent Office
- Prior art keywords
- sample
- reagent
- tissue
- time
- concentration
- Prior art date
- Legal status (The legal status is an assumption and is not a legal conclusion. Google has not performed a legal analysis and makes no representation as to the accuracy of the status listed.)
- Active
Links
Images


Classifications
-
- G—PHYSICS
- G01—MEASURING; TESTING
- G01N—INVESTIGATING OR ANALYSING MATERIALS BY DETERMINING THEIR CHEMICAL OR PHYSICAL PROPERTIES
- G01N1/00—Sampling; Preparing specimens for investigation
- G01N1/28—Preparing specimens for investigation including physical details of (bio-)chemical methods covered elsewhere, e.g. G01N33/50, C12Q
- G01N1/30—Staining; Impregnating ; Fixation; Dehydration; Multistep processes for preparing samples of tissue, cell or nucleic acid material and the like for analysis
- G01N1/31—Apparatus therefor
-
- G—PHYSICS
- G01—MEASURING; TESTING
- G01N—INVESTIGATING OR ANALYSING MATERIALS BY DETERMINING THEIR CHEMICAL OR PHYSICAL PROPERTIES
- G01N1/00—Sampling; Preparing specimens for investigation
- G01N1/28—Preparing specimens for investigation including physical details of (bio-)chemical methods covered elsewhere, e.g. G01N33/50, C12Q
- G01N1/30—Staining; Impregnating ; Fixation; Dehydration; Multistep processes for preparing samples of tissue, cell or nucleic acid material and the like for analysis
-
- G—PHYSICS
- G01—MEASURING; TESTING
- G01N—INVESTIGATING OR ANALYSING MATERIALS BY DETERMINING THEIR CHEMICAL OR PHYSICAL PROPERTIES
- G01N29/00—Investigating or analysing materials by the use of ultrasonic, sonic or infrasonic waves; Visualisation of the interior of objects by transmitting ultrasonic or sonic waves through the object
- G01N29/02—Analysing fluids
- G01N29/024—Analysing fluids by measuring propagation velocity or propagation time of acoustic waves
-
- G—PHYSICS
- G01—MEASURING; TESTING
- G01N—INVESTIGATING OR ANALYSING MATERIALS BY DETERMINING THEIR CHEMICAL OR PHYSICAL PROPERTIES
- G01N29/00—Investigating or analysing materials by the use of ultrasonic, sonic or infrasonic waves; Visualisation of the interior of objects by transmitting ultrasonic or sonic waves through the object
- G01N29/04—Analysing solids
- G01N29/07—Analysing solids by measuring propagation velocity or propagation time of acoustic waves
-
- G—PHYSICS
- G01—MEASURING; TESTING
- G01N—INVESTIGATING OR ANALYSING MATERIALS BY DETERMINING THEIR CHEMICAL OR PHYSICAL PROPERTIES
- G01N29/00—Investigating or analysing materials by the use of ultrasonic, sonic or infrasonic waves; Visualisation of the interior of objects by transmitting ultrasonic or sonic waves through the object
- G01N29/44—Processing the detected response signal, e.g. electronic circuits specially adapted therefor
- G01N29/4409—Processing the detected response signal, e.g. electronic circuits specially adapted therefor by comparison
- G01N29/4418—Processing the detected response signal, e.g. electronic circuits specially adapted therefor by comparison with a model, e.g. best-fit, regression analysis
-
- G—PHYSICS
- G01—MEASURING; TESTING
- G01N—INVESTIGATING OR ANALYSING MATERIALS BY DETERMINING THEIR CHEMICAL OR PHYSICAL PROPERTIES
- G01N29/00—Investigating or analysing materials by the use of ultrasonic, sonic or infrasonic waves; Visualisation of the interior of objects by transmitting ultrasonic or sonic waves through the object
- G01N29/44—Processing the detected response signal, e.g. electronic circuits specially adapted therefor
- G01N29/4409—Processing the detected response signal, e.g. electronic circuits specially adapted therefor by comparison
- G01N29/4427—Processing the detected response signal, e.g. electronic circuits specially adapted therefor by comparison with stored values, e.g. threshold values
-
- G—PHYSICS
- G01—MEASURING; TESTING
- G01N—INVESTIGATING OR ANALYSING MATERIALS BY DETERMINING THEIR CHEMICAL OR PHYSICAL PROPERTIES
- G01N29/00—Investigating or analysing materials by the use of ultrasonic, sonic or infrasonic waves; Visualisation of the interior of objects by transmitting ultrasonic or sonic waves through the object
- G01N29/44—Processing the detected response signal, e.g. electronic circuits specially adapted therefor
- G01N29/4472—Mathematical theories or simulation
-
- G—PHYSICS
- G01—MEASURING; TESTING
- G01N—INVESTIGATING OR ANALYSING MATERIALS BY DETERMINING THEIR CHEMICAL OR PHYSICAL PROPERTIES
- G01N1/00—Sampling; Preparing specimens for investigation
- G01N1/28—Preparing specimens for investigation including physical details of (bio-)chemical methods covered elsewhere, e.g. G01N33/50, C12Q
- G01N1/30—Staining; Impregnating ; Fixation; Dehydration; Multistep processes for preparing samples of tissue, cell or nucleic acid material and the like for analysis
- G01N2001/305—Fixative compositions
-
- G—PHYSICS
- G01—MEASURING; TESTING
- G01N—INVESTIGATING OR ANALYSING MATERIALS BY DETERMINING THEIR CHEMICAL OR PHYSICAL PROPERTIES
- G01N2291/00—Indexing codes associated with group G01N29/00
- G01N2291/01—Indexing codes associated with the measuring variable
- G01N2291/011—Velocity or travel time
-
- G—PHYSICS
- G01—MEASURING; TESTING
- G01N—INVESTIGATING OR ANALYSING MATERIALS BY DETERMINING THEIR CHEMICAL OR PHYSICAL PROPERTIES
- G01N2291/00—Indexing codes associated with group G01N29/00
- G01N2291/02—Indexing codes associated with the analysed material
- G01N2291/023—Solids
-
- G—PHYSICS
- G01—MEASURING; TESTING
- G01N—INVESTIGATING OR ANALYSING MATERIALS BY DETERMINING THEIR CHEMICAL OR PHYSICAL PROPERTIES
- G01N2291/00—Indexing codes associated with group G01N29/00
- G01N2291/02—Indexing codes associated with the analysed material
- G01N2291/024—Mixtures
- G01N2291/02475—Tissue characterisation
-
- G—PHYSICS
- G01—MEASURING; TESTING
- G01N—INVESTIGATING OR ANALYSING MATERIALS BY DETERMINING THEIR CHEMICAL OR PHYSICAL PROPERTIES
- G01N2291/00—Indexing codes associated with group G01N29/00
- G01N2291/02—Indexing codes associated with the analysed material
- G01N2291/028—Material parameters
- G01N2291/02809—Concentration of a compound, e.g. measured by a surface mass change
Definitions
- the present disclosure generally relates to systems and methods for ensuring a biological sample is properly preserved for analysis. More particularly, the present disclosure relates to systems and methods for ensuring that a cellular sample is sufficiently fixed to provide consistently good staining of tissue and/or cellular components.
- “Fixation” in 10% NBF serves to preserve tissue by cross-linking of proteins and nucleic acids.
- the cross-linking preserves the characteristics of the tissue, such as the tissue structure, cell structure and molecular integrity.
- fixation with 10% NBF takes several hours and can be thought of as two separate steps.
- First is the diffusion step of formalin into the tissue.
- formalin molecules interact with biological molecules in the tissue to form cross-links.
- These cross-links can help keep the cellular structure intact during subsequent processing steps such as tissue dehydration, clearing, embedding in paraffin, sectioning, de-paraffinization, and staining.
- the tissue is "over-fixed," it may be difficult to diffuse processing liquids through the tissue due to an overly extensive network of cross-linked molecules that limit paths for diffusion. This can result in inadequate penetration of subsequent processing liquids. If the processing liquid is a stain, slow diffusion rates can cause uneven and inconsistent staining. These types of problems can be increased if the "stain” includes relatively large molecules. For example, conjugated biomolecules (such as antibody or nucleic acid probe molecules) can be relatively large, often having a mass of several hundred kilodaltons, causing them to diffuse slowly into solid tissue, particularly if the tissue is over-fixed. While over-fixation can sometimes be remedied by extensive antigen and target retrieval procedures, such procedures are time consuming and not always successful, particularly for retrieval of labile biomarkers such as phosphorylated proteins.
- conjugated biomolecules such as antibody or nucleic acid probe molecules
- the tissue may be degraded, for example, by autocatalytic destruction, leading to loss of tissue and cellular morphology as well as loss of protein and nucleic acid markers of diagnostic significance. Furthermore, processing after incomplete fixation of a sample can also lead to loss of morphological features of diagnostic significance. For example, without a sufficient network of cross- linked molecules, cells, nuclei and cytoplasm can shrink during dehydration steps. Accordingly, under-fixed tissue may be unsuitable for examination and is often discarded.
- WO 2016/097163 discloses a method and system for determining the diffusivity constant of a fluid diffusing into a porous material, wherein a sample of the porous material is immersed into the fluid, time-of-flight (TOF) data of ultrasonic waves passed through the sample are collected, a TOF trend for a plurality of candidate diffusivity constants is modelled, an error function is calculated to determine a candidate diffusivity constant as the true diffusivity constant, and the concentration of the fluid in the porous sample is calculated using said candidate diffusivity constant.
- TOF time-of-flight
- the system and method are based on acoustic time-of-flight (TOF) information correlated with a diffusion model to reconstruct the concentration of the reagent (such as formaldehyde) at a particular point(s) within a tissue sample over time as the reagent diffuses into the sample.
- TOF time-of-flight
- a method according to claim 1 for determining a reagent concentration at a particular point(s) within a sample immersed within a reagent, at a given time the method including simulating a spatial dependence of diffusion into the sample over a plurality of time points and for each of a plurality of candidate diffusivity constants to generate a model time-of-flight, and comparing the model time-of-flight with an experimental time-of-flight to obtain an error function, wherein a minimum of the error function yields the diffusivity constant for the sample.
- the method further includes providing a plurality of candidate tissue porosities and using each of these candidate tissue porosities to generate a model time-of-flight using the diffusivity constant and comparing the model time-of-flight with an experimental time-of-flight to obtain a second error function, wherein a minimum of the error function yields the porosity of the sample. From the determined diffusivity constant and the porosity of the sample, the concentration at a particular point or points within the sample at a particular time can be calculated.
- the method has yielded the surprising result that once a formaldehyde concentration of above about lOOmM (such as above 90 mM) is reached in a tissue sample, quality detection ("staining") of molecular targets and faithful morphological integrity, as judged by pathologist scoring against industry “gold standards,” is reliably achieved, yielding a better receiver operating characteristic (ROC) curve of relative true positives versus false positives than previous results for modeled diffusivity constants alone.
- ROC receiver operating characteristic
- the addition of spatial information regarding true reagent concentration and an understandable SI unit of measure makes it possible to utilize other techniques, such as radio-label tracing, mid-IR or magnetic resonance techniques to directly determine when this threshold formaldehyde concentration is reached within a particular type, size and shaped sample, either statically or dynamically (e.g. in realtime), in order to help ensure that quality staining will be obtained at any given point(s) in a tissue sample.
- using the disclosed method it is possible to arrive at a fixation level for a tissue sample (or portion thereof, such as at the center) that is sufficient to preserve morphology and biomarkers within the sample without unduly complicating further analysis through over-fixation.
- other portions of the sample can be selected to have higher or lower concentrations of formalin that are better suited for detection of one or more additional biomarkers.
- selected portions such as selected tissue sections
- the fixation can be carried out either at room temperature, or using a cold+hot protocol as described herein. More particularly, in a cold+hot protocol, the optimal formaldehyde concentration is reached during the cold step.
- system including an acoustic monitoring device that detects acoustic waves that have traveled through a tissue sample, and a computing device communicatively coupled to the acoustic monitoring device, the computing device is configured to evaluate a speed of the acoustic waves based on a time-of-flight and including instructions, when executed, for causing the processing system to perform operations comprising setting a range of candidate diffusivity constants for the tissue sample, simulating a spatial dependence of a reagent within the tissue sample for a plurality of time points and for a first of the range of candidate diffusivity points, determining a modeled time-of-flight based on the spatial dependence, repeating the spatial dependence simulation for each of the plurality of diffusivity constants, and determining an error between the modeled-time-of-flight for the plurality of diffusivity constants versus an experimental time-of-flight for the tissue sample, wherein a minimum of an error function
- the system further includes instructions, when executed, for causing the processing system to perform operations comprising setting a range of candidate porosities for the tissue sample that includes a plurality of candidate porosities (such as between about 0.05 and about 0.50, for example between about 0.05 and about 0.40 or between about 0.05 and about 0.30), determining a second modeled time-of- flight based on the diffusivity constant of the sample and a first of the plurality of candidate porosities, and determining a second error between the experimental time- of-flight and the second modeled time-of-flight, repeating the determination of the second modeled time-of-flight for others of the plurality of candidate porosities and a corresponding second error, wherein a minimum of the error identifies the porosity of the sample.
- a range of candidate porosities for the tissue sample that includes a plurality of candidate porosities (such as between about 0.05 and about 0.50, for example between about 0.05 and about 0.40 or between about 0.05 and about 0.30), determining
- the system further includes instructions, that when executed, yield a spatial concentration distribution of the reagent within the sample at a particular time.
- the system further includes instructions, that when executed provide a reagent concentration at the center of the sample at a particular time.
- such a reagent concentration can be utilized to terminate infusion of the sample with the reagent when a pre-determined concentration is reached at a particular point or region within the sample, such as at the center of the sample.
- a tangible non-transitory computer-readable medium provided to store computer-readable code that is executed by the system of claim 12 to perform operations including comparing a simulated time-of-flight for a sample material with an experimental time-of-flight for the sample material, obtaining a diffusivity constant for the sample material based on a minimum of an error function between the simulated time-of-flight and the acoustic time-of- flight, comparing a second simulated time-of-flight for a sample material obtained using the diffusivity constant and the experimental decay constant (tau) to the experimental time-of-flight, obtaining a porosity for the sample material based on a minimum of a second error function, and optionally calculating a spatial distribution of the concentration of the reagent or a concentration of the reagent at a particular point or region of the sample.
- a method involving steps a, b, and c means that the method includes at least steps a, b, and c.
- steps and processes may be outlined herein in a particular order, the skilled artisan will recognize that the ordering steps and processes may vary.
- the phrase "at least one,” in reference to a list of one or more elements, should be understood to mean at least one element selected from any one or more of the elements in the list of elements, but not necessarily including at least one of each and every element specifically listed within the list of elements and not excluding any combinations of elements in the list of elements.
- This definition also allows that elements may optionally be present other than the elements specifically identified within the list of elements to which the phrase "at least one" refers, whether related or unrelated to those elements specifically identified.
- At least one of A and B can refer, in one embodiment, to at least one, optionally including more than one, A, with no B present (and optionally including elements other than B); in another embodiment, to at least one, optionally including more than one, B, with no A present (and optionally including elements other than A); in yet another embodiment, to at least one, optionally including more than one, A, and at least one, optionally including more than one, B (and optionally including other elements); etc.
- the present disclosure provides systems and computer-implemented methods for calculating the diffusivity constant (also known as "diffusion coefficient”) and/or a porosity of a sample (e.g. through the use of acoustic time-of-flight (TOF) based information correlated with a diffusion model to reconstruct a spatiotemporal concentration profile across a tissue sample).
- the diffusivity constant also known as "diffusion coefficient”
- TOF time-of-flight
- tissue preparation systems and methods disclosed herein may be adapted to monitor the diffusion of fixative fluid into a tissue sample until a pre-determined concentration level is reached. For example, as formalin penetrates into tissue, it displaces interstitial fluid. This fluid exchange at least partially changes the composition of the tissue volume, and this change may be monitored.
- interstitial fluid and formalin each react differently to an introduced ultrasound pulse (i.e. each fluid has a discrete "sound velocity" property)
- an output ultrasound pulse will accumulate a small transit time differential that increases as more fluid exchange occurs, i.e. as more formalin displaces interstitial fluid.
- the sensitivity of the disclosed TOF instruments can detect a change of less than 10 parts per million enabling potentially more accurate characterization of the diffusivity constant and porosity.
- all fluids and tissues will have discrete sound velocities, so the disclosed operations are not limited to solely quantifying water diffusion, but may be used to monitor the diffusion of all fluids into all tissues. For example, diffusion of dehydrating reagents (such as graded ethanols), clearing agents (such as xylene) and paraffin used for embedding of a tissue sample.
- the rate of diffusion may be monitored by a system of acoustic probes based on the different acoustic properties of formalin-soaked tissue samples.
- a system for diffusion monitoring and experimental TOF measurement is described in further detail U.S. Patent Publication Nos. 2013/0224791 , 2017/0284969 , 2017/0336363 , 2017/0284920 , and 2017/0284859 .
- Another suitable system for diffusion monitoring and experimental TOF measurement is also described in the international patent application entitled ACCURATELY CALCULATING ACOUSTIC TIME-OF-FLIGHT filed in December 17, 2015 .
- a fixative such as formalin having a bulk modulus greater than interstitial fluid can significantly alter the TOF as it displaces the interstitial fluid.
- a fixation protocol may be adjusted to enhance processing consistency, reduce processing times, improve processing quality, or the like.
- the acoustic measurements may be used to non-invasively analyze tissue samples.
- the acoustic properties of tissue samples may change as liquid reagent (e.g., a liquid fixative) travels through the sample.
- the sample's acoustic properties can change during, for example, a pre-soak process (e.g., diffusion of cold fixative), a fixation process, a staining process, or the like.
- a pre-soak process e.g., diffusion of cold fixative
- a fixation process e.g., a staining process
- the speed of transmission of acoustic energy can change as the tissue sample becomes more heavily cross-linked.
- Real-time monitoring can be used to accurately track movement of the fixative through the sample.
- a diffusion or fixation status of a biological sample can be monitored based on a time-of-flight (TOF) of acoustic waves.
- TOF time-of-flight
- Other examples of measurements include acoustic signal amplitude, attenuation, scatter, absorption, phase shifts of acoustic waves, or combinations thereof.
- the movement of the fixative through the tissue sample may be monitored in real-time.
- a “time-of-flight” or “TOF” as used herein is, for example, the time that it takes for an object, particle or acoustic, electromagnetic or other wave to travel a distance through a medium.
- the TOF may be measured empirically e.g. by determining a phase differential between the phases of an acoustic signal emitted by a transmitter ("transmitted signal”) and an acoustic signal received by a receiver (“received signal”) that has passed through an object immersed in a fluid and an acoustic signal that has passed through the fluid alone.
- biological sample refers to any sample including a biomolecule (such as a protein, a peptide, a nucleic acid, a lipid, a carbohydrate, or a combination thereof) that is obtained from any organism including viruses.
- a biomolecule such as a protein, a peptide, a nucleic acid, a lipid, a carbohydrate, or a combination thereof
- Other examples of organisms include mammals (such as humans; veterinary animals like cats, dogs, horses, cattle, and swine; and laboratory animals like mice, rats and primates), insects, annelids, arachnids, marsupials, reptiles, amphibians, bacteria, and fungi.
- Biological samples include tissue samples (such as tissue sections and needle biopsies of tissue), cell samples (such as cytological smears such as Pap smears or blood smears or samples of cells obtained by microdissection), or cell fractions, fragments or organelles (such as obtained by lysing cells and separating their components by centrifugation or otherwise).
- tissue samples such as tissue sections and needle biopsies of tissue
- cell samples such as cytological smears such as Pap smears or blood smears or samples of cells obtained by microdissection
- cell fractions, fragments or organelles such as obtained by lysing cells and separating their components by centrifugation or otherwise.
- biological samples include blood, serum, urine, semen, fecal matter, cerebrospinal fluid, interstitial fluid, mucous, tears, sweat, pus, biopsied tissue (for example, obtained by a surgical biopsy or a needle biopsy), nipple aspirates, cerumen, milk, vaginal fluid, saliva, swabs (such as buccal swabs), or any material containing biomolecules that is derived from a first biological sample.
- the term "biological sample” as used herein refers to a sample (such as a homogenized or liquefied sample) prepared from a tumor or a portion thereof obtained from a subject. The samples may be contained e.g. on a tissue sample slide.
- the "Porosity” is a measure of the void (i.e. "empty") spaces in a material, and is a fraction of the volume of voids over the total volume of an object, between 0 and 1, or as a percentage between 0 and 100%.
- a "porous material” as used herein refers to, for example, a 3D object having a porosity larger than 0.
- a "diffusion coefficient" or "diffusivity constant” as used herein is, for example, a proportionality constant between the molar flux due to molecular diffusion and the gradient in the concentration of the object whose diffusion is observed (or the driving force for diffusion). Diffusivity is encountered e.g. in Fick's law and numerous other equations of physical chemistry. The higher the diffusivity (of one substance with respect to another), the faster they diffuse into each other. Typically, a compound's diffusivity constant is ⁇ 10,000 ⁇ as great in air as in water. Carbon dioxide in air has a diffusivity constant of 16 mm2/s, and in water its diffusivity constant is 0.0016 mm2/s.
- phase differential as used herein is, for example, the difference, expressed in degrees or time, between two waves having the same frequency and referenced to the same point in time.
- a “biopsy capsule” as used herein is, for example, a container for a biopsy tissue sample.
- a biopsy capsule comprises a mesh for holding the sample and letting a liquid reagent, e.g. a buffer, a fixation solution or a staining solution surround and diffuse into a tissue sample.
- a biopsy capsule can maintain the sample in a particular shape, which shape can advantageously provide the sample with a shape that is computationally easier to model according to the disclosed method and thus be more suitable for use in a disclosed system.
- a “cassette” as used herein refers to, for example, a container for a biopsy capsule or a tissue sample not contained within a biopsy capsule.
- the cassette is designed and shaped such that it can automatically be selected and moved, e.g. raised and lowered, relative to the beam path of an ultrasonic transmitter-receiver pair, and further has openings that permit movement of a liquid reagent into and out of the cassette and thus further into and out of a tissue sample held within.
- the movement may be performed for example by a robotic arm or another automated movable component of a device onto which the cassette is loaded.
- a cassette alone is use for containing a tissue sample and the shape of the cassette can, at least in part, determine the shape of the tissue sample.
- placing a rectangular tissue block that is slightly thicker that the depth of a cassette into a cassette and closing the cassette lid can cause the tissue sample to be compressed and spread to fill a greater portion of the inner space of the cassette, and thus be transformed into a thinner piece having a greater height and width, but having a thickness corresponding roughly to the depth of the cassette.
- a system of calculating a formaldehyde concentration or other reagent including a signal analyzer having a processor and a memory coupled to the processor, the memory to store computer-executable instructions that, when executed by the processor, cause the processor to perform operations including calculation of a formalin concentration from a set of acoustic data as discussed in further detail below.
- a data input into the signal analyzer is an acoustic data set generated by an acoustic monitoring system, where the acoustic data set is generated by transmitting an acoustic signal so that the acoustic signal encounters a material of interest, and then detecting the acoustic signal after the acoustic signal has encountered the material of interest.
- a system comprising a signal analyzer as disclosed herein and an acoustic monitoring system discussed in further detail below.
- a system comprising a signal analyzer as disclosed herein and a non-transitory computer readable medium comprising an acoustic data set obtained from an acoustic monitoring system as disclosed herein.
- the acoustic data is generated by frequency sweep transmitted and received by the acoustic monitoring system.
- the term "frequency sweep” shall refer to a series of acoustic waves transmitted at fixed intervals of frequencies through a medium, such that a first set of acoustic waves is emitted through the medium at a fixed frequency for a first fixed duration of time, and subsequent sets of acoustic waves are emitted at fixed frequency intervals for subsequent - preferably equal - durations.
- the system is adapted for monitoring diffusion of a fluid into a porous material.
- a system may be provided comprising: (a) a signal analyzer; (b) an acoustic monitoring system as discussed herein and/or a non-transitory computer readable medium comprising an acoustic data set generated by said acoustic monitoring system; and (c) an apparatus for holding a porous material immersed in a volume of a fluid.
- the system is adapted to monitor diffusion of a fixative into a tissue sample.
- the formalin concentration or other reagent concentration is determined for the purpose of characterizing the extent to which a reagent has penetrated a porous object.
- the method may be used for monitoring a staining process of an object, e.g. cloth, plastics, ceramics, tissues or others, for monitoring a fixation process or other tissue processing step, such as dehydration, clearing and paraffin embedding.
- the present disclosure provides an acoustic monitoring system for collecting an acoustic data set, the acoustic monitoring system comprising a transmitter and a receiver, wherein the transmitter and receiver are arranged such that acoustic signals generated by the transmitter are received by the receiver and transformed into a computer-readable signal.
- the system comprises an ultrasonic transmitter and an ultrasonic receiver.
- a "transmitter” refers to a device capable of converting an electrical signal to acoustic energy.
- an “ultrasonic transmitter” refers a device capable of converting an electrical signal to ultrasonic acoustic energy.
- a “receiver” is a device capable of converting an acoustic wave to an electrical signal; and an “ultrasonic receiver” is a device capable of converting ultrasonic acoustic energy to an electrical signal.”
- certain materials useful for generating acoustic energy from electrical signals are also useful for generating electrical signals from acoustic energy.
- the transmitter and receiver do not necessarily need to be separate components, although they can be.
- the transmitter and receiver are arranged such that the receiver detects acoustic waves generated by the transmitter after the transmitted waves have encountered a material of interest.
- the receiver is arranged to detect acoustic waves that have been reflected by the material of interest.
- the receiver is arranged to detect acoustic waves that have been transmitted through the material of interest.
- the transmitter comprises at least a waveform generator operably linked to a transducer, the waveform generator being configured to generate an electrical signal that is communicated to the transducer, the transducer being configured for converting the electrical signal to an acoustic signal.
- the waveform generator is programmable, such that a user may modify certain parameters of the frequency sweep, including for example: starting and/or ending frequency, the step size between frequencies of the frequency sweep, the number of frequency steps, and/or the duration for which each frequency is transmitted.
- the waveform generator is pre-programmed to generate one or more a pre-determined frequency sweep pattern.
- the waveform generator may be configured to transmit both pre-programmed frequency sweeps and customized frequency sweeps.
- the transmitter may also contain a focusing element, which allows the acoustic energy generated by the transducer to be predictably focused and directed to a specific area of an object.
- the transmitter can transmit a frequency sweep through the medium, which is then detected by the receiver and transformed into the acoustic data set to be stored in a non-transitory computer readable storage medium and/or transmitted to the signal analyzer for analysis.
- the acoustic data set includes data representative of a phase difference between the transmitted acoustic waves and the received acoustic waves
- the acoustic monitoring system may also include a phase comparator.
- the phase comparator generates an electrical signal that corresponds to the phase difference between transmitted and received acoustic waves.
- the acoustic monitoring system comprises a phase comparator communicatively linked to a transmitter and/or a receiver.
- the acoustic monitoring system may also include an analog to digital converter for converting the analog output of the phase comparator to a digital signal.
- the digital signal may then be recorded, for example, on a non-transitory computer readable medium, or may be communicated directly to the signal analyzer for analysis.
- the transmitter can transmit acoustic energy at a particular frequency and the signal detected by the receiver is stored and analyzed for its peak intensity.
- a signal analyzer containing a processor and a memory coupled to the processor, the memory to store computer-executable instructions that, when executed by the processor, cause the processor to calculate a formalin concentration based at least in part on an acoustic data set generated by an acoustic monitoring system as discussed above.
- processor encompasses all kinds of apparatus, devices, and machines for processing data, including by way of example a programmable microprocessor, a computer, a system on a chip, or multiple ones, or combinations, of the foregoing.
- the apparatus can include special purpose logic circuitry, e.g., an FPGA (field programmable gate array) or an ASIC (application-specific integrated circuit).
- the apparatus also can include, in addition to hardware, code that creates an execution environment for the computer program in question, e.g., code that constitutes processor firmware, a protocol stack, a database management system, an operating system, a cross-platform runtime environment, a virtual machine, or a combination of one or more of them.
- the apparatus and execution environment can realize various different computing model infrastructures, such as web services, distributed computing and grid computing infrastructures.
- a computer program (also known as a program, software, software application, script, or code) can be written in any form of programming language, including compiled or interpreted languages, declarative or procedural languages, and it can be deployed in any form, including as a stand-alone program or as a module, component, subroutine, object, or other unit suitable for use in a computing environment.
- a computer program may, but need not, correspond to a file in a file system.
- a program can be stored in a portion of a file that holds other programs or data (e.g., one or more scripts stored in a markup language document), in a single file dedicated to the program in question, or in multiple coordinated files (e.g., files that store one or more modules, subprograms, or portions of code).
- a computer program can be deployed to be executed on one computer or on multiple computers that are located at one site or distributed across multiple sites and interconnected by a communication network.
- the processes and logic flows described in this specification can be performed by one or more programmable processors executing one or more computer programs to perform actions by operating on input data and generating output.
- the processes and logic flows can also be performed by, and apparatus can also be implemented as, special purpose logic circuitry, e.g., an FPGA (field programmable gate array) or an ASIC (application-specific integrated circuit).
- processors suitable for the execution of a computer program include, by way of example, both general and special purpose microprocessors, and any one or more processors of any kind of digital computer.
- a processor will receive instructions and data from a read-only memory or a random access memory or both.
- the essential elements of a computer are a processor for performing actions in accordance with instructions and one or more memory devices for storing instructions and data.
- a computer will also include, or be operatively coupled to receive data from or transfer data to, or both, one or more mass storage devices for storing data, e.g., magnetic, magneto-optical disks, or optical disks.
- mass storage devices for storing data, e.g., magnetic, magneto-optical disks, or optical disks.
- a computer need not have such devices.
- a computer can be embedded in another device, e.g., a mobile telephone, a personal digital assistant (PDA), a mobile audio or video player, a game console, a Global Positioning System (GPS) receiver, or a portable storage device (e.g., a universal serial bus (USB) flash drive), to name just a few.
- Devices suitable for storing computer program instructions and data include all forms of non-volatile memory, media and memory devices, including by way of example semiconductor memory devices, e.g., EPROM, EEPROM, and flash memory devices; magnetic disks, e.g., internal hard disks or removable disks; magneto-optical disks; and CD-ROM and DVD-ROM disks.
- the processor and the memory can be supplemented by, or incorporated in, special purpose logic circuitry.
- embodiments of the subject matter described in this specification can be implemented on a computer having a display device, e.g., an LCD (liquid crystal display), LED (light emitting diode) display, or OLED (organic light emitting diode) display, for displaying information to the user and a keyboard and a pointing device, e.g., a mouse or a trackball, by which the user can provide input to the computer.
- a display device e.g., an LCD (liquid crystal display), LED (light emitting diode) display, or OLED (organic light emitting diode) display
- a keyboard and a pointing device e.g., a mouse or a trackball
- a touch screen can be used to display information and receive input from a user.
- a computer can interact with a user by sending documents to and receiving documents from a device that is used by the user; for example, by sending web pages to a web browser on a user's client device in response to requests received from the web browser.
- Embodiments of the subject matter described in this specification can be implemented in a computing system that includes a back-end component, e.g., as a data server, or that includes a middleware component, e.g., an application server, or that includes a front-end component, e.g., a client computer having a graphical user interface or a Web browser through which a user can interact with an implementation of the subject matter described in this specification, or any combination of one or more such back-end, middleware, or front-end components.
- the components of the system can be interconnected by any form or medium of digital data communication, e.g., a communication network.
- Examples of communication networks include a local area network (“LAN”) and a wide area network (“WAN”), an inter-network (e.g., the Internet), and peer-to-peer networks (e.g., ad hoc peer-to-peer networks).
- LAN local area network
- WAN wide area network
- inter-network e.g., the Internet
- peer-to-peer networks e.g., ad hoc peer-to-peer networks.
- the computing system can include any number of clients and servers.
- a client and server are generally remote from each other and typically interact through a communication network. The relationship of client and server arises by virtue of computer programs running on the respective computers and having a client-server relationship to each other.
- a server transmits data (e.g., an HTML page) to a client device (e.g., for purposes of displaying data to and receiving user input from a user interacting with the client device).
- client device e.g., for purposes of displaying data to and receiving user input from a user interacting with the client device.
- Data generated at the client device e.g., a result of the user interaction
- the signal analyzer accepts as an input an acoustic data set recorded from a test material.
- the acoustic data set is representative of at least a portion of a frequency sweep that is detected after the frequency sweep encounters a material of interest.
- the portion of the frequency sweep that is detected constitutes acoustic waves that are reflected by the material of interest.
- the portion of the frequency sweep that is detected constitutes acoustic waves that have passed through the material of interest.
- the acoustic data set is representative of burst of acoustic energy of a single frequency that is reflected or has passed through the material of interest.
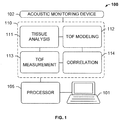
- FIG. 1 shows an embodiment of a system useful for tissue processing 100 (e.g., for optimized tissue fixation, dehydration, clearing or embedding), according to an exemplary embodiment of the subject disclosure.
- System 100 comprises an acoustic monitoring device 102 communicatively coupled to a memory 110 for storing a plurality of processing modules or logical instructions that are executed by processor 105 coupled to computer 101.
- Acoustic monitoring device 102 may comprise the aforementioned acoustic probes including one or more transmitters and one or more receivers.
- the tissue sample may be immersed in a liquid fixative while the transmitters and receivers communicate to detect time-of-flight (TOF) of acoustic waves.
- TOF time-of-flight
- the system 100 employs one or more processors 105 and at least one memory 110, the at least one memory 110 storing non-transitory computer-readable instructions for execution by the one or more processors to cause the one or more processors to execute instructions (or stored data) in one or more modules, including: a tissue analysis module 111 for receiving information about the tissue block via user input or electronic input and for determining tissue characteristics such as an acoustic velocity of the tissue; a TOF modeling module 112 for simulating a spatial dependence of relative fixative or reagent concentrations for various times and model diffusion constants to generate a time-varying ("expected" or "modeled") TOF signal and outputting a model decay constant; a TOF measurement module 113 for determining an actual TOF signal of the tissue, computing a spatial average, and generating an experimental decay constant that depends on tissue characteristics (e.g.
- a correlation module 114 for correlating (e.g. comparing) the experimental and modeled TOF data, determining a diffusivity constant for the tissue sample based on a minimum of an error function of the correlation, using the determined diffusivity constant in the modelling module 112 along with candidate porosity values for the tissue sample to generate second model TOF signals, and again using the correlation module 114 to make a second correlation between the second model TOF signals based on the determined diffusivity constant and candidate porosities for the sample and the experimental TOF data, determining a porosity of the tissue sample based on a minimum of an error function of the second correlation between the experimental TOF data and the model TOF signals generated using the determined diffusivity constant, and calculating based on the experimental TOF signal, the determined diffusivity constant and the determined porosity, a concentration of a reagent within the sample at a particular point
- computer 101 may also include user input and output devices such as a keyboard, mouse, stylus, and a display / touchscreen.
- the modules include logic that is executed by processor 105.
- Logic refers to any information having the form of instruction signals and/or data that may be applied to affect the operation of a processor.
- Software is one example of such logic.
- processors are computer processors (processing units), microprocessors, digital signal processors, controllers and microcontrollers, etc.
- Logic may be formed from signals stored on a computer-readable medium such as memory 110 that, in an exemplary embodiment, may be a random access memory (RAM), read-only memories (ROM), erasable / electrically erasable programmable read-only memories (EPROMS/EEPROMS), flash memories, etc.
- RAM random access memory
- ROM read-only memories
- EPROMS/EEPROMS erasable programmable read-only memories
- flash memories etc.
- Logic may also comprise digital and/or analog hardware circuits, for example, hardware circuits comprising logical AND, OR, XOR, NAND, NOR, and other logical operations. Logic may be formed from combinations of software and hardware. On a network, logic may be programmed on a server, or a complex of servers. A particular logic unit is not limited to a single logical location on the network. Moreover, the modules need not be executed in any specific order. Each module may call another module when needed to be executed.
- the acoustic monitoring device 102 may be retrofitted onto a commercial dip-and-dunk tissue processor such as the Lynx II by Electron Microscopy Sciences (RTM).
- a mechanical head designed using Solidworks® software may be fit around and seal a standard reagent canister. Once sealed, an external vacuum system may initiate to degas the bulk reagent as well as the contents of the cassette, including the tissue.
- a cassette holder designed for use with either a standard sized histological cassette such as CellSafe 5 by CellPath (RTM) or a biopsy capsule such as CellSafe Biopsy Capsules by CellPath (RTM) for smaller tissue samples may be utilized.
- the cassette holder may be attached to a vertical translation arm that would slide the cassette holder in one direction.
- the mechanical head may be designed with two metal brackets on either side of the tissue cassette, with one bracket housing 5 transmitting transducers, and the other bracket housing 5 receiving transducers that are spatially aligned with their respective transmitting transducers.
- the receiving bracket may also house a pair of transducers oriented orthogonal to the propagation axis of the other transducers. After each acquisition, the orthogonal sensors may calculate a reference TOF value to detect spatiotemporal variations in the fluid that has a profound effect on sound velocity.
- the cassette may be raised up and a second reference acquisition acquired.
- these reference TOF values may be used to compensate for environmentally-induced fluctuations in the formalin.
- Environmentally-induced fluctuations in the formalin or any other fixative may be, for example, temperature fluctuations in the container comprising the porous material, vibrations, and others.
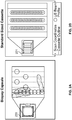
- FIGS. 2A and 2B depict examples of ultrasound scan patterns from a biopsy capsule and from a standard-sized cassette.
- the measurement and modeling procedures described herein for a tissue samples may likewise be applied on other forms of porous material.
- the present disclosure may illustrate modeling in the context of a tissue sample, such examples are non-limiting and the techniques may be applied to other materials, such as any porous material.
- the measurements from the acoustic sensors in an acoustic monitoring device may be used to track the change and/or rate of change of a TOF of acoustic signals through the tissue sample.
- the "different positions,” also referred to “candidate diffusivity positions” may be a position within or on the surface of the tissue sample.
- the sample may be positioned at different “sample positions” by a relative movement of biopsy capsule and acoustic beam path.
- the relative movement may comprise moving the receiver and/or the transducer for "scanning" over the sample in a stepwise or continuous manner.
- the cassette may be repositioned by means of a movable cassette holder.
- the cassette holder may be sequentially raised ⁇ 1 mm vertically and TOF values acquired at each new position, as depicted in FIGS. 2A and 2B .
- the process may be repeated to cover the entire open aperture of the cassette.
- FIG. 2A when imaging tissue in the biopsy capsule 220, signals are calculated from all 5 transducers pairs, resulting in the scan pattern depicted in FIG. 2A .
- FIG. 2A when imaging tissue in the standard sized cassette 221 depicted in FIG.
- the 2nd and 4th transducer pairs may be turned off and TOF values acquired between the 1st, 3rd, and 5th transducer pairs located at the respective centers of the three middle subdivisions of the standard sized cassette 221.
- two tissue cores may then be placed in each column, one on the top and one on the bottom, enabling TOF traces from 6 samples (2 rows X 3 columns) to simultaneously be obtained and significantly decreased run to run variation and increased throughput.
- the full-width-half-maximum of the ultrasound beam is 2.2 mm.
- acoustic sensors in the acoustic monitoring device may include pairs of 4 MHz focused transducers such as the TA0040104-10 by CNIRHurricane Tech (Shenzhen) Co., Ltd. (RTM) that are spatially aligned, with a tissue sample being placed at their common foci.
- One transducer, designated the transmitter, may send out an acoustic pulse that traverses the coupling fluid (i.e. formalin) and tissue and is detected by the receiving transducer.
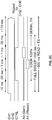
- FIG. 2C shows a timing diagram for an exemplary embodiment of the subject disclosure.
- the transmitting transducer can be programmed with a waveform generator such as the AD5930 by Analog Devices (RTM) to transmit a sinusoidal wave for several hundred microseconds. That pulse train may then be detected by the receiving transducer after traversing the fluid and tissue.
- the received ultrasound sinusoid and the transmitted sinusoid may be compared using, for instance, a digital phase comparator such as the AD8302 by Analog Devices.
- the output of the phase comparator yields a valid reading during the region of temporal overlap between the transmitted and received pulses.
- phase comparator The output of the phase comparator is allowed to stabilize before the output is queried with an integrated analog to digital converter on the microcontroller, such as the ATmega2560 by Atmel (RTM).
- RTM ATmega2560 by Atmel
- the process may then be repeated at multiple acoustic frequencies across the bandwidth of the transducer to build up the phase relationship between the input and output sinusoids across a frequency range.
- This acoustic phase-frequency sweep is directly used to calculate the TOF using a post-processing algorithm analogous to acoustic interferometry and capable of detecting transit times with sub-nanosecond accuracy.
- the "measured TOF”, i.e. the “measured TOF value” obtained for a particular time point and a particular candidate diffusivity point is computed from a measured phase shift between a transmitted ultrasound signal and the corresponding received ultrasound signal, whereby the beam path of the ultrasound signal crossed the particular candidate diffusivity point and whereby the phase shift was measured at the particular time point.
- FIG. 3 shows a method for obtaining a diffusivity coefficient for a tissue sample, according to an exemplary embodiment of the subject disclosure.
- the operations disclosed with respect to this embodiment may be performed by any electronic or computer-based system, including the system of FIG. 1 .
- the operations may be encoded on a computer-readable medium such as a memory and executed by a processor, resulting in an output that may be presented to a human operator or used in subsequent operations.
- the operations may be performed in any order besides the order disclosed herein, provided the operations performed fall within the scope of the appended claims.
- the method includes calculating an acoustic velocity for the tissue sample (S330).
- the tissue thickness may also be obtained via measurement or user input.
- a variety of suitable techniques are available to obtain tissue thickness, including ultrasound, mechanical, and optical methods.
- the acoustic velocity of a tissue sample may be calculated by first calculating the speed of sound in the reagent based on the distance between the two ultrasound transducers (that are herein also referred to as "sensors") (d sensor ) being accurately measured as with a calibrated caliper.
- t reagent 16.71 ⁇ s for a bulk reagent of 10% NBF (neutral buffered formalin).
- the time t reagent is the time required by an ultrasound signal for traversing the distance from the transmitting transducer to the receiving transducer, whereby the signal passes a reagent volume but not the tissue sample.
- Said traversal time can be measured e.g. by placing a biopsy capsule between the two sensors that has the same diameter as the tissue, e.g. 6 mm, and performing a TOF measurement for a signal that passes solely the reagent, not the tissue.
- the time t tissue is the time required by an ultrasound signal for traversing the distance from the transmitting transducer to the receiving transducer, whereby the signal passes the tissue sample that does not comprise and is not surrounded by the reagent.
- Said traversal time can be measured e.g. by placing a biopsy capsule between the two sensors before adding the reagent to the capsule and performing a TOF measurement for a signal that passes solely the tissue.
- the candidate diffusivity constants comprise a range of constants selected (S331) from known or prior knowledge of tissue properties obtained from the literature.
- the candidate diffusivity constants are not precise, but are simply based on a rough estimate of what the range may be for the particular tissue or material under observation.
- These estimated candidate diffusivity constants are provided to the modeling process (steps S332-S335), with a minimal of an error function being determined (S337) to obtain the true diffusivity constant of the tissue.
- method tracks differences between the experimentally measured TOF diffusion curve and a series of modeled diffusion curves with varying diffusivity constants.
- x is the spatial coordinate in the depth direction of the tissue
- Ro is the radius of the sample
- D is the candidate diffusivity constant
- t time
- Jo is a Bessel function of the first kind and 0th order
- J1 is a Bessel function of the first kind and 1st order
- ⁇ n is the location of the nth root of a 0th order Bessel function
- c max is the maximum concentration of the reagent.
- the summation of the coefficient of each of these Bessel functions provides the constant as a function of space, time, and rate, i.e. the diffusivity constant.
- this equation is specific to the cylindrical tissue sample disclosed in these experimental embodiments, and the equation would change depending on the shape or boundary condition, the solution to the heat equation for any shape may provide the diffusivity constants for that shape.
- heat equations for object having spherical, cubic or rectangular block shapes can also be utilized in the disclosed methods.
- this step is repeated for a plurality of time points (S333-S334) to obtain a time-varying TOF (that corresponds to an expected reagent concentration because the integral of the expected reagent concentration at a particular time point can be used for computing the speed of sound differential) (S335).
- the step may be repeated for at least 2 time points, for at least 3 time points, for at least 4 time points, or for at least 8 time points.
- a determination is made as to whether or not the diffusion time is complete. This diffusion time may be based on the hardware or the type of system being used.
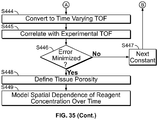
- steps S333, S334, and S332 are repeated until the modeling time is complete upon which the modeled reagent concentration is converted to a time-varying TOF signal (S335).
- each of the used candidate diffusion constants D candidate is contained in the following value range: 0.01 ⁇ D candidate ⁇ 2 ⁇ m 2 ms
- the tissue sample was cored with a cylindrical biopsy core punch and therefore may be well approximated by a cylinder.
- the solution to the heat equation above was then used to calculate an expected concentration of the reagent (c reagent ) in the tissue sample and, for the first time point in the experiment, i.e. after 104 seconds of diffusion (based on the time interval between TOF acquisitions used in the system performing the disclosed experiment), the solution representing the concentration of the reagent in the depth direction of the tissue is depicted in FIG. 5A .
- a particular system may regularly measure a new TOF value for each of a number of different spatial locations which here are also referred to as "pixels". Each "pixel" may thus have an update rate of assigning a new TOF value, e.g. every 104 seconds.
- FIG. 5A shows the simulated concentration gradient of 10% NBF into an about 6 mm sample of tissue after about 104 seconds of passive diffusion as calculated from the heat equation in the experimental embodiment. Moreover, these steps were repeated to determine the concentration of the reagent throughout the tissue repeatedly every 104s over the course of the experiment (8.5 hours long in the experimental embodiment), and the result depicted in FIG. 5B .
- FIG. 5B shows a plot of c reagent (t, r) displaying the ("expected”, “modeled”, or “heat equation based") concentration of the reagent at all locations in the tissue (horizontal axis) as well as at all times (curves moving upward).
- results of the reagent modeling steps may be used to predict the contribution towards the ultrasound signal based on the fact that the ultrasound detection mechanism linearly builds up phase retardation over the depth of the tissue.
- an "integrated expected" reagent concentration c detected may be calculated.
- the “detected reagent concentration” is thus not an empirically detected value. Rather, it is a derivative value created by spatially integrating all expected reagent concentrations computed for a particular time point t and for a particular candidate diffusivity constant.
- the spatial integration may cover, for example, the radius of the tissue sample.
- the integrated reagent concentration c detected is used to calculate the total amount of reagent at a particular time point.
- additional volume and/or weight information of the sample may be used for calculating absolute reagent amounts.
- the reagent amount is computed in relative units, e.g. as a percentage value indicating e.g. the volume fraction [%] of the sample being already diffused by the reagent.
- p is the volume porosity of the tissue, representing the fractional volume of the tissue sample that is capable of fluid exchange with the bulk reagent.
- This equation therefore models the change in TOF signal from diffusion as a linear combination of the two distinct sound velocities (tissue and reagent).
- the TOF of the respective sound velocities of pure tissue on the one hand and pure reagent on the other hand can easily be determined empirically (e.g. by respective phase-shift based TOF measurements), the amount of the reagent having already diffused into the sample at the particular time point can easily be determined.
- the TOF contribution of the pure tissue sample (being free of the TOF contribution of a bulk fluid such as sample buffers or the tissue fluid) can be obtained by subtracting the TOF contribution measured for the tissue sample including and/or being surrounded by the bulk fluid from the TOF contribution measured for an ultrasound signal having traversed a corresponding inter-transducer distance filled with said bulk fluid only.
- the TOF signals in Fig. 6B are computed as derivatives of the respective integrated concentration of the reagent.
- the method generally correlates (S336) the modeled (or "simulated” or “expected") TOF with an experimental TOF determined by measuring different spatial regions of interest (ROIs), also referred to as “candidate diffusivity points", within the tissue sample and determining a minimum of an error function to obtain a true diffusivity constant.
- ROIs spatial regions of interest
- each modeled TOF for the specific diffusion constant selected in the range specified by (S322) is correlated with the experimental TOF (S336), and determination is made as to whether or not an error is minimized (S337). If the error is not minimized, the next diffusion constant is selected (S338) and the modeling process (S332-S335) is repeated for the new diffusion constant. If it is determined that the error is minimized (S337) based on correlation (S336), then the true diffusivity constant is determined (S339) and the method ends.
- ROIs spatial regions of interest
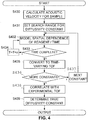
- FIG. 4 shows an alternative method whereby all candidate diffusivity constants are first used to perform the modeling, based on steps S436-S437 and the correlation (S438) is performed after all the diffusivity constants are processed.
- a depiction of the temporally varying TOF signal calculated for all potential diffusivity constants is shown in FIG. 7 .
- FIG. 7 depicts simulated TOF traces over the 8.5 hour experiments for 6 mm tissue samples with diffusivity constants ranging from 0.01 to 2.0 ⁇ m2/ms.
- the error minimization is performed within true diffusivity constant determination step S439.
- the experimental TOF must be determined for the correlation to take place.
- the experimental TOF may be determined by measuring different spatial regions of interest (ROIs) within the tissue. Each signal has the contribution from background reagent subtracted out to isolate the contribution from active diffusion into the tissue. Individual TOF trends are temporally smoothed via filtering. These spatially distinct TOF trends are then spatially-averaged to determine the average rate of 10% NBF diffusion into the tissue.
- ROIs spatial regions of interest
- FIGS. 8A and 8B respectively depict experimentally calculated TOF trends collected from a 6mm piece of human tonsil sample ( FIG. 8A ) and spatially-averaged TOF signals ( FIG. 8B ) representing the average rate and amount of fluid exchange of 10% NBF into the tissue.
- a decay constant of the tissue sample can be computed, e.g. by plotting the amplitudes of the TOF signal over time, analyzing the plot for identifying the offset and resolving the above solution for the decay constant.
- the error correlation (S336 in FIG. 3 , S438 in FIG. 4 ) is performed to determine an error of the modeled ("expected") TOF vs. the experimental TOF. Having calculated simulated and experimental TOF signals, a difference between the two signals may be calculated to see whether or not the candidate diffusivity constant minimizes the difference between the two signals (S337).
- the first error function calculates the point-by-point difference between simulated ("modeled", "expected") and experimentally measured TOF signals.
- the second error function exclusively compares the rate of diffusion between the simulated and modeled TOF signal by calculated the sum-squared differences between each's decay constant.
- the experimental decay constant ⁇ experimental can be obtained experimentally as described above.
- the "modeled", "expected” or “simulated” decay constant ⁇ simulated can be derived analogously from the modeled ("expected") TOFs signal of consecutive time points which also follow a decay function.
- a true diffusivity constant may be determined (S339).
- This equation enables a determination of the candidate diffusivity coefficient that produce a TOF signal as close as possible to the experimental data.
- the error function may be determined for each candidate diffusivity constant until the error is minimized (S337).
- the correlation with experimental TOF may be performed after all candidate diffusivity constants are processed, upon which the determination (S439) of the true diffusivity constant includes determining a minimum of the error function.
- the minimum of the error function is ideally zero, or as close as possible to zero. Any error function known in the art may be used with the goal of minimizing the error between the modeled versus experimental coefficients disclosed herein.
- FIGS. 9A and 9B respectively show a plot of the calculated error function between simulated and experimentally measured TOF signals as a function of candidate diffusivity constant ( FIG. 9A , ⁇ D ⁇ 10 e-5 ⁇ m 2 / ms .), and a zoomed-in view of the error function ( FIG. 9B ).
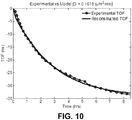
- the validity of the reconstructed constant was tested and used to back-simulate a TOF trend.
- FIG. 10 depicts the TOF trend calculated with this diffusivity constant and plotted alongside the experimental TOF measured with the 6 mm piece of human tonsil.
- FIG. 10 depicts the TOF trend calculated with this diffusivity constant and plotted alongside the experimental TOF measured with the 6 mm piece of human tonsil.
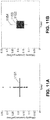
- FIG. 11A shows reconstructed diffusivity constants for the 23 samples of 6 mm human tonsil.
- Line 1151 represents the average.
- FIG. 11B shows a box and whisker plot displaying the distribution of the reconstructed diffusivity constants.
- Line 1152 represents the median value, and the box 1153 extends from the 25-75 percentiles, with whiskers 1154 extending from the 5-95 percentiles.
- the algorithm predicted 6 mm tonsils samples have an average diffusivity constant of 0.1849 ⁇ m2/ms with a relative tight distributed producing a standard deviation of 0.0545 ⁇ m2/ms.
- Figure 12A shows a system for monitoring the time-of-flight of an ultrasound signal according to embodiments of the disclosure.
- the ultrasound-based time-of-flight (TOF) monitoring system may comprise one or more pairs of transducers (e.g. TA0040104-10, CNIRHurricane Tech) for performing the time-of-flight measurements based on a phase shift of the ultrasound signals.
- transducers e.g. TA0040104-10, CNIRHurricane Tech
- the system comprises at least one pair of transducers consisting of an ultrasound ("US") transmitter 902 and an ultrasound receiver 904 which are spatially aligned to each other such that a tissue sample 910 which is placed in the beam path 914 from the transmitter to the receiver is located at our close to the common foci of said two transducers 902, 904.
- the tissue sample 910 can be contained, for example, in a sample container 912 (e.g. a standard histological cassette like "CellSafe 5" of CellPath or a biopsy capsule like "CellSafe Biopsy Capsules" of CellPath) that is filled with a fixation solution.
- Phase-shift based TOF measurements are performed before and after the biopsy capsule 912 is filled with the fixation solution and while the solution slowly diffuses into the sample.
- the one transducer acting as the transmitter sends out an acoustic pulse that traverses the tissue and is detected by the other transducer acting as the receiver.
- the total distance between two transducers constituting a transmitter-receiver transducer pair is referred to as "L”.
- the total time the ultrasound signal needs to traverse the distance between the transmitter 902 and the receiver 904 may be referred to as time-of-flight of said signal.
- the transmitter 902 may be focused, for example, at about 4 MHz and support a frequency sweep range of between about 3.7 and about 4.3 MHz.
- the distance L is assumed to be known, at least approximately.
- the distance of the transducers may be accurately measured (e.g. by optic, ultrasound based or other measurement techniques) or may be disclosed by a manufacturer of the acoustic monitoring system.
- the transmitting transducer 902 is programmable with a waveform generator (e.g. AD5930 from Analog Devices) to transmit a sinusoidal wave (or "sinusoidal signal") for a defined frequency for a defined time interval, e.g. several hundred microseconds. That signal is detected by the receiving transducer 904 after traversing the fluid and/or tissue.
- the received ultrasound signal 922 and the emitted (also referred to as "transmitted") sinusoid signal 920 are compared electronically with a digital phase comparator (e.g. AD8302, Analog Devices).
- a “received” “signal” (or wave) as used herein is a signal whose properties (phase, amplitude, and/or frequency, etc.) are identified and provided by a transducer, e.g. receiver 904, that receives said signal.
- a transducer e.g. receiver 904 that receives said signal.
- the signal properties are identified after said signal has passed a sample or any other kind of material.
- a “transmitted” or “emitted” “signal” (or wave) as used herein refers to a signal whose properties (phase, amplitude, and/or frequency, etc.) are identified by a transducer, e.g. transmitter 902 that emits the signal. Thus, the signal properties are identified before the signal has passed a sample or any other kind of material.
- the transmitted signal may be characterized by signal properties identified by the transmitting transducer
- the received signal may be characterized by signal properties measured by the receiving transducer, whereby the transmitting and the receiving transducer are operatively coupled to a phase comparator of the acoustic monitoring system.
- Figure 12B depicts the determination of the TOF for the pure reagent from which the speed of the sound wave for the beam path crossing the pure reagent without the sample can be inferred.
- the one or more transducer pairs 902, 904 and the sample container 912 can be moved relative to each other.
- the system comprises a container holder capable of repositioning the container 912 such that the US beam traverses a region 914 of the container that solely comprises the fixation solution but not the tissue.
- the TOF for a sound signal traversing the distance between the transducers is obtained via a measured phase shift ⁇ exp as described for Fig. 12A .
- the beam path crosses a sample being free of the reagent.
- the measured TOF can be used for computing the speed of the sound signal for traversing the distance in the presence of the undiffused sample.
- the TOF for a sound signal traversing the distance between the transducers is obtained via a measured phase shift ⁇ exp .
- the beam path crosses a sample container comprising only the reagent, not the sample (or crosses the sample container at a position that is free of the sample).
- the measured TOF can be used for computing the speed of the sound signal for traversing the distance in the presence of the reagent (and the sample container) only, i.e., in the absence of the sample in the beam path.
- Time A and time B may represent identical time points in case a further transducer pair is configured for performing the two measurements in parallel.
- FIG. 13 shows a model of diffusion of a reagent into a cylindrical object, such as a cylindrical tissue core.
- the reagent concentration rapidly increases first at the edges of the tissue sample, and that the concentration of the reagent at the center increases slowly (if at all) at first, lagging the concentration changes seen at the edges of the sample, and then accelerating at later time points, before beginning to slow again.
- candidate porosities can be used to calculate simulated TOF curves and compared to experimental TOF curves to generate an error, which error can be minimized.
- the first error function calculates the point-by-point difference between simulated ("modeled", "expected") and experimentally measured TOF signals.
- the second error function exclusively compares the rate of diffusion between the simulated and modeled TOF signal by calculating the sum-squared differences between each's decay constant.
- the experimental decay constant ⁇ experimental can be obtained experimentally as described above.
- the "modeled”, “expected” or “simulated” decay constant ⁇ simulated can be derived analogously from the modeled ("expected") TOFs signal of consecutive time points which also follow a decay function.
- a true porosity may be determined.
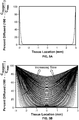
- FIG. 14 shows for comparison a typical distribution of the percent diffusion of a formalin solution into the centers of tonsil tissue core samples (approximately, 6mm cylinders) at 3 hours and 5 hours, wherein a 3 hour immersion of a sample yields decent staining whereas a 5 hour immersion yields "ideal" staining.
- a sample subjected to a 3 hour immersion will reach a 52.6% percent diffusion at tissue center and a sample subjected to a 5 hour immersion will reach an average percent diffusion of 76.9% diffused.
- the 95% predictive interval at 5 hours indicates that a sample needs to be at least 52.45% diffused at the center to achieve "ideal" staining as judged by pathologist review.
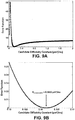
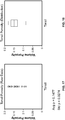
- FIG. 15 shows for comparison an ROC curve of staining quality (sensitivity and specificity) based on percent diffusion at the tissue sample center.
- AUC area under the curve
- FIG. 16 shows for comparison a typical graph of the differential in percent diffusion measured at the tissue sample center between about 3 hours and about 5 hours of exposure to a reagent, with the result that the average difference between about 3 hours and about 5 hours of diffusion is about 24.3% at the center of the tissue.
- FIG. 17 shows a raw data distribution of determined tonsil tissue volume porosities for several samples.
- FIG. 18 shows a corresponding box and whisker distribution of the data of FIG. 17 for determined tonsil tissue volume porosities.
- tonsil tissue in particular exhibits an average porosity of about 0.15.
- FIG. 19 shows a typical distribution of formaldehyde concentrations at the tissue sample center for tonsil tissue core samples (approximately 6mm cylinders) at 3 hours and 5 hours, wherein an about 3 hour immersion of a sample yields decent staining whereas a 5 hour immersion yields "ideal" staining.
- a sample subjected to an about 3 hour immersion will reach a 92.3 mM formaldehyde concentration at tissue center and a sample subjected to a 5 hour immersion will reach an average concentration at tissue center of 137.5 mM.
- the 95% predictive interval at 5 hours indicates that a sample should have achieved at least 91.07 mM formalin at tissue center during fixation to achieve "ideal" staining as judged by pathologist review.
- FIG. 20 shows an ROC curve of staining quality (sensitivity and specificity) based on formaldehyde concentration at the tissue sample center.
- the AUC in this case is 0.9256, which demonstrates the superiority of using formaldehyde concentration at tissue center as a predictor of stain quality in comparison with use of percent diffused at tissue center as a predictor of stain quality (AUC-0.8926) as was shown in FIG. 15 .
- FIG. 21 demonstrates the superiority of reagent concentration at tissue center as a predictor of stain quality. It shows a graph of the differential in formaldehyde concentration at the tissue sample center between about 3 hours and about 5 hours of immersion in an NBF solution. Overall, the average difference seen in concentration is 45 mM. Compared to the difference in percent diffused (24%; FIG. 16 ), the difference in concentration at tissue center between about 3 about and about 5 about is more dramatic at about 33% (45 mM/137 mM x 100%) reflecting the differences in reagent concentration occurring late in an immersion that can have an effect on staining quality at the tissue center.
- this demonstrates the advantage of using a method that provides a measure (in this case concentration) that is location and time specific within the sample volume, as opposed to an average measure across the entire sample volume (as in the case of a percent diffused measurement alone).
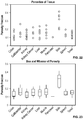
- FIG. 22 shows the distributions of raw porosities for the several tissue types.
- FIG. 23 shows a set of box and whisker distributions of porosities for the several tissue types. As can be seen, for most tissue types, the average porosity (line in box) is between about 0.1 and about 0.2, whereas skin has a much higher porosity of more than about 0.3.
- FIG. 24 shows the distributions of the determined diffusivity constants for the several tissue types
- FIG. 25 shows a set of box and whisker distributions of the diffusivity constants for the several tissue types.
- the diffusivity constant is more variable.
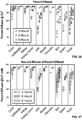
- FIG. 26 shows the distributions of raw percent diffusion at the tissue sample center at 3, 5 and 6 hours determined for the several tissue types
- FIG. 27 shows a set of box and whisker distributions of percent diffusion at the tissue sample center at 3, 5 and 6 hours for the several tissue types
- FIG. 28 shows the distributions of raw formaldehyde concentration as determined at the tissue sample center at 3, 5 and 6 hours for several tissue types
- FIG. 29 shows a set of box and whisker distributions of formaldehyde concentration at the tissue sample center at 3, 5 and 6 hours for several tissue types.
- FIG. 30 shows distributions of raw formaldehyde concentrations at the tissue sample center for the several tissue types after the indicated immersion times
- FIG. 31 shows a set of box and whisker distributions of formaldehyde concentrations at the tissue sample center for the several tissue types after the indicated immersion times.
- FIG. 33 shows the raw distribution of formaldehyde concentration at the tissue sample center across all tissues types after 6 hours of immersion in 10% NBF
- FIG. 34 show the box and whisker distribution of formaldehyde concentration at the tissue sample center for all tissues after 6 hours of immersion in 10% NBF.
- the 90 mM (or 100 mM) formaldehyde concentration level for achievement of "ideal staining" is confirmed across all tissue types.
- FIG. 35 shows an embodiment of the disclosed method for obtaining a diffusivity coefficient, a porosity, and formaldehyde concentration at the tissue sample center.
- the acoustic velocity of the sample is measured as was previously described in the context of FIG. 3 .
- operations and decisions S431, S432, S433, S434, S435, S436, S437 and S438 are performed to define the diffusivity constant.
- a range of porosities that are used to model the diffusion of the reagent solution into the sample is set at S440. The range can be set by default or entered by a user. For example, based on the experimentally determined porosity values discussed above in regard to FIG.
- a range of 0.05 to 0.50 should cover most, if not all, tissue types.
- a narrower range can be set when the tissue type has been examined prior, and for example, the user can enter the tissue type to provide an appropriate range of values for the model to explore.
- the diffusivity constant from S439 and a candidate porosity set at S440 are used to model the spatial dependence of the reagent over a series of time points T to T+n.
- the model built over the series of time points is then used to generate an expected TOF curve at S444 and correlated with the experimental TOF curve at S445.
- the error between the expected and experimental TOF curves is checked to see if it is at a minimum, and if so, the candidate tissue porosity is determined at S448 to be the actual tissue porosity. If not, the process is repeated with a second candidate porosity at S447.
- a spatial model of reagent concentration across time can be generated at S449. Once the spatial model of reagent concentration over time is established, the concentration at a particular point within the sample at a particular time, such as at sample center, can be extracted from the model.
- the disclosure relates to a system including an acoustic monitoring device that detects acoustic waves having traveled through a porous material and a computing device communicatively coupled to the acoustic monitoring device 102.
- the computing device includes instructions which, when executed, cause the computing device to perform operations comprising:
- the disclosure relates to a corresponding method.
- the computing the spatial dependence TOF model comprises determining each of the modeled TOFs by solving a heat equation for the porous material.
- the acoustic data comprises: the velocity of the sound waves in the porous material prior to diffusion with the reagent; and/or the experimental TOFs of the acoustic waves through the porous material at the plurality of time points during diffusion of the reagent into the porous material; and/or experimental phase shift data for computing the experimental TOFs from the experimental phase shift data; and/or velocity of the sound waves in the reagent being free of the porous material; and/or a thickness of the porous material.
- said thickness is determined, according to embodiments, using a pulse echo ultrasound.
- the computation of the spatial dependence TOF model comprises:
- determination reagent concentrations with any sample material may be provided by calculating the speed of sound in a reagent at a given temperature, pressure, etc., determining the sample's thickness with standard pulse echo ultrasound, determining the absolute sound velocity in the undiffused sample via phase retardation of ultrasound, followed by generating the modeled TOF trend from the candidate diffusivity constant first simulating the spatial dependence of the reagent diffusion into the sample, summing the total reagent concentration detected by the ultrasound beam, converting the detected reagent concentration to the TOF differential, and repeating these steps for multiple diffusion times.
- the modeled TOF trend is determined by repeating the spatial dependence simulation for a plurality of candidate diffusivity constants (such as in a range as provided by those known from literature) and calculating an error between the experimental and simulated TOF differentials at all times and for all diffusivity constants, resulting in an error function between the experimental and modeled TOF as a function of diffusivity constant. Calculating the true diffusivity constant as the minimum of the error function results in an output.
- the true diffusivity constant and a plurality of candidate porosities for the sample (such as selected from a range of expected tissue porosities) to generate a second modeled TOF trend over time, calculating a second error function between the second modeled TOF trend and the experimental TOF trend at all times, and calculating the true porosity of the sample as a minimum of second error function.
- the true porosity can then be input along with the true diffusivity constant back into the model for spatial dependence of reagent diffusion to obtain reagent concentrations at any spatial point at any time within a sample during the diffusion process.
- the reagent concentration in units of molarity at a particular spatial point at a particular time according to the following equation based on % Diffused at a particular time.
- Reagent _ concentration % diffused porosity g reagent / L 1 mole / MW of reagent
- the subject disclosure applies to both biological and non-biological context, providing an ability to reconstruct the diffusivity constant of any substance based on the acoustic TOF curve.
- the disclosed methods are more sensitive and accurate when compared to prior art methods.
- the disclosed operations provide fitting the TOF curve to a single exponential function comprising a summation of Bessel functions, a double exponential or quadratic function may be more appropriate, depending on the context. Therefore, the equation itself may change.
- Diffusivity constant and porosity calculations are known to be useful for many applications, including compositional analysis.
- the present systems and methods are contemplated to be used in any system that utilizes diffusivity constant and porosity measurements.
- the present systems and methods are applied to the field of monitoring diffusion of fluids into porous materials.
- the porous material is a tissue sample.
- the tissue sample is diffused with a fluid solution.
- Hine Stain Technol. 1981 Mar;56(2): 119-23 discloses a method of staining whole tissue blocks by immersing a tissue sample in a hematoxylin solution and eosin solution after fixation and prior to embedding and sectioning. Additionally, fixation is frequently performed by immersing an unfixed tissue sample into a volume of fixative solution, and the fixative solution is allowed to diffuse into the tissue sample.
- Chafin et al. (PLoS ONE 8(1): e54138. doi:10.1371/journal.pone.
- the present systems and methods are applied to determine a sufficient time of diffusion of a fixative into a tissue sample.
- the user selects a minimum fixative concentration to be achieved at a particular point in the tissue sample (such as the center of the thickness of the tissue sample). Knowing at least the tissue thickness, tissue geometry, and the calculated true diffusivity a minimum time to reach the minimum relative (to the surrounding fluid) fixative concentration at the center of the tissue sample can be determined. The fixative will thus be allowed to diffuse into the tissue sample for at least said minimum time.
- tissue sample porosity as disclosed herein permits determination of an actual fixative concentration that needs to be achieved to ensure sample integrity.
- other techniques such as radiolabel tracing, mid-IR evaluation and MRI can be used to determine appropriate times for particular treatments with particular reagents, such as fixatives.
- a "two-temperature fixation method” is a fixation method in which tissue is first immersed in cold fixative solution for a first period of time, followed by heating the tissue for the second period of time.
- the cold step permits the fixative solution to diffuse throughout the tissue without substantially causing cross-linking.
- the heating step leads to cross-linking by the fixative.
- the combination of a cold diffusion followed by a heating step leads to a tissue sample that is more completely fixed than by using standard methods.
- a tissue sample is fixed by: (1) immersing an unfixed tissue sample in a cold fixative solution and monitoring diffusion of the fixative into the tissue sample by monitoring TOF in the tissue sample using the systems and methods as disclosed herein (diffusion step); and (2) allowing the temperature of the tissue sample to raise after a threshold TOF has been measured (fixation step).
- the diffusion step is performed in a fixative solution that is below 20 °C, below 15 °C, below 12 °C, below 10 °C, in the range of about 0 °C to about 10 °C, in the range of about 0 °C to about 12 °C, in the range of about 0 °C to about 15 °C, in the range of about 2 °C to about 10 °C, in the range of about 2 °C to about 12 °C, in the range of about 2 °C to about 15 °C, in the range of about 5 °C to about 10 °C, in the range of about 5 °C to about 12 °C, or in the range of about 5 °C to 1 about 5 °C.
- the environment surrounding the tissue sample is allowed to rise within the range of about 20 °C to about 55 °C during the fixation step.
- the fixative is an aldehyde-based cross-linking fixative, such as glutaraldehyde- and/or formalin-based solutions. Examples of aldehydes frequently used for immersion fixation include:
- Aldehydes are often used in combination with one another. Standard aldehyde combinations include 10% formalin + 1% (w/v) Glutaraldehyde. Atypical aldehydes have been used in certain specialized fixation applications, including: fumaraldehyde, 12.5% hydroxyadipaldehyde (pH 7.5), 10% crotonaldehyde (pH 7.4), 5% pyruvic aldehyde (pH 5.5), 10% acetaldehyde (pH 7.5), 10% acrolein (pH 7.6), and 5% methacrolein (pH 7.6).
- the fixative solution is selected from Table 1.
- the aldehyde concentration used is higher than the above-mentioned standard concentrations.
- a high-concentration aldehyde-based fixative solution can be used having an aldehyde concentration that is at least 1.25-times higher than the standard concentration used to fix a selected tissue for immunohistochemistry with a substantially similar composition.
- the high-concentration aldehyde-based fixative solution is selected from: greater than 20% formalin, about 25% formalin or greater, about 27.5% formalin or greater, about 30% formalin or greater, from about 25% to about 50% formalin, from about 27.5% to about 50% formalin, from about 30% to about 50% formalin, from about 25% to about 40% formalin, from about 27.5% to about 40% formalin, and from about 30% to about 40% formalin.
- the term "about” shall encompass concentrations that do not result in a statistically significant difference in diffusion at 4 °C as measured by Bauer et al., Dynamic Subnanosecond Time-of-Flight Detection for Ultra-precise Diffusion Monitoring and Optimization of Biomarker Preservation, Proceedings of SPIE, Vol. 9040, 90400B-1 (2014-Mar-20 ).
- Two-temperature fixation processes are especially useful for methods of detecting certain labile biomarkers in tissue samples, including, for example, phosphorylated proteins, DNA, and RNA molecules (such as miRNA and mRNA). See PCT/EP2012/ 052800 .
- the fixed tissue samples obtained using these methods can be analyzed for the presence of such labile markers.
- a method of detecting a labile marker is a sample is provided, said method comprising fixing the tissue according to a two-temperature fixation as disclosed herein and contacting the fixed tissue sample with an analyte binding entity capable of binding specifically to the labile marker, such as FOXP3.
- analyte-binding entities include: antibodies and antibody fragments (including single chain antibodies), which bind to target antigens; t-cell receptors (including single chain receptors), which bind to MHC:antigen complexes; MHC: peptide multimers (which bind to specific T-cell receptors); aptamers, which bind to specific nucleic acid or peptide targets; zinc fingers, which bind to specific nucleic acids, peptides, and other molecules; receptor complexes (including single chain receptors and chimeric receptors), which bind to receptor ligands; receptor ligands, which bind to receptor complexes; and nucleic acid probes, which hybridize to specific nucleic acids.
- an immunohistochemical method of detecting a phosphorylated protein in a tissue sample comprising contacting the fixed tissue obtained according to the foregoing two-temperature fixation method with an antibody specific for the phosphorylated protein and detecting binding of the antibody to the phosphorylated protein.
- an in situ hybridization method of detecting a nucleic acid molecule is provided, said method comprising contacting the fixed tissue obtained according to the foregoing two-temperature fixation method with a nucleic acid probe specific for the nucleic acid of interest and detecting binding of the probe to the nucleic acid of interest.
Landscapes
- Physics & Mathematics (AREA)
- Health & Medical Sciences (AREA)
- Life Sciences & Earth Sciences (AREA)
- General Physics & Mathematics (AREA)
- Pathology (AREA)
- Biochemistry (AREA)
- General Health & Medical Sciences (AREA)
- Chemical & Material Sciences (AREA)
- Immunology (AREA)
- Analytical Chemistry (AREA)
- Engineering & Computer Science (AREA)
- Signal Processing (AREA)
- Biomedical Technology (AREA)
- Molecular Biology (AREA)
- Acoustics & Sound (AREA)
- Algebra (AREA)
- Mathematical Analysis (AREA)
- Mathematical Optimization (AREA)
- Mathematical Physics (AREA)
- Pure & Applied Mathematics (AREA)
- Investigating Or Analysing Biological Materials (AREA)
- Sampling And Sample Adjustment (AREA)
- Investigating Or Analyzing Materials By The Use Of Ultrasonic Waves (AREA)
Claims (19)
- Verfahren zur Bestimmung einer Reagenskonzentration in einer Probe, umfassend die Schritte:(a) Eintauchen der Probe in das Reagens;(b) Erlangen einer experimentellen Flugzeit versus Zeit, in der ein akustisches Signal durch die in das Reagens eingetauchte Probe hindurchtritt (S330, S430);(c) Bereitstellen einer Vielzahl von Kandidatendiffusionsfähigkeitskonstanten der Probe (S331, S431) ;(d) Simulieren einer räumlichen Abhängigkeit von Diffusion in die Probe, um eine Modellflugzeit versus Zeit über eine Vielzahl von Zeitpunkten zu generieren, wobei die Simulation für jede der Kandidatendiffusionsfähigkeitskonstanten durchgeführt wird (S332-S335, S432-S437);(e) Vergleichen der Modellflugzeit versus Zeit mit der experimentellen Flugzeit versus Zeit, um eine Fehlerfunktion zu erhalten, wobei ein Minimum der Fehlerfunktion eine Diffusionsfähigkeitskonstante für die Probe ergibt (S336-S339, S438-S439);(f) Bereitstellen einer Vielzahl von Kandidatenporositäten der Probe (S440);(g) Simulieren einer räumlichen Abhängigkeit von Diffusion in die Probe, um eine Modellflugzeit versus Zeit über eine Vielzahl von Zeitpunkten zu generieren, wobei die Simulation für jede der Kandidatenporositäten durchgeführt wird (S441-S444);(h) Vergleichen der Modellflugzeit mit der experimentellen Flugzeit, um eine zweite Fehlerfunktion zu erhalten, wobei ein Minimum der Fehlerfunktion eine Porosität der Probe ergibt (S445-S448);
und(i) Berechnen einer Konzentration des Reagens an einem oder mehreren bestimmten räumlichen Punkten innerhalb der Probe zu einer bestimmten Zeit unter Verwendung der Diffusionsfähigkeitskonstante für die Probe und der Porosität der Probe (S449). - Verfahren nach Anspruch 1, wobei das Simulieren der räumlichen Abhängigkeit von Diffusion in die Probe, um die Modellflugzeit versus Zeit über die Vielzahl von Zeitpunkten zu generieren, die Diffusionsfähigkeitskonstante für die Probe nutzt.
- Verfahren nach einem der Ansprüche 1 oder 2, wobei das Berechnen der Konzentration des Reagens an dem einen oder mehreren räumlichen Punkten mit der Probe zu der bestimmten Zeit ein Berechnen einer prozentualen Diffusion an dem einen oder mehreren bestimmten räumlichen Punkten zu der bestimmten Zeit aus der Diffusionsfähigkeitskonstante und der Zeit und ein Verwenden der prozentualen Diffusion in der folgenden Gleichung umfasst, um die Konzentration zu erhalten:

- Verfahren nach einem der Ansprüche 1 bis 3, wobei das Reagens aus der Gruppe, die aus Formaldehyd, Ethanol, Xylen und Paraffin besteht, ausgewählt ist.
- Verfahren nach Anspruch 4, wobei das Molekulargewicht von Paraffin aus der Gruppe, die aus einem zahlenmittleren Molekulargewicht (Mn), einem gewichtsmittleren Molekulargewicht (Mw), einem viskositätsmittleren Molekulargewicht (Mv) und Kombinationen davon besteht, ausgewählt ist.
- Verfahren nach Anspruch 1, wobei das Reagens eine Formaldehydlösung umfasst und wobei die Probe aus dem Reagens entfernt wird, sobald eine Konzentration der Formaldehydlösung an einem Punkt in der Mitte der Probe mindestens über 90 mM ist.
- Verfahren nach Anspruch 6, wobei das Eintauchen der Probe in das Reagens als ein kalter Schritt ausgeführt wird, und sobald die Konzentration an dem Punkt in der Mitte der Probe mindestens über 90 mM ist, wird in einem heißen Schritt die Temperatur des Reagens erhöht.
- Verfahren zum Fixieren einer Gewebeprobe, umfassend:Eintauchen der Gewebeprobe in eine kalte Formalinlösung;gemäß dem Verfahren nach Anspruch 1 feststellen, wann ein Punkt in der Mitte der Gewebeprobe eine Formaldehydkonzentration von mindestens 90 mM aufweist, wobei das Reagens das Formaldehyd ist, undKontaktieren der Gewebeprobe mit einer heißen Formalinlösung, sobald festgestellt wird, dass die Formaldehydkonzentration an dem Punkt in der Mitte der Gewebeprobe für eine zum Ausbilden von Querverbindungen ausreichende Zeit über 90 mM beträgt, dabei Fixieren der Gewebeprobe.
- Verfahren nach Anspruch 8, wobei der Schritt des Eintauchens fortgesetzt wird, bis festgestellt wird, dass eine Formaldehydkonzentration an dem Punkt in der Mitte der Gewebeprobe eine Formaldehydkonzentration von mindestens 100 mM aufweist.
- Verfahren nach einem der Ansprüche 8 bis 9, wobei die kalte Formalinlösung eine Temperatur von weniger als etwa 20 Grad C aufweist und die heiße Formalinlösung eine Temperatur zwischen etwa 20 Grad C und etwa 55 Grad C aufweist.
- Verfahren nach einem der Ansprüche 8 bis 10, wobei das Kontaktieren der Gewebeprobe mit der heißen Formalinlösung ein Erhöhen der Temperatur der kalten Formalinlösung, während die kalte Formalinlösung im Kontakt mit der Gewebeprobe bleibt, bis sie eine heiße Formalinlösung wird, umfasst.
- System (100) zum Feststellen einer Reagenskonzentration, umfassend:eine akustische Überwachungsvorrichtung (102), die akustische Wellen, die sich durch eine Gewebeprobe bewegt haben, detektiert;einen Prozessor (105), kommunikativ gekoppelt an die akustische Überwachungsvorrichtung, wobei der Prozessor dazu ausgelegt ist, eine Geschwindigkeit der akustischen Wellen basierend auf der Flugzeit der akustischen Wellen durch die Probe zu evaluieren (S330, S430);einen Speicher (110), kommunikativ gekoppelt an den Prozessor, wobei auf dem Speicher Anweisungen gespeichert sind, die, wenn sie ausgeführt werden, den Prozessor veranlassen, Operationen auszuführen, umfassend: Festsetzen eines Bereichs von Kandidatendiffusionsfähigkeitskonstanten für die Gewebeprobe (S331, S431);Simulieren einer räumlichen Abhängigkeit eines Reagens innerhalb der Gewebeprobe für eine Vielzahl von Zeitpunkten und für einen ersten von Kandidatendiffusionsfähigkeitspunkten; Feststellen einer modellierten Flugzeit basierend auf der räumlichen Abhängigkeit; Wiederholen der Simulation der räumlichen Abhängigkeit für jede von der Vielzahl von Diffusionsfähigkeitskonstanten (S332-S335, S432-S437);Feststellen eines Fehlers zwischen der modellierten Flugzeit für die Vielzahl von Diffusionsfähigkeitskonstanten versus einer experimentellen Flugzeit für die Gewebeprobe, wobei ein Minimum einer Fehlerfunktion basierend auf dem Fehler eine Diffusionsfähigkeitskonstante für die Gewebeprobe (S336-S339, S438-S439) ergibt; Festlegen eines Bereichs von Kandidatenporositäten für die Gewebeprobe, der eine Vielzahl von Kandidatenporositäten umfasst (S440);Feststellen einer zweiten modellierten Flugzeit basierend auf der Diffusionsfähigkeitskonstante der Probe und einer ersten von der Vielzahl von Kandidatenporositäten, und Feststellen eines zweiten Fehlers zwischen der experimentellen Flugzeit und der zweiten modellierten Flugzeit; Wiederholen der Feststellung der zweiten modellierten Flugzeit für andere von der Vielzahl von Kandidatenporositäten und ihrer entsprechenden zweiten Fehler, wobei ein Minimum des Fehlers die Porosität der Probe identifiziert (S441-S448);und Berechnen einer räumlichen Abhängigkeit der Reagenskonzentration innerhalb der Probe zu einer bestimmten Zeit aus der identifizierten Diffusionsfähigkeitskonstante und der identifizierten Porosität der Probe (S449).
- System nach Anspruch 12, wobei der Speicher ferner Anweisungen umfasst, die, wenn sie ausgeführt werden, eine Reagenskonzentration in der Mitte der Probe zu einer bestimmten Zeit ausgeben.
- System nach Anspruch 13, wobei der Speicher ferner Anweisungen umfasst, die, wenn sie ausgeführt werden, die Infusion der Probe mit dem Reagens beenden, wenn die Reagenskonzentration in der Mitte des Gewebes einen vorbestimmten Konzentrationsschwellenwert überschreitet.
- System nach Anspruch 14, wobei das Reagens Formaldehyd umfasst und der vorbestimmte Konzentrationsschwellenwert mindestens 90 mM beträgt.
- System nach einem der Ansprüche 14 bis 15, wobei das System ferner einen Alarm umfasst und der Speicher ferner Anweisungen umfasst, die, wenn sie durch den Prozessor ausgeführt werden, den Alarm veranlassen, zu ertönen, sobald die Reagenskonzentration in der Mitte des Gewebes den vorbestimmten Schwellenwert überschreitet.
- System nach den Ansprüchen 14 oder 15, wobei das System ferner einen Mechanismus umfasst, um die Probe aus dem Reagens zu entfernen, und der Speicher ferner Anweisungen umfasst, die den Mechanismus veranlassen, die Probe aus dem Reagens zu entfernen, wenn die Reagenskonzentration in der Mitte des Gewebes den vorbestimmten Schwellenwert überschreitet.
- System nach Anspruch 14, wobei das Reagens eine kalte Formaldehydlösung mit einer Temperatur von weniger als etwa 20 Grad C umfasst und das Beenden der Infusion ein Erhöhen der Temperatur der Formaldehydlösung auf eine Temperatur zwischen etwa 20 Grad C und etwa 55 Grad C umfasst, um eine heiße Formaldehydlösung bereitzustellen, wobei das System ferner einen Heizer umfasst, um die kalte Formaldehydlösung auf eine heiße Formaldehydlösung zu erhitzen, und wobei der Speicher ferner Anweisungen umfasst, die den Heizer veranlassen, die kalte Formaldehydlösung zu erhitzen, um die heiße Formaldehydlösung auszubilden, wenn die Formaldehydkonzentration in der Mitte des Gewebes etwa 90 mM überschreitet.
- Materielles, nicht flüchtiges, computerlesbares Medium, auf dem Anweisungen gespeichert sind, die das System (100) nach Anspruch 12 veranlassen, Operationen, die die Schritte (b) bis (i) nach Anspruch 1 umfassen, auszuführen.
Applications Claiming Priority (3)
| Application Number | Priority Date | Filing Date | Title |
|---|---|---|---|
| US201662438152P | 2016-12-22 | 2016-12-22 | |
| US201662437962P | 2016-12-22 | 2016-12-22 | |
| PCT/US2017/067811 WO2018119189A1 (en) | 2016-12-22 | 2017-12-21 | System and method for sample processing |
Publications (2)
| Publication Number | Publication Date |
|---|---|
| EP3559628A1 EP3559628A1 (de) | 2019-10-30 |
| EP3559628B1 true EP3559628B1 (de) | 2021-08-18 |
Family
ID=61003385
Family Applications (3)
| Application Number | Title | Priority Date | Filing Date |
|---|---|---|---|
| EP22171093.2A Pending EP4123285A1 (de) | 2016-12-22 | 2017-12-21 | System und verfahren zur probenverarbeitung |
| EP17832848.0A Active EP3559629B1 (de) | 2016-12-22 | 2017-12-21 | System und verfahren zur probenverarbeitung |
| EP17832141.0A Active EP3559628B1 (de) | 2016-12-22 | 2017-12-21 | System und verfahren zur probenverarbeitung |
Family Applications Before (2)
| Application Number | Title | Priority Date | Filing Date |
|---|---|---|---|
| EP22171093.2A Pending EP4123285A1 (de) | 2016-12-22 | 2017-12-21 | System und verfahren zur probenverarbeitung |
| EP17832848.0A Active EP3559629B1 (de) | 2016-12-22 | 2017-12-21 | System und verfahren zur probenverarbeitung |
Country Status (6)
| Country | Link |
|---|---|
| US (5) | US11635355B2 (de) |
| EP (3) | EP4123285A1 (de) |
| JP (4) | JP7228518B2 (de) |
| CN (3) | CN110100162B (de) |
| ES (1) | ES2920973T3 (de) |
| WO (2) | WO2018119194A1 (de) |
Families Citing this family (6)
| Publication number | Priority date | Publication date | Assignee | Title |
|---|---|---|---|---|
| EP3256844B1 (de) * | 2015-02-09 | 2021-04-14 | Ventana Medical Systems, Inc. | System und verfahren zur standardisierung der diffusion eines fluids in geweben |
| AR120551A1 (es) | 2019-12-19 | 2022-02-23 | Dow Global Technologies Llc | Procesos para la producción de olefinas c₂ a c₄ |
| US11460400B2 (en) | 2020-07-07 | 2022-10-04 | Sakura Finetek U.S.A., Inc. | Use of IR spectroscopy to evaluate penetration of reagents into biological specimen |
| US12465218B2 (en) | 2021-02-02 | 2025-11-11 | Colgate-Palmolive Company | System and devices for multispectral 3D imaging and diagnostics of tissues, and methods thereof |
| EP4337092A1 (de) * | 2021-05-13 | 2024-03-20 | Ventana Medical Systems, Inc. | Echtzeitvorhersage der gewebefixierzeit |
| CN114279801B (zh) * | 2021-12-24 | 2024-03-29 | 哈尔滨东尧科技有限公司 | 一种可用于多种新鲜组织固定的无甲醛固定液及固定方法 |
Family Cites Families (24)
| Publication number | Priority date | Publication date | Assignee | Title |
|---|---|---|---|---|
| US5089288A (en) * | 1989-06-24 | 1992-02-18 | Berger Hermann J | Method for impregnating tissue samples in paraffin |
| CN1333871A (zh) * | 1998-11-12 | 2002-01-30 | 英国石油化学品有限公司 | 用于筛分催化剂库的方法和装置 |
| US6291180B1 (en) * | 1999-09-29 | 2001-09-18 | American Registry Of Pathology | Ultrasound-mediated high-speed biological reaction and tissue processing |
| JP2005504323A (ja) | 2001-10-01 | 2005-02-10 | ヴィジョン バイオシステムズ リミテッド | 組織学的組織標本処理 |
| JP4457742B2 (ja) * | 2003-04-30 | 2010-04-28 | 株式会社島津製作所 | 生体標本への試薬の分注方法及び生体標本の解析方法 |
| WO2005031312A1 (en) | 2003-09-29 | 2005-04-07 | Vision Biosystems Limited | System and method for histological tissue specimen processing |
| SG186660A1 (en) | 2007-12-14 | 2013-01-30 | Chugai Pharmaceutical Co Ltd | Novel method for specimen preparation, which ensures preservation of tissue morphology and nucleic acid quality |
| GB2479069B (en) * | 2008-09-24 | 2012-07-25 | Stabilitech Ltd | Method for preserving polypeptides using a sugar and polyethyleneimine |
| US20110045565A1 (en) * | 2009-08-18 | 2011-02-24 | Leica Biosystems Nussloch Gmbh | Apparatus and method for accelerated tissue infiltration by means of microwave excitation |
| JP2013508065A (ja) | 2009-10-24 | 2013-03-07 | シネロン メディカル リミテッド | 組織層のリアルタイム監視のための方法と装置 |
| US10539487B2 (en) * | 2010-03-04 | 2020-01-21 | Ventana Medical Systems, Inc. | Systems and methods for monitoring tissue sample processing |
| CA2788664C (en) | 2010-03-04 | 2023-04-11 | Ventana Medical Systems, Inc. | Processing system for processing specimens using acoustic energy |
| US10126216B2 (en) | 2011-02-17 | 2018-11-13 | Ventana Medical Systems, Inc. | Method for tissue sample fixation |
| EP2678094A4 (de) * | 2011-02-03 | 2014-12-10 | Co2 Solutions Inc | Co2-behandlungen mittels entsprechend der dicke eines reaktiven flüssigfilms sortierter enzympartikel für verbesserte katalyse |
| US8908159B2 (en) * | 2011-05-11 | 2014-12-09 | Leddartech Inc. | Multiple-field-of-view scannerless optical rangefinder in high ambient background light |
| DE102012224535B4 (de) | 2012-12-28 | 2019-07-11 | Leica Biosystems Nussloch Gmbh | Verfahren zum Fixieren einer histologischen Probe, Bearbeitungsvorrichtung zum Bearbeiten einer histologischen Probe |
| US9909173B2 (en) * | 2013-02-08 | 2018-03-06 | Cornell University | Biomolecular processing platform and uses thereof |
| AU2015367415B2 (en) | 2014-12-17 | 2019-05-09 | Ventana Medical Systems, Inc. | Obtaining true diffusivity constant |
| CA3087129C (en) | 2014-12-17 | 2022-05-10 | Ventana Medical Systems, Inc. | Diffusion monitoring protocol for optimized tissue fixation |
| JP6618540B2 (ja) | 2014-12-17 | 2019-12-11 | ベンタナ メディカル システムズ, インコーポレイテッド | 音響飛行時間の正確な計算 |
| CA2972682C (en) | 2015-01-27 | 2021-06-08 | Ventana Medical Systems, Inc. | Methods for tissue sample fixation using an extended soak in aldehyde-based fixative solutions |
| US9534938B1 (en) * | 2015-01-30 | 2017-01-03 | Squadle, Inc. | System and method for automatic measurement and recording |
| EP3256844B1 (de) | 2015-02-09 | 2021-04-14 | Ventana Medical Systems, Inc. | System und verfahren zur standardisierung der diffusion eines fluids in geweben |
| CN105319266A (zh) * | 2015-10-22 | 2016-02-10 | 同济大学 | 一种超声波液体浓度相敏检测方法及装置 |
-
2017
- 2017-12-21 WO PCT/US2017/067819 patent/WO2018119194A1/en not_active Ceased
- 2017-12-21 EP EP22171093.2A patent/EP4123285A1/de active Pending
- 2017-12-21 JP JP2019533636A patent/JP7228518B2/ja active Active
- 2017-12-21 CN CN201780079550.9A patent/CN110100162B/zh active Active
- 2017-12-21 JP JP2019533406A patent/JP7129981B2/ja active Active
- 2017-12-21 EP EP17832848.0A patent/EP3559629B1/de active Active
- 2017-12-21 CN CN201780079517.6A patent/CN110073194B/zh active Active
- 2017-12-21 WO PCT/US2017/067811 patent/WO2018119189A1/en not_active Ceased
- 2017-12-21 ES ES17832848T patent/ES2920973T3/es active Active
- 2017-12-21 CN CN202211135230.XA patent/CN115791343B/zh active Active
- 2017-12-21 EP EP17832141.0A patent/EP3559628B1/de active Active
-
2019
- 2019-06-13 US US16/439,751 patent/US11635355B2/en active Active
- 2019-06-13 US US16/439,743 patent/US11630038B2/en active Active
-
2022
- 2022-08-23 JP JP2022132322A patent/JP7458450B2/ja active Active
-
2023
- 2023-02-28 US US18/115,430 patent/US12085490B2/en active Active
- 2023-03-13 US US18/120,887 patent/US12181387B2/en active Active
-
2024
- 2024-03-15 JP JP2024041332A patent/JP7719905B2/ja active Active
- 2024-07-22 US US18/779,330 patent/US20240377293A1/en active Pending
Non-Patent Citations (1)
| Title |
|---|
| None * |
Also Published As
| Publication number | Publication date |
|---|---|
| WO2018119194A1 (en) | 2018-06-28 |
| CN110100162B (zh) | 2022-08-30 |
| CN110100162A (zh) | 2019-08-06 |
| US12085490B2 (en) | 2024-09-10 |
| CN110073194A (zh) | 2019-07-30 |
| WO2018119189A1 (en) | 2018-06-28 |
| JP7129981B2 (ja) | 2022-09-02 |
| EP3559629B1 (de) | 2022-05-04 |
| ES2920973T3 (es) | 2022-08-12 |
| JP7458450B2 (ja) | 2024-03-29 |
| JP2020503510A (ja) | 2020-01-30 |
| US11630038B2 (en) | 2023-04-18 |
| US11635355B2 (en) | 2023-04-25 |
| JP2022172192A (ja) | 2022-11-15 |
| JP7228518B2 (ja) | 2023-02-24 |
| EP3559628A1 (de) | 2019-10-30 |
| US20190293525A1 (en) | 2019-09-26 |
| CN110073194B (zh) | 2022-08-16 |
| JP2024069506A (ja) | 2024-05-21 |
| US12181387B2 (en) | 2024-12-31 |
| US20190310169A1 (en) | 2019-10-10 |
| US20230204470A1 (en) | 2023-06-29 |
| JP7719905B2 (ja) | 2025-08-06 |
| JP2020502529A (ja) | 2020-01-23 |
| EP3559629A1 (de) | 2019-10-30 |
| CN115791343B (zh) | 2025-11-11 |
| US20230213416A1 (en) | 2023-07-06 |
| EP4123285A1 (de) | 2023-01-25 |
| US20240377293A1 (en) | 2024-11-14 |
| CN115791343A (zh) | 2023-03-14 |
Similar Documents
| Publication | Publication Date | Title |
|---|---|---|
| US12181387B2 (en) | System and method for sample preservation | |
| US11002593B2 (en) | Obtaining true diffusivity constant | |
| US11639886B2 (en) | Diffusion monitoring protocol for optimized tissue fixation |
Legal Events
| Date | Code | Title | Description |
|---|---|---|---|
| STAA | Information on the status of an ep patent application or granted ep patent |
Free format text: STATUS: UNKNOWN |
|
| STAA | Information on the status of an ep patent application or granted ep patent |
Free format text: STATUS: THE INTERNATIONAL PUBLICATION HAS BEEN MADE |
|
| PUAI | Public reference made under article 153(3) epc to a published international application that has entered the european phase |
Free format text: ORIGINAL CODE: 0009012 |
|
| STAA | Information on the status of an ep patent application or granted ep patent |
Free format text: STATUS: REQUEST FOR EXAMINATION WAS MADE |
|
| 17P | Request for examination filed |
Effective date: 20190722 |
|
| AK | Designated contracting states |
Kind code of ref document: A1 Designated state(s): AL AT BE BG CH CY CZ DE DK EE ES FI FR GB GR HR HU IE IS IT LI LT LU LV MC MK MT NL NO PL PT RO RS SE SI SK SM TR |
|
| AX | Request for extension of the european patent |
Extension state: BA ME |
|
| DAV | Request for validation of the european patent (deleted) | ||
| DAX | Request for extension of the european patent (deleted) | ||
| GRAP | Despatch of communication of intention to grant a patent |
Free format text: ORIGINAL CODE: EPIDOSNIGR1 |
|
| STAA | Information on the status of an ep patent application or granted ep patent |
Free format text: STATUS: GRANT OF PATENT IS INTENDED |
|
| INTG | Intention to grant announced |
Effective date: 20201117 |
|
| GRAJ | Information related to disapproval of communication of intention to grant by the applicant or resumption of examination proceedings by the epo deleted |
Free format text: ORIGINAL CODE: EPIDOSDIGR1 |
|
| STAA | Information on the status of an ep patent application or granted ep patent |
Free format text: STATUS: REQUEST FOR EXAMINATION WAS MADE |
|
| GRAP | Despatch of communication of intention to grant a patent |
Free format text: ORIGINAL CODE: EPIDOSNIGR1 |
|
| STAA | Information on the status of an ep patent application or granted ep patent |
Free format text: STATUS: GRANT OF PATENT IS INTENDED |
|
| INTC | Intention to grant announced (deleted) | ||
| INTG | Intention to grant announced |
Effective date: 20210316 |
|
| GRAS | Grant fee paid |
Free format text: ORIGINAL CODE: EPIDOSNIGR3 |
|
| GRAA | (expected) grant |
Free format text: ORIGINAL CODE: 0009210 |
|
| STAA | Information on the status of an ep patent application or granted ep patent |
Free format text: STATUS: THE PATENT HAS BEEN GRANTED |
|
| AK | Designated contracting states |
Kind code of ref document: B1 Designated state(s): AL AT BE BG CH CY CZ DE DK EE ES FI FR GB GR HR HU IE IS IT LI LT LU LV MC MK MT NL NO PL PT RO RS SE SI SK SM TR |
|
| REG | Reference to a national code |
Ref country code: GB Ref legal event code: FG4D |
|
| RIN1 | Information on inventor provided before grant (corrected) |
Inventor name: BAUER, DANIEL Inventor name: OTTER, MICHAEL Inventor name: CHAFIN, DAVID |
|
| REG | Reference to a national code |
Ref country code: CH Ref legal event code: EP |
|
| REG | Reference to a national code |
Ref country code: DE Ref legal event code: R096 Ref document number: 602017044428 Country of ref document: DE |
|
| REG | Reference to a national code |
Ref country code: IE Ref legal event code: FG4D Ref country code: AT Ref legal event code: REF Ref document number: 1422066 Country of ref document: AT Kind code of ref document: T Effective date: 20210915 |
|
| REG | Reference to a national code |
Ref country code: LT Ref legal event code: MG9D |
|
| REG | Reference to a national code |
Ref country code: NL Ref legal event code: MP Effective date: 20210818 |
|
| REG | Reference to a national code |
Ref country code: AT Ref legal event code: MK05 Ref document number: 1422066 Country of ref document: AT Kind code of ref document: T Effective date: 20210818 |
|
| PG25 | Lapsed in a contracting state [announced via postgrant information from national office to epo] |
Ref country code: SE Free format text: LAPSE BECAUSE OF FAILURE TO SUBMIT A TRANSLATION OF THE DESCRIPTION OR TO PAY THE FEE WITHIN THE PRESCRIBED TIME-LIMIT Effective date: 20210818 Ref country code: RS Free format text: LAPSE BECAUSE OF FAILURE TO SUBMIT A TRANSLATION OF THE DESCRIPTION OR TO PAY THE FEE WITHIN THE PRESCRIBED TIME-LIMIT Effective date: 20210818 Ref country code: HR Free format text: LAPSE BECAUSE OF FAILURE TO SUBMIT A TRANSLATION OF THE DESCRIPTION OR TO PAY THE FEE WITHIN THE PRESCRIBED TIME-LIMIT Effective date: 20210818 Ref country code: ES Free format text: LAPSE BECAUSE OF FAILURE TO SUBMIT A TRANSLATION OF THE DESCRIPTION OR TO PAY THE FEE WITHIN THE PRESCRIBED TIME-LIMIT Effective date: 20210818 Ref country code: FI Free format text: LAPSE BECAUSE OF FAILURE TO SUBMIT A TRANSLATION OF THE DESCRIPTION OR TO PAY THE FEE WITHIN THE PRESCRIBED TIME-LIMIT Effective date: 20210818 Ref country code: BG Free format text: LAPSE BECAUSE OF FAILURE TO SUBMIT A TRANSLATION OF THE DESCRIPTION OR TO PAY THE FEE WITHIN THE PRESCRIBED TIME-LIMIT Effective date: 20211118 Ref country code: AT Free format text: LAPSE BECAUSE OF FAILURE TO SUBMIT A TRANSLATION OF THE DESCRIPTION OR TO PAY THE FEE WITHIN THE PRESCRIBED TIME-LIMIT Effective date: 20210818 Ref country code: LT Free format text: LAPSE BECAUSE OF FAILURE TO SUBMIT A TRANSLATION OF THE DESCRIPTION OR TO PAY THE FEE WITHIN THE PRESCRIBED TIME-LIMIT Effective date: 20210818 Ref country code: NO Free format text: LAPSE BECAUSE OF FAILURE TO SUBMIT A TRANSLATION OF THE DESCRIPTION OR TO PAY THE FEE WITHIN THE PRESCRIBED TIME-LIMIT Effective date: 20211118 Ref country code: PT Free format text: LAPSE BECAUSE OF FAILURE TO SUBMIT A TRANSLATION OF THE DESCRIPTION OR TO PAY THE FEE WITHIN THE PRESCRIBED TIME-LIMIT Effective date: 20211220 |
|
| PG25 | Lapsed in a contracting state [announced via postgrant information from national office to epo] |
Ref country code: PL Free format text: LAPSE BECAUSE OF FAILURE TO SUBMIT A TRANSLATION OF THE DESCRIPTION OR TO PAY THE FEE WITHIN THE PRESCRIBED TIME-LIMIT Effective date: 20210818 Ref country code: LV Free format text: LAPSE BECAUSE OF FAILURE TO SUBMIT A TRANSLATION OF THE DESCRIPTION OR TO PAY THE FEE WITHIN THE PRESCRIBED TIME-LIMIT Effective date: 20210818 Ref country code: GR Free format text: LAPSE BECAUSE OF FAILURE TO SUBMIT A TRANSLATION OF THE DESCRIPTION OR TO PAY THE FEE WITHIN THE PRESCRIBED TIME-LIMIT Effective date: 20211119 |
|
| PG25 | Lapsed in a contracting state [announced via postgrant information from national office to epo] |
Ref country code: NL Free format text: LAPSE BECAUSE OF FAILURE TO SUBMIT A TRANSLATION OF THE DESCRIPTION OR TO PAY THE FEE WITHIN THE PRESCRIBED TIME-LIMIT Effective date: 20210818 |
|
| PG25 | Lapsed in a contracting state [announced via postgrant information from national office to epo] |
Ref country code: DK Free format text: LAPSE BECAUSE OF FAILURE TO SUBMIT A TRANSLATION OF THE DESCRIPTION OR TO PAY THE FEE WITHIN THE PRESCRIBED TIME-LIMIT Effective date: 20210818 |
|
| REG | Reference to a national code |
Ref country code: DE Ref legal event code: R097 Ref document number: 602017044428 Country of ref document: DE |
|
| PG25 | Lapsed in a contracting state [announced via postgrant information from national office to epo] |
Ref country code: SM Free format text: LAPSE BECAUSE OF FAILURE TO SUBMIT A TRANSLATION OF THE DESCRIPTION OR TO PAY THE FEE WITHIN THE PRESCRIBED TIME-LIMIT Effective date: 20210818 Ref country code: SK Free format text: LAPSE BECAUSE OF FAILURE TO SUBMIT A TRANSLATION OF THE DESCRIPTION OR TO PAY THE FEE WITHIN THE PRESCRIBED TIME-LIMIT Effective date: 20210818 Ref country code: RO Free format text: LAPSE BECAUSE OF FAILURE TO SUBMIT A TRANSLATION OF THE DESCRIPTION OR TO PAY THE FEE WITHIN THE PRESCRIBED TIME-LIMIT Effective date: 20210818 Ref country code: EE Free format text: LAPSE BECAUSE OF FAILURE TO SUBMIT A TRANSLATION OF THE DESCRIPTION OR TO PAY THE FEE WITHIN THE PRESCRIBED TIME-LIMIT Effective date: 20210818 Ref country code: CZ Free format text: LAPSE BECAUSE OF FAILURE TO SUBMIT A TRANSLATION OF THE DESCRIPTION OR TO PAY THE FEE WITHIN THE PRESCRIBED TIME-LIMIT Effective date: 20210818 Ref country code: AL Free format text: LAPSE BECAUSE OF FAILURE TO SUBMIT A TRANSLATION OF THE DESCRIPTION OR TO PAY THE FEE WITHIN THE PRESCRIBED TIME-LIMIT Effective date: 20210818 |
|
| PLBE | No opposition filed within time limit |
Free format text: ORIGINAL CODE: 0009261 |
|
| STAA | Information on the status of an ep patent application or granted ep patent |
Free format text: STATUS: NO OPPOSITION FILED WITHIN TIME LIMIT |
|
| 26N | No opposition filed |
Effective date: 20220519 |
|
| PG25 | Lapsed in a contracting state [announced via postgrant information from national office to epo] |
Ref country code: MC Free format text: LAPSE BECAUSE OF FAILURE TO SUBMIT A TRANSLATION OF THE DESCRIPTION OR TO PAY THE FEE WITHIN THE PRESCRIBED TIME-LIMIT Effective date: 20210818 Ref country code: IT Free format text: LAPSE BECAUSE OF FAILURE TO SUBMIT A TRANSLATION OF THE DESCRIPTION OR TO PAY THE FEE WITHIN THE PRESCRIBED TIME-LIMIT Effective date: 20210818 |
|
| PG25 | Lapsed in a contracting state [announced via postgrant information from national office to epo] |
Ref country code: SI Free format text: LAPSE BECAUSE OF FAILURE TO SUBMIT A TRANSLATION OF THE DESCRIPTION OR TO PAY THE FEE WITHIN THE PRESCRIBED TIME-LIMIT Effective date: 20210818 |
|
| REG | Reference to a national code |
Ref country code: BE Ref legal event code: MM Effective date: 20211231 |
|
| PG25 | Lapsed in a contracting state [announced via postgrant information from national office to epo] |
Ref country code: LU Free format text: LAPSE BECAUSE OF NON-PAYMENT OF DUE FEES Effective date: 20211221 Ref country code: IE Free format text: LAPSE BECAUSE OF NON-PAYMENT OF DUE FEES Effective date: 20211221 |
|
| PG25 | Lapsed in a contracting state [announced via postgrant information from national office to epo] |
Ref country code: BE Free format text: LAPSE BECAUSE OF NON-PAYMENT OF DUE FEES Effective date: 20211231 |
|
| PG25 | Lapsed in a contracting state [announced via postgrant information from national office to epo] |
Ref country code: CY Free format text: LAPSE BECAUSE OF FAILURE TO SUBMIT A TRANSLATION OF THE DESCRIPTION OR TO PAY THE FEE WITHIN THE PRESCRIBED TIME-LIMIT Effective date: 20210818 |
|
| PG25 | Lapsed in a contracting state [announced via postgrant information from national office to epo] |
Ref country code: HU Free format text: LAPSE BECAUSE OF FAILURE TO SUBMIT A TRANSLATION OF THE DESCRIPTION OR TO PAY THE FEE WITHIN THE PRESCRIBED TIME-LIMIT; INVALID AB INITIO Effective date: 20171221 |
|
| REG | Reference to a national code |
Ref country code: DE Ref legal event code: R082 Ref document number: 602017044428 Country of ref document: DE Representative=s name: KRAUS & LEDERER PARTGMBB, DE |
|
| PG25 | Lapsed in a contracting state [announced via postgrant information from national office to epo] |
Ref country code: MK Free format text: LAPSE BECAUSE OF FAILURE TO SUBMIT A TRANSLATION OF THE DESCRIPTION OR TO PAY THE FEE WITHIN THE PRESCRIBED TIME-LIMIT Effective date: 20210818 |
|
| PG25 | Lapsed in a contracting state [announced via postgrant information from national office to epo] |
Ref country code: MT Free format text: LAPSE BECAUSE OF FAILURE TO SUBMIT A TRANSLATION OF THE DESCRIPTION OR TO PAY THE FEE WITHIN THE PRESCRIBED TIME-LIMIT Effective date: 20210818 |
|
| PGFP | Annual fee paid to national office [announced via postgrant information from national office to epo] |
Ref country code: DE Payment date: 20241121 Year of fee payment: 8 |
|
| PGFP | Annual fee paid to national office [announced via postgrant information from national office to epo] |
Ref country code: GB Payment date: 20241122 Year of fee payment: 8 |
|
| PGFP | Annual fee paid to national office [announced via postgrant information from national office to epo] |
Ref country code: FR Payment date: 20241121 Year of fee payment: 8 |
|
| PGFP | Annual fee paid to national office [announced via postgrant information from national office to epo] |
Ref country code: CH Payment date: 20250101 Year of fee payment: 8 |
|
| PG25 | Lapsed in a contracting state [announced via postgrant information from national office to epo] |
Ref country code: TR Free format text: LAPSE BECAUSE OF FAILURE TO SUBMIT A TRANSLATION OF THE DESCRIPTION OR TO PAY THE FEE WITHIN THE PRESCRIBED TIME-LIMIT Effective date: 20210818 |