EP3520688A1 - Electronic device, control method, and program - Google Patents
Electronic device, control method, and program Download PDFInfo
- Publication number
- EP3520688A1 EP3520688A1 EP17856272.4A EP17856272A EP3520688A1 EP 3520688 A1 EP3520688 A1 EP 3520688A1 EP 17856272 A EP17856272 A EP 17856272A EP 3520688 A1 EP3520688 A1 EP 3520688A1
- Authority
- EP
- European Patent Office
- Prior art keywords
- power spectrum
- basis
- noise
- temporal change
- controller
- Prior art date
- Legal status (The legal status is an assumption and is not a legal conclusion. Google has not performed a legal analysis and makes no representation as to the accuracy of the status listed.)
- Withdrawn
Links
Images





Classifications
-
- A—HUMAN NECESSITIES
- A61—MEDICAL OR VETERINARY SCIENCE; HYGIENE
- A61B—DIAGNOSIS; SURGERY; IDENTIFICATION
- A61B5/00—Measuring for diagnostic purposes; Identification of persons
- A61B5/02—Detecting, measuring or recording for evaluating the cardiovascular system, e.g. pulse, heart rate, blood pressure or blood flow
- A61B5/026—Measuring blood flow
- A61B5/0261—Measuring blood flow using optical means, e.g. infrared light
-
- A—HUMAN NECESSITIES
- A61—MEDICAL OR VETERINARY SCIENCE; HYGIENE
- A61B—DIAGNOSIS; SURGERY; IDENTIFICATION
- A61B5/00—Measuring for diagnostic purposes; Identification of persons
- A61B5/72—Signal processing specially adapted for physiological signals or for diagnostic purposes
- A61B5/7221—Determining signal validity, reliability or quality
-
- A—HUMAN NECESSITIES
- A61—MEDICAL OR VETERINARY SCIENCE; HYGIENE
- A61B—DIAGNOSIS; SURGERY; IDENTIFICATION
- A61B5/00—Measuring for diagnostic purposes; Identification of persons
-
- A—HUMAN NECESSITIES
- A61—MEDICAL OR VETERINARY SCIENCE; HYGIENE
- A61B—DIAGNOSIS; SURGERY; IDENTIFICATION
- A61B5/00—Measuring for diagnostic purposes; Identification of persons
- A61B5/02—Detecting, measuring or recording for evaluating the cardiovascular system, e.g. pulse, heart rate, blood pressure or blood flow
-
- A—HUMAN NECESSITIES
- A61—MEDICAL OR VETERINARY SCIENCE; HYGIENE
- A61B—DIAGNOSIS; SURGERY; IDENTIFICATION
- A61B5/00—Measuring for diagnostic purposes; Identification of persons
- A61B5/72—Signal processing specially adapted for physiological signals or for diagnostic purposes
- A61B5/7203—Signal processing specially adapted for physiological signals or for diagnostic purposes for noise prevention, reduction or removal
- A61B5/7207—Signal processing specially adapted for physiological signals or for diagnostic purposes for noise prevention, reduction or removal of noise induced by motion artifacts
-
- G—PHYSICS
- G01—MEASURING; TESTING
- G01N—INVESTIGATING OR ANALYSING MATERIALS BY DETERMINING THEIR CHEMICAL OR PHYSICAL PROPERTIES
- G01N21/00—Investigating or analysing materials by the use of optical means, i.e. using sub-millimetre waves, infrared, visible or ultraviolet light
- G01N21/17—Systems in which incident light is modified in accordance with the properties of the material investigated
- G01N21/47—Scattering, i.e. diffuse reflection
-
- G—PHYSICS
- G01—MEASURING; TESTING
- G01N—INVESTIGATING OR ANALYSING MATERIALS BY DETERMINING THEIR CHEMICAL OR PHYSICAL PROPERTIES
- G01N33/00—Investigating or analysing materials by specific methods not covered by groups G01N1/00 - G01N31/00
- G01N33/48—Biological material, e.g. blood, urine; Haemocytometers
- G01N33/483—Physical analysis of biological material
- G01N33/487—Physical analysis of biological material of liquid biological material
- G01N33/49—Blood
-
- A—HUMAN NECESSITIES
- A61—MEDICAL OR VETERINARY SCIENCE; HYGIENE
- A61B—DIAGNOSIS; SURGERY; IDENTIFICATION
- A61B2562/00—Details of sensors; Constructional details of sensor housings or probes; Accessories for sensors
- A61B2562/02—Details of sensors specially adapted for in-vivo measurements
- A61B2562/0233—Special features of optical sensors or probes classified in A61B5/00
-
- A—HUMAN NECESSITIES
- A61—MEDICAL OR VETERINARY SCIENCE; HYGIENE
- A61B—DIAGNOSIS; SURGERY; IDENTIFICATION
- A61B5/00—Measuring for diagnostic purposes; Identification of persons
- A61B5/02—Detecting, measuring or recording for evaluating the cardiovascular system, e.g. pulse, heart rate, blood pressure or blood flow
- A61B5/026—Measuring blood flow
- A61B5/0285—Measuring or recording phase velocity of blood waves
-
- A—HUMAN NECESSITIES
- A61—MEDICAL OR VETERINARY SCIENCE; HYGIENE
- A61B—DIAGNOSIS; SURGERY; IDENTIFICATION
- A61B5/00—Measuring for diagnostic purposes; Identification of persons
- A61B5/68—Arrangements of detecting, measuring or recording means, e.g. sensors, in relation to patient
- A61B5/6801—Arrangements of detecting, measuring or recording means, e.g. sensors, in relation to patient specially adapted to be attached to or worn on the body surface
- A61B5/6813—Specially adapted to be attached to a specific body part
- A61B5/6814—Head
-
- A—HUMAN NECESSITIES
- A61—MEDICAL OR VETERINARY SCIENCE; HYGIENE
- A61B—DIAGNOSIS; SURGERY; IDENTIFICATION
- A61B5/00—Measuring for diagnostic purposes; Identification of persons
- A61B5/68—Arrangements of detecting, measuring or recording means, e.g. sensors, in relation to patient
- A61B5/6801—Arrangements of detecting, measuring or recording means, e.g. sensors, in relation to patient specially adapted to be attached to or worn on the body surface
- A61B5/6813—Specially adapted to be attached to a specific body part
- A61B5/6825—Hand
- A61B5/6826—Finger
-
- A—HUMAN NECESSITIES
- A61—MEDICAL OR VETERINARY SCIENCE; HYGIENE
- A61B—DIAGNOSIS; SURGERY; IDENTIFICATION
- A61B5/00—Measuring for diagnostic purposes; Identification of persons
- A61B5/72—Signal processing specially adapted for physiological signals or for diagnostic purposes
- A61B5/7235—Details of waveform analysis
- A61B5/7253—Details of waveform analysis characterised by using transforms
- A61B5/7257—Details of waveform analysis characterised by using transforms using Fourier transforms
-
- G—PHYSICS
- G01—MEASURING; TESTING
- G01N—INVESTIGATING OR ANALYSING MATERIALS BY DETERMINING THEIR CHEMICAL OR PHYSICAL PROPERTIES
- G01N21/00—Investigating or analysing materials by the use of optical means, i.e. using sub-millimetre waves, infrared, visible or ultraviolet light
- G01N21/17—Systems in which incident light is modified in accordance with the properties of the material investigated
- G01N21/47—Scattering, i.e. diffuse reflection
- G01N2021/473—Compensating for unwanted scatter, e.g. reliefs, marks
Definitions
- the present disclosure relates to an electronic apparatus, a control method, and a program.
- Apparatuses configured to remove noise from data associated with biological information acquired from a subject (a user) are conventionally known (e.g., see PTL 1 and PTL 2).
- An electronic apparatus includes an output interface and a controller.
- the output interface is configured to output a signal on the basis of scattered light from a measured part.
- the controller is configured to calculate a temporal change of a power spectrum on the basis of the signal and detect noise included in the signal on the basis of the temporal change of the power spectrum.
- a control method includes a step of receiving a signal output on the basis of scattered light from a measured part, a step of calculating a temporal change of a power spectrum on the basis of the signal, and a step of detecting noise included in the signal on the basis of the temporal change of the power spectrum.
- a program causes a computer to execute a step of receiving a signal output on the basis of scattered light from a measured part, a step of calculating a temporal change of a power spectrum on the basis of the signal, and a step of detecting noise included in the signal on the basis of the temporal change of the power spectrum.
- FIG. 1 is a functional block diagram illustrating a schematic configuration of an electronic apparatus 100 according to an embodiment of the present disclosure.
- the electronic apparatus 100 includes a biological sensor 110, a controller 120, a memory 130, an input interface 140, and a display 150.
- the electronic apparatus 100 measures biological information of a subject.
- the electronic apparatus 100 measures the biological information on the basis of biological information data (hereinafter, also referred to simply as "data") acquired by the biological sensor 110.
- the electronic apparatus 100 acquires the data in a state in which, for example, the biological sensor 110 is in contact with a measured part such as a finger or a forehead.
- the biological information measured by the electronic apparatus 100 is information about any living organism that can be measured using data acquired by the biological sensor 110. Although in the present embodiment the biological information is described as information about blood flow amount, the biological information is not limited thereto.
- the biological sensor 110 acquires the data.
- the biological sensor 110 acquires the data in a state, for example, in which it contacts the measured part.
- the biological sensor 110 may be equipped with an optical emitter 111 and an optical detector 112.
- the biological sensor 110 irradiates the measured part with measurement light and receives reflected light (scattered light) from an inner tissue of the measured part.
- the biological sensor 110 transmits a photoelectric conversion signal of the scattered light to the controller 120.
- the biological sensor 110 functions as an output interface configured to output a signal based on the scattered light.
- the optical emitter 111 irradiates the measured part with measurement light on the basis of control performed by the controller 120.
- the optical emitter 111 irradiates the measured part with measurement light such as laser light at a wavelength that enables the detection of a predetermined blood component.
- the optical emitter 111 may be configured as, for example, an LD (Laser Diode).
- the optical detector 112 receives the scattered light of the measurement light from the measured part.
- the optical detector 112 may be configured as, for example, a PD (Photo Diode).
- a photoelectronic conversion signal of the scattered light received by the optical detector 112 is transmitted to the controller 120.
- the controller 120 includes at least one processor 120a configured to control and manage the electronic apparatus 100 in its entirety including each functional block thereof.
- the controller 120 is configured to include at least one processor 120a such as a CPU (Central Processing Unit) which executes a program defining a control procedure to realize the functionality.
- a program is stored in, for example, the memory 130 or an external storage medium coupled to the electronic apparatus 100.
- the at least one processor 120a may be realized as a single integrated circuit (IC), or a plurality of ICs and/or discrete circuits communicably coupled to one another.
- the at least one processor 120a may be realized according to various known technologies.
- the processor 120a includes one or more circuits or units configured to execute one or more data computing procedures or process by executing instructions stored in an associated memory.
- the processor 120a may be configured as firmware (e.g., discrete logic components) configured to execute one or more data computing procedures or process.
- the processor 120a may include one or more processors, controllers, microprocessors, microcontrollers, ASICs (application specific integrated circuits), digital signal processors, programmable logic devices, or field programmable gate arrays, any combination thereof, or any combination of configurations thereof.
- the processor 120a may include any combination of other know devices or any combination of configurations thereof.
- the controller 120 measures (calculates) the biological information on the basis of the data acquired from the biological sensor 110.
- the controller 120 may measure the blood flow amount as the biological information.
- the biological information is not limited to the blood flow amount.
- the controller 120 detects noise in the data when biological information is measured. The noise detection performed by the controller 120 will be described in detail later.
- the controller 120 When the controller 120 detects noise in the data, the controller 120 corrects the data by removing the noise. A correction method for the data performed by the controller 120 will be described in detail later. Because the controller 120 corrects the data by removing the noise, the measurement accuracy of the biological information performed by the electronic apparatus 100 is improved.
- the memory 130 may be configured as a semiconductor memory or a magnetic memory.
- the memory 130 stores various information and/or programs for operating the electronic apparatus 100.
- the memory 130 may also function as a working memory.
- the memory 130 may store, for example, the data acquired by the biological sensor 110.
- the input interface 140 receives an input operation performed by the subject and is configured, for example, as an operation button (an operation key).
- an operation button an operation key
- the input interface 140 may display an operation button for receiving an input operation performed by the subject on a display device and receive a touch input operation.
- the display 150 is a display device configured as, for example, a liquid crystal display, an organic EL (Electro Luminescent) display, or an inorganic EL display.
- the display 150 displays, for example, a result of the measurement of the biological information performed by the electronic apparatus 100.
- the controller 120 detects a beat signal generated by light interference between scattered light from static tissues and scattered light from the moving blood cells.
- the beat signal represents intensity as a function of time.
- the controller 120 converts the beat signal into a power spectrum which represents power as a function of frequency.
- the Doppler shift frequency is proportional to the moving speed of the blood cells.
- the power corresponds to the amount of blood cells.
- the controller 120 acquires the blood flow amount by multiplying the power spectrum of the beat signal by the frequency and then integrating the multiplication result.
- FIG. 2A to FIG. 2C are schematic diagrams illustrating the blood flow amount measurement process performed by the electronic apparatus 100.
- FIG. 2A is a diagram illustrating an example of the photoelectric conversion signal acquired by the controller 120 from the optical detector 112.
- the vertical axis represents output intensity of the optical detector 112 (i.e., intensity of the scattered light received by the optical detector 112)
- the horizontal axis represents time.
- the controller 120 calculates the power spectrum of the output intensity on the basis of the output of the optical detector 112 as illustrated in FIG. 2A by way of example.
- FIG. 2B is a diagram illustrating an example of the power spectrum calculated by the controller 120.
- the controller 120 calculates the power spectrum as illustrated in FIG. 2B by performing a Fast Fourier Transform on the output intensity.
- the vertical axis represents spectral intensity P(f), and the horizontal axis represents frequency f.
- the power spectrum shows, for example, a distribution with a downward descent to the right as illustrated in FIG. 2B .
- the controller 120 calculates the power spectrum of the output intensity at predetermined intervals (e.g., every 0.1024 seconds, that is, the time to collect 2048 data points by sampling at 20 kHz).
- the controller 120 calculates the blood flow amount on the basis of the power spectrum as illustrated in FIG. 2B .
- FIG. 2C is a diagram illustrating an example of the flood flow amount calculated by the controller 120.
- the vertical axis represents the blood flow amount Q
- the horizontal axis represents time.
- the controller 120 calculates the blood flow amount using, for example, the following equation (1).
- the optical detector 112 detects the beat signal caused by moving blood cells as referred to in the above description of the blood flow amount measurement technique using the Doppler shift, but may also detect, as the beat signal, the change (a deviation) of the positional relationship between the biological sensor 110 and the measured site.
- a beat signal caused by the deviation of the biological sensor 110 from the measured part is noise that causes a deterioration in the measurement accuracy of the biological information.
- noise is also referred to as a body-movement noise.
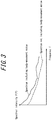
- the spectral intensity P(f) increases as illustrated in FIG. 3 by way of example.
- the body-movement noise affects all frequency bands as illustrated in FIG. 3 . That is, the body-movement noise does not affect only a particular frequency band. Accordingly, the use of a frequency band selective filter for processing a particular frequency band such as a band-pass filter cannot adequately remove the body-movement noise.
- the controller 120 detects body-movement noise on the basis of a change of the spectrum.
- the controller 120 corrects the spectrum that includes the body-movement noise as illustrated in FIG. 3 by way of example and generates a spectrum that does not include the body-movement noise.
- the controller 120 performs the noise detection and the correction by calculating a temporal change of the power spectrum.
- the controller 120 may calculate the temporal changes of at least three frequencies of the power spectrum.
- the three frequencies for which the controller 120 calculates the temporal change are a low frequency f l , a medium frequency f m , and a high frequency f h , in ascending order of the frequency.
- the low frequency f l is, for example, a frequency of several tens of Hz.
- the medium frequency f m is, for example, a frequency of 7 kHz to 10 kHz.
- the high frequency f h is, for example, a frequency of 18 kHz to 20 kHz. Note that these frequencies are used by way of example only, and the frequencies for which the controller 120 calculates the temporal change may be frequencies in other frequency bands.
- the controller 120 In order to perform the noise detection and the correction process, the controller 120 first generates reference waveforms for the temporal changes of the power spectrum to be used as basis for the noise detection.
- FIG. 4 is a flowchart illustrating an example generation process for the reference waveforms.
- the controller 120 acquires the data from the biological sensor 110 (step S101).
- the controller 120 calculates the power spectrum on the basis of the data by employing the foregoing method or the like (step S102).
- the controller 120 calculates the temporal changes of the spectral intensity P(f) of the low frequency f l , the medium frequency f m , and the high frequency f h , on the basis of the power spectrum (step S103).
- the waveform of the blood flow amount has a shape that oscillates between peaks and valleys with time, as illustrated in FIG. 2C by way of example.
- the power spectrum at the midpoint (the center) of the oscillation of the waveform of the power spectrum e.g., the power spectrum at the time t 1 of FIG. 2C , has the shape as illustrated in FIG. 5A .
- the power spectrum at the valley of the waveform of the blood flow amount e.g., the power spectrum at the time t 2 of FIG. 2C , has the shape as illustrated in FIG. 5B .
- the spectral intensity P(f) of the low frequency f l is higher and the spectral intensity P(f) of the high frequency f h is lower, as compared to the power spectrum P(f) at the midpoint of the oscillation.
- the power spectrum at the peak of the waveform of the blood flow amount e.g., the power spectrum at the time of time t 3 of FIG. 2C , has the shape as illustrated in FIG. 5C .
- the spectral intensity P(f) of the low frequency f l is lower and the spectral_intensity P(f) of the high frequency f h is higher, as compared to the power spectrum P(f) at the midpoint of the oscillation.
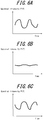
- FIG. 6A to FIG. 6C are diagrams illustrating examples of the temporal change of the spectral intensity P(f).
- FIG. 6A, FIG. 6B, and FIG. 6C illustrate the temporal changes of the spectral intensity P(f) of the low frequency f l , the medium frequency f m , and the high frequency f h , respectively.
- the spectral intensity P(f) of each of the low frequency f l and the high frequency f h has a waveform that oscillates from high to low with time.
- the spectral intensity P(f) of the low frequency f l When the spectral intensity P(f) of the low frequency f l is at a peak, the spectral intensity P(f) of the high frequency f h is at a valley. On the other hand, when the spectral intensity P(f) of the low frequency f l is at a valley, the spectral intensity P(f) of the high frequency fl is at a valley.
- the spectral intensity P(f) of the medium frequency f m is substantially constant.
- the medium frequency f m may be a frequency that has spectral intensity P(f) substantially constant with time.
- the controller 120 generates the reference waveforms on the basis of the temporal changes of the spectral intensity P(f) calculated in step S103 (step S104).
- the controller 120 generates the reference waveforms by predicting the temporal changes of the spectral intensity P(f) of the low frequency f l , the medium frequency f m , and the high frequency f h , and determining the predicted temporal changes of the spectral intensity P(f) as the reference waveforms.
- the controller 120 generates the reference waveforms on the basis of past data.
- the reference waveforms may be generated at, for example, predetermined time intervals.
- the controller 120 can generate the reference waveforms that reflect a trend of the spectral intensity P(f) by generating the reference waveforms at the predetermined time intervals.
- the trend of the spectral intensity P(f) includes rise and fall of the midpoint of the oscillation, a change of amplitude, a change of a oscillation period, and the like.
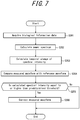
- FIG. 7 is a flowchart illustrating the noise detection and correction by way of example.
- the controller 120 acquires the data from the biological sensor 110 (step S201).
- the controller 120 calculates the power spectrum on the basis of the data by employing the foregoing method or the like (step S202).
- the controller 120 calculates the temporal changes of the spectrum P(f) at the low frequency f l , the medium frequency f m , and the high frequency f h , on the basis of the power spectrum (step S203).
- the waveforms of the temporal change of the spectral intensity P(f) calculated in step S203 are referred to as measured waveforms.
- the controller 120 detects the body-movement noise on the basis of the measured waveforms calculated in step S203. In particular, the controller 120 detects the body-movement noise on the basis of a comparison between the measured waveforms calculated in step S203 and the reference waveforms generated in step S104 of FIG. 4 .
- the controller 120 first compares the measured waveforms calculated in step S203 and the reference waveforms generated in step S104 of FIG. 4 (step S204).
- the controller 120 determines whether the body-movement noise is being generated, on the basis of the comparison. For example, the controller 120 provides a threshold associated with the reference waveforms and determines whether the spectral intensity P(f) at a predetermined time calculated in step S203 is equal to or higher than the threshold (step S205). The controller 120 may determine that the body-movement noise is being generated at a time at which the spectral intensity P(f) is equal to or higher than the threshold. That is, the controller 120 determines that a time slot in which the spectral intensity P(f) of the measured waveform is higher than the reference waveform by the threshold or more is a time slot in which the body-movement noise is generated.
- FIG. 8A to FIG. 8C are schematic diagrams illustrating the noise detection performed by the electronic apparatus 100.
- FIG. 8A, FIG. 8B, and FIG. 8C illustrate the temporal changes of the spectral intensity P(f) of the low frequency f l , the medium frequency f m , and the high frequency f h .
- Each of FIG. 8A to FIG. 8C illustrates the reference waveform and the measured waveform.
- the controller 120 determines that body-movement noise is being generated in the time slot between time t4 and time t5.
- the controller 120 may determine that the noise is generated in the time slot in which the spectral intensity P(f) is higher by the above threshold or more. In this case, the controller 120 corrects the measured waveform (step S206). The controller 120 may correct the measured waveform in the time slot in which it is determined that the body-movement noise is being generated, by, for example, replacing the measured waveforms with the reference waveforms. The controller 120 may otherwise correct the measured waveform.
- step S205 When the controller 120 determines that there is no time slot in which the spectral intensity P(f) calculated in step S203 is equal to or higher than the above threshold (a No determination in step S205), the controller 120 determines that body-movement noise is not being generated and ends the flow.
- the controller 120 may reproduce the power spectrum as illustrated in FIG. 2B by way of example on the basis of the temporal changes of the spectral intensity P(f) of the low frequency F l , the medium frequency f m , and the high frequency f h after performing the noise detection and the correction process illustrated in FIG. 7 .
- the controller 120 reproduces the shape of the power spectrum on the basis of three points of the spectral intensity P(f) for the high frequency f l , the medium frequency f m , and the high frequency f h .
- the shape of the power spectrum between the three points may be reproduced by, for example, linear approximation.
- the controller 120 may further generate the waveform of the blood flow amount as illustrated in FIG. 2C on the basis of the reproduced power spectrum. Thus, the controller 120 may measure the blood flow amount as the biological information.
- the electronic apparatus 100 calculates the temporal change of the power spectrum on the basis of the data acquired from the biological sensor 110 and detects noise included in the data on the basis of the power spectrum. Thus, the electronic apparatus 100 can detect the time slot in which noise is generated.
- the electronic apparatus 100 generates the reference waveforms for the temporal changes of the power spectrum and detects noise on the basis of a comparison with the reference waveforms.
- the reference waveforms reflect the trend in the spectrum of the blood flow amount of the subject.
- the electronic apparatus 100 can perform noise detection that reflects the trend in the change of the spectrum of the blood flow amount of the subject. In this way, the electronic apparatus 100 can improve the accuracy of the noise detection. Accordingly, the usability of the electronic apparatus 100 can be improved in comparison to conventional apparatuses.
- the electronic apparatus 100 can correct the temporal change of the power spectrum in the time slot in which the noise is detected.
- the correction may be performed by replacing the measured waveform for the time slot in which the noise is detected with the reference waveform.
- the electronic apparatus 100 can correct (remove) the noise without using a frequency band selective filter.
- the controller 120 detects noise using the temporal changes of three frequencies of the power spectrum.
- the controller 120 may detect noise using, for example, temporal changes of four or more frequencies. This improves the reproducibility of the power spectrum when the power spectrum is reproduced by correcting the noise.
- the controller 120 may detect a noise on the basis of the temporal change(s) of one or two frequencies. This enables the controller 120 to detect noise with a less processing load.
Landscapes
- Health & Medical Sciences (AREA)
- Life Sciences & Earth Sciences (AREA)
- Engineering & Computer Science (AREA)
- Biomedical Technology (AREA)
- Physics & Mathematics (AREA)
- General Health & Medical Sciences (AREA)
- Pathology (AREA)
- Biophysics (AREA)
- Molecular Biology (AREA)
- Animal Behavior & Ethology (AREA)
- Surgery (AREA)
- Veterinary Medicine (AREA)
- Heart & Thoracic Surgery (AREA)
- Medical Informatics (AREA)
- Public Health (AREA)
- Hematology (AREA)
- Physiology (AREA)
- Cardiology (AREA)
- Chemical & Material Sciences (AREA)
- Signal Processing (AREA)
- Biochemistry (AREA)
- Analytical Chemistry (AREA)
- General Physics & Mathematics (AREA)
- Immunology (AREA)
- Psychiatry (AREA)
- Computer Vision & Pattern Recognition (AREA)
- Artificial Intelligence (AREA)
- Ecology (AREA)
- Urology & Nephrology (AREA)
- Food Science & Technology (AREA)
- Medicinal Chemistry (AREA)
- Measuring Pulse, Heart Rate, Blood Pressure Or Blood Flow (AREA)
- Measuring And Recording Apparatus For Diagnosis (AREA)
Abstract
Description
- This application claims priority to and the benefit of Japanese Patent Application No.
2016-188621 (filed on September 27, 2016 - The present disclosure relates to an electronic apparatus, a control method, and a program.
- Apparatuses configured to remove noise from data associated with biological information acquired from a subject (a user) are conventionally known (e.g., see PTL 1 and PTL 2).
-
- PTL 1:
JP-A-2007-054471 - PTL 2:
JP-A-2013-150772 - An electronic apparatus according to one embodiment includes an output interface and a controller. The output interface is configured to output a signal on the basis of scattered light from a measured part. The controller is configured to calculate a temporal change of a power spectrum on the basis of the signal and detect noise included in the signal on the basis of the temporal change of the power spectrum.
- A control method according to one embodiment includes a step of receiving a signal output on the basis of scattered light from a measured part, a step of calculating a temporal change of a power spectrum on the basis of the signal, and a step of detecting noise included in the signal on the basis of the temporal change of the power spectrum.
- A program according to one embodiment causes a computer to execute a step of receiving a signal output on the basis of scattered light from a measured part, a step of calculating a temporal change of a power spectrum on the basis of the signal, and a step of detecting noise included in the signal on the basis of the temporal change of the power spectrum.
- In the accompanying drawings:
-
FIG. 1 is a functional block diagram illustrating a schematic configuration of an electronic apparatus according to one embodiment of the present disclosure; -
FIG. 2A is a schematic diagram illustrating a blood flow amount measurement process performed by the electronic apparatus ofFIG. 1 ; -
FIG. 2B is a schematic diagram illustrating the blood flow amount measurement process performed by the electronic apparatus ofFIG. 1 ; -
FIG. 2C is a schematic diagram illustrating the blood flow amount measurement process performed by the electronic apparatus ofFIG. 1 ; -
FIG. 3 is a diagram illustrating an example spectrum that includes a body-movement noise; -
FIG. 4 is a flowchart illustrating an example process for generating a reference waveform of a temporal change of a power spectrum performed by the electronic apparatus ofFIG. 1 ; -
FIG. 5A is a diagram illustrating an example power spectrum; -
FIG. 5B is a diagram illustrating an example power spectrum; -
FIG. 5C is a diagram illustrating an example power spectrum; -
FIG. 6A is a diagram illustrating an example temporal change of spectral intensity; -
FIG. 6B is a diagram illustrating an example temporal change of the spectral intensity; -
FIG. 6C is a diagram illustrating an example temporal change of the spectral intensity; -
FIG. 7 is a flowchart illustrating noise detection and a correction process by way of example performed by the electronic apparatus ofFIG. 1 ; -
FIG. 8A is a diagram schematically illustrating the noise detection performed by the electronic apparatus ofFIG. 1 ; -
FIG. 8B is a diagram schematically illustrating the noise detection performed by the electronic apparatus ofFIG. 1 ; and -
FIG. 8C is a diagram schematically illustrating the noise detection performed by the electronic apparatus ofFIG. 1 . - Hereinafter, an embodiment of the present disclosure will be described in detail with reference to the accompanying drawings.
-
FIG. 1 is a functional block diagram illustrating a schematic configuration of anelectronic apparatus 100 according to an embodiment of the present disclosure. Theelectronic apparatus 100 includes abiological sensor 110, acontroller 120, amemory 130, aninput interface 140, and adisplay 150. - The
electronic apparatus 100 measures biological information of a subject. Theelectronic apparatus 100 measures the biological information on the basis of biological information data (hereinafter, also referred to simply as "data") acquired by thebiological sensor 110. Theelectronic apparatus 100 acquires the data in a state in which, for example, thebiological sensor 110 is in contact with a measured part such as a finger or a forehead. The biological information measured by theelectronic apparatus 100 is information about any living organism that can be measured using data acquired by thebiological sensor 110. Although in the present embodiment the biological information is described as information about blood flow amount, the biological information is not limited thereto. - The
biological sensor 110 acquires the data. Thebiological sensor 110 acquires the data in a state, for example, in which it contacts the measured part. Thebiological sensor 110 may be equipped with anoptical emitter 111 and anoptical detector 112. Thebiological sensor 110 irradiates the measured part with measurement light and receives reflected light (scattered light) from an inner tissue of the measured part. Thebiological sensor 110 transmits a photoelectric conversion signal of the scattered light to thecontroller 120. Thebiological sensor 110 functions as an output interface configured to output a signal based on the scattered light. - The
optical emitter 111 irradiates the measured part with measurement light on the basis of control performed by thecontroller 120. Theoptical emitter 111 irradiates the measured part with measurement light such as laser light at a wavelength that enables the detection of a predetermined blood component. Theoptical emitter 111 may be configured as, for example, an LD (Laser Diode). - The
optical detector 112 receives the scattered light of the measurement light from the measured part. Theoptical detector 112 may be configured as, for example, a PD (Photo Diode). A photoelectronic conversion signal of the scattered light received by theoptical detector 112 is transmitted to thecontroller 120. - The
controller 120 includes at least oneprocessor 120a configured to control and manage theelectronic apparatus 100 in its entirety including each functional block thereof. Thecontroller 120 is configured to include at least oneprocessor 120a such as a CPU (Central Processing Unit) which executes a program defining a control procedure to realize the functionality. Such a program is stored in, for example, thememory 130 or an external storage medium coupled to theelectronic apparatus 100. - In various embodiments, the at least one
processor 120a may be realized as a single integrated circuit (IC), or a plurality of ICs and/or discrete circuits communicably coupled to one another. The at least oneprocessor 120a may be realized according to various known technologies. - In one embodiment, the
processor 120a includes one or more circuits or units configured to execute one or more data computing procedures or process by executing instructions stored in an associated memory. In some embodiments, theprocessor 120a may be configured as firmware (e.g., discrete logic components) configured to execute one or more data computing procedures or process. - In various embodiments, in order to perform the function of the
controller 120, theprocessor 120a may include one or more processors, controllers, microprocessors, microcontrollers, ASICs (application specific integrated circuits), digital signal processors, programmable logic devices, or field programmable gate arrays, any combination thereof, or any combination of configurations thereof. Theprocessor 120a may include any combination of other know devices or any combination of configurations thereof. - The
controller 120 measures (calculates) the biological information on the basis of the data acquired from thebiological sensor 110. Thecontroller 120 may measure the blood flow amount as the biological information. However, the biological information is not limited to the blood flow amount. Thecontroller 120 detects noise in the data when biological information is measured. The noise detection performed by thecontroller 120 will be described in detail later. - When the
controller 120 detects noise in the data, thecontroller 120 corrects the data by removing the noise. A correction method for the data performed by thecontroller 120 will be described in detail later. Because thecontroller 120 corrects the data by removing the noise, the measurement accuracy of the biological information performed by theelectronic apparatus 100 is improved. - The
memory 130 may be configured as a semiconductor memory or a magnetic memory. Thememory 130 stores various information and/or programs for operating theelectronic apparatus 100. Thememory 130 may also function as a working memory. Thememory 130 may store, for example, the data acquired by thebiological sensor 110. - The
input interface 140 receives an input operation performed by the subject and is configured, for example, as an operation button (an operation key). When theinput interface 140 is configured as a touch panel, theinput interface 140 may display an operation button for receiving an input operation performed by the subject on a display device and receive a touch input operation. - The
display 150 is a display device configured as, for example, a liquid crystal display, an organic EL (Electro Luminescent) display, or an inorganic EL display. Thedisplay 150 displays, for example, a result of the measurement of the biological information performed by theelectronic apparatus 100. - Next, a blood flow rate measurement technique using Doppler shift employed by the
controller 120 will be described. - In the tissues of the living body, scattered light scattered by moving blood cells undergoes a frequency shift (a Doppler shift) due to a Doppler effect that is proportional to the moving speed of the blood cells in the blood. The
controller 120 detects a beat signal generated by light interference between scattered light from static tissues and scattered light from the moving blood cells. The beat signal represents intensity as a function of time. Thecontroller 120 converts the beat signal into a power spectrum which represents power as a function of frequency. In the power spectrum of the beat signal, the Doppler shift frequency is proportional to the moving speed of the blood cells. In the power spectrum of the beat signal, the power corresponds to the amount of blood cells. Thecontroller 120 acquires the blood flow amount by multiplying the power spectrum of the beat signal by the frequency and then integrating the multiplication result. -
FIG. 2A to FIG. 2C are schematic diagrams illustrating the blood flow amount measurement process performed by theelectronic apparatus 100.FIG. 2A is a diagram illustrating an example of the photoelectric conversion signal acquired by thecontroller 120 from theoptical detector 112. InFIG. 2A , the vertical axis represents output intensity of the optical detector 112 (i.e., intensity of the scattered light received by the optical detector 112), and the horizontal axis represents time. Thecontroller 120 calculates the power spectrum of the output intensity on the basis of the output of theoptical detector 112 as illustrated inFIG. 2A by way of example. -
FIG. 2B is a diagram illustrating an example of the power spectrum calculated by thecontroller 120. Thecontroller 120 calculates the power spectrum as illustrated inFIG. 2B by performing a Fast Fourier Transform on the output intensity. InFIG. 2B , the vertical axis represents spectral intensity P(f), and the horizontal axis represents frequency f. The power spectrum shows, for example, a distribution with a downward descent to the right as illustrated inFIG. 2B . Thecontroller 120 calculates the power spectrum of the output intensity at predetermined intervals (e.g., every 0.1024 seconds, that is, the time to collect 2048 data points by sampling at 20 kHz). Thecontroller 120 calculates the blood flow amount on the basis of the power spectrum as illustrated inFIG. 2B . -
FIG. 2C is a diagram illustrating an example of the flood flow amount calculated by thecontroller 120. InFIG. 2C , the vertical axis represents the blood flow amount Q, and the horizontal axis represents time. Thecontroller 120 calculates the blood flow amount using, for example, the following equation (1).
[Equation 1]
- During the measurement of the biological information, when the positional relationship between the
biological sensor 110 that acquires the data and the measured part (skin) changes, the output intensity received by theoptical detector 112 also changes. That is, theoptical detector 112 detects the beat signal caused by moving blood cells as referred to in the above description of the blood flow amount measurement technique using the Doppler shift, but may also detect, as the beat signal, the change (a deviation) of the positional relationship between thebiological sensor 110 and the measured site. Such a beat signal caused by the deviation of thebiological sensor 110 from the measured part is noise that causes a deterioration in the measurement accuracy of the biological information. Hereinafter, such noise is also referred to as a body-movement noise. - When body-movement noise is generated, the spectral intensity P(f) increases as illustrated in
FIG. 3 by way of example. The body-movement noise affects all frequency bands as illustrated inFIG. 3 . That is, the body-movement noise does not affect only a particular frequency band. Accordingly, the use of a frequency band selective filter for processing a particular frequency band such as a band-pass filter cannot adequately remove the body-movement noise. - Next, the noise detection and the correction performed by the
controller 120 according to the present embodiment will be described in detail. Thecontroller 120 detects body-movement noise on the basis of a change of the spectrum. Whencontroller 120 detects body-movement noise, thecontroller 120 corrects the spectrum that includes the body-movement noise as illustrated inFIG. 3 by way of example and generates a spectrum that does not include the body-movement noise. - The
controller 120 performs the noise detection and the correction by calculating a temporal change of the power spectrum. Thecontroller 120 may calculate the temporal changes of at least three frequencies of the power spectrum. Here, it is assumed that thecontroller 120 calculates the temporal changes of at least three frequencies of the power spectrum. The three frequencies for which thecontroller 120 calculates the temporal change are a low frequency fl, a medium frequency fm, and a high frequency fh, in ascending order of the frequency. The low frequency fl is, for example, a frequency of several tens of Hz. The medium frequency fm is, for example, a frequency of 7 kHz to 10 kHz. The high frequency fh is, for example, a frequency of 18 kHz to 20 kHz. Note that these frequencies are used by way of example only, and the frequencies for which thecontroller 120 calculates the temporal change may be frequencies in other frequency bands. - In order to perform the noise detection and the correction process, the
controller 120 first generates reference waveforms for the temporal changes of the power spectrum to be used as basis for the noise detection.FIG. 4 is a flowchart illustrating an example generation process for the reference waveforms. - The
controller 120 acquires the data from the biological sensor 110 (step S101). - The
controller 120 calculates the power spectrum on the basis of the data by employing the foregoing method or the like (step S102). - The
controller 120 calculates the temporal changes of the spectral intensity P(f) of the low frequency fl, the medium frequency fm, and the high frequency fh, on the basis of the power spectrum (step S103). - Here, the temporal change of the power spectrum calculated by the
controller 120 will be described with reference toFIG. 5A to FIG 5C . The waveform of the blood flow amount has a shape that oscillates between peaks and valleys with time, as illustrated inFIG. 2C by way of example. The power spectrum at the midpoint (the center) of the oscillation of the waveform of the power spectrum, e.g., the power spectrum at the time t1 ofFIG. 2C , has the shape as illustrated inFIG. 5A . - The power spectrum at the valley of the waveform of the blood flow amount, e.g., the power spectrum at the time t2 of
FIG. 2C , has the shape as illustrated inFIG. 5B . As can be understood with reference toFIG. 5A and FIG. 5B , in the power spectrum at the valley the spectral intensity P(f) of the low frequency fl is higher and the spectral intensity P(f) of the high frequency fh is lower, as compared to the power spectrum P(f) at the midpoint of the oscillation. - The power spectrum at the peak of the waveform of the blood flow amount, e.g., the power spectrum at the time of time t3 of
FIG. 2C , has the shape as illustrated inFIG. 5C . As can be understood with reference toFIG. 5A to FIG. 5C , in the power spectrum at the peak, the spectral intensity P(f) of the low frequency fl is lower and the spectral_intensity P(f) of the high frequency fh is higher, as compared to the power spectrum P(f) at the midpoint of the oscillation. -
FIG. 6A to FIG. 6C are diagrams illustrating examples of the temporal change of the spectral intensity P(f).FIG. 6A, FIG. 6B, and FIG. 6C illustrate the temporal changes of the spectral intensity P(f) of the low frequency fl, the medium frequency fm, and the high frequency fh, respectively. As can be understood with reference toFIG. 6A to FIG. 6C , the spectral intensity P(f) of each of the low frequency fl and the high frequency fh has a waveform that oscillates from high to low with time. When the spectral intensity P(f) of the low frequency fl is at a peak, the spectral intensity P(f) of the high frequency fh is at a valley. On the other hand, when the spectral intensity P(f) of the low frequency fl is at a valley, the spectral intensity P(f) of the high frequency fl is at a valley. As can be understood with reference toFIG. 6B , the spectral intensity P(f) of the medium frequency fm is substantially constant. The medium frequency fm may be a frequency that has spectral intensity P(f) substantially constant with time. - The
controller 120 generates the reference waveforms on the basis of the temporal changes of the spectral intensity P(f) calculated in step S103 (step S104). In particular, thecontroller 120 generates the reference waveforms by predicting the temporal changes of the spectral intensity P(f) of the low frequency fl, the medium frequency fm, and the high frequency fh, and determining the predicted temporal changes of the spectral intensity P(f) as the reference waveforms. In this manner, thecontroller 120 generates the reference waveforms on the basis of past data. The reference waveforms may be generated at, for example, predetermined time intervals. Thecontroller 120 can generate the reference waveforms that reflect a trend of the spectral intensity P(f) by generating the reference waveforms at the predetermined time intervals. Note that the trend of the spectral intensity P(f) includes rise and fall of the midpoint of the oscillation, a change of amplitude, a change of a oscillation period, and the like. - After generating the reference waveforms, the
controller 120 performs the noise detection and correction using the reference waveforms.FIG. 7 is a flowchart illustrating the noise detection and correction by way of example. - The
controller 120 acquires the data from the biological sensor 110 (step S201). - The
controller 120 calculates the power spectrum on the basis of the data by employing the foregoing method or the like (step S202). - The
controller 120 calculates the temporal changes of the spectrum P(f) at the low frequency fl, the medium frequency fm, and the high frequency fh, on the basis of the power spectrum (step S203). Here, the waveforms of the temporal change of the spectral intensity P(f) calculated in step S203 are referred to as measured waveforms. - The
controller 120 detects the body-movement noise on the basis of the measured waveforms calculated in step S203. In particular, thecontroller 120 detects the body-movement noise on the basis of a comparison between the measured waveforms calculated in step S203 and the reference waveforms generated in step S104 ofFIG. 4 . - That is, the
controller 120 first compares the measured waveforms calculated in step S203 and the reference waveforms generated in step S104 ofFIG. 4 (step S204). - The
controller 120 determines whether the body-movement noise is being generated, on the basis of the comparison. For example, thecontroller 120 provides a threshold associated with the reference waveforms and determines whether the spectral intensity P(f) at a predetermined time calculated in step S203 is equal to or higher than the threshold (step S205). Thecontroller 120 may determine that the body-movement noise is being generated at a time at which the spectral intensity P(f) is equal to or higher than the threshold. That is, thecontroller 120 determines that a time slot in which the spectral intensity P(f) of the measured waveform is higher than the reference waveform by the threshold or more is a time slot in which the body-movement noise is generated. -
FIG. 8A to FIG. 8C are schematic diagrams illustrating the noise detection performed by theelectronic apparatus 100.FIG. 8A, FIG. 8B, and FIG. 8C illustrate the temporal changes of the spectral intensity P(f) of the low frequency fl, the medium frequency fm, and the high frequency fh. Each ofFIG. 8A to FIG. 8C illustrates the reference waveform and the measured waveform. When the spectral intensity of the measured waveform is higher than the spectral intensity P(f) of the reference waveform by the threshold or more in a time zone between t4 and t5 as illustrated inFIG. 8A to FIG. 8C , thecontroller 120 determines that body-movement noise is being generated in the time slot between time t4 and time t5. - When the
controller 120 determines that the spectral intensity P(f) calculated in step S203 is higher by the above threshold or more (a Yes determination in step S205), thecontroller 120 may determine that the noise is generated in the time slot in which the spectral intensity P(f) is higher by the above threshold or more. In this case, thecontroller 120 corrects the measured waveform (step S206). Thecontroller 120 may correct the measured waveform in the time slot in which it is determined that the body-movement noise is being generated, by, for example, replacing the measured waveforms with the reference waveforms. Thecontroller 120 may otherwise correct the measured waveform. - When the
controller 120 determines that there is no time slot in which the spectral intensity P(f) calculated in step S203 is equal to or higher than the above threshold (a No determination in step S205), thecontroller 120 determines that body-movement noise is not being generated and ends the flow. - The
controller 120 may reproduce the power spectrum as illustrated inFIG. 2B by way of example on the basis of the temporal changes of the spectral intensity P(f) of the low frequency Fl, the medium frequency fm, and the high frequency fh after performing the noise detection and the correction process illustrated inFIG. 7 . In particular, thecontroller 120 reproduces the shape of the power spectrum on the basis of three points of the spectral intensity P(f) for the high frequency fl, the medium frequency fm, and the high frequency fh. The shape of the power spectrum between the three points may be reproduced by, for example, linear approximation. - The
controller 120 may further generate the waveform of the blood flow amount as illustrated inFIG. 2C on the basis of the reproduced power spectrum. Thus, thecontroller 120 may measure the blood flow amount as the biological information. - The
electronic apparatus 100 according to the above embodiment calculates the temporal change of the power spectrum on the basis of the data acquired from thebiological sensor 110 and detects noise included in the data on the basis of the power spectrum. Thus, theelectronic apparatus 100 can detect the time slot in which noise is generated. Theelectronic apparatus 100 generates the reference waveforms for the temporal changes of the power spectrum and detects noise on the basis of a comparison with the reference waveforms. The reference waveforms reflect the trend in the spectrum of the blood flow amount of the subject. Thus, theelectronic apparatus 100 can perform noise detection that reflects the trend in the change of the spectrum of the blood flow amount of the subject. In this way, theelectronic apparatus 100 can improve the accuracy of the noise detection. Accordingly, the usability of theelectronic apparatus 100 can be improved in comparison to conventional apparatuses. - When the
electronic apparatus 100 detects noise, theelectronic apparatus 100 can correct the temporal change of the power spectrum in the time slot in which the noise is detected. The correction may be performed by replacing the measured waveform for the time slot in which the noise is detected with the reference waveform. Thus, theelectronic apparatus 100 can correct (remove) the noise without using a frequency band selective filter. - One embodiment has been described in order to provide a complete and clear disclosure. However, the appended claims should not be construed as limited to the above embodiment and are configured to realize every possible variations and alternatives that can be conceived by those who are skilled in the art within the scope of the fundamentals shown herein. Each of the requirements shown in some embodiments can be freely combined.
- For example, in the above embodiment the
controller 120 detects noise using the temporal changes of three frequencies of the power spectrum. However, thecontroller 120 may detect noise using, for example, temporal changes of four or more frequencies. This improves the reproducibility of the power spectrum when the power spectrum is reproduced by correcting the noise. Thecontroller 120 may detect a noise on the basis of the temporal change(s) of one or two frequencies. This enables thecontroller 120 to detect noise with a less processing load. -
- 100
- electronic apparatus
- 110
- biological sensor
- 111
- optical emitter
- 112
- optical detector
- 120
- controller
- 120a
- processor
- 130
- memory
- 140
- input interface
- 150
- display
Claims (20)
- An electronic apparatus comprising:an output interface configured to output a signal on the basis of scattered light from a measured part; anda controller configured to calculate a temporal change of a power spectrum on the basis of the signal and detect noise included in the signal on the basis of the temporal change of the power spectrum.
- The electronic apparatus according to claim 1,
wherein the controller generates a reference for the temporal change of the power spectrum and detects the noise on the basis of a comparison between the temporal change of the power spectrum and the reference. - The electronic apparatus according to claim 2,
wherein the controller generates the reference on the basis of a signal output in the past. - The electronic apparatus according to claim 2 or 3,
wherein the controller detects the noise when the power spectrum at a predetermined time is higher than the reference by a predetermined threshold or more. - The electronic apparatus according to any one of claims 1 to 4,
wherein the controller corrects the temporal change of the power spectrum on the basis of the noise. - The electronic apparatus according to any one of claims 1 to 5,
wherein the controller calculates temporal changes for at least three frequencies of the power spectrum. - The electronic apparatus according to any one of claims 1 to 6,
wherein the biological information is a blood flow amount. - The electronic apparatus according to any one of claims 1 to 7,
wherein the measured part is a finger or a forehead. - A control method comprising:a step of receiving a signal output on the basis of scattered light from a measured part;a step of calculating a temporal change of a power spectrum on the basis of the signal; anda step of detecting noise included in the signal on the basis of the temporal change of the power spectrum.
- The control method according to claim 9,
further comprising a step of generating a reference for the temporal change of the temporal change of the power spectrum, and
the step of detecting the noise detects the noise on the basis of a comparison between the temporal change of the power spectrum and the reference. - The control method according to claim 10,
wherein the step of generating the reference generates the reference on the basis of a signal output in the past. - The control method according to claim 10 or 11,
wherein the step of detecting the noise detects the noise when the power spectrum at a predetermined time is higher than the reference by a predetermined threshold or more. - The control method according to any one of claims 9 to 12,
further comprising a step of correcting the temporal change of the power spectrum on the basis of the noise. - The control method according to any one of claims 9 to 13,
wherein the step of calculating the temporal change calculates temporal changes for at least three frequencies of the power spectrum. - A program causing a computer to perform:a step of receiving a signal output on the basis of scattered light from a measured part;a step of calculating a temporal change of a power spectrum on the basis of the signal; anda step of detecting noise included in the signal on the basis of the temporal change of the power spectrum.
- The program according to claim 15,
further causing the computer to perform a step of generating a reference for the temporal change of the power spectrum,
wherein the step of detecting the noise detects the noise on the basis of a comparison between the temporal change of the power spectrum and the reference. - The program according to claim 16,
wherein the step of generating the reference generates the reference on the basis of a signal output in the past. - The program according to claim 16 or 17,
wherein the step of detecting the noise detects the noise when the power spectrum at a predetermined time is higher than the reference by a predetermined threshold or more. - The program according to any one of claims 15 to 18,
further causing the computer to perform a step of correcting the temporal change of the power spectrum on the basis of the noise. - The program according to any one of claims 15 to 19,
wherein the step of calculating the temporal change calculates temporal changes for at least three frequencies of the power spectrum.
Applications Claiming Priority (2)
| Application Number | Priority Date | Filing Date | Title |
|---|---|---|---|
| JP2016188621A JP6820706B2 (en) | 2016-09-27 | 2016-09-27 | Electronics, control methods and programs |
| PCT/JP2017/035069 WO2018062323A1 (en) | 2016-09-27 | 2017-09-27 | Electronic device, control method, and program |
Publications (2)
| Publication Number | Publication Date |
|---|---|
| EP3520688A1 true EP3520688A1 (en) | 2019-08-07 |
| EP3520688A4 EP3520688A4 (en) | 2020-06-03 |
Family
ID=61759818
Family Applications (1)
| Application Number | Title | Priority Date | Filing Date |
|---|---|---|---|
| EP17856272.4A Withdrawn EP3520688A4 (en) | 2016-09-27 | 2017-09-27 | ELECTRONIC DEVICE, CONTROL METHOD AND PROGRAM |
Country Status (5)
| Country | Link |
|---|---|
| US (1) | US11607177B2 (en) |
| EP (1) | EP3520688A4 (en) |
| JP (1) | JP6820706B2 (en) |
| CN (1) | CN109788915B (en) |
| WO (1) | WO2018062323A1 (en) |
Families Citing this family (1)
| Publication number | Priority date | Publication date | Assignee | Title |
|---|---|---|---|---|
| CN115165792B (en) * | 2022-06-24 | 2023-09-29 | 宝腾智能润滑技术(东莞)有限公司 | Method and device for detecting gas-liquid two-phase flow state in pipeline |
Family Cites Families (17)
| Publication number | Priority date | Publication date | Assignee | Title |
|---|---|---|---|---|
| JPH01213553A (en) * | 1988-02-22 | 1989-08-28 | Toshimitsu Musha | Method for removing thermal noise of photodetector as well as method for measuring grain size and method for measuring immune reaction |
| JP3464697B2 (en) * | 1993-12-21 | 2003-11-10 | 興和株式会社 | Oxygen saturation meter |
| US5647366A (en) * | 1996-09-17 | 1997-07-15 | Siemens Medical Systems, Inc. | Method and system for automatic measurements of doppler waveforms |
| GB9623363D0 (en) | 1996-11-09 | 1997-01-08 | Moor Instr Ltd | Apparatus for measuring microvascular blood flow |
| GB2351197B (en) * | 1996-11-09 | 2001-02-21 | Moor Instr Ltd | Apparatus for measuring microvascular blood flow |
| US6393311B1 (en) * | 1998-10-15 | 2002-05-21 | Ntc Technology Inc. | Method, apparatus and system for removing motion artifacts from measurements of bodily parameters |
| JP2003047601A (en) * | 2001-05-31 | 2003-02-18 | Denso Corp | Biological abnormality monitoring device, blood pressure monitoring device, biological abnormality monitoring method, and blood pressure monitoring method |
| JP3924636B2 (en) * | 2001-10-30 | 2007-06-06 | 日本光電工業株式会社 | Pulse wave signal processing method |
| JP2006247221A (en) * | 2005-03-11 | 2006-09-21 | Omron Healthcare Co Ltd | Pulse wave detector |
| JP2007054471A (en) * | 2005-08-26 | 2007-03-08 | Nippon Koden Corp | Pulse rate measuring device and pulse rate measuring method |
| CN101138507B (en) * | 2006-09-05 | 2010-05-12 | 深圳迈瑞生物医疗电子股份有限公司 | Method and device for processing sound signal of Doppler blood flow |
| CN101766497B (en) * | 2008-12-31 | 2013-03-06 | 深圳迈瑞生物医疗电子股份有限公司 | Method for processing signal of sound spectrogram image and system therefor |
| WO2011155048A1 (en) * | 2010-06-10 | 2011-12-15 | 富士通株式会社 | Audio processing device, and breathing detection device |
| US8755876B2 (en) * | 2011-12-02 | 2014-06-17 | Worcester Polytechnic Institute | Methods and systems for atrial fibrillation detection |
| JP2013150772A (en) | 2011-12-29 | 2013-08-08 | Sony Corp | Signal processing apparatus and signal processing method |
| US9168020B2 (en) * | 2012-08-13 | 2015-10-27 | Fujitsu Limited | Frequency domain analysis transform of renal blood flow doppler signal to determine stress levels |
| JP6045100B2 (en) * | 2012-10-17 | 2016-12-14 | オメガウェーブ株式会社 | Blood flow measurement device |
-
2016
- 2016-09-27 JP JP2016188621A patent/JP6820706B2/en active Active
-
2017
- 2017-09-27 CN CN201780058646.7A patent/CN109788915B/en not_active Expired - Fee Related
- 2017-09-27 WO PCT/JP2017/035069 patent/WO2018062323A1/en not_active Ceased
- 2017-09-27 EP EP17856272.4A patent/EP3520688A4/en not_active Withdrawn
- 2017-09-27 US US16/335,068 patent/US11607177B2/en active Active
Also Published As
| Publication number | Publication date |
|---|---|
| JP6820706B2 (en) | 2021-01-27 |
| JP2018050812A (en) | 2018-04-05 |
| CN109788915A (en) | 2019-05-21 |
| US20190274629A1 (en) | 2019-09-12 |
| US11607177B2 (en) | 2023-03-21 |
| EP3520688A4 (en) | 2020-06-03 |
| CN109788915B (en) | 2022-05-27 |
| WO2018062323A1 (en) | 2018-04-05 |
Similar Documents
| Publication | Publication Date | Title |
|---|---|---|
| US10201286B2 (en) | Frequency domain projection algorithm | |
| CN105380630B (en) | heart rate path optimizer | |
| JP3605216B2 (en) | Pulse meter | |
| US20160196175A1 (en) | Information processing system, information processing method, and program | |
| CN109788920B (en) | Information processing apparatus, information processing method, and program | |
| EP4032468A1 (en) | Apparatus and method for estimating blood pressure | |
| JPH11276448A (en) | Signal extraction device and signal extraction method | |
| EP3485807A1 (en) | Measurement device, measurement method, and measurement program | |
| US20170258405A1 (en) | Measurement device and measurement method | |
| JP2018166883A (en) | Pulse measuring device, pulse measuring method, and program | |
| EP3520688A1 (en) | Electronic device, control method, and program | |
| US20170319084A1 (en) | Measuring apparatus and measuring method | |
| JP5488135B2 (en) | Biological information processing device | |
| US20170127955A1 (en) | Measurement apparatus and measurement method | |
| KR20180042700A (en) | Apparatus and method for monitoring stability of spectrum | |
| JP2015139516A (en) | Biological information measuring device | |
| JP5381586B2 (en) | Blood vessel state estimation device, blood vessel state estimation method, and blood vessel state estimation program | |
| US20170319081A1 (en) | Electronic device and control method | |
| JP6730899B2 (en) | Electronic device, control method, and program | |
| US20170112393A1 (en) | Measurement apparatus and measurement method | |
| US11832972B2 (en) | Biological analysis device, biological analysis method, and program | |
| JP4497979B2 (en) | Blood flow velocity measuring device and blood flow velocity measuring method | |
| JP7069598B2 (en) | Bioanalyzers, bioanalysis methods and programs | |
| KR102422021B1 (en) | Photo detector selection apparatus and method, scattering coefficient measurement apparatus and method | |
| JP7010002B2 (en) | Pulse wave analyzer, pulse wave analysis method and program |
Legal Events
| Date | Code | Title | Description |
|---|---|---|---|
| STAA | Information on the status of an ep patent application or granted ep patent |
Free format text: STATUS: THE INTERNATIONAL PUBLICATION HAS BEEN MADE |
|
| PUAI | Public reference made under article 153(3) epc to a published international application that has entered the european phase |
Free format text: ORIGINAL CODE: 0009012 |
|
| STAA | Information on the status of an ep patent application or granted ep patent |
Free format text: STATUS: REQUEST FOR EXAMINATION WAS MADE |
|
| 17P | Request for examination filed |
Effective date: 20190321 |
|
| AK | Designated contracting states |
Kind code of ref document: A1 Designated state(s): AL AT BE BG CH CY CZ DE DK EE ES FI FR GB GR HR HU IE IS IT LI LT LU LV MC MK MT NL NO PL PT RO RS SE SI SK SM TR |
|
| AX | Request for extension of the european patent |
Extension state: BA ME |
|
| DAV | Request for validation of the european patent (deleted) | ||
| DAX | Request for extension of the european patent (deleted) | ||
| REG | Reference to a national code |
Ref country code: DE Ref legal event code: R079 Free format text: PREVIOUS MAIN CLASS: A61B0005020000 Ipc: A61B0005026000 |
|
| A4 | Supplementary search report drawn up and despatched |
Effective date: 20200508 |
|
| RIC1 | Information provided on ipc code assigned before grant |
Ipc: A61B 5/026 20060101AFI20200501BHEP Ipc: A61B 5/0285 20060101ALN20200501BHEP Ipc: A61B 5/00 20060101ALI20200501BHEP |
|
| P01 | Opt-out of the competence of the unified patent court (upc) registered |
Effective date: 20230505 |
|
| STAA | Information on the status of an ep patent application or granted ep patent |
Free format text: STATUS: EXAMINATION IS IN PROGRESS |
|
| 17Q | First examination report despatched |
Effective date: 20230809 |
|
| GRAP | Despatch of communication of intention to grant a patent |
Free format text: ORIGINAL CODE: EPIDOSNIGR1 |
|
| STAA | Information on the status of an ep patent application or granted ep patent |
Free format text: STATUS: GRANT OF PATENT IS INTENDED |
|
| RIC1 | Information provided on ipc code assigned before grant |
Ipc: A61B 5/0285 20060101ALN20250228BHEP Ipc: A61B 5/00 20060101ALI20250228BHEP Ipc: A61B 5/026 20060101AFI20250228BHEP |
|
| INTG | Intention to grant announced |
Effective date: 20250318 |
|
| STAA | Information on the status of an ep patent application or granted ep patent |
Free format text: STATUS: THE APPLICATION IS DEEMED TO BE WITHDRAWN |
|
| 18D | Application deemed to be withdrawn |
Effective date: 20250719 |