EP3461404A1 - A sensor system and sensing method for use in assessment of circulatory volume - Google Patents
A sensor system and sensing method for use in assessment of circulatory volume Download PDFInfo
- Publication number
- EP3461404A1 EP3461404A1 EP17193449.0A EP17193449A EP3461404A1 EP 3461404 A1 EP3461404 A1 EP 3461404A1 EP 17193449 A EP17193449 A EP 17193449A EP 3461404 A1 EP3461404 A1 EP 3461404A1
- Authority
- EP
- European Patent Office
- Prior art keywords
- ppg
- pulse amplitude
- variation
- derived
- baseline
- Prior art date
- Legal status (The legal status is an assumption and is not a legal conclusion. Google has not performed a legal analysis and makes no representation as to the accuracy of the status listed.)
- Withdrawn
Links
- 238000000034 method Methods 0.000 title claims description 20
- 210000001061 forehead Anatomy 0.000 claims description 40
- 238000012545 processing Methods 0.000 claims description 35
- 238000001914 filtration Methods 0.000 claims description 5
- 238000004590 computer program Methods 0.000 claims description 4
- 238000012986 modification Methods 0.000 abstract description 2
- 230000004048 modification Effects 0.000 abstract description 2
- 238000013186 photoplethysmography Methods 0.000 description 208
- 238000013459 approach Methods 0.000 description 47
- 125000004122 cyclic group Chemical group 0.000 description 14
- 239000012530 fluid Substances 0.000 description 13
- 210000004369 blood Anatomy 0.000 description 12
- 239000008280 blood Substances 0.000 description 12
- 230000035485 pulse pressure Effects 0.000 description 11
- 238000005259 measurement Methods 0.000 description 10
- 230000004872 arterial blood pressure Effects 0.000 description 9
- 230000004043 responsiveness Effects 0.000 description 9
- 230000000694 effects Effects 0.000 description 7
- 230000006872 improvement Effects 0.000 description 7
- 238000009423 ventilation Methods 0.000 description 5
- 238000004458 analytical method Methods 0.000 description 4
- QVGXLLKOCUKJST-UHFFFAOYSA-N atomic oxygen Chemical compound [O] QVGXLLKOCUKJST-UHFFFAOYSA-N 0.000 description 4
- 238000012544 monitoring process Methods 0.000 description 4
- 229910052760 oxygen Inorganic materials 0.000 description 4
- 239000001301 oxygen Substances 0.000 description 4
- 230000036316 preload Effects 0.000 description 4
- 230000008569 process Effects 0.000 description 4
- 239000000654 additive Substances 0.000 description 3
- 230000000996 additive effect Effects 0.000 description 3
- 230000009286 beneficial effect Effects 0.000 description 3
- 238000004364 calculation method Methods 0.000 description 3
- 230000008859 change Effects 0.000 description 3
- 230000007423 decrease Effects 0.000 description 3
- 230000000004 hemodynamic effect Effects 0.000 description 3
- 238000010348 incorporation Methods 0.000 description 3
- 238000005399 mechanical ventilation Methods 0.000 description 3
- 238000001356 surgical procedure Methods 0.000 description 3
- 210000001519 tissue Anatomy 0.000 description 3
- 230000001131 transforming effect Effects 0.000 description 3
- 238000002835 absorbance Methods 0.000 description 2
- 230000004075 alteration Effects 0.000 description 2
- 238000003491 array Methods 0.000 description 2
- 230000000747 cardiac effect Effects 0.000 description 2
- 238000009795 derivation Methods 0.000 description 2
- 230000010412 perfusion Effects 0.000 description 2
- 238000009877 rendering Methods 0.000 description 2
- 238000010561 standard procedure Methods 0.000 description 2
- 230000003068 static effect Effects 0.000 description 2
- 241001535291 Analges Species 0.000 description 1
- 206010009192 Circulatory collapse Diseases 0.000 description 1
- NOQGZXFMHARMLW-UHFFFAOYSA-N Daminozide Chemical compound CN(C)NC(=O)CCC(O)=O NOQGZXFMHARMLW-UHFFFAOYSA-N 0.000 description 1
- 206010016803 Fluid overload Diseases 0.000 description 1
- 206010020919 Hypervolaemia Diseases 0.000 description 1
- 206010021137 Hypovolaemia Diseases 0.000 description 1
- 206010030113 Oedema Diseases 0.000 description 1
- 206010040047 Sepsis Diseases 0.000 description 1
- 230000003321 amplification Effects 0.000 description 1
- 230000008901 benefit Effects 0.000 description 1
- 210000000988 bone and bone Anatomy 0.000 description 1
- 230000002612 cardiopulmonary effect Effects 0.000 description 1
- 210000004351 coronary vessel Anatomy 0.000 description 1
- 238000012937 correction Methods 0.000 description 1
- 230000003247 decreasing effect Effects 0.000 description 1
- 230000001419 dependent effect Effects 0.000 description 1
- 238000010586 diagram Methods 0.000 description 1
- 210000000624 ear auricle Anatomy 0.000 description 1
- 210000000613 ear canal Anatomy 0.000 description 1
- 238000000605 extraction Methods 0.000 description 1
- 238000009499 grossing Methods 0.000 description 1
- 230000003993 interaction Effects 0.000 description 1
- 210000003205 muscle Anatomy 0.000 description 1
- 210000004165 myocardium Anatomy 0.000 description 1
- 210000000492 nasalseptum Anatomy 0.000 description 1
- 210000001331 nose Anatomy 0.000 description 1
- 238000003199 nucleic acid amplification method Methods 0.000 description 1
- 238000005457 optimization Methods 0.000 description 1
- 238000012805 post-processing Methods 0.000 description 1
- 230000002980 postoperative effect Effects 0.000 description 1
- 238000003672 processing method Methods 0.000 description 1
- 238000002106 pulse oximetry Methods 0.000 description 1
- 210000003491 skin Anatomy 0.000 description 1
- 230000002792 vascular Effects 0.000 description 1
- 230000001457 vasomotor Effects 0.000 description 1
- 230000002861 ventricular Effects 0.000 description 1
- 210000000707 wrist Anatomy 0.000 description 1
Images


Classifications
-
- A—HUMAN NECESSITIES
- A61—MEDICAL OR VETERINARY SCIENCE; HYGIENE
- A61B—DIAGNOSIS; SURGERY; IDENTIFICATION
- A61B5/00—Measuring for diagnostic purposes; Identification of persons
- A61B5/02—Detecting, measuring or recording for evaluating the cardiovascular system, e.g. pulse, heart rate, blood pressure or blood flow
- A61B5/026—Measuring blood flow
- A61B5/0261—Measuring blood flow using optical means, e.g. infrared light
-
- A—HUMAN NECESSITIES
- A61—MEDICAL OR VETERINARY SCIENCE; HYGIENE
- A61B—DIAGNOSIS; SURGERY; IDENTIFICATION
- A61B5/00—Measuring for diagnostic purposes; Identification of persons
- A61B5/02—Detecting, measuring or recording for evaluating the cardiovascular system, e.g. pulse, heart rate, blood pressure or blood flow
- A61B5/024—Measuring pulse rate or heart rate
- A61B5/02416—Measuring pulse rate or heart rate using photoplethysmograph signals, e.g. generated by infrared radiation
- A61B5/02427—Details of sensor
- A61B5/02433—Details of sensor for infrared radiation
-
- A—HUMAN NECESSITIES
- A61—MEDICAL OR VETERINARY SCIENCE; HYGIENE
- A61B—DIAGNOSIS; SURGERY; IDENTIFICATION
- A61B5/00—Measuring for diagnostic purposes; Identification of persons
- A61B5/02—Detecting, measuring or recording for evaluating the cardiovascular system, e.g. pulse, heart rate, blood pressure or blood flow
- A61B5/026—Measuring blood flow
- A61B5/029—Measuring blood output from the heart, e.g. minute volume
-
- A—HUMAN NECESSITIES
- A61—MEDICAL OR VETERINARY SCIENCE; HYGIENE
- A61B—DIAGNOSIS; SURGERY; IDENTIFICATION
- A61B5/00—Measuring for diagnostic purposes; Identification of persons
- A61B5/02—Detecting, measuring or recording for evaluating the cardiovascular system, e.g. pulse, heart rate, blood pressure or blood flow
- A61B5/026—Measuring blood flow
- A61B5/0295—Measuring blood flow using plethysmography, i.e. measuring the variations in the volume of a body part as modified by the circulation of blood therethrough, e.g. impedance plethysmography
-
- A—HUMAN NECESSITIES
- A61—MEDICAL OR VETERINARY SCIENCE; HYGIENE
- A61B—DIAGNOSIS; SURGERY; IDENTIFICATION
- A61B5/00—Measuring for diagnostic purposes; Identification of persons
- A61B5/68—Arrangements of detecting, measuring or recording means, e.g. sensors, in relation to patient
- A61B5/6801—Arrangements of detecting, measuring or recording means, e.g. sensors, in relation to patient specially adapted to be attached to or worn on the body surface
- A61B5/6813—Specially adapted to be attached to a specific body part
- A61B5/6814—Head
-
- A—HUMAN NECESSITIES
- A61—MEDICAL OR VETERINARY SCIENCE; HYGIENE
- A61B—DIAGNOSIS; SURGERY; IDENTIFICATION
- A61B5/00—Measuring for diagnostic purposes; Identification of persons
- A61B5/68—Arrangements of detecting, measuring or recording means, e.g. sensors, in relation to patient
- A61B5/6801—Arrangements of detecting, measuring or recording means, e.g. sensors, in relation to patient specially adapted to be attached to or worn on the body surface
- A61B5/6813—Specially adapted to be attached to a specific body part
- A61B5/6825—Hand
- A61B5/6826—Finger
-
- A—HUMAN NECESSITIES
- A61—MEDICAL OR VETERINARY SCIENCE; HYGIENE
- A61B—DIAGNOSIS; SURGERY; IDENTIFICATION
- A61B5/00—Measuring for diagnostic purposes; Identification of persons
- A61B5/72—Signal processing specially adapted for physiological signals or for diagnostic purposes
- A61B5/7235—Details of waveform analysis
- A61B5/725—Details of waveform analysis using specific filters therefor, e.g. Kalman or adaptive filters
-
- A—HUMAN NECESSITIES
- A61—MEDICAL OR VETERINARY SCIENCE; HYGIENE
- A61B—DIAGNOSIS; SURGERY; IDENTIFICATION
- A61B5/00—Measuring for diagnostic purposes; Identification of persons
- A61B5/72—Signal processing specially adapted for physiological signals or for diagnostic purposes
- A61B5/7271—Specific aspects of physiological measurement analysis
- A61B5/7278—Artificial waveform generation or derivation, e.g. synthesizing signals from measured signals
-
- A—HUMAN NECESSITIES
- A61—MEDICAL OR VETERINARY SCIENCE; HYGIENE
- A61B—DIAGNOSIS; SURGERY; IDENTIFICATION
- A61B5/00—Measuring for diagnostic purposes; Identification of persons
- A61B5/145—Measuring characteristics of blood in vivo, e.g. gas concentration or pH-value ; Measuring characteristics of body fluids or tissues, e.g. interstitial fluid or cerebral tissue
- A61B5/1455—Measuring characteristics of blood in vivo, e.g. gas concentration or pH-value ; Measuring characteristics of body fluids or tissues, e.g. interstitial fluid or cerebral tissue using optical sensors, e.g. spectral photometrical oximeters
- A61B5/14551—Measuring characteristics of blood in vivo, e.g. gas concentration or pH-value ; Measuring characteristics of body fluids or tissues, e.g. interstitial fluid or cerebral tissue using optical sensors, e.g. spectral photometrical oximeters for measuring blood gases
- A61B5/14552—Details of sensors specially adapted therefor
Definitions
- the present invention relates to a sensor system and method for use in assessment of circulatory volume.
- Circulatory volume is the total volume of arterial blood present in the circulatory system, and effectively perfusing tissue in the body, at any given time.
- Optimal circulatory volume status is important for patients in the operating room (OR) and the intensive care unit (ICU).
- Hypovolemia is a state of decreased blood volume and can lead to inadequate oxygen delivery to tissues.
- Hypervolemia is a state of fluid overload in the blood and can induce tissue edema and oxygen delivery alteration.
- Hemodynamic optimization, with the aim of providing optimal circulatory volume, has been shown to be able to improve postoperative outcome and reduce the cost of the surgery.
- Fluid responsiveness has been used as an indirect assessment of volume status. It aims to determine if a patient's cardiac output, and hence hemodynamics, can be improved by giving fluid. Extra fluid loading may cause complications and hence has to be avoided in some situations.
- static indicators and dynamic indicators have been proposed.
- Static indicators include for instance central venous pressure (CVP) and left ventricular end-diastolic area. However, these have been demonstrated to have poor performance for assessing fluid responsiveness.
- CVP central venous pressure
- left ventricular end-diastolic area have been demonstrated to have poor performance for assessing fluid responsiveness.
- Dynamic indicators relying on cardiopulmonary interactions, have been shown to be better predictors for patients undergoing mechanical ventilation.
- Mechanical ventilation induces cyclic changes in the intrathoracic pressure (i.e., the external pressure on the heart muscle).
- the cyclic changes in the intrathoracic pressure can induce cyclic changes in the preload of the heart (the end-diastolic blood volume inside the heart).
- the cyclic changes in the preload can induce cyclic changes in the stroke volume of the heart, which will appear as cyclic changes in the pulse pressure.
- the patient is predicted to be fluid responsive. If the cyclic changes in the intrathoracic pressure do not result in sufficiently strong cyclic changes of the stroke volume, the patient is predicted not to be fluid responsive.
- Measurement of pulse pressure variation is designed to quantify the cyclic changes in the pulse amplitude of a hemodynamic waveform.
- PPV phosphatidylcholine
- PAV pulse amplitude variation
- PPG sensors provide a non-invasive measurement approach, for measuring volumetric changes of a body.
- PPG measured PAV provides a non-invasive surrogate for PPV.
- PPV provides an indication of cyclic changes in the stroke volume of the heart, which in turn indicates the degree to which cyclic changes in the intrathoracic pressure caused by mechanical ventilation are affecting pre-load of the heart. Where the effect on pre-load is great, this indicates fluid responsiveness. The contrary indicates low fluid responsiveness.
- monitoring PAV signal can provide a non-invasive indication of fluid responsiveness.
- a pulse oximeter is a common example of a PPG-based sensor.
- the purpose of pulse oximetry is to monitor the oxygen saturation of a patient's blood. While the purpose of such a sensor is to obtain a measure of blood oxygen saturation, it also detects changes in blood volume in the skin, and thereby performs PPG sensing. By detecting changes in blood volume, a cyclic signal corresponding to the pulse is obtained.
- PPG sensors such as pulse oximeters, are thus commonly used to provide a measure of the pulse rate.
- a PPG sensor contains at least one light source (or emitter) such as LED, and one light sensor.
- the light source (LED) and sensor are placed such that the source (LED) directs light into the skin of the user, which is reflected or transmitted, and detected by the sensor.
- the amount of reflected/transmitted light is determined by, amongst others, the perfusion of blood within the skin.
- the PPG system for example includes a source of red light (red LED), a near-infrared light source (near-infrared LED), and a photodetector diode.
- the sensor is typically configured with the LEDs and photodetector diode directly on the skin of the patient, typically on a digit (finger or toe) or earlobe.
- the light source LEDs
- the light source emit light at different wavelengths, which light is diffused through the vascular bed of the patient's skin and received by the photodetector diode.
- the changing absorbance at each of the wavelengths is measured, allowing the sensor to determine the absorbance due to the pulsing arterial blood alone, excluding venous blood, skin, bone, muscle, and fat for example.
- the resulting PPG signal may then be analyzed.
- the PAV derived from the PPG signal is susceptible to more factors in comparison to the PPV derived from the ABP signal. This is because of the presence of vasomotor tone artefact and other measurement noise. Furthermore, the information contained in the PPG signal that can be used for PPV estimation is not fully exploited.
- Examples in accordance with a first aspect of the invention provide a sensor system, comprising: a PPG sensor; a controller for processing output signals from the PPG sensor, the controller being adapted to derive a modified pulse amplitude variation value by:
- the invention is based on insights of the inventors concerning the utility of PPG baseline variation information in improving the agreement and correlation between measured pulse amplitude variation (PAV) and pulse pressure variation (PPV).
- PAV pulse amplitude variation
- PV pulse pressure variation
- Baseline variation compensation means compensating the PPG sensor output signal for variation in the baseline of the PPG sensor signal. This may mean adjusting the PPG sensor output signal for variation in the PPG baseline.
- this may comprise for instance performing high pass filtering of the PPG sensor signal to filter out the baseline variation from the signal.
- the compensation may comprise deriving a baseline variation of PPG sensor output signal and processing the signal to compensate for the derived baseline variation.
- Compensating for the derived baseline variation may comprise adjusting values of the PPG sensor output signal.
- the compensating may comprise adjusting amplitude values of the PPG sensor output signal based on the derived baseline variation value.
- the compensating may comprise processing the PPG sensor output signal to remove or extract the baseline variation from at least parts of the PPG sensor output signal.
- the controller may generally be adapted to derive a series of pulse amplitude variation values or a series of baseline variation values, derived for instance at successive points in time, for instance one for each ventilation cycle in examples.
- steps or processes described in terms of a single value may be understood as applicable equally to a series of values, or an array of values or to a signal representative of a series of values for instance.
- Linear combination of a series of values may simply comprise adding each value in the series to each corresponding value in the added series, i.e. in the manner of adding two arrays or matrices of values together.
- 'baseline' may be meant the middle or center or base level or median level of a signal, i.e. the level about which a signal oscillates or pulses.
- 'Baseline' is well recognized term in the art and its standard meaning is to be applied for the purposes of this disclosure.
- baseline variation is meant the change in this baseline level of the PPG signal, for instance the change over time.
- the PPG sensor may be a finger or forehead PPG sensor.
- the sensor may be a sensor for measuring PPG at the finger or at the forehead.
- Finger sensors are the most common form of PPG sensor for extended monitoring of patients and are highly convenient. It is generally speculated that forehead-derived PAV may be more robust that finger-derived PAV. However, it may also be more vulnerable to noise.
- the sensor system may make use of readings from two PPG sensors.
- the system may further comprise: a second PPG sensor; and wherein the controller is for processing output signals from the PPG sensor and the second PPG sensor, the controller being further adapted to:
- an output pulse amplitude variation is derived based on a combination of PAV values derived from PPG readings of each of two PPG sensors.
- the PPG sensors are configured to relate signals corresponding to different regions of the body.
- one of the PPG sensors may be a finger PPG sensor and the other may be a forehead PPG sensor.
- forehead-derived PAV may be more robust that finger-derived PAV. This is suggested to arise from the fact that forehead PPG, measured at the cephalic region, may offer more insight into the central circulation. However, the measurement of forehead PPG may suffer from low AC:DC ratio, rendering it potentially more vulnerable to noise than finger derived PPG.
- the controller may be adapted to derive an output pulse amplitude variation as the mean of the modified pulse amplitude variation values for the PPG sensor and the second PPG sensor.
- the controller may be adapted to derive an output pulse amplitude variation as a different type of average of the modified pulse amplitude variation values for the PPG sensor and the second PPG sensor, or for instance a linear combination of the values for the PPG sensor and second PPG sensor.
- the baseline variation compensation applied to the PPG signal may take different forms.
- the baseline variation compensation may comprise performing high-pass filtering. This is a very simple and fast approach to removing the effect of baseline variation from the PPG signal. However, in some cases this may be less than fully accurate or complete in compensating for baseline variation effects. In particular, in certain circumstances, baseline variation can itself exhibit fast alterations, thereby also having high-frequency components.
- the baseline variation compensation may comprise for the each PPG sensor, deriving a baseline variation of the PPG sensor output signal and processing the PPG sensor output signal to compensate for the derived baseline variation.
- Compensating may comprise for instance adjusting values of the PPG sensor output signal.
- the compensating may comprise adjusting amplitude values of the PPG sensor output signal.
- the compensating may comprise processing the PPG sensor output signal to remove or extract the baseline variation from at least parts of the PPG sensor output signal.
- deriving a baseline variation value from the PPG sensor output signal may be based on deriving a variation in pulse maximum value or variation in pulse mean value over time of the PPG.
- pulse maximum value is meant the value of the signal at peaks in pulses of the signal.
- This approach to deriving baseline variation is based on processing in the time domain.
- Known prior art approaches are based on processing in the frequency domain.
- baseline variation may be extracted based on a pulse-wise analysis: examining variation in baseline on a pulse-wise level, rather than in frequency domain in which baselines of multiple pulses are necessarily analyzed together.
- the variation in pulse maximum value may be divided by an average pulse amplitude for the time period considered, to thereby derive a measure of baseline variation value.
- the adjustment step may comprise both the applying baseline variation compensation and the combining a baseline variation of the PPG sensor output signal with the derived pulse amplitude variation value.
- both of these approaches achieves combined improvements in agreement between derived PAV and underlying PPV.
- the combining the derived baseline variation value of the adjustment step may comprise performing a linear combination of the derived baseline variation value with the derived pulse amplitude variation value.
- the linear coefficient for the baseline variation i.e. ⁇
- the linear coefficient for the pulse amplitude variation i.e. ⁇ . This is because the coefficient of the PAV component by itself does not directly quantify the full contribution of PAV, since the BV amplifies the PAV contribution when linearly combined. For this reason, it is preferable that the PAV coefficient is lower than that of the BV linear combination.
- the controller may be adapted to derive a series of PAV values and/or a series of BV values, relating to different time points, for instance each value acquired for each ventilation cycle.
- the controller may be adapted for the or each PPG sensor to apply a median filter to the pulse amplitude variation (PAV) values and/or the baseline variation values from the PPG sensor output signal.
- PAV pulse amplitude variation
- both the PAV and the baseline variation value series' may be applied with a median filter.
- a median filter may be applied to derived modified PAV values.
- the controller may be adapted to apply a median filter to the modified PAV value thereby derived.
- a median filter assists in removing noise from the baseline variation signal or value and/or from the pulse amplitude variation signal or value.
- Examples in accordance with a further aspect of the invention provide a method of deriving a modified pulse amplitude variation, comprising:
- the method may further comprise: measuring a second PPG signal; deriving a second modified pulse amplitude variation value by:
- the baseline variation compensation may comprise for the or each PPG signal, deriving a baseline variation of the PPG signal and processing the PPG signal to compensate for the derived baseline variation.
- Examples in accordance with a further aspect of the invention provide a computer program product comprising computer program code means which is adapted, when run on a computer, to perform any of the methods described above or defined in any claim of the present application.
- the invention provides a sensor system in which output signals of at least one PPG sensor are processed to derive a modified pulse amplitude variation (PAV) value, being modified to take account of a baseline variation of the PPG sensor output signal.
- PAV pulse amplitude variation
- the modified PAV is derived through performing a modification step in which either: a baseline variation of the PPG sensor output is derived and combined with a previously derived PAV, or, a PPG sensor output is first processed to perform baseline variation compensation, in advance of then deriving a PAV from the compensated signal.
- FIG. 1 The basic architecture of an example sensor system 12 in accordance with one or more embodiments of the present invention is shown in block diagram form in Fig. 1 .
- the system 12 comprises a controller 18 being operatively coupled with two photoplethysmogram (PPG) sensors 14a, 14b.
- PPG photoplethysmogram
- the two PPG sensors 14a, 14b are advantageously applied to different parts of the body, for deriving PPG readings at different anatomical locations.
- the PGG sensors in advantageous examples may in use be applied to a patient's finger and forehead.
- the two sensors may be designed for use at different parts of the body.
- the sensors are a finger PPG sensor 14a and a forehead PPG sensor 14b.
- the system may further comprise a display (not shown), the controller 18 being adapted to control the display to show results of the modified PAV calculation.
- the controller may be adapted to control the display to show results in real time.
- the controller is adapted to process output signals of the PPG sensors to derive from each of them modified pulse amplitude variation (PAV) signals.
- PAV signals or values are standardly derived from a PPG sensor signal by determining exhibited variation in the signal amplitude or power of a raw PPG sensor output and either expressing this as a single figure or monitoring its change over time.
- an adjustment step is performed to factor in baseline variation information concerning the PPG signal.
- Baseline modulation or variation has been associated with volume status.
- the baseline variation of the PPG therefore in effect contains or embodies additional physiological information which if utilized in an appropriate way when deriving a measure of PAV can provide a more accurate measure of underlying pulse pressure variation (PPV) for which PAV is a surrogate.
- PV pulse pressure variation
- the inventors have found that the PPG baseline variation information should be incorporated into the PAV determination calculation in different ways depending upon the stage at which it is introduced.
- baseline variation information is to be factored in in advance of initially deriving a PAV value from the PPG signal
- best results are achieved if the baseline variation (BV) information is 'subtractively' incorporated, i.e. a baseline variation is extracted or filtered from the raw PPG sensor signal, or where the PPG sensor signal is otherwise processed to compensate for the baseline variation it exhibits.
- BV baseline variation
- PPG baseline variation information is to be factored in after initial derivation of a PAV value from the PPG signal, best results are achieved if it is 'additively' incorporated, i.e. where the PAV is combined with a derived baseline variation of the PPG.
- the modified PAV derived from the two may be averaged in examples to further improve agreement with PPV.
- Figs. 1-6 illustrate process steps performed by the controller in a set of example system embodiments.
- a controller of a single system may in examples be adapted to perform more than one of the outlined approaches.
- a controller 18 may for instance have a plurality of operating modes, in accordance with each of which the controller is adapted to perform a different one of the outlined processing approaches.
- Fig. 2 shows a first processing approach in accordance with one or more embodiments of the invention.
- a PPG sensor output signal 30 is processed to derive a pulse amplitude variation (PAV) 32 from the PPG signal.
- the PAV may be derived using standard procedures known in the art for deriving a PAV from a PPG signal.
- the PPG sensor output signal 30 is also processed to derive a baseline variation (BV) 36 of the PPG sensor signal.
- BV baseline variation
- a baseline variation can be derived from a PPG sensor output signal using frequency-domain analysis.
- BV baseline modulation
- This measure of baseline variation is derived in the time domain instead of the frequency domain, avoiding the assumption errors which arise when frequency based analysis is used. This approach is not known in the art.
- a baseline variation is derived based on a determination of variation in PPG pulse maxima (or pulse peak value) over time.
- the derived variation is divided by mean pulse amplitude over the time period for which the variation in maxima is calculated. This result has been found to give a very good measure of baseline variation of the PPG signal.
- Both the derived PAV 32 and derived BV 36 are separately processed with a median filter 38 to remove noise.
- the length of the filter may be set to a value between 3 and 7.
- a value of between 3 and 7 represents an advantageous trade-off between latency incurred by the filter and the beneficial smoothing effect of the filter. Too long a filter may lead to an unacceptable delay in processing incurred by the filter.
- a particularly advantageous value for the filter length in respect of this trade-off is five.
- the step of applying the median filter is optional and may be omitted.
- an adjustment step 42 is performed by which the BV information is introduced or incorporated into the PAV measurement.
- the PAV 32 and BV 36 are combined.
- the two values or signals may be additively combined.
- a linear combination 46 is performed of the two signals. This linear combination thereby derives a modified pulse amplitude variation 48 (labelled PAV' in Fig. 2 ) which incorporates baseline variation information.
- the coefficients for PAV and BV may be between 0.50 and 0.60 and between 0.90 and 1.00 respectively where a finger PPG is used.
- the coefficients for the PAV and BV may in advantageous examples be between 0.20 and 0.30 and between 5.00 and 5.20 respectively.
- coefficients for a finger PPG coefficients for the PAV and BV may be 0.53 and 0.94 respectively, and for a forehead PPG, may be 0.22 and 5.10 respectively.
- baseline variation has been known to be associated with volume status.
- additional information regarding volume status is assimilated with the standard PAV measurement.
- noise from the PAV is suppressed by the introduction of an additional parameter.
- Fig. 2 The approach of Fig. 2 has been tested for each of finger and forehead derived PAV, to determine the degree of agreement with PPV (of which PAV provides a proxy measure), and the improvement compared with standard PAV measurement.
- the results are presented in Tables 1 and 2 below.
- Table 1 lists various measures of agreement between standardly derived PAV and PPV and Table 2 shows the corresponding results for the new Modified PAV, derived using the linear combination approach outlined above and presented in Fig. 2 .
- Table 1 Agreement between Standard PAV and PPV Finger Forehead Mean ⁇ SD a of difference between PAV and PPV 3.2% ⁇ 5.1% 12.0% ⁇ 9.1% Correlation coefficients 0.70 0.60 Concordance rate 84% 83% a SD: standard deviation
- Table 2 Agreement between Modified PAV and PPV Finger Forehead Mean ⁇ SD a of difference Between PAV and PPV -0.7% ⁇ 3.0% -0.43% ⁇ 3.2% Correlation coefficients 0.70 0.61 Concordance rate 89% 88% a SD: standard deviation
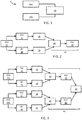
- Fig. 3 shows a second processing approach as may be implemented in examples of the present invention to derive a modified pulse amplitude variation (PAV).
- PAV pulse amplitude variation
- This second approach is based on combining results obtained from PPG sensor output signals derived from two different PPG sensors, being located at different parts of the body. This has been found to improve results.
- the approach of Fig. 3 comprises performing the first processing approach shown in Fig. 2 and described above (comprising linearly combining baseline variation 36 and pulse amplitude variation 32 to derive a modified PAV 48 (labelled PAV')) separately for output signals 30a, 30b of each of two PPG sensors, and then deriving the mean 50 of the two derived modified PAV results. The mean then provides a final output PAV.
- the steps of deriving the linear combination 46 for each of the first 30a and second 30b PPG sensor signals, and then deriving the mean of the resulting modified PAV values 48 constitute the adjustment step 42 of the processing approach.
- the two PPG sensor signals may be signals from a finger and forehead PPG sensor respectively. It is generally understood in the field that forehead-derived PAV values may be more robust and reliable than equivalent finger-derived PAV.
- forehead PPG measured at the cephalic region
- forehead PPG measurement typically experiences low AC/DC ratio, rendering it vulnerable to noise.
- the approach of Fig. 3 in advantageous examples comprises applying the processing method of Fig. 2 to PPG signals derived from each of a finger and forehead PPG and subsequently taking the mean of the respectively derived results.
- the correlation coefficient is significantly improved compared with achieved values for finger and forehead PAV considered separately, and the concordance rate is also improved.
- Fig. 4 shows for illustration sample waveforms for, in (a), an (invasive) arterial blood pressure (ABP) signal, in (b), PPG signal for a finger PPG sensor, and in (c), PPG signal for a forehead PPG sensor.
- ABSP arterial blood pressure
- Waveform (a) shows ABP in the form of pressure (y axis; mmHg, i.e. 133.322 Pascals) vs time (x, axis; seconds).
- Waveform (b) shows a PPG sensor output signal for a finger sensor, in the form of PPG sensor signal (y-axis; nA / mA) vs time (x-axis; seconds).
- Waveform (c) shows a PPG sensor output signal for a forehead sensor, in the form of sensor signal (y-axis; nA / mA) vs time (x-axis; seconds).
- the unit nA/mA is a common unit used for expressing PPG sensor signal. It represents the photo current in the photodiode (the sensor) of the PPG sensor (units nanoAmpere) divided by the LED current (units milliAmpere).
- a PPG sensor contains at least one LED, and one light sensor.
- the LED and sensor are placed such that the LED directs light into the skin of the user, which is reflected or transmitted, and detected by the sensor.
- the amount of reflected/transmitted light is determined by, amongst others, the perfusion of blood within the skin.
- nA/mA represents the current in the light sensor (photodiode) in units of nA divided by the current in the LED in units of mA.
- the variation in the amplitude of the PPG signals (b) and (c) (that is, the variation in the amplitude of pulses in the PPG signals (b) and (c)) over time gives pulse amplitude variation (PAV).
- the results presented in Tables 2 and 3 are illustrated in Fig. 5 , in graphical form.
- the y-axis represents the signal values for each of the results.
- the x-axis represents time, in seconds.
- line 60 shows the result for (invasive) arterial blood pressure (ABP) measured PPV.
- Line 62 shows the result for standard PAV derived from a forehead PPG sensor output.
- Line 64 shows the result for standard PAV derived from a finger PPG sensor output.
- Line 66 shows the modified PAV derived using the method of Fig. 2 , as derived from a finger PPG.
- Line 68 shows the modified PAV derived using the method of Fig. 2 , as derived from a forehead PPG.
- Line 70 shows the modified PAV derived using the method of Fig. 3 in which modified PAV values derived from each of a finger and forehead PPG sensor outputs are averaged (mean is taken) to derive a final modified PAV output.
- Fig. 5 illustrate the results of Table 1.
- Table 1 The results as shown in Fig. 5 illustrate the results of Table 1.
- standard forehead-derived PAV 62 compared to the PPV signal 60.
- standard finger-derived PAV 64 and the PPV signal 60 is also relatively large.
- Figs. 6 shows a third processing approach for deriving a modified PAV.
- This third approach is based on taking account of the PPG sensor output signal baseline variation before determination of the PAV value. This is based on the finding of the inventors that the presence of strong baseline variation can influence the accuracy of the initial computation of PAV. While combining the PPG baseline variation with the derived PAV improves the agreement with ABP PPV, it cannot remedy the initial influence of the BV in the determining the PAV.
- the PPG sensor output 30 is first processed to apply baseline variation compensation 52, before a PAV is then derived.
- the compensating 52 comprises extracting the baseline variation from the PPG sensor output by applying to the PPG sensor output 30 a high-pass filter.
- the high pass filter acts to retain the relatively fast varying PPG signal part, whilst removing the relatively slow varying baseline variation part. This hence suppresses the baseline variation in the PPG sensor output before computing PAV.
- a PAV is then derived from the filtered PPG, the PAV being a modified PAV 48 (labelled PAV'), modified as a consequence of the pre-extraction of the baseline variation from the PPG sensor signal.
- the thus derived modified PAV 48 is then processed with a median filter 38 to remove noise.
- the cut-off frequency for the high pass filtering may set at be 0.4 Hz. Baseline variation in PPG signals can typically be expected to fall below this frequency.
- the adjustment step 42 by which baseline variation information is introduced into the derived PAV comprises just the baseline variation compensation step 52, performed in advance of calculation of the PAV.
- the baseline variation compensation 52 comprises processing pulses of the PPG sensor output signal in the time domain in order to adjust the PPG sensor signal pulses to compensate for the baseline variation.
- Fig. 7 shows a portion of an example PPG sensor output signal.
- Lines 76, 80 show PPG signal amplitudes at two points before compensation, and lines 78, 82 show the same respective PPG signal amplitudes after compensation.
- Inclined lines 86, 80 illustrate the slope in the baseline of the signal PPG between consecutive peaks. It can be seen that this variation in the baseline leads to an error in determination of the amplitude without, in the absence of any applied compensation.
- the compensated pulse amplitude 78, 82 take account of the variation in the baseline, in particular by modifying the PPG sensor signal.
- the pulse compensation approach in more detail comprises the following steps. First, the peaks in the PPG signal are identified. The PPG signal is then compensated by transforming each pulse segment (where one pulse segment is the portion of the PPG signal in-between two consecutive peaks) such that the second peak of each pulse segment is shifted to the same height (level) as the first peak of the pulse segment, while linearly transforming the intermediate signal accordingly, e.g. transforming the intermediate signal such that it follows the same general shape or trend as the previous signal, but adjusted so that the baseline of that signal is level, i.e. so that the intermediate signal portion leads to the shifted-height second peak.
- the approach of Fig. 6 is applied separately to PPG sensor output signals of two PPG sensors.
- these are signals attached to different parts of the body.
- the two sensors are a finger PPG sensor and a forehead PPG sensor.
- Fig. 6 The processing of Fig. 6 is applied to the signal output of each, and the modified PAV 48 results for each then averaged (the mean taken) to derive a final modified PAV result.
- a median filter 38 may be applied to the modified PAV results 48 obtained from each of the two PPG sensor outputs before the mean is taken.
- Fig. 8 illustrates a fifth processing approach.
- the approaches of Fig. 2 and Fig. 6 are combined, so that both additive and subtractive incorporation of baseline variation information is applied.
- a PPG sensor output signal 30 is processed to apply baseline variation compensation 52, as in Fig. 6 .
- the baseline variation compensation may in examples comprise application of a high pass filter or application of pulse compensation, as illustrated in Fig. 7 .
- a first modified PAV 48a (labelled PAV') is then derived from the preprocessed PPG signal.
- the raw (uncompensated) PPG sensor output signal 30 is processed to derive a baseline variation (BV) 36 of the PPG signal in a manner as discussed above in relation to the method of Fig. 2 .
- BV baseline variation
- both the BV 36 and the first modified PAV 48a are processed with a median filter 38 to reduce noise.
- the (median filtered 38) first modified PAV 48a and BV 36 are then linearly combined 46 to derive a final modified PAV 48b.
- the adjustment step may be understood to comprise two parts: a first part 42a in which baseline compensation 52 is applied to the raw PPG sensor output signal 30 and a second part 42b in which the linear combination 46 is performed of the PPG baseline variation 36 and the first modified PAV 48a.
- the approach of Fig. 8 is applied separately to signals derived from output signal of each of two PPG sensors, where preferably these are a finger PPG sensor and a forehead PPG sensor.
- the final modified PAV signals 48b for each of the PPG sensors are then combined in the form of a mean to derive an output pulse amplitude variation value being an average of the two. Taking an average of signals derived from two parts of the body, and most advantageously from the finger and forehead has been shown to improve the agreement of the final derived output PAV compared to equivalent PPV readings.
- example sensor systems in accordance with the present invention may be of particular utility in determining or monitoring or assessing circulatory volume status via fluid responsiveness.
- Improved PAV provides a reliable surrogate for PPV which in turn provides an indirect indication of fluid responsiveness.
- Fluid responsiveness gives an indirect indication of circulatory volume status.
- the system is of use in any scenario in which non-invasive estimation of PPV is required.
- controllers can be implemented in numerous ways, with software and/or hardware, to perform the various functions required.
- a controller is one example of a controller which employs one or more microcontrollers that may be programmed using software (e.g., microcode) to perform the required functions.
- a controller may however be implemented with or without employing a controller, and also may be implemented as a combination of dedicated hardware to perform some functions and a controller (e.g., one or more programmed microcontrollers and associated circuitry) to perform other functions.
- controller components that may be employed in various embodiments of the present disclosure include, but are not limited to, conventional microcontrollers, application specific integrated circuits (ASICs), and field-programmable gate arrays (FPGAs).
- ASICs application specific integrated circuits
- FPGAs field-programmable gate arrays
- a controller or controller may be associated with one or more storage media such as volatile and non-volatile computer memory such as RAM, PROM, EPROM, and EEPROM.
- the storage media may be encoded with one or more programs that, when executed on one or more controllers and/or controllers, perform the required functions.
- Various storage media may be fixed within a controller or controller or may be transportable, such that the one or more programs stored thereon can be loaded into a controller or controller.
Landscapes
- Health & Medical Sciences (AREA)
- Life Sciences & Earth Sciences (AREA)
- Engineering & Computer Science (AREA)
- Physics & Mathematics (AREA)
- Public Health (AREA)
- Surgery (AREA)
- Veterinary Medicine (AREA)
- General Health & Medical Sciences (AREA)
- Animal Behavior & Ethology (AREA)
- Biophysics (AREA)
- Pathology (AREA)
- Biomedical Technology (AREA)
- Heart & Thoracic Surgery (AREA)
- Medical Informatics (AREA)
- Molecular Biology (AREA)
- Physiology (AREA)
- Cardiology (AREA)
- Hematology (AREA)
- Psychiatry (AREA)
- Computer Vision & Pattern Recognition (AREA)
- Artificial Intelligence (AREA)
- Signal Processing (AREA)
- Spectroscopy & Molecular Physics (AREA)
- Optics & Photonics (AREA)
- Measuring Pulse, Heart Rate, Blood Pressure Or Blood Flow (AREA)
Priority Applications (6)
| Application Number | Priority Date | Filing Date | Title |
|---|---|---|---|
| EP17193449.0A EP3461404A1 (en) | 2017-09-27 | 2017-09-27 | A sensor system and sensing method for use in assessment of circulatory volume |
| US16/651,568 US12150744B2 (en) | 2017-09-27 | 2018-09-18 | Sensor system and sensing method for use in assessment of circulatory volume |
| PCT/EP2018/075137 WO2019063349A1 (en) | 2017-09-27 | 2018-09-18 | MEASUREMENT SENSOR SYSTEM AND DETECTION METHOD FOR USE IN EVALUATING THE CIRCULATORY VOLUME |
| JP2020517110A JP7299878B2 (ja) | 2017-09-27 | 2018-09-18 | 循環量の査定で使用するためのセンサシステム及び感知方法 |
| EP18769721.4A EP3687399B1 (en) | 2017-09-27 | 2018-09-18 | A sensor system and sensing method for use in assessment of circulatory volume |
| CN201880069166.5A CN111356404B (zh) | 2017-09-27 | 2018-09-18 | 用于在循环血量的评价中使用的传感器系统和感测方法 |
Applications Claiming Priority (1)
| Application Number | Priority Date | Filing Date | Title |
|---|---|---|---|
| EP17193449.0A EP3461404A1 (en) | 2017-09-27 | 2017-09-27 | A sensor system and sensing method for use in assessment of circulatory volume |
Publications (1)
| Publication Number | Publication Date |
|---|---|
| EP3461404A1 true EP3461404A1 (en) | 2019-04-03 |
Family
ID=60037368
Family Applications (2)
| Application Number | Title | Priority Date | Filing Date |
|---|---|---|---|
| EP17193449.0A Withdrawn EP3461404A1 (en) | 2017-09-27 | 2017-09-27 | A sensor system and sensing method for use in assessment of circulatory volume |
| EP18769721.4A Active EP3687399B1 (en) | 2017-09-27 | 2018-09-18 | A sensor system and sensing method for use in assessment of circulatory volume |
Family Applications After (1)
| Application Number | Title | Priority Date | Filing Date |
|---|---|---|---|
| EP18769721.4A Active EP3687399B1 (en) | 2017-09-27 | 2018-09-18 | A sensor system and sensing method for use in assessment of circulatory volume |
Country Status (5)
| Country | Link |
|---|---|
| US (1) | US12150744B2 (https=) |
| EP (2) | EP3461404A1 (https=) |
| JP (1) | JP7299878B2 (https=) |
| CN (1) | CN111356404B (https=) |
| WO (1) | WO2019063349A1 (https=) |
Families Citing this family (1)
| Publication number | Priority date | Publication date | Assignee | Title |
|---|---|---|---|---|
| WO2020258251A1 (zh) * | 2019-06-28 | 2020-12-30 | 深圳迈瑞生物医疗电子股份有限公司 | 监护设备、设定参考基线的方法和可读存储介质 |
Citations (4)
| Publication number | Priority date | Publication date | Assignee | Title |
|---|---|---|---|---|
| US20140073867A1 (en) * | 2012-09-11 | 2014-03-13 | Nellcor Puritan Bennett Llc | Methods and systems for qualifying a calculated value based on baseline and deviation information |
| US20140323822A1 (en) * | 2013-04-25 | 2014-10-30 | Covidien Lp | System and method for generating an adjusted fluid responsiveness metric |
| WO2014176577A1 (en) * | 2013-04-25 | 2014-10-30 | Covidien Lp | Methods and systems for determining fluid responsiveness in the presence of gain changes and baseline changes |
| US20160073965A1 (en) * | 2014-09-17 | 2016-03-17 | Covidien Lp | Methods and systems for determining fluid responsiveness |
Family Cites Families (15)
| Publication number | Priority date | Publication date | Assignee | Title |
|---|---|---|---|---|
| KR100455286B1 (ko) | 2002-01-11 | 2004-11-06 | 삼성전자주식회사 | 생리신호획득 및 해석을 이용한 동물의 상태 파악 방법 및장치 |
| US9078609B2 (en) * | 2008-10-02 | 2015-07-14 | Nellcor Puritan Bennett Ireland | Extraction of physiological measurements from a photoplethysmograph (PPG) signal |
| US20110270097A1 (en) | 2010-04-28 | 2011-11-03 | Pedro Mateo Riobo Aboy | Method and apparatus for assessment of fluid responsiveness |
| JP5408751B2 (ja) | 2012-03-27 | 2014-02-05 | 国立大学法人東北大学 | 自律神経機能測定装置 |
| US9060745B2 (en) | 2012-08-22 | 2015-06-23 | Covidien Lp | System and method for detecting fluid responsiveness of a patient |
| US9554712B2 (en) * | 2013-02-27 | 2017-01-31 | Covidien Lp | Systems and methods for generating an artificial photoplethysmograph signal |
| US20140316278A1 (en) | 2013-04-23 | 2014-10-23 | Covidien Lp | System and method for scaling a fluid responsiveness metric |
| US20140323874A1 (en) * | 2013-04-25 | 2014-10-30 | Covidien Lp | Systems and methods for determining fluid responsiveness |
| EP3052007A1 (en) * | 2013-10-01 | 2016-08-10 | Koninklijke Philips N.V. | Device, method and system for processing a physiological signal |
| EP3094248B1 (en) * | 2014-01-16 | 2020-05-27 | Nokia Technologies Oy | Method and device for the detection of respiratory rate |
| RU2017125476A (ru) | 2014-12-17 | 2019-01-18 | Конинклейке Филипс Н.В. | Способ и система для оценки восприимчивости к инфузионной терапии с использованием мультимодальных данных |
| EP3087915B1 (en) | 2015-04-27 | 2022-02-09 | Tata Consultancy Services Limited | Method and system for noise cleaning of photoplethysmogram signals for estimating blood pressure |
| WO2017100185A1 (en) | 2015-12-07 | 2017-06-15 | Medici Technologies, LLC | Observational heart failure monitoring system |
| US11045146B2 (en) * | 2016-03-01 | 2021-06-29 | Koninklijke Philips N.V. | Device, system and method for determining a vital sign of a subject |
| CN106175742A (zh) * | 2016-07-19 | 2016-12-07 | 北京心量科技有限公司 | 一种心脏体征获取方法以及装置 |
-
2017
- 2017-09-27 EP EP17193449.0A patent/EP3461404A1/en not_active Withdrawn
-
2018
- 2018-09-18 JP JP2020517110A patent/JP7299878B2/ja active Active
- 2018-09-18 EP EP18769721.4A patent/EP3687399B1/en active Active
- 2018-09-18 WO PCT/EP2018/075137 patent/WO2019063349A1/en not_active Ceased
- 2018-09-18 CN CN201880069166.5A patent/CN111356404B/zh active Active
- 2018-09-18 US US16/651,568 patent/US12150744B2/en active Active
Patent Citations (4)
| Publication number | Priority date | Publication date | Assignee | Title |
|---|---|---|---|---|
| US20140073867A1 (en) * | 2012-09-11 | 2014-03-13 | Nellcor Puritan Bennett Llc | Methods and systems for qualifying a calculated value based on baseline and deviation information |
| US20140323822A1 (en) * | 2013-04-25 | 2014-10-30 | Covidien Lp | System and method for generating an adjusted fluid responsiveness metric |
| WO2014176577A1 (en) * | 2013-04-25 | 2014-10-30 | Covidien Lp | Methods and systems for determining fluid responsiveness in the presence of gain changes and baseline changes |
| US20160073965A1 (en) * | 2014-09-17 | 2016-03-17 | Covidien Lp | Methods and systems for determining fluid responsiveness |
Non-Patent Citations (2)
| Title |
|---|
| LEIER MAIRO ET AL: "Respiration signal extraction from photoplethysmogram using pulse wave amplitude variation", 2014 IEEE INTERNATIONAL CONFERENCE ON COMMUNICATIONS (ICC), IEEE, 10 June 2014 (2014-06-10), pages 3535 - 3540, XP032632483, DOI: 10.1109/ICC.2014.6883869 * |
| SHELLEY KH; JABLONKA DH; AWAD A A.; STOUT RG; REZKANNA H; SILVERMAN DG: "What is the best site for measuring the effect of ventilation on the pulse oximeter", WAVEFORM? ANESTH ANALG., vol. 103, no. 2, 2006, pages 372 - 377 |
Also Published As
| Publication number | Publication date |
|---|---|
| JP2020534912A (ja) | 2020-12-03 |
| CN111356404B (zh) | 2023-05-30 |
| WO2019063349A1 (en) | 2019-04-04 |
| JP7299878B2 (ja) | 2023-06-28 |
| CN111356404A (zh) | 2020-06-30 |
| US12150744B2 (en) | 2024-11-26 |
| US20200260967A1 (en) | 2020-08-20 |
| EP3687399A1 (en) | 2020-08-05 |
| EP3687399B1 (en) | 2023-11-29 |
Similar Documents
| Publication | Publication Date | Title |
|---|---|---|
| US11317821B2 (en) | System and method for generating an adjusted fluid responsiveness metric | |
| EP3117766B1 (en) | Processing biological data | |
| US20140316278A1 (en) | System and method for scaling a fluid responsiveness metric | |
| US11445930B2 (en) | System and method for determining stroke volume of a patient | |
| US11058303B2 (en) | System and method for determining stability of cardiac output | |
| CN107405090B (zh) | 用于测量血压的方法和装置 | |
| US9402573B2 (en) | System and method for detecting fluid responsiveness of a patient | |
| EP2727524B1 (en) | Method and apparatus for measuring cardiac output | |
| US20140066732A1 (en) | System and method for determining cardiac output | |
| EP3687399B1 (en) | A sensor system and sensing method for use in assessment of circulatory volume | |
| JP7570631B2 (ja) | 光電容積脈波を用いた血圧推定方法および血圧推定用コンピュータプログラム | |
| Liu | Automated estimation of blood pressure using PPG recordings: an updated review | |
| WO2021204426A1 (de) | Verfahren und vorrichtung zur bestimmung des volämischen status und des gefässtonus | |
| KR102734192B1 (ko) | 변형된 Fick 방법을 이용한 심박출량 추정법 | |
| Singam et al. | Photoplethysmogram Signal | |
| EP4014837A1 (en) | Method, apparatus and computer program product for analysing a pulse wave signal | |
| WO2025051932A1 (de) | Blutdruckmessverfahren und vorrichtung hierfür | |
| DE102023124287A1 (de) | Blutdruckmessverfahren | |
| CN120731040A (zh) | 用于确定压力脉搏重搏切迹位置的处理器、方法和计算机程序 |
Legal Events
| Date | Code | Title | Description |
|---|---|---|---|
| PUAI | Public reference made under article 153(3) epc to a published international application that has entered the european phase |
Free format text: ORIGINAL CODE: 0009012 |
|
| AK | Designated contracting states |
Kind code of ref document: A1 Designated state(s): AL AT BE BG CH CY CZ DE DK EE ES FI FR GB GR HR HU IE IS IT LI LT LU LV MC MK MT NL NO PL PT RO RS SE SI SK SM TR |
|
| AX | Request for extension of the european patent |
Extension state: BA ME |
|
| STAA | Information on the status of an ep patent application or granted ep patent |
Free format text: STATUS: THE APPLICATION IS DEEMED TO BE WITHDRAWN |
|
| 18D | Application deemed to be withdrawn |
Effective date: 20191005 |