EP3399916B1 - System and method for the visualization and characterization of objects in images - Google Patents
System and method for the visualization and characterization of objects in images Download PDFInfo
- Publication number
- EP3399916B1 EP3399916B1 EP17750690.4A EP17750690A EP3399916B1 EP 3399916 B1 EP3399916 B1 EP 3399916B1 EP 17750690 A EP17750690 A EP 17750690A EP 3399916 B1 EP3399916 B1 EP 3399916B1
- Authority
- EP
- European Patent Office
- Prior art keywords
- image
- color space
- dimensional color
- applying
- values
- Prior art date
- Legal status (The legal status is an assumption and is not a legal conclusion. Google has not performed a legal analysis and makes no representation as to the accuracy of the status listed.)
- Active
Links
Images


Classifications
-
- A—HUMAN NECESSITIES
- A61—MEDICAL OR VETERINARY SCIENCE; HYGIENE
- A61B—DIAGNOSIS; SURGERY; IDENTIFICATION
- A61B5/00—Measuring for diagnostic purposes; Identification of persons
- A61B5/43—Detecting, measuring or recording for evaluating the reproductive systems
- A61B5/4306—Detecting, measuring or recording for evaluating the reproductive systems for evaluating the female reproductive systems, e.g. gynaecological evaluations
- A61B5/4312—Breast evaluation or disorder diagnosis
-
- A—HUMAN NECESSITIES
- A61—MEDICAL OR VETERINARY SCIENCE; HYGIENE
- A61B—DIAGNOSIS; SURGERY; IDENTIFICATION
- A61B6/00—Apparatus or devices for radiation diagnosis; Apparatus or devices for radiation diagnosis combined with radiation therapy equipment
- A61B6/50—Apparatus or devices for radiation diagnosis; Apparatus or devices for radiation diagnosis combined with radiation therapy equipment specially adapted for specific body parts; specially adapted for specific clinical applications
- A61B6/502—Apparatus or devices for radiation diagnosis; Apparatus or devices for radiation diagnosis combined with radiation therapy equipment specially adapted for specific body parts; specially adapted for specific clinical applications for diagnosis of breast, i.e. mammography
-
- A—HUMAN NECESSITIES
- A61—MEDICAL OR VETERINARY SCIENCE; HYGIENE
- A61B—DIAGNOSIS; SURGERY; IDENTIFICATION
- A61B6/00—Apparatus or devices for radiation diagnosis; Apparatus or devices for radiation diagnosis combined with radiation therapy equipment
- A61B6/52—Devices using data or image processing specially adapted for radiation diagnosis
- A61B6/5211—Devices using data or image processing specially adapted for radiation diagnosis involving processing of medical diagnostic data
- A61B6/5217—Devices using data or image processing specially adapted for radiation diagnosis involving processing of medical diagnostic data extracting a diagnostic or physiological parameter from medical diagnostic data
-
- A—HUMAN NECESSITIES
- A61—MEDICAL OR VETERINARY SCIENCE; HYGIENE
- A61B—DIAGNOSIS; SURGERY; IDENTIFICATION
- A61B8/00—Diagnosis using ultrasonic, sonic or infrasonic waves
- A61B8/08—Clinical applications
- A61B8/0825—Clinical applications for diagnosis of the breast, e.g. mammography
-
- A—HUMAN NECESSITIES
- A61—MEDICAL OR VETERINARY SCIENCE; HYGIENE
- A61B—DIAGNOSIS; SURGERY; IDENTIFICATION
- A61B8/00—Diagnosis using ultrasonic, sonic or infrasonic waves
- A61B8/52—Devices using data or image processing specially adapted for diagnosis using ultrasonic, sonic or infrasonic waves
- A61B8/5215—Devices using data or image processing specially adapted for diagnosis using ultrasonic, sonic or infrasonic waves involving processing of medical diagnostic data
- A61B8/5223—Devices using data or image processing specially adapted for diagnosis using ultrasonic, sonic or infrasonic waves involving processing of medical diagnostic data for extracting a diagnostic or physiological parameter from medical diagnostic data
-
- G—PHYSICS
- G06—COMPUTING OR CALCULATING; COUNTING
- G06T—IMAGE DATA PROCESSING OR GENERATION, IN GENERAL
- G06T11/00—Two-dimensional [2D] image generation
- G06T11/10—Texturing; Colouring; Generation of textures or colours
-
- G—PHYSICS
- G06—COMPUTING OR CALCULATING; COUNTING
- G06T—IMAGE DATA PROCESSING OR GENERATION, IN GENERAL
- G06T7/00—Image analysis
- G06T7/0002—Inspection of images, e.g. flaw detection
- G06T7/0012—Biomedical image inspection
-
- G—PHYSICS
- G06—COMPUTING OR CALCULATING; COUNTING
- G06T—IMAGE DATA PROCESSING OR GENERATION, IN GENERAL
- G06T7/00—Image analysis
- G06T7/10—Segmentation; Edge detection
- G06T7/11—Region-based segmentation
-
- G—PHYSICS
- G06—COMPUTING OR CALCULATING; COUNTING
- G06T—IMAGE DATA PROCESSING OR GENERATION, IN GENERAL
- G06T7/00—Image analysis
- G06T7/10—Segmentation; Edge detection
- G06T7/174—Segmentation; Edge detection involving the use of two or more images
-
- G—PHYSICS
- G06—COMPUTING OR CALCULATING; COUNTING
- G06T—IMAGE DATA PROCESSING OR GENERATION, IN GENERAL
- G06T7/00—Image analysis
- G06T7/40—Analysis of texture
- G06T7/41—Analysis of texture based on statistical description of texture
- G06T7/48—Analysis of texture based on statistical description of texture using fractals
-
- G—PHYSICS
- G06—COMPUTING OR CALCULATING; COUNTING
- G06V—IMAGE OR VIDEO RECOGNITION OR UNDERSTANDING
- G06V10/00—Arrangements for image or video recognition or understanding
- G06V10/40—Extraction of image or video features
- G06V10/46—Descriptors for shape, contour or point-related descriptors, e.g. scale invariant feature transform [SIFT] or bags of words [BoW]; Salient regional features
- G06V10/462—Salient features, e.g. scale invariant feature transforms [SIFT]
-
- G—PHYSICS
- G06—COMPUTING OR CALCULATING; COUNTING
- G06V—IMAGE OR VIDEO RECOGNITION OR UNDERSTANDING
- G06V10/00—Arrangements for image or video recognition or understanding
- G06V10/40—Extraction of image or video features
- G06V10/54—Extraction of image or video features relating to texture
-
- G—PHYSICS
- G06—COMPUTING OR CALCULATING; COUNTING
- G06V—IMAGE OR VIDEO RECOGNITION OR UNDERSTANDING
- G06V10/00—Arrangements for image or video recognition or understanding
- G06V10/40—Extraction of image or video features
- G06V10/56—Extraction of image or video features relating to colour
-
- G—PHYSICS
- G16—INFORMATION AND COMMUNICATION TECHNOLOGY [ICT] SPECIALLY ADAPTED FOR SPECIFIC APPLICATION FIELDS
- G16H—HEALTHCARE INFORMATICS, i.e. INFORMATION AND COMMUNICATION TECHNOLOGY [ICT] SPECIALLY ADAPTED FOR THE HANDLING OR PROCESSING OF MEDICAL OR HEALTHCARE DATA
- G16H50/00—ICT specially adapted for medical diagnosis, medical simulation or medical data mining; ICT specially adapted for detecting, monitoring or modelling epidemics or pandemics
- G16H50/30—ICT specially adapted for medical diagnosis, medical simulation or medical data mining; ICT specially adapted for detecting, monitoring or modelling epidemics or pandemics for calculating health indices; for individual health risk assessment
-
- H—ELECTRICITY
- H04—ELECTRIC COMMUNICATION TECHNIQUE
- H04N—PICTORIAL COMMUNICATION, e.g. TELEVISION
- H04N1/00—Scanning, transmission or reproduction of documents or the like, e.g. facsimile transmission; Details thereof
- H04N1/46—Colour picture communication systems
- H04N1/465—Conversion of monochrome to colour
-
- H—ELECTRICITY
- H04—ELECTRIC COMMUNICATION TECHNIQUE
- H04N—PICTORIAL COMMUNICATION, e.g. TELEVISION
- H04N1/00—Scanning, transmission or reproduction of documents or the like, e.g. facsimile transmission; Details thereof
- H04N1/46—Colour picture communication systems
- H04N1/56—Processing of colour picture signals
- H04N1/60—Colour correction or control
- H04N1/6027—Correction or control of colour gradation or colour contrast
-
- A—HUMAN NECESSITIES
- A61—MEDICAL OR VETERINARY SCIENCE; HYGIENE
- A61B—DIAGNOSIS; SURGERY; IDENTIFICATION
- A61B2503/00—Evaluating a particular growth phase or type of persons or animals
- A61B2503/40—Animals
-
- G—PHYSICS
- G06—COMPUTING OR CALCULATING; COUNTING
- G06T—IMAGE DATA PROCESSING OR GENERATION, IN GENERAL
- G06T2207/00—Indexing scheme for image analysis or image enhancement
- G06T2207/10—Image acquisition modality
- G06T2207/10116—X-ray image
-
- G—PHYSICS
- G06—COMPUTING OR CALCULATING; COUNTING
- G06T—IMAGE DATA PROCESSING OR GENERATION, IN GENERAL
- G06T2207/00—Indexing scheme for image analysis or image enhancement
- G06T2207/30—Subject of image; Context of image processing
- G06T2207/30004—Biomedical image processing
- G06T2207/30016—Brain
-
- G—PHYSICS
- G06—COMPUTING OR CALCULATING; COUNTING
- G06T—IMAGE DATA PROCESSING OR GENERATION, IN GENERAL
- G06T2207/00—Indexing scheme for image analysis or image enhancement
- G06T2207/30—Subject of image; Context of image processing
- G06T2207/30004—Biomedical image processing
- G06T2207/30056—Liver; Hepatic
-
- G—PHYSICS
- G06—COMPUTING OR CALCULATING; COUNTING
- G06T—IMAGE DATA PROCESSING OR GENERATION, IN GENERAL
- G06T2207/00—Indexing scheme for image analysis or image enhancement
- G06T2207/30—Subject of image; Context of image processing
- G06T2207/30004—Biomedical image processing
- G06T2207/30061—Lung
-
- G—PHYSICS
- G06—COMPUTING OR CALCULATING; COUNTING
- G06T—IMAGE DATA PROCESSING OR GENERATION, IN GENERAL
- G06T2207/00—Indexing scheme for image analysis or image enhancement
- G06T2207/30—Subject of image; Context of image processing
- G06T2207/30004—Biomedical image processing
- G06T2207/30068—Mammography; Breast
-
- G—PHYSICS
- G06—COMPUTING OR CALCULATING; COUNTING
- G06T—IMAGE DATA PROCESSING OR GENERATION, IN GENERAL
- G06T2207/00—Indexing scheme for image analysis or image enhancement
- G06T2207/30—Subject of image; Context of image processing
- G06T2207/30004—Biomedical image processing
- G06T2207/30081—Prostate
-
- G—PHYSICS
- G06—COMPUTING OR CALCULATING; COUNTING
- G06T—IMAGE DATA PROCESSING OR GENERATION, IN GENERAL
- G06T2207/00—Indexing scheme for image analysis or image enhancement
- G06T2207/30—Subject of image; Context of image processing
- G06T2207/30004—Biomedical image processing
- G06T2207/30084—Kidney; Renal
-
- G—PHYSICS
- G06—COMPUTING OR CALCULATING; COUNTING
- G06T—IMAGE DATA PROCESSING OR GENERATION, IN GENERAL
- G06T2207/00—Indexing scheme for image analysis or image enhancement
- G06T2207/30—Subject of image; Context of image processing
- G06T2207/30004—Biomedical image processing
- G06T2207/30096—Tumor; Lesion
-
- G—PHYSICS
- G06—COMPUTING OR CALCULATING; COUNTING
- G06V—IMAGE OR VIDEO RECOGNITION OR UNDERSTANDING
- G06V2201/00—Indexing scheme relating to image or video recognition or understanding
- G06V2201/03—Recognition of patterns in medical or anatomical images
Definitions
- the present invention generally relates to image processing and, more particularly, to a convergence-based system and method for the visualization and characterization of objects in images.
- US 2010/266179 A1 discloses a system and method for the analysis and visualization of normal and abnormal tissues, objects and structures in digital images generated by medical image sources. It utilizes principles of Iterative Transformational Divergence in which objects in images, when subjected to special transformations, will exhibit radically different responses based on the physical, chemical, or numerical properties of the object or its representation (such as images), combined with machine learning capabilities.
- US 2014/233826 A1 (AGAIAN SOS S [US] ET AL, 2014-08-21 ) discloses systems and methods for detection, grading, scoring and tele-screening of cancerous lesions.
- Various aspects of the disclosure are directed to the detection, grading, prediction and staging of prostate cancer on serial sections/slides of prostate core images, or biopsy images.
- Robin N Strickland "Image-processing techniques for tumor detection”, Image-Processing Techniques for Tumor Detection, (2002-04-24), pages 154-155 , teaches the use of sigmoidal enhancement functions for tumor detection.
- FIG. 1a - 11h systems, devices and methods, generally designated, in accordance with exemplary embodiments of the present invention.
- CAD computer aided detection
- CAD methodologies do not improve visualization and characterization of objects in the processed image as an aid to the radiologist to visually confirm the extent of the abnormalities or distinguish characteristics of abnormalities from normal tissue. Instead, CAD approaches simply place a location marker within an original mammogram image. This further provides a dilemma for a radiologist in that no additional discriminating visual information is available to assess the validity of the marker. Using CAD methodologies, the radiologist must not only assess the original image for the presence of cancer or other abnormalities, but also assess the validity of a given marker, while being aware of the very high false positive rate associated with the CAD process. Similar deficiencies exist in a broad spectrum of fields that use CAD methodologies or image segmentation algorithmic approaches.
- Mammography is the use of X-ray radiographs to generate an image of a person's breast to detect the possible presence of breast cancer or other abnormalities. While the use of mammograms is currently the best methodology available for screening to detect breast cancer, between 10% and 30% of women with cancer are reported as negative (i.e., cancer free). This may be due in part to the very complex, and often very subtle nature of detecting cancer in mammographic images, and is especially a serious issue for women with dense breast tissue who have a higher potential of getting breast cancer. Cancer in mammograms appears white, yet the breast contains non-cancerous elements that also appear white (e.g., dense breast tissue) and dark (e.g., fatty breast tissue).
- white e.g., dense breast tissue
- dark e.g., fatty breast tissue
- Radiologists more easily observe cancers in fatty tissue, yet cancers occurring in dense breast tissue are very difficult to distinguish from surrounding tissue. Almost 40% of women have breasts that contain at least a portion of dense tissue; consequently, there is a significant need to be able to distinguish cancerous lesions regardless of the level or relative amount of density in a woman's breast tissue.
- a radiologist determines that breast cancer may be present in a mammogram several possible follow-up procedures may be employed. These may include the use of ultrasound, MRI with contrast, breast CT scans, and biopsies. These follow-up procedures are expensive, are frequently emotionally traumatic to the patient and their family and, in some instances, can cause physical trauma.
- the positive predictive value of ultrasound when indicating the need for a biopsy, is only 9%. Clinically, 91% of patients who have biopsies following ultrasound are confirmed by pathology as not having cancer. Similarly, 60% of patients having an MRI and going on to biopsy do not have cancer.
- positive predictive values refer to the probability that subjects with a positive screening test have the disease.
- negative predictive value refers to the probability that subjects with a negative screening test do not have the disease.
- Ultrasound patients who have indications of possible disease in a mammogram may be sent to have an ultrasound or have an MRI exam with contrast.
- ultrasound is performed and a radiologist determines from the ultrasound image that a cancer might be present, a biopsy is often recommended. Of those patients that had a follow-up biopsy, based on an ultrasound, 91% did not have cancer.
- Breast cancer can develop from normal tissues in one or more different progressions of change. Abnormal tissue development may progress from being normal to Hyperplasia to Atypical Hyperplasia to ductal carcinoma in situ (DCIS) to invasive DCIS. Tissues can evolve from being normal to being an invasive carcinoma with no intervening steps. Once the tumor has grown beyond the duct, it is called an invasive carcinoma.
- DCIS ductal carcinoma in situ
- breast cancer As well as other diseases and abnormalities, has diffuse boundaries. The cancer is most often amorphous and multi-patterned. Tissues may also be in a variety of transition states. A lesion may have cells that are in the Atypical Hyperplasia state as well as being Ductal Carcinoma in situ, and becoming invasive. Additionally, both normal and abnormal breast conditions may include or be affected by:
- radiographic findings related to breast cancer generally involve identifying the presence of two different types of structures, masses and microcalcifications.
- Microcalcifications related to pathology generally occur in ducts and in association with neoplasms.
- Masses most often correlated with abnormalities and can either be benign or cancerous. Fibroglandular tissues within the breast can obscure masses, making detection difficult in unprocessed images.
- mammography two mammographic views are generally created for each breast (cranial/caudal CC and medial lateral oblique MLO) to assure that all breast parenchyma are included in the views. This further complicates the task of cancer detection and quantification in that it is hard to correlate the presence and dimensionality of structures between the two different views.
- Binary processes are typically designed to look for specific diseases, but do not address other diagnostically important features in mammographic or other medical images such as architectural distortions of the breast, degree of asymmetry between breasts, nipple retractions, dilated ducts, and skin lesions. While not being cancerous, these features are still of importance to the clinician and their patients. While segmentation and bifurcating divergence algorithmic approaches focus on cancer, they are not designed to address the overall structures of all tissues in the image.
- segmentation techniques often use analysis of gray level increments in pixels, to define the boundaries of a possible lesion.
- Other techniques use probabilistic interpolation of pixel data but the interpolation method is limited again by the extreme similarities between lesions and dense tissue.
- ⁇ processing methodologies designed to improve visualization and maintain context of all tissues by differentially and predictably visualizing and characterizing all structures and features within the context of a given image.
- These embodiments employ a process of iterative sequencing of image processing functions that cause the local micro-contrast patterns associated with each material type to coalesce (or converge) and consistently be expressed as distinctive characteristic patterns within the resulting processed image.
- these embodiments provide an approach for the characterization of all tissue types within the context of the rest of the tissues, rather than attempting to extract or remove identified tissue types outside the context of the rest of the tissues.
- Figure 1a shows one embodiment of the local micro-contrast convergence algorithmic sequence pathway approach.
- An original image 101 e.g., a grayscale image 101
- the image 101 is then processed by an image processing function 102 which either becomes the resultant image 103 or is further processed by applying a second, but different image processing function at function 102.
- the repeating process 104 may be applied from 0 to n times.
- cancer exhibit such self-similarity in its growth, and that growth can be characterized and visualized at any scale utilizing the local micro-contrast process where very small cancerous lesions exhibit the same expressed patterns as large lesions.
- fractal geometry can generate patterns of nature through the iteration of mathematical functions
- the approach exemplified in this set of embodiments mathematically decomposes the fractal patterns generated in biological systems into identifiable and measurable expressions of pixel data within an image. Consequently, the local micro-contrast convergence algorithms described herein can be mathematically parallel to an iterative process, and can visualize tissue patterns such as breast boundaries, cancerous and benign lesion margins and cores, and characteristics of breast asymmetry that can be present in mammographic images.
- local micro-contrast convergence refers to an iterative sequencing of image transformations utilizing profile look-up table (PLUT) functions.
- the PLUT functions refers to mathematical expressions in a matrix/array that specifies image input and output values of an image so that localized, self-similar image contrast pixel variables (such as statistically-based co-occurrence of pixel neighborhood relationships - textures for example) in the source image, have a discrete sets of values (called reconstruction levels) where the pixels in each local neighborhood (e.g., pixels having similar characteristics) in the source image are assigned a single color or luminance value in a resulting output image.
- reconstruction levels discrete sets of values
- Singular or iterative applications of PLUT and other functions in the local micro-contrast convergence process can cause relationships among neighboring pixel groups to converge or aggregate into repeatable and predictable color and/or luminosity patterns consistent with the material's structure and relationship to its imaging modality.
- tissue/material types may vary significantly, each tissue/material type possesses common underlying pixel neighborhood relationships.
- the resulting local micro-contrast convergence patterns expressed in each area of the image are capable of visually expressing their characteristic color patterns based on e.g., the statistically-based distribution of luminance values for each object or material, regardless of the presence of surrounding and overlying materials of different types.
- a breast cancer lesion in a mammogram can be characterized with a specific visually-observable and uniquely quantifiable pattern regardless if it is in dark fatty or high luminance dense breast tissue.
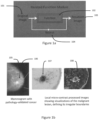
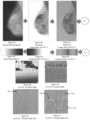
- Figure 1b shows an original mammogram image 105 and two resultant images 107, 108 produced using at least some embodiments of the invention.
- a box outlining the area of cancer is shown at 106.
- Two resultant images are created by two different local micro-contrast convergence algorithmic sequences reveal distinctive patterns of the cancer as shown at 107 and 108.
- the iterative processing sequence transformed the subtle grayscale patterns of the original X-ray of the breast into characteristic pattern responses, such as edges, boundaries, internal structures, textures, spiculations, and luminance values and colors associated with a cancer response.
- Figure 1c illustrates a standard photographic coordinate system used to plot an image transformation using 2 nodal points at 109.
- a nodal point refers to a singular point on a curve where the direction of the curve is altered. Moving any nodal point on a curve alters surrounding aspects of the curve.
- the input values of the original image are indicated along the bottom of the plot (x axis) and the output of the image values are indicated on the vertical axis.
- Nodal points change the shape of the "curve” and modify the relationship between the input values and the output values of an image.
- nodal points must be linked so that all parts of the curve are continuous. Therefore, it is limited to what can be mapped with continuous and linked values. Non-linear transformations utilizing nodal points perform poorly when separation of objects of nearly equal densities is desired.
- the one or more local micro-contrast convergence functions are without nodal points so that an image can be processed to properly define possible external boundaries of a legion (or other feature of interest).
- Figure 1d diagrams the hierarchical approach to the implementation of the local micro-contrast convergence process. The sequence progresses from the bottom of the triangle to the top as it relates to higher levels of processing integration.
- Modality Fusion is supported in the local micro-contrast convergence process.
- Modality Fusion is a process of adapting the input values of images from different types of imaging modalities, so that the same, or slightly modified local micro-contrast convergence algorithmic sequences, can visualize and characterize, the same types of tissues between different imaging modalities.
- a local micro-contrast convergence pattern would then be similar for a patient's cancer when viewed in an X-ray, ultra-sound, breast CT, and MRI scan. This allows for combining information from different input modalities in a principled way.
- the imaging-based fusion approach facilitates early fusion, in which signals are integrated at the image feature level, and late fusion, in which information is integrated at the semantic level using post-processing image feature analytic tools.
- These data can be used to generate one or more probability distribution functions correlated to localized response patterns at one or more vector coordinates to characterize materials such as normal, benign, and cancerous breast-tissue-types and correlate that data from a multiplicity of X-ray, MRI, or ultrasound images, even when the tissues/materials are overlaid with other tissue/material types.
- the Multi-processing Sequencing, Multi-image Synthesis, and Modality Fusion the resultant images can be analyzed, and data correlated among those images within an Expert System. Since all tissues are visualized in the local micro-contrast convergence process, diseases can both be detected and their pathology correlated to their occurrence within the organ of origin. This provides opportunities for advanced research in disease prevention and drug/treatment therapies.
- At least some embodiments of the invention described herein are capable of consistently characterizing tissue/material types in images where other mathematical models, built on purely deterministic, or deterministic with simple random components fail, due to the complex stochastic non-Euclidean fractal-like shapes involving patterns of growth/development represented in images of natural processes like those in medicine.
- the methods are designed specifically to be able to identify structures within structures.
- the finalized images provide visual evidence as to the presence and structure of abnormal tissues in the context of the remaining structure in the image.
- the finalized images may also provide a mechanism to correlate abnormal objects to other normal and abnormal tissue types. For example, a cancerous lesion that is in a milk duct has a different level of concern than a lesion that has become invasive or appears to be associated with a lymph node.
- a carcinoma in proximity to microcalcifications requires a different clinical interpretation as compared to a carcinoma next to the chest wall or in situations where there is significant asymmetry in the breast.
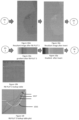
- Figure 1e An example of an iterative image process is illustrated in Figure 1e .
- Figure 1e illustrates an exemplary fundamental sequencing of the local micro-contrast convergence process whereby an Iterated Function Module 110 approach takes a first image 111 and processes it with a first set of one or more non-linear transfer functions 112 (e.g., local micro-contrast convergence algorithm).
- the second image created either becomes the final resultant image 120 or, if a next processing step is designed as part of the algorithm, the first iteration image 113 is further processed with a second function 114 (e.g., a second set of one or more non-linear transfer functions) resulting in image 115.
- a second function 114 e.g., a second set of one or more non-linear transfer functions
- the process can be iterated one or more times with different sets of non-linear transfer functions (e.g., a third set of one or more non-linear transfer functions or a fourth set of one or more non-linear transfer functions) applied within a given algorithmic sequence 116 to 119 to output a resultant image 120.
- sets of non-linear transfer functions e.g., a third set of one or more non-linear transfer functions or a fourth set of one or more non-linear transfer functions
- a second Iterated Functional Module can be applied to the same image 111, but applying different functions and number of iterations to reveal different characterizations and relationships among the tissues. Consequently, this Multi-process Sequencing approach can provide two distinct characterizations of the same objects within the same original image.
- two or more of the resultant images can be combined or merged in a Multi-image Synthesis process to create a new resultant image that is a composite of the two resultant images or a composite of one resultant image and the original image.
- This composite image can be further processed or combined with other resultant images.
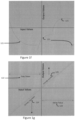
- Figure 1f shows a plot in a coordinate system illustrating a discontinuous non-linear transfer function 121 according to at least one embodiment of the invention.
- Figure 1f illustrates one example of mapping input values of a input image along the x-axis and output values of an output image along the y-axis.
- the graphic plot generated from a PLUT illustrates the potential to design discontinuous transformations to apply to images.
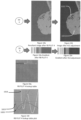
- Figure 1g shows a plot in a coordinate system illustrating luminance values of breast tissue in a mammogram image.
- Figure 1g illustrates one example of mapping input values along the x-axis and output values along the y-axis.
- Fatty tissue representation 122 is indicated in the luminance area of breast images that contain fatty tissue and dense tissue representation 123 indicates the luminance area of breast images that contain dense tissues.
- dense tissue representation 123 indicates the luminance area of breast images that contain dense tissues.
- breast cancer has luminosities much higher than those of fatty tissue. Consequently, it is important to separate fatty tissue from dense tissue. Any remapping of luminosities below the red diagonal line makes that part of an image darker decreasing the density 124, while the those above the line makes the values brighter and increases the density 125.
- the correlation of this image property distribution with discontinuous nonlinear transformations built into the PLUT design reduces time needed for developing new algorithms for new diseases and imaging modalities.
- Figure 2a illustrates one embodiment where multiple mathematical functions can be utilized to create possible PLUT values for multiple image channels to create different iterations of a local micro-contrast convergence algorithms for use in applications with new diseases, modalities, and applications beyond medicine. Utilizing computer-based creation of PLUT sequences can greatly speed the process of developing new algorithmic sequences for visualizing new diseases or anomalies.
- Figure 2a the x and y axis reflect the input and output values of an image while mid-point 126 specifies one possible position of a mid-point for the coordinate system.
- Figure 2a expresses the luminance and color values of an 8-bit image with 256 data points possible for luminance and multiple color channel mapping.
- Three mathematical functions 127 were plotted automatically and their values indicated within the plot.
- the mid-point 126 (or 0 point) can be placed in any position within the coordinate system that best supports the mapping of mathematical functions that can be mapped to a PLUT for optimization of tissue/material visualization and characterization in an automatic, rather than a laborious manual process.
- Figure 2b shows a matrix representing a grayscale 2D look-up table for an 8-bit grayscale image.
- Level 0 representing black is in the upper left corner of the grid at 131.
- Grayscale luminance levels increase stepwise left to right, and top to bottom until pure white level 255 is reached in the lower right hand corner at 132.
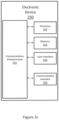
- Figure 2c shows a block diagram that illustrates an electronic device 250 for performing one or more methods according to one or more embodiments of the present invention.
- Electronic device 250 may be any computing device for receiving data from a user or a remote device, processing data, and generating and/or displaying data.
- Electronic device 250 may include communication infrastructure 251, processor 252, memory 253, user interface 254 and communication interface 255.
- Processor 252 may be any type of processor, including but not limited to a special purpose or a general-purpose digital signal processor.
- processor 252 is connected to a communication infrastructure 251 (for example, a bus or network).
- communication infrastructure 251 for example, a bus or network.
- Memory 253 may include at least one of: random access memory (RAM), a hard disk drive and a removable storage drive, such as a floppy disk drive, a magnetic tape drive, or an optical disk drive, etc.
- the removable storage drive reads from and/or writes to a removable storage unit.
- the removable storage unit can be a floppy disk, a magnetic tape, an optical disk, etc., which is read by and written to a removable storage drive.
- Memory 253 may include a computer usable storage medium having stored therein computer software programs and/or data to perform any of the computing functions of electronic device 250.
- Computer software programs also called computer control logic
- Memory 253 may include one or more data stores that store imaging data, software files or any other types of data files.
- User interface 254 may be a program that controls a display (not shown) of electronic device 250.
- User interface 254 may include one or more peripheral user interface components, such as a keyboard or a mouse. The user may use the peripheral user interface components to interact with electronic device 250.
- User interface 254 may receive user inputs, such as mouse inputs or keyboard inputs from the mouse or keyboard user interface components.
- User interface 254 may display imaging data on the display of electronic device 250.
- Communication interface 255 allows imaging data to be transferred between electronic device 250 and remote devices.
- Examples of communication interface 255 may include a modem, a network interface (such as an Ethernet card), a communication port, a Personal Computer Memory Card International Association (PCMCIA) slot and card, etc.
- Imaging data transferred via communication interface 251 are in the form of signals, which may be electronic, electromagnetic, optical, or other signals capable of being transmitted or received by communication interface. These signals are provided to or received from communication interface 251.
- Figure 3a shows a mammogram containing very dense breast with high density outlined at 300.
- the outline at 301 defines the boundary of extreme density containing cancer at 302.
- Figure 3b shows an exemplary mammogram image after processing the image using one or more methods described herein.
- only the highest density areas of the breast are revealed in color.
- Fatty and other low-density areas of the breast image are indicated in black at 303.
- Density increases are indicated in steps proceeding from the outer boundary in green 300 and progressing inward to the blue 302 and finally black area in the center 303 where the greatest development of the cancer exists.
- Each color represents a quantifiably different level of breast density. This quantification provides precise reporting for the American College of Radiology BI-RADS specification to indicate the presence of dense breasts in a woman's mammograms. Additionally, however, this process can extend the BI-RADS reporting system to go beyond a simple overall percentage of the breast density.
- Embodiments of the CI algorithm is designed to optimize the expression of high-density abnormalities in breast tissues by processing original grayscale mammograms and revealing the abnormality's boundaries and internal structures.
- the algorithmic sequence provides significant color and brightness differentiation between the abnormalities and other normal tissues such that it is easier for clinicians and patients to readily observe areas of concern.
- Figure 4k is a flow chart illustrating a method 400 for creating a visualization from a grayscale image, according to at least one embodiment of the invention.
- processor 252 imports a grayscale image.
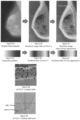
- Figure 4a shows an exemplary grayscale image of a mammogram, according to at least one embodiment of the invention.
- Figure 4d shows a horizontal gradient representation of Figure 4a .
- the gradient grayscale image provides the full range of luminance levels, as compared with the range different mammograms have, so that the full range of colors expressed in the local micro-contrast convergence algorithmic sequence can be illustrated.
- Each step of the algorithmic sequence described in Figure 4k can applied to both the mammograms and the gradients, again, for illustration and comparative purposes.
- a processor 252 receives or imports an image (e.g., grayscale).
- the image is imported from memory 253.
- the image is imported from a remote device via communication interface 251.
- the grayscale image is imported for processing as an input array or matrix with x and y pixel dimensions and z bits of grayscale or color depth.
- the matrix may contain values of 8, 10, 12, 14 or 16 bits of luminance per pixel (Lp).
- Lp is the luminance value of each pixel (p) at a position (x, y) in the original image.
- Lp luminance per pixel
- the greater number of variations in a pixel value also increases. For example, if 8 bits are used, then 2 8 possible pixel values may be assigned to each pixel. On the other hand, if 16 bits are used, then 2 16 possible pixel values may be assigned to each pixel.
- the image processing methods described herein can increase the variations in the final image.
- processor 252 maps the grayscale image to a multi-dimensional color space.
- the grayscale image is replicated into additional matrices of identical x/y coordinates for each color component and luminance value to form an n-dimensional super-positioned matrix space of color space layers, where n> 1 forms a new matrix set containing voxels.
- an RGB multi-dimensional color space can be defined in terms of four different components: luminance, red, green, and blue.
- the RGB multi-dimensional color space includes a luminance color space layer, and first, second and third color space layers corresponding to blue, red and green, respectively.
- the values can also be expressed for other values of n where, for example, n has 3 values - luminance, saturation, and hue.
- each mammogram (or other image) begins with a multi- channel matrix or image. Additional color spaces may also occur in color spaces such as HSV, CMYK, CIEXYZ or CIELAB using either xyz or cylindrical color spaces.
- processor 252 applies a median filter to the multi-dimensional color space.
- a median filter may refer to a nonlinear digital image processing technique, which preserves edges of objects in the multi-dimensional color space while removing noise. Noise reduction can improve the results of later processing.
- the median filter is applied to each pixel in the multi-dimensional color space by replacing each pixel value with the median of neighboring pixel values.
- the pattern of neighbors may be referred to as the "window", which slides, pixel by pixel, over the entire image.
- processor 252 inverts the image whereby black (0) becomes white (255) and white becomes black. All other values are proportionally inverted except the midpoint of the image values.
- processor 252 applies a first set of one or more (e.g., PLUT) non-linear transfer functions to the multi-dimensional color space (e.g., RGB). Representation of the resultant images are shown in Figures 4b and 4e .
- PLUT e.g., PLUT
- Figure 4g shows the color values of the CI PLUT 1 (2D look-up tables) that have been optimized to reveal breast structures in this local micro-contrast convergence algorithmic sequence after being applied to the image in Figure 4a .
- Figure 4i shows a Cartesian plot illustrating a representation of an exemplary (e.g,. PLUT) transfer function applied by the processor 252 to the multi-dimensional color space to attenuate low-density breast tissue according to at least one embodiment of the invention.
- the color space layer input is shown on the x-axis, with values ranging from -128 to +128.
- the corresponding output after the (e.g., PLUT) transfer function is shown on the y-axis, where the midpoint of the luminance levels of an image are at 0 and the values range from - 128 to +128. It can be observed that the 0 position in the coordinate plot may be placed at any position in the x/y coordinate space.
- the red channel is shown at 408, the green channel is 409, and the luminance channel is 410.
- a first (e.g., PLUT) transfer function (as shown in Figure 4i ) is applied to the luminance color space layer to attenuate low-density fatty breast tissue.
- the low density fatty breast tissue has a luminance value in the lower 50% range; the lower 40% range; the lower 30% range; the lower 20% range; or the lower 10% range.
- At least some embodiments of the invention may allow PLUT values to be determined that eliminate the center surround issue affecting perception and detection of cancer in mammograms; based on optimal settings for human vision differentiation based on color perception theory, the image that the clinician is seeing after the transformation provides greatly enhanced diagnosis potential for the tissues being examined.
- processor 252 applies a second set of one or more transfer functions to the multi-dimensional color space.
- Figure 4h shows the color values of the CI PLUT 2 (2D look-up table) that has been optimized to reveal breast structures in this local micro-contrast convergence algorithmic sequence after being applied to the image in Figure 4b .
- Figure 4i shows a Cartesian plot illustrating a representation of an exemplary (e.g,. PLUT) set of transfer functions applied by the processor 252 to the multi-dimensional color space.
- the red channel is indicated at 411 and luminance channel at 412 are graphic representations of CI PLUT 2 lookup table in Figure 4h .
- the color space layer input is shown on the x-axis, with values ranging from -128 to +128.
- the corresponding output after the transfer function is shown on the y-axis, where the midpoint of the luminance levels of an image are at 0 and the values range from -128 to +128.
- the values are applied to the resultant image in Figure 4b to cause fatty breast tissue to appear as one color in Figure 4c (e.g., blue and magenta) and to differentiate the denser breast tissue (gold and red), and breast boundary (green) using other colors.
- Figures 4c and 4f show exemplary image representations of a mammogram and gradient image based on the multi-dimensional color space after applying an exemplary second set of one or more non-linear transfer functions to cause low density breast tissue to appear as one color and differentiate high density breast tissue, according to at least one embodiment of the invention.
- the cancer is revealed in gold 413 and surrounded by black.
- the values of the high-density areas of a breast image measured in RGB values in Figure 4c at 413 are Red>250/Green>165/Blue ⁇ 50.
- the design concept of these transfer functions are employed to attenuate pixel values in areas of a mammogram outside of the breast tissue.
- one component of the transfer function values in the PLUT reduce eyestrain on clinicians in the final image by assigning a value to the areas of the mammogram outside of the breast so as not to interfere with patterns inside the breast area.
- processor 252 displays a visualization image (e.g., Figure 4c ) based on the processed multi-dimensional color space.
- a visualization image e.g., Figure 4c
- Each step of this process further transforms a grayscale mammogram (and it also works for MRI and ultrasound images of the breast) into color patterns that clearly defined boundaries of abnormal tissues as well as reveal structures of normal breast tissue, regardless of size.
- a grayscale mammogram and it also works for MRI and ultrasound images of the breast
- color patterns that clearly defined boundaries of abnormal tissues as well as reveal structures of normal breast tissue, regardless of size.
- cancerous lesions have distinctive patterns that separate themselves from all other abnormal and normal tissue structures.
- CI visualizations differences in the characterization of both cancer and benign lesions in the visualizations can be differentiated using histogram analysis.
- the boundaries of cancer are clearly defined in the CI visualizations.
- differences in structure inside the boundaries of the cancer are indicated with characteristic colors and shapes. This makes it easier for radiologists to identify boundaries of cancerous and benign structures.
- the greater the number of color changes within the boundaries of the cancer the more advanced the development of the cancerous tissue. Changes in tissue surrounding cancerous and benign lesions are also revealed in the CI visualizations. It is possible that the CI visualizations may also reveal angiogenesis occurring at the boundaries of cancerous lesions.
- radial scars vs. cancerous lesions and cancerous lesions vs. fibro adenomas are differentiated.
- the CI visualizations also indicate the presence of developing cancer within milk ducts before it has become invasive and surrounding breast tissue. Cancerous tissues can be correlated with the presence of microcalcifications.
- Cancerous lesions can be correlated between different views of mammograms for a woman such as Cranial-Caudal (CC or view from above) and Mediolateral-oblique (MLO or angled view) and be used to correlate data between studies at different times.
- the internal structure characterized for cancer by these methods is so precise that it can be used to guide surgeons performing biopsies, lumpectomies, and for determining progress for a patient undergoing treatment for cancer.
- Embodiments of the invention regarding the LD algorithm provide visualizations that are designed to emphasize extremely fine structures and details in an image (e.g., original mammogram) that occur in the very low density areas of the image. Diagnostically important structures such as spiculations and low attenuating lesions become clearly defined.
- Figure 5i is a flow chart illustrating a method 500 for creating a LD visualization from a grayscale image, according to at least one embodiment of the invention.
- processor 252 imports a grayscale image.
- Figure 5a shows an exemplary grayscale image of a mammogram, according to at least one embodiment of the invention.
- Figure 5d shows a horizontal gradient representation of 256 grayscale values from black to white.
- processor 252 maps the grayscale image to a multi-dimensional color space.
- the grayscale mapping at step 502 is substantially similar to the grayscale mapping in step 402 above.
- processor 252 applies a first set of one or more transfer functions (e.g., a local micro-contrast convergence algorithm PLUT) to the multi-dimensional color space. Examples of the one or more transfer functions are illustrated in Figures 5g and 5h .
- Figure 5h shows a Cartesian plot illustrating a representation of an exemplary (e.g., PLUT) transfer function applied by the processor 252 according to at least one embodiment of the invention.
- a first transfer functions is applied to the luminance color space layer 508 to brighten low-density areas of the breast image while attenuate high-density breast areas.
- a second transfer function representing a red channel 509, colorizes the breast parenchyma while leaving the dense tissue dark.
- the low density fatty breast tissue has a luminance value in the lower 50% range; the lower 40% range; the lower 30% range; the lower 20% range; or the lower 10% range.
- the design of this local micro-contrast convergence algorithm, and its related PLUT values, function to reveal details in any portion of the image regardless of the percentage of low density in the breast.
- the multi-dimensional color space (represented as color image shown in Figure 5b ) is now converted to an HSL color space.
- RGB values are converted to luminance, hue, and saturation values, as shown below in the following example:
- the image can be displayed first in RGB color or after conversion in HSL color space in step 505.
- the image in Figure 5c (and corresponding image 5f) is created from the image in Figure 5b and 5e by setting the master saturation for all hues in the HSL color space to -100% saturation. As a result, hue is no longer a factor in the expression of the image.
- Luminance values however, are still adjustable and changing the luminance values of various hues in the color space can alter the grayscale representation of those values.
- the red and cyan luminance values are adjusted to 0.2 and 0.1 respectively. This brightens the gray values of the general breast background, highlights the interior portion of dense tissues such as cancerous lesions, and creates separation between the fine structure and the fatty tissue of the breast.
- the image can be converted to a single channel image containing only luminance in step 507 (and shown in Figure 5c ).
- Embodiments of the invention regarding the HD algorithm provide visualizations that are designed to reveal details in an image (e.g., original mammogram) that occur in the very highest density areas of the image. Structures such as breast abnormalities and cancerous lesion are revealed from the surrounding dense bright/white areas and become clearly defined.
- image e.g., original mammogram
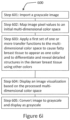
- Figure 6i is a flow chart illustrating a method 600 for creating a HD visualization from a grayscale image, according to at least one embodiment of the invention.
- processor 252 imports a grayscale image.
- Figure 6a shows an exemplary grayscale image of a mammogram, according to at least one embodiment of the invention.
- processor 252 maps the grayscale image to a multi-dimensional color space.
- processor 252 applies a first set of one or more non-linear transfer functions (e.g., HD PLUT 1 local micro-contrast algorithm) to the multi-dimensional color space.
- a first set of one or more non-linear transfer functions e.g., HD PLUT 1 local micro-contrast algorithm
- Figure 6g and 6h respectively.
- Figure 6g shows the color values of the LD PLUT (look-up table) that has been optimized to reveal breast structures in mammographic images.
- Figure 6h show graphic representations in a coordinate system (e.g., that can be created from the PLUTs in Figures 6h ).
- a first transfer function is applied to the luminance color space layer to invert the luminance values 606 of the breast image.
- a red channel 607 amplifies the low-density areas of the image while attenuating high-density breast areas.
- the high-density breast tissue is greater than a lower 50% range; a lower 40% range; a lower 30% range; a lower 20% range; or a lower 10% range.
- the blue channel 609 adds color to define the outer boundary of the breast. The design of this local micro-contrast convergence algorithm, and its related PLUT values, can function to reveal details in any portion of the image regardless of the percentage of high density in the breast.
- areas of the image containing very high density structures 610 are separated from the low-density areas 611 of the breast parenchyma, boundary, and chest wall and cancer is further distinguished from among other high-density areas of the breast.
- visually distinguishable boundaries have been formed based on tissue structures.
- Embodiments of the invention regarding the MC algorithm provide visualizations that are designed to reveal details in an image (e.g., original mammogram) that occur in the very highest density areas of the image, mainly small structures such as calcifications are revealed from the surrounding dense bright/white areas and become clearly defined.
- an image e.g., original mammogram
- Figure 7j is a flow chart illustrating a method 700 for creating a MC visualization from a grayscale image, according to at least one embodiment of the invention.
- processor 252 imports a grayscale image.
- Figure 7a shows an exemplary grayscale image of a mammogram, according to at least one embodiment of the invention.
- processor 252 maps the grayscale image to a multi-dimensional color space.
- processor 252 applies a first set of one or more transfer functions (e.g., MC PLUT 1 local micro-contrast convergence algorithm) to the multi-dimensional color space.
- a transfer function is applied to the luminance space 706, to discontinuously invert the luminance values of the breast image.
- the red channel 707 attenuates a large portion of the image employing a discontinuous mapping of red channel values.
- the green channel 708 values contribute to creating a brown tone to the high-density areas of the breast.
- the blue channel 709 slightly tints the fatty tissue area of the breast.
- micro-calcification structures even in very high density areas of the image, are separated from among other high-density areas of the breast. Compared with the diffuse grayscale mammographic image, visually distinguishable calcifications have been more clearly revealed.
- Figure 7c is an enlarged section of the image in Figure 7b after being converted to grayscale.
- the small black microcalcifications 710 can be distinguished from the light background more easily than in the original image.
- Embodiments of the invention regarding the RF algorithm provide visualizations that are designed to emphasize extremely fine structures and details in an image (e.g., original mammogram). Structures such as spiculations and milk ducts are clearly defined as are structures within high density areas of the rest including those of cancer.
- the relief visualization is shown as an overlay on the original image to improve visibility by a user (e.g., radiologist).
- Figure 8u is a flow chart illustrating a method 800 for creating a RF visualization from a grayscale image, according to at least one embodiment of the invention.
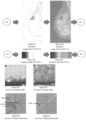
- Figures 8b to 8c to 8l to 8m to 8s illustrate the results obtained by applying multiple local micro-contrast convergence transformations iteratively beginning with an original mammogram at Figure 8a .
- Figures 8e to 8f to 8n to 8o and 8t illustrate the results of the same RF transformational sequence steps as applied to an original gradient grayscale image at 8d.
- Figures 8g, 8h , 8p, and 8q show the color values of the RF PLUT (look-up tables) that have been optimized to reveal breast structures in mammographic images.
- Figures 8i, 8j , 8k and 8r show graphic representations in a coordinate system (e.g., that can be created from the PLUTs in Figures 8g, 8h , 8p, and 8q .
- processor 252 imports a grayscale image.
- Figure 8a shows an exemplary grayscale image of a mammogram, according to at least one embodiment of the invention.
- processor 252 maps the original grayscale image to a multi-dimensional color space.
- processor 252 applies a median filter of radius 1 to the multi-dimensional color space of the original grayscale image.
- processor 252 applies a convolution filter to the multi-dimensional color space of the original image.
- convolution filtering can be used to modify the spatial frequency characteristics of an image.
- the convolution filter 804 is applied to each pixel in the multi-dimensional color space by replacing each pixel value with a weighted average of the pixel value and its neighboring pixel values.
- the pattern of neighboring pixel values is called the "window", which is applied, pixel by pixel, over the entire image.
- the values of the 3x3 convolution filter matrix are shown in Table 1 as follows: Table 1 -4 -1 0 0 1 -1 6 0 1
- processor 252 copies the multi-dimensional color space of the processed image after step 804.
- processor 252 imports a duplicate of the same grayscale original image as utilized at step 801.
- processor 252 maps the duplicate image to a multi-dimensional color space.
- processor 252 applies a first set of one or more transfer functions (e.g., local micro-contrast convergence transfer function RF PLUT 1) to the multi-dimensional color space of the duplicate image.
- a first transfer function e.g., of local micro-contrast convergence function RF PLUT 1 is applied to the luminance color space 814 to elevate darker values of the image and attenuate mid tones.
- a second transfer function (e.g., of local micro-contrast convergence function RF PLUT 2 is applied to the luminance color space 815 to further attenuate mid tones.
- mid tones are attenuated to a minimum at a luminance value of 1 in an image of 8-bit grayscale luminance range (0-255).
- fatty tissue is elevated slightly at a maximum peak level 47 and transformed to 71. As a result, fatty tissue 816 is separated from the dense areas of the breast 817.
- Figures 8i, 8j , 8k and 8r show Cartesian plots illustrating a representation of an exemplary PLUT transfer function (e.g., and generated from PLUTs applied by the processor 252) according to at least one embodiment of the invention.
- exemplary PLUT transfer function e.g., and generated from PLUTs applied by the processor 252
- Figures 8i, 8j , 8k and 8r show Cartesian plots illustrating a representation of an exemplary PLUT transfer function (e.g., and generated from PLUTs applied by the processor 252) according to at least one embodiment of the invention.
- the color spaces, coordinates, and values have been previously described and illustrated in Figure 2a .
- Figure 8b shows an exemplary image of a mammogram based on the multi-dimensional color space after applying the first set of one or more transfer functions to elevate darker values of the image and attenuate mid tones, according to at least one embodiment of the invention.
- Figure 8c shows an exemplary image of a mammogram based on the multi-dimensional color space after applying a second set one or more transfer functions to further attenuate mid tones, according to at least one embodiment of the invention.
- processor 252 applies a third set of one or more transfer functions (e.g., local micro-contrast convergence function RF PLUT 3) to the multi-dimensional color space of the image in Figure 8c to result in image shown in Figure 8l .
- the third transfer function is applied to the luminance color space 818 create a discontinuous invert in the luminance values.
- processor 252 applies a fourth set of one or more transfer functions (e.g., local micro-contrast convergence function RF PLUT 4) to the multi-dimensional color space of the image in Figure 8l to result in image shown in Figure 8m .
- RF PLUT 4 also shown graphically in Figure 8q , is applied to the luminance channel 820 to create an increase in the luminance values of the lower densities of the image and to expand the tonal values associated with cancer and further define the breast boundary.
- processor 252 merges the processed multi-dimensional color space from the image in step 811 (e.g., Figure 8m ) with the copied image from step 805 (e.g., Figure 8a ) by employing a multiply blend.
- the two images are blended with an opacity of 100%.
- the merged image has an emphasis on high frequency structures and attenuation of low frequency information with the highest densities remaining in color.
- the merging function can be utilized to allow mathematical functions to be applied to one or more resultant images that utilize optimal qualities from each of the combining images for a specific purpose. For example, an image expressing the boundaries of cancer tissue in an image may be combined with an image expressing high frequency information. Such a combination can simultaneously show the extent of a cancer as it relates to possible high-frequency structures such as spiculations and calcifications within the tumor.
- Figure 8t shows an exemplary image of a mammogram after, at step 812, merging of the color spaces of the two images from 805 and 811, applying a merging function of 50%, and converting to grayscale at step 813 according to at least one embodiment of the invention.
- an image can be superimposed with additional matrices (layers) that contain either additional images or processing functions such as convert to black and white or incorporate layers generated from previous processing such as from high-pass filtering.
- additional matrices layers that contain either additional images or processing functions such as convert to black and white or incorporate layers generated from previous processing such as from high-pass filtering.
- Additional matrices layers that contain either additional images or processing functions such as convert to black and white or incorporate layers generated from previous processing such as from high-pass filtering.
- Additional matrices layers that contain either additional images or processing functions such as convert to black and white or incorporate layers generated from previous processing such as from high-pass filtering.
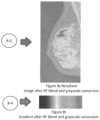
- Embodiments of the invention regarding the GI algorithm provide visualizations that are designed to isolate, visualize, and characterize high-density structures and details in an image (e.g., original mammogram), and display them in a grayscale resultant image. Variations within the dense breast tissue are reflected in the darker areas of the image. Structures such as cancerous and benign lesions are clearly defined as are structures within high density areas.
- the GI visualization is designed to improve visibility of abnormalities by a user (e.g., radiologist).
- Figure 9q is a flow chart illustrating a method 900 for creating a GI visualization from a grayscale image, according to at least one embodiment of the invention.
- Figures 9b to 9c to 9m to 9n illustrate the results obtained by applying multiple local micro-contrast convergence transformations iteratively beginning with an original mammogram at Figure 9a .
- Figures 9e to 9f to 9o to 9p illustrate the results of the same RF transformational sequence steps as applied to an original gradient grayscale image at 9d.
- Figures 9g to 9h to 9k show the color values of the RF PLUT (look-up tables) that have been optimized to reveal breast structures in mammographic images.
- Figures 9i, 9j , and 9l show graphic representations in a coordinate system (e.g., that is created from the PLUTs in Figures 9g, 9h , and 9k respectively).
- FIG. 9a shows an exemplary grayscale image of a mammogram, according to at least one embodiment of the invention.
- processor 252 maps the original grayscale image to a multi-dimensional color space.
- processor 252 applies a first set of one or more transfer functions (e.g., local micro-contrast convergence transfer function GI PLUT 1) to the multi-dimensional color space of the image.
- one or more transfer functions are applied to the luminance color space 912 to non-linearly invert the luminance values of the image (e.g., as can be seen in figures 9g GI PLUT 1 lookup table and graphic representation of the PLUT in Figure 9i ).
- processor 252 applies a second set of one or more transfer functions (e.g., local micro-contrast convergence function Figure 9h GI PLUT 2) to process the multi-dimensional color space image illustrated in Figure 9b .
- a second set of one or more transfer functions e.g., local micro-contrast convergence function Figure 9h GI PLUT 2
- Figure 9c shows an exemplary image of a mammogram based on the multi-dimensional color space after performing step 904 to further isolate high-density areas of the mammogram, according to at least one embodiment of the invention.
- the process performed at step 904 discontinuously alters the luminance channel 913 while adding color to the image with a discontinuous mapping of the red channel 914, and a low value non-linear set of values in the green channel 915.
- the resultant image in Figure 9c shows that the low-density tones are colored orange.
- the red values of the low densities have values between 174 to 175 depending on the distribution in the original image. High density areas are bright, and boundaries of high density areas become dark.
- processor 252 applies a third set of one or more transfer functions (e.g., local micro-contrast convergence function GI PLUT 3) to the multi-dimensional color space of the image in Figure 9c to result in image shown in Figure 9m .
- the red channel 917 of the third set of transfer functions are applied to the color space layers to add distinctive color hues to the breast 919.
- the color image shown in Figure 9m is now converted to an HSL color space in step 904 with RGB values being converted to luminance, hue, and saturation values.
- the image can be displayed first in RGB color or after conversion in HSL color space in step 906.
- the resultant image (e.g., Figure 9n ) can be displayed in step 907 based on the processed multi-dimensional color space.
- the image in Figure 9m is altered in step 908 by setting the saturation for all hues in the HSL color space to -100% saturation. As a result, hue is no longer a factor in the expression of the image.
- step 909 the desaturated HSL color image in Figure 9m is merged (blended) with the original image in Figure 9a employing a darken blend. If the pixels of the processed image are darker than the ones on the original image, they are kept in the image. If the pixels in the processed image are lighter, they are replaced with the tones on the original.
- processor 252 adjusts the opacity so that the blending is altered to 60% of its total effect.
- the blended and then merged image is then converted to a single luminance channel to form a grayscale image as shown in Figure 9n .
- Details in the final image reveal a large cancerous tumor in the upper part of the breast.
- the GI local micro-contrast convergence algorithmic process has revealed the extent of the lesion 920, defined its boundaries, and revealed details within the core of the lesion. Use of other local micro-contrast convergence algorithmic sequences embodied in this document, can then be correlated to the identified area for further analysis and to discriminate between normal high-density tissues, benign, and cancerous lesions.
- Embodiments of the invention regarding the RB algorithm provide visualizations that are designed to isolate and clearly defined boundary and internal structures within high density areas of the breast including those of cancer while the rest of the breast is revealed as a dark gray.
- Figure 10w is a flow chart illustrating a method 1000 for creating a RB visualization from a grayscale image, according to at least one embodiment of the invention.
- Figures 10b to 10c to 10m to 10n to 10s to 10t illustrate the results obtained by applying multiple local micro-contrast convergence transformations iteratively beginning with an original mammogram at Figure 10a .
- Figures 10e to 10f to 10 ⁇ to 10p, to 10u to 10v illustrate the results of the same RB transformational sequence steps as applied to an original gradient grayscale image as shown in Figure 10d .
- Figures 10g, 10h , 10k , and 10q show the color values of the RB PLUT (look-up tables) that have been optimized to reveal breast structures in mammographic images.
- Figures 10i, 10j , 10l , and 10r show graphic representations in a coordinate system (e.g., that is created from the RB PLUTs in Figures 10g to 10h , 10k , and 10q respectively).
- processor 252 imports a grayscale image.
- Figure 10a shows an exemplary grayscale image of a mammogram, according to at least one embodiment of the invention.
- processor 252 maps the original grayscale image to a multi-dimensional color space.
- processor 252 applies a median filter of radius 3 to the multi-dimensional color space of the original grayscale image.
- processor 252 applies a first set of one or more transfer functions (e.g., a local micro-contrast convergence transfer function RB PLUT 1) to the multi-dimensional color space of the duplicate image.
- first set of one or more transfer functions (as shown in Figure 10g and luminance transfer function 1012 of Figure 10i ) is designed to the discontinuously darken the luminance channel 1012 to darken the low- and mid-density areas values of the image as shown in Figures 10b and 10e .
- processor 252 applies a second set of one or more transfer functions (e.g., local micro-contrast convergence function RB PLUT 2) 10h to the multi-dimensional color space.
- transfer functions e.g., local micro-contrast convergence function RB PLUT 2
- Figure 10j transfer functions are applied to the luminance 1013, red 1014, and blue 1015 color space layers.
- Figure 10c shows an exemplary image of a mammogram based on the multi-dimensional color space after applying a second set of one or more transfer functions, according to at least one embodiment of the invention.
- the luminance channel is altered to increase the contrast of the image.
- the red channel discontinuously elevates the dark areas of the image, reduces the highlights, and "flat-lines" the mid tones.
- the blue channel is reduced in value to control tonal values in the color image.
- processor 252 applies a third set of one or more transfer functions (e.g., third local micro-contrast convergence function RB PLUT 3 Figure 10k and plot 10l) to the multi-dimensional color space of the image in Figure 10c to produce the image shown in Figure 10m .
- a transfer function is applied to the luminance channel 1016 to create a discontinuous "flat line" in the low-density areas of the image, attenuates the mid-tones, and slightly reduces the high-density luminance values.
- the red, green, and blue channels 1017 have transfer functions applied that colorize the low-density areas of the breast area.
- other "color" functions of the third set of transfer functions are applied to the color space layers to add uniform color hues to the breast image.
- the colors of the image shown in Figure 10m are inverted to create resultant image in Figures 10n in the mammogram and 10p in the gradient.
- processor 252 applies a fourth set of one or more transfer functions (e.g., fourth local micro-contrast convergence function RB PLUT 4) 10q to the multi-dimensional color space image in Figure 10n to result in the image shown in Figure 10s.
- Figure 10r shows that the luminance values 1018 of the low densities are brought to a maximum 255 level for all luminance values ⁇ 74, another peak for mid-tones and for the brightest areas of the image.
- the red channel 1019 attenuates the low densities while maximizing the high densities with values set at 255 for all luminance values > 160.
- the green channel1020 contributes to the color hues of background and breast tissues.
- the RB PLUT 4 Figure 10q is applied to the luminance color space to differentiate the breast from the outside of its boundary.
- the color image shown in Figure 10s is converted to an HSL color space with RGB values being converted to luminance, hue, and saturation values.
- the image can be displayed first in RGB color or after conversion in HSL color space at step 1010.
- An exemplary HSL color space conversion is as follows:
- the final image in Figure 10t is created from the image in Figure 10s by setting the master saturation for all hues in the HSL color space to -100% saturation. As a result, hue is no longer a factor in the expression of the image. Luminance values however, are still adjustable and changing the luminance values of various hues in the color space can alter the grayscale representation of those values.
- step 1011 the image is converted to a single channel image containing luminance only.
- all areas of non-pathology are revealed in the uniform gray 1021 of the breast image area where the average luminance value may be 130.
- This separation of possible areas of abnormalities 1022 reduces the "dwell time" for a radiologist, that is, the time they must spend investigating all areas of an image to locate the highest probability areas where cancer could occur.
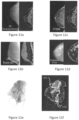
- Figures 11a through 11d illustrate the consistency with which one embodiment of this application performs across different imaging modalities.
- the pattern responses for breast images reveal consistent colors and tissue characterizations for modalities 3D Tomosynthesis in Figure 11a , synthetic 2D from 3D in Figure 11b , Full Field Digital Mammography (FFDM) in Figure 11c , and digitized film in Figure 11d .
- FFDM Full Field Digital Mammography
- This provides a radiologist and their patients the ability to compare changes over time using only one set of algorithms, even when a patient's images were generated historically using different imaging modalities.
- These results verify one of the capabilities inherent in the local micro-contrast convergence approach as indicated in the local micro-contrast convergence hierarch of features identified as Modality Fusion in Figure 1d .
- Figure 11e shows an X-ray view of cancer in an exemplary mammogram image generated from excised breast tissue removed in surgery.
- Figure 11f shows an exemplary mammogram image after processing the image using one or more methods described herein.
- the original image was processed using the CI Algorithm described earlier in this document.
- the black and magenta boundaries of the cancer 1101 are clearly defined, as are the changes in color inside of the boundaries 1102 indicating the extent of cancer development.
- Embodiments of the invention include methods that utilize a multi-algorithmic, multi-dimensional, computer-based process for the visualization and characterization of features, in context, in images. These local micro-contrast convergence methods are applicable in applications where the features are less than 1 mm in size, less than 900 microns in size, less than 850 microns in size, less than 800 microns in size, or less than 750 microns in size.
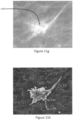
- Figure 11g shows an enlarged view of a mammographic X-ray known to contain cancer 1103.
- Figure 11h shows an exemplary mammogram image after processing the image using one or more of the methods described herein.
- the black boundary of the cancer 1104 using the CI Algorithmic process described earlier in Figures 4a-4k is clearly defined as are details inside of the core of the cancer.
- the progression from yellow, to red to blue within the cancer show a progression cancer development to as small a size in the blue core 1105 being a size of only 980 microns.
- Multiple algorithmic expressions that are embodiments of the invention provide different characterizations and visualizations of the same tissue.
- a feature of interest is located within another feature, where the feature of interest is less than 900 microns in size, less than 850 microns in size, less than 800 microns in size, or less than 750 microns in size and where the first feature is 1 mm in size or larger.
- the feature of interest is between 700 and 900 microns in size.
- structures as small as 750 II. are identified using the above methods. Based on X-ray images where a pixel represents a dimension of breast tissue that is 75 II. in size, cancer cores can be expressed and characterized in sizes from 750 II. to 1 mm. It has been determined, through clinical testing, that structures as small as 500 II. (microns) can be revealed and differentiated in images whose pixel dimensions are 50 II. or smaller. Consequently, cancer of various forms as well as Ductal Carcinoma in situ and precancerous Atypical Hyperplasia have been revealed using these methods.
- one or more of the processing steps performed in one embodiment may be applied in any order and/or to other embodiments, including, but not limited to: gamma level adjustment or leveling, convolution filtering, sharpening filters, smoothing filters, median filters, high-pass filters, low-pass filters, merging functions, image multiplication functions, image subtraction functions, image addition functions, image blending functions, wavelet functions, and image layering functions, among others described herein.
- Imaging modalities e.g., mammogram, x-ray, ultrasound, infra-red, ultra-violet, MRI, CT scans, PET scans, grayscale, color, visible light (e.g., photo microscopy), laser scans
- imaging modalities e.g., mammogram, x-ray, ultrasound, infra-red, ultra-violet, MRI, CT scans, PET scans, grayscale, color, visible light (e.g., photo microscopy), laser scans
- different visualization methodologies e.g., mammogram, x-ray, ultrasound, infra-red, ultra-violet, MRI, CT scans, PET scans, grayscale, color, visible light (e.g., photo microscopy), laser scans
- Embodiments of the invention have applicability to visualizing, characterizing, and detecting several different cancers including, but not limited to: prostate, kidney, liver, bone, lung, brain, and skin of both humans and animals.
- cancers including, but not limited to: prostate, kidney, liver, bone, lung, brain, and skin of both humans and animals.
- embodiments of the invention are not limited to the cancers described herein, but instead are applicable to other similar cancers.
- Embodiments of the invention have applicability to detecting several different diseases including, but not limited to: cardiovascular diseases, detection of Alzheimer's disease in retinal scans, diseases of the eye, multiple sclerosis lesion mapping, photo microscopy.
- cardiovascular diseases detection of Alzheimer's disease in retinal scans
- diseases of the eye multiple sclerosis lesion mapping
- photo microscopy photo microscopy.
- embodiments of the invention are not limited to the diseases described herein, but instead are applicable to other similar diseases.
- the false positive rate for breast cancer detection in a mammogram image, where the breast includes at least a portion of dense breast tissue, over a series of 100 trials is less than 10% as determined by a physician. In some embodiments, the false positive rate for breast cancer detection in a mammogram image, where the breast includes at least a portion of dense breast tissue, over a series of 100 trials, is less than 5% as determined by a physician. In some embodiments, the false positive rate for breast cancer detection in a mammogram image, where the breast includes at least a portion of dense breast tissue, over a series of 100 trials, is less than 1% as determined by a physician.
- the false negative rate for breast cancer detection in a mammogram image, where the breast includes at least a portion of dense breast tissue, over a series of 100 trials is less than 60% as determined by a physician. In some embodiments, the false negative rate for breast cancer detection in a mammogram image, where the breast includes at least a portion of dense breast tissue, over a series of 100 trials, is less than 50% as determined by a physician. In some embodiments, the false negative rate for breast cancer detection in a mammogram image, where the breast includes at least a portion of dense breast tissue, over a series of 100 trials, is less than 45% as determined by a physician.
- the false negative rate for breast cancer detection in a mammogram image, where the breast includes at least a portion of dense breast tissue, over a series of 100 trials is less than 40% as determined by a physician. In some embodiments, the false negative rate for breast cancer detection in a mammogram image, where the breast includes at least a portion of dense breast tissue, over a series of 100 trials, is less than 35% as determined by a physician. In some embodiments, the false negative rate for breast cancer detection in a mammogram image, where the breast includes at least a portion of dense breast tissue, over a series of 100 trials, is less than 30% as determined by a physician.
- the false negative rate for breast cancer detection in a mammogram image, where the breast includes at least a portion of dense breast tissue, over a series of 100 trials is less than 25% as determined by a physician. In some embodiments, the false negative rate for breast cancer detection in a mammogram image, where the breast includes at least a portion of dense breast tissue, over a series of 100 trials, is less than 20% as determined by a physician. In some embodiments, the false negative rate for breast cancer detection in a mammogram image, where the breast includes at least a portion of dense breast tissue, over a series of 100 trials, is less than 15% as determined by a physician.
- the false negative rate for breast cancer detection in a mammogram image, where the breast includes at least a portion of dense breast tissue, over a series of 100 trials is less than 10% as determined by a physician. In some embodiments, the false negative rate for breast cancer detection in a mammogram image, where the breast includes at least a portion of dense breast tissue, over a series of 100 trials, is less than 5% as determined by a physician. In some embodiments, the false negative rate for breast cancer detection in a mammogram image, where the breast includes at least a portion of dense breast tissue, over a series of 100 trials, is less than 4% as determined by a physician.
- the false negative rate for breast cancer detection in a mammogram image, where the breast includes at least a portion of dense breast tissue, over a series of 100 trials is less than 3% as determined by a physician. In some embodiments, the false negative rate for breast cancer detection in a mammogram image, where the breast includes at least a portion of dense breast tissue, over a series of 100 trials, is less than 2% as determined by a physician. In some embodiments, the false negative rate for breast cancer detection in a mammogram image, where the breast includes at least a portion of dense breast tissue, over a series of 100 trials, is less than 1% as determined by a physician.
- the false negative rate for breast cancer detection in a mammogram image, where the breast includes normal breast tissue, over a series of 100 trials is less than 16% as determined by a physician. In some embodiments, the false negative rate for breast cancer detection in a mammogram image, where the breast is normal breast tissue, over a series of 100 trials, is less than 15% as determined by a physician. In some embodiments, the false negative rate for breast cancer detection in a mammogram image, where the breast includes normal breast tissue, over a series of 100 trials, is less than 10% as determined by a physician.
- the false negative rate for breast cancer detection in a mammogram image, where the breast includes normal breast tissue, over a series of 100 trials is less than 5% as determined by a physician. In some embodiments, the false negative rate for breast cancer detection in a mammogram image, where the breast includes normal breast tissue, over a series of 100 trials, is less than 1% as determined by a physician.
- images are generated that visualize and characterize tissue structures in an enhanced manner that improves feature identification (e.g., by radiologists).
- processor 252 may implement one or more computer aided detection (CAD) techniques on one or more generated image visualizations to identify cancerous structures.
- CAD computer aided detection
- Large-scale pattern recognition systems applicable to millions of informational features may include such features first, second, and third order image analysis any may employ image comparisons (e.g., between a known cancerous structure and portions of the image visualizations).
- tissue type in an image such as a mammogram
- characteristics color and grayscale properties that uniquely characterize the tissues and their boundaries, making feature identification and extraction highly effective for accurate identification.
- These properties include, but are not limited to: morphology, geometry, color, texture, relationships among different tissue structures (such as correlating the presence of lesions with microcalcifications in breast tissue), shapes of lesion boundaries, presence of spiculations, edge-gradients, cumulative edge-gradient distributions, architectural distortions, distribution of colors within lesions, contrast, temporal stability (changes between mammographic exams), and correlation of features between different views (multiple view correlation between CC and MLO mammographic image views).
- the Machine Learning process in the breast cancer detection domain begins by extracting features correlated with disease such as benign cysts, fibroadenomas, carcinomas, and invasive cancers.
- a training set of images is used to develop criteria for comparison between cancer and non-cancer areas of a mammogram.
- Relevant features are extracted as clusters of pixel luminance and color values that have resulted in local micro-contrast convergence process tissue characterization patterns from a given coordinate area in each processed image.
- a multiplicity of local micro-contrast convergence processed images can be analyzed and features extracted from each of the separate images that have been created through one or more visualization algorithmic sequences, described herein. All processed images being examined may be superimposed so there is complete registration in areas of interest among the different processed images.
- processor 252 generates one or more non-linear transfer functions to apply to an image to identify a feature of interest.
- processor 252 may run different trials, with a different set of local micro-contrast convergence transfer functions used for each trial.
- the local micro-contrast convergence transfer functions may be generated at random.
- the local micro-contrast convergence transfer functions are generated based on default functions (e.g., trigonometric functions). Examples for generating local micro-contrast convergence transfer functions based on default functions are illustrated in Figure 2a .
- processor 252 may select a preferred set of non-linear transfer functions to apply to an image based on the lowest probability of a false positive and/or false negative.
- Feature analysis may include high separability feature extraction (HSFE) from data, basing on both standard and advanced characteristics of images and time series, including: Co-Occurrences, Gabor, SIFT, LBP, Histograms of Oriented Gradients, Random Ferns and Hough Forests.
- HSFE high separability feature extraction
- Machine learning, data mining, and statistical modeling techniques can be applied for real-time object recognition and localization in the processed images using such processes as Adaboost, genetic programming, support vector machines, neural networks, global optimization, and learning vector quantization.
- one or more computers having one or more processors and memory (e.g., one or more nonvolatile storage devices).
- memory or computer readable storage medium of memory stores programs, modules and data structures, or a subset thereof for a processor to control and run the various systems and methods disclosed herein.
- a non-transitory computer readable storage medium having stored thereon computer-executable instructions which, when executed by a processor, perform one or more of the methods disclosed herein.
Landscapes
- Engineering & Computer Science (AREA)
- Health & Medical Sciences (AREA)
- Life Sciences & Earth Sciences (AREA)
- Physics & Mathematics (AREA)
- Medical Informatics (AREA)
- General Physics & Mathematics (AREA)
- Theoretical Computer Science (AREA)
- General Health & Medical Sciences (AREA)
- Computer Vision & Pattern Recognition (AREA)
- Public Health (AREA)
- Biomedical Technology (AREA)
- Pathology (AREA)
- Nuclear Medicine, Radiotherapy & Molecular Imaging (AREA)
- Radiology & Medical Imaging (AREA)
- Biophysics (AREA)
- Molecular Biology (AREA)
- Surgery (AREA)
- Animal Behavior & Ethology (AREA)
- Heart & Thoracic Surgery (AREA)
- Veterinary Medicine (AREA)
- Multimedia (AREA)
- Optics & Photonics (AREA)
- High Energy & Nuclear Physics (AREA)
- Physiology (AREA)
- Signal Processing (AREA)
- Oral & Maxillofacial Surgery (AREA)
- Dentistry (AREA)
- Quality & Reliability (AREA)
- Probability & Statistics with Applications (AREA)
- Gynecology & Obstetrics (AREA)
- Reproductive Health (AREA)
- Databases & Information Systems (AREA)
- Primary Health Care (AREA)
- Epidemiology (AREA)
- Data Mining & Analysis (AREA)
- Image Processing (AREA)
- Apparatus For Radiation Diagnosis (AREA)
- Ultra Sonic Daignosis Equipment (AREA)
- Nuclear Medicine (AREA)
- Magnetic Resonance Imaging Apparatus (AREA)
Priority Applications (1)
| Application Number | Priority Date | Filing Date | Title |
|---|---|---|---|
| EP23192820.1A EP4273799A3 (en) | 2016-02-08 | 2017-02-08 | System and method for the visualization and characterization of objects in images |
Applications Claiming Priority (2)
| Application Number | Priority Date | Filing Date | Title |
|---|---|---|---|
| US201662292413P | 2016-02-08 | 2016-02-08 | |
| PCT/US2017/016999 WO2017139367A1 (en) | 2016-02-08 | 2017-02-08 | System and method for the visualization and characterization of objects in images |
Related Child Applications (1)
| Application Number | Title | Priority Date | Filing Date |
|---|---|---|---|
| EP23192820.1A Division EP4273799A3 (en) | 2016-02-08 | 2017-02-08 | System and method for the visualization and characterization of objects in images |
Publications (4)
| Publication Number | Publication Date |
|---|---|
| EP3399916A1 EP3399916A1 (en) | 2018-11-14 |
| EP3399916A4 EP3399916A4 (en) | 2019-08-07 |
| EP3399916B1 true EP3399916B1 (en) | 2023-08-23 |
| EP3399916C0 EP3399916C0 (en) | 2023-08-23 |
Family
ID=59564041
Family Applications (2)
| Application Number | Title | Priority Date | Filing Date |
|---|---|---|---|
| EP17750690.4A Active EP3399916B1 (en) | 2016-02-08 | 2017-02-08 | System and method for the visualization and characterization of objects in images |
| EP23192820.1A Pending EP4273799A3 (en) | 2016-02-08 | 2017-02-08 | System and method for the visualization and characterization of objects in images |
Family Applications After (1)
| Application Number | Title | Priority Date | Filing Date |
|---|---|---|---|
| EP23192820.1A Pending EP4273799A3 (en) | 2016-02-08 | 2017-02-08 | System and method for the visualization and characterization of objects in images |
Country Status (8)
| Country | Link |
|---|---|
| US (3) | US10873681B2 (https=) |
| EP (2) | EP3399916B1 (https=) |
| JP (2) | JP7065038B2 (https=) |
| KR (1) | KR20180115725A (https=) |
| CN (1) | CN108882902B (https=) |
| MA (1) | MA43593A (https=) |
| MX (1) | MX2018009566A (https=) |
| WO (1) | WO2017139367A1 (https=) |
Cited By (1)
| Publication number | Priority date | Publication date | Assignee | Title |
|---|---|---|---|---|
| JP7765344B2 (ja) | 2016-02-08 | 2025-11-06 | イマーゴ・システムズ,インコーポレーテッド | 画像中の物体の視覚化および特徴づけのためのシステムおよび方法 |
Families Citing this family (41)
| Publication number | Priority date | Publication date | Assignee | Title |
|---|---|---|---|---|
| WO2007095330A2 (en) | 2006-02-15 | 2007-08-23 | Hologic Inc | Breast biopsy and needle localization using tomosynthesis systems |
| EP2485651B1 (en) | 2009-10-08 | 2020-12-23 | Hologic, Inc. | Needle breast biopsy system |
| CA2829349C (en) | 2011-03-08 | 2021-02-09 | Hologic, Inc. | System and method for dual energy and/or contrast enhanced breast imaging for screening, diagnosis and biopsy |
| JP2014534042A (ja) | 2011-11-27 | 2014-12-18 | ホロジック, インコーポレイテッドHologic, Inc. | マンモグラフィーおよび/またはトモシンセシス画像データを使用して2d画像を生成するためのシステムおよび方法 |
| US9805507B2 (en) | 2012-02-13 | 2017-10-31 | Hologic, Inc | System and method for navigating a tomosynthesis stack using synthesized image data |
| EP2967473B1 (en) | 2013-03-15 | 2020-02-19 | Hologic, Inc. | System and method for navigating a tomosynthesis stack including automatic focusing |
| JP6388347B2 (ja) | 2013-03-15 | 2018-09-12 | ホロジック, インコーポレイテッドHologic, Inc. | 腹臥位におけるトモシンセシス誘導生検 |
| JP6506769B2 (ja) | 2014-02-28 | 2019-04-24 | ホロジック, インコーポレイテッドHologic, Inc. | トモシンセシス画像スラブを生成し表示するためのシステムおよび方法 |
| US11944486B2 (en) * | 2016-06-27 | 2024-04-02 | Taihao Medical Inc. | Analysis method for breast image and electronic apparatus using the same |
| US10430984B2 (en) * | 2016-12-16 | 2019-10-01 | General Electric Company | Fused slice or cine-loop image for multi-mode DBT acquisitions |
| US20180174294A1 (en) * | 2016-12-16 | 2018-06-21 | General Electric Company | Multi-Layer Color Display In Synthetic 2D Images |
| US10187637B2 (en) | 2017-03-07 | 2019-01-22 | Filmic Inc. | Inductive micro-contrast evaluation method |
| CN110621233B (zh) | 2017-03-30 | 2023-12-12 | 豪洛捷公司 | 用于处理乳房组织图像数据的方法 |
| EP3600047A1 (en) | 2017-03-30 | 2020-02-05 | Hologic, Inc. | System and method for hierarchical multi-level feature image synthesis and representation |
| US10789712B2 (en) * | 2017-07-11 | 2020-09-29 | MESC Health Ltd | Method and system for image analysis to detect cancer |
| US11026641B2 (en) * | 2017-10-16 | 2021-06-08 | Mayo Foundation For Medical Education And Research | System and method for tomography-based radiomic mass analysis |
| JP7153261B2 (ja) * | 2017-11-16 | 2022-10-14 | 国立大学法人九州大学 | 画像処理装置および画像処理装置の作動方法並びに画像処理プログラム |
| CN109003248B (zh) * | 2018-07-23 | 2020-12-08 | 中国石油大学(华东) | 一种细粒沉积岩纹层结构的表征方法 |
| WO2020068851A1 (en) * | 2018-09-24 | 2020-04-02 | Hologic, Inc. | Breast mapping and abnormality localization |
| CN110458834B (zh) | 2019-02-25 | 2021-02-09 | 腾讯科技(深圳)有限公司 | 一种乳腺肿瘤图像处理系统、方法及装置 |
| EP3709262A1 (en) * | 2019-03-13 | 2020-09-16 | Koninklijke Philips N.V. | Correlated image analysis for 3d biopsy |
| KR102039138B1 (ko) * | 2019-04-02 | 2019-10-31 | 주식회사 루닛 | 적대적 학습에 기반한 도메인 어댑테이션 방법 및 그 장치 |
| US11209817B2 (en) * | 2019-05-06 | 2021-12-28 | Argo AI, LLC | Method and system for real-time diagnostics and fault monitoring in a robotic system |
| JP7209599B2 (ja) * | 2019-07-29 | 2023-01-20 | 富士フイルム株式会社 | 画像処理装置、方法およびプログラム |
| JP7203705B2 (ja) | 2019-09-17 | 2023-01-13 | 富士フイルム株式会社 | 画像処理装置、方法およびプログラム、並びに画像表示装置、方法およびプログラム |
| CN110751648B (zh) * | 2019-10-29 | 2023-02-28 | 国网黑龙江省电力有限公司电力科学研究院 | 基于图像处理技术的杆塔基础异常检测方法 |
| EP4106635A4 (en) * | 2020-03-02 | 2024-07-31 | Vayyar Imaging Ltd. | IMAGING SYSTEM AND DEVICE FOR DETECTION OF BREAST CANCER |
| CN111583320B (zh) * | 2020-03-17 | 2023-04-07 | 哈尔滨医科大学 | 融合深度卷积网络和影像组学特征的乳腺癌超声图分型方法、系统及存储介质 |
| JP7671776B2 (ja) | 2020-03-27 | 2025-05-02 | ホロジック, インコーポレイテッド | 複数の画像化モダリティにおける関心対象領域を識別するシステム及び方法 |
| US12505645B2 (en) | 2020-03-27 | 2025-12-23 | Hologic, Inc. | Systems and methods for correlating regions of interest in multiple imaging modalities |
| CN112164020B (zh) * | 2020-03-31 | 2024-01-23 | 苏州润迈德医疗科技有限公司 | 精确提取血管中心线的方法、装置、分析系统和存储介质 |
| KR102736798B1 (ko) | 2020-07-20 | 2024-12-03 | 펄스나인 주식회사 | 인공지능을 이용한 편집된 이미지 검출 방법 및 시스템 |
| US11151755B1 (en) * | 2020-07-29 | 2021-10-19 | Adobe Inc. | Image processing for increasing visibility of obscured patterns |
| US20220101518A1 (en) * | 2020-09-25 | 2022-03-31 | GE Precision Healthcare LLC | System and method for stylizing a medical image |
| CN112164012B (zh) * | 2020-10-14 | 2023-05-12 | 上海影卓信息科技有限公司 | 人像彩色浮雕效果的实现方法及系统 |
| JP7746381B2 (ja) * | 2020-11-14 | 2025-09-30 | アルコン インコーポレイティド | 深層学習を使用する生体眼球測定 |
| US12254586B2 (en) | 2021-10-25 | 2025-03-18 | Hologic, Inc. | Auto-focus tool for multimodality image review |
| CN118318247A (zh) | 2021-11-29 | 2024-07-09 | 豪洛捷公司 | 用于将感兴趣的对象相关的系统和方法 |
| US20240104701A1 (en) * | 2022-09-16 | 2024-03-28 | Imago Systems, Inc., | System and method for non-invasive visualization and characterization of lumen structures and flow therewithin |
| WO2024112579A1 (en) * | 2022-11-23 | 2024-05-30 | Subtle Medical, Inc. | Systems and methods for mri contrast synthesis under light-weighted framework |
| CN117315415B (zh) * | 2023-07-13 | 2024-06-11 | 东南大学 | 一种店铺招牌健康性能评估方法与装置 |
Family Cites Families (58)
| Publication number | Priority date | Publication date | Assignee | Title |
|---|---|---|---|---|
| IL106691A (en) | 1993-08-13 | 1998-02-08 | Sophis View Tech Ltd | System and method for diagnosis of living tissue diseases |
| GB9619119D0 (en) * | 1996-09-12 | 1996-10-23 | Discreet Logic Inc | Processing image |
| US5859891A (en) | 1997-03-07 | 1999-01-12 | Hibbard; Lyn | Autosegmentation/autocontouring system and method for use with three-dimensional radiation therapy treatment planning |
| CA2297986A1 (en) * | 1997-08-28 | 1999-03-04 | John E. Rosenstengel | Method and system for automated detection of clustered microcalcifications from digital mammograms |
| US6031935A (en) | 1998-02-12 | 2000-02-29 | Kimmel; Zebadiah M. | Method and apparatus for segmenting images using constant-time deformable contours |
| DE10139708A1 (de) | 2001-08-11 | 2003-02-20 | Philips Corp Intellectual Pty | Vorrichtung und Verfahren zur Verarbeitung von Digitalbildern |
| WO2005036451A1 (en) | 2003-10-08 | 2005-04-21 | Lifespan Biosciences, Inc. | Automated microspcope slide tissue sample mapping and image acquisition |
| US20050078861A1 (en) | 2003-10-10 | 2005-04-14 | Usikov Daniel A. | Tomographic system and method for iteratively processing two-dimensional image data for reconstructing three-dimensional image data |
| JP2005111946A (ja) | 2003-10-10 | 2005-04-28 | Tokukin Kagi Kofun Yugenkoshi | ハーフトーンスクリーンの非線形較正方法 |
| US7574335B1 (en) * | 2004-02-11 | 2009-08-11 | Adobe Systems Incorporated | Modelling piece-wise continuous transfer functions for digital image processing |
| US20060269140A1 (en) | 2005-03-15 | 2006-11-30 | Ramsay Thomas E | System and method for identifying feature of interest in hyperspectral data |
| US7907762B2 (en) | 2004-05-26 | 2011-03-15 | Guardian Technologies International, Inc. | Method of creating a divergence transform for identifying a feature of interest in hyperspectral data |
| WO2005119574A2 (en) | 2004-05-26 | 2005-12-15 | Guardian Technologies International, Inc. | System and method for identifying objects of interest in image data |
| US7840048B2 (en) | 2004-05-26 | 2010-11-23 | Guardian Technologies International, Inc. | System and method for determining whether there is an anomaly in data |
| CA2580795A1 (en) | 2004-09-22 | 2006-04-06 | Tripath Imaging, Inc. | Methods and compositions for evaluating breast cancer prognosis |
| US20060127880A1 (en) | 2004-12-15 | 2006-06-15 | Walter Harris | Computerized image capture of structures of interest within a tissue sample |
| US8045805B2 (en) | 2005-03-15 | 2011-10-25 | Applied Visual Sciences, Inc. | Method for determining whether a feature of interest or an anomaly is present in an image |
| US8538099B2 (en) | 2005-03-23 | 2013-09-17 | General Electric Company | Method and system for controlling image reconstruction |
| US20100266179A1 (en) * | 2005-05-25 | 2010-10-21 | Ramsay Thomas E | System and method for texture visualization and image analysis to differentiate between malignant and benign lesions |
| ATE512421T1 (de) | 2005-11-23 | 2011-06-15 | Cedara Software Corp | Verfahren und system zur verbesserung von digitalen bildern |
| US7768652B2 (en) | 2006-03-16 | 2010-08-03 | Carl Zeiss Meditec, Inc. | Methods for mapping tissue with optical coherence tomography data |
| EP2029020A4 (en) | 2006-06-22 | 2010-04-21 | Wisconsin Alumni Res Found | USE OF STROMA COLLAGEN IN THE DIAGNOSIS AND CHARACTERIZATION OF BREAST CANCER |
| US8897528B2 (en) | 2006-06-26 | 2014-11-25 | General Electric Company | System and method for iterative image reconstruction |
| US8571287B2 (en) | 2006-06-26 | 2013-10-29 | General Electric Company | System and method for iterative image reconstruction |
| CN101496061B (zh) * | 2006-07-31 | 2016-05-04 | 皇家飞利浦电子股份有限公司 | 用于计算交互尺度以修改图像数据集的可视化属性的方法、装置和计算机可读介质 |
| JP2008067296A (ja) | 2006-09-11 | 2008-03-21 | Canon Inc | 画像処理方法及び画像処理装置 |
| US7916912B2 (en) | 2006-09-14 | 2011-03-29 | Siemens Israel Ltd. | Efficient border extraction of image feature |
| US20080085040A1 (en) | 2006-10-05 | 2008-04-10 | General Electric Company | System and method for iterative reconstruction using mask images |
| WO2008157843A1 (en) | 2007-06-21 | 2008-12-24 | Guardian Technologies International Inc. | System and method for the detection, characterization, visualization and classification of objects in image data |
| US7949181B2 (en) | 2007-06-28 | 2011-05-24 | General Electric Company | Segmentation of tissue images using color and texture |
| US8270691B2 (en) | 2007-10-09 | 2012-09-18 | Siemens Aktiengesellschaft | Method for fusing images acquired from a plurality of different image acquiring modalities |
| US8295575B2 (en) | 2007-10-29 | 2012-10-23 | The Trustees of the University of PA. | Computer assisted diagnosis (CAD) of cancer using multi-functional, multi-modal in-vivo magnetic resonance spectroscopy (MRS) and imaging (MRI) |
| CN101919230B (zh) | 2007-12-25 | 2013-02-13 | 梅迪奇视觉-脑科技有限公司 | 降低图像噪声的方法 |
| JP5820117B2 (ja) | 2008-03-06 | 2015-11-24 | コーニンクレッカ フィリップス エヌ ヴェKoninklijke Philips N.V. | データセットを選択式及び対話式に処理する方法 |
| JP5492869B2 (ja) | 2008-04-08 | 2014-05-14 | ナショナル ユニヴァーシティー オブ シンガポール | 網膜画像分析システム及び方法 |
| US8358453B2 (en) | 2008-05-27 | 2013-01-22 | Xerox Corporation | Control based iterative profiling methods |
| US8660330B2 (en) | 2008-06-27 | 2014-02-25 | Wolfram Jarisch | High efficiency computed tomography with optimized recursions |
| JP5478618B2 (ja) | 2008-07-03 | 2014-04-23 | エヌイーシー ラボラトリーズ アメリカ インク | 上皮層検出器およびそれに関連する方法 |
| US8718340B2 (en) | 2008-09-03 | 2014-05-06 | Trustees Of The University Of Pennsylvania | System and method for accurate and rapid identification of diseased regions on biological images with applications to disease diagnosis and prognosis |
| JP2010218271A (ja) | 2009-03-17 | 2010-09-30 | Tokyo Institute Of Technology | パラメータ制御処理装置及び画像処理装置 |
| US9111179B2 (en) | 2009-09-18 | 2015-08-18 | Rutgers, The State University Of New Jersey | High-throughput biomarker segmentation utilizing hierarchical normalized cuts |
| IN2012DN02337A (https=) | 2009-10-12 | 2015-08-21 | Ventana Med Syst Inc | |
| US8897544B2 (en) | 2009-12-10 | 2014-11-25 | Indiana University Research And Technology Corp. | System and method for segmentation of three-dimensional image data |
| EP2564355A1 (en) | 2010-04-30 | 2013-03-06 | Vucomp, Inc. | Malignant mass detection and classification in radiographic images |
| US9996929B2 (en) | 2010-10-27 | 2018-06-12 | Varian Medical Systems International Ag | Visualization of deformations using color overlays |
| US8705833B2 (en) | 2011-04-25 | 2014-04-22 | The General Hospital Corporation | Computer-aided staining of multispectral images |
| US9159129B2 (en) | 2011-07-12 | 2015-10-13 | Definiens Ag | Generating image-based diagnostic tests by optimizing image analysis and data mining of co-registered images |
| WO2013049153A2 (en) * | 2011-09-27 | 2013-04-04 | Board Of Regents, University Of Texas System | Systems and methods for automated screening and prognosis of cancer from whole-slide biopsy images |
| US9607374B2 (en) | 2011-11-10 | 2017-03-28 | Cadess Medical Ab | Color decomposition in histology |
| US9256977B2 (en) | 2012-02-01 | 2016-02-09 | Siemens Medical Solutions Usa, Inc. | System for reconstruction of virtual frequency selective inversion MR images |
| US8594407B2 (en) | 2012-02-03 | 2013-11-26 | Siemens Aktiengesellschaft | Plane-by-plane iterative reconstruction for digital breast tomosynthesis |
| DE102012217301B4 (de) | 2012-09-25 | 2021-10-14 | Bayer Pharma Aktiengesellschaft | Kombination aus Kontrastmittel und Mammographie-CT-System mit vorgegebenem Energiebereich und Verfahren zur Erzeugung tomographischer Mammographie-CT-Aufnahmen durch diese Kombination |
| US9730655B2 (en) | 2013-01-21 | 2017-08-15 | Tracy J. Stark | Method for improved detection of nodules in medical images |
| WO2015054666A1 (en) | 2013-10-10 | 2015-04-16 | Board Of Regents, The University Of Texas System | Systems and methods for quantitative analysis of histopathology images using multi-classifier ensemble schemes |
| DE102015204957A1 (de) | 2014-03-27 | 2015-10-01 | Siemens Aktiengesellschaft | Bildgebendes Tomosynthesesystem, insbesondere Mammographiesystem |
| GB2528283B (en) * | 2014-07-16 | 2020-08-05 | Barco Nv | Image colour calibration with multiple colour scales |
| US9805248B2 (en) | 2014-08-29 | 2017-10-31 | Definiens Ag | Applying pixelwise descriptors to a target image that are generated by segmenting objects in other images |
| MX2018009566A (es) | 2016-02-08 | 2019-05-30 | Imago Systems Inc | Sistema y metodo para la visualizacion y caracterizacion de objetos en imagenes. |
-
2017
- 2017-02-08 MX MX2018009566A patent/MX2018009566A/es unknown
- 2017-02-08 EP EP17750690.4A patent/EP3399916B1/en active Active
- 2017-02-08 CN CN201780022416.5A patent/CN108882902B/zh active Active
- 2017-02-08 KR KR1020187026011A patent/KR20180115725A/ko not_active Ceased
- 2017-02-08 WO PCT/US2017/016999 patent/WO2017139367A1/en not_active Ceased
- 2017-02-08 US US15/533,451 patent/US10873681B2/en active Active
- 2017-02-08 JP JP2018560735A patent/JP7065038B2/ja active Active
- 2017-02-08 EP EP23192820.1A patent/EP4273799A3/en active Pending
- 2017-02-08 MA MA043593A patent/MA43593A/fr unknown
-
2020
- 2020-12-21 US US17/129,133 patent/US11734911B2/en active Active
-
2022
- 2022-04-25 JP JP2022071438A patent/JP7765344B2/ja active Active
-
2023
- 2023-08-17 US US18/451,656 patent/US20240096048A1/en active Pending
Non-Patent Citations (1)
| Title |
|---|
| ROBIN N STRICKLAND: "Image-processing techniques for tumor detection", IMAGE-PROCESSING TECHNIQUES FOR TUMOR DETECTION, 24 April 2002 (2002-04-24), pages 154 - 155, XP055697624, ISBN: 978-0-8247-0637-1, Retrieved from the Internet <URL:https://www.taylorfrancis.com/books/9780203909355> [retrieved on 20200521], DOI: https://doi.org/10.1201/9780203909355 * |
Cited By (1)
| Publication number | Priority date | Publication date | Assignee | Title |
|---|---|---|---|---|
| JP7765344B2 (ja) | 2016-02-08 | 2025-11-06 | イマーゴ・システムズ,インコーポレーテッド | 画像中の物体の視覚化および特徴づけのためのシステムおよび方法 |
Also Published As
| Publication number | Publication date |
|---|---|
| US20180109698A1 (en) | 2018-04-19 |
| US10873681B2 (en) | 2020-12-22 |
| MX2018009566A (es) | 2019-05-30 |
| WO2017139367A1 (en) | 2017-08-17 |
| JP7065038B2 (ja) | 2022-05-11 |
| JP2022105079A (ja) | 2022-07-12 |
| CN108882902B (zh) | 2022-08-30 |
| US11734911B2 (en) | 2023-08-22 |
| US20240096048A1 (en) | 2024-03-21 |
| JP7765344B2 (ja) | 2025-11-06 |
| EP3399916C0 (en) | 2023-08-23 |
| JP2019511342A (ja) | 2019-04-25 |
| CN108882902A (zh) | 2018-11-23 |
| EP3399916A4 (en) | 2019-08-07 |
| EP3399916A1 (en) | 2018-11-14 |
| EP4273799A3 (en) | 2023-12-06 |
| EP4273799A2 (en) | 2023-11-08 |
| MA43593A (fr) | 2018-11-14 |
| KR20180115725A (ko) | 2018-10-23 |
| CA3013926A1 (en) | 2017-08-17 |
| US20210258451A1 (en) | 2021-08-19 |
Similar Documents
| Publication | Publication Date | Title |
|---|---|---|
| US20240096048A1 (en) | System and Method for the Visualization and Characterization of Objects in Images | |
| US12524859B2 (en) | System and method for the visualization and characterization of objects in images | |
| US11669964B2 (en) | Systems and methods to facilitate review of liver tumor cases | |
| EP0811205B1 (en) | System and method for diagnosis of living tissue diseases | |
| Duarte et al. | Evaluating geodesic active contours in microcalcifications segmentation on mammograms | |
| Araújo et al. | An automatic method for segmentation of liver lesions in computed tomography images using deep neural networks | |
| EP1074939A1 (en) | A system and method for processing images of living tissue | |
| Ganvir et al. | Filtering method for pre-processing mammogram images for breast cancer detection | |
| Dobrescu et al. | Diagnosis of breast cancer from mammograms by using fractal measures | |
| Kaur et al. | Computer-aided diagnosis of renal lesions in CT images: a comprehensive survey and future prospects | |
| Beheshti et al. | Classification of abnormalities in mammograms by new asymmetric fractal features | |
| Pezeshki et al. | Mass classification of mammograms using fractal dimensions and statistical features | |
| CA3013926C (en) | System and method for the visualization and characterization of objects in images | |
| Kayode et al. | An explorative survey of image enhancement techniques used in mammography | |
| HK40000956A (en) | System and method for the visualization and characterization of objects in images | |
| HK40000956B (en) | System and method for the visualization and characterization of objects in images | |
| Anandan et al. | Neural Network Model for Cancer Tumor Growth with Minimizing the Error in Learning | |
| McCarthy | A Quantitative Visualization Tool for the Assessment of Mammographic Dense Tissue Subtypes | |
| Naeppi et al. | Mammographic feature generator for evaluation of image analysis algorithms | |
| Rani et al. | Breast Cancer Detection Using Combination of Feature Extraction Models | |
| Bayram et al. | An approach to the detection of lesions in mammograms using fuzzy image processing | |
| Pöhlmann | Breast Imaging beyond 2D: from Screening to Treatment |
Legal Events
| Date | Code | Title | Description |
|---|---|---|---|
| STAA | Information on the status of an ep patent application or granted ep patent |
Free format text: STATUS: THE INTERNATIONAL PUBLICATION HAS BEEN MADE |
|
| PUAI | Public reference made under article 153(3) epc to a published international application that has entered the european phase |
Free format text: ORIGINAL CODE: 0009012 |
|
| STAA | Information on the status of an ep patent application or granted ep patent |
Free format text: STATUS: REQUEST FOR EXAMINATION WAS MADE |
|
| 17P | Request for examination filed |
Effective date: 20180808 |
|
| AK | Designated contracting states |
Kind code of ref document: A1 Designated state(s): AL AT BE BG CH CY CZ DE DK EE ES FI FR GB GR HR HU IE IS IT LI LT LU LV MC MK MT NL NO PL PT RO RS SE SI SK SM TR |
|
| AX | Request for extension of the european patent |
Extension state: BA ME |
|
| A4 | Supplementary search report drawn up and despatched |
Effective date: 20190705 |
|
| RIC1 | Information provided on ipc code assigned before grant |
Ipc: A61B 5/00 20060101ALI20190701BHEP Ipc: G06T 11/00 20060101ALI20190701BHEP Ipc: G06K 9/46 20060101ALI20190701BHEP Ipc: H04N 1/46 20060101ALI20190701BHEP Ipc: G06T 7/48 20170101ALI20190701BHEP Ipc: G06T 7/11 20170101ALI20190701BHEP Ipc: H04N 1/60 20060101ALI20190701BHEP Ipc: G06K 9/00 20060101ALI20190701BHEP Ipc: G06T 7/00 20170101ALI20190701BHEP Ipc: A61B 8/08 20060101ALI20190701BHEP Ipc: G06T 7/174 20170101ALI20190701BHEP Ipc: G06K 9/36 20060101ALI20190701BHEP Ipc: A61B 6/00 20060101AFI20190701BHEP |
|
| STAA | Information on the status of an ep patent application or granted ep patent |
Free format text: STATUS: EXAMINATION IS IN PROGRESS |
|
| 17Q | First examination report despatched |
Effective date: 20200529 |
|
| REG | Reference to a national code |
Ref country code: DE Ref legal event code: R079 Free format text: PREVIOUS MAIN CLASS: A61B0006000000 Ipc: G16H0050300000 Ref document number: 602017073101 Country of ref document: DE |
|
| RIC1 | Information provided on ipc code assigned before grant |
Ipc: G06T 7/48 20170101ALI20230317BHEP Ipc: G06T 7/00 20170101ALI20230317BHEP Ipc: A61B 8/08 20060101ALI20230317BHEP Ipc: A61B 6/00 20060101ALI20230317BHEP Ipc: G06V 10/56 20220101ALI20230317BHEP Ipc: G06V 10/54 20220101ALI20230317BHEP Ipc: G06V 10/46 20220101ALI20230317BHEP Ipc: G16H 50/30 20180101AFI20230317BHEP |
|
| GRAP | Despatch of communication of intention to grant a patent |
Free format text: ORIGINAL CODE: EPIDOSNIGR1 |
|
| STAA | Information on the status of an ep patent application or granted ep patent |
Free format text: STATUS: GRANT OF PATENT IS INTENDED |
|
| INTG | Intention to grant announced |
Effective date: 20230508 |
|
| GRAS | Grant fee paid |
Free format text: ORIGINAL CODE: EPIDOSNIGR3 |
|
| GRAA | (expected) grant |
Free format text: ORIGINAL CODE: 0009210 |
|
| STAA | Information on the status of an ep patent application or granted ep patent |
Free format text: STATUS: THE PATENT HAS BEEN GRANTED |
|
| AK | Designated contracting states |
Kind code of ref document: B1 Designated state(s): AL AT BE BG CH CY CZ DE DK EE ES FI FR GB GR HR HU IE IS IT LI LT LU LV MC MK MT NL NO PL PT RO RS SE SI SK SM TR |
|
| REG | Reference to a national code |
Ref country code: GB Ref legal event code: FG4D |
|
| REG | Reference to a national code |
Ref country code: CH Ref legal event code: EP |
|
| REG | Reference to a national code |
Ref country code: DE Ref legal event code: R096 Ref document number: 602017073101 Country of ref document: DE |
|
| REG | Reference to a national code |
Ref country code: IE Ref legal event code: FG4D |
|
| U01 | Request for unitary effect filed |
Effective date: 20230823 |
|
| U07 | Unitary effect registered |
Designated state(s): AT BE BG DE DK EE FI FR IT LT LU LV MT NL PT SE SI Effective date: 20230828 |
|
| PG25 | Lapsed in a contracting state [announced via postgrant information from national office to epo] |
Ref country code: GR Free format text: LAPSE BECAUSE OF FAILURE TO SUBMIT A TRANSLATION OF THE DESCRIPTION OR TO PAY THE FEE WITHIN THE PRESCRIBED TIME-LIMIT Effective date: 20231124 |
|
| PG25 | Lapsed in a contracting state [announced via postgrant information from national office to epo] |
Ref country code: IS Free format text: LAPSE BECAUSE OF FAILURE TO SUBMIT A TRANSLATION OF THE DESCRIPTION OR TO PAY THE FEE WITHIN THE PRESCRIBED TIME-LIMIT Effective date: 20231223 |
|
| PG25 | Lapsed in a contracting state [announced via postgrant information from national office to epo] |
Ref country code: RS Free format text: LAPSE BECAUSE OF FAILURE TO SUBMIT A TRANSLATION OF THE DESCRIPTION OR TO PAY THE FEE WITHIN THE PRESCRIBED TIME-LIMIT Effective date: 20230823 Ref country code: NO Free format text: LAPSE BECAUSE OF FAILURE TO SUBMIT A TRANSLATION OF THE DESCRIPTION OR TO PAY THE FEE WITHIN THE PRESCRIBED TIME-LIMIT Effective date: 20231123 Ref country code: IS Free format text: LAPSE BECAUSE OF FAILURE TO SUBMIT A TRANSLATION OF THE DESCRIPTION OR TO PAY THE FEE WITHIN THE PRESCRIBED TIME-LIMIT Effective date: 20231223 Ref country code: HR Free format text: LAPSE BECAUSE OF FAILURE TO SUBMIT A TRANSLATION OF THE DESCRIPTION OR TO PAY THE FEE WITHIN THE PRESCRIBED TIME-LIMIT Effective date: 20230823 Ref country code: GR Free format text: LAPSE BECAUSE OF FAILURE TO SUBMIT A TRANSLATION OF THE DESCRIPTION OR TO PAY THE FEE WITHIN THE PRESCRIBED TIME-LIMIT Effective date: 20231124 |
|
| PG25 | Lapsed in a contracting state [announced via postgrant information from national office to epo] |
Ref country code: PL Free format text: LAPSE BECAUSE OF FAILURE TO SUBMIT A TRANSLATION OF THE DESCRIPTION OR TO PAY THE FEE WITHIN THE PRESCRIBED TIME-LIMIT Effective date: 20230823 |
|
| U20 | Renewal fee for the european patent with unitary effect paid |
Year of fee payment: 8 Effective date: 20240227 |
|
| PG25 | Lapsed in a contracting state [announced via postgrant information from national office to epo] |
Ref country code: ES Free format text: LAPSE BECAUSE OF FAILURE TO SUBMIT A TRANSLATION OF THE DESCRIPTION OR TO PAY THE FEE WITHIN THE PRESCRIBED TIME-LIMIT Effective date: 20230823 |
|
| PG25 | Lapsed in a contracting state [announced via postgrant information from national office to epo] |
Ref country code: SM Free format text: LAPSE BECAUSE OF FAILURE TO SUBMIT A TRANSLATION OF THE DESCRIPTION OR TO PAY THE FEE WITHIN THE PRESCRIBED TIME-LIMIT Effective date: 20230823 Ref country code: RO Free format text: LAPSE BECAUSE OF FAILURE TO SUBMIT A TRANSLATION OF THE DESCRIPTION OR TO PAY THE FEE WITHIN THE PRESCRIBED TIME-LIMIT Effective date: 20230823 Ref country code: ES Free format text: LAPSE BECAUSE OF FAILURE TO SUBMIT A TRANSLATION OF THE DESCRIPTION OR TO PAY THE FEE WITHIN THE PRESCRIBED TIME-LIMIT Effective date: 20230823 Ref country code: CZ Free format text: LAPSE BECAUSE OF FAILURE TO SUBMIT A TRANSLATION OF THE DESCRIPTION OR TO PAY THE FEE WITHIN THE PRESCRIBED TIME-LIMIT Effective date: 20230823 Ref country code: SK Free format text: LAPSE BECAUSE OF FAILURE TO SUBMIT A TRANSLATION OF THE DESCRIPTION OR TO PAY THE FEE WITHIN THE PRESCRIBED TIME-LIMIT Effective date: 20230823 |
|
| VS25 | Lapsed in a validation state [announced via postgrant information from nat. office to epo] |
Ref country code: MD Free format text: LAPSE BECAUSE OF FAILURE TO SUBMIT A TRANSLATION OF THE DESCRIPTION OR TO PAY THE FEE WITHIN THE PRESCRIBED TIME-LIMIT Effective date: 20230823 |
|
| REG | Reference to a national code |
Ref country code: DE Ref legal event code: R097 Ref document number: 602017073101 Country of ref document: DE |
|
| PLBE | No opposition filed within time limit |
Free format text: ORIGINAL CODE: 0009261 |
|
| STAA | Information on the status of an ep patent application or granted ep patent |
Free format text: STATUS: NO OPPOSITION FILED WITHIN TIME LIMIT |
|
| 26N | No opposition filed |
Effective date: 20240524 |
|
| PG25 | Lapsed in a contracting state [announced via postgrant information from national office to epo] |
Ref country code: MC Free format text: LAPSE BECAUSE OF FAILURE TO SUBMIT A TRANSLATION OF THE DESCRIPTION OR TO PAY THE FEE WITHIN THE PRESCRIBED TIME-LIMIT Effective date: 20230823 |
|
| REG | Reference to a national code |
Ref country code: CH Ref legal event code: PL |
|
| PG25 | Lapsed in a contracting state [announced via postgrant information from national office to epo] |
Ref country code: CH Free format text: LAPSE BECAUSE OF NON-PAYMENT OF DUE FEES Effective date: 20240229 |
|
| PG25 | Lapsed in a contracting state [announced via postgrant information from national office to epo] |
Ref country code: CH Free format text: LAPSE BECAUSE OF NON-PAYMENT OF DUE FEES Effective date: 20240229 |
|
| U20 | Renewal fee for the european patent with unitary effect paid |
Year of fee payment: 9 Effective date: 20250227 |
|
| PG25 | Lapsed in a contracting state [announced via postgrant information from national office to epo] |
Ref country code: CY Free format text: LAPSE BECAUSE OF FAILURE TO SUBMIT A TRANSLATION OF THE DESCRIPTION OR TO PAY THE FEE WITHIN THE PRESCRIBED TIME-LIMIT; INVALID AB INITIO Effective date: 20170208 |
|
| PG25 | Lapsed in a contracting state [announced via postgrant information from national office to epo] |
Ref country code: HU Free format text: LAPSE BECAUSE OF FAILURE TO SUBMIT A TRANSLATION OF THE DESCRIPTION OR TO PAY THE FEE WITHIN THE PRESCRIBED TIME-LIMIT; INVALID AB INITIO Effective date: 20170208 |
|
| VS25 | Lapsed in a validation state [announced via postgrant information from nat. office to epo] |
Ref country code: MA Free format text: FAILURE TO ELECT DOMICILE IN THE NATIONAL COUNTRY Effective date: 20231124 |
|
| PG25 | Lapsed in a contracting state [announced via postgrant information from national office to epo] |
Ref country code: TR Free format text: LAPSE BECAUSE OF FAILURE TO SUBMIT A TRANSLATION OF THE DESCRIPTION OR TO PAY THE FEE WITHIN THE PRESCRIBED TIME-LIMIT Effective date: 20230823 |
|
| U20 | Renewal fee for the european patent with unitary effect paid |
Year of fee payment: 10 Effective date: 20260227 |
|
| PGFP | Annual fee paid to national office [announced via postgrant information from national office to epo] |
Ref country code: GB Payment date: 20260227 Year of fee payment: 10 |
|
| PGFP | Annual fee paid to national office [announced via postgrant information from national office to epo] |
Ref country code: IE Payment date: 20260227 Year of fee payment: 10 |