EP3397597B1 - Glass-based articles including a stress profile comprising two regions, and methods of making - Google Patents
Glass-based articles including a stress profile comprising two regions, and methods of making Download PDFInfo
- Publication number
- EP3397597B1 EP3397597B1 EP17720633.1A EP17720633A EP3397597B1 EP 3397597 B1 EP3397597 B1 EP 3397597B1 EP 17720633 A EP17720633 A EP 17720633A EP 3397597 B1 EP3397597 B1 EP 3397597B1
- Authority
- EP
- European Patent Office
- Prior art keywords
- glass
- mpa
- mol
- thickness
- micrometer
- Prior art date
- Legal status (The legal status is an assumption and is not a legal conclusion. Google has not performed a legal analysis and makes no representation as to the accuracy of the status listed.)
- Active
Links
- 239000011521 glass Substances 0.000 title claims description 496
- 238000000034 method Methods 0.000 title claims description 74
- 239000000203 mixture Substances 0.000 claims description 133
- 239000000758 substrate Substances 0.000 claims description 109
- 238000012360 testing method Methods 0.000 claims description 96
- 239000011734 sodium Substances 0.000 claims description 76
- KKCBUQHMOMHUOY-UHFFFAOYSA-N Na2O Inorganic materials [O-2].[Na+].[Na+] KKCBUQHMOMHUOY-UHFFFAOYSA-N 0.000 claims description 59
- FUJCRWPEOMXPAD-UHFFFAOYSA-N Li2O Inorganic materials [Li+].[Li+].[O-2] FUJCRWPEOMXPAD-UHFFFAOYSA-N 0.000 claims description 45
- XUCJHNOBJLKZNU-UHFFFAOYSA-M dilithium;hydroxide Chemical compound [Li+].[Li+].[OH-] XUCJHNOBJLKZNU-UHFFFAOYSA-M 0.000 claims description 45
- 229910052700 potassium Inorganic materials 0.000 claims description 40
- 238000009792 diffusion process Methods 0.000 claims description 36
- 229910044991 metal oxide Inorganic materials 0.000 claims description 35
- 150000004706 metal oxides Chemical class 0.000 claims description 35
- 229910001415 sodium ion Inorganic materials 0.000 claims description 20
- ZLMJMSJWJFRBEC-UHFFFAOYSA-N Potassium Chemical compound [K] ZLMJMSJWJFRBEC-UHFFFAOYSA-N 0.000 claims description 19
- 239000011591 potassium Substances 0.000 claims description 19
- 229910001414 potassium ion Inorganic materials 0.000 claims description 14
- 238000005728 strengthening Methods 0.000 claims description 13
- 230000004083 survival effect Effects 0.000 claims description 13
- 230000007423 decrease Effects 0.000 claims description 10
- 239000006058 strengthened glass Substances 0.000 claims description 7
- DGAQECJNVWCQMB-PUAWFVPOSA-M Ilexoside XXIX Chemical compound C[C@@H]1CC[C@@]2(CC[C@@]3(C(=CC[C@H]4[C@]3(CC[C@@H]5[C@@]4(CC[C@@H](C5(C)C)OS(=O)(=O)[O-])C)C)[C@@H]2[C@]1(C)O)C)C(=O)O[C@H]6[C@@H]([C@H]([C@@H]([C@H](O6)CO)O)O)O.[Na+] DGAQECJNVWCQMB-PUAWFVPOSA-M 0.000 claims description 5
- 230000035882 stress Effects 0.000 description 277
- 238000005342 ion exchange Methods 0.000 description 98
- VWDWKYIASSYTQR-UHFFFAOYSA-N sodium nitrate Chemical compound [Na+].[O-][N+]([O-])=O VWDWKYIASSYTQR-UHFFFAOYSA-N 0.000 description 82
- VYPSYNLAJGMNEJ-UHFFFAOYSA-N Silicium dioxide Chemical compound O=[Si]=O VYPSYNLAJGMNEJ-UHFFFAOYSA-N 0.000 description 61
- FGIUAXJPYTZDNR-UHFFFAOYSA-N potassium nitrate Chemical compound [K+].[O-][N+]([O-])=O FGIUAXJPYTZDNR-UHFFFAOYSA-N 0.000 description 60
- PNEYBMLMFCGWSK-UHFFFAOYSA-N aluminium oxide Inorganic materials [O-2].[O-2].[O-2].[Al+3].[Al+3] PNEYBMLMFCGWSK-UHFFFAOYSA-N 0.000 description 57
- 229910052593 corundum Inorganic materials 0.000 description 56
- 229910001845 yogo sapphire Inorganic materials 0.000 description 56
- 239000000523 sample Substances 0.000 description 54
- XOLBLPGZBRYERU-UHFFFAOYSA-N tin dioxide Chemical compound O=[Sn]=O XOLBLPGZBRYERU-UHFFFAOYSA-N 0.000 description 50
- 230000000052 comparative effect Effects 0.000 description 47
- 150000003839 salts Chemical class 0.000 description 44
- 150000002500 ions Chemical class 0.000 description 40
- 229910052708 sodium Inorganic materials 0.000 description 37
- 229910000272 alkali metal oxide Inorganic materials 0.000 description 33
- 229910052681 coesite Inorganic materials 0.000 description 30
- 229910052906 cristobalite Inorganic materials 0.000 description 30
- 239000000377 silicon dioxide Substances 0.000 description 30
- 229910052682 stishovite Inorganic materials 0.000 description 30
- 229910052905 tridymite Inorganic materials 0.000 description 30
- 238000007906 compression Methods 0.000 description 29
- 230000006835 compression Effects 0.000 description 26
- 239000010410 layer Substances 0.000 description 26
- APSBXTVYXVQYAB-UHFFFAOYSA-M sodium docusate Chemical compound [Na+].CCCCC(CC)COC(=O)CC(S([O-])(=O)=O)C(=O)OCC(CC)CCCC APSBXTVYXVQYAB-UHFFFAOYSA-M 0.000 description 26
- 230000006870 function Effects 0.000 description 25
- 230000003116 impacting effect Effects 0.000 description 25
- GWEVSGVZZGPLCZ-UHFFFAOYSA-N Titan oxide Chemical compound O=[Ti]=O GWEVSGVZZGPLCZ-UHFFFAOYSA-N 0.000 description 23
- MCMNRKCIXSYSNV-UHFFFAOYSA-N Zirconium dioxide Chemical compound O=[Zr]=O MCMNRKCIXSYSNV-UHFFFAOYSA-N 0.000 description 20
- 230000015556 catabolic process Effects 0.000 description 20
- 229910052845 zircon Inorganic materials 0.000 description 20
- GFQYVLUOOAAOGM-UHFFFAOYSA-N zirconium(iv) silicate Chemical compound [Zr+4].[O-][Si]([O-])([O-])[O-] GFQYVLUOOAAOGM-UHFFFAOYSA-N 0.000 description 20
- 229910052744 lithium Inorganic materials 0.000 description 18
- 239000006059 cover glass Substances 0.000 description 17
- 229910011255 B2O3 Inorganic materials 0.000 description 15
- 238000005452 bending Methods 0.000 description 15
- 230000006378 damage Effects 0.000 description 15
- JKWMSGQKBLHBQQ-UHFFFAOYSA-N diboron trioxide Chemical compound O=BOB=O JKWMSGQKBLHBQQ-UHFFFAOYSA-N 0.000 description 15
- 230000008569 process Effects 0.000 description 15
- OCKGFTQIICXDQW-ZEQRLZLVSA-N 5-[(1r)-1-hydroxy-2-[4-[(2r)-2-hydroxy-2-(4-methyl-1-oxo-3h-2-benzofuran-5-yl)ethyl]piperazin-1-yl]ethyl]-4-methyl-3h-2-benzofuran-1-one Chemical compound C1=C2C(=O)OCC2=C(C)C([C@@H](O)CN2CCN(CC2)C[C@H](O)C2=CC=C3C(=O)OCC3=C2C)=C1 OCKGFTQIICXDQW-ZEQRLZLVSA-N 0.000 description 14
- 238000007654 immersion Methods 0.000 description 14
- 238000007373 indentation Methods 0.000 description 14
- 230000003287 optical effect Effects 0.000 description 14
- 238000003426 chemical strengthening reaction Methods 0.000 description 13
- 239000000126 substance Substances 0.000 description 13
- 230000008901 benefit Effects 0.000 description 12
- 239000005345 chemically strengthened glass Substances 0.000 description 12
- 239000012634 fragment Substances 0.000 description 12
- 210000003127 knee Anatomy 0.000 description 12
- 238000005259 measurement Methods 0.000 description 12
- 235000010344 sodium nitrate Nutrition 0.000 description 11
- 239000002585 base Substances 0.000 description 10
- 230000008859 change Effects 0.000 description 10
- 239000011833 salt mixture Substances 0.000 description 10
- 238000005336 cracking Methods 0.000 description 9
- 238000010438 heat treatment Methods 0.000 description 9
- 239000003082 abrasive agent Substances 0.000 description 8
- 230000015572 biosynthetic process Effects 0.000 description 8
- 239000002241 glass-ceramic Substances 0.000 description 8
- 239000000463 material Substances 0.000 description 8
- 239000006060 molten glass Substances 0.000 description 8
- 230000006872 improvement Effects 0.000 description 7
- JEIPFZHSYJVQDO-UHFFFAOYSA-N iron(III) oxide Inorganic materials O=[Fe]O[Fe]=O JEIPFZHSYJVQDO-UHFFFAOYSA-N 0.000 description 7
- 235000010333 potassium nitrate Nutrition 0.000 description 7
- 230000000694 effects Effects 0.000 description 6
- 238000009863 impact test Methods 0.000 description 6
- 229910052751 metal Inorganic materials 0.000 description 6
- 239000002184 metal Substances 0.000 description 6
- 229910000287 alkaline earth metal oxide Inorganic materials 0.000 description 5
- 239000006121 base glass Substances 0.000 description 5
- 230000009286 beneficial effect Effects 0.000 description 5
- 229910021645 metal ion Inorganic materials 0.000 description 5
- 239000007787 solid Substances 0.000 description 5
- 238000005496 tempering Methods 0.000 description 5
- 239000005341 toughened glass Substances 0.000 description 5
- ATJFFYVFTNAWJD-UHFFFAOYSA-N Tin Chemical compound [Sn] ATJFFYVFTNAWJD-UHFFFAOYSA-N 0.000 description 4
- -1 alkali metal cations Chemical class 0.000 description 4
- 229910001413 alkali metal ion Inorganic materials 0.000 description 4
- 239000013078 crystal Substances 0.000 description 4
- 230000003247 decreasing effect Effects 0.000 description 4
- 238000003280 down draw process Methods 0.000 description 4
- 230000001747 exhibiting effect Effects 0.000 description 4
- 238000003286 fusion draw glass process Methods 0.000 description 4
- 230000007246 mechanism Effects 0.000 description 4
- 239000002667 nucleating agent Substances 0.000 description 4
- 239000002245 particle Substances 0.000 description 4
- 230000010287 polarization Effects 0.000 description 4
- 238000003283 slot draw process Methods 0.000 description 4
- 229910001220 stainless steel Inorganic materials 0.000 description 4
- 239000010935 stainless steel Substances 0.000 description 4
- 239000002344 surface layer Substances 0.000 description 4
- 229910016978 MnOx Inorganic materials 0.000 description 3
- 239000007832 Na2SO4 Substances 0.000 description 3
- 244000137852 Petrea volubilis Species 0.000 description 3
- PMZURENOXWZQFD-UHFFFAOYSA-L Sodium Sulfate Chemical compound [Na+].[Na+].[O-]S([O-])(=O)=O PMZURENOXWZQFD-UHFFFAOYSA-L 0.000 description 3
- HEMHJVSKTPXQMS-UHFFFAOYSA-M Sodium hydroxide Chemical compound [OH-].[Na+] HEMHJVSKTPXQMS-UHFFFAOYSA-M 0.000 description 3
- 238000007545 Vickers hardness test Methods 0.000 description 3
- 238000005299 abrasion Methods 0.000 description 3
- 239000002390 adhesive tape Substances 0.000 description 3
- 239000005358 alkali aluminosilicate glass Substances 0.000 description 3
- 238000000137 annealing Methods 0.000 description 3
- 239000010426 asphalt Substances 0.000 description 3
- 150000001768 cations Chemical class 0.000 description 3
- 238000003279 ceramming Methods 0.000 description 3
- 230000000295 complement effect Effects 0.000 description 3
- 230000001419 dependent effect Effects 0.000 description 3
- 229910003460 diamond Inorganic materials 0.000 description 3
- 239000010432 diamond Substances 0.000 description 3
- 238000004453 electron probe microanalysis Methods 0.000 description 3
- IIPYXGDZVMZOAP-UHFFFAOYSA-N lithium nitrate Chemical compound [Li+].[O-][N+]([O-])=O IIPYXGDZVMZOAP-UHFFFAOYSA-N 0.000 description 3
- 230000004048 modification Effects 0.000 description 3
- 238000012986 modification Methods 0.000 description 3
- 150000002823 nitrates Chemical class 0.000 description 3
- 230000000704 physical effect Effects 0.000 description 3
- 230000009467 reduction Effects 0.000 description 3
- NCCSSGKUIKYAJD-UHFFFAOYSA-N rubidium(1+) Chemical compound [Rb+] NCCSSGKUIKYAJD-UHFFFAOYSA-N 0.000 description 3
- 229910052938 sodium sulfate Inorganic materials 0.000 description 3
- 238000007655 standard test method Methods 0.000 description 3
- 238000011282 treatment Methods 0.000 description 3
- MIMUSZHMZBJBPO-UHFFFAOYSA-N 6-methoxy-8-nitroquinoline Chemical compound N1=CC=CC2=CC(OC)=CC([N+]([O-])=O)=C21 MIMUSZHMZBJBPO-UHFFFAOYSA-N 0.000 description 2
- GOLCXWYRSKYTSP-UHFFFAOYSA-N Arsenious Acid Chemical compound O1[As]2O[As]1O2 GOLCXWYRSKYTSP-UHFFFAOYSA-N 0.000 description 2
- WHXSMMKQMYFTQS-UHFFFAOYSA-N Lithium Chemical compound [Li] WHXSMMKQMYFTQS-UHFFFAOYSA-N 0.000 description 2
- XOJVVFBFDXDTEG-UHFFFAOYSA-N Norphytane Natural products CC(C)CCCC(C)CCCC(C)CCCC(C)C XOJVVFBFDXDTEG-UHFFFAOYSA-N 0.000 description 2
- 238000006124 Pilkington process Methods 0.000 description 2
- WCUXLLCKKVVCTQ-UHFFFAOYSA-M Potassium chloride Chemical compound [Cl-].[K+] WCUXLLCKKVVCTQ-UHFFFAOYSA-M 0.000 description 2
- FAPWRFPIFSIZLT-UHFFFAOYSA-M Sodium chloride Chemical compound [Na+].[Cl-] FAPWRFPIFSIZLT-UHFFFAOYSA-M 0.000 description 2
- 239000003513 alkali Substances 0.000 description 2
- 229910052783 alkali metal Inorganic materials 0.000 description 2
- 150000001447 alkali salts Chemical class 0.000 description 2
- 238000004458 analytical method Methods 0.000 description 2
- 229910001423 beryllium ion Inorganic materials 0.000 description 2
- 150000001875 compounds Chemical class 0.000 description 2
- 238000010168 coupling process Methods 0.000 description 2
- 230000007547 defect Effects 0.000 description 2
- 238000011161 development Methods 0.000 description 2
- 230000018109 developmental process Effects 0.000 description 2
- 238000009826 distribution Methods 0.000 description 2
- 230000008030 elimination Effects 0.000 description 2
- 238000003379 elimination reaction Methods 0.000 description 2
- 238000007667 floating Methods 0.000 description 2
- 230000004927 fusion Effects 0.000 description 2
- 239000010438 granite Substances 0.000 description 2
- 230000003993 interaction Effects 0.000 description 2
- 229910001416 lithium ion Inorganic materials 0.000 description 2
- 230000033001 locomotion Effects 0.000 description 2
- 238000004519 manufacturing process Methods 0.000 description 2
- 150000002739 metals Chemical class 0.000 description 2
- 230000035515 penetration Effects 0.000 description 2
- NOTVAPJNGZMVSD-UHFFFAOYSA-N potassium monoxide Inorganic materials [K]O[K] NOTVAPJNGZMVSD-UHFFFAOYSA-N 0.000 description 2
- 239000002994 raw material Substances 0.000 description 2
- 229910052701 rubidium Inorganic materials 0.000 description 2
- IGLNJRXAVVLDKE-UHFFFAOYSA-N rubidium atom Chemical compound [Rb] IGLNJRXAVVLDKE-UHFFFAOYSA-N 0.000 description 2
- 238000006748 scratching Methods 0.000 description 2
- 230000002393 scratching effect Effects 0.000 description 2
- HBMJWWWQQXIZIP-UHFFFAOYSA-N silicon carbide Chemical compound [Si+]#[C-] HBMJWWWQQXIZIP-UHFFFAOYSA-N 0.000 description 2
- 235000012239 silicon dioxide Nutrition 0.000 description 2
- JHJLBTNAGRQEKS-UHFFFAOYSA-M sodium bromide Chemical compound [Na+].[Br-] JHJLBTNAGRQEKS-UHFFFAOYSA-M 0.000 description 2
- PUZPDOWCWNUUKD-UHFFFAOYSA-M sodium fluoride Chemical compound [F-].[Na+] PUZPDOWCWNUUKD-UHFFFAOYSA-M 0.000 description 2
- 238000010998 test method Methods 0.000 description 2
- KOPBYBDAPCDYFK-UHFFFAOYSA-N Cs2O Inorganic materials [O-2].[Cs+].[Cs+] KOPBYBDAPCDYFK-UHFFFAOYSA-N 0.000 description 1
- 101100348017 Drosophila melanogaster Nazo gene Proteins 0.000 description 1
- 229910000760 Hardened steel Inorganic materials 0.000 description 1
- 229910018068 Li 2 O Inorganic materials 0.000 description 1
- 101001047513 Mus musculus Lethal(2) giant larvae protein homolog 1 Proteins 0.000 description 1
- 241001579016 Nanoa Species 0.000 description 1
- 229910006404 SnO 2 Inorganic materials 0.000 description 1
- 229910010413 TiO 2 Inorganic materials 0.000 description 1
- 230000001133 acceleration Effects 0.000 description 1
- 238000009825 accumulation Methods 0.000 description 1
- 239000002253 acid Substances 0.000 description 1
- 230000032683 aging Effects 0.000 description 1
- CNLWCVNCHLKFHK-UHFFFAOYSA-N aluminum;lithium;dioxido(oxo)silane Chemical compound [Li+].[Al+3].[O-][Si]([O-])=O.[O-][Si]([O-])=O CNLWCVNCHLKFHK-UHFFFAOYSA-N 0.000 description 1
- ADCOVFLJGNWWNZ-UHFFFAOYSA-N antimony trioxide Inorganic materials O=[Sb]O[Sb]=O ADCOVFLJGNWWNZ-UHFFFAOYSA-N 0.000 description 1
- 238000013459 approach Methods 0.000 description 1
- 238000000149 argon plasma sintering Methods 0.000 description 1
- 229910052792 caesium Inorganic materials 0.000 description 1
- TVFDJXOCXUVLDH-UHFFFAOYSA-N caesium atom Chemical compound [Cs] TVFDJXOCXUVLDH-UHFFFAOYSA-N 0.000 description 1
- 239000000919 ceramic Substances 0.000 description 1
- 229910010293 ceramic material Inorganic materials 0.000 description 1
- 238000012512 characterization method Methods 0.000 description 1
- 150000003841 chloride salts Chemical class 0.000 description 1
- 230000002301 combined effect Effects 0.000 description 1
- 239000000470 constituent Substances 0.000 description 1
- 239000000356 contaminant Substances 0.000 description 1
- 238000005260 corrosion Methods 0.000 description 1
- 230000007797 corrosion Effects 0.000 description 1
- 238000005859 coupling reaction Methods 0.000 description 1
- 239000006092 crystalline glass-ceramic Substances 0.000 description 1
- 239000002178 crystalline material Substances 0.000 description 1
- 238000005520 cutting process Methods 0.000 description 1
- 238000007405 data analysis Methods 0.000 description 1
- 238000013461 design Methods 0.000 description 1
- AKUNKIJLSDQFLS-UHFFFAOYSA-M dicesium;hydroxide Chemical compound [OH-].[Cs+].[Cs+] AKUNKIJLSDQFLS-UHFFFAOYSA-M 0.000 description 1
- 238000006073 displacement reaction Methods 0.000 description 1
- 230000009429 distress Effects 0.000 description 1
- 238000004993 emission spectroscopy Methods 0.000 description 1
- 238000011156 evaluation Methods 0.000 description 1
- 239000006025 fining agent Substances 0.000 description 1
- 239000005357 flat glass Substances 0.000 description 1
- 238000007656 fracture toughness test Methods 0.000 description 1
- 238000013467 fragmentation Methods 0.000 description 1
- 238000006062 fragmentation reaction Methods 0.000 description 1
- 238000007499 fusion processing Methods 0.000 description 1
- 229910001676 gahnite Inorganic materials 0.000 description 1
- 230000014509 gene expression Effects 0.000 description 1
- 230000005484 gravity Effects 0.000 description 1
- 238000000227 grinding Methods 0.000 description 1
- 238000007542 hardness measurement Methods 0.000 description 1
- 239000012535 impurity Substances 0.000 description 1
- 230000005764 inhibitory process Effects 0.000 description 1
- 230000000977 initiatory effect Effects 0.000 description 1
- 230000010354 integration Effects 0.000 description 1
- 238000000691 measurement method Methods 0.000 description 1
- 238000002844 melting Methods 0.000 description 1
- 230000008018 melting Effects 0.000 description 1
- 239000012768 molten material Substances 0.000 description 1
- 230000003647 oxidation Effects 0.000 description 1
- 238000007254 oxidation reaction Methods 0.000 description 1
- 230000002093 peripheral effect Effects 0.000 description 1
- 238000005498 polishing Methods 0.000 description 1
- CHWRSCGUEQEHOH-UHFFFAOYSA-N potassium oxide Chemical compound [O-2].[K+].[K+] CHWRSCGUEQEHOH-UHFFFAOYSA-N 0.000 description 1
- OTYBMLCTZGSZBG-UHFFFAOYSA-L potassium sulfate Chemical compound [K+].[K+].[O-]S([O-])(=O)=O OTYBMLCTZGSZBG-UHFFFAOYSA-L 0.000 description 1
- 229910052939 potassium sulfate Inorganic materials 0.000 description 1
- 230000001902 propagating effect Effects 0.000 description 1
- 238000003908 quality control method Methods 0.000 description 1
- 230000004044 response Effects 0.000 description 1
- 239000011435 rock Substances 0.000 description 1
- 229910001953 rubidium(I) oxide Inorganic materials 0.000 description 1
- 239000004576 sand Substances 0.000 description 1
- 239000005368 silicate glass Substances 0.000 description 1
- RMAQACBXLXPBSY-UHFFFAOYSA-N silicic acid Chemical compound O[Si](O)(O)O RMAQACBXLXPBSY-UHFFFAOYSA-N 0.000 description 1
- 229910010271 silicon carbide Inorganic materials 0.000 description 1
- 239000011780 sodium chloride Substances 0.000 description 1
- 239000011775 sodium fluoride Substances 0.000 description 1
- 241000894007 species Species 0.000 description 1
- 238000001228 spectrum Methods 0.000 description 1
- 150000003467 sulfuric acid derivatives Chemical class 0.000 description 1
- 230000002459 sustained effect Effects 0.000 description 1
- YEAUATLBSVJFOY-UHFFFAOYSA-N tetraantimony hexaoxide Chemical compound O1[Sb](O2)O[Sb]3O[Sb]1O[Sb]2O3 YEAUATLBSVJFOY-UHFFFAOYSA-N 0.000 description 1
- 238000012876 topography Methods 0.000 description 1
- 238000002834 transmittance Methods 0.000 description 1
- 238000005406 washing Methods 0.000 description 1
- 230000004580 weight loss Effects 0.000 description 1
- 229910052644 β-spodumene Inorganic materials 0.000 description 1
Images


Classifications
-
- H—ELECTRICITY
- H05—ELECTRIC TECHNIQUES NOT OTHERWISE PROVIDED FOR
- H05K—PRINTED CIRCUITS; CASINGS OR CONSTRUCTIONAL DETAILS OF ELECTRIC APPARATUS; MANUFACTURE OF ASSEMBLAGES OF ELECTRICAL COMPONENTS
- H05K5/00—Casings, cabinets or drawers for electric apparatus
- H05K5/02—Details
- H05K5/0217—Mechanical details of casings
-
- C—CHEMISTRY; METALLURGY
- C03—GLASS; MINERAL OR SLAG WOOL
- C03C—CHEMICAL COMPOSITION OF GLASSES, GLAZES OR VITREOUS ENAMELS; SURFACE TREATMENT OF GLASS; SURFACE TREATMENT OF FIBRES OR FILAMENTS MADE FROM GLASS, MINERALS OR SLAGS; JOINING GLASS TO GLASS OR OTHER MATERIALS
- C03C3/00—Glass compositions
- C03C3/04—Glass compositions containing silica
- C03C3/076—Glass compositions containing silica with 40% to 90% silica, by weight
- C03C3/089—Glass compositions containing silica with 40% to 90% silica, by weight containing boron
- C03C3/091—Glass compositions containing silica with 40% to 90% silica, by weight containing boron containing aluminium
- C03C3/093—Glass compositions containing silica with 40% to 90% silica, by weight containing boron containing aluminium containing zinc or zirconium
-
- C—CHEMISTRY; METALLURGY
- C03—GLASS; MINERAL OR SLAG WOOL
- C03C—CHEMICAL COMPOSITION OF GLASSES, GLAZES OR VITREOUS ENAMELS; SURFACE TREATMENT OF GLASS; SURFACE TREATMENT OF FIBRES OR FILAMENTS MADE FROM GLASS, MINERALS OR SLAGS; JOINING GLASS TO GLASS OR OTHER MATERIALS
- C03C21/00—Treatment of glass, not in the form of fibres or filaments, by diffusing ions or metals in the surface
- C03C21/001—Treatment of glass, not in the form of fibres or filaments, by diffusing ions or metals in the surface in liquid phase, e.g. molten salts, solutions
- C03C21/002—Treatment of glass, not in the form of fibres or filaments, by diffusing ions or metals in the surface in liquid phase, e.g. molten salts, solutions to perform ion-exchange between alkali ions
-
- C—CHEMISTRY; METALLURGY
- C03—GLASS; MINERAL OR SLAG WOOL
- C03C—CHEMICAL COMPOSITION OF GLASSES, GLAZES OR VITREOUS ENAMELS; SURFACE TREATMENT OF GLASS; SURFACE TREATMENT OF FIBRES OR FILAMENTS MADE FROM GLASS, MINERALS OR SLAGS; JOINING GLASS TO GLASS OR OTHER MATERIALS
- C03C3/00—Glass compositions
- C03C3/04—Glass compositions containing silica
- C03C3/076—Glass compositions containing silica with 40% to 90% silica, by weight
- C03C3/083—Glass compositions containing silica with 40% to 90% silica, by weight containing aluminium oxide or an iron compound
-
- C—CHEMISTRY; METALLURGY
- C03—GLASS; MINERAL OR SLAG WOOL
- C03C—CHEMICAL COMPOSITION OF GLASSES, GLAZES OR VITREOUS ENAMELS; SURFACE TREATMENT OF GLASS; SURFACE TREATMENT OF FIBRES OR FILAMENTS MADE FROM GLASS, MINERALS OR SLAGS; JOINING GLASS TO GLASS OR OTHER MATERIALS
- C03C3/00—Glass compositions
- C03C3/04—Glass compositions containing silica
- C03C3/076—Glass compositions containing silica with 40% to 90% silica, by weight
- C03C3/097—Glass compositions containing silica with 40% to 90% silica, by weight containing phosphorus, niobium or tantalum
-
- C—CHEMISTRY; METALLURGY
- C03—GLASS; MINERAL OR SLAG WOOL
- C03C—CHEMICAL COMPOSITION OF GLASSES, GLAZES OR VITREOUS ENAMELS; SURFACE TREATMENT OF GLASS; SURFACE TREATMENT OF FIBRES OR FILAMENTS MADE FROM GLASS, MINERALS OR SLAGS; JOINING GLASS TO GLASS OR OTHER MATERIALS
- C03C4/00—Compositions for glass with special properties
-
- H—ELECTRICITY
- H05—ELECTRIC TECHNIQUES NOT OTHERWISE PROVIDED FOR
- H05K—PRINTED CIRCUITS; CASINGS OR CONSTRUCTIONAL DETAILS OF ELECTRIC APPARATUS; MANUFACTURE OF ASSEMBLAGES OF ELECTRICAL COMPONENTS
- H05K5/00—Casings, cabinets or drawers for electric apparatus
- H05K5/0017—Casings, cabinets or drawers for electric apparatus with operator interface units
-
- H—ELECTRICITY
- H05—ELECTRIC TECHNIQUES NOT OTHERWISE PROVIDED FOR
- H05K—PRINTED CIRCUITS; CASINGS OR CONSTRUCTIONAL DETAILS OF ELECTRIC APPARATUS; MANUFACTURE OF ASSEMBLAGES OF ELECTRICAL COMPONENTS
- H05K5/00—Casings, cabinets or drawers for electric apparatus
- H05K5/02—Details
- H05K5/03—Covers
-
- H—ELECTRICITY
- H04—ELECTRIC COMMUNICATION TECHNIQUE
- H04B—TRANSMISSION
- H04B1/00—Details of transmission systems, not covered by a single one of groups H04B3/00 - H04B13/00; Details of transmission systems not characterised by the medium used for transmission
- H04B1/38—Transceivers, i.e. devices in which transmitter and receiver form a structural unit and in which at least one part is used for functions of transmitting and receiving
- H04B1/3827—Portable transceivers
- H04B1/3888—Arrangements for carrying or protecting transceivers
-
- H—ELECTRICITY
- H04—ELECTRIC COMMUNICATION TECHNIQUE
- H04M—TELEPHONIC COMMUNICATION
- H04M1/00—Substation equipment, e.g. for use by subscribers
- H04M1/02—Constructional features of telephone sets
- H04M1/0202—Portable telephone sets, e.g. cordless phones, mobile phones or bar type handsets
- H04M1/026—Details of the structure or mounting of specific components
- H04M1/0266—Details of the structure or mounting of specific components for a display module assembly
-
- Y—GENERAL TAGGING OF NEW TECHNOLOGICAL DEVELOPMENTS; GENERAL TAGGING OF CROSS-SECTIONAL TECHNOLOGIES SPANNING OVER SEVERAL SECTIONS OF THE IPC; TECHNICAL SUBJECTS COVERED BY FORMER USPC CROSS-REFERENCE ART COLLECTIONS [XRACs] AND DIGESTS
- Y02—TECHNOLOGIES OR APPLICATIONS FOR MITIGATION OR ADAPTATION AGAINST CLIMATE CHANGE
- Y02P—CLIMATE CHANGE MITIGATION TECHNOLOGIES IN THE PRODUCTION OR PROCESSING OF GOODS
- Y02P40/00—Technologies relating to the processing of minerals
- Y02P40/50—Glass production, e.g. reusing waste heat during processing or shaping
- Y02P40/57—Improving the yield, e-g- reduction of reject rates
Definitions
- This disclosure relates to glass-based articles exhibiting improved damage resistance, including improved fracture resistance, and more particularly to fusion-formable, glass and glass ceramic articles exhibiting a non-zero metal oxide concentration gradient or concentration that varies along a substantial portion of the thickness.
- This disclosure also relates to glass-based articles including a stress profile comprising two regions with varying tangents.
- thermally tempered glass has been used to prevent failures caused by the introduction of such flaws into the glass because thermally tempered glass often exhibits large compressive stress (CS) layers (e.g., approximately 21% of the total thickness of the glass), which can prevent the flaws from propagating further into the glass and thus, can prevent failure.
- CS compressive stress
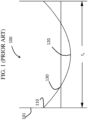
- FIG. 1 An example of a stress profile generated by thermal tempering is shown in Figure 1 .
- the thermally treated glass article 100 includes a first surface 101, a thickness t 1 , and a surface CS 110.
- the thermally treated glass article 100 exhibits a CS that decreases from the first surface 101 to a depth of compression (DOC) 130, as defined herein, at which depth the stress changes from compressive to tensile stress and reaches a maximum central tension (CT) 120.
- DOC depth of compression
- CT maximum central tension
- Thermal tempering is currently limited to thick glass-based articles (i.e., glass-based articles having a thickness t 1 of about 3 millimeters or greater) because, to achieve the thermal strengthening and the desired residual stresses, a sufficient thermal gradient must be formed between the core of such articles and the surface.
- thick articles are undesirable or not practical in many applications such as display (e.g., consumer electronics, including mobile phones, tablets, computers, navigation systems, and the like), architecture (e.g., windows, shower panels, countertops etc.), transportation (e.g., automotive, trains, aircraft, sea craft, etc.), appliance, or any application that requires superior fracture resistance but thin and light-weight articles.
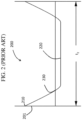
- the chemically strengthened glass-based article 200 includes a first surface 201, a thickness t 2 and a surface CS 210.
- the glass-based article 200 exhibits a CS that decreases from the first surface 201 to a DOC 230, as defined herein, at which depth the stress changes from compressive to tensile stress and reaches a maximum CT 220.
- such profiles exhibit a substantially flat CT region or CT region with a constant or near constant tensile stress along at least a portion of the CT region.
- known chemically strengthened glass-based articles exhibit a lower maximum CT value, as compared to the maximum central value shown in Figure 1 .
- glass-based articles that have relatively high compressive stress at the surface of the article, a first stress profile region having a steep slope or tangent and a second stress profile region having a less steep profile region, and methods of providing such glass articles.
- WO 2015/195419 A2 provides a glass article which is chemically strengthened to obtain a specific stress profile.
- the invention provides a glass article according to claims 1 and 4, a consumer electronic product according to claim 9, and a method of chemically strengthening a glass-based substrate according to claim 10.
- glass-based article and “glass-based substrates” are used in their broadest sense to include any object made wholly or partly of glass.
- Glass-based articles include laminates of glass and non-glass materials, laminates of glass and crystalline materials, and glass-ceramics (including an amorphous phase and a crystalline phase). Unless otherwise specified, all compositions are expressed in terms of mole percent (mol%).
- the term “softening point” refers to the temperature at which the viscosity of a glass is approximately 10 7.6 poise (P)
- the term “anneal point” refers to the temperature at which the viscosity of a glass is approximately 10 13.2 poise
- the term “200 poise temperature (T 200P )” refers to the temperature at which the viscosity of a glass is approximately 200 poise
- the term “10 11 poise temperature” refers to the temperature at which the viscosity of a glass is approximately 10 11 poise
- the term “35 kP temperature (T 35kP )” refers to the temperature at which the viscosity of a glass is approximately 35 kilopoise (kP)
- the term “160 kP temperature (T 160kP )” refers to the temperature at which the viscosity of a glass is approximately 160 kP.
- DOC refers to the depth at which the stress within the glass-based article changes compressive to tensile stress. At the DOC, the stress crosses from a positive (compressive) stress to a negative (tensile) stress (e.g., 130 in Figure 1 ) and thus exhibits a stress value of zero.
- the terms "chemical depth”, “chemical depth of layer” and “depth of chemical layer” may be used interchangeably and refer to the depth at which an ion of the metal oxide or alkali metal oxide (e.g., the metal ion or alkali metal ion) diffuses into the glass-based article and the depth at which the concentration of the ion reaches a minimum value, as determined by Electron Probe Micro-Analysis (EPMA) or Glow Discharge - Optival Emission Spectroscopy (GD-OES)).
- EPMA Electron Probe Micro-Analysis
- GD-OES Glow Discharge - Optival Emission Spectroscopy
- compressive stress is expressed as a negative ( ⁇ 0) and tenslie stress is expressed as a positive (> 0) stress.
- Described herein are thin, chemically strengthened glass-based articles that include glasses, such as silicate glasses including alkali-containing glass, and glass-ceramics that may be used as a cover glass for mobile electronic devices and touch-enabled displays.
- glasses such as silicate glasses including alkali-containing glass
- glass-ceramics that may be used as a cover glass for mobile electronic devices and touch-enabled displays.
- the glass-based articles may also be used in displays (or as display articles) (e.g., billboards, point of sale systems, computers, navigation systems, and the like), architectural articles (walls, fixtures, panels, windows, etc.), transportation articles (e.g., in automotive applications, trains, aircraft, sea craft, etc.), appliances (e.g., washers, dryers, dishwashers, refrigerators and the like), or any article that requires some fracture resistance.
- the glass-based articles described herein are thin and exhibit stress profiles that are typically only achievable through thermal tempering thick glass articles (e.g., having a thickness of about 2 mm or 3 mm or greater).
- the glass-based articles exhibit unique stress profiles along the thickness thereof.
- the glass-based articles described herein exhibit a greater surface CS than thermally tempered glass articles.
- the glass-based articles have a compressive stress layer that extends deeper into the glass-based article (in which the CS decreases and increases more gradually than known chemically strengthened glass-based articles) such that the glass-based article exhibits substantially improved fracture resistance, even when the glass-based article or a device including the same is dropped on a hard surface (e.g., granite) or a hard and rough surface (e.g., asphalt).
- the glass-based articles of one or more embodiments exhibit a greater maximum CT value than some known chemically strengthened glass substrates.
- CS and depth of penetration of potassium ions are measured using those means known in the art.
- DOC means the depth at which the stress in the chemically strengthened alkali aluminosilicate glass article described herein changes from compressive to tensile.
- DOC may be measured by FSM or a scattered light polariscope (SCALP) depending on the ion exchange treatment. Where the stress in the glass article is generated by exchanging potassium ions into the glass article, FSM is used to measure DOC.
- SCALP is used to measure DOC.
- the DOC is measured by SCALP, since it is believed the exchange depth of sodium indicates the DOC and the exchange depth of potassium ions indicates a change in the magnitude of the compressive stress (but not the change in stress from compressive to tensile); the exchange depth of potassium ions in such glass articles is measured by FSM.
- the modification includes using a glass disc as the specimen with a thickness of 5 to 10 mm and a diameter of 12.7 mm, wherein the disc is isotropic and homogeneous and core drilled with both faces polished and parallel.
- ⁇ MPa 8 F / ⁇ ⁇ D ⁇ h
- SCALP scattered light polariscope
- RNF Refracted near-field
- SCALP the maximum CT value provided by SCALP
- the stress profile measured by the RNF method is force balanced and calibrated to the maximum CT value provided by a SCALP measurement.
- the RNF method is described in U.S. Patent No. 8,854,623 , entitled "Systems and methods for measuring a profile characteristic of a glass sample”.
- the RNF method includes placing the glass-based article adjacent to a reference block, generating a polarization-switched light beam that is switched between orthogonal polarizations at a rate of between 1 Hz and 50 Hz, measuring an amount of power in the polarization-switched light beam and generating a polarization-switched reference signal, wherein the measured amounts of power in each of the orthogonal polarizations are within 50% of each other.
- the method further includes transmitting the polarization-switched light beam through the glass sample and reference block for different depths into the glass sample, then relaying the transmitted polarization-switched light beam to a signal photodetector using a relay optical system, with the signal photodetector generating a polarization-switched detector signal.
- the method also includes dividing the detector signal by the reference signal to form a normalized detector signal and determining the profile characteristic of the glass sample from the normalized detector signal.
- the RNF profile is then smoothed, and used for the CT region.
- the FSM technique is used for the surface CS and slope of the stress profile in the CS region near the surface.
- glass-based articles described herein are chemically strengthened by ion exchange and exhibit stress profiles that are distinguished from those exhibited by known strengthened glass articles.
- glass-based substrates are generally unstrengthened and glass-based articles generally refer to glass-based substrates that have been strengthened (by, for example, ion exchange).
- ions at or near the surface of the glass-based article are replaced by - or exchanged with - larger ions having the same valence or oxidation state.
- ions in the surface layer of the glass and the larger ions are monovalent alkali metal cations, such as Li + (when present in the glass-based article), Na + , K + , Rb + , and Cs + .
- monovalent cations in the surface layer may be replaced with monovalent cations other than alkali metal cations, such as Ag + or the like.
- Ion exchange processes are typically carried out by immersing a glass-based substrate in a molten salt bath (or two or more molten salt baths) containing the larger ions to be exchanged with the smaller ions in the glass-based substrate.
- a molten salt bath or two or more molten salt baths
- aqueous salt baths may also be utilized.
- the composition of the bath(s) may include more than one type of larger ion (e.g., Na+ and K+) or a single larger ion.
- parameters for the ion exchange process including, but not limited to, bath composition and temperature, immersion time, the number of immersions of the glass-based article in a salt bath (or baths), use of multiple salt baths, additional steps such as annealing, washing, and the like, are generally determined by the composition of the glass-based article (including the structure of the article and any crystalline phases present) and the desired DOL or DOC and CS of the glass-based article that results from strengthening.
- ion exchange of glass-based substrates may be achieved by immersion of the glass-based substrates in at least one molten bath containing a salt such as, but not limited to, nitrates, sulfates, and chlorides of the larger alkali metal ion.
- a salt such as, but not limited to, nitrates, sulfates, and chlorides of the larger alkali metal ion.
- Typical nitrates include KNO 3 , NaNO 3 , LiNO 3 , NaSO 4 and combinations thereof.
- the temperature of the molten salt bath typically is in a range from about 380°C up to about 450°C, while immersion times range from about 15 minutes up to about 100 hours depending on glass thickness, bath temperature and glass diffusivity. However, temperatures and immersion times different from those described above may also be used.
- the glass-based substrates may be immersed in a molten salt bath of 100% NaNO 3 having a temperature from about 370 °C to about 480 °C. In some embodiments, the glass-based substrate may be immersed in a molten mixed salt bath including from about 5% to about 90% KNO 3 and from about 10% to about 95% NaNO 3 . In some embodiments, the glass-based substrate may be immersed in a molten mixed salt bath including Na 2 SO 4 and NaNO 3 and have a wider temperature range (e.g., up to about 500 °C). In one or more embodiments, the glass-based article may be immersed in a second bath, after immersion in a first bath. Immersion in a second bath may include immersion in a molten salt bath including 100% KNO 3 for 15 minutes to 8 hours.
- the glass-based substrate may be immersed in a molten, mixed salt bath including NaNO 3 and KNO 3 (e.g., 49%/51%, 50%/50%, 51%/49%) having a temperature less than about 420 °C (e.g., about 400 °C or about 380 °C). for less than about 5 hours, or even about 4 hours or less.
- a molten, mixed salt bath including NaNO 3 and KNO 3 (e.g., 49%/51%, 50%/50%, 51%/49%) having a temperature less than about 420 °C (e.g., about 400 °C or about 380 °C). for less than about 5 hours, or even about 4 hours or less.
- Ion exchange conditions can be tailored to provide a "spike” or to increase the slope of the stress profile at or near the surface of the resulting glass-based article.
- This spike can be achieved by single bath or multiple baths, with the bath(s) having a single composition or mixed composition, due to the unique properties of the glass compositions used in the glass-based articles described herein.
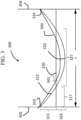
- the glass-based article 300 of one or more embodiments includes a first surface 302 and a second surface 304 opposing the first surface, defining a thickness t.
- the thickness t may be about 3 millimeters or less (e.g., in the range from about 0.01 millimeter to about 3 millimeters, from about 0.1 millimeter to about 3 millimeters, from about 0.2 millimeter to about 3 millimeters, from about 0.3 millimeter to about 3 millimeters, from about 0.4 millimeter to about 3 millimeters, from about 0.01 millimeter to about 2.5 millimeters, from about 0.01 millimeter to about 2 millimeters, from about 0.01 millimeter to about 1.5 millimeters, from about 0.01 millimeter to about 1 millimeter, from about 0.01 millimeter to about 0.9 millimeter, from about 0.01 millimeter to about 0.8 millimeter, from about 0.01 millimeter to about 0.7 millimeter
- the glass-based article includes a stress profile that extends from the first surface 302 to the second surface 304 (or along the entire length of the thickness t).
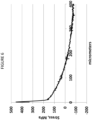
- the stress profile 312 as measured by the techniques described herein is shown along with the stress profile 340 estimated by FSM techniques as described herein.
- the y-axis represents the stress value and the x-axis represents the thickness or depth within the glass-based article.
- the stress profile 312 includes a CS layer 315 (with a surface CS 310), a CT layer 325 (with a maximum CT 320) and a DOC 317 at which the stress profile 312 turns from compressive to tensile at 330.
- the CT layer 325 also has an associated depth or length 327 (CT region or layer).
- the estimated stress profile 340 includes a DOL that is greater than the DOC.
- reference to the DOC and DOL is with respect to a depth from one surface (either the first surface 302 or the second surface 304), with the understanding that such DOC or DOL may also be present from the other surface.
- the surface CS 310 may be about 150 MPa or greater or about 200 MPa or greater (e.g., about 250 MPa or greater, about 300 MPa or greater, about 400 MPa or greater, about 450 MPa or greater, about 500 MPa or greater, or about 550 MPa or greater).
- the surface CS 310 may be up to about 900 MPa, up to about 1000 MPa, up to about 1100 MPa, or up to about 1200 MPa.
- the surface CS values provided herein may also comprise the maximum CS. In some embodiments, the surface CS is less than the maximum CS.
- the maximum CT 320 may be about 80 MPa or less, about 75 MPa or less, or about 70 MPa or less (e.g., about 60 MPa or less, about 55 MPa or less, 50 MPa or less, or about 40 MPa or less). In some embodiments, the maximum CT 320 may be in the range from about 25 MPa to about 80 MPa (e.g., from about 25 MPa to about 75 MPa, from about 25 MPa to about 70 MPa, from about 25 MPa to about 65 MPa, from about 45 MPa to about 80 MPa, from about 50 MPa to about 80 MPa, or from about 60 MPa to about 80 MPa).
- the maximum CT 320 may be positioned at a range from about 0.3• t to about 0.7• t , from about 0.4• t to about 0.6• t or from about 0.45• t to about 0.55• t . It should be noted that any one or more of surface CS 310 and maximum CT 320 may be dependent on the thickness of the glass-based article. For example, glass-based articles having at thickness of about 0.8 mm may have a maximum CT of about 75 MPa or less. When the thickness of the glass-based article decreases, the maximum CT may increase. In other words, the maximum CT increases with decreasing thickness (or as the glass-based article becomes thinner).
- the ratio of the maximum CT 320 to the surface CS 310 in the range from about 0.01 to about 0.2 e.g., in the range from about 0.01 to about 0.18, from about 0.01 to about 0.16, from about 0.01 to about 0.15, from about 0.01 to about 0.14, from about 0.01 to about 0.1, from about 0.02 to about 0.2, from about 0.04 to about 0.2, from about 0.05 to about 0.2, from about 0.06 to about 0.2, from about 0.08 to about 0.2, from about 0.1 to about 0.2, or from about 0.12 to about 0.2).
- the ratio of the maximum CT 320 to the absolute value of surface CS 310 is 0.2 or less, or about 0.15 or less.
- absolute value of surface CS may be 1.5 times (or 2 times or 2.5 times) the maximum CT or greater. In some embodiments, the absolute value of surface CS may be up to about 48 times the maximum CT, up to 40 times the maximum CT, up to 20 times the maximum CT, 10 up to times the maximum CT, or up to 8 times the maximum CT. The absolute value of surface CS may be in the range from about 5 times up to about 50 times the maximum CT.
- the stress profile 312 comprises a maximum CS, which is typically the surface CS 310 and can be found at one or both of the first surface 302 and the second surface 304.
- the CS layer or region 315 extends along a portion of the thickness to the DOC 317 and a maximum CT 320.
- the DOC 317 may be about 0.1• t or greater.
- the DOC 317 may be about 0.12• t or greater, about 0.14• t or greater, about 0.15• t or greater, about 0.16• t or greater, 0.17• t or greater, 0.18• t or greater, 0.19• t or greater, 0.20• t or greater, about 0.21• t or greater, or up to about 0.25• t .
- the DOC 317 is less than the chemical depth 342.
- the chemical depth 342 may be about 0.4• t or greater, 0.5• t or greater, about .55• t or greater, or about 0.6• t or greater.
- the stress profile 312 may be described as parabolic-like in shape.
- the stress profile along the region or depth of the glass-based article exhibiting tensile stress exhibits a parabolic-like shape.
- the stress profile 312 is free of a flat stress (i.e., compressive or tensile) portion or a portion that exhibits a substantially constant stress (i.e., compressive or tensile).
- the CT region exhibits a stress profile that is substantially free of a flat stress or free of a substantially constant stress.
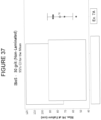
- all points of the stress profile 312 between a thickness range from about 0 t up to about 0.2• t and greater than 0.8• t (or from about 0• t to about 0.3• t and greater than 0.7• t ) comprise a tangent having a slope that is less than about -0.1 MPa/micrometers or greater than about 0.1 MPa/micrometers.
- the slope may be less than about - 0.2 MPa/micrometers or greater than about 0.2 MPa/micrometers.
- the slope may be less than about -0.3 MPa/micrometers or greater than about 0.3 MPa/micrometers.
- the slope may be less than about -0.5 MPa/micrometers or greater than about 0.5 MPa/micrometers.
- the stress profile of one or more embodiments along these thickness ranges i.e., 0• t up to about 0.2• t and greater than 0.8t, or from about 0 t to about 0.3• t and 0.7• t or greater) exclude points having a tangent with a slope, as described herein.
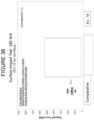
- known error function or quasi-linear stress profiles have points along these thickness ranges (i.e., from about 0• t up to about 0.2• t and greater than 0.8• t , or from about 0• t to about 0.3• t and 0.7• t or greater) that have a tangent with a slope that is in the range from about -0.1 MPa/micrometers to about 0.1 MPa/micrometers, (indicating a flat or zero slope stress profile along such thickness ranges, as shown in Figure 2 , 220).
- the glass-based articles of one or more embodiments of this disclosure do not exhibit such a stress profile having a flat or zero slope stress profile along these thickness ranges, as shown in Figure 3 .
- the glass-based article exhibits a stress profile in a thickness range from about 0.1• t to 0.3• t and from about 0.7• t to 0.9• t that comprises a tangent with a maximum slope and a tangent with a minimum slope.
- the difference between the maximum slope and the minimum slope is about 3.5 MPa/micrometers or less, about 3 MPa/micrometers or less, about 2.5 MPa/micrometers or less, or about 2 MPa/micrometers or less.
- this thickness range in which the difference between the maximum and minimum slope falls within the above ranges comprises up to about 0.02• t and greater than 0.980• t , for example up to about 0.0250• t and greater than 0.9750• t , or up to about 0.0275• t and greater than 0.9725• t , or up to about 0.030• t and greater than 0.970• t , or up to about 0.0350• t and greater than 0.9650• t .
- the glass-based article includes a stress profile 312 that is substantially free of any flat segments that extend in a depth direction or along at least a portion of the thickness t of the glass-based article.
- the stress profile 312 is substantially continuously increasing or decreasing along the thickness t.
- the stress profile is substantially free of any flat segments in a depth direction having a length of about 10 micrometers or more, about 50 micrometers or more, or about 100 micrometers or more, or about 200 micrometers or more.
- the term "flat" refers to a slope having a magnitude of less than about 5 MPa/micrometer, or less than about 2 MPa/micrometer along the flat segment.
- one or more portions of the stress profile that are substantially free of any flat segments in a depth direction are present at depths within the glass-based article of about 5 micrometers or greater (e.g., 10 micrometers or greater, or 15 micrometers or greater) from either one or both the first surface or the second surface.
- the stress profile may include linear segments, but from a depth of about 5 micrometers or greater from the first surface, the stress profile may be substantially free of flat segments.
- linear includes line segments having flat slope as well as line segments not having flat slopes; for example of the latter, see Figure 6 within a depth of about 12 microns from the surface.
- the stress profile may include linear segments at depths from about 0 t up to about 0.1t and may be substantially free of flat segments at depths of about 0.1 t to about 0.4t.
- the stress profile from a thickness in the range from about Otto about 0.1 t may have a slope in the range from about 20 MPa/microns to about 200 MPa/microns.
- such embodiments may be formed using a single ion-exchange process by which the bath includes two or more alkali salts or is a mixed alkali salt bath or multiple (e.g., 2 or more) ion exchange processes.
- the glass-based article may be described in terms of the shape of the stress profile along the CT region (327 in Figure 3 ).
- the stress profile along the CT region (where stress is in tension) may be approximated by equation.
- the stress (x) is the stress value at position x.
- the stress is positive (tension).
- MaxCT is the maximum central tension as a positive value in MPa.
- 1.5 to 5 e.g., 2 to 4, 2 to 3 or 1.8 to 2.2
- the stress profile may be modified by heat treatment.
- the heat treatment may occur before any ion-exchange processes, between ion-exchange processes, or after all ion-exchange processes.
- the heat treatment may reduce the slope of the stress profile at or near the surface.
- an ion-exchange process after the heat treatment may be utilized to provide a "spike" or to increase the slope of the stress profile at or near the surface.
- the stress profile 312 (and/or estimated stress profile 340) is generated due to a non-zero concentration of a metal oxide(s) that varies along a portion of the thickness, for example along a thickness segment of about 10 micrometers, 100 micrometers, or the entire thickness.
- concentration of a metal oxide is both non-zero and varies along a thickness range from about 0• t to about 0.3• t .
- the concentration of the metal oxide is non-zero and varies along a thickness range from about 0• t to about 0.35• t , from about 0• t to about 0.4• t , from about 0• t to about 0.45• t or from about 0• t to about 0.48• t .
- the metal oxide may be described as generating a stress in the glass-based article.
- the variation in concentration may be continuous along the above-referenced thickness ranges.
- Variation in concentration may include a change in metal oxide concentration of about 0.2 mol% along a thickness segment of about 100 micrometers. This change may be measured by known methods in the art including microprobe, as shown in Example 1.
- the metal oxide that is non-zero in concentration and varies along a portion of the thickness may be described as generating a stress in the glass-based article.
- the variation in concentration may be continuous along the above-referenced thickness ranges. In some embodiments, the variation in concentration may be continuous along thickness segments in the range from about 10 micrometers to about 30 micrometers. In some embodiments, the concentration of the metal oxide decreases from the first surface to a value at a point between the first surface and the second surface and increases from the value to the second surface.
- the concentration of metal oxide may include more than one metal oxide (e.g., a combination of Na 2 O and K 2 O).
- the concentration of ions having a larger radius is greater than the concentration of ions having a smaller radius at shallow depths, while at deeper depths, the concentration of ions having a smaller radius is greater than the concentration of ions having larger radius.
- the concentration of K+ ions in the glass-based article is greater than the concentration of Na+ ions at shallower depths, while the concentration of Na+ is greater than the concentration of K+ ions at deeper depths.
- the area at or near the surface comprises a greater CS due to the greater amount of larger ions (i.e., K+ ions) at or near the surface.
- This greater CS may be exhibited by a stress profile having a steeper slope at or near the surface (i.e., a spike in the stress profile at the surface).
- the concentration gradient or variation of one or more metal oxides is created by chemically strengthening a glass-based substrate, as previously described herein, in which a plurality of first metal ions in the glass-based substrate is exchanged with a plurality of second metal ions.
- the first ions may be ions of lithium, sodium, potassium, and rubidium.
- the second metal ions may be ions of one of sodium, potassium, rubidium, and cesium, with the proviso that the second alkali metal ion has an ionic radius greater than the ionic radius of the first alkali metal ion.
- the second metal ion is present in the glass-based substrate as an oxide thereof (e.g., Na 2 O, K 2 O, Rb 2 O, Cs 2 O or a combination thereof).
- the metal oxide concentration gradient extends through a substantial portion of the thickness t or the entire thickness t of the glass-based article, including the CT layer 327. In one or more embodiments, the concentration of the metal oxide is about 0.5 mol% or greater in the CT layer 327. In some embodiments, the concentration of the metal oxide may be about 0.5 mol% or greater (e.g., about 1 mol% or greater) along the entire thickness of the glass-based article, and is greatest at the first surface 302 and/or the second surface 304 and decreases substantially constantly to a value at a point between the first surface 302 and the second surface 304.
- the concentration of the metal oxide is the least along the entire thickness t; however the concentration is also non-zero at that point.
- the non-zero concentration of that particular metal oxide extends along a substantial portion of the thickness t (as described herein) or the entire thickness t.
- the lowest concentration in the particular metal oxide is in the CT layer 327.
- the total concentration of the particular metal oxide in the glass-based article may be in the range from about 1 mol% to about 20 mol%.
- the glass-based article includes a first metal oxide concentration and a second metal oxide concentration, such that the first metal oxide concentration is in the range from about 0 mol% to about 15 mol% along a first thickness range from about 0 t to about 0.5t, and the second metal oxide concentration is in the range from about 0 mol% to about 10 mol% from a second thickness range from about 0 micrometers to about 25 micrometers (or from about 0 micrometers to about 12 micrometers); however, the concentration of one or both the first metal oxide and the second metal oxide is non-zero along a substantial portion or the entire thickness of the glass-based article.
- the glass-based article may include an optional third metal oxide concentration.
- the first metal oxide may include Na 2 O while the second metal oxide may include K 2 O.
- the concentration of the metal oxide may be determined from a baseline amount of the metal oxide in the glass-based article prior to being modified to include the concentration gradient of such metal oxide.
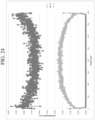
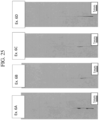
- the glass-based articles may be described in terms of how they fracture and the fragments that result from such fracture.
- the glass-based articles when fractured, fracture into 2 or more fragments per square inch (or per 6.4516 square centimeters) of the glass-based article (prior to fracture) , wherein the sample size used was a 5.08 cm by 5.08 cm (2 inch by 2 inch) square.
- the glass-based articles fracture into 3 or more, 4 or more, 5 or more, or 10 or more fragments per square inch (or per 6.4516 square centimeters) of the glass-based article (prior to fracture) , wherein the sample size used was a 5.08 cm by 5.08 cm (2 inch by 2 inch) square .
- the glass-based articles when fractured, fracture into fragments such that 50% or more of the fragments have a surface area that is less than 5%, less than 2%, or less than 1% of the surface area of the glass-based article (prior to fracture). In some embodiments, when fractured, the glass-based articles fracture into fragments such that 90% or more or even 100% of the fragments have a surface area that is less than 5%, less than 2%, or less than 1% of the surface area of the glass-based article (prior to fracture).
- the resulting stress profile 312 (and estimated stress profile 340) of the glass-based article provides improved fracture resistance.
- the glass-based article upon fracture, comprises fragments having an average longest cross-sectional dimension of less than or equal to about 0.2• t .
- the glass-based articles may exhibit a fracture toughness (K 1C ) of about 0.7 MPa ⁇ m 1/2 or greater.
- the fracture toughness may be about 0.8 MPa ⁇ m 1/2 or greater, or about 0.9 MPa ⁇ m 1/2 or greater.
- the fracture toughness may be in the range from about 0.7 MPa ⁇ m 1/2 to about 1 MP ⁇ am 1/2 .
- the fracture toughness value K 1C ) recited in this disclosure refers to a value as measured by chevron notched short bar (CNSB) method disclosed in Reddy, K.P.R. et al, "Fracture Toughness Measurement of Glass and Ceramic Materials Using Chevron-Notched Specimens," J. Am. Ceram.
- the substrate may also be characterized as having a hardness from about 500 HVN to about 800 HVN, as measured by Vickers hardness test at a load of 200 g.
- the glass-based articles described herein may exhibit a stored tensile energy in the range from greater than 0 J/m 2 to about 20 J/m 2 .
- the stored tensile energy may be in the range from about 1 J/m 2 to about 20 J/m 2 , from about 2 J/m 2 to about 20 J/m 2 , from about 3 J/m 2 to about 20 J/m 2 , from about 4 J/m 2 to about 20 J/m 2 , from about 1 J/m 2 to about 19 J/m 2 , from about 1 J/m 2 to about 18 J/m 2 , from about 1 J/m 2 to about 16 J/m 2 , from about 4 J/m 2 to about 20 J/m 2 , or from about 4 J/m 2 to about 18 J/m 2 .
- the glass-based articles described herein generally have elastic modulus or Young's modulus of less than about 80 GPa.
- the elastic modulus which is intrinsic to the composition of the glass-based article, can provide the desired high stiffness, which is an extrinsic property, to the ultimate glass-based article that is produced therefrom.
- the elastic modulus described herein will be the Young's modulus of a material, rather than, for example, shear modulus, bulk modulus, Poisson's ratio, and the like.
- the glass-based article comprises a high liquidus viscosity that enables the formation of the glass-based articles via down-draw techniques (e.g., fusion draw, slot draw, and other like methods), which can provide high precision surface smoothness.
- liquidus viscosity refers to the viscosity of a molten glass at the liquidus temperature, wherein the term “liquidus temperature” refers to the temperature at which crystals first appear as a molten glass cools down from the melting temperature (or the temperature at which the very last crystals melt away as temperature is increased from room temperature). The liquidus viscosity is determined by the following method.
- the liquidus temperature of the glass is measured in accordance with ASTM C829-81 (2015), titled “Standard Practice for Measurement of Liquidus Temperature of Glass by the Gradient Furnace Method” .
- the viscosity of the glass at the liquidus temperature is measured in accordance with ASTM C965-96(2012), titled “Standard Practice for Measuring Viscosity of Glass Above the Softening Point”.
- the glass-based articles (or the compositions used to form such articles) described herein a liquidus viscosity of about 100 kilopoise (kP) or greater.
- the glass-based articles exhibit a liquidus viscosity of at 200 kP or more (e.g., about 600 kP or greater).
- the glass-based articles exhibit a Knoop Lateral Cracking Scratch Threshold in the range from about 4 N to about 7 N, from about 4.5 N to about 7 N, from about 5 N to about 7 N, from about 4 N to about 6.5 N, from about 4 N to about 6 N, or from about 5 N to about 6 N.
- Knoop Scratch Lateral Cracking Threshold is the onset of lateral cracking (in 3 or more of 5 indentation events) which extend equal to or greater than 2 times the width of the microductile scratch groove, formed using a Knoop indenter.
- the Knoop Lateral Cracking scratch Threshold may be in the range of from about 10 to about 16 Newtons.
- Knoop Scratch Lateral Cracking Threshold is the onset of lateral cracking (in 3 or more of 5 scratch events). A series of increasing constant load scratches (3 minimum per load, but more per load could be used to increase confidence level) are performed to identify the Knoop scratch threshold. In Knoop Scratch Lateral Cracking Threshold testing, for each load, samples of the glass substrates and/or articles were scratched with a Knoop indenter over a length of 10mm with a velocity of 0.25 mm/s.
- the Knoop scratch threshold range can be determined by comparing the test specimen to one of the following 3 failure modes: 1) sustained lateral surface cracks that are more than two times the width of the groove, 2) damage is contained within the groove, but there are lateral surface cracks that are less than two times the width of groove and there is damage visible by naked eye, or 3) the presence of large subsurface lateral cracks which are greater than two times the width of the groove and/or there is a median crack at the vertex of the scratch. The scratch threshold is then the highest load at which failure does not occur in 3 or more of 5 events.
- the glass-based articles exhibit a Vickers Indentation Fracture Threshold in the range from about 10 kgf or greater, about 12 kgf or greater, or about 15 kgf or greater.
- Indentation Fracture Threshold or Vickers crack initiation threshold
- Vickers Indentation Fracture Threshold is a measure of indentation damage resistance of the glass.
- the test involved the use of a square-based pyramidal diamond indenter with an angle of 136° between faces, referred to as a Vickers indenter.
- the Vickers indenter was same as the one used in standard micro hardness testing (reference ASTM-E384-11).
- a minimum of five specimens were chosen to represent the glass type and/or pedigree of interest. For each specimen, multiple sets of five indentations were introduced to the specimen surface. Each set of five indentations was introduced at a given load, with each individual indentation separated by a minimum of 5 mm and no closer than 5 mm to a specimen edge.
- a rate of indenter loading/unloading of 50 kg/minute was used for test loads ⁇ 2 kg. For test loads ⁇ 2 kg, a rate of 5 kg/minute was used.
- a dwell (i.e., hold) time of 10 seconds at the target load was utilized. The machine maintained load control during the dwell period.
- the indentations were inspected in under reflected light using a compound microscope at 500X magnification.
- the presence or absence of median/radial cracks, or specimen fracture, was then noted for each indentation. Note that the formation of lateral cracks was not considered indicative of exhibiting threshold behavior, since the formation of median/radial cracks was of interest, or specimen fracture, for this test.
- the specimen threshold value is defined as the midpoint of the lowest consecutive indentation loads which bracket greater than 50% of the individual indentations meeting threshold.
- the specimen threshold value would be defined as the midpoint of 5 and 6 kg, or 5.5 kg.
- the sample mean threshold value is defined as the arithmetic mean of all individual specimen threshold values. Along with the mean, the range (lowest value to highest value) of all the specimen midpoints was reported for each sample. The pre-test, test and post-test environment was controlled to 23 ⁇ 2°C and 50 ⁇ 5%RH to minimize variation in the fatigue (stress corrosion) behavior of the glass specimens.
- the glass-based articles exhibit improved surface strength when subjected to abraded ring-on-ring (AROR) testing.
- the strength of a material is defined as the stress at which fracture occurs.
- the AROR test is a surface strength measurement for testing flat glass specimens, and ASTM C1499-09(2013), entitled “Standard Test Method for Monotonic Equibiaxial Flexural Strength of Advanced Ceramics at Ambient Temperature,” serves as the basis for the AROR test methodology described herein.
- ASTM C1499-09 The contents of ASTM C1499-09 are incorporated herein by reference in their entirety.
- the glass specimen is abraded prior to ring-on-ring testing with 90 grit silicon carbide (SiC) particles that are delivered to the glass sample using the method and apparatus described in Annex A2, entitled “abrasion Procedures,” of ASTM C158-02(2012), entitled “Standard Test Methods for Strength of Glass by Flexure (Determination of Modulus of Rupture).
- SiC silicon carbide
- a surface of the glass-based article Prior to ring-on-ring testing a surface of the glass-based article is abraded as described in ASTM C158-02, Annex 2, to normalize and/or control the surface defect condition of the sample using the apparatus shown in Figure A2.1 of ASTM C158-02.
- the abrasive material is typically sandblasted onto the surface 110 of the glass-based article at a load of 15 psi using an air pressure of 304 kPa (44 psi); although in the Examples below, the abrasive material was sandblasted onto the surface 110 at other loads (e.g., 25 psi or 45 psi). After air flow is established, 5 cm 3 of abrasive material is dumped into a funnel and the sample is sandblasted for 5 seconds after introduction of the abrasive material.
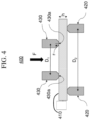
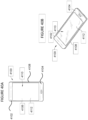
- a glass-based article having at least one abraded surface 410 as shown in Figure 4 is placed between two concentric rings of differing size to determine equibiaxial flexural strength (i.e., the maximum stress that a material is capable of sustaining when subjected to flexure between two concentric rings), as also shown in Figure 4 .
- the abraded glass-based article 410 is supported by a support ring 420 having a diameter D2.
- a force F is applied by a load cell (not shown) to the surface of the glass-based article by a loading ring 430 having a diameter D1.
- the ratio of diameters of the loading ring and support ring D1/D2 may be in a range from about 0.2 to about 0.5. In some embodiments, D1/D2 is about 0.5.
- Loading and support rings 130, 120 should be aligned concentrically to within 0.5% of support ring diameter D2.
- the load cell used for testing should be accurate to within ⁇ 1% at any load within a selected range. In some embodiments, testing is carried out at a temperature of 23 ⁇ 2°C and a relative humidity of 40 ⁇ 10%.
- Loading and support rings 430, 420 are typically made of hardened steel with hardness HRc > 40. AROR fixtures are commercially available.
- the intended failure mechanism for the AROR test is to observe fracture of the glass-based article 410 originating from the surface 430a within the loading ring 430. Failures that occur outside of this region - i.e., between the loading rings 430 and support rings 420 - are omitted from data analysis. Due to the thinness and high strength of the glass-based article 410, however, large deflections that exceed 1 ⁇ 2 of the specimen thickness h are sometimes observed. It is therefore not uncommon to observe a high percentage of failures originating from underneath the loading ring 430. Stress cannot be accurately calculated without knowledge of stress development both inside and under the ring (collected via strain gauge analysis) and the origin of failure in each specimen. AROR testing therefore focuses on peak load at failure as the measured response.
- the strength of glass-based article depends on the presence of surface flaws. However, the likelihood of a flaw of a given size being present cannot be precisely predicted, as the strength of glass is statistical in nature. A probability distribution can therefore generally be used as a statistical representation of the data obtained.
- the glass-based articles described herein have a surface or equibiaxial flexural strength of 20 kgf or more, and up to about 30 kgf as determined by AROR testing using a load of 172.4 kPa (25 psi) or even 310.3 kPa (45 psi) to abrade the surface.
- the surface strength is 25 kgf or more, and in still other embodiments, 30 kgf or more.
- the glass-based articles described herein may be described in terms of performance in an inverted ball on sandpaper (IBoS) test.
- IBoS inverted ball on sandpaper
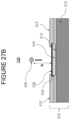
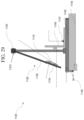
- the IBoS test is a dynamic component level test that mimics the dominant mechanism for failure due to damage introduction plus bending that typically occurs in glass-based articles that are used in mobile or hand held electronic devices, as schematically shown in Figure 27A .
- damage introduction (a in Figure 27A ) occurs on the top surface of the glass-based article. Fracture initiates on the top surface of the glass-based article and damage either penetrates the glass-based article (b in Figure 27A ) or the fracture propagates from bending on the top surface or from the interior portions of the glass-based article (c in Figure 27A ).
- the IBoS test is designed to simultaneously introduce damage to the surface of the glass and apply bending under dynamic load.
- the glass-based article exhibits improved drop performance when it includes a compressive stress than if the same glass-based article does not include a compressive stress.
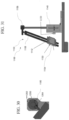
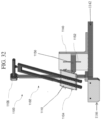
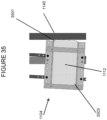
- Apparatus 500 includes a test stand 510 and a ball 530.
- Ball 530 is a rigid or solid ball such as, for example, a stainless steel ball, or the like. In one embodiment, ball 530 is a 4.2 gram stainless steel ball having diameter of 10 mm.
- the ball 530 is dropped directly onto the glass-based article sample 518 from a predetermined height h.
- Test stand 510 includes a solid base 512 comprising a hard, rigid material such as granite or the like.
- a sheet 514 having an abrasive material disposed on a surface is placed on the upper surface of the solid base 512 such that surface with the abrasive material faces upward.
- sheet 514 is sandpaper having a 30 grit surface and, in other embodiments, a 180 grit surface.
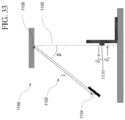
- the glass-based article sample 518 is held in place above sheet 514 by sample holder 515 such that an air gap 516 exists between glass-based article sample 518 and sheet 514.
- the air gap 516 between sheet 514 and glass-based article sample 518 allows the glass-based article sample 518 to bend upon impact by ball 530 and onto the abrasive surface of sheet 514.
- the glass-based article sample 518 is clamped across all corners to keep bending contained only to the point of ball impact and to ensure repeatability.
- sample holder 514 and test stand 510 are adapted to accommodate sample thicknesses of up to about 2 mm.
- the air gap 516 is in a range from about 50 ⁇ m to about 100 ⁇ m. Air gap 516 is adapted to adjust for difference of material stiffness (Young's modulus, Emod), but also includes the elastic modulus and thickness of the sample.
- An adhesive tape 520 may be used to cover the upper surface of the glass-based article sample to collect fragments in the event of fracture of the glass-based article sample 518 upon impact of ball 530.
- the abrasive surface is sandpaper, such as silicon carbide or alumina sandpaper, engineered sandpaper, or any abrasive material known to those skilled in the art for having comparable hardness and/or sharpness.
- sandpaper having 30 grit may be used, as it has a surface topography that is more consistent than either concrete or asphalt, and a particle size and sharpness that produces the desired level of specimen surface damage.
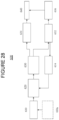
- a method 600 of conducting the IBoS test using the apparatus 500 described hereinabove is shown in Figure 28 .
- Step 610 a glass-based article sample (218 in Figure 36 ) is placed in the test stand 510, described previously and secured in sample holder 515 such that an air gap 516 is formed between the glass-based article sample 518 and sheet 514 with an abrasive surface.
- Method 600 presumes that the sheet 514 with an abrasive surface has already been placed in test stand 510. In some embodiments, however, the method may include placing sheet 514 in test stand 510 such that the surface with abrasive material faces upward.
- an adhesive tape 520 is applied to the upper surface of the glass-based article sample 518 prior to securing the glass-based article sample 518 in the sample holder 510.
- Step 520 a solid ball 530 of predetermined mass and size is dropped from a predetermined height h onto the upper surface of the glass-based article sample 518, such that the ball 530 impacts the upper surface (or adhesive tape 520 affixed to the upper surface) at approximately the center (i.e., within 1 mm, or within 3 mm, or within 5 mm, or within 10 mm of the center) of the upper surface.
- the extent of damage to the glass-based article sample 518 is determined (Step 630).
- the term "fracture” means that a crack propagates across the entire thickness and/or entire surface of a substrate when the substrate is dropped or impacted by an object.
- the sheet 518 with the abrasive surface may be replaced after each drop to avoid "aging" effects that have been observed in repeated use of other types (e.g., concrete or asphalt) of drop test surfaces.
- Various predetermined drop heights h and increments are typically used in method 600.
- the test may, for example, utilize a minimum drop height to start (e.g., about 10-20 cm). The height may then be increased for successive drops by either a set increment or variable increments.
- the test described in method 600 is stopped once the glass-based article sample 518 breaks or fractures (Step 631). Alternatively, if the drop height h reaches the maximum drop height (e.g., about 100 cm) without fracture, the drop test of method 300 may also be stopped, or Step 520 may be repeated at the maximum height until fracture occurs.
- IBoS test of method 600 is performed only once on each glass-based article sample 518 at each predetermined height h. In other embodiments, however, each sample may be subjected to multiple tests at each height.
- Step 640 If fracture of the glass-based article sample 518 has occurred (Step 631 in Figure 28 ), the IBoS test according to method 600 is ended (Step 640). If no fracture resulting from the ball drop at the predetermined drop height is observed (Step 632), the drop height is increased by a predetermined increment (Step 634) - such as, for example 5, 10, or 20 cm - and Steps 620 and 630 are repeated until either sample fracture is observed (631) or the maximum test height is reached (636) without sample fracture. When either Step 631 or 636 is reached, the test according to method 600 is ended.
- a predetermined increment such as, for example 5, 10, or 20 cm -
- embodiments of the glass-based article described herein have about a 60% or more survival rate when the ball is dropped onto the surface of the glass from a height of 100 cm.
- a glass-based article is described as having a 60% survival rate when dropped from a given height when three of five identical (or nearly identical) samples (i.e., having approximately the same composition and, when strengthened, approximately the same compressive stress and depth of compression or compressive stress layer, as described herein) survive the IBoS drop test without fracture when dropped from the prescribed height (here 100 cm).
- the survival rate in the 100 cm IBoS test of the glass-based articles that are strengthened is about 70% or more, in other embodiments, about 80% or more, and, in still other embodiments, about 90% or more.
- the survival rate of the strengthened glass-based articles dropped from a height of 100 cm in the IBoS test is about 60% or more, in other embodiments, about 70% or more, in still other embodiments, about 80% or more, and, in other embodiments, about 90% or more.
- the survival rate of the strengthened glass-based articles dropped from a height of 150 cm in the IBoS test is about 60% or more, in other embodiments, about 70% or more, in still other embodiments, about 80% or more, and, in other embodiments, about 90% or more.
- At least five identical (or nearly identical) samples i.e., having approximately the same composition and, if strengthened, approximately the same compressive stress and depth of compression or layer
- larger numbers e.g., 10, 20, 30, etc.
- Each sample is dropped a single time from the predetermined height (e.g., 100 cm or 150 cm) or, alternatively, dropped from progressively higher heights without fracture until the predetermined height is reached, and visually (i.e., with the naked eye) examined for evidence of fracture (crack formation and propagation across the entire thickness and/or entire surface of a sample).
- a sample is deemed to have "survived” the drop test if no fracture is observed after being dropped from the predetermined height, and a sample is deemed to have "failed (or "not survived") if fracture is observed when the sample is dropped from a height that is less than or equal to the predetermined height.
- the survivability rate is determined to be the percentage of the sample population that survived the drop test. For example, if 7 samples out of a group of 10 did not fracture when dropped from the predetermined height, the survivability rate of the glass would be 70%.
- Apparatus 1100 comprises a pendulum 1102 including a bob 1104 attached to a pivot 1106.
- a bob on a pendulum is a weight suspended from the pivot and connected to a pivot by an arm.
- the bob 1104 shown in the Figures is connected to the pivot 1106 by arm 1108, which may be in the form of a string, or a rod or a plurality of rods, such as two rods as shown.
- the bob 1104 has an equilibrium position 1105 shown as dotted line such that the angle ⁇ is zero. In other words, the arm 1108 is not in a raised position.
- the bob 1104 includes a base 1110 for receiving a brittle substrate.
- the base 1110 for receiving a brittle substrate 1112 having two ends 1114, 1116, an inner surface 1113 and an outer surface 1115.
- the base 1110 has a first end 1120 and a second end 1122, and a curved surface 1124 defining a radius of curvature between the first end 1120 and the second end 1122.
- Suitable material for the base 1110 is metal.
- the curved surface 1124 has an apex 1125.
- the apparatus 1100 further includes a first fixture 1130 and a second fixture 1132 to hold two ends 1114, 1116 of the brittle substrate 1112 and to apply a force to bend the brittle substrate 1112 about the curved surface 1124 and to conform the brittle substrate to the radius of curvature.
- the brittle substrate has an apex 1127 conforming to the apex 1125 of the curved surface 1124.
- the curved surface 1124 and the curvature of the brittle substrate 1112 can be a fixed radius or a compound radius.
- the first fixture 1130 and the second fixture 1132 each are a clamp, toggle clamps as shown in FIGURE 34 .
- the apparatus 1100 further includes a roughened surface, which is an abrasive sheet having an abrasive surface to be placed in contact with the outer surface 1115 (or corners 3501, 3503, etc., as shown in Figure 35 ) of the substrate 1112.
- the abrasive sheet is attached to impact surface 1150 (of impacting object 1140 described below) by double sided tape, with the abrasive surface of the abrasive sheet facing toward the curved surface 1124 on which the substrate 1112 is mounted.
- One suitable abrasive sheet is Indasa Rhynowet ® Plus Line P180 grit sandpaper.
- the sandpaper according to one or more embodiments is cut in 25 mm square pieces, and the sandpaper is flattened if the pieces are bent during the cutting process.
- the apparatus 1100 further includes an impacting object 1140 positioned such that when the bob 1104 is released from a position at an angle ⁇ greater than zero from the equilibrium position 1105, the curved surface 1124 of the bob 1104 (or a substrate 1112 mounted on the curved surface 1124) contacts the impact surface 1150 (or the abrasive side of an abrasive sheet disposed on the impact surface 1150) of the impacting object 1140.
- the impacting object 1140 is a L-shaped bracket affixed to platform 1142, and the impacting object 1140 is affixed to the platform 1142 by screw 1144.
- the impacting object 1140 could also be affixed by any other suitable mechanism such as a bolt, rivet, clamp, etc.
- the platform 1142 includes a stopper 1146, which permits the apparatus 1100 to be held at the end of work bench 1148.
- the impacting object 1140 is fixed and does not move when the bob 1104 contacts the impacting object 1140 at impact surface 1150.
- the impact surface 1150 may be a separate element that is movable in the x-y plane as best seen in FIGURE 32 within slot 1152. Alternatively, the impact surface 1150 need not move relative to the impacting object 1140.
- the bob 1104 and base 1110 are sized and shaped such that when a brittle substrate is affixed to the base 1110 and when the bob 1104 is released from a position at an angle ⁇ greater than zero from the equilibrium position 1105, the brittle substrate 1112 is subjected to a bending radius and an impact force that simulate a bending radius of a chemically strengthened cover glass of a mobile phone or tablet device when the mobile phone or tablet device is dropped on a ground surface by a user of the mobile phone or tablet device.
- the radius of curvature of the curved surface 1124 on the base 1110 is selected to provide a bending tensile force of 100 MPa when a substrate is bent around the curved surface 1124 such that the tensile force is an externally applied tensile force that results from the stress of bending the substrate.
- the tensile force is at the apex 1125 of the brittle substrate.
- the radius of curvature is in the range of 0.25 m and 1.5 m, for example, in the range of 0.5 m and 1 m.
- the first fixture 1130 and second fixture 1132 are spaced apart at a distance of a cover glass length for a mobile phone or a tablet. In specific embodiments, the first fixture 1130 and second fixture 1132 are spaced apart at a distance in the range of 50 mm and 500 mm.
- Another aspect of the disclosure pertains to a method of impact testing a brittle sheet, the surface Impact Threshold Test method comprising: bending the brittle sheet having a contact surface to provide a bent sheet having a radius of curvature and an apex on the contact surface; and impacting the bent sheet at the apex with an impacting object using a pendulum.
- the bent sheet is attached to a pendulum bob.
- the bent sheet attached to a pendulum bob is positioned such that the impacting object contacts the apex of the contact surface.
- the brittle sheet is glass and the radius of curvature is in a range that simulates a bending radius of a chemically or thermally strengthened cover glass of a mobile phone or tablet device when the mobile phone or tablet device is dropped on a ground surface by a user of the mobile phone or tablet device, wherein the drop event is such that an edge of the device contacts the ground first (as opposed to a face first drop wherein the device generally hits the ground in an orientation such that the contact surface is generally parallel to the ground).
- At least five identical (or nearly identical) samples i.e., having approximately the same composition and, if strengthened, approximately the same compressive stress and depth of compression or layer
- larger numbers e.g., 10, 20, 30, etc.
- an abrasive sheet is placed on the impact surface 1150 in a position so as to contact the apex of the brittle sheet upon a swinging movement of the arm 1108.
- the brittle sheet is secured to the impacting object with double sided tape.
- Another embodiment pertains to a method of impact testing a brittle sheet, the method comprising attaching a brittle sheet to a pendulum bob to expose a contact surface on the brittle sheet; and moving the pendulum bob with the brittle sheet attached to the pendulum bob to cause the contact surface to contact an impact object.
- the method includes bending the brittle sheet to provide a bent sheet having a radius of curvature and an apex on the contact surface.
- the bent sheet attached to a pendulum bob is positioned such that the impact object contacts the apex of the contact surface.
- the brittle sheet is glass and the radius of curvature is in a range that simulates a bending radius of a chemically or thermally strengthened cover glass of a mobile phone or tablet device when the mobile phone or tablet device is dropped on a ground surface by a user of the mobile phone or tablet device, wherein the drop event is such that an edge of the device contacts the ground first (as opposed to a face first drop wherein the device generally hits the ground in an orientation such that the contact surface is generally parallel to the ground).
- the brittle sheet is secured to a curved surface prior to impacting the apex with the impacting object.
- the pointer notch 1200 enables alignment with a variety of test positions 1202, which may be any suitable number of test positions, for example 1, 2, 3, 4, 5, 6, 7, 8, 9, 10,and so on incrementally up to 50 or more.
- the apparatus 1100 may further include a lock, which may be in the form of nut 1204 to lock the arm 1108 in the desired rotational orientation about its central longitudinal axis so as to square the base 1110 with the impact surface 1150 of the impacting object 1140.
- the apparatus 1100 simulates an actual phone drop event according to one or more embodiments.
- m mass of the pendulum 1102 (including swing arm 1108, bob 1104, and base 1110)
- L length of arm
- g acceleration of free fall
- vf is the initial impact velocity (i.e., the velocity at the point when the glass first contacts the impact surface 1150 of the impacting object 1140)
- vi is the final impact velocity (i.e., the velocity at which the glass leaves the impact surface 1150 of the impacting object 1140, or in other words at the point when the glass first separates from the impact surface 1150 of the impacting object 1140)
- ⁇ t contact interaction time (i.e., the time during which the glass is in contact with the impact surface 1150 of the impacting object 1140).
- the contact interaction time is measured by high-speed video camera by observing the number of frames during which the glass is in contact with the impact surface 1150, and multiplying by the number of frames taken per unit time by the high-speed video camera.
- the average force equation is useful for samples that have not been broken already, i.e., the samples loaded into the apparatus 1100 prior to the test are ones that have not already been broken.
- an impact force can be calculated and used to simulate impacts on a device when dropped from a specific height. For example, the average force experienced by a substrate cover glass on a 130 g mobile phone device when dropped from 1 meter height has been calculated to be 800 N. Using the mass, arm length and angle ⁇ , this force can be replicated using the apparatus 1100 shown in Figures 29-34 .
- the bob 1104 may be repositioned so that an edge of the substrate 1112 may be impacted by the impacting object, according to the edge Impact Threshold Test.
- the impact surface 1150 of the impacting object 1140 is not raised, but is simply a planar portion of the impacting object 1140 facing toward the bob 1140.
- a corner 3501 of the substrate 1112 contacts with the impacting object 1140 to which an abrasive sheet is attached, in the same manner as described above.
- this orientation simulates a drop of an electronic device onto its edge so that the impact energy a substrate edge is able to withstand is then determined in a similar manner as set forth above.
- the substrate 1112 is tested at each corner only once, and is tested so that the top portion of the edge of the substrate is made the point of impact with the impacting object 1140.
- the corner 3501 is tested first, and then at an incrementally higher pendulum height the opposite corner 3503 is tested.
- No more than one impact test is performed at the same location on a sample, so as to avoid accumulation of damage introductions.
- At least five identical (or nearly identical) samples i.e., having approximately the same composition and, if strengthened, approximately the same compressive stress and depth of compression or layer
- larger numbers e.g., 10, 20, 30, etc.
- the glass-based articles described herein may be transparent.
- the glass-based article may have a thickness of about 1 millimeter or less and exhibit a transmittance of about 88% or greater over a wavelength in the range from about 380 nm to about 780 nm.
- the glass-based article may also exhibit a substantially white color.
- the glass-based article may exhibit CIELAB color space coordinates, under a CIE illuminant F02, of L* values of about 88 and greater, a* values in the range from about -3 to about +3, and b* values in the range from about -6 to about +6.
- the glass-based article may be described as having a high cation diffusivity for ion exchange.
- the glass or glass-ceramic has fast ion-exchange capability, i.e., where diffusivity is greater than 500 ⁇ m 2 /hr. or may be characterized as greater than 450 ⁇ m 2 /hour at 460 °C.
- Diffusivity DOL ⁇ 2 / 5.6 ⁇ T in which DOL is depth of ion-exchange layer and T is the IOX time it takes to reach that DOL.
- the glass-based article may include an amorphous substrate, a crystalline substrate or a combination thereof (e.g., a glass-ceramic substrate).
- the glass-based article substrate (prior to being chemically strengthened as described herein) may include a glass composition, in mole percent (mole%), including: SiO 2 in the range from about 40 to about 80, Al 2 O 3 in the range from about 10 to about 30, B 2 O 3 in the range from about 0 to about 10, R 2 O in the range from about 0 to about 20, and RO in the range from about 0 to about 15.
- the composition may include either one or both of ZrO 2 in the range from about 0 mol% to about 5 mol% and P 2 O 5 in the range from about 0 to about 15 mol%.
- TiO2 can be present from about 0 mol% to about 2 mol%.
- the glass composition may include SiO 2 in an amount, in mol%, in the range from about 45 to about 80, from about 45 to about 75, from about 45 to about 70, from about 45 to about 65, from about 45 to about 60, from about 45 to about 65, from about 45 to about 65, from about 50 to about 70, from about 55 to about 70, from about 60 to about 70, from about 70 to about 75, from about 70 to about 72, or from about 50 to about 65.
- the glass composition may include Al 2 O 3 in an amount, in mol%, in the range from about 5 to about 28, from about 5 to about 26, from about 5 to about 25, from about 5 to about 24, from about 5 to about 22, from about 5 to about 20, from about 6 to about 30, from about 8 to about 30, from about 10 to about 30, from about 12 to about 30, from about 14 to about 30, from about 16 to about 30, from about 18 to about 30, from about 18 to about 28, or from about 12 to about 15.
- the glass composition may include B 2 O 3 in an amount, in mol%, in the range from about 0 to about 8, from about 0 to about 6, from about 0 to about 4, from about 0.1 to about 8, from about 0.1 to about 6, from about 0.1 to about 4, from about 1 to about 10, from about 2 to about 10, from about 4 to about 10, from about 2 to about 8, from about 0.1 to about 5, or from about 1 to about 3.
- the glass composition may be substantially free of B 2 O 3 .
- the phrase "substantially free" with respect to the components of the glass composition means that the component is not actively or intentionally added to the glass compositions during initial batching or subsequent ion exchange, but may be present as an impurity.
- a glass may be describe as being substantially free of a component, when the component is present in an amount of less than about 0.1001 mol%.
- the glass composition may include one or more alkali earth metal oxides, such as MgO, CaO and ZnO.
- the total amount of the one or more alkali earth metal oxides may be a non-zero amount up to about 15 mol%.
- the total amount of any of the alkali earth metal oxides may be a non-zero amount up to about 14 mol%, up to about 12 mol%, up to about 10 mol%, up to about 8 mol%, up to about 6 mol%, up to about 4 mol%, up to about 2 mol%, or up about 1.5 mol%.
- the total amount, in mol%, of the one or more alkali earth metal oxides may be in the range from about 0.1 to 10, from about 0.1 to 8, from about 0.1 to 6, from about 0.1 to 5, from about 1 to 10, from about 2 to 10, or from about 2.5 to 8.
- the amount of MgO may be in the range from about 0 mol% to about 5 mol% (e.g., from about 2 mol% to about 4 mol%, from about 0.01 to about 2, or from about 0.001 to about 1).
- the amount of ZnO may be in the range from about 0 to about 2 mol% (e.g., from about 1 to about 2).
- the amount of CaO may be from about 0 mol% to about 2 mol%.
- the glass composition may include MgO and may be substantially free of CaO and ZnO. In one variant, the glass composition may include any one of CaO or ZnO and may be substantially free of the others of MgO, CaO and ZnO. In one or more specific embodiments, the glass composition may include only two of the alkali earth metal oxides of MgO, CaO and ZnO and may be substantially free of the third of the earth metal oxides.
- the total amount, in mol%, of alkali metal oxides R 2 O in the glass composition may be in the range from about 5 to about 20, from about 5 to about 18, from about 5 to about 16, from about 5 to about 15, from about 5 to about 14, from about 5 to about 12, from about 5 to about 10, from about 5 to about 8, from about 5 to about 20, from about 6 to about 20, from about 7 to about 20, from about 8 to about 20, from about 9 to about 20, from about 10 to about 20, from about 11 to about 20, from about 12 to about 18, or from about 14 to about 18.
- the glass composition includes Na 2 O in an amount in the range from about 0 mol% to about 18 mol%, from about 0 mol% to about 16 mol% or from about 0 mol% to about 14 mol%, from about 0 mol% to about 12 mol%, from about 2 mol% to about 18 mol%, from about 4 mol% to about 18 mol%, from about 6 mol% to about 18 mol%, from about 8 mol% to about 18 mol%, from about 8 mol% to about 14 mol%, from about 8 mol% to about 12 mol%, or from about 10 mol% to about 12 mol%.
- the composition may include about 4 mol% or more Na 2 O.
- the amount of Li 2 O and Na 2 O is controlled to a specific amount or ratio to balance formability and ion exchangeability. For example, as the amount of Li 2 O increases, the liquidus viscosity may be reduced, thus preventing some forming methods from being used; however, such glass compositions are ion exchanged to deeper DOC levels, as described herein.
- the amount of Na 2 O can modify liquidus viscosity but can inhibit ion exchange to deeper DOC levels.
- the glass composition may include K 2 O in an amount less than about 5 mol%, less than about 4 mol%, less than about 3 mol%, less than about 2 mol%, or less than about 1 mol%. In one or more alternative embodiments, the glass composition may be substantially free, as defined herein, of K 2 O.
- the glass composition may include Li 2 O in an amount about 0 mol% to about 18 mol%, from about 0 mol% to about 15 mol% or from about 0 mol% to about 10 mol%, from about 0 mol% to about 8 mol%, from about 0 mol% to about 6 mol%, from about 0 mol% to about 4 mol% or from about 0 mol% to about 2 mol%.
- the glass composition may include Li 2 O in an amount about 2 mol% to about 10 mol%, from about 4 mol% to about 10 mol%, from about 6 mol% to about 10 mol, or from about 5 mol% to about 8 mol%.
- the glass composition may be substantially free, as defined herein, of Li 2 O.
- the glass composition may include Fe 2 O 3 .
- Fe 2 O 3 may be present in an amount less than about 1 mol%, less than about 0.9 mol%, less than about 0.8 mol%, less than about 0.7 mol%, less than about 0.6 mol%, less than about 0.5 mol%, less than about 0.4 mol%, less than about 0.3 mol%, less than about 0.2 mol%, less than about 0.1 mol% and all ranges and sub-ranges therebetween.
- the glass composition may be substantially free, as defined herein, of Fe 2 O 3 .
- the glass composition may include ZrO 2 .
- ZrO 2 may be present in an amount less than about 1 mol%, less than about 0.9 mol%, less than about 0.8 mol%, less than about 0.7 mol%, less than about 0.6 mol%, less than about 0.5 mol%, less than about 0.4 mol%, less than about 0.3 mol%, less than about 0.2 mol%, less than about 0.1 mol% and all ranges and sub-ranges therebetween.
- the glass composition may be substantially free, as defined herein, of ZrO 2 .
- the glass composition may include P 2 O 5 in a range from about 0 mol% to about 10 mol%, from about 0 mol% to about 8 mol%, from about 0 mol% to about 6mol%, from about 0 mol% to about 4 mol%, from about 0.1 mol% to about 10 mol%, from about 0.1 mol% to about 8 mol%, from about 2 mol% to about 8 mol%, from about 2 mol% to about 6 mol% or from about 2 mol% to about 4 mol%.
- the glass composition may be substantially free of P 2 O 5 .
- the glass composition may include TiO 2 .
- TiO 2 may be present in an amount less than about 6 mol%, less than about 4 mol%, less than about 2 mol%, or less than about 1 mol%.
- the glass composition may be substantially free, as defined herein, of TiO 2 .
- TiO 2 is present in an amount in the range from about 0.1 mol% to about 6 mol%, or from about 0.1 mol% to about 4 mol%.
- the glass composition may include various compositional relationships.
- the glass composition may include a ratio of the amount of Li 2 O (in mol%) to the total amount of R 2 O (in mol%) in the range from about 0 to about 1, from about 0 to about 0.5, from about 0 to about 0.4, from about 0.1 to about 0.5, or from about 0.2 to about 0.4.
- the glass composition may include a difference between the total amount of R 2 O (in mol%) to the amount of Al 2 O 3 (in mol%) (R 2 O - Al 2 O 3 ) in the range from about 0 to about 5 (e.g., from about 0 to about 4, from about 0 to about 3, from about 0.1 to about 4, from about 0.1 to about 3, from about 0.1 to about 2 or from about 1 to about 2).
- the glass composition may include a difference between the total amount of R x O (in mol%) to the amount of Al 2 O 3 (in mol%) (R x O-Al 2 O 3 ) in the range from about 0 to about 5 (e.g., from about 0 to about 4, from about 0 to about 3, from about 0.1 to about 4, from about 0.1 to about 3, from about 1 to about 3, or from about 2 to about 3).
- the glass composition may include a ratio of the total amount of R 2 O (in mol%) to the amount of Al 2 O 3 (in mol%) (R 2 O/Al 2 O 3 ) in the range from about 0 to about 5 (e.g., from about 0 to about 4, from about 0 to about 3, from about 1 to about 4, from about 1 to about 3, or from about 1 to about 2).
- the glass composition includes a combined amount of Al 2 O 3 and Na 2 O greater than about 15 mol% (e.g., greater than 18 mol%, greater than about 20 mol%, or greater than about 23 mol%).
- the combined amount of Al 2 O 3 and Na 2 O may be up to and including about 30 mol%, about 32 mol% or about 35 mol%.
- the glass composition of one or more embodiments may exhibit a ratio of the amount of MgO (in mol%) to the total amount of RO (in mol%) in the range from about 0 to about 2.
- glass composition may be substantially free of nucleating agents.
- nucleating agents are TiO 2 , ZrO 2 and the like.
- Nucleating agents may be described in terms of function in that nucleating agents are constituents in the glass can initiate the formation of crystallites in the glass.
- the compositions used for the glass substrate may be batched with 0-2 mol% of at least one fining agent selected from a group that includes Na 2 SO 4 , NaCl, NaF, NaBr, K 2 SO 4 , KCl, KF, KBr, and SnO 2 .
- the glass composition according to one or more embodiments may further include SnO 2 in the range from about 0 to about 2, from about 0 to about 1, from about 0.1 to about 2, from about 0.1 to about 1, or from about 1 to about 2.
- the glass compositions disclosed herein may be substantially free of As 2 O 3 and/or Sb 2 O 3 .
- the composition may specifically include 62 mol% to 75 mol% SiO 2 ; 10.5 mol% to about 17 mol% Al 2 O 3 ; 5 mol% to about 13 mol% Li 2 O; 0 mol% to about 4 mol% ZnO; 0 mol% to about 8 mol% MgO; 2 mol% to about 5 mol% TiO 2 ; 0 mol% to about 4 mol% B 2 O 3 ; 0 mol% to about 5 mol% Na 2 O; 0 mol% to about 4 mol% K 2 O; 0 mol% to about 2 mol% ZrO 2 ; 0 mol% to about 7 mol% P 2 O 5 ; 0 mol% to about 0.3 mol% Fe 2 O 3 ; 0 mol% to about 2 mol% MnOx; and 0.05 mol% to about0.2 mol% SnO 2 .
- the composition may include 67 mol% to about 74 mol% SiO 2 ; 11 mol% to about 15 mol% Al 2 O 3 ; 5.5 mol% to about 9 mol% Li 2 O; 0.5 mol% to about 2 mol% ZnO; 2 mol% to about 4.5 mol% MgO; 3 mol% to about 4.5 mol% TiO 2 ; 0 mol% to about 2.2 mol% B 2 O 3 ; 0 mol% to about 1 mol% Na 2 O; 0 mol% to about 1 mol% K 2 O; 0 mol% to about 1 mol% ZrO 2 ; 0 mol% to about 4 mol% P 2 O 5 ; 0 mol% to about 0.1 mol% Fe 2 O 3 ; 0 mol% to about 1.5 mol% MnOx; and 0.08 mol% to about 0.16 mol%SnO 2 .
- the composition may include 70 mol% to 75 mol% SiO 2 ; 10 mol% to about 15 mol% Al 2 O 3 ; 5 mol% to about 13 mol% Li 2 O; 0 mol% to about 4 mol% ZnO; 0.1 mol% to about 8 mol% MgO; 0 mol% to about 5 mol% TiO 2 ; 0.1 mol% to about 4 mol% B 2 O 3 ; 0.1 mol% to about 5 mol% Na 2 O; 0 mol% to about 4 mol% K 2 O; 0 mol% to about 2 mol% ZrO 2 ; 0 mol% to about 7 mol% P 2 O 5 ; 0 mol% to about 0.3 mol% Fe 2 O 3 ; 0 mol% to about 2 mol% MnOx; and 0.05 mol% to about0.2 mol% SnO 2 .
- the composition may include 52 mol% to about 65 mol% SiO 2 ; 14 mol% to about 18 mol% Al 2 O 3 ; 5.5 mol% to about 7 mol% Li 2 O; 1 mol% to about 2 mol% ZnO; 0.01 mol% to about 2 mol% MgO; 4 mol% to about 12 mol% Na 2 O; 0.1 mol% to about 4 mol% P 2 O 5 ; and 0.01 mol% to about 0.16 mol%SnO 2 .
- the composition may be substantially free of any one or more of B 2 O 3 , TiO 2 , K 2 O and ZrO 2 .
- the composition may include 0.5 mol% or more P 2 O 5 , Na 2 O and, optionally, Li 2 O, where Li 2 O(mol%)/Na 2 O(mol%) ⁇ 1.
- these compositions may be substantially free of B 2 O 3 and K 2 O.
- the composition may include ZnO, MgO, and SnO 2 .
- the composition may comprise: from about 58 mol% to about 65 mol% SiO 2 ; from about 11 mol% to about 19 mol% Al 2 O 3 ; from about 0.5 mol% to about 3 mol% P 2 O 5 ; from about 6 mol% to about 18 mol% Na 2 O; from 0 mol% to about 6 mol% MgO; and from 0 mol% to about 6 mol% ZnO.
- the composition may comprise from about 63 mol% to about 65 mol% SiO 2 ; from 11 mol% to about 17 mol% Al 2 O 3 ; from about 1 mol% to about 3 mol% P 2 O 5 ; from about 9 mol% to about 20 mol% Na 2 O; from 0 mol% to about 6 mol% MgO; and from 0 mol% to about 6 mol% ZnO.
- Table 1A Other exemplary compositions of glass-based articles prior to being chemically strengthened, as described herein, are shown in Table 1A.
- Table 1B lists selected physical properties determined for the examples listed in Table 1A. The physical properties listed in Table 1B include: density; low temperature and high temperature CTE; strain, anneal and softening points; 10 11 Poise, 35 kP, 200 kP, liquidus, and zircon breakdown temperatures; zircon breakdown and liquidus viscosities; Poisson's ratio; Young's modulus; refractive index, and stress optical coefficient.
- the glass-based articles and glass substrates described herein have a high temperature CTE of less than or equal to 30 ppm/°C and/or a Young's modulus of 70 GPa or more and, in some embodiments, a Young's modulus of up to 80 GPa.
- Table 1A Exemplary compositions prior to chemical strengthening. Composit ion (mol%) Ex. 1 Ex. 2 Ex. 3 Ex. 4 Ex. 5 Ex. 6 Ex.
- the crystal phases may include ⁇ -spodumene, rutile, gahnite or other known crystal phases and combinations thereof.
- the glass-based article may be substantially planar, although other embodiments may utilize a curved or otherwise shaped or sculpted substrate. In some instances, the glass-based article may have a 3D or 2.5D shape.
- the glass-based article may be substantially optically clear, transparent and free from light scattering.
- the glass-based article may have a refractive index in the range from about 1.45 to about 1.55. As used herein, the refractive index values are with respect to a wavelength of 550 nm.
- the thickness of the glass-based article may be constant along one or more dimension or may vary along one or more of its dimensions for aesthetic and/or functional reasons.
- the edges of the glass-based article may be thicker as compared to more central regions of the glass-based article.
- the length, width and thickness dimensions of the glass-based article may also vary according to the article application or use.
- the glass-based article may be characterized by the manner in which it is formed.
- the glass-based article may be characterized as float-formable (i.e., formed by a float process), down-drawable and, in particular, fusion-formable or slot-drawable (i.e., formed by a down draw process such as a fusion draw process or a slot draw process).
- the glass-based articles are fusion-formable.
- a float-formable glass-based article may be characterized by smooth surfaces and uniform thickness is made by floating molten glass on a bed of molten metal, typically tin.
- molten glass that is fed onto the surface of the molten tin bed forms a floating glass ribbon.
- the temperature is gradually decreased until the glass ribbon solidifies into a solid glass-based article that can be lifted from the tin onto rollers.
- the glass glass-based article can be cooled further and annealed to reduce internal stress.
- the glass-based article is a glass ceramic
- the glass-based article formed from the float process may be subjected to a ceramming process by which one or more crystalline phases are generated.
- Down-draw processes produce glass-based articles having a uniform thickness that possess relatively pristine surfaces. Because the average flexural strength of the glass-based article is controlled by the amount and size of surface flaws, a pristine surface that has had minimal contact has a higher initial strength. When this high strength glass-based article is then further strengthened (e.g., chemically), the resultant strength can be higher than that of a glass-based article with a surface that has been lapped and polished. Down-drawn glass-based articles may be drawn to a thickness of less than about 2 mm. In addition, down drawn glass-based articles have a very flat, smooth surface that can be used in its final application without costly grinding and polishing. Where the glass-based article is a glass ceramic, the glass-based article formed from the down draw process may be subjected to a ceramming process by which one or more crystalline phases are generated.
- the fusion draw process uses a drawing tank that has a channel for accepting molten glass raw material.
- the channel has weirs that are open at the top along the length of the channel on both sides of the channel.
- the molten glass overflows the weirs. Due to gravity, the molten glass flows down the outside surfaces of the drawing tank as two flowing glass films. These outside surfaces of the drawing tank extend down and inwardly so that they join at an edge below the drawing tank. The two flowing glass films join at this edge to fuse and form a single flowing glass-based article.
- the fusion draw method offers the advantage that, because the two glass films flowing over the channel fuse together, neither of the outside surfaces of the resulting glass-based article comes in contact with any part of the apparatus. Thus, the surface properties of the fusion drawn glass-based article are not affected by such contact.
- the glass-based article is a glass ceramic
- the glass-based article formed from the fusion process may be subjected to a ceramming process by which one or more crystalline phases are generated.
- the slot draw process is distinct from the fusion draw method.
- the molten raw material glass is provided to a drawing tank.
- the bottom of the drawing tank has an open slot with a nozzle that extends the length of the slot.
- the molten glass flows through the slot/nozzle and is drawn downward as a continuous glass-based article and into an annealing region.
- the glass-based article may be acid polished or otherwise treated to remove or reduce the effect of surface flaws.
- Another aspect of this disclosure pertains to a method of forming a fracture-resistant glass-based article.
- the method includes providing a glass-based substrate having a first surface and a second surface defining a thickness of about 1 millimeter or less and generating a stress profile in the glass-based substrate, as described herein to provide the fracture-resistant glass-based article.
- generating the stress profile comprises ion exchanging a plurality of alkali ions into the glass-based substrate to form a non-zero alkali metal oxide concentration that varies along a substantial portion of the thickness (as described herein) or along the entire thickness.
- generating the stress profile includes immersing the glass-based substrate in a molten salt bath including nitrates of Na+, K+, Rb+, Cs+ or a combination thereof, having a temperature of about 350 °C or greater (e.g., about 350 °C to about 500 °C).
- the molten bath may include NaNO 3 , KNO 3 or a combination thereof, and may have a temperature of about 485 °C or less.
- the bath may include a mixture of NaNO 3 and KNO 3 and have a temperature of about 460 °C.
- the glass-based substrate may be immersed in the bath for about 2 hours or more, up to about 48 hours (e.g., from about 2 hours to about 10 hours, from about 2 hours to about 8 hours, from about 2 hours to about 6 hours, from about 3 hours to about 10 hours, or from about 3.5 hours to about 10 hours).
- the method may include chemically strengthening or ion exchanging the glass-based substrate in a single bath or in more than one step using successive immersion steps in more than one bath.
- two or more baths may be used successively.
- the composition of the one or more baths may include a single metal (e.g., Ag+, Na+, K+, Rb+, or Cs+) or a combination of metals in the same bath.
- the baths may have the same or different composition and/or temperature as one another.
- the immersion times in each such bath may be the same or may vary to provide the desired stress profile.
- a second bath or subsequent baths may be utilized to generate a greater surface CS.
- the method includes immersing the glass-based substrate in the second or subsequent baths to generate a greater surface CS, without significantly influencing the chemical depth of layer and/or the DOC.
- the second or subsequent bath may include a single metal (e.g., KNO 3 or NaNOa) or a mixture of metals (KNO 3 and NaNO 3 ).
- the temperature of the second or subsequent bath may be tailored to generate the greater surface CS.
- the immersion time of the glass-based substrate in the second or subsequent bath may also be tailored to generate a greater surface CS without influencing the chemical depth of layer and/or the DOC.
- the immersion time in the second or subsequent baths may be less than 10 hours (e.g., about 8 hours or less, about 5 hours or less, about 4 hours or less, about 2 hours or less, about 1 hour or less, about 30 minutes or less, about 15 minutes or less, or about 10 minutes or less).
- the method may include one or more heat treatment steps which may be used in combination with the ion-exchanging processes described herein.
- the heat treatment includes heat treating the glass-based article to obtain a desired stress profile.
- heat treating includes annealing, tempering or heating the glass-based substrate to a temperature in the range from about 300°C to about 600°C.
- the heat treatment may last for 1 minute up to about 18 hours.
- the heat treatment may be used after one or more ion-exchanging processes, or between ion-exchanging processes.
- Another aspect of the disclosure pertains to a glass-based article comprising
- One or more embodiments of the glass-based articles described herein comprise a certain stress profile that can impart enhanced scratch performance to the glass surface. Additionally, drop performances (e.g . on both 180 grit sand paper and 30 grit sand paper simultaneously) are not degraded and are kept at reasonable levels of performance for field use. Such experimental rough surfaces introduce a range of flaws in the glass that is significant and relevant to field performance. Thus, these stress profiles show improved resistance to scratching and good resistance to fracture in drop testing are the focus of the present disclosure. These stress profiles are also non-frangible.
- stress profiles for multiple-ion diffusion are disclosed in that impart a surprising improvement in scratch performance. Some stress profiles may be obtained in a single ion exchange step, others are obtained using two or more ion exchange steps. In one or more embodiments, the stress profiles exhibit two regions - a spike region of higher slope followed by a deep tail of substantially smaller slope leading to a very large depth of compression that is defined as the point where the stress changes from compressive to tensile inside the glass.
- diffusion processes are long enough in duration that a nontrivial fraction of the Na ions exchanged into the glass from the ion exchange bath may reach the center of the glass such that the deep profiles in the two halves of the thickness connect in the middle without a central region of substantially constant Na concentration equal to the original Na concentration in the non-ion-exchanged substrate.
- the stress profile provides an article that is non-frangible.
- non-frangible means that when the glass breaks, the glass breaks in a few relatively large fragments.
- frangible glass breaks into very small fragments, and with the possibility of ejection of glass particles at large distances due to the high elastic energy stored in the glass article.
- the glass-based article of one or more embodiments includes a first surface and a second surface opposing the first surface, defining a thickness t .
- the thickness t may be about 2 millimeters or less (e.g., in the range from about 0.01 millimeter to about 2 millimeters, from about 0.1 millimeter to about 2 millimeters, from about 0.2 millimeter to about 2 millimeters, from about 0.3 millimeter to about 2 millimeters, from about 0.4 millimeter to about 2 millimeters, from about 0.01 millimeter to about 1.75 millimeters, from about 0.01 millimeter to about 1.5 millimeters, from about 0.01 millimeter to about 1 millimeter, from about 0.01 millimeter to about 0.9 millimeter, from about 0.01 millimeter to about 0.8 millimeter, from about 0.01 millimeter to about 0.7 millimeter, from about 0.01 millimeter to about 0.6 millimeter, from about 0.01 millimeter to about
- the stress profile of one or more embodiments feature the presence of two distinct regions having tangents with a slopes within certain ranges - one with a relatively steep slope and one with a shallow slope.
- the stress profile can be achieved two different ways.
- the first method features a single ion exchange diffusion, wherein two or more ions are diffused simultaneously.
- the second method features a two or more ion exchange diffusions where two or more ions are diffused simultaneously.
- Each method has particular advantages. For example, a single ion exchange diffusion step may be simpler and easier to implement and/or control. However, multiple ion exchange diffusion steps may allow for more freedom to tailor the stress profile.
- duration of the ion exchange is greater than 1 hour, greater than 1.5 hours, greater than 2 hours , greater than 2.5 hours, greater than 3 hours, greater than 3.5 hours, greater than 4 hours, greater than 4.5 hours, greater than 5 hours, greater than 5.5 hours, greater than 6 hours, greater than 6.5 hours, greater than 7 hours, greater than 7.5 hours and greater than 8 hours.
- stress profiles having a large DOC and a high CS spike help reduce failures from front-side damage introduction while also keeping the rate of overstress failures acceptable.
- These profiles can achieve improved results in Li-containing glasses, which offer the ability to achieve a large depth of compression quickly via fast ion-exchange counter-diffusion of Na and Li ions.
- they also may achieve a high-compression (spike) surface layer by diffusing potassium (K) to a small depth on the order of 5-15 microns.
- a challenge with Li-containing glasses that have substantial amounts of both Li and Na in the non-strengthened substrate is that single-ion-exchange (SIOX, i.e., an ion-exchange that takes place in one bath or step, as opposed to "DIOX” which refers to double ion exchange, i.e., ion exchange performed on the same substrate or glass-based article in two baths or steps) profiles that have relatively high CS k tend to have limited depth of compression (DOC) due to high positive curvature of the deep portion of the profile resulting from strongly nonlinear diffusion.
- SIOX single-ion-exchange
- DIOX double ion exchange
- DOC depth of compression
- the present disclosure offers the ability to break the trade-off between CS and CS k and achieve combinations that offer high CS and relatively high CS k at the same time, while still achieving relatively high DOL sp .
- the invention provides for a substantial increase in DOC by allowing substantial reduction of the positive curvature of the deep portion of the profile, and in some cases even introducing negative curvature in a portion of the compression region.
- a two-step process of ion exchange is used, where both steps have a mixture of Na + -ion and K + -ion containing salts, such as NaNO 3 and KNO 3 .
- the first-step salt mixture may have a higher Na content than the second-step salt mixture.
- the first-step mixture may have 38-90 % NaNO 3 by weight when the salt mixture is NaNO 3 +KNO 3 .
- the first-step salt mixture may produce a K 2 O-spike near the surface with moderate surface concentration (for example, ⁇ 5 mol%), allowing development of a substantial CS k despite the presence of the K-spike.
- the first step may also develop substantial center tension CT, typically higher than 60 MPa.
- the second step may be performed in a salt mixture where Na-containing salt is substantially less (for example, 3-15 wt% NaNO 3 ).
- the second step may be substantially shorter than the first step (in some embodiments 3 or more times shorter), or performed at a substantially lower temperature.
- the process takes advantage of nonlinear diffusion of K when the base glass has very low level of K 2 O, lower than about 8% of the molar content of total alkali oxides in the glass.
- the second-step spike is thus characterized by a substantially higher effective diffusion coefficient for K + ions compared to the first step, allowing the full DOL of the high-CS spike to be maintained with a short second step, without significant sacrifice of CS K .
- the small amount of Na in the second-step salt mixture serves the purpose of preventing Na from out-diffusing during the spike, and thus to obtain a relatively stable process where CS k does not vary too much with relatively small variations of ion exchange temperature or time.
- the resulting profile has high CS, similar to the CS obtained by using the second mixture alone.
- it has CS k that is substantially higher than CS k typical of the second-step salt alone (by more than 10 MPa), but also substantially lower than CS K of the first step (by more than 10 MPa).
- the relatively high CT is maintained, or sometime slightly increased after the short second step.
- This CT is substantially higher than the maximum CT that can be obtained by using only the salt composition of the second step.
- the stress profile may have a DOC that is often on the order of .2• t (20% of the substrate thickness), and is greater than the maximum depth that is possible in either the first salt mixture or the second salt mixture when used alone.
- the same cover-glass component experiences a variety of service stresses (meaning wear-and-tear effects) on the front (outer) side, the back (inner) side, and the edge.
- the most common causes of failure (fracture) include fractures from introduction of a deep flaw (>10 ⁇ m ) whose tip depth may sometimes even exceed the depth of compression (DOC) available from the chemical strengthening, and from overstress (OS) of a relatively shallow flaw (1-10um) subjected to high local tension of several hundred MPa. Quite often a fracture may be initiated when a deep flaw having a tip depth somewhat smaller than the DOC is exposed to moderate tension by minor bending of the cover-glass component during service.
- DOC depth of compression
- OS overstress
- a fracture may be initiated when a deep flaw having a tip depth somewhat smaller than the DOC is exposed to moderate tension by minor bending of the cover-glass component during service.
- DOC depth of compression
- OS overstress
- a two-step process has an advantage that, if done in an appropriate manner as according to the present disclosure, the deep portion of the profile and the spike are developed essentially independently.
- the change of the deep portion of the profile during a short and relatively low-temperature "spike” step may be almost negligible (typically less than 1 % change in DOL and stress of the deep portion, and a minor change in DOC).
- Li-containing glasses offer some useful attributes for obtaining spiked profiles with very large DOC, but also come with some significant challenges.
- One advantage is the ability to develop very large DOC using a relatively short ion exchange at a temperature much lower than the softening point of the glass.
- a large DOC is achievable quickly because Na can be exchanged for Li deep into the glass much faster than K can be exchanged for Na to similar depths, owing to the larger diffusivity of the smaller Na and Li, when compared to K and Na, respectively.
- This advantage creates a challenge at the same time, because the formation of a surface spike of high CS in a Li-containing glass usually requires in-diffusion of K+ ions to the desired depth on the order of 10 ⁇ m.
- the very small diffusivity of K in a Li-based glass, relative to that of Na generally means that implementing a surface compression spike in a nominally pure KNO3 bath using a second step following a first step of pure NaNO3 ion exchange or exchange in a NaNO3 - LiNO3 mixture, would greatly deteriorate the level of compression at depths exceeding the DOL sp (e.g., from the spike depth, DOL sp to the DOC), because the gradient of Na ions obtained after the first ion-exchange step would significantly decrease during the spike-formation (second ion-exchange) step.
- DOL sp e.g., from the spike depth, DOL sp to the DOC
- Li-containing glasses of commercial interest contain significant and comparable amounts of both Li2O and Na2O in the base glass.
- one commercially available glass from Corning Incorporated (Corning, NY) contains about 6 mol% Li2O and 11 mol% Na2O.
- another commercially available glass from Corning Incorporated (Corning, NY) contains about 6 mol% Li2O and about 9 mol% Na2O.
- the deep portion of the stress profile at depths greater than the spike depth also has a substantial positive curvature when the knee stress CS k is significant, such as exceeding 120 MPa.
- curves 2801 (Comparative Example 7B) and 2802 (Comparative Example 7C) in Figure 28 discussed in further detail below.
- Such profiles tend to provide a significant level of compressive stress at relatively small and intermediate depths, but relatively lower compressive stress at large depths approaching the depth of compression. See Figure 28 wherein curves 2801 and 2802 drop below curve 2804 (Example 7A).
- curve 2802 has a CS that is already below that of curve 2804 by 50 microns (about 1/3 DOC) and remains below that of curve 2802 at 75 microns (about 1/2 DOC) and 100 microns (about 2/3 DOC).
- profiles tend to have somewhat smaller DOC than profiles with similar spike and similar knee stress that have less curvature in the deep portion of the compression region, e.g., profiles that could be obtained in a glass that has a lot of Li2O but little or no Na2O in the non-strengthened composition.
- the present disclosure sets forth a particular double-ion-exchanged process that allows simultaneously achievement of a significant spike DOL, significant spike CS, deep DOC, significant CS k , and significant compressive stress at large depths 0.3DOC-DOC (in some embodiments as a result of reduced positive curvature of the deep portion of the compressive-stress profile).
- Some embodiments may include improvement of scratch resistance, as a result of the benefit of simultaneous achievement of a good depth of the spike and high CS while achieving the desired level of CS k for good fracture resistance.
- stress profiles obtained by two-step (or more) ion exchange of a Lithium containing glass have substantial benefits compared to profiles that can be obtained in the same glass by either a single-step ion exchange in a mixed bath of Na and K-containing salt, or in prior two-step ion exchanges.
- a stress profile obtained using DIOX with a relatively long step in 100% NaNO 3 followed by a shorter second step in a mixture of NaNO 3 and KNO 3 provides mostly a tradeoff between higher CS k and reduced DOL sp , when compared with a SIOX process using the same salt mixture as the second step of the DIOX.
- the second-step bath has a molar ratio of Na: K that is substantially smaller (for example, 3-10 times smaller) than the Na:K molar ratio of the first-step bath.
- a stress profile in a Li-containing glass is obtained by a two-step ion-exchange wherein both steps of ion exchange are completed in a bath including both a Na-containing salt and a K-containing salt, wherein the ratio of Na ions to K ions in the first bath is 2.5 or more times higher than the ratio of Na ions to K ions in the second bath, for example 3 or more times higher, or 5 or 8 or more times higher, but 800 or less times higher, for example 600, 500, or 400, or less, times higher, depending on the Na:Li ratio in the glass composition.
- the second salt has a ratio of Na to K that is 0.03 or more, for example 0.04 or more, or 0.047 or more, and in some cases 0.06 or 0.07 or more, and that is less than or equal to 0.4, or 0.35, or 0.30, or 0.21, 0.16, or 0.13, depending on the glass composition.
- a ratio of Na to K that is 0.03 or more, for example 0.04 or more, or 0.047 or more, and in some cases 0.06 or 0.07 or more, and that is less than or equal to 0.4, or 0.35, or 0.30, or 0.21, 0.16, or 0.13, depending on the glass composition.
- compositions having substantially more Na in the glass than Li would tolerate higher ratios of Na:K in the bath, for example 0.21 and 0.16 in the second bath.
- the effective diffusion time of the second step is from 1/20 to 1 ⁇ 2 of the diffusion time of the first step, for example from 1/20 to 1/3,or from 1/20 to 1 ⁇ 4.
- high surface CS very similar to the high surface CS that would have been obtained with the low-Na composition of the second step, and substantially higher than the surface CS that is normally produced with the high-Na first-step bath.
- curve 2801 having a high surface CS produced by the 70Na/30K bath of Comparative Example 7B, and compare with Example 7A, curve 2804.
- the surface CS of the DIOX profile can be 600 MPa or more, for example 650 MPa or more, 700 MPa or more, 750 MPa or more, 800 MPa or more, or 850 MPa or more.
- the DOL sp is comparable to the DOL sp of the first step, and significantly larger than DOL sp that would have been obtained with the second step alone (often twice as large, even more). This means that DOL sp is relatively large, when compared to a DOL sp that would be obtained if only the second step had KNO 3 in the salt bath and provided K ions for spike formation through ion exchange.
- DOL sp attained with the DIOX process disclosed herein is: in the range of from 5 to 16 microns, and represents from 0.5 to 1.5% of the thickness when the thickness is from 1 to 1.3mm; in the range of from 0.6 to 2% of thickness when the thickness is from 0.8 to 1mm; in the range of 0.7 to 2.5% when the thickness is from 0.65 to 0.8mm; in the range of 0.9 to 3% when the thickness is from 0.5 to 0.65mm; and in the range of 1 to 3% when the thickness is from 0.3 to 0.5mm.
- relatively high CS k substantially higher than CS k that would be typical of the composition of the second-step bath alone, and lower than the first-step CS k .
- the first-step CS k is about 160 MPa
- the DIOX CS k is 125 MPa
- a bath having the composition of the second step, 7%NaNO 3 + 93%KNO 3 by weight would produce CSk below 75 MPa when stable DOC is reached.
- a high DOC higher than the DOC that would be obtained by a single-step ion exchange in the first-step salt.
- the DIOX DOC of Example 7A is about 160 um, or 20% of the thickness.
- the curvature in that depth range preferably does not exceed the curvature of a force-balanced parabolic profile centered in the middle of the substrate and having the same CS k as the inventive DIOX profile.
- a sign convention is assumed where compressive stress is positive, tensile stress is negative.
- a simplified representation of the profile as a spiked power-law profile may be assumed.
- the deep portion of a spiked parabolic profile is fitted with a parabola having a power coefficient of 2.
- the power coefficient may range from 1 to 3, or from 1.7 to 2.6 for the shape of the deep region of the profile, or the CT region.
- a relatively high compression in the depth range from DOC/3 to DOC there can be attained a relatively high compression in the depth range from DOC/3 to DOC.
- the DIOX profile has similar or higher compression than the first-step profile in this depth range.
- This higher CS is a result of the combined effect of force balance and the reduction or elimination of positive curvature of the profile in the depth range between about 1.5DOL sp and DOC.
- the DIOX profile (curve 2804) has a CT of about 70 MPa, approximately the same as the CT of the 1 step, curve 2801 profile (70%Na, 4 hours, 380 C), while an ion exchange in the second-step bath (7%Na) for a comparable time as the DIOX total time of 4hr+40min would result in a CT in the range 50-55 MPa.
- the high CT of the DIOX profile indicates a high stress-depth integral in the compression zone, which helps provide resistance of the glass article to fracture initiated by a flaw introduced in the compression zone.
- the curve 2802 SIOX profile of Figure 28 prepared in the bath having 40%NaNO 3 and 60%KNO 3 having a similar CS k at 125 MPa, similar DOC, and DOL sp as the DIOX profile curve 2804 but the surface CS of curve 2802 is lower by about 250 MPa (550-570 MPa vs. 800-820 MPa for the curve 2804 DIOX profile).
- the DIOX profile and method of making it provide superb strengthening of the peripheral area of the glass article, particularly when the thickness of the glass article decreases gradually toward the edge ("2.5D cover glass").
- the thickness of the glass article is constant essentially to the very edge of the glass sheet, or to within less than 0.3 t of the edge tip when the edge is chamfered, where t is the thickness of the sheet.
- the profiles according to embodiments described herein do provide superior strengthening of this type of edge when compared to prior-art profiles, as the depth of compression measured from any point around the edge is similar to the large depth of compression in the interior of the sheet.
- the first thickness range may span from about 0• t up to about 0.020• t , 0.025• t , 0.0275• t , 0.030• t , or 0.035• t , and greater than 0.98• t , 0.975• t , 0.9725• t , 0.97• t , or 0.965• t .
- the slope may range from about -200 MPa/micrometer to about -25 MPa/micrometer or about 200 MPa/micrometer to about 25 MPa/micrometer.
- the slope may range from about -200, -190, -180, -170, -160, -150 or -140 MPa/micrometer to about -25, -27, -30, -31, -32, -33, -34 or -35 MPa/micrometer; or about 25, 27, 30, 31, 32, 33, 34, or 35 to about 140, 150, 160, 170, 180, 190 or 200.
- At least one point of, and in other embodiments all points of, the stress profile in the first thickness range comprise a tangent with a slope of from about -170 MPa/micrometer to about -30 MPa/micrometer or about 30 MPa/micrometer to about 170 MPa/micrometer.
- at least one point of, and in other embodiments all points of, the stress profile in the first thickness range comprise a tangent with a slope of from about -140 MPa/micrometer to about -35 MPa/micrometer or about 35 MPa/micrometer to about 140 MPa/micrometer.
- the above slope ranges may be combined with any of the first thickness ranges.
- at least one point of, and in other embodiments all points of, the stress profile in a first thickness range from about 0• t up to 0.025• t and greater than 0.975• t comprise a tangent with a slope of from about -200 MPa/micrometer to about -25 MPa/micrometer or about 25 MPa/micrometer to about 200 MPa/micrometer.
- At least one point of, and in other embodiments all points of, the stress profile in a first thickness range from about 0• t up to 0.025• t and greater than 0.975• t comprise a tangent with a slope of from about -170 MPa/micrometer to about - 30 MPa/micrometer or about 30 MPa/micrometer to about 170 MPa/micrometer.
- At least one point of, and in other embodiments all points of the stress profile in a first thickness range from about 0• t up to 0.025• t and greater than 0.975• t comprise a tangent with a slope of from about -140 MPa/micrometer to about -35 MPa/micrometer or about 35 MPa/micrometer to about 140 MPa/micrometer.
- At least one point of, and in other embodiments all points of the stress profile in a first thickness range from about 0• t up to 0.035• t and greater than 0.965• t comprise a tangent with a slope of from about -200 MPa/micrometer to about -25 MPa/micrometer or about 25 MPa/micrometer to about 200 MPa/micrometer.
- At least one point of, and in other embodiments all points of the stress profile in a first thickness range from about 0• t up to 0.035• t and greater than 0.965• t comprise a tangent with a slope of from about -170 MPa/micrometer to about -30 MPa/micrometer or about 30 MPa/micrometer to about 170 MPa/micrometer.
- At least one point of, and in other embodiments all points of the stress profile in a first thickness range from about 0• t up to 0.035• t and greater than 0.965• t comprise a tangent with a slope of from about -140 MPa/micrometer to about -35 MPa/micrometer or about 35 MPa/micrometer to about 140 MPa/micrometer.
- the slopes of tangents at points in the first thickness may become steeper.
- all points of the stress profile in a second thickness range from about 0.035• t and less than 0.965• t comprise a tangent with a slope of from about -15 MPa/micrometer to about 15 MPa/micrometer. That is, going along the span of 0.035• t and through 0.965• t , the slope begins negative, approaches zero, and then becomes positive, approximating a power-law function.
- power-law function refers to a curve in which the stress is exponentially proportional to the depth or thickness.
- the exponent ranges from about 1.2 to about 3.2. In further embodiments, the exponent ranges from about 1.2 to about 2.8.
- the noted slopes for the second thickness range may be in a range from about 0.1• t to 0.9• t , or from 0.15• t to 0.85• t , or from 0.2• t to 0.8• t , or from 0.22• t to 0.78• t , or from 0.24• t to 0.76• t , or from 0.26• t to 0.74• t , or from 0.28• t to 0.72• t , or from 0.3• t to 0.7• t , or from 0.35• t to 0.65• t , or from 0.4• t to 0.6• t , or from 0.45• t to 0.55• t .
- the points in the second thickness range can also be described as comprising tangents with slopes.
- the slopes of the tangents range from about -15, -10, -5, -4, -3, -2 or -1 MPa/micrometer to about 1, 2, 3, 4, 5, 10 or 15 MPa/micrometer.
- the noted slopes for the second thickness range may be in a range from about 0.1• t to 09• t , or from 0.15• t to 0.85• t , or from 0.2• t to 0.8• t , or from 022• t to 0.78• t , or from 0.24• t to 0.76• t , or from 026• t to 0.74• t , or from 0.28• t to 0.72• t , or from 0.3• t to 0.7• t , or from 0.35• t to 0.65• t , or from 0.4• t to 0.6• t , or from 0.45• t to 0.55• t .
- all points of the stress profile in a second thickness range from about 0.035• t and less than 0.965• t comprise a tangent with a slope of from about -2 MPa/micrometer to about 2 MPa/micrometer.
- the all points of the stress profile in the second thickness range from about 0.025• t and less than 0.975• t comprise a tangent with a slope of from about -15 MPa/micrometer to about 15 MPa/micrometer.
- the points of the stress profile in the second thickness range from about 0.025• t and less than 0.975• t comprise a tangent with a slope of from about -2 MPa/micrometer to about 2 MPa/micrometer. In one or more embodiments, all points of the stress profile in the second thickness range from about 0.02• t and less than 0.98• t comprise a tangent with a slope of from about -15 MPa/micrometer to about 15 MPa/micrometer, or from about -2 MPa/micrometer to about 2 MPa/micrometer.
- the glass-based article comprises a surface CS of from about 200 MPa to about 1100 MPa. In further embodiments, the surface CS is greater than about 300, 350, 400, 450, 500, 550, 600, 610, 620 650, 700, 750, and/or less than about 650, 700, 750 800, 850, 900, 950, 1000 or 1100.
- the glass-based articles described in or more embodiments of this aspect comprise a stress profile comprises a DOC ranging from about 0.1• t to 0.25• t , or 0.3• t .
- the glass-based article comprises a composition comprising between about 0.5 mol% P 2 O 5 and 10 mol% P 2 O 5 .
- the stress profiles of the glass-based articles of this aspect can be obtained either via a single ion exchange step or using two or more ion exchange steps.
- the ion exchange step(s) can include or incorporate any of the features described above in previous aspects.
- the first thickness range is obtained by ion exchange in a potassium-containing salt.
- a main control parameter is the bath concentration ratio between Na and K, driving the relative magnitude of the spike CS and the stress in the deep portion of the profile.
- Secondary parameters with smaller influence on that relative magnitude are the ion exchange time and temperature, both of which may be affected by the requirements for the depth of the spike and the overall stress in the profile.
- methods are provided that include a single ion exchange step including varying the concentration ratio between Na and K for a duration to achieve the stress profiles described herein.
- a range of power coefficients for the tail region of the profile can be achieved by tailoring the KNO 3 /NaNO 3 ratio and ion exchange time.
- Experimental profiles provided in the present disclosure can have a power coefficient falling in a range of from 1 to 3, or from 1.7 to 2.6 for the shape of the deep region of the profile. It is thought that profiles with lower power coefficients generally have smaller slopes in the deep region, typically below 1 MPa/micrometer.
- methods are provided that include two or more ion exchange steps including varying the concentration ratio between Na and K for a duration to achieve the stress profiles described herein.
- a glass-based article comprising a center plane, wherein the center plane comprises from about 2 to about 20 mol-% Li 2 O; a first surface and a second surface opposing the first surface defining a thickness ( t ) in a range of 0.1 mm and 2 mm; and a stress profile extending along the thickness ( t ), wherein at least one point of the stress profile in a first thickness range from about 0• t up to 0.020• t and greater than 0.98• t comprises a tangent with a slope of from about -200 MPa/micrometer to about -25 MPa/micrometer or about 25 MPa/micrometer to about 200 MPa/micrometer, wherein the stress profile comprises a surface CS of from about 200 MPa to about 1100 MPa, and wherein the stress profile comprises a DOC ranging from about 0.05• t to 0.25• t .
- all points of the stress profile in the first thickness range from about 0• t up to 0.020• t and greater than 0.98• t comprise a tangent with a slope of from about -200 MPa/micrometer to about -25 MPa/micrometer or about 25 MPa/micrometer to about 200 MPa/micrometer.
- the first thickness range is obtained by ion exchange in a K-containing salt.
- the second thickness range is obtained by ion exchange in a Na- or K-containing salt.
- the stress profile is obtained using a single ion-exchange step.
- the stress profile is obtained using two or more ion-exchange steps.
- the surface CS ranges from about 690 MPa and 950 MPa.
- all points of the stress profile in the second thickness range from a power-law profile having a power exponent, wherein the power exponent is between about 1.2 to 3.4. In some embodiments, the power exponent is between about 1.3 and 2.8.
- the glass-based article comprises a composition comprising from about 0.5 mol% P 2 O 5 to about 10 mol% P 2 O 5 .
- the center-plane further comprises a composition comprising from about 0.5 mol% to about 20 mol%Na 2 O. In some embodiments, the center-plane further comprises a composition comprising from about 2 mol% to about 10 mol% Li 2 O. In some embodiments, the concentration of Na 2 O in the center plane of the glass article is between about 5 mol% and 16 mol%. In some embodiments, the concentration of Na 2 O in the center plane of the glass article is between about 10 mol% and 15 mol%. In some embodiments, the concentration of Li 2 O in the center plane of the glass article is between about 3 mol% and 10 mol%.
- the glass-based articles according to one or more embodiments of the disclosure described herein provide an improved level of scratch resistance without penalty to the drop performance, particularly for glass-based articles comprising Li-based.
- the glass-based articles according to one or more embodiments of the disclosure described herein provide superior drop performance, as demonstrated both in 30 grit and 180 grit sand paper.
- the glass-based articles according to one or more embodiments of the disclosure described herein provide recipes that are non-frangible and breakage of the glass is quasi-uniform in large parts.
- the glass-based articles according to one or more embodiments of the disclosure described herein provide for acceptable levels of glass shape distortion for the temperatures and composition used in the ion exchange process.
- the glass-based articles according to one or more embodiments of the disclosure described herein comprise stress profiles that can be implemented without added complexity in the manufacturing process
- the concentration profiles in glasses according to the present disclosure differ from complementary error function-based profiles that can be calculated using linear diffusion approximation.
- glasses according to one or more embodiments described herein do not exhibit complementary error function-based profiles that can be calculated using linear diffusion approximation.
- mutual diffusivities that can be used to describe NalLi, K/(Na+Li) counter-diffusion in glasses according to one or more embodiments are dependent on the local concentration of Li, Na, and K.
- Li-containing glasses that are chemically strengthened have been described in the literature.
- such glasses described in the literature neglect the effects of concentration-dependent diffusivity on the curvature of the stress profile, and such glasses exhibit profiles consistent with a linear diffusion approximation (i.e., erfc-shaped shallow and deep branch of a two segment profile), distinguishing glasses of one or more embodiments of the present disclosure from those in the literature.
- Another difference between glasses described according to one or more embodiments of the present disclosure and those in the literature is that diffusion of the strengthening ion species (e.g., Na+ or K+ or a combination thereof) in known strengthened substrates do not extend to deeper depths of the substrate or, in some cases, to the center (i.e., in the range from about 0.4t to about 0.6t) of the substrate.
- the literature does not disclose the combination of glass diffusivity, substrate thickness, and ion exchange conditions that result in the stress profiles described herein.
- the literatures describes thicker substrates (e.g., substrates having thicknesses exceeding 2.5 mm).
- Examples 1A-1G included glass substrates having a nominal composition of about 63.46 mol% SiO 2 , 15.71 mol% Al 2 O 3 , 6.37 mol% Li 2 O, 10.69 mol% Na 2 O, 0.06 mol% MgO, 1.15 mol% ZnO, 2.45 mol% P 2 O 5 , and 0.04 mol% SnO 2 .
- the glass substrates have a thickness of 0.8 mm.
- the glass substrates of Examples 1A-1G were ion exchanged in a molten salt bath including 100% NaNO 3 and having a temperature of about 390 °C, according to the conditions provided in Table 2.
- FIGS. 1-3 , 23 , and 27 show the stress profile for Example 1E.
- RMF refracted near-field
- Figure 6 shows the measured stress as a function of depth extending from the surface of the glass-based article of Example 1E into the glass-based article. The stress at specific depths is shown in Table 3, including at the knee.
- positive numbers are used for compressive stress, and negative numbers indicate tensile stress. This same convention (compressive stress is indicated as positive values on the y axis, and tensile stress is indicated by negative values on the y axis) is used for FIGS. 1-3 , 23 , and 27 , also.
- Example 2A included a glass substrate having the same composition as Example 1 and a thickness of 0.8 mm.
- the glass substrate was ion exchanged in a single molten salt bath including 51% KNO3 and 49% NaNO 3 , and having a temperature of about 380° C, for 3.75 hours.
- the resulting glass-based article exhibited the stress profile as described in Table 4.
- Table 4 Stress profile of Example 2A. Surface Compressive Stress 500 MPa Depth of layer for potassium 12 micrometers Stress at DOL of potassium 161 MPa Maximum CT 70 MPa DOC 150 micrometers
- Glass-based articles according to Example 2A were subjected to AROR testing as described herein.
- One set of glass-based articles was abraded using a load or pressure of 34.5 (5 psi)
- a second set of glass-based articles was abraded using a load or pressure of 172.4 kPa (25 psi)
- a third set of glass-based articles was abraded using a load or pressure of 310.3 kPa (45 psi).
- the AROR data is shown in Figure 7 .
- all of the glass-based articles according to Example 2A exhibited an average load to failure of greater than about 20 kgf.
- Glass-based articles according to Example 2A were retrofitted onto identical mobile phone devices.
- the phone devices were dropped from incremental heights starting at 20 centimeters onto 180 grit sandpaper. If a glass-based article survived the drop from one height (e.g., 20 cm), the mobile phone was dropped again from a greater height (e.g., 30 cm, 40 cm, 50 cm, etc.) up to a height of 225 cm.
- the surviving glass-based articles were then dropped onto 30 grit sandpaper (in the same phone devices).
- the height at which the glass-based article failed on both 180 grit sandpaper and 30 grit sandpaper is plotted in Figure 8 .
- the glass based articles according to Example 2A exhibited a dielectric constant of about 6.9 to about 7.05 over a frequency range from about 480 mHz to about 3000 mHz.
- the glass-based articles according to Example 2A exhibited a dielectric loss tangent in the range from about 0.012 to about 0.015 over a frequency range from about 480 mHz to about 3000 mHz.
- the refractive index of the glass-based articles according to Example 2A is in the range from about 1.158 to about 1.49 over a range from about 380 nm to about 1550 nm, and from about 1.518 to about 1.497 over a wavelength range from about 380 nm to about 800 nm.
- Comparative Example 2E was a glass substrate having a nominal composition of 64.3 mol% SiO 2 , 7.02 mol% B 2 O 3 , 14 mol% Al 2 O 3 , 14 mol% Na 2 O, 0.5 mol% K 2 O, 0.03 mol% Fe 2 O 3 , and 0,1 mol% SnO 2 .
- Comparative Example 2F was a glass substrate having a nominal composition of 64.75 mol% SiO 2 , 5 mol% B 2 O 3 , 14 mol% Al 2 O 3 , 13.75 mol% Na 2 O, 2.4 mol% MgO, and 0.08 mol% SnO 2 .
- Comparative Example 2G included a glass substrate having a nominal composition of 57.5 mol% SiO 2 , 16.5 mol% Al 2 O 3 , 16.71 mol% Na 2 O, 2.8 mol% MgO and 0.05 mol% SnO 2 .
- Table 5 Chemical durability of Example 2A.
- Example 3A included glass substrates having the same composition as Example 1 and a thickness of 0.8mm.
- Comparative Example 3B included glass substrates having the same composition as Comparative Example 2G and a thickness of 0.8 mm.
- the glass substrates of Example 3A were chemically strengthened in a single step using a single bath, as described in Table 6.
- the glass substrates of Comparative Example 3B was ion exchanged in a two-step process, as described in Table 6. Table 6: Ion exchange conditions for Example 3A and Comparative Example 3B.
- Example 3A Comparative Example 3B 1 st Step Molten salt bath 49%NaNO3/51% 49%NaNO3/51% composition KNO3 KNO3 Bath Temperature 380 °C 460 °C Immersion time 3.75 hours 14 hours 2 nd Step Molten salt bath composition - 99.5% KNO3/0.5% NaNO3 Bath Temperature - 390 °C Immersion time - 0.25 hours Properties of resulting glass article Surface CS 500 MPa 825 MPa DOL of potassium 12 micrometers 10 micrometers Stress at DOL of potassium 160 MPa 220 MPa DOC 150 micrometers 100 micrometers
- Example 3A and Comparative Example 3B were retrofitted onto identical mobile phone devices.
- the phone devices were dropped from incremental heights starting at 20 centimeters onto 30 grit sandpaper.
- the height at which the glass-based article failed on 30 grit sandpaper is plotted in Figure 9 .
- the glass-based articles of Example 3A exhibited an average survival drop height that is more than two times (i.e., 91 cm) the average survival drop height of Comparative Example 3B (i.e., 38 cm).
- Example 3A and Comparative Example 3B were subjected to AROR testing, as described herein, using a load or pressure of 172.4 kPa (25 psi).
- the glass-based substrates of Example 3A exhibited an average load to failure of about 30 kgf, while the glass-based substrates of Comparative Example 3B exhibited an average load to failure of about 27 kgf, as shown in Figure 10 .
- the abrasion load or pressure was increased to 310.3 kPa (45 psi)
- the difference in average load to failure for Example 3A and Comparative Example 3B increased.
- Example 3A Under a 45 psi load or pressure, Example 3A exhibited an average load to failure of about 25.9 kgf, while Comparative Example 3B exhibited an average load to failure of about 19.6 kgf, as shown in Figure 11 .
- Glass substrates having a nominal composition of 57.5 mol% SiO 2 , 16.5 mol% Al 2 O 3 , 16.7 mol% NazO, 2.5 mol% MgO, and 6.5 mol% P 2 O 5 , and having a thicknesses of about 0.4 mm, 0.55 mm, or 1 mm were subjected to chemical strengthening.
- the thicknesses and conditions of chemical strengthening are shown in Table 7.
- Example 4A was immersed in a molten salt bath, as indicted in Table 7, for 4 hours, 8 hours, 16 hours, 32 hours, 64 hours and 128 hours (Examples 4A-1 through 4A-6).
- Example 4B was immersed in a molten salt bath, as indicated in Table 7, for 4 hours, 8 hours, 16 hours, 32 hours, 64 hours and 128 hours (Examples 4B-1 through 4B-6).
- Example 4C was immersed in a molten salt bath, as indicated in Table 7, for 1 hour, 2 hours, 4 hours, 8 hours, 16 hours and 32 hours (Examples 4C-1 through 4C-6).
- Example 4D was immersed in a molten salt bath, as indicated in Table 7, for 4 hours, 8 hours, 16 hours, 32 hours, 64 hours and 128 hours (Examples 4D-1 through 4D-6).
- the stress profiles of Examples 4A-1 through 4A-6, 4B-1 through 4B-6, 6C-1 through 4C-6, and 4D-1 through 4D-6 are shown in Figures 12 , 14 , 16 and 18 , respectively.
- Figures 12 , 14 , 16 and 18 the depth or thickness of the glass articles is plotted on the x-axis and stress is plotted on the y-axis.
- the positive stress values are CT values and the negative stress values are the CS values.
- CT and DOC values as a function of time immersed in the molten salt bath are shown in Figures 13 , 15 , 17 , and 19 , respectively.
- Table 8 Composition of the glass substrate of Example 5, prior to chemical strengthening.
- Example ⁇ 5 Oxide [mole%] SiO 2 69.2 Al 2 O 3 12.6 B 2 O 3 1.8 Li 2 O 7.7 Na 2 O 0.4 MgO 2.9 ZnO 1.7 TiO 2 3.5 SnO 2 0.1 [Li 2 O+Na 2 O+MgO+ZnO+K 2 O] [Al 2 O 3 +B 2 O 3 ] [TiO 2 +SnO 2 ] [SiO 2 +B 2 O 3 ]
- the stress profile of the glass-based articles of Examples 5A and 5B are shown in Figure 20 .
- a shown in Figure 20 Comparative Example 5A exhibited a known stress profile, whereas, Example 5B showed a stress profile according to one or more embodiments of this disclosure.
- the stored tensile energy of the glass-based articles of Examples 5A and 5B was calculated from the measured SCALP stress profile data and using equation (3) above.
- the calculated stored tensile energy is plotted as a function of measured CT (MPa), as shown in Figure 21 .
- Comparative 5A exhibited much greater stored tensile energy values for a given CT value than Example 5B (for the same CT value).
- CT is the maximum CT in the sample.
- Comparative Example 5A exhibited a stored tensile energy of about 12 J/m 2
- Example 5B exhibited a stored tensile energy of about 9 J/m 2 .
- Comparative Example 5A and Example 5B were fractured and Example 5B fractured into fewer pieces than Comparative Example 5A, which fractured into a significantly greater number of pieces.
- controlling the stored tensile energy may provide a way to control or predict fragmentation patterns or the number of fragments that result from fracture.
- the CT was varied by keeping a sample in the ion exchange bath for a longer period of time while using the same bath temperature and composition.
- the point 0,0 was not experimental, but is would one of ordinary skill in the art would expect to be the case, i.e., when there is 0 CT, there will be 0 stored tensile energy.
- Example 5C Glass substrates having a nominal composition as shown in Table 8 and having a thicknesses of about 1 mm each were subjected to chemical strengthening in a molten salt bath including NaNO 3 and a temperature of 430 °C for 4 hours (Comparative Example 5C) and for 61.5 hours (Example 5D). Comparative Example 5C exhibited a known stress profile, whereas, Example 5D showed a stress profile according to one or more embodiments of this disclosure.
- the stored tensile energy of Examples 5C and 5D was calculated using the same method used with Examples 5A-5B and plotted as a function of measured CT (MPa), as shown in Figure 22 .
- Comparative 5C exhibited much greater stored tensile energy values for a given CT value (again, as with Figure 21 , these are maximum CT values, and again the values were varied by using the same ion exchange bath temperature and composition, but with longer periods of time) than Example 5D (for the same CT value). Comparative Example 5C and Example 5D were fractured and Example 5D fractured into fewer pieces than Comparative Example 5C, which fractured into a significantly greater number of pieces.
- Examples 6A-6D included glass substrates in accordance with one or more embodiments of the disclosure and having about 10 mol% Na 2 O and 6 mol-% Li 2 O in the base glass.
- a nominal composition has about 63.46 mol% SiO 2 , 15.71 mol% Al 2 O 3 , 6.37 mol% Li 2 O, 10.69 mol% Na 2 O, 0.06 mol% MgO, 1.15 mol% ZnO, 2.45 mol% P 2 O 5 , and 0.04 mol% SnO 2 .
- the glass substrates have a thickness of 0.8 mm.
- the glass substrates of Examples 6A-6D were ion exchanged in a molten salt bath including to the conditions provided in Table 9, in which "SIOX” refers to single ion exchange, and “DIOX” refers to double ion exchange.
- the glass substrate has a composition containing Na and Li in the base glass. It is possible to exchange more than one ion, such as Na and K primarily for Li, simultaneously. Typically, in glasses that have just one free ion such as Na in its composition, it would take a two-step IOX process with different KNO 3 /NaNO 3 mixtures in order to achieve a profile that has a long tail towards the center of the glass and a spike in its surface.
- Table 9 IOX Conditions and Resultant Properties for Example 6 Parameter 6A. 6B. 6C. 6D. 6D.
- Table 9 also shows parameters and measured values via point-by point method plus prism coupler measurements (FSM instrument) for stress at immediate external surface for different ion exchange recipes.
- the parameters shown in Table 9 include the power coefficient of the deep region of the profile, the Surface Compressive Stress (CS), the stress at the knee where the spike connects to the deep tail, and the Depth of layer of the spike where the knee occurs.
- CS Surface Compressive Stress
- the DOL of the spike can be from about .01•t to about .035•t (for example about .015•t, .02•t, .025•t, .30•t, or .35•t, and any and all subranges therebetween), i.e., from about 7.3 microns to about 24 microns of an 800 micron thick sample.
- the spike DOL generally corresponds to the potassium DOL.
- Even a single IOX diffusion creates a spike and a tail in the stress profile. This is thought to be due to the fact that the glass containing different amounts of Li, Na and K is exchanged simultaneously at different diffusion rates.
- Figure 23 shows the measured stress profile via point by point refractive index metrology at TE and TM polarizations. It is noted that the stress at the surface is under-represented in the top 5 microns due resolution limitation of the measurement technique. Surface stress values in practice are higher than shown here, and are separately measured by prism-coupling techniques. A more complete range of attributes are shown in Table 9. It is noted that even a single ion exchange (SIOX) diffusion creates a spike and a tail in the stress profile when a Li-containing glass is immersed in a bath having both K and Na. While not wishing to be bound to any particular theory, it is thought that this spike and tail are due to the fact that the glass contains different amounts of Li, Na and K being exchanged simultaneously at different diffusion rates.
- SIOX single ion exchange
- Example 6A the spike region is obtained by the nonlinear diffusion of potassium, while the tail of the profile is obtained by the non-linear diffusion of Na and Li. Even for short diffusion times where the Na from the ion exchange bath does not reach the center of the thickness, the tail of the profile in this case would not be described by a complementary error function which is only applicable to substantially linear diffusion.
- Figure 24 shows the measured normalized microprobe data for K, Na and Li diffused using the recipe of 51 wt%K/ 49wt%Na at 380 °C for 3.75h (6A) in a glass in accordance with one or more embodiments of the disclosure and having about 10 mol% Na 2 O and 6 mol-% Li 2 O in the base glass.
- the potassium diffusion is limited to near the glass surface, producing a surface peak in the stress profile.
- the Na profile penetrates very deeply, all the way to the center of the glass.
- Figure 25 shows an example of ramped scratch tests for 6A-6D with a diamond tip with 30 micron radius at angle of 76.5 degree in cone angle in a ramp mode from 0 Newtons to 4 Newtons linearly increasing from top to bottom of the figure.
- Table 10 shows the percentage of scratches with cracking as evaluated by an optical microscope for the ramp scratch test as exemplified in Figure 25 .
- Table 10 Example 30 ⁇ m Conospherical Scratch (0-4N ramp) # scratches showing cracks/total # scratches; (% scratches showing cracks) 6A 3/3 (100%) 6B 1/3 (33%) 6C 2/4 (50%) 6D 1/3 (33%)
- Tables 11-18 show a ranking of severity of scratches in several test via microscope evaluation.
- Table 13 Ramped Scratch 30microns tip 76 degrees with NO ETC 6A 6B 6C 6D Reference Glass 6A 6B 6C 6D Reference Glass Start 1 1 1 1 1 A A A A A A A 2N 5 5 5 5 5 A A A A A A A A 4N 12 6 6 9 15 C B B B C max width anywhere 12 8 8 9 17 C B B B C
- FIG. 25 one example is given of a ramped scratch test with a diamond tip having a 30 micron radius and a supporting-cone angle of 76.5 degree. The applied scratch force was ramped linearly over the range from 0 Newtons to 4 Newtons.
- the Example 6B-6D recipes modified to increase the spike CS provide an improvement in scratch performance observable as narrower and less visible scratch defects.
- the presented images for each recipe are of 5 severe trials performed for that recipe. Observation of the scratch performance with an optical microscope, revealed some potential trends if one ranks the severity by the width developed in the scratch process.
- Figure 26 shows the drop performance of samples in a 30 grit sandpaper from the different conditions in Examples 6A-D compared to a reference glass having a nominal value of 57.5 mol% SiO2, 16.5 mol% Al2O3, 16.5 mol% Na2O, 2.8 mol% MgO, 6.5 mol% P2O5, and 0.05 mol% SnO2.
- Examples 6A-D have similar performance and have an improvement in drop performance in comparison to the reference glass.
- desirable stress profiles are resistant to fracture upon face-drop on a rough surface.
- Figure 26 are shown the controlled drop tests of samples on a 30 grit sandpaper from the different conditions in the inventive glass compared to the reference glass which has the most fracture-resistant profile for this test among cover glasses on products that have recently reached the market.
- All the tested profiles with large depth of compression DOC>130 um have similar performance in this test, and have a substantial improvement in drop performance in comparison to the reference glass. That leads us to believe that these nonlinear-diffusion curved profiles with a spike and large DOC can provide a significant improvement in drop performance, and in some cases improved scratch resistance.
- Examples 7A, and Comparative Examples 7B-7D included glass substrates in accordance with one or more embodiments of the disclosure, having a thickness of 0.8 mm and having a nominal composition of 64 mol% SiO 2 , 15 mol% Al 2 O 3 , 2.4 mol% B 2 O 3 , 9.2 mol% Na 2 O, 5.9 mol% Li 2 O, 1.2 mol% ZnO, 2.5 mol%P2O5. 0.05 mol% SnO 2 , using 3 different mixtures of NaNO 3 and KNO3.
- the glass substrates of Examples 7A-7D were ion exchanged in a molten salt bath(s) including to the conditions provided in Table 19, with the resulting properties also listed in that table.
- Figure 36 shows 3 stress profiles, namely curves 2801, 2802, and 2803 corresponding to Comparative Examples 7B-D, and measured by RNF (refracted near-field scan). Due to the limited resolution of RNF, the surface CS of the spike is not fully represented (the spike is rounded in the RNF profile and has lower maximum stress than the actual CS).
- the salt mixtures has 70, 40, and 28 % NaNO 3 by weight, the rest of the mass being KNO 3 , and up to 0.5 wt% silicic acid for eliminating effects of salt contaminants. This corresponds to Na:K molar ratio in the salt of 2.78, 0.79, and 0.46, respectively.
- Figure 36 shows a DIOX stress profile according to some embodiments of the present invention curve 2804 (Example 7A), together with three SIOX profiles (curves 2801-2803 of Comparative Examples 7B-7D) for the same 0.8mm-thick Corning Incorporated glass having a nominal composition of 64 mol% SiO 2 , 15 mol% Al 2 O 3 , 2.4 mol% B 2 O 3 , 9.2 mol% Na 2 O, 5.9 mol% Li 2 O, 1.2 mol% ZnO, 2.5 mol%P2O5. 0.05 mol% SnO 2 .
- the DIOX profile was obtained by a first step of ion exchange for 4 hours at 380 C in a salt having 70% NaNO 3 and 30%KNO 3 by weight (Na:K ratio of 2.78), and a second step of ion exchange for 40 min at 380 C in a salt having 7%NaNO 3 and 93%KNO 3 by weight (Na:K ratio of about 0.09).
- the Na:K ratio in the second bath is about 31 times lower than that in the first bath, and the second-bath effective ion exchange time is about 6 times shorter than the first-step ion-exchange time.
- the first step developed a surface spike due to K enrichment, having a surface CS of about 400 MPa and DOL sp of about 9.4 ⁇ m .
- the second step increased the CS of the spike to about 800 MPa, and also resulted in an effective DOL sp of about 8.7 ⁇ m .
- the apparent reduction in the DOL sp in this particular example is an artifact resulting from a change in the shape of the spike, from mostly linear shape after step 1 to a somewhat curved shape with positive curvature after step 2. Since the DOL sp in both cases is calculated assuming a linear spike, the DOL sp appears to be somewhat smaller after step 2.
- the high-compression portion of the spike developed during step 2 is somewhat shallower than the original depth of the spike after step 1.
- the effective DOL sp after step 2 is similar and often somewhat larger than that of the first-step DOL sp .
- KST Knoop Scratch Threshold
- the strengthened glass articles had at least a 60% survival rate when subjected to an IBoS test with a 4.2 g stainless steel ball having a diameter of 10 mm from a height of about 80 cm onto a 30 grit sandpaper positioned above the surface of the glass so there is a 100 ⁇ m air gap between the sandpaper and the surface of the glass, wherein the survival rate was based on testing at least 5 samples.
- Impact threshold value testing was then conducted with the apparatus as shown in Figures 29 to 35 , i.e., on both the major surface of the samples, as well as on its edges. The results are shown in Figures 38 for face impact, and in Figure 39 for edge impact.
- the samples according to Example 7 were able to survive an impact force of over 200N, for example 250N or more, 300N or more, 350N or more, 400N or more, 450N or more, 500N or more, 550N or more, 600N or more, 650N or more, 700N or more, 750N or more, 800N or more, and even 850N or more.
- the samples of Example 7A reached the highest impact load of 851 N and did not break.
- Comparative Sample set consists of commercially available alkali aluminosilicate glasses (Dragontrail ® Glass, manufactured by Asahi Glass Company) of identical composition (nominal composition about 65 mol% SiO 2 , about 8 mol% Al 2 O 3 , about 12 mol% Na 2 O, about 4 mol% K 2 O, about 0.3 mol% CaO, about 10 mol% MgO, and about 0.5 mol% ZrO 2 ) and thickness (0.8 mm).
- Alkali aluminosilicate glasses Dragontrail ® Glass, manufactured by Asahi Glass Company
- nominal composition about 65 mol% SiO 2 , about 8 mol% Al 2 O 3 , about 12 mol% Na 2 O, about 4 mol% K 2 O, about 0.3 mol% CaO, about 10 mol% MgO, and about 0.5 mol% ZrO 2
- thickness 0.8 mm
- the glasses of the Comparative sample set were ion exchanged so as to have a compressive depth of layer DOL of 24 ⁇ m and a surface compressive stress CS of 804 MPa.
- the samples in the Comparative set reached an average impact force of only about 152N, with only three out of 10 (or 30%) of the samples surviving an impact force of over 200N.
- the strengthened glass according to the present disclosure, and to Example 7 in particular is well suited to use in a mobile device, wherein drop is likely.
- glass-based articles made according to Example 7A can survive an edge impact force of 400N or more (for example 450N), or an impact energy of 1.28 J or more.
- the glass-based articles disclosed herein may be incorporated into another article such as an article with a display (or display articles) (e.g., consumer electronics, including mobile phones, tablets, computers, navigation systems, wearable devices (e.g., watches) and the like), architectural articles, transportation articles (e.g., automotive, trains, aircraft, sea craft, etc.), appliance articles, or any article that would benefit from some transparency, scratch-resistance, abrasion resistance or a combination thereof.
- a display or display articles
- FIGS. 40A and 40B An exemplary article incorporating any of the glass-based articles disclosed herein is shown in FIGS. 40A and 40B . Specifically, FIGS.
- 40A and 40B show a consumer electronic device 4100 including a housing 4102 having front 4104, back 4106, and side surfaces 4108; electrical components (not shown) that are at least partially inside or entirely within the housing and including at least a controller, a memory, and a display 4110 at or adjacent to the front surface of the housing; and a cover substrate 4112 at or over the front surface of the housing such that it is over the display.
- the cover substrate 4112 may include any of the glass-based articles disclosed herein.
- at least one of a portion of the housing or the cover glass comprises the glass-based articles disclosed herein.
Description
- This disclosure relates to glass-based articles exhibiting improved damage resistance, including improved fracture resistance, and more particularly to fusion-formable, glass and glass ceramic articles exhibiting a non-zero metal oxide concentration gradient or concentration that varies along a substantial portion of the thickness. This disclosure also relates to glass-based articles including a stress profile comprising two regions with varying tangents.
- Glass-based articles often experience severe impacts that can introduce large flaws into a surface of such articles. Such flaws can extend to depths of up to about 200 micrometers from the surface. Traditionally, thermally tempered glass has been used to prevent failures caused by the introduction of such flaws into the glass because thermally tempered glass often exhibits large compressive stress (CS) layers (e.g., approximately 21% of the total thickness of the glass), which can prevent the flaws from propagating further into the glass and thus, can prevent failure. An example of a stress profile generated by thermal tempering is shown in
Figure 1 . InFigure 1 , the thermally treatedglass article 100 includes afirst surface 101, a thickness t 1, and asurface CS 110. The thermally treatedglass article 100 exhibits a CS that decreases from thefirst surface 101 to a depth of compression (DOC) 130, as defined herein, at which depth the stress changes from compressive to tensile stress and reaches a maximum central tension (CT) 120. - Thermal tempering is currently limited to thick glass-based articles (i.e., glass-based articles having a thickness t 1 of about 3 millimeters or greater) because, to achieve the thermal strengthening and the desired residual stresses, a sufficient thermal gradient must be formed between the core of such articles and the surface. Such thick articles are undesirable or not practical in many applications such as display (e.g., consumer electronics, including mobile phones, tablets, computers, navigation systems, and the like), architecture (e.g., windows, shower panels, countertops etc.), transportation (e.g., automotive, trains, aircraft, sea craft, etc.), appliance, or any application that requires superior fracture resistance but thin and light-weight articles.
- Although chemical strengthening is not limited by the thickness of the glass-based article in the same manner as thermally tempering, known chemically strengthened glass-based articles do not exhibit the stress profile of thermally tempered glass-based articles. An example of a stress profile generated by chemical strengthening (e.g., by an ion exchange process), is shown in
Figure 2 . InFigure 2 , the chemically strengthened glass-basedarticle 200 includes afirst surface 201, a thickness t 2 and asurface CS 210. The glass-basedarticle 200 exhibits a CS that decreases from thefirst surface 201 to aDOC 230, as defined herein, at which depth the stress changes from compressive to tensile stress and reaches amaximum CT 220. As shown inFigure 2 , such profiles exhibit a substantially flat CT region or CT region with a constant or near constant tensile stress along at least a portion of the CT region. Often, known chemically strengthened glass-based articles exhibit a lower maximum CT value, as compared to the maximum central value shown inFigure 1 . - It would be desirable to provide glass-based articles that have relatively high compressive stress at the surface of the article, a first stress profile region having a steep slope or tangent and a second stress profile region having a less steep profile region, and methods of providing such glass articles.
-
WO 2015/195419 A2 provides a glass article which is chemically strengthened to obtain a specific stress profile. - The invention provides a glass article according to
claims claim 10. - Additional features and advantages will be set forth in the detailed description which follows, and in part will be readily apparent to those skilled in the art from that description or recognized by practicing the embodiments as described herein, including the detailed description which follows, the claims, as well as the appended drawings.
- It is to be understood that both the foregoing general description and the following detailed description are merely exemplary, and are intended to provide an overview or framework to understanding the nature and character of the claims. The accompanying drawings are included to provide a further understanding, and are incorporated in and constitute a part of this specification. The drawings illustrate one or more embodiment(s), and together with the description serve to explain principles and operation of the various embodiments.
-
-
Figure 1 is a cross-sectional view across a thickness of a known, thermally tempered glass article; -
Figure 2 is a cross-sectional view across a thickness of a known, chemically strengthened glass article; -
Figure 3 is a cross-sectional view across a thickness of a chemically strengthened glass-based article according to one or more embodiments of this disclosure; -
Figure 4 is a is a schematic cross-sectional view of a ring-on-ring apparatus; -
Figure 5 is a graph showing the maximum CT values for Examples 1A-1G as a function of ion exchange time; -
Figure 6 is a graph showing the measured stress of Example 1E as a function of depth extending from the surface of the glass-based article of Example 1E into the glass-based article; -
Figure 7 is a graph showing the load to failure values for glass-based articles according to Example 2A after being abraded at different loads or pressures; -
Figure 8 is a graph showing the heights at which the glass-based articles according to Example 2A failed after being dropped onto 180 grit sandpaper and then onto 30 grit sandpaper; -
Figure 9 is a graph showing the heights at which the glass-based articles according to Example 3A and Comparative Example 3B failed after being dropped onto 30 grit sandpaper; -
Figure 10 is a graph comparing the average load to failure of glass-based articles according to Example 3A and Comparative Example 3B, after being abraded at a load or pressure of 172.4 kPa (25 psi); -
Figure 11 is a graph comparing the average load to failure of glass-based articles according to Example 3A and Comparative Example 3B, after being abraded at a load or pressure of 310.3 kPa (45 psi); -
Figure 12 is a graph showing the stress profiles of Examples 4A-1 through 4A-6 as a function of depth; -
Figure 13 is a graph showing the maximum CT and DOC values of Examples 4A-1 through 4A-6 as a function of ion exchange time; -
Figure 14 is a graph showing the stress profiles of Examples 4B-1 through 4B-6 as a function of depth; -
Figure 15 is a graph showing the maximum CT and DOC values of Examples 4B-1 through 4B-6 as a function of ion exchange time; -
Figure 16 is a graph showing the stress profiles of Examples 4C-1 through 4C-6 as a function of depth; -
Figure 17 is a graph showing the maximum CT and DOC values of Examples 4C-1 through 4C-6 as a function of ion exchange time; -
Figure 18 is a graph showing the stress profiles of Examples 4D-1 through 4D-6 as a function of depth; -
Figure 19 is a graph showing the maximum CT and DOC values of Examples 4D-1 through 4D-6 as a function of ion exchange time; -
Figure 20 is a graph showing the stress profiles of Comparative Example 5A and Example 5B as a function of depth; -
Figure 21 is a graph showing the stored tensile energy of Comparative Example 5A and Example 5B as a function of maximum CT; -
Figure 22 is a graph showing stored tensile energy of Comparative Example 5C and Example 5D as a function of maximum CT; -
Figure 23 is a cross-sectional view across a thickness of four chemically strengthened glass-based article according to one or more embodiments of this disclosure; -
Figure 24 is a graph showing the normalized microprobe concentration profiles for K, Na and Li of a chemically strengthened glass-based article according to one or more embodiments of this disclosure; -
Figure 25 is an image of scratch test results of four chemically strengthened glass-based article according to one or more embodiments of this disclosure; and -
Figure 26 is a graph comparing the average load to failure of glass-based articles according to one or more embodiments of this disclosure. -
Figure 27A is a schematic cross-sectional representation of the dominant mechanism for failure due to damage introduction plus bending that typically occurs in glass-based articles that are used in mobile or hand held electronic devices. -
Figure 27B is a schematic cross-sectional view of an embodiment of the apparatus that is used to perform the inverted ball on sandpaper (IBoS) test described in the present disclosure. -
Figure 28 is a flow chart for a method of conducting the IBoS test in the apparatus described herein. -
Figure 29 is a side view of a testing apparatus for glass-based articles; -
Figure 30 is a side view of a portion of the testing apparatus shown inFigure 29 ; -
Figure 31 is a rear perspective view of the testing apparatus shown inFigure 29 ; -
Figure 32 is a front perspective view of the testing apparatus shown inFigure 29 ; -
Figure 33 is side view of a testing apparatus for glass-based articles; -
Figure 34 is a side view of a portion of the testing apparatus shown inFigure 29 ; -
Figure 35 is a schematic view of an alternative configuration of a portion of the testing apparatus shown inFigure 29 . -
Figure 36 is a graph showing various stress profiles according to some embodiments. -
Figure 37 is a graph showing IBoS test results for samples according to some embodiments. -
Figure 38 is a graph showing surface Impact Threshold Test results for samples according to some embodiments, and to some Comparative samples. -
Figure 39 is a graph showing edge impact test results for samples according to some embodiments. -
Figure 40A is a plan view of an exemplary electronic device incorporating any of the glass-based articles disclosed herein. -
Figure 40B is a perspective view of the exemplary electronic device ofFigure 40A . - Reference will now be made in detail to various embodiments, examples of which are illustrated in the accompanying examples and drawings.
- In the following description, like reference characters designate like or corresponding parts throughout the several views shown in the figures. It is also understood that, unless otherwise specified, terms such as "top," "bottom," "outward," "inward," and the like are words of convenience and are not to be construed as limiting terms. In addition, whenever a group is described as comprising at least one of a group of elements and combinations thereof, it is understood that the group may comprise, consist essentially of, or consist of any number of those elements recited, either individually or in combination with each other. Similarly, whenever a group is described as consisting of at least one of a group of elements or combinations thereof, it is understood that the group may consist of any number of those elements recited, either individually or in combination with each other. Unless otherwise specified, a range of values, when recited, includes both the upper and lower limits of the range. As used herein, the indefinite articles "a," "an," and the corresponding definite article "the" mean "at least one" or "one or more," unless otherwise specified. It also is understood that the various features disclosed in the specification and the drawings can be used in any and all combinations.
- As used herein, the terms "glass-based article" and "glass-based substrates" are used in their broadest sense to include any object made wholly or partly of glass. Glass-based articles include laminates of glass and non-glass materials, laminates of glass and crystalline materials, and glass-ceramics (including an amorphous phase and a crystalline phase). Unless otherwise specified, all compositions are expressed in terms of mole percent (mol%).
- Unless otherwise specified, all temperatures are expressed in terms of degrees Celsius (°C). As used herein the term "softening point" refers to the temperature at which the viscosity of a glass is approximately 107.6 poise (P), the term "anneal point" refers to the temperature at which the viscosity of a glass is approximately 1013.2 poise, the term "200 poise temperature (T200P)" refers to the temperature at which the viscosity of a glass is approximately 200 poise, the term "1011 poise temperature " refers to the temperature at which the viscosity of a glass is approximately 1011 poise, the term "35 kP temperature (T35kP)" refers to the temperature at which the viscosity of a glass is approximately 35 kilopoise (kP), and the term "160 kP temperature (T160kP)" refers to the temperature at which the viscosity of a glass is approximately 160 kP.
- Referring to the drawings in general and to
Figures 1-3 in particular, it will be understood that the illustrations are for the purpose of describing particular embodiments and are not intended to limit the disclosure or appended claims thereto. The drawings are not necessarily to scale, and certain features and certain views of the drawings may be shown exaggerated in scale or in schematic in the interest of clarity and conciseness. - As used herein, DOC refers to the depth at which the stress within the glass-based article changes compressive to tensile stress. At the DOC, the stress crosses from a positive (compressive) stress to a negative (tensile) stress (e.g., 130 in
Figure 1 ) and thus exhibits a stress value of zero. - As used herein, the terms "chemical depth", "chemical depth of layer" and "depth of chemical layer" may be used interchangeably and refer to the depth at which an ion of the metal oxide or alkali metal oxide (e.g., the metal ion or alkali metal ion) diffuses into the glass-based article and the depth at which the concentration of the ion reaches a minimum value, as determined by Electron Probe Micro-Analysis (EPMA) or Glow Discharge - Optival Emission Spectroscopy (GD-OES)). In particular, to assess the depth of Na2O diffusion or Na+ ion concentration may be determined using EPMA and a surface stress meter (described in more detail below).
- According to the convention normally used in the art, compressive stress is expressed as a negative (< 0) and tenslie stress is expressed as a positive (> 0) stress. Throughout this description, however, CS is expressed as a positive or absolute value - i.e., as recited herein, CS = | CS | .
- Described herein are thin, chemically strengthened glass-based articles that include glasses, such as silicate glasses including alkali-containing glass, and glass-ceramics that may be used as a cover glass for mobile electronic devices and touch-enabled displays. The glass-based articles may also be used in displays (or as display articles) (e.g., billboards, point of sale systems, computers, navigation systems, and the like), architectural articles (walls, fixtures, panels, windows, etc.), transportation articles (e.g., in automotive applications, trains, aircraft, sea craft, etc.), appliances (e.g., washers, dryers, dishwashers, refrigerators and the like), or any article that requires some fracture resistance.
- In particular, the glass-based articles described herein are thin and exhibit stress profiles that are typically only achievable through thermal tempering thick glass articles (e.g., having a thickness of about 2 mm or 3 mm or greater). The glass-based articles exhibit unique stress profiles along the thickness thereof. In some cases, the glass-based articles described herein exhibit a greater surface CS than thermally tempered glass articles. In one or more embodiments, the glass-based articles have a compressive stress layer that extends deeper into the glass-based article (in which the CS decreases and increases more gradually than known chemically strengthened glass-based articles) such that the glass-based article exhibits substantially improved fracture resistance, even when the glass-based article or a device including the same is dropped on a hard surface (e.g., granite) or a hard and rough surface (e.g., asphalt). The glass-based articles of one or more embodiments exhibit a greater maximum CT value than some known chemically strengthened glass substrates.
- CS and depth of penetration of potassium ions ("Potassium DOL"), or depth of chemical layer "DOL" or "chemical DOL", which are typically indicative of the depth of the compressive stress layer particularly of a surface spike as typically caused by potassium ions, are measured using those means known in the art. As used herein, DOC means the depth at which the stress in the chemically strengthened alkali aluminosilicate glass article described herein changes from compressive to tensile. DOC may be measured by FSM or a scattered light polariscope (SCALP) depending on the ion exchange treatment. Where the stress in the glass article is generated by exchanging potassium ions into the glass article, FSM is used to measure DOC. Where the stress is generated by exchanging sodium ions into the glass article, SCALP is used to measure DOC. Where the stress in the glass article is generated by exchanging both potassium and sodium ions into the glass, the DOC is measured by SCALP, since it is believed the exchange depth of sodium indicates the DOC and the exchange depth of potassium ions indicates a change in the magnitude of the compressive stress (but not the change in stress from compressive to tensile); the exchange depth of potassium ions in such glass articles is measured by FSM.
- Potassium DOL is distinguished from DOC because it represents the depth of potassium penetration as a result of an ion exchange process. Potassium DOL is typically less than the DOC for the articles described herein. CS and Potassium DOL are measured by surface stress meter (FSM) using commercially available instruments such as the FSM-6000, manufactured by Orihara Industrial Co., Ltd. (Japan). Surface stress measurements rely upon the accurate measurement of the stress optical coefficient (SOC), which is related to the birefringence of the glass. SOC in turn is measured according to a modified version of Procedure C described in ASTM standard C770-98 (2013), entitled "Standard Test Method for Measurement of Glass Stress-Optical Coefficient," the contents of which are incorporated herein by reference in their entirety. The modification includes using a glass disc as the specimen with a thickness of 5 to 10 mm and a diameter of 12.7 mm, wherein the disc is isotropic and homogeneous and core drilled with both faces polished and parallel. The modification also includes calculating the maximum force, Fmax to be applied. The force should be sufficient to produce 20 MPa or more compression stress. Fmax is calculated as follows:

- Where:
- Fmax = Force in Newtons
- D = the diameter of the disc
- h= the thickness of the light path
- For each force applied, the stress is computed as follows:

- Where:
- F = Force in Newtons
- D = the diameter of the disc
- h= the thickness of the light path
- Maximum CT values are measured using a scattered light polariscope (SCALP). Refracted near-field (RNF) method or SCALP may be used to measure the stress profile. When the RNF method is utilized, the maximum CT value provided by SCALP is utilized. In particular, the stress profile measured by the RNF method is force balanced and calibrated to the maximum CT value provided by a SCALP measurement. The RNF method is described in
U.S. Patent No. 8,854,623 , entitled "Systems and methods for measuring a profile characteristic of a glass sample". In particular, the RNF method includes placing the glass-based article adjacent to a reference block, generating a polarization-switched light beam that is switched between orthogonal polarizations at a rate of between 1 Hz and 50 Hz, measuring an amount of power in the polarization-switched light beam and generating a polarization-switched reference signal, wherein the measured amounts of power in each of the orthogonal polarizations are within 50% of each other. The method further includes transmitting the polarization-switched light beam through the glass sample and reference block for different depths into the glass sample, then relaying the transmitted polarization-switched light beam to a signal photodetector using a relay optical system, with the signal photodetector generating a polarization-switched detector signal. The method also includes dividing the detector signal by the reference signal to form a normalized detector signal and determining the profile characteristic of the glass sample from the normalized detector signal. The RNF profile is then smoothed, and used for the CT region. As noted above, the FSM technique is used for the surface CS and slope of the stress profile in the CS region near the surface. - As stated above, the glass-based articles described herein are chemically strengthened by ion exchange and exhibit stress profiles that are distinguished from those exhibited by known strengthened glass articles. In this disclosure glass-based substrates are generally unstrengthened and glass-based articles generally refer to glass-based substrates that have been strengthened (by, for example, ion exchange). In this process, ions at or near the surface of the glass-based article are replaced by - or exchanged with - larger ions having the same valence or oxidation state. In those embodiments in which the glass-based article comprises an alkali aluminosilicate glass, ions in the surface layer of the glass and the larger ions are monovalent alkali metal cations, such as Li+ (when present in the glass-based article), Na+, K+, Rb+, and Cs+. Alternatively, monovalent cations in the surface layer may be replaced with monovalent cations other than alkali metal cations, such as Ag+ or the like.
- Ion exchange processes are typically carried out by immersing a glass-based substrate in a molten salt bath (or two or more molten salt baths) containing the larger ions to be exchanged with the smaller ions in the glass-based substrate. It should be noted that aqueous salt baths may also be utilized. In addition, the composition of the bath(s) may include more than one type of larger ion (e.g., Na+ and K+) or a single larger ion. It will be appreciated by those skilled in the art that parameters for the ion exchange process, including, but not limited to, bath composition and temperature, immersion time, the number of immersions of the glass-based article in a salt bath (or baths), use of multiple salt baths, additional steps such as annealing, washing, and the like, are generally determined by the composition of the glass-based article (including the structure of the article and any crystalline phases present) and the desired DOL or DOC and CS of the glass-based article that results from strengthening. By way of example, ion exchange of glass-based substrates may be achieved by immersion of the glass-based substrates in at least one molten bath containing a salt such as, but not limited to, nitrates, sulfates, and chlorides of the larger alkali metal ion. Typical nitrates include KNO3, NaNO3, LiNO3, NaSO4 and combinations thereof. The temperature of the molten salt bath typically is in a range from about 380°C up to about 450°C, while immersion times range from about 15 minutes up to about 100 hours depending on glass thickness, bath temperature and glass diffusivity. However, temperatures and immersion times different from those described above may also be used.
- In one or more embodiments, the glass-based substrates may be immersed in a molten salt bath of 100% NaNO3 having a temperature from about 370 °C to about 480 °C. In some embodiments, the glass-based substrate may be immersed in a molten mixed salt bath including from about 5% to about 90% KNO3 and from about 10% to about 95% NaNO3. In some embodiments, the glass-based substrate may be immersed in a molten mixed salt bath including Na2SO4 and NaNO3 and have a wider temperature range (e.g., up to about 500 °C). In one or more embodiments, the glass-based article may be immersed in a second bath, after immersion in a first bath. Immersion in a second bath may include immersion in a molten salt bath including 100% KNO3 for 15 minutes to 8 hours.
- In one or more embodiments, the glass-based substrate may be immersed in a molten, mixed salt bath including NaNO3 and KNO3 (e.g., 49%/51%, 50%/50%, 51%/49%) having a temperature less than about 420 °C (e.g., about 400 °C or about 380 °C). for less than about 5 hours, or even about 4 hours or less.
- Ion exchange conditions can be tailored to provide a "spike" or to increase the slope of the stress profile at or near the surface of the resulting glass-based article. This spike can be achieved by single bath or multiple baths, with the bath(s) having a single composition or mixed composition, due to the unique properties of the glass compositions used in the glass-based articles described herein.
- As illustrated in
Figure 3 , the glass-basedarticle 300 of one or more embodiments includes afirst surface 302 and asecond surface 304 opposing the first surface, defining a thickness t. In one or more embodiments, the thickness t may be about 3 millimeters or less (e.g., in the range from about 0.01 millimeter to about 3 millimeters, from about 0.1 millimeter to about 3 millimeters, from about 0.2 millimeter to about 3 millimeters, from about 0.3 millimeter to about 3 millimeters, from about 0.4 millimeter to about 3 millimeters, from about 0.01 millimeter to about 2.5 millimeters, from about 0.01 millimeter to about 2 millimeters, from about 0.01 millimeter to about 1.5 millimeters, from about 0.01 millimeter to about 1 millimeter, from about 0.01 millimeter to about 0.9 millimeter, from about 0.01 millimeter to about 0.8 millimeter, from about 0.01 millimeter to about 0.7 millimeter, from about 0.01 millimeter to about 0.6 millimeter, from about 0.01 millimeter to about 0.5 millimeter, from about 0.1 millimeter to about 0.5 millimeter, or from about 0.3 millimeter to about 0.5 millimeter.) - The glass-based article includes a stress profile that extends from the
first surface 302 to the second surface 304 (or along the entire length of the thickness t). In the embodiment shown inFigure 3 , thestress profile 312 as measured by the techniques described herein is shown along with thestress profile 340 estimated by FSM techniques as described herein. The y-axis represents the stress value and the x-axis represents the thickness or depth within the glass-based article. - As illustrated in
Figure 3 , thestress profile 312 includes a CS layer 315 (with a surface CS 310), a CT layer 325 (with a maximum CT 320) and aDOC 317 at which thestress profile 312 turns from compressive to tensile at 330. TheCT layer 325 also has an associated depth or length 327 (CT region or layer). The estimatedstress profile 340 includes a DOL that is greater than the DOC. As used herein, reference to the DOC and DOL is with respect to a depth from one surface (either thefirst surface 302 or the second surface 304), with the understanding that such DOC or DOL may also be present from the other surface. - The
surface CS 310 may be about 150 MPa or greater or about 200 MPa or greater (e.g., about 250 MPa or greater, about 300 MPa or greater, about 400 MPa or greater, about 450 MPa or greater, about 500 MPa or greater, or about 550 MPa or greater). Thesurface CS 310 may be up to about 900 MPa, up to about 1000 MPa, up to about 1100 MPa, or up to about 1200 MPa. The surface CS values provided herein may also comprise the maximum CS. In some embodiments, the surface CS is less than the maximum CS. - The
maximum CT 320 may be about 80 MPa or less, about 75 MPa or less, or about 70 MPa or less (e.g., about 60 MPa or less, about 55 MPa or less, 50 MPa or less, or about 40 MPa or less). In some embodiments, themaximum CT 320 may be in the range from about 25 MPa to about 80 MPa (e.g., from about 25 MPa to about 75 MPa, from about 25 MPa to about 70 MPa, from about 25 MPa to about 65 MPa, from about 45 MPa to about 80 MPa, from about 50 MPa to about 80 MPa, or from about 60 MPa to about 80 MPa). - The
maximum CT 320 may be positioned at a range from about 0.3•t to about 0.7•t, from about 0.4•t to about 0.6•t or from about 0.45•t to about 0.55•t. It should be noted that any one or more ofsurface CS 310 andmaximum CT 320 may be dependent on the thickness of the glass-based article. For example, glass-based articles having at thickness of about 0.8 mm may have a maximum CT of about 75 MPa or less. When the thickness of the glass-based article decreases, the maximum CT may increase. In other words, the maximum CT increases with decreasing thickness (or as the glass-based article becomes thinner). - In some embodiments, the ratio of the
maximum CT 320 to thesurface CS 310 in the range from about 0.01 to about 0.2 (e.g., in the range from about 0.01 to about 0.18, from about 0.01 to about 0.16, from about 0.01 to about 0.15, from about 0.01 to about 0.14, from about 0.01 to about 0.1, from about 0.02 to about 0.2, from about 0.04 to about 0.2, from about 0.05 to about 0.2, from about 0.06 to about 0.2, from about 0.08 to about 0.2, from about 0.1 to about 0.2, or from about 0.12 to about 0.2). In known chemically strengthened glass-based articles, the ratio of themaximum CT 320 to the absolute value ofsurface CS 310 is 0.2 or less, or about 0.15 or less. In some embodiments, absolute value of surface CS may be 1.5 times (or 2 times or 2.5 times) the maximum CT or greater. In some embodiments, the absolute value of surface CS may be up to about 48 times the maximum CT, up to 40 times the maximum CT, up to 20 times the maximum CT, 10 up to times the maximum CT, or up to 8 times the maximum CT. The absolute value of surface CS may be in the range from about 5 times up to about 50 times the maximum CT. - In one or more embodiments, the
stress profile 312 comprises a maximum CS, which is typically thesurface CS 310 and can be found at one or both of thefirst surface 302 and thesecond surface 304. In one or more embodiments, the CS layer orregion 315 extends along a portion of the thickness to theDOC 317 and amaximum CT 320. In one or more embodiments, theDOC 317 may be about 0.1•t or greater. For example, theDOC 317 may be about 0.12•t or greater, about 0.14•t or greater, about 0.15•t or greater, about 0.16•t or greater, 0.17•t or greater, 0.18•t or greater, 0.19•t or greater, 0.20•t or greater, about 0.21•t or greater, or up to about 0.25•t. In some embodiments, theDOC 317 is less than thechemical depth 342. Thechemical depth 342 may be about 0.4•t or greater, 0.5•t or greater, about .55•t or greater, or about 0.6•t or greater. In one or more embodiments, thestress profile 312 may be described as parabolic-like in shape. In some embodiments, the stress profile along the region or depth of the glass-based article exhibiting tensile stress exhibits a parabolic-like shape. In one or more specific embodiments, thestress profile 312 is free of a flat stress (i.e., compressive or tensile) portion or a portion that exhibits a substantially constant stress (i.e., compressive or tensile). In some embodiments, the CT region exhibits a stress profile that is substantially free of a flat stress or free of a substantially constant stress. In one or more embodiments, all points of thestress profile 312 between a thickness range from about 0t up to about 0.2•t and greater than 0.8•t (or from about 0•t to about 0.3•t and greater than 0.7•t) comprise a tangent having a slope that is less than about -0.1 MPa/micrometers or greater than about 0.1 MPa/micrometers. In some embodiments, the slope may be less than about - 0.2 MPa/micrometers or greater than about 0.2 MPa/micrometers. In some more specific embodiments, the slope may be less than about -0.3 MPa/micrometers or greater than about 0.3 MPa/micrometers. In even more specific embodiments, the slope may be less than about -0.5 MPa/micrometers or greater than about 0.5 MPa/micrometers. In other words, the stress profile of one or more embodiments along these thickness ranges (i.e., 0•t up to about 0.2•t and greater than 0.8t, or from about 0t to about 0.3•t and 0.7•t or greater) exclude points having a tangent with a slope, as described herein. Without being bound by theory, known error function or quasi-linear stress profiles have points along these thickness ranges (i.e., from about 0•t up to about 0.2•t and greater than 0.8•t, or from about 0•t to about 0.3•t and 0.7•t or greater) that have a tangent with a slope that is in the range from about -0.1 MPa/micrometers to about 0.1 MPa/micrometers, (indicating a flat or zero slope stress profile along such thickness ranges, as shown inFigure 2 , 220). The glass-based articles of one or more embodiments of this disclosure do not exhibit such a stress profile having a flat or zero slope stress profile along these thickness ranges, as shown inFigure 3 . - In one or more embodiments, the glass-based article exhibits a stress profile in a thickness range from about 0.1•t to 0.3•t and from about 0.7•t to 0.9•t that comprises a tangent with a maximum slope and a tangent with a minimum slope. In some instances, the difference between the maximum slope and the minimum slope is about 3.5 MPa/micrometers or less, about 3 MPa/micrometers or less, about 2.5 MPa/micrometers or less, or about 2 MPa/micrometers or less. In other embodiments, this thickness range in which the difference between the maximum and minimum slope falls within the above ranges comprises up to about 0.02•t and greater than 0.980•t, for example up to about 0.0250•t and greater than 0.9750•t, or up to about 0.0275•t and greater than 0.9725•t, or up to about 0.030•t and greater than 0.970•t, or up to about 0.0350•t and greater than 0.9650•t.
- In one or more embodiments, the glass-based article includes a
stress profile 312 that is substantially free of any flat segments that extend in a depth direction or along at least a portion of the thickness t of the glass-based article. In other words, thestress profile 312 is substantially continuously increasing or decreasing along the thickness t. In some embodiments, the stress profile is substantially free of any flat segments in a depth direction having a length of about 10 micrometers or more, about 50 micrometers or more, or about 100 micrometers or more, or about 200 micrometers or more. As used herein, the term "flat" refers to a slope having a magnitude of less than about 5 MPa/micrometer, or less than about 2 MPa/micrometer along the flat segment. In some embodiments, one or more portions of the stress profile that are substantially free of any flat segments in a depth direction are present at depths within the glass-based article of about 5 micrometers or greater (e.g., 10 micrometers or greater, or 15 micrometers or greater) from either one or both the first surface or the second surface. For example, along a depth of about 0 micrometers to less than about 5 micrometers from the first surface, the stress profile may include linear segments, but from a depth of about 5 micrometers or greater from the first surface, the stress profile may be substantially free of flat segments. As used herein "linear" includes line segments having flat slope as well as line segments not having flat slopes; for example of the latter, seeFigure 6 within a depth of about 12 microns from the surface. - In some embodiments, the stress profile may include linear segments at depths from about 0t up to about 0.1t and may be substantially free of flat segments at depths of about 0.1 t to about 0.4t. In some embodiments, the stress profile from a thickness in the range from about Otto about 0.1t may have a slope in the range from about 20 MPa/microns to about 200 MPa/microns. As will be described herein, such embodiments may be formed using a single ion-exchange process by which the bath includes two or more alkali salts or is a mixed alkali salt bath or multiple (e.g., 2 or more) ion exchange processes.
- In one or more embodiments, the glass-based article may be described in terms of the shape of the stress profile along the CT region (327 in
Figure 3 ). For example, in some embodiments, the stress profile along the CT region (where stress is in tension) may be approximated by equation. In some embodiments, the stress profile along the CT region may be approximated by equation (1):
Figure 3 ), x=0.5t is the center of the glass-based article, stress(x)=MaxCT, and x=t is the opposite surface (304, inFigure 3 ). MaxCT used in equation (1) may be in the range from about 50 MPa to about 80 MPa (e.g., from about 60 MPa to about 80 MPa, from about 70 MPa to about 80 MPa, from about 50 MPa to about 75 MPa, from about 50 MPa to about 70 MPa, or from about 50 MPa to about 65 MPa), and n is a fitting parameter from 1.5 to 5 (e.g., 2 to 4, 2 to 3 or 1.8 to 2.2) whereby n=2 can provide a parabolic stress profile, exponents that deviate from n=2 provide stress profiles with near parabolic stress profiles. - In some embodiments, the stress profile may be modified by heat treatment. In such embodiments, the heat treatment may occur before any ion-exchange processes, between ion-exchange processes, or after all ion-exchange processes. In some embodiments, the heat treatment may reduce the slope of the stress profile at or near the surface. In some embodiments, where a steeper or greater slope is desired at the surface, an ion-exchange process after the heat treatment may be utilized to provide a "spike" or to increase the slope of the stress profile at or near the surface.
- In one or more embodiments, the stress profile 312 (and/or estimated stress profile 340) is generated due to a non-zero concentration of a metal oxide(s) that varies along a portion of the thickness, for example along a thickness segment of about 10 micrometers, 100 micrometers, or the entire thickness. The variation in concentration may be referred to herein as a gradient. In some embodiments, the concentration of a metal oxide is both non-zero and varies along a thickness range from about 0•t to about 0.3•t. In some embodiments, the concentration of the metal oxide is non-zero and varies along a thickness range from about 0•t to about 0.35•t, from about 0•t to about 0.4•t, from about 0•t to about 0.45•t or from about 0•t to about 0.48•t. The metal oxide may be described as generating a stress in the glass-based article. The variation in concentration may be continuous along the above-referenced thickness ranges. Variation in concentration may include a change in metal oxide concentration of about 0.2 mol% along a thickness segment of about 100 micrometers. This change may be measured by known methods in the art including microprobe, as shown in Example 1. The metal oxide that is non-zero in concentration and varies along a portion of the thickness may be described as generating a stress in the glass-based article.
- The variation in concentration may be continuous along the above-referenced thickness ranges. In some embodiments, the variation in concentration may be continuous along thickness segments in the range from about 10 micrometers to about 30 micrometers. In some embodiments, the concentration of the metal oxide decreases from the first surface to a value at a point between the first surface and the second surface and increases from the value to the second surface.
- The concentration of metal oxide may include more than one metal oxide (e.g., a combination of Na2O and K2O). In some embodiments, where two metal oxides are utilized and where the radius of the ions differ from one or another, the concentration of ions having a larger radius is greater than the concentration of ions having a smaller radius at shallow depths, while at deeper depths, the concentration of ions having a smaller radius is greater than the concentration of ions having larger radius. For example, where a single Na- and K-containing bath is used in the ion exchange process, the concentration of K+ ions in the glass-based article is greater than the concentration of Na+ ions at shallower depths, while the concentration of Na+ is greater than the concentration of K+ ions at deeper depths. This is due, in part, due to the size of the ions. In such glass-based articles, the area at or near the surface comprises a greater CS due to the greater amount of larger ions (i.e., K+ ions) at or near the surface. This greater CS may be exhibited by a stress profile having a steeper slope at or near the surface (i.e., a spike in the stress profile at the surface).
- The concentration gradient or variation of one or more metal oxides is created by chemically strengthening a glass-based substrate, as previously described herein, in which a plurality of first metal ions in the glass-based substrate is exchanged with a plurality of second metal ions. The first ions may be ions of lithium, sodium, potassium, and rubidium. The second metal ions may be ions of one of sodium, potassium, rubidium, and cesium, with the proviso that the second alkali metal ion has an ionic radius greater than the ionic radius of the first alkali metal ion. The second metal ion is present in the glass-based substrate as an oxide thereof (e.g., Na2O, K2O, Rb2O, Cs2O or a combination thereof).
- In one or more embodiments, the metal oxide concentration gradient extends through a substantial portion of the thickness t or the entire thickness t of the glass-based article, including the
CT layer 327. In one or more embodiments, the concentration of the metal oxide is about 0.5 mol% or greater in theCT layer 327. In some embodiments, the concentration of the metal oxide may be about 0.5 mol% or greater (e.g., about 1 mol% or greater) along the entire thickness of the glass-based article, and is greatest at thefirst surface 302 and/or thesecond surface 304 and decreases substantially constantly to a value at a point between thefirst surface 302 and thesecond surface 304. At that point, the concentration of the metal oxide is the least along the entire thickness t; however the concentration is also non-zero at that point. In other words, the non-zero concentration of that particular metal oxide extends along a substantial portion of the thickness t (as described herein) or the entire thickness t. In some embodiments, the lowest concentration in the particular metal oxide is in theCT layer 327. The total concentration of the particular metal oxide in the glass-based article may be in the range from about 1 mol% to about 20 mol%. - In one or more embodiments, the glass-based article includes a first metal oxide concentration and a second metal oxide concentration, such that the first metal oxide concentration is in the range from about 0 mol% to about 15 mol% along a first thickness range from about 0t to about 0.5t, and the second metal oxide concentration is in the range from about 0 mol% to about 10 mol% from a second thickness range from about 0 micrometers to about 25 micrometers (or from about 0 micrometers to about 12 micrometers); however, the concentration of one or both the first metal oxide and the second metal oxide is non-zero along a substantial portion or the entire thickness of the glass-based article. The glass-based article may include an optional third metal oxide concentration. The first metal oxide may include Na2O while the second metal oxide may include K2O.
- The concentration of the metal oxide may be determined from a baseline amount of the metal oxide in the glass-based article prior to being modified to include the concentration gradient of such metal oxide.
- In one or more embodiments, the glass-based articles may be described in terms of how they fracture and the fragments that result from such fracture. In one or more embodiments, when fractured, the glass-based articles fracture into 2 or more fragments per square inch (or per 6.4516 square centimeters) of the glass-based article (prior to fracture) , wherein the sample size used was a 5.08 cm by 5.08 cm (2 inch by 2 inch) square. In some cases, the glass-based articles fracture into 3 or more, 4 or more, 5 or more, or 10 or more fragments per square inch (or per 6.4516 square centimeters) of the glass-based article (prior to fracture) , wherein the sample size used was a 5.08 cm by 5.08 cm (2 inch by 2 inch) square . In some instances, when fractured, the glass-based articles fracture into fragments such that 50% or more of the fragments have a surface area that is less than 5%, less than 2%, or less than 1% of the surface area of the glass-based article (prior to fracture). In some embodiments, when fractured, the glass-based articles fracture into fragments such that 90% or more or even 100% of the fragments have a surface area that is less than 5%, less than 2%, or less than 1% of the surface area of the glass-based article (prior to fracture).
- In one or more embodiments, after chemically strengthening the glass-based article, the resulting stress profile 312 (and estimated stress profile 340) of the glass-based article provides improved fracture resistance. For example, in some embodiments, upon fracture, the glass-based article comprises fragments having an average longest cross-sectional dimension of less than or equal to about 0.2•t.
- In one or more embodiments, the glass-based articles may exhibit a fracture toughness (K1C) of about 0.7 MPa·m1/2 or greater. In some cases, the fracture toughness may be about 0.8 MPa·m1/2 or greater, or about 0.9 MPa·m1/2 or greater. In some embodiments the fracture toughness may be in the range from about 0.7 MPa·m1/2 to about 1 MP·am1/2. The fracture toughness value K1C) recited in this disclosure refers to a value as measured by chevron notched short bar (CNSB) method disclosed in Reddy, K.P.R. et al, "Fracture Toughness Measurement of Glass and Ceramic Materials Using Chevron-Notched Specimens," J. Am. Ceram. Soc., 71 [6], C-310-C-313 (1988) except that Y∗ m is calculated using
equation 5 of Bubsey, R.T. et al., "Closed-Form Expressions for Crack-Mouth Displacement and Stress Intensity Factors for Chevron-Notched Short Bar and Short Rod Specimens Based on Experimental Compliance Measurements," NASA Technical Memorandum 83796, pp. 1-30 (October 1992). - In some embodiments, the substrate may also be characterized as having a hardness from about 500 HVN to about 800 HVN, as measured by Vickers hardness test at a load of 200 g.
- The glass-based articles described herein may exhibit a stored tensile energy in the range from greater than 0 J/m2 to about 20 J/m2. In some instances, the stored tensile energy may be in the range from about 1 J/m2 to about 20 J/m2, from about 2 J/m2 to about 20 J/m2, from about 3 J/m2 to about 20 J/m2, from about 4 J/m2 to about 20 J/m2, from about 1 J/m2 to about 19 J/m2, from about 1 J/m2 to about 18 J/m2, from about 1 J/m2 to about 16 J/m2, from about 4 J/m2 to about 20 J/m2, or from about 4 J/m2 to about 18 J/m2. The stored tensile energy is calculated the following Equation (2):

- The glass-based articles described herein generally have elastic modulus or Young's modulus of less than about 80 GPa. The elastic modulus, which is intrinsic to the composition of the glass-based article, can provide the desired high stiffness, which is an extrinsic property, to the ultimate glass-based article that is produced therefrom. For clarity, unless the specific type of elastic modulus measurement is explicitly indicated, the elastic modulus described herein will be the Young's modulus of a material, rather than, for example, shear modulus, bulk modulus, Poisson's ratio, and the like.
- In some embodiments, the glass-based article comprises a high liquidus viscosity that enables the formation of the glass-based articles via down-draw techniques (e.g., fusion draw, slot draw, and other like methods), which can provide high precision surface smoothness. As used herein, the term "liquidus viscosity" refers to the viscosity of a molten glass at the liquidus temperature, wherein the term "liquidus temperature" refers to the temperature at which crystals first appear as a molten glass cools down from the melting temperature (or the temperature at which the very last crystals melt away as temperature is increased from room temperature). The liquidus viscosity is determined by the following method. First the liquidus temperature of the glass is measured in accordance with ASTM C829-81 (2015), titled "Standard Practice for Measurement of Liquidus Temperature of Glass by the Gradient Furnace Method" . Next the viscosity of the glass at the liquidus temperature is measured in accordance with ASTM C965-96(2012), titled "Standard Practice for Measuring Viscosity of Glass Above the Softening Point". In general, the glass-based articles (or the compositions used to form such articles) described herein a liquidus viscosity of about 100 kilopoise (kP) or greater. In scenarios where a higher liquidus viscosity is desired for down-draw processability, the glass-based articles (or the compositions used to form such articles) exhibit a liquidus viscosity of at 200 kP or more (e.g., about 600 kP or greater).
- In one or more embodiments, the glass-based articles exhibit a Knoop Lateral Cracking Scratch Threshold in the range from about 4 N to about 7 N, from about 4.5 N to about 7 N, from about 5 N to about 7 N, from about 4 N to about 6.5 N, from about 4 N to about 6 N, or from about 5 N to about 6 N. As used herein, Knoop Scratch Lateral Cracking Threshold is the onset of lateral cracking (in 3 or more of 5 indentation events) which extend equal to or greater than 2 times the width of the microductile scratch groove, formed using a Knoop indenter. In some embodiments, the Knoop Lateral Cracking scratch Threshold may be in the range of from about 10 to about 16 Newtons. As used herein, Knoop Scratch Lateral Cracking Threshold is the onset of lateral cracking (in 3 or more of 5 scratch events). A series of increasing constant load scratches (3 minimum per load, but more per load could be used to increase confidence level) are performed to identify the Knoop scratch threshold. In Knoop Scratch Lateral Cracking Threshold testing, for each load, samples of the glass substrates and/or articles were scratched with a Knoop indenter over a length of 10mm with a velocity of 0.25 mm/s. The Knoop scratch threshold range can be determined by comparing the test specimen to one of the following 3 failure modes: 1) sustained lateral surface cracks that are more than two times the width of the groove, 2) damage is contained within the groove, but there are lateral surface cracks that are less than two times the width of groove and there is damage visible by naked eye, or 3) the presence of large subsurface lateral cracks which are greater than two times the width of the groove and/or there is a median crack at the vertex of the scratch. The scratch threshold is then the highest load at which failure does not occur in 3 or more of 5 events.
- In one or more embodiments, the glass-based articles exhibit a Vickers Indentation Fracture Threshold in the range from about 10 kgf or greater, about 12 kgf or greater, or about 15 kgf or greater. As used herein, Indentation Fracture Threshold (or Vickers crack initiation threshold) was measured by a Vickers indenter. Vickers Indentation Fracture Threshold is a measure of indentation damage resistance of the glass. The test involved the use of a square-based pyramidal diamond indenter with an angle of 136° between faces, referred to as a Vickers indenter. The Vickers indenter was same as the one used in standard micro hardness testing (reference ASTM-E384-11). A minimum of five specimens were chosen to represent the glass type and/or pedigree of interest. For each specimen, multiple sets of five indentations were introduced to the specimen surface. Each set of five indentations was introduced at a given load, with each individual indentation separated by a minimum of 5 mm and no closer than 5 mm to a specimen edge. A rate of indenter loading/unloading of 50 kg/minute was used for test loads ≥ 2 kg. For test loads < 2 kg, a rate of 5 kg/minute was used. A dwell (i.e., hold) time of 10 seconds at the target load was utilized. The machine maintained load control during the dwell period. After a period of at least 12 hours, the indentations were inspected in under reflected light using a compound microscope at 500X magnification. The presence or absence of median/radial cracks, or specimen fracture, was then noted for each indentation. Note that the formation of lateral cracks was not considered indicative of exhibiting threshold behavior, since the formation of median/radial cracks was of interest, or specimen fracture, for this test. The specimen threshold value is defined as the midpoint of the lowest consecutive indentation loads which bracket greater than 50% of the individual indentations meeting threshold. For example, if within an
individual specimen 2 of the 5 (40%) indentations induced at a 5 kg load have exceeded threshold, and 3 of the 5 (60%) indentations induced at a 6 kg load have exceeded threshold, then the specimen threshold value would be defined as the midpoint of 5 and 6 kg, or 5.5 kg. The sample mean threshold value is defined as the arithmetic mean of all individual specimen threshold values. Along with the mean, the range (lowest value to highest value) of all the specimen midpoints was reported for each sample. The pre-test, test and post-test environment was controlled to 23±2°C and 50±5%RH to minimize variation in the fatigue (stress corrosion) behavior of the glass specimens. It should be noted that when first testing an unfamiliar composition or pedigree, the required indentation loads and bracketing increment were determined by performing an "iterative search." Once familiarity with the sample's performance was gained, future testing may be streamlined by testing only those loads near the expected threshold, and then "filling in" additional indentation loads only if necessary. - In one or more embodiments, the glass-based articles exhibit improved surface strength when subjected to abraded ring-on-ring (AROR) testing. The strength of a material is defined as the stress at which fracture occurs. The AROR test is a surface strength measurement for testing flat glass specimens, and ASTM C1499-09(2013), entitled "Standard Test Method for Monotonic Equibiaxial Flexural Strength of Advanced Ceramics at Ambient Temperature," serves as the basis for the AROR test methodology described herein. The contents of ASTM C1499-09 are incorporated herein by reference in their entirety. In one embodiment, the glass specimen is abraded prior to ring-on-ring testing with 90 grit silicon carbide (SiC) particles that are delivered to the glass sample using the method and apparatus described in Annex A2, entitled "abrasion Procedures," of ASTM C158-02(2012), entitled "Standard Test Methods for Strength of Glass by Flexure (Determination of Modulus of Rupture). The contents of ASTM C158-02 and the contents of
Annex 2 in particular are incorporated herein by reference in their entirety. - Prior to ring-on-ring testing a surface of the glass-based article is abraded as described in ASTM C158-02,
Annex 2, to normalize and/or control the surface defect condition of the sample using the apparatus shown in Figure A2.1 of ASTM C158-02. The abrasive material is typically sandblasted onto thesurface 110 of the glass-based article at a load of 15 psi using an air pressure of 304 kPa (44 psi); although in the Examples below, the abrasive material was sandblasted onto thesurface 110 at other loads (e.g., 25 psi or 45 psi). After air flow is established, 5 cm3 of abrasive material is dumped into a funnel and the sample is sandblasted for 5 seconds after introduction of the abrasive material. - For the AROR test, a glass-based article having at least one abraded
surface 410 as shown inFigure 4 is placed between two concentric rings of differing size to determine equibiaxial flexural strength (i.e., the maximum stress that a material is capable of sustaining when subjected to flexure between two concentric rings), as also shown inFigure 4 . In theAROR configuration 400, the abraded glass-basedarticle 410 is supported by asupport ring 420 having a diameter D2. A force F is applied by a load cell (not shown) to the surface of the glass-based article by aloading ring 430 having a diameter D1. - The ratio of diameters of the loading ring and support ring D1/D2 may be in a range from about 0.2 to about 0.5. In some embodiments, D1/D2 is about 0.5. Loading and support rings 130, 120 should be aligned concentrically to within 0.5% of support ring diameter D2. The load cell used for testing should be accurate to within ±1% at any load within a selected range. In some embodiments, testing is carried out at a temperature of 23±2°C and a relative humidity of 40±10%.
- For fixture design, the radius r of the protruding surface of the
loading ring 430, h/2 ≤r ≤ 3h/2, where h is the thickness of glass-basedarticle 410. Loading and support rings 430, 420 are typically made of hardened steel with hardness HRc > 40. AROR fixtures are commercially available. - The intended failure mechanism for the AROR test is to observe fracture of the glass-based
article 410 originating from thesurface 430a within theloading ring 430. Failures that occur outside of this region - i.e., between the loading rings 430 and support rings 420 - are omitted from data analysis. Due to the thinness and high strength of the glass-basedarticle 410, however, large deflections that exceed ½ of the specimen thickness h are sometimes observed. It is therefore not uncommon to observe a high percentage of failures originating from underneath theloading ring 430. Stress cannot be accurately calculated without knowledge of stress development both inside and under the ring (collected via strain gauge analysis) and the origin of failure in each specimen. AROR testing therefore focuses on peak load at failure as the measured response. - The strength of glass-based article depends on the presence of surface flaws. However, the likelihood of a flaw of a given size being present cannot be precisely predicted, as the strength of glass is statistical in nature. A probability distribution can therefore generally be used as a statistical representation of the data obtained.
- In some embodiments, the glass-based articles described herein have a surface or equibiaxial flexural strength of 20 kgf or more, and up to about 30 kgf as determined by AROR testing using a load of 172.4 kPa (25 psi) or even 310.3 kPa (45 psi) to abrade the surface. In other embodiments, the surface strength is 25 kgf or more, and in still other embodiments, 30 kgf or more.
- In some embodiments, the glass-based articles described herein may be described in terms of performance in an inverted ball on sandpaper (IBoS) test. The IBoS test is a dynamic component level test that mimics the dominant mechanism for failure due to damage introduction plus bending that typically occurs in glass-based articles that are used in mobile or hand held electronic devices, as schematically shown in
Figure 27A . In the field, damage introduction (a inFigure 27A ) occurs on the top surface of the glass-based article. Fracture initiates on the top surface of the glass-based article and damage either penetrates the glass-based article (b inFigure 27A ) or the fracture propagates from bending on the top surface or from the interior portions of the glass-based article (c inFigure 27A ). The IBoS test is designed to simultaneously introduce damage to the surface of the glass and apply bending under dynamic load. In some instances, the glass-based article exhibits improved drop performance when it includes a compressive stress than if the same glass-based article does not include a compressive stress. - An IBoS test apparatus is schematically shown in
Figure 27B .Apparatus 500 includes atest stand 510 and a ball 530. Ball 530 is a rigid or solid ball such as, for example, a stainless steel ball, or the like. In one embodiment, ball 530 is a 4.2 gram stainless steel ball having diameter of 10 mm. The ball 530 is dropped directly onto the glass-based article sample 518 from a predetermined height h. Test stand 510 includes a solid base 512 comprising a hard, rigid material such as granite or the like. A sheet 514 having an abrasive material disposed on a surface is placed on the upper surface of the solid base 512 such that surface with the abrasive material faces upward. In some embodiments, sheet 514 is sandpaper having a 30 grit surface and, in other embodiments, a 180 grit surface. The glass-based article sample 518 is held in place above sheet 514 by sample holder 515 such that an air gap 516 exists between glass-based article sample 518 and sheet 514. The air gap 516 between sheet 514 and glass-based article sample 518 allows the glass-based article sample 518 to bend upon impact by ball 530 and onto the abrasive surface of sheet 514. In one embodiment, the glass-based article sample 518 is clamped across all corners to keep bending contained only to the point of ball impact and to ensure repeatability. In some embodiments, sample holder 514 and test stand 510 are adapted to accommodate sample thicknesses of up to about 2 mm. The air gap 516 is in a range from about 50 µm to about 100 µm. Air gap 516 is adapted to adjust for difference of material stiffness (Young's modulus, Emod), but also includes the elastic modulus and thickness of the sample. An adhesive tape 520 may be used to cover the upper surface of the glass-based article sample to collect fragments in the event of fracture of the glass-based article sample 518 upon impact of ball 530. - Various materials may be used as the abrasive surface. In a one particular embodiment, the abrasive surface is sandpaper, such as silicon carbide or alumina sandpaper, engineered sandpaper, or any abrasive material known to those skilled in the art for having comparable hardness and/or sharpness. In some embodiments, sandpaper having 30 grit may be used, as it has a surface topography that is more consistent than either concrete or asphalt, and a particle size and sharpness that produces the desired level of specimen surface damage.
- In one aspect, a
method 600 of conducting the IBoS test using theapparatus 500 described hereinabove is shown inFigure 28 . In Step 610, a glass-based article sample (218 inFigure 36 ) is placed in thetest stand 510, described previously and secured in sample holder 515 such that an air gap 516 is formed between the glass-based article sample 518 and sheet 514 with an abrasive surface.Method 600 presumes that the sheet 514 with an abrasive surface has already been placed intest stand 510. In some embodiments, however, the method may include placing sheet 514 in test stand 510 such that the surface with abrasive material faces upward. In some embodiments (Step 610a), an adhesive tape 520 is applied to the upper surface of the glass-based article sample 518 prior to securing the glass-based article sample 518 in thesample holder 510. - In Step 520, a solid ball 530 of predetermined mass and size is dropped from a predetermined height h onto the upper surface of the glass-based article sample 518, such that the ball 530 impacts the upper surface (or adhesive tape 520 affixed to the upper surface) at approximately the center (i.e., within 1 mm, or within 3 mm, or within 5 mm, or within 10 mm of the center) of the upper surface. Following impact in Step 520, the extent of damage to the glass-based article sample 518 is determined (Step 630). As previously described hereinabove, herein, the term "fracture" means that a crack propagates across the entire thickness and/or entire surface of a substrate when the substrate is dropped or impacted by an object.
- In
method 600, the sheet 518 with the abrasive surface may be replaced after each drop to avoid "aging" effects that have been observed in repeated use of other types (e.g., concrete or asphalt) of drop test surfaces. - Various predetermined drop heights h and increments are typically used in
method 600. The test may, for example, utilize a minimum drop height to start (e.g., about 10-20 cm). The height may then be increased for successive drops by either a set increment or variable increments. The test described inmethod 600 is stopped once the glass-based article sample 518 breaks or fractures (Step 631). Alternatively, if the drop height h reaches the maximum drop height (e.g., about 100 cm) without fracture, the drop test ofmethod 300 may also be stopped, or Step 520 may be repeated at the maximum height until fracture occurs. - In some embodiments, IBoS test of
method 600 is performed only once on each glass-based article sample 518 at each predetermined height h. In other embodiments, however, each sample may be subjected to multiple tests at each height. - If fracture of the glass-based article sample 518 has occurred (Step 631 in
Figure 28 ), the IBoS test according tomethod 600 is ended (Step 640). If no fracture resulting from the ball drop at the predetermined drop height is observed (Step 632), the drop height is increased by a predetermined increment (Step 634) - such as, for example 5, 10, or 20 cm - andSteps 620 and 630 are repeated until either sample fracture is observed (631) or the maximum test height is reached (636) without sample fracture. When either Step 631 or 636 is reached, the test according tomethod 600 is ended. - When subjected to the inverted ball on sandpaper (IBoS) test described above, embodiments of the glass-based article described herein have about a 60% or more survival rate when the ball is dropped onto the surface of the glass from a height of 100 cm. For example, a glass-based article is described as having a 60% survival rate when dropped from a given height when three of five identical (or nearly identical) samples (i.e., having approximately the same composition and, when strengthened, approximately the same compressive stress and depth of compression or compressive stress layer, as described herein) survive the IBoS drop test without fracture when dropped from the prescribed height (here 100 cm). In other embodiments, the survival rate in the 100 cm IBoS test of the glass-based articles that are strengthened is about 70% or more, in other embodiments, about 80% or more, and, in still other embodiments, about 90% or more. In other embodiments, the survival rate of the strengthened glass-based articles dropped from a height of 100 cm in the IBoS test is about 60% or more, in other embodiments, about 70% or more, in still other embodiments, about 80% or more, and, in other embodiments, about 90% or more. In one or more embodiments, the survival rate of the strengthened glass-based articles dropped from a height of 150 cm in the IBoS test is about 60% or more, in other embodiments, about 70% or more, in still other embodiments, about 80% or more, and, in other embodiments, about 90% or more.
- To determine the survivability rate of the glass-based articles when dropped from a predetermined height using the IBoS test method and apparatus described hereinabove, at least five identical (or nearly identical) samples (i.e., having approximately the same composition and, if strengthened, approximately the same compressive stress and depth of compression or layer) of the glass-based articles are tested, although larger numbers (e.g., 10, 20, 30, etc.) of samples may be subjected to testing to raise the confidence level of the test results. Each sample is dropped a single time from the predetermined height (e.g., 100 cm or 150 cm) or, alternatively, dropped from progressively higher heights without fracture until the predetermined height is reached, and visually (i.e., with the naked eye) examined for evidence of fracture (crack formation and propagation across the entire thickness and/or entire surface of a sample). A sample is deemed to have "survived" the drop test if no fracture is observed after being dropped from the predetermined height, and a sample is deemed to have "failed (or "not survived") if fracture is observed when the sample is dropped from a height that is less than or equal to the predetermined height. The survivability rate is determined to be the percentage of the sample population that survived the drop test. For example, if 7 samples out of a group of 10 did not fracture when dropped from the predetermined height, the survivability rate of the glass would be 70%.
- Referring now to
FIGS. 29-33 , an embodiment of anapparatus 1100 for alternative impact testing a brittle substrate is shown; this apparatus is used to carry out "Impact Threshold Testing" on both the major surface of a sample, and an edge of a sample.Apparatus 1100 comprises apendulum 1102 including abob 1104 attached to a pivot 1106. A bob on a pendulum is a weight suspended from the pivot and connected to a pivot by an arm. Thus, thebob 1104 shown in the Figures is connected to the pivot 1106 byarm 1108, which may be in the form of a string, or a rod or a plurality of rods, such as two rods as shown. As best shown inFigure 33 , thebob 1104 has an equilibrium position 1105 shown as dotted line such that the angle β is zero. In other words, thearm 1108 is not in a raised position. - The
bob 1104 includes abase 1110 for receiving a brittle substrate. As shown in better detail inFIGURE 34 , thebase 1110 for receiving abrittle substrate 1112 having two ends 1114, 1116, an inner surface 1113 and an outer surface 1115. Thebase 1110 has a first end 1120 and a second end 1122, and a curved surface 1124 defining a radius of curvature between the first end 1120 and the second end 1122. Suitable material for thebase 1110 is metal. The curved surface 1124 has an apex 1125. - The
apparatus 1100 according to one or more embodiments further includes a first fixture 1130 and a second fixture 1132 to hold two ends 1114, 1116 of thebrittle substrate 1112 and to apply a force to bend thebrittle substrate 1112 about the curved surface 1124 and to conform the brittle substrate to the radius of curvature. By bending thebrittle substrate 1112, the brittle substrate has an apex 1127 conforming to the apex 1125 of the curved surface 1124. In one or more specific embodiments, the curved surface 1124 and the curvature of thebrittle substrate 1112 can be a fixed radius or a compound radius. The first fixture 1130 and the second fixture 1132 each are a clamp, toggle clamps as shown inFIGURE 34 . - The
apparatus 1100 further includes a roughened surface, which is an abrasive sheet having an abrasive surface to be placed in contact with the outer surface 1115 (orcorners Figure 35 ) of thesubstrate 1112. The abrasive sheet is attached to impact surface 1150 (of impactingobject 1140 described below) by double sided tape, with the abrasive surface of the abrasive sheet facing toward the curved surface 1124 on which thesubstrate 1112 is mounted. One suitable abrasive sheet is Indasa Rhynowet® Plus Line P180 grit sandpaper. The sandpaper according to one or more embodiments is cut in 25 mm square pieces, and the sandpaper is flattened if the pieces are bent during the cutting process. - The
apparatus 1100 further includes animpacting object 1140 positioned such that when thebob 1104 is released from a position at an angle β greater than zero from the equilibrium position 1105, the curved surface 1124 of the bob 1104 (or asubstrate 1112 mounted on the curved surface 1124) contacts the impact surface 1150 (or the abrasive side of an abrasive sheet disposed on the impact surface 1150) of the impactingobject 1140. In the embodiment shown, the impactingobject 1140 is a L-shaped bracket affixed toplatform 1142, and theimpacting object 1140 is affixed to theplatform 1142 by screw 1144. The impactingobject 1140 could also be affixed by any other suitable mechanism such as a bolt, rivet, clamp, etc. Theplatform 1142 includes astopper 1146, which permits theapparatus 1100 to be held at the end of work bench 1148. In the embodiment shown, the impactingobject 1140 is fixed and does not move when thebob 1104 contacts theimpacting object 1140 at impact surface 1150. The impact surface 1150 may be a separate element that is movable in the x-y plane as best seen inFIGURE 32 within slot 1152. Alternatively, the impact surface 1150 need not move relative to theimpacting object 1140. In one or more embodiments, thebob 1104 andbase 1110 are sized and shaped such that when a brittle substrate is affixed to thebase 1110 and when thebob 1104 is released from a position at an angle β greater than zero from the equilibrium position 1105, thebrittle substrate 1112 is subjected to a bending radius and an impact force that simulate a bending radius of a chemically strengthened cover glass of a mobile phone or tablet device when the mobile phone or tablet device is dropped on a ground surface by a user of the mobile phone or tablet device. - In one or more embodiments the radius of curvature of the curved surface 1124 on the
base 1110 is selected to provide a bending tensile force of 100 MPa when a substrate is bent around the curved surface 1124 such that the tensile force is an externally applied tensile force that results from the stress of bending the substrate. Thus, when the substrate is bent, the tensile force is at the apex 1125 of the brittle substrate. According to one or more embodiments, the radius of curvature is in the range of 0.25 m and 1.5 m, for example, in the range of 0.5 m and 1 m. - In one or more embodiments, the first fixture 1130 and second fixture 1132 are spaced apart at a distance of a cover glass length for a mobile phone or a tablet. In specific embodiments, the first fixture 1130 and second fixture 1132 are spaced apart at a distance in the range of 50 mm and 500 mm.
- Another aspect of the disclosure pertains to a method of impact testing a brittle sheet, the surface Impact Threshold Test method comprising:
bending the brittle sheet having a contact surface to provide a bent sheet having a radius of curvature and an apex on the contact surface; and impacting the bent sheet at the apex with an impacting object using a pendulum. In an embodiment, the bent sheet is attached to a pendulum bob. In an embodiment, the bent sheet attached to a pendulum bob is positioned such that the impacting object contacts the apex of the contact surface. In one or more embodiments, the brittle sheet is glass and the radius of curvature is in a range that simulates a bending radius of a chemically or thermally strengthened cover glass of a mobile phone or tablet device when the mobile phone or tablet device is dropped on a ground surface by a user of the mobile phone or tablet device, wherein the drop event is such that an edge of the device contacts the ground first (as opposed to a face first drop wherein the device generally hits the ground in an orientation such that the contact surface is generally parallel to the ground). At least five identical (or nearly identical) samples (i.e., having approximately the same composition and, if strengthened, approximately the same compressive stress and depth of compression or layer) of the glass-based articles are tested, although larger numbers (e.g., 10, 20, 30, etc.) of samples may be subjected to testing to raise the confidence level of the test results. - In one or more embodiments, an abrasive sheet is placed on the impact surface 1150 in a position so as to contact the apex of the brittle sheet upon a swinging movement of the
arm 1108. In one or more embodiments, the brittle sheet is secured to the impacting object with double sided tape. - Another embodiment pertains to a method of impact testing a brittle sheet, the method comprising attaching a brittle sheet to a pendulum bob to expose a contact surface on the brittle sheet; and moving the pendulum bob with the brittle sheet attached to the pendulum bob to cause the contact surface to contact an impact object. In an embodiment, the method includes bending the brittle sheet to provide a bent sheet having a radius of curvature and an apex on the contact surface. In an embodiment, the bent sheet attached to a pendulum bob is positioned such that the impact object contacts the apex of the contact surface. In one or more embodiments, the brittle sheet is glass and the radius of curvature is in a range that simulates a bending radius of a chemically or thermally strengthened cover glass of a mobile phone or tablet device when the mobile phone or tablet device is dropped on a ground surface by a user of the mobile phone or tablet device, wherein the drop event is such that an edge of the device contacts the ground first (as opposed to a face first drop wherein the device generally hits the ground in an orientation such that the contact surface is generally parallel to the ground). In some embodiments, the brittle sheet is secured to a curved surface prior to impacting the apex with the impacting object.
- Referring now to
Figures 29 and30 , specific, non-limiting details of operation of the apparatus include apointer notch 1200 on the pivot 1106, which can point to various test positions 1202, i.e., positions at which thearm 1108 is positioned at angle β relative to equilibrium position 1105, and positions from which motion of the pendulum is initiated. Thepointer notch 1200 enables alignment with a variety of test positions 1202, which may be any suitable number of test positions, for example 1, 2, 3, 4, 5, 6, 7, 8, 9, 10,and so on incrementally up to 50 or more. Theapparatus 1100 may further include a lock, which may be in the form of nut 1204 to lock thearm 1108 in the desired rotational orientation about its central longitudinal axis so as to square thebase 1110 with the impact surface 1150 of the impactingobject 1140. - The
apparatus 1100 simulates an actual phone drop event according to one or more embodiments. Incident impact energy, E and average impact force,F avg are provided by the equations

- Where, m = mass of the pendulum 1102 (including
swing arm 1108,bob 1104, and base 1110), L = length of arm, g = acceleration of free fall, vf is the initial impact velocity (i.e., the velocity at the point when the glass first contacts the impact surface 1150 of the impacting object 1140), and vi is the final impact velocity (i.e., the velocity at which the glass leaves the impact surface 1150 of the impactingobject 1140, or in other words at the point when the glass first separates from the impact surface 1150 of the impacting object 1140), and Δt = contact interaction time (i.e., the time during which the glass is in contact with the impact surface 1150 of the impacting object 1140). The contact interaction time is measured by high-speed video camera by observing the number of frames during which the glass is in contact with the impact surface 1150, and multiplying by the number of frames taken per unit time by the high-speed video camera. The average force equation is useful for samples that have not been broken already, i.e., the samples loaded into theapparatus 1100 prior to the test are ones that have not already been broken. When the mass and length of the swing arm are known, setting the angle β to a selected position, an impact force can be calculated and used to simulate impacts on a device when dropped from a specific height. For example, the average force experienced by a substrate cover glass on a 130 g mobile phone device when dropped from 1 meter height has been calculated to be 800 N. Using the mass, arm length and angle β, this force can be replicated using theapparatus 1100 shown inFigures 29-34 . - Alternatively, as shown in
Figure 35 , thebob 1104 may be repositioned so that an edge of thesubstrate 1112 may be impacted by the impacting object, according to the edge Impact Threshold Test. In this case, the impact surface 1150 of the impactingobject 1140 is not raised, but is simply a planar portion of the impactingobject 1140 facing toward thebob 1140. In this orientation, acorner 3501 of thesubstrate 1112 contacts with the impactingobject 1140 to which an abrasive sheet is attached, in the same manner as described above. Thus, this orientation simulates a drop of an electronic device onto its edge so that the impact energy a substrate edge is able to withstand is then determined in a similar manner as set forth above. In the case of edge testing, thesubstrate 1112 is tested at each corner only once, and is tested so that the top portion of the edge of the substrate is made the point of impact with the impactingobject 1140. Thecorner 3501 is tested first, and then at an incrementally higher pendulum height theopposite corner 3503 is tested. No more than one impact test is performed at the same location on a sample, so as to avoid accumulation of damage introductions. At least five identical (or nearly identical) samples (i.e., having approximately the same composition and, if strengthened, approximately the same compressive stress and depth of compression or layer) of the glass-based articles are tested, although larger numbers (e.g., 10, 20, 30, etc.) of samples maybe subjected to testing to raise the confidence level of the test results. - The glass-based articles described herein may be transparent. In one or more the glass-based article may have a thickness of about 1 millimeter or less and exhibit a transmittance of about 88% or greater over a wavelength in the range from about 380 nm to about 780 nm.
- The glass-based article may also exhibit a substantially white color. For example, the glass-based article may exhibit CIELAB color space coordinates, under a CIE illuminant F02, of L* values of about 88 and greater, a* values in the range from about -3 to about +3, and b* values in the range from about -6 to about +6.
- Choice of substrates not particularly limited. In some examples, the glass-based article may be described as having a high cation diffusivity for ion exchange. In one or more embodiments, the glass or glass-ceramic has fast ion-exchange capability, i.e., where diffusivity is greater than 500µm2/hr. or may be characterized as greater than 450 µm2/hour at 460 °C.
- At a certain temperature the diffusivity is calculated using the equation (4):

- The glass-based article may include an amorphous substrate, a crystalline substrate or a combination thereof (e.g., a glass-ceramic substrate). In one or more embodiments, the glass-based article substrate (prior to being chemically strengthened as described herein) may include a glass composition, in mole percent (mole%), including: SiO2 in the range from about 40 to about 80, Al2O3 in the range from about 10 to about 30, B2O3 in the range from about 0 to about 10, R2O in the range from about 0 to about 20, and RO in the range from about 0 to about 15. In some instances, the composition may include either one or both of ZrO2 in the range from about 0 mol% to about 5 mol% and P2O5 in the range from about 0 to about 15 mol%. TiO2 can be present from about 0 mol% to about 2 mol%.
- In some embodiments, the glass composition may include SiO2 in an amount, in mol%, in the range from about 45 to about 80, from about 45 to about 75, from about 45 to about 70, from about 45 to about 65, from about 45 to about 60, from about 45 to about 65, from about 45 to about 65, from about 50 to about 70, from about 55 to about 70, from about 60 to about 70, from about 70 to about 75, from about 70 to about 72, or from about 50 to about 65.
- In some embodiments, the glass composition may include Al2O3 in an amount, in mol%, in the range from about 5 to about 28, from about 5 to about 26, from about 5 to about 25, from about 5 to about 24, from about 5 to about 22, from about 5 to about 20, from about 6 to about 30, from about 8 to about 30, from about 10 to about 30, from about 12 to about 30, from about 14 to about 30, from about 16 to about 30, from about 18 to about 30, from about 18 to about 28, or from about 12 to about 15.
- In one or more embodiments, the glass composition may include B2O3 in an amount, in mol%, in the range from about 0 to about 8, from about 0 to about 6, from about 0 to about 4, from about 0.1 to about 8, from about 0.1 to about 6, from about 0.1 to about 4, from about 1 to about 10, from about 2 to about 10, from about 4 to about 10, from about 2 to about 8, from about 0.1 to about 5, or from about 1 to about 3. In some instances, the glass composition may be substantially free of B2O3. As used herein, the phrase "substantially free" with respect to the components of the glass composition means that the component is not actively or intentionally added to the glass compositions during initial batching or subsequent ion exchange, but may be present as an impurity. For example, a glass may be describe as being substantially free of a component, when the component is present in an amount of less than about 0.1001 mol%.
- In some embodiments, the glass composition may include one or more alkali earth metal oxides, such as MgO, CaO and ZnO. In some embodiments, the total amount of the one or more alkali earth metal oxides may be a non-zero amount up to about 15 mol%. In one or more specific embodiments, the total amount of any of the alkali earth metal oxides may be a non-zero amount up to about 14 mol%, up to about 12 mol%, up to about 10 mol%, up to about 8 mol%, up to about 6 mol%, up to about 4 mol%, up to about 2 mol%, or up about 1.5 mol%. In some embodiments, the total amount, in mol%, of the one or more alkali earth metal oxides may be in the range from about 0.1 to 10, from about 0.1 to 8, from about 0.1 to 6, from about 0.1 to 5, from about 1 to 10, from about 2 to 10, or from about 2.5 to 8. The amount of MgO may be in the range from about 0 mol% to about 5 mol% (e.g., from about 2 mol% to about 4 mol%, from about 0.01 to about 2, or from about 0.001 to about 1). The amount of ZnO may be in the range from about 0 to about 2 mol% (e.g., from about 1 to about 2). The amount of CaO may be from about 0 mol% to about 2 mol%. In one or more embodiments, the glass composition may include MgO and may be substantially free of CaO and ZnO. In one variant, the glass composition may include any one of CaO or ZnO and may be substantially free of the others of MgO, CaO and ZnO. In one or more specific embodiments, the glass composition may include only two of the alkali earth metal oxides of MgO, CaO and ZnO and may be substantially free of the third of the earth metal oxides.
- The total amount, in mol%, of alkali metal oxides R2O in the glass composition may be in the range from about 5 to about 20, from about 5 to about 18, from about 5 to about 16, from about 5 to about 15, from about 5 to about 14, from about 5 to about 12, from about 5 to about 10, from about 5 to about 8, from about 5 to about 20, from about 6 to about 20, from about 7 to about 20, from about 8 to about 20, from about 9 to about 20, from about 10 to about 20, from about 11 to about 20, from about 12 to about 18, or from about 14 to about 18.
- In one or more embodiments, the glass composition includes Na2O in an amount in the range from about 0 mol% to about 18 mol%, from about 0 mol% to about 16 mol% or from about 0 mol% to about 14 mol%, from about 0 mol% to about 12 mol%, from about 2 mol% to about 18 mol%, from about 4 mol% to about 18 mol%, from about 6 mol% to about 18 mol%, from about 8 mol% to about 18 mol%, from about 8 mol% to about 14 mol%, from about 8 mol% to about 12 mol%, or from about 10 mol% to about 12 mol%. In some embodiments, the composition may include about 4 mol% or more Na2O.
- In some embodiments, the amount of Li2O and Na2O is controlled to a specific amount or ratio to balance formability and ion exchangeability. For example, as the amount of Li2O increases, the liquidus viscosity may be reduced, thus preventing some forming methods from being used; however, such glass compositions are ion exchanged to deeper DOC levels, as described herein. The amount of Na2O can modify liquidus viscosity but can inhibit ion exchange to deeper DOC levels.
- In one or more embodiments, the glass composition may include K2O in an amount less than about 5 mol%, less than about 4 mol%, less than about 3 mol%, less than about 2 mol%, or less than about 1 mol%. In one or more alternative embodiments, the glass composition may be substantially free, as defined herein, of K2O.
- In one or more embodiments, the glass composition may include Li2O in an amount about 0 mol% to about 18 mol%, from about 0 mol% to about 15 mol% or from about 0 mol% to about 10 mol%, from about 0 mol% to about 8 mol%, from about 0 mol% to about 6 mol%, from about 0 mol% to about 4 mol% or from about 0 mol% to about 2 mol%. In some embodiments, the glass composition may include Li2O in an amount about 2 mol% to about 10 mol%, from about 4 mol% to about 10 mol%, from about 6 mol% to about 10 mol, or from about 5 mol% to about 8 mol%. In one or more alternative embodiments, the glass composition may be substantially free, as defined herein, of Li2O.
- In one or more embodiments, the glass composition may include Fe2O3. In such embodiments, Fe2O3 may be present in an amount less than about 1 mol%, less than about 0.9 mol%, less than about 0.8 mol%, less than about 0.7 mol%, less than about 0.6 mol%, less than about 0.5 mol%, less than about 0.4 mol%, less than about 0.3 mol%, less than about 0.2 mol%, less than about 0.1 mol% and all ranges and sub-ranges therebetween. In one or more alternative embodiments, the glass composition may be substantially free, as defined herein, of Fe2O3.
- In one or more embodiments, the glass composition may include ZrO2. In such embodiments, ZrO2 may be present in an amount less than about 1 mol%, less than about 0.9 mol%, less than about 0.8 mol%, less than about 0.7 mol%, less than about 0.6 mol%, less than about 0.5 mol%, less than about 0.4 mol%, less than about 0.3 mol%, less than about 0.2 mol%, less than about 0.1 mol% and all ranges and sub-ranges therebetween. In one or more alternative embodiments, the glass composition may be substantially free, as defined herein, of ZrO2.
- In one or more embodiments, the glass composition may include P2O5 in a range from about 0 mol% to about 10 mol%, from about 0 mol% to about 8 mol%, from about 0 mol% to about 6mol%, from about 0 mol% to about 4 mol%, from about 0.1 mol% to about 10 mol%, from about 0.1 mol% to about 8 mol%, from about 2 mol% to about 8 mol%, from about 2 mol% to about 6 mol% or from about 2 mol% to about 4 mol%. In some instances, the glass composition may be substantially free of P2O5.
- In one or more embodiments, the glass composition may include TiO2. In such embodiments, TiO2 may be present in an amount less than about 6 mol%, less than about 4 mol%, less than about 2 mol%, or less than about 1 mol%. In one or more alternative embodiments, the glass composition may be substantially free, as defined herein, of TiO2. In some embodiments, TiO2 is present in an amount in the range from about 0.1 mol% to about 6 mol%, or from about 0.1 mol% to about 4 mol%.
- In some embodiments, the glass composition may include various compositional relationships. For example, the glass composition may include a ratio of the amount of Li2O (in mol%) to the total amount of R2O (in mol%) in the range from about 0 to about 1, from about 0 to about 0.5, from about 0 to about 0.4, from about 0.1 to about 0.5, or from about 0.2 to about 0.4.
- In some embodiments, the glass composition may include a difference between the total amount of R2O (in mol%) to the amount of Al2O3 (in mol%) (R2O - Al2O3) in the range from about 0 to about 5 (e.g., from about 0 to about 4, from about 0 to about 3, from about 0.1 to about 4, from about 0.1 to about 3, from about 0.1 to about 2 or from about 1 to about 2).
- In some embodiments, the glass composition may include a difference between the total amount of RxO (in mol%) to the amount of Al2O3 (in mol%) (RxO-Al2O3) in the range from about 0 to about 5 (e.g., from about 0 to about 4, from about 0 to about 3, from about 0.1 to about 4, from about 0.1 to about 3, from about 1 to about 3, or from about 2 to about 3).
- In some embodiments, the glass composition may include a ratio of the total amount of R2O (in mol%) to the amount of Al2O3 (in mol%) (R2O/Al2O3) in the range from about 0 to about 5 (e.g., from about 0 to about 4, from about 0 to about 3, from about 1 to about 4, from about 1 to about 3, or from about 1 to about 2).
- In one or more embodiments, the glass composition includes a combined amount of Al2O3 and Na2O greater than about 15 mol% (e.g., greater than 18 mol%, greater than about 20 mol%, or greater than about 23 mol%). The combined amount of Al2O3 and Na2O may be up to and including about 30 mol%, about 32 mol% or about 35 mol%.
- The glass composition of one or more embodiments may exhibit a ratio of the amount of MgO (in mol%) to the total amount of RO (in mol%) in the range from about 0 to about 2.
- In some embodiments, glass composition may be substantially free of nucleating agents. Examples of typical nucleating agents are TiO2, ZrO2 and the like. Nucleating agents may be described in terms of function in that nucleating agents are constituents in the glass can initiate the formation of crystallites in the glass.
- In some embodiments, the compositions used for the glass substrate may be batched with 0-2 mol% of at least one fining agent selected from a group that includes Na2SO4, NaCl, NaF, NaBr, K2SO4, KCl, KF, KBr, and SnO2. The glass composition according to one or more embodiments may further include SnO2 in the range from about 0 to about 2, from about 0 to about 1, from about 0.1 to about 2, from about 0.1 to about 1, or from about 1 to about 2. The glass compositions disclosed herein may be substantially free of As2O3 and/or Sb2O3.
- In one or more embodiments, the composition may specifically include 62 mol% to 75 mol% SiO2; 10.5 mol% to about 17 mol% Al2O3; 5 mol% to about 13 mol% Li 2O; 0 mol% to about 4 mol% ZnO; 0 mol% to about 8 mol% MgO; 2 mol% to about 5 mol% TiO2; 0 mol% to about 4 mol% B2O3; 0 mol% to about 5 mol% Na2O; 0 mol% to about 4 mol% K2O; 0 mol% to about 2 mol% ZrO2; 0 mol% to about 7 mol% P2O5; 0 mol% to about 0.3 mol% Fe2O3; 0 mol% to about 2 mol% MnOx; and 0.05 mol% to about0.2 mol% SnO2.
- In one or more embodiments, the composition may include 67 mol% to about 74 mol% SiO2; 11 mol% to about 15 mol% Al2O3; 5.5 mol% to about 9 mol% Li 2O; 0.5 mol% to about 2 mol% ZnO; 2 mol% to about 4.5 mol% MgO; 3 mol% to about 4.5 mol% TiO2; 0 mol% to about 2.2 mol% B2O3; 0 mol% to about 1 mol% Na2O; 0 mol% to about 1 mol% K2O; 0 mol% to about 1 mol% ZrO2; 0 mol% to about 4 mol% P2O5; 0 mol% to about 0.1 mol% Fe2O3; 0 mol% to about 1.5 mol% MnOx; and 0.08 mol% to about 0.16 mol%SnO2.
- In one or more embodiments, the composition may include 70 mol% to 75 mol% SiO2; 10 mol% to about 15 mol% Al2O3; 5 mol% to about 13 mol% Li 2O; 0 mol% to about 4 mol% ZnO; 0.1 mol% to about 8 mol% MgO; 0 mol% to about 5 mol% TiO2; 0.1 mol% to about 4 mol% B2O3; 0.1 mol% to about 5 mol% Na2O; 0 mol% to about 4 mol% K2O; 0 mol% to about 2 mol% ZrO2; 0 mol% to about 7 mol% P2O5; 0 mol% to about 0.3 mol% Fe2O3; 0 mol% to about 2 mol% MnOx; and 0.05 mol% to about0.2 mol% SnO2.
- In one or more embodiments, the composition may include 52 mol% to about 65 mol% SiO2; 14 mol% to about 18 mol% Al2O3; 5.5 mol% to about 7 mol% Li 2O; 1 mol% to about 2 mol% ZnO; 0.01 mol% to about 2 mol% MgO; 4 mol% to about 12 mol% Na2O; 0.1 mol% to about 4 mol% P2O5; and 0.01 mol% to about 0.16 mol%SnO2. In some embodiments, the composition may be substantially free of any one or more of B2O3, TiO2, K2O and ZrO2.
- In one or more embodiments, the composition may include 0.5 mol% or more P2O5, Na2O and, optionally, Li2O, where Li2O(mol%)/Na2O(mol%) < 1. In addition, these compositions may be substantially free of B2O3 and K2O. In some embodiments, the composition may include ZnO, MgO, and SnO2.
- In some embodiments, the composition may comprise: from about 58 mol% to about 65 mol% SiO2; from about 11 mol% to about 19 mol% Al2O3; from about 0.5 mol% to about 3 mol% P2O5; from about 6 mol% to about 18 mol% Na2O; from 0 mol% to about 6 mol% MgO; and from 0 mol% to about 6 mol% ZnO. In certain embodiments, the composition may comprise from about 63 mol% to about 65 mol% SiO2; from 11 mol% to about 17 mol% Al2O3; from about 1 mol% to about 3 mol% P2O5; from about 9 mol% to about 20 mol% Na2O; from 0 mol% to about 6 mol% MgO; and from 0 mol% to about 6 mol% ZnO.
- In some embodiments, the composition may include the following compositional relationships R2O(mol%)/Al2O3(mol%) < 2, where R2O = Li2O +Na2O. In some embodiments, 65 mol% < SiO2(mol%) + P2O5(mol%) < 67 mol%. In certain embodiments, R2O(mol%) + R'O(mol%) - Al2O3(mol%) + P2O5(mol%) > -3 mol%, where R2O = Li2O + Na2O and R'O is the total amount of divalent metal oxides present in the composition.
- Other exemplary compositions of glass-based articles prior to being chemically strengthened, as described herein, are shown in Table 1A. Table 1B lists selected physical properties determined for the examples listed in Table 1A. The physical properties listed in Table 1B include: density; low temperature and high temperature CTE; strain, anneal and softening points; 1011 Poise, 35 kP, 200 kP, liquidus, and zircon breakdown temperatures; zircon breakdown and liquidus viscosities; Poisson's ratio; Young's modulus; refractive index, and stress optical coefficient. In some embodiments, the glass-based articles and glass substrates described herein have a high temperature CTE of less than or equal to 30 ppm/°C and/or a Young's modulus of 70 GPa or more and, in some embodiments, a Young's modulus of up to 80 GPa.
Table 1A: Exemplary compositions prior to chemical strengthening. Composit ion (mol%) Ex. 1 Ex. 2 Ex. 3 Ex. 4 Ex. 5 Ex. 6 Ex. 7 SiO2 63.77 64.03 63.67 63.91 64.16 63.21 63.50 Al2O3 12.44 12.44 11.83 11.94 11.94 11.57 11.73 P2O5 2.43 2.29 2.36 2.38 1.92 1.93 1.93 Li2O 0.00 0.00 0.00 0.00 0.00 0.00 0.00 Na2O 16.80 16.81 16.88 16.78 16.80 17.63 16.85 ZnO 0.00 4.37 0.00 4.93 0.00 5.59 5.93 MgO 4.52 0.02 5.21 0.02 5.13 0.02 0.01 SnO2 0.05 0.05 0.05 0.05 0.05 0.05 0.05 R2O/Al2O3 1.35 1.35 1.43 1.41 1.41 1.52 1.44 Li2O/Na2O 0.00 0.00 0.00 0.00 0.00 0.00 0.00 (R2O + RO) - Al2O3 - P2O5 6.45 6.46 7.89 7.40 8.07 9.74 9.14 Composition (mol%) Ex. 8 Ex. 9 Ex. 10 Ex. 11 Ex. 12 Ex. 13 Ex. 14 SiO2 63.37 63.43 63.56 63.58 63.66 63.62 63.67 Al2O3 11.72 12.49 12.63 12.59 12.91 12.85 12.89 P2O5 2.00 2.32 2.46 2.46 2.43 2.45 2.47 Li2O 0.00 0.00 1.42 2.87 0.00 1.42 2.92 Na2O 16.84 17.16 15.45 14.04 16.89 15.48 13.92 ZnO 6.00 4.54 4.43 4.41 4.04 4.12 4.06 MgO 0.02 0.02 0.02 0.02 0.02 0.02 0.02 SnO2 0.05 0.04 0.05 0.05 0.05 0.05 0.05 R2O/Al2O3 1.44 1.37 1.34 1.34 1.31 1.31 1.31 Li2O/Na2O 0.00 0.00 0.09 0.20 0.00 0.09 0.21 (R2O + RO) - Al2O3 - P2O3 9.14 6.90 6.22 6.29 5.62 5.72 5.57 Composition (mol%) Ex. 15 Ex. 16 Ex. 17 Ex. 18 Ex. 19 Ex. 20 Ex. 21 SiO2 63.55 63.80 63.76 63.88 63.74 64.03 63.68 Al2O3 12.92 12.90 12.95 13.48 13.37 13.26 13.19 P2O5 2.35 2.34 2.37 2.31 2.34 2.29 2.46 Li2O 0.00 1.47 2.94 0.00 1.48 2.94 0.00 Na2O 17.97 16.36 14.85 17.20 15.96 14.37 16.84 ZnO 0.00 0.00 0.00 0.00 0.00 0.00 3.77 MgO 3.17 3.08 3.09 3.08 3.08 3.06 0.02 SnO2 0.05 0.04 0.05 0.05 0.04 0.04 0.05 R2O/Al2O3 1.39 1.38 1.37 1.28 1.30 1.31 1.28 Li2O/Na2O 0.00 0.09 0.20 0.00 0.09 0.20 0.00 (R2O + RO) - Al2O3 - P2O5 5.87 5.67 5.56 4.48 4.81 4.83 4.98 Composition (mol%) Ex. 22 Ex. 23 Ex. 24 Ex. 25 Ex. 26 Ex. 27 Ex. 28 SiO2 63.66 63.76 63.67 63.73 63.73 63.64 63.76 Al2O3 14.15 15.31 13.87 14.82 12.93 16.62 16.59 P2O5 2.47 2.44 2.47 2.43 2.48 2.47 2.47 Li2O 1.49 2.98 1.50 2.96 0.00 2.52 4.91 Na2O 15.31 13.79 15.36 13.93 16.83 14.68 12.20 ZnO 2.85 1.64 0.00 0.00 2.98 0.00 0.00 MgO 0.03 0.03 3.09 2.08 1.00 0.03 0.03 SnO2 0.05 0.04 0.05 0.05 0.05 0.05 0.05 R2O/Al2O3 1.19 1.10 1.22 1.14 1.30 1.03 1.03 Li2O/Na2O 0.10 0.22 0.10 0.21 0.00 0.17 0.40 (R2O + RO) - Al2O3 - P2O5 3.05 0.70 3.61 1.72 5.40 -1.86 -1.92 Composition (mol%) Ex. 29 Ex. 30 Ex. 31 Ex. 32 Ex. 33 Ex. 34 Ex. 35 SiO2 63.89 63.92 63.77 63.73 63.70 63.65 63.87 Al2O3 16.55 15.29 15.27 15.30 15.27 15.22 15.29 P2O5 2.47 2.24 2.31 2.39 2.40 2.48 2.37 Li2O 7.27 3.46 2.98 4.02 4.46 4.96 5.39 Na2O 9.74 13.46 13.99 12.91 12.51 11.99 11.44 ZnO 0.00 1.56 1.61 1.57 1.58 1.63 1.57 MgO 0.03 0.02 0.02 0.03 0.03 0.02 0.02 SnO2 0.04 0.04 0.04 0.05 0.04 0.05 0.04 R2O/Al2O3 1.03 1.11 1.11 1.11 1.11 1.11 1.10 Li2O/Na2O 0.75 0.26 0.21 0.31 0.36 0.41 0.47 (R2O + RO) - Al2O3 - P2O5 -1.98 0.97 1.01 0.84 0.90 0.91 0.76 Composition (mol%) Ex. 36 Ex. 37 Ex. 38 Ex. 39 Ex. 40 Ex. 41 Ex. 42 SiO2 63.69 63.75 63.70 63.62 63.74 63.77 63.77 Al2O3 15.26 15.30 15.27 15.23 15.27 15.27 15.33 P2O5 2.45 2.42 2.45 2.46 2.47 2.46 2.44 Li2O 2.96 2.98 3.94 3.98 4.93 4.93 2.91 Na2O 13.50 13.46 12.54 12.57 11.49 11.50 13.94 ZnO 2.06 2.01 2.03 2.06 2.03 2.00 0.00 MgO 0.02 0.03 0.02 0.03 0.03 0.03 1.57 SnO2 0.05 0.04 0.04 0.05 0.04 0.05 0.04 R2O/Al2O3 1.08 1.08 1.08 1.09 1.08 1.08 1.10 Li2O/Na2O 0.22 0.22 0.31 0.32 0.43 0.43 0.21 (R2O + RO) - Al2O3 - P2O3 0.83 0.77 0.80 0.95 0.73 0.73 0.66 Composition (mol%) Ex. 43 Ex. 44 Ex. 45 Ex. 46 Ex. 47 Ex. 48 Ex. 49 SiO2 63.69 63.81 63.65 63.71 63.62 63.65 63.62 Al2O3 15.25 15.26 15.33 15.32 15.24 15.68 15.67 P2O5 2.43 2.41 2.46 2.44 2.47 2.44 2.48 Li2O 4.00 4.89 2.96 4.01 4.91 6.07 6.06 Na2O 13.01 12.03 13.29 12.25 11.42 10.93 10.53 ZnO 0.00 0.00 2.24 2.20 2.27 1.17 1.57 MgO 1.57 1.56 0.03 0.03 0.02 0.02 0.02 SnO2 0.05 0.04 0.05 0.04 0.05 0.04 0.05 R2O/Al2O3 1.12 1.11 1.06 1.06 1.07 1.08 1.06 Li2O/Na2O 0.31 0.41 0.22 0.33 0.43 0.56 0.58 (R2O + RO) - Al2O3 - P2O5 0.90 0.81 0.73 0.73 0.91 0.08 0.04 Composition (mol%) Ex. 50 Ex. 51 Ex. 52 Ex. 53 Ex. 54 Ex. 55 Ex. 56 SiO2 63.60 63.89 63.84 63.90 63.88 64.74 60.17 Al2O3 15.65 16.09 16.47 16.87 16.97 15.25 18.58 P2O5 2.46 2.42 2.43 2.43 2.42 0.98 1.90 Li2O 6.13 6.80 7.84 8.75 9.78 5.28 5.16 Na2O 10.29 9.97 8.96 7.99 6.88 12.09 12.58 ZnO 1.81 0.78 0.39 0.00 0.00 1.61 1.55 MgO 0.02 0.02 0.02 0.02 0.02 0.02 0.02 SnO2 0.04 0.04 0.04 0.04 0.04 0.03 0.03 R2O/Al2O3 1.05 1.04 1.02 0.99 0.98 1.14 0.96 Li2O/Na2O 0.60 0.68 0.87 1.10 1.42 0.44 0.41 (R2O + RO) - Al2O3 - P2O5 0.14 -0.94 -1.68 -2.54 -2.70 2.78 -1.16 Composition (mol%) Ex. 57 Ex. 58 Ex. 59 Ex. 60 Ex. 61 Ex. 62 Ex. 63 Ex. 64 SiO2 58.32 63.3 63.3 63.3 63.3 63.3 63.3 63.46 Al2O3 18.95 15.25 15.65 16.2 15.1 15.425 15.7 15.71 P2O5 2.42 2.5 2.5 2.5 2.5 2.5 2.5 2.45 Li2O 4.96 6 7 7.5 6 7 7.5 6.37 Na2O 13.74 10.7 9.7 9.45 10.55 9.475 8.95 10.69 ZnO 1.56 1.2 0.8 0 2.5 2.25 2 1.15 MgO 0.02 1 1 1 0 0 0 0.06 SnO2 0.03 0.05 0.05 0.05 0.05 0.05 0.05 0.04 R2O/Al2O3 0.99 1.10 1.07 1.05 1.10 1.07 1.05 1.09 Li2O/Na2O 0.36 0.56 0.72 0.79 0.57 0.74 0.84 0.6 (R2O + RO) - Al2O3 - P2O5 -1.09 1.15 0.35 -0.75 1.45 0.80 0.25 -1.1 Table 2. Selected physical properties of the glasses listed in Table 1. Ex. 1 Ex. 2 Ex. 3 Ex. 4 Ex. 5 Ex. 6 Ex. 7 Density (g/cm3) 2.434 2.493 2.434 2.504 2.44 2.514 2.519 Low temperature CTE 25-300 °C (ppm/°C) 8.9 8.62 8.95 8.6 8.82 8.71 8.54 High temperature CTE (ppm/°C) 17.67 19.1 17.16 21 18.12 20 20.11 Strain pt. (°C) 630 591 612 580 605 580 589 Anneal pt. (°C) 683 641 662 628 651 629 639 1011 Poise temperature (°C) 770 725 748 710 734 711 721 Softening pt. (°C) 937 888 919 873 909 868 874 T35kP(°C) 1167 1180 1158 1160 T200 kP(°C) 1070 1083 1061 1064 Zircon breakdown temperature (°C) 1205 1220 1170 1185 1205 Zircon breakdown viscosity (P) 1.56 x10⁴ 4.15 x10⁴ 2.29 x10⁴ 1.74 x10⁴ Liquidus temperature (°C) 980 990 975 990 1000 Liquidus viscosity (P) 1.15 x10⁶ 2.17 x10⁶ 9.39 x10⁵ 7.92 x10⁵ Poisson's ratio 0.200 0.211 0.206 0.214 0.204 0.209 0.211 Young's modulus (GPa) 69.2 68.8 69.4 68.5 69.6 68.3 69.0 Refractive index at 589.3 run 1.4976 1.5025 1.4981 1.5029 1.4992 1.5052 1.506 Stress optical coefficient (nm/mm/MPa) 2.963 3.158 3.013 3.198 2.97 3.185 3.234 Ex. 8 Ex. 9 Ex. 10 Ex. 11 Ex. 12 Ex. 13 Ex. 14 Density (g/cm3) 2.516 2.501 2.498 2.493 2.493 2.492 2.486 Low temperature CTE 25-300 °C (ppm/°C) 8.35 8.67 8.87 8.49 8.65 8.71 8.49 High temperature CTE (ppm/°C) 20.11 20.6 20.94 19.52 20.77 Strain pt. (°C) 590 589 591 584 600 579 588 Anneal pt. (°C) 641 639 640 628 652 620 630 1011 Poise temperature (°C) 726 724 720 704 738 695 704 Softening pt. (°C) 888 890 865 857 900 867 860 T35kP(°C) 1170 1176 1159 1139 1197 1169 T200kP (°C) 1073 1080 1061 1041 1099 1070 Zircon breakdown temperature (°C) 1195 1195 1210 1225 1195 1195 1220 Zircon breakdown viscosity (P) 2.33 x10⁴ 2.58 x10⁴ 1.60 x10⁴ 9.94 x10³ 3.63 x10⁴ 2.35 ×10⁴ Liquidus temperature (°C) 1005 990 990 980 990 980 980 Liquidus viscosity (P) 8.69 x10⁴ 1.48E+06 9.02E+05 7.10E+05 2.19E+06 1.33E+06 Poisson's ratio 0.211 0.205 0.208 0.209 0.209 0.210 0.217 Young's modulus (GPa) 69.0 68.7 71.4 73.5 68.4 71.6 74.0 Refractive index at 589.3 run 1.506 1.5036 1.505 1.5063 1.5026 1.5041 1.5052 Stress optical coefficient (nm/mm/MPa) 3.234 3.194 3.157 3.131 3.18 3.156 3.131 Ex. 15 Ex. 16 Ex. 17 Ex. 18 Ex. 19 Ex. 20 Ex. 21 Density (g/cm3) 2.433 2.429 2.426 2.431 2.428 2.433 2.486 Low temperature CTE 25-300 °C (ppm/°C) 9.15 9.16 8.83 8.97 8.97 8.79 8.45 High temperature CTE (ppm/°C) 20 20 21 17.3 20 Strain pt. (°C) 615 606 599 633 616 611 602 Anneal pt. (°C) 662 659 653 684 670 665 653 1011 Poise temperature (°C) 747 745 741 771 758 751 739 Softening pt. (°C) 935 903 901 943 918 905 910 T35kP(°C) 1182 1166 1152 1221 1185 1167 1207 T200kP(°C) 1083 1066 1051 1122 1084 1066 1108 Zircon breakdown temperature (°C) Zircon breakdown viscosity (P) Liquidus temperature (°C) Liquidus viscosity (P) Poisson's ratio 0.203 0.207 0.205 0.209 0.199 0.207 Young's modulus (GPa) 68.9 71.2 72.7 69.4 70.9 68.1 Refractive index at 589.3 nm 1.4964 1.4981 1.4991 1.4965 1.4984 1.5006 1.5019 Stress optical coefficient (nm/mm/MPa) 2.994 3.022 2.982 2.979 2.99 0 3.173 Ex. 22 Ex. 23 Ex. 24 Ex. 25 Ex. 26 Ex. 27 Ex. 28 Density (g/cm3) 2.468 2.448 2.434 2.428 2.47 2.419 2.414 Low temperature CTE 25-300 °C (ppm/°C) 8.6 8.23 8.91 8.25 8.66 8.52 8.17 High temperature CTE (ppm/°C) 19.52 19.49 19.47 Strain pt. (°C) 596 595 638 616 608 640 620 Anneal pt. (°C) 644 649 695 656 654 700 677 1011 Poise temperature (°C) 728 741 785 732 736 798 771 Softening pt. (°C) 905 922 941 925 911 978 946 T35kP(°C) 1217 1227 1209 1215 1209 1283 1249 T200kP(°C) 1115 1125 1109 1115 1107 1184 1150 Zircon breakdown temperature (°C) 1185 1185 1180 1185 1185 Zircon breakdown viscosity (P) 5.86E+04 6.91E+04 5.59E+04 5.72E+04 1.05E+05 Liquidus temperature (°C) 975 980 1080 1025 940 Liquidus viscosity (P) 4.14E+06 4.52E+06 3.56E+05 1.27E+06 2. 92E+07 Poisson's ratio 0.210 0.204 0.210 0.212 0.213 Young's modulus (GPa) 71.4 71.6 73.5 68.8 76.9 Refractive index at 589.3 run 1.502 1.5025 1.4996 1.5008 1.5006 1.4987 1.5014 Stress optical coefficient (nm/mm/MPa) 3.123 3.03 3.001 3.021 3.148 3.039 3.015 Ex. 29 Ex. 30 Ex. 31 Ex. 32 Ex. 33 Ex. 34 Ex. 35 Density (g/cm3) 2.408 2.446 2.448 2.446 2.445 2.443 2.442 Low temperature CTE 25-300 °C (ppm/°C) 7.86 8.29 8.38 8.17 8.14 8.04 7.97 High temperature CTE (ppm/°C) 18.57 19.71 Strain pt. (°C) 610 591 595 585 580 574 577 Anneal pt. (°C) 665 645 649 638 633 627 629 1011 Poise temperature (°C) 755 736 740 726 722 717 717 Softening pt. (°C) 924 915 919 894 894 895 890 T35kP(°C) 1216 1223 1227 1216 1210 1203 1196 T200kP(°C) 1120 1122 1126 1114 1108 1102 1095 Zircon breakdown temperature (°C) 1210 1175 1180 1190 1195 1210 1205 Zircon breakdown viscosity (P) 3.86E+04 7.72E+04 7.55E+04 5.29E+04 4.43E+04 3.14E+04 3.04E+04 Liquidus temperature (°C) 1080 990 975 975 975 975 980 Liquidus viscosity (P) 4.55E+05 3.28E+06 5.43E+06 3.80E+06 3.33E+06 3.02E+06 2.29E+06 Poisson's ratio 0.211 0.206 0.202 0.21 0.204 0.204 0.203 Young's modulus (GPa) 75.0 73.91 73.02 74.60 74.67 75.15 75.43 Refractive index at 589.3 nm 1.5053 1.503 1.5025 1.5035 1.5041 1.5046 1.5053 Stress optical coefficient (nm/mm/MPa) 3.002 3.074 3.083 3.071 3.059 3.016 3.053 Ex. 36 Ex. 37 Ex. 38 Ex. 39 Ex. 40 Ex. 41 Ex. 42 Density (g/cm3) 2.453 2.453 2.452 2.451 2.449 2.449 2.425 Low temperature CTE 25-300 °C (ppm/°C) 8.17 8.14 7.97 8.01 7.79 7.9 8.54 High temperature CTE (ppm/°C) 20.56 Strain pt. (°C) 595 595 584 587 578 584 617 Anneal pt. (°C) 649 649 638 640 630 637 663 1011 Poise temperature (°C) 740 741 729 730 718 726 746 Softening pt. (°C) 918 921 905 907 894 901 929 T35kP(°C) 1229 1232 1212 1219 1200 1204 1232 T200kP (°C) 1128 1131 1111 1118 1100 1103 1132 Zircon breakdown temperature (°C) 1185 1200 1210 Zircon breakdown viscosity (P) 7.20E+04 4.26E+04 3.00E+04 Liquidus temperature (°C) 995 990 965 Liquidus viscosity (P) 3.33E+06 2.51E+06 3.71E+06 Poisson's ratio 0.208 0.206 0.206 Young's modulus (GPa) 73.70 74.67 75.50 Refractive index at 589.3 run 1.5032 1.5042 1.5054 1.5005 Stress optical coefficient (nm/mm/MPa) 3.093 3.071 3.072 3.033 Ex. 43 Ex. 44 Ex. 45 Ex. 46 Ex. 47 Ex. 48 Ex. 49 Ex. 50 Density (g/cm3) 2.424 2.422 2.455 2.454 2.454 2.434 2.439 2.443 Low temperature coefficient of thermal expansion 25 - 300 °C (ppm/°C) 8.48 8.34 8.03 7.88 7.76 7.87 7.71 7.63 High temperature coefficient of thermal expansion (ppm/°C) Strain pt. temperature (°C) 614 594 595 586 579 580 581 579 Anneal pt. temperature (°C) 659 640 649 639 630 633 633 632 1011 Poise temperature (°C) 739 722 740 729 718 722 721 721 Softening pt. temperature (°C) 912 899 918 909 898 892 893 895 35 kP temperature (°C) 1216 1204 1212 1200 1203 1203 1203 200 kP temperature (°C) 1116 1102 1113 1099 1105 1102 1103 Zircon breakdown temperature (°C) Zircon breakdown viscosity (P) Liquidus temperature (°C) 985 965 1005 1010 1030 Liquidus viscosity (P) 4.E+06 1.78E+06 1.34E+06 8. 98E+05 Poisson's ratio 0.211 0.21 0.213 Young's modulus (GPa) 76.32 76.60 76.81 Refractive index at 589.3 run 1.5014 1.5026 1.5036 1.5047 1.5061 1.505 1.5059 1.5064 Stress optical coefficient (nm/mm/MPa) 2.965 2.981 3.082 3.057 3.063 3.025 3.004 3.046 Ex. 51 Ex. 52 Ex. 53 Ex. 54 Ex. 55 Ex. 56 Ex. 57 Density (g/cm3) 2.424 2.431 2.403 2.4 2.45 2.462 2.468 Low temperature CTE 25-300 °C (ppm/°C) 77.1 76.1 74.3 73.1 80.2 79.7 83.6 High temperature CTE (ppm/°C) Strain pt. (°C) 588 599 611 612 580 611 597 Anneal pt. (°C) 640 651 665 665 631 663 649 1011 Poise temperature (°C) 728 738 753 752 718 750 735 Softening pt. (°C) 900.4 907.5 916 912.5 892.2 915.6 899.4 T35kP(°C) 1204 1209 1209 1202 1206 1205 1184 T200kP (°C) 1106 1113 1113 1106 1102 1111 1093 Zircon breakdown temperature (°C) Zircon breakdown viscosity (P) Liquidus temperature (°C) 1060 1115 1160 1205 Liquidus viscosity (P) 5.11E+05 1.90E+05 8.18E+04 3.32E+04 Poisson's ratio 0.211 0.212 0.208 0.214 Young's modulus (GPa) 77.01 78.05 77.57 78.74 Refractive index at 589.3 nm 1.5054 1.5055 1.5059 1.5072 Stress optical coefficient (nm/mm/MPa) 3.011 2.98 2.982 2.964 Ex. 64 Density (g/cm3) 2.428 CTE 25-300 °C (ppm/°C) 7.8 Strain pt. (°C) 571 Anneal pt. (°C) 622 1011 Poise temperature (°C) Softening pt. (°C) 881.4 T35kP(°C) T200 kP (°C) 1645 Zircon breakdown temperature (°C) Zircon breakdown viscosity (P) Liquidus temperature (°C) 1000 Liquidus viscosity (P) 1524280 Poisson's ratio 0.211 Young's modulus (GPa) 76.3 Refractive index at 589.3 run 1.51 Stress optical coefficient (nm/mm/MPa) 3.02 - Where the glass-based article includes a glass-ceramic, the crystal phases may include β-spodumene, rutile, gahnite or other known crystal phases and combinations thereof.
- The glass-based article may be substantially planar, although other embodiments may utilize a curved or otherwise shaped or sculpted substrate. In some instances, the glass-based article may have a 3D or 2.5D shape. The glass-based article may be substantially optically clear, transparent and free from light scattering. The glass-based article may have a refractive index in the range from about 1.45 to about 1.55. As used herein, the refractive index values are with respect to a wavelength of 550 nm.
- Additionally or alternatively, the thickness of the glass-based article may be constant along one or more dimension or may vary along one or more of its dimensions for aesthetic and/or functional reasons. For example, the edges of the glass-based article may be thicker as compared to more central regions of the glass-based article. The length, width and thickness dimensions of the glass-based article may also vary according to the article application or use.
- The glass-based article may be characterized by the manner in which it is formed. For instance, where the glass-based article may be characterized as float-formable (i.e., formed by a float process), down-drawable and, in particular, fusion-formable or slot-drawable (i.e., formed by a down draw process such as a fusion draw process or a slot draw process). In specific embodiments, the glass-based articles are fusion-formable.
- A float-formable glass-based article may be characterized by smooth surfaces and uniform thickness is made by floating molten glass on a bed of molten metal, typically tin. In an example process, molten glass that is fed onto the surface of the molten tin bed forms a floating glass ribbon. As the glass ribbon flows along the tin bath, the temperature is gradually decreased until the glass ribbon solidifies into a solid glass-based article that can be lifted from the tin onto rollers. Once off the bath, the glass glass-based article can be cooled further and annealed to reduce internal stress. Where the glass-based article is a glass ceramic, the glass-based article formed from the float process may be subjected to a ceramming process by which one or more crystalline phases are generated.
- Down-draw processes produce glass-based articles having a uniform thickness that possess relatively pristine surfaces. Because the average flexural strength of the glass-based article is controlled by the amount and size of surface flaws, a pristine surface that has had minimal contact has a higher initial strength. When this high strength glass-based article is then further strengthened (e.g., chemically), the resultant strength can be higher than that of a glass-based article with a surface that has been lapped and polished. Down-drawn glass-based articles may be drawn to a thickness of less than about 2 mm. In addition, down drawn glass-based articles have a very flat, smooth surface that can be used in its final application without costly grinding and polishing. Where the glass-based article is a glass ceramic, the glass-based article formed from the down draw process may be subjected to a ceramming process by which one or more crystalline phases are generated.
- The fusion draw process, for example, uses a drawing tank that has a channel for accepting molten glass raw material. The channel has weirs that are open at the top along the length of the channel on both sides of the channel. When the channel fills with molten material, the molten glass overflows the weirs. Due to gravity, the molten glass flows down the outside surfaces of the drawing tank as two flowing glass films. These outside surfaces of the drawing tank extend down and inwardly so that they join at an edge below the drawing tank. The two flowing glass films join at this edge to fuse and form a single flowing glass-based article. The fusion draw method offers the advantage that, because the two glass films flowing over the channel fuse together, neither of the outside surfaces of the resulting glass-based article comes in contact with any part of the apparatus. Thus, the surface properties of the fusion drawn glass-based article are not affected by such contact. Where the glass-based article is a glass ceramic, the glass-based article formed from the fusion process may be subjected to a ceramming process by which one or more crystalline phases are generated.
- The slot draw process is distinct from the fusion draw method. In slot draw processes, the molten raw material glass is provided to a drawing tank. The bottom of the drawing tank has an open slot with a nozzle that extends the length of the slot. The molten glass flows through the slot/nozzle and is drawn downward as a continuous glass-based article and into an annealing region.
- The glass-based article may be acid polished or otherwise treated to remove or reduce the effect of surface flaws.
- Another aspect of this disclosure pertains to a method of forming a fracture-resistant glass-based article. The method includes providing a glass-based substrate having a first surface and a second surface defining a thickness of about 1 millimeter or less and generating a stress profile in the glass-based substrate, as described herein to provide the fracture-resistant glass-based article. In one or more embodiments, generating the stress profile comprises ion exchanging a plurality of alkali ions into the glass-based substrate to form a non-zero alkali metal oxide concentration that varies along a substantial portion of the thickness (as described herein) or along the entire thickness. In one example, generating the stress profile includes immersing the glass-based substrate in a molten salt bath including nitrates of Na+, K+, Rb+, Cs+ or a combination thereof, having a temperature of about 350 °C or greater (e.g., about 350 °C to about 500 °C). In one example, the molten bath may include NaNO3, KNO3 or a combination thereof, and may have a temperature of about 485 °C or less. In another example, the bath may include a mixture of NaNO3 and KNO3 and have a temperature of about 460 °C. The glass-based substrate may be immersed in the bath for about 2 hours or more, up to about 48 hours (e.g., from about 2 hours to about 10 hours, from about 2 hours to about 8 hours, from about 2 hours to about 6 hours, from about 3 hours to about 10 hours, or from about 3.5 hours to about 10 hours).
- In some embodiments, the method may include chemically strengthening or ion exchanging the glass-based substrate in a single bath or in more than one step using successive immersion steps in more than one bath. For example, two or more baths may be used successively. The composition of the one or more baths may include a single metal (e.g., Ag+, Na+, K+, Rb+, or Cs+) or a combination of metals in the same bath. When more than one bath is utilized, the baths may have the same or different composition and/or temperature as one another. The immersion times in each such bath may be the same or may vary to provide the desired stress profile.
- In one or more embodiments of the method, a second bath or subsequent baths may be utilized to generate a greater surface CS. In some instances, the method includes immersing the glass-based substrate in the second or subsequent baths to generate a greater surface CS, without significantly influencing the chemical depth of layer and/or the DOC. In such embodiments, the second or subsequent bath may include a single metal (e.g., KNO3 or NaNOa) or a mixture of metals (KNO3 and NaNO3). The temperature of the second or subsequent bath may be tailored to generate the greater surface CS. In some embodiments, the immersion time of the glass-based substrate in the second or subsequent bath may also be tailored to generate a greater surface CS without influencing the chemical depth of layer and/or the DOC. For example, the immersion time in the second or subsequent baths may be less than 10 hours (e.g., about 8 hours or less, about 5 hours or less, about 4 hours or less, about 2 hours or less, about 1 hour or less, about 30 minutes or less, about 15 minutes or less, or about 10 minutes or less).
- In one or more alternative embodiments, the method may include one or more heat treatment steps which may be used in combination with the ion-exchanging processes described herein. The heat treatment includes heat treating the glass-based article to obtain a desired stress profile. In some embodiments, heat treating includes annealing, tempering or heating the glass-based substrate to a temperature in the range from about 300°C to about 600°C. The heat treatment may last for 1 minute up to about 18 hours. In some embodiments, the heat treatment may be used after one or more ion-exchanging processes, or between ion-exchanging processes.
- Another aspect of the disclosure pertains to a glass-based article comprising
- a first surface and a second surface opposing the first surface defining a thickness (t) in a range of 0.1 mm and 2 mm; and
- a stress profile extending along the thickness (t),
- wherein at least one point of the stress profile in a first thickness range from about 0•t up to 0.020•t and greater than 0.98•t comprise a tangent having a slope of from about -200 MPa/micrometer to about -25 MPa/micrometer or about 200 MPa/micrometer to about 25 MPa/micrometer,
- wherein all points of the stress profile in a second thickness range from about 0.035•t and less than 0.965•t comprise a tangent with a slope of from about -15 MPa/micrometer to about 15 MPa/micrometer,
- wherein the stress profile comprises a surface CS of from about 200 MPa to about 1100 MPa, and
- wherein the stress profile comprises a DOC ranging from about 0.1•t to 0.25•t. In some embodiments, all points of the stress profile in a first thickness range from about 0•t up to 0.020•t and greater than 0.98•t comprise a tangent with a slope of from about -200 MPa/micrometer to about -25 MPa/micrometer or about 200 MPa/micrometer to about 25 MPa/micrometer. In some embodiments, the noted slopes for the second thickness range may be in a range from about 0.1•t to 0.9•t, or from 0.15•t to 0.85•t, or from 0.2•t to 0.8•t, or from 0.22•t to 0.78•t, or from 0.24•t to 0.76•t, or from 026•t to 0.74•t, or from 0.28•t to 0.72•t, or from 0.3•t to 0.7•t, or from 0.35•t to 0.65•t, or from 0.4•t to 0.6•t, or from 0.45•t to 0.55•t.
- One or more embodiments of the glass-based articles described herein comprise a certain stress profile that can impart enhanced scratch performance to the glass surface. Additionally, drop performances (e.g. on both 180 grit sand paper and 30 grit sand paper simultaneously) are not degraded and are kept at reasonable levels of performance for field use. Such experimental rough surfaces introduce a range of flaws in the glass that is significant and relevant to field performance. Thus, these stress profiles show improved resistance to scratching and good resistance to fracture in drop testing are the focus of the present disclosure. These stress profiles are also non-frangible.
- According to one or more embodiments, stress profiles for multiple-ion diffusion are disclosed in that impart a surprising improvement in scratch performance. Some stress profiles may be obtained in a single ion exchange step, others are obtained using two or more ion exchange steps. In one or more embodiments, the stress profiles exhibit two regions - a spike region of higher slope followed by a deep tail of substantially smaller slope leading to a very large depth of compression that is defined as the point where the stress changes from compressive to tensile inside the glass.
- In embodiments pertaining to thin glasses (i.e., thickness ranging from 0.05 mm to 2 mm), diffusion processes are long enough in duration that a nontrivial fraction of the Na ions exchanged into the glass from the ion exchange bath may reach the center of the glass such that the deep profiles in the two halves of the thickness connect in the middle without a central region of substantially constant Na concentration equal to the original Na concentration in the non-ion-exchanged substrate. In one or more embodiments, duration of the ion exchange is greater than 1 hour, greater than 1.5 hours, greater than 2 hours, greater than 2.5 hours, greater than 3 hours, greater than 3.5 hours, greater than 4 hours, greater than 4.5 hours, greater than 5 hours, greater than 5.5 hours, greater than 6 hours, greater than 6.5 hours, greater than 7 hours, greater than 7.5 hours and greater than 8 hours.
- In one or more embodiments, the stress profile provides an article that is non-frangible. As used herein, "non-frangible" means that when the glass breaks, the glass breaks in a few relatively large fragments. In contrast, frangible glass breaks into very small fragments, and with the possibility of ejection of glass particles at large distances due to the high elastic energy stored in the glass article.
- The glass-based article of one or more embodiments includes a first surface and a second surface opposing the first surface, defining a thickness t. In one or more embodiments, the thickness t may be about 2 millimeters or less (e.g., in the range from about 0.01 millimeter to about 2 millimeters, from about 0.1 millimeter to about 2 millimeters, from about 0.2 millimeter to about 2 millimeters, from about 0.3 millimeter to about 2 millimeters, from about 0.4 millimeter to about 2 millimeters, from about 0.01 millimeter to about 1.75 millimeters, from about 0.01 millimeter to about 1.5 millimeters, from about 0.01 millimeter to about 1 millimeter, from about 0.01 millimeter to about 0.9 millimeter, from about 0.01 millimeter to about 0.8 millimeter, from about 0.01 millimeter to about 0.7 millimeter, from about 0.01 millimeter to about 0.6 millimeter, from about 0.01 millimeter to about 0.5 millimeter, from about 0.1 millimeter to about 0.5 millimeter, or from about 0.3 millimeter to about 0.5 millimeter.)
- The stress profile of one or more embodiments feature the presence of two distinct regions having tangents with a slopes within certain ranges - one with a relatively steep slope and one with a shallow slope. Generally, the stress profile can be achieved two different ways. The first method features a single ion exchange diffusion, wherein two or more ions are diffused simultaneously. The second method features a two or more ion exchange diffusions where two or more ions are diffused simultaneously. Each method has particular advantages. For example, a single ion exchange diffusion step may be simpler and easier to implement and/or control. However, multiple ion exchange diffusion steps may allow for more freedom to tailor the stress profile. In one or more embodiments, duration of the ion exchange is greater than 1 hour, greater than 1.5 hours, greater than 2 hours , greater than 2.5 hours, greater than 3 hours, greater than 3.5 hours, greater than 4 hours, greater than 4.5 hours, greater than 5 hours, greater than 5.5 hours, greater than 6 hours, greater than 6.5 hours, greater than 7 hours, greater than 7.5 hours and greater than 8 hours.
- It is thought that the stress profiles described herein which contain the two regions in one step is that the larger K ions diffuse slower. In contrast, it is thought that the smaller Na ions diffuses faster and penetrates more deeply. It is also thought that the larger K ions produce higher stress due to larger specific volume change, hence a shallower spike in CS.
- In general, stress profiles having a large DOC and a high CS spike help reduce failures from front-side damage introduction while also keeping the rate of overstress failures acceptable. These profiles can achieve improved results in Li-containing glasses, which offer the ability to achieve a large depth of compression quickly via fast ion-exchange counter-diffusion of Na and Li ions. At the same time they also may achieve a high-compression (spike) surface layer by diffusing potassium (K) to a small depth on the order of 5-15 microns. With a single ion-exchange, there is a trade-off between on the one hand the compressive stress CS at the surface together with moderate to high depth-of-layer of the spike (DOLsp), and the knee stress CSk occurring at the bottom of the high-compression surface layer, which is the depth at which the slope of the stress changes drastically.
- A challenge with Li-containing glasses that have substantial amounts of both Li and Na in the non-strengthened substrate is that single-ion-exchange (SIOX, i.e., an ion-exchange that takes place in one bath or step, as opposed to "DIOX" which refers to double ion exchange, i.e., ion exchange performed on the same substrate or glass-based article in two baths or steps) profiles that have relatively high CSk tend to have limited depth of compression (DOC) due to high positive curvature of the deep portion of the profile resulting from strongly nonlinear diffusion.
- The present disclosure offers the ability to break the trade-off between CS and CSk and achieve combinations that offer high CS and relatively high CSk at the same time, while still achieving relatively high DOLsp. In addition, the invention provides for a substantial increase in DOC by allowing substantial reduction of the positive curvature of the deep portion of the profile, and in some cases even introducing negative curvature in a portion of the compression region.
- In some embodiments a two-step process of ion exchange is used, where both steps have a mixture of Na+ -ion and K+ -ion containing salts, such as NaNO3 and KNO3. The first-step salt mixture may have a higher Na content than the second-step salt mixture. For example, the first-step mixture may have 38-90 % NaNO3 by weight when the salt mixture is NaNO3+KNO3. The first-step salt mixture may produce a K2O-spike near the surface with moderate surface concentration (for example, <5 mol%), allowing development of a substantial CSk despite the presence of the K-spike. The first step may also develop substantial center tension CT, typically higher than 60 MPa.
- The second step may be performed in a salt mixture where Na-containing salt is substantially less (for example, 3-15 wt% NaNO3). In addition, the second step may be substantially shorter than the first step (in some
embodiments 3 or more times shorter), or performed at a substantially lower temperature. - The process takes advantage of nonlinear diffusion of K when the base glass has very low level of K2O, lower than about 8% of the molar content of total alkali oxides in the glass. The second-step spike is thus characterized by a substantially higher effective diffusion coefficient for K+ ions compared to the first step, allowing the full DOL of the high-CS spike to be maintained with a short second step, without significant sacrifice of CSK. The small amount of Na in the second-step salt mixture serves the purpose of preventing Na from out-diffusing during the spike, and thus to obtain a relatively stable process where CSk does not vary too much with relatively small variations of ion exchange temperature or time.
- The resulting profile has high CS, similar to the CS obtained by using the second mixture alone. In addition, it has CSk that is substantially higher than CSk typical of the second-step salt alone (by more than 10 MPa), but also substantially lower than CSK of the first step (by more than 10 MPa). The relatively high CT is maintained, or sometime slightly increased after the short second step. This CT is substantially higher than the maximum CT that can be obtained by using only the salt composition of the second step. Finally, the stress profile may have a DOC that is often on the order of .2•t (20% of the substrate thickness), and is greater than the maximum depth that is possible in either the first salt mixture or the second salt mixture when used alone.
- During service, the same cover-glass component experiences a variety of service stresses (meaning wear-and-tear effects) on the front (outer) side, the back (inner) side, and the edge. The most common causes of failure (fracture) include fractures from introduction of a deep flaw (>10 µm) whose tip depth may sometimes even exceed the depth of compression (DOC) available from the chemical strengthening, and from overstress (OS) of a relatively shallow flaw (1-10um) subjected to high local tension of several hundred MPa. Quite often a fracture may be initiated when a deep flaw having a tip depth somewhat smaller than the DOC is exposed to moderate tension by minor bending of the cover-glass component during service. Hence, a large DOC and the value of compressive stress at relatively large depths inside the deep compressive layer are among beneficial parameters of chemical strengthening. Such deep flaws may be introduced into the glass during contact with rough surfaces or sharp objects.
- A two-step process has an advantage that, if done in an appropriate manner as according to the present disclosure, the deep portion of the profile and the spike are developed essentially independently. The change of the deep portion of the profile during a short and relatively low-temperature "spike" step may be almost negligible (typically less than 1 % change in DOL and stress of the deep portion, and a minor change in DOC).
- Li-containing glasses offer some useful attributes for obtaining spiked profiles with very large DOC, but also come with some significant challenges. One advantage is the ability to develop very large DOC using a relatively short ion exchange at a temperature much lower than the softening point of the glass. A large DOC is achievable quickly because Na can be exchanged for Li deep into the glass much faster than K can be exchanged for Na to similar depths, owing to the larger diffusivity of the smaller Na and Li, when compared to K and Na, respectively. This advantage creates a challenge at the same time, because the formation of a surface spike of high CS in a Li-containing glass usually requires in-diffusion of K+ ions to the desired depth on the order of 10 µm. The very small diffusivity of K in a Li-based glass, relative to that of Na, generally means that implementing a surface compression spike in a nominally pure KNO3 bath using a second step following a first step of pure NaNO3 ion exchange or exchange in a NaNO3 - LiNO3 mixture, would greatly deteriorate the level of compression at depths exceeding the DOLsp (e.g., from the spike depth, DOLsp to the DOC), because the gradient of Na ions obtained after the first ion-exchange step would significantly decrease during the spike-formation (second ion-exchange) step.
- Furthermore, some Li-containing glasses of commercial interest contain significant and comparable amounts of both Li2O and Na2O in the base glass. In an example, one commercially available glass from Corning Incorporated (Corning, NY) contains about 6 mol% Li2O and 11 mol% Na2O. Similarly, another commercially available glass from Corning Incorporated (Corning, NY) contains about 6 mol% Li2O and about 9 mol% Na2O. When a glass with such composition having significant amounts of both Li2O and Na2O is ion exchanged in a bath designed to substantially enrich the glass with Na at the expense of Li, the resulting Na concentration profiles tend to poses very significant positive curvature as a result of substantially nonlinear diffusion. As a result, the deep portion of the stress profile at depths greater than the spike depth also has a substantial positive curvature when the knee stress CSk is significant, such as exceeding 120 MPa. For example, see curves 2801 (Comparative Example 7B) and 2802 (Comparative Example 7C) in
Figure 28 , discussed in further detail below. Such profiles tend to provide a significant level of compressive stress at relatively small and intermediate depths, but relatively lower compressive stress at large depths approaching the depth of compression. SeeFigure 28 whereincurves Figure 28 , whereincurve 2801 has about the same CS ascurve 2804 at 50 microns (1/3 the DOC of about 150 microns), but has a CS that drops below that ofcurve 2804 by 100 microns (about 2/3 of the DOC). Similarly, again inFigure 28 ,curve 2802 has a CS that is already below that ofcurve 2804 by 50 microns (about 1/3 DOC) and remains below that ofcurve 2802 at 75 microns (about 1/2 DOC) and 100 microns (about 2/3 DOC). In addition, such profiles (ascurves 2801 and 2802) tend to have somewhat smaller DOC than profiles with similar spike and similar knee stress that have less curvature in the deep portion of the compression region, e.g., profiles that could be obtained in a glass that has a lot of Li2O but little or no Na2O in the non-strengthened composition. - In chemically strengthened Li-containing cover glasses, one benefit of the chemical strengthening is achieved when the DOC is in a stable regime. The DOC is stabilized on the order of 20% of the thickness (DOC is about 0.2t), and profiles with higher positive curvature usually have somewhat smaller values, while profiles with lower positive curvature, or even with a portion having negative curvature, tend to have somewhat higher values of DOC. In this stable-DOC regime, during service in the field the cover glass could be subjected to formation of deep flaws by sharp objects such as sand particles or small rocks. The strength-limiting flaws are most often the deepest flaws, and having more compressive stress at large depths such as the range 0.3DOC-DOC may be beneficial for reducing the probability of fracture as a result of sharp-contact events. This becomes particularly important for smaller thicknesses such as equal to or less than1mm, for example equal to or less than 0.8mm, or equal to or less than 0.6mm, because the DOC is reduced in proportion to the thickness and the tips of the flaws that need to be arrested by compressive stress reach an increasingly larger portion of the DOC.
- The present disclosure sets forth a particular double-ion-exchanged process that allows simultaneously achievement of a significant spike DOL, significant spike CS, deep DOC, significant CSk, and significant compressive stress at large depths 0.3DOC-DOC (in some embodiments as a result of reduced positive curvature of the deep portion of the compressive-stress profile).
- Some embodiments may include improvement of scratch resistance, as a result of the benefit of simultaneous achievement of a good depth of the spike and high CS while achieving the desired level of CSk for good fracture resistance.
- In some embodiments, stress profiles obtained by two-step (or more) ion exchange of a Lithium containing glass have substantial benefits compared to profiles that can be obtained in the same glass by either a single-step ion exchange in a mixed bath of Na and K-containing salt, or in prior two-step ion exchanges.
- A stress profile obtained using DIOX with a relatively long step in 100% NaNO3 followed by a shorter second step in a mixture of NaNO3 and KNO3 provides mostly a tradeoff between higher CSk and reduced DOLsp, when compared with a SIOX process using the same salt mixture as the second step of the DIOX. A better a DIOX profile is obtained when both the first step and the second step of ion exchange are performed in mixtures of KNO3 and NaNO3, but, unlike a DIOX (having
step 1 with 65%Na; step2 40%Na), the second-step bath has a molar ratio of Na: K that is substantially smaller (for example, 3-10 times smaller) than the Na:K molar ratio of the first-step bath. - A stress profile in a Li-containing glass, according to some embodiments, is obtained by a two-step ion-exchange wherein both steps of ion exchange are completed in a bath including both a Na-containing salt and a K-containing salt, wherein the ratio of Na ions to K ions in the first bath is 2.5 or more times higher than the ratio of Na ions to K ions in the second bath, for example 3 or more times higher, or 5 or 8 or more times higher, but 800 or less times higher, for example 600, 500, or 400, or less, times higher, depending on the Na:Li ratio in the glass composition. Furthermore, in some embodiments, the second salt has a ratio of Na to K that is 0.03 or more, for example 0.04 or more, or 0.047 or more, and in some cases 0.06 or 0.07 or more, and that is less than or equal to 0.4, or 0.35, or 0.30, or 0.21, 0.16, or 0.13, depending on the glass composition. Generally, compositions having substantially more Na in the glass than Li would tolerate higher ratios of Na:K in the bath, for example 0.21 and 0.16 in the second bath.
- In some embodiments, the effective diffusion time of the second step is from 1/20 to ½ of the diffusion time of the first step, for example from 1/20 to 1/3,or from 1/20 to ¼.
- Some features of the DIOX process described herein are as follows.
- In some embodiments, high surface CS, very similar to the high surface CS that would have been obtained with the low-Na composition of the second step, and substantially higher than the surface CS that is normally produced with the high-Na first-step bath. For example, see
curve 2801 having a high surface CS produced by the 70Na/30K bath of Comparative Example 7B, and compare with Example 7A,curve 2804. The surface CS of the DIOX profile can be 600 MPa or more, for example 650 MPa or more, 700 MPa or more, 750 MPa or more, 800 MPa or more, or 850 MPa or more. - In some embodiments, the DOLsp is comparable to the DOLsp of the first step, and significantly larger than DOLsp that would have been obtained with the second step alone (often twice as large, even more). This means that DOLsp is relatively large, when compared to a DOLsp that would be obtained if only the second step had KNO3 in the salt bath and provided K ions for spike formation through ion exchange. In some embodiments, DOLsp attained with the DIOX process disclosed herein is: in the range of from 5 to 16 microns, and represents from 0.5 to 1.5% of the thickness when the thickness is from 1 to 1.3mm; in the range of from 0.6 to 2% of thickness when the thickness is from 0.8 to 1mm; in the range of 0.7 to 2.5% when the thickness is from 0.65 to 0.8mm; in the range of 0.9 to 3% when the thickness is from 0.5 to 0.65mm; and in the range of 1 to 3% when the thickness is from 0.3 to 0.5mm.
- In some embodiments, relatively high CSk, substantially higher than CSk that would be typical of the composition of the second-step bath alone, and lower than the first-step CSk. For example, in Example 7A, the first-step CSk is about 160 MPa, the DIOX CSk is 125 MPa, whereas a bath having the composition of the second step, 7%NaNO3 + 93%KNO3 by weight would produce CSk below 75 MPa when stable DOC is reached.
- In some embodiments, there is attained a high DOC, higher than the DOC that would be obtained by a single-step ion exchange in the first-step salt. For example, for a 0.8mm sample the DIOX DOC of Example 7A is about 160 um, or 20% of the thickness.
- In some embodiments, there is attained minimization or even elimination of positive curvature in the compressive-stress profile in the depth range from about 1.5 DOLsp to DOC. In particular, the curvature in that depth range preferably does not exceed the curvature of a force-balanced parabolic profile centered in the middle of the substrate and having the same CSk as the inventive DIOX profile. Note that for the purposes of this comparison, a sign convention is assumed where compressive stress is positive, tensile stress is negative. Also it should be noted that while for the purposes of quality control a simplified representation of the profile as a spiked power-law profile may be assumed. The deep portion of a spiked parabolic profile is fitted with a parabola having a power coefficient of 2. In some embodiments, the power coefficient may range from 1 to 3, or from 1.7 to 2.6 for the shape of the deep region of the profile, or the CT region. The inventive DIOX profile demonstrates curvature in the region between DOLsp and the DOC that over the same depth range does not exceed the curvature of a parabolic profile having the same stress at depth=DOLsp.
- In some embodiments, there can be attained a relatively high compression in the depth range from DOC/3 to DOC. In particular, the DIOX profile has similar or higher compression than the first-step profile in this depth range. For example, compare
curve 2804 inFigure 28 withcurves - In some embodiments, there can be attained a relatively high CT, usually within +/-3 MPa of the first-step CT, and usually 5-15 MPa higher than CT that would be obtained with just the
step 2 salt composition for an equivalent total ion-exchange time. In Example 7, shown inFigure 28 , the DIOX profile (curve 2804) has a CT of about 70 MPa, approximately the same as the CT of the 1 step,curve 2801 profile (70%Na, 4 hours, 380 C), while an ion exchange in the second-step bath (7%Na) for a comparable time as the DIOX total time of 4hr+40min would result in a CT in the range 50-55 MPa. The high CT of the DIOX profile indicates a high stress-depth integral in the compression zone, which helps provide resistance of the glass article to fracture initiated by a flaw introduced in the compression zone. - In some embodiments, there is attained better scratch resistance compared to other fracture-resistant profiles with similar deep portion and similarly high CSk, but substantially lower surface CS or lower DOLsp. For example, compare the
curve 2802 SIOX profile ofFigure 28 prepared in the bath having 40%NaNO3 and 60%KNO3 having a similar CSk at 125 MPa, similar DOC, and DOLsp as theDIOX profile curve 2804, but the surface CS ofcurve 2802 is lower by about 250 MPa (550-570 MPa vs. 800-820 MPa for thecurve 2804 DIOX profile). - In some embodiments, the DIOX profile and method of making it provide superb strengthening of the peripheral area of the glass article, particularly when the thickness of the glass article decreases gradually toward the edge ("2.5D cover glass"). For traditional ("2D") cover glass, the thickness of the glass article is constant essentially to the very edge of the glass sheet, or to within less than 0.3t of the edge tip when the edge is chamfered, where t is the thickness of the sheet. The profiles according to embodiments described herein do provide superior strengthening of this type of edge when compared to prior-art profiles, as the depth of compression measured from any point around the edge is similar to the large depth of compression in the interior of the sheet. More significantly, for 2.5D cover glass, where the thickness of the sheet gradually declines toward the edge, starting to decline usually 1-3mm from the edge, or from a distance greater than or equal to 0.3t from the edge, but most often from a distance greater than or equal to 0.5t, or greater than or equal to 1.0t, from the edge, there is a major strengthening of the edge in the sense that a flaw initiated in the periphery of the glass article (e.g., form edge contact) is substantially more likely than usual to be arrested or deflected by the compressive-stress distribution compared to prior-art profiles. This crack arresting effect is a major advantage because when electronic devices are accidentally dropped, they more often experience contact events on the edge, so strengthening the edge is beneficial for significant improvement in resistance to fracture in actual service.
- Accordingly, in one or more embodiments at least one point of, and in other embodiments all points of, the stress profile in a first thickness range from about 0•t up to 0.020•t and greater than 0.98•t comprise a tangent with a slope of from about -200 MPa/micrometer to about -25 MPa/micrometer or about 200 MPa/micrometer to about 25 MPa/micrometer. The first thickness range may span from about 0•t up to about 0.020•t, 0.025•t, 0.0275•t, 0.030•t, or 0.035•t, and greater than 0.98•t, 0.975•t, 0.9725•t, 0.97•t, or 0.965•t. The slope may range from about -200 MPa/micrometer to about -25 MPa/micrometer or about 200 MPa/micrometer to about 25 MPa/micrometer. In further embodiments, the slope may range from about -200, -190, -180, -170, -160, -150 or -140 MPa/micrometer to about -25, -27, -30, -31, -32, -33, -34 or -35 MPa/micrometer; or about 25, 27, 30, 31, 32, 33, 34, or 35 to about 140, 150, 160, 170, 180, 190 or 200. Thus, for example, in one or more embodiments at least one point of, and in other embodiments all points of, the stress profile in the first thickness range comprise a tangent with a slope of from about -170 MPa/micrometer to about -30 MPa/micrometer or about 30 MPa/micrometer to about 170 MPa/micrometer. In some embodiments at least one point of, and in other embodiments all points of, the stress profile in the first thickness range comprise a tangent with a slope of from about -140 MPa/micrometer to about -35 MPa/micrometer or about 35 MPa/micrometer to about 140 MPa/micrometer.
- The above slope ranges may be combined with any of the first thickness ranges. Thus, for example, in one or more embodiments at least one point of, and in other embodiments all points of, the stress profile in a first thickness range from about 0•t up to 0.025•t and greater than 0.975•t comprise a tangent with a slope of from about -200 MPa/micrometer to about -25 MPa/micrometer or about 25 MPa/micrometer to about 200 MPa/micrometer. In further embodiments at least one point of, and in other embodiments all points of, the stress profile in a first thickness range from about 0•t up to 0.025•t and greater than 0.975•t comprise a tangent with a slope of from about -170 MPa/micrometer to about - 30 MPa/micrometer or about 30 MPa/micrometer to about 170 MPa/micrometer. In further embodiments at least one point of, and in other embodiments all points of the stress profile in a first thickness range from about 0•t up to 0.025•t and greater than 0.975•t comprise a tangent with a slope of from about -140 MPa/micrometer to about -35 MPa/micrometer or about 35 MPa/micrometer to about 140 MPa/micrometer.
- In some embodiments at least one point of, and in other embodiments all points of the stress profile in a first thickness range from about 0•t up to 0.035•t and greater than 0.965•t comprise a tangent with a slope of from about -200 MPa/micrometer to about -25 MPa/micrometer or about 25 MPa/micrometer to about 200 MPa/micrometer. In further embodiments at least one point of, and in other embodiments all points of the stress profile in a first thickness range from about 0•t up to 0.035•t and greater than 0.965•t comprise a tangent with a slope of from about -170 MPa/micrometer to about -30 MPa/micrometer or about 30 MPa/micrometer to about 170 MPa/micrometer. In yet further embodiments at least one point of, and in other embodiments all points of the stress profile in a first thickness range from about 0•t up to 0.035•t and greater than 0.965•t comprise a tangent with a slope of from about -140 MPa/micrometer to about -35 MPa/micrometer or about 35 MPa/micrometer to about 140 MPa/micrometer. In some embodiments, as the first thickness range becomes shorter, the slopes of tangents at points in the first thickness may become steeper.
- In one or more embodiments of this aspect, all points of the stress profile in a second thickness range from about 0.035•t and less than 0.965•t comprise a tangent with a slope of from about -15 MPa/micrometer to about 15 MPa/micrometer. That is, going along the span of 0.035•t and through 0.965•t, the slope begins negative, approaches zero, and then becomes positive, approximating a power-law function. As used herein, "power-law function" refers to a curve in which the stress is exponentially proportional to the depth or thickness. In one or more embodiments, the exponent ranges from about 1.2 to about 3.2. In further embodiments, the exponent ranges from about 1.2 to about 2.8. In some embodiments, the noted slopes for the second thickness range may be in a range from about 0.1•t to 0.9•t, or from 0.15•t to 0.85•t, or from 0.2•t to 0.8•t, or from 0.22•t to 0.78•t, or from 0.24•t to 0.76•t, or from 0.26•t to 0.74•t, or from 0.28•t to 0.72•t, or from 0.3•t to 0.7•t, or from 0.35•t to 0.65•t, or from 0.4•t to 0.6•t, or from 0.45•t to 0.55•t.
- The points in the second thickness range can also be described as comprising tangents with slopes. In one or more embodiments, the slopes of the tangents range from about -15, -10, -5, -4, -3, -2 or -1 MPa/micrometer to about 1, 2, 3, 4, 5, 10 or 15 MPa/micrometer. In some embodiments, the noted slopes for the second thickness range may be in a range from about 0.1•t to 09•t, or from 0.15•t to 0.85•t, or from 0.2•t to 0.8•t, or from 022•t to 0.78•t, or from 0.24•t to 0.76•t, or from 026•t to 0.74•t, or from 0.28•t to 0.72•t, or from 0.3•t to 0.7•t, or from 0.35•t to 0.65•t, or from 0.4•t to 0.6•t, or from 0.45•t to 0.55•t.
- The above slope ranges may be combined with any of the second thickness ranges. Thus, for example, in one or more embodiments, all points of the stress profile in a second thickness range from about 0.035•t and less than 0.965•t comprise a tangent with a slope of from about -2 MPa/micrometer to about 2 MPa/micrometer. In some embodiments, the all points of the stress profile in the second thickness range from about 0.025•t and less than 0.975•t comprise a tangent with a slope of from about -15 MPa/micrometer to about 15 MPa/micrometer. In further embodiments, the points of the stress profile in the second thickness range from about 0.025•t and less than 0.975•t comprise a tangent with a slope of from about -2 MPa/micrometer to about 2 MPa/micrometer. In one or more embodiments, all points of the stress profile in the second thickness range from about 0.02•t and less than 0.98•t comprise a tangent with a slope of from about -15 MPa/micrometer to about 15 MPa/micrometer, or from about -2 MPa/micrometer to about 2 MPa/micrometer.
- In one or more embodiments, the glass-based article comprises a surface CS of from about 200 MPa to about 1100 MPa. In further embodiments, the surface CS is greater than about 300, 350, 400, 450, 500, 550, 600, 610, 620 650, 700, 750, and/or less than about 650, 700, 750 800, 850, 900, 950, 1000 or 1100.
- The glass-based articles described in or more embodiments of this aspect comprise a stress profile comprises a DOC ranging from about 0.1•t to 0.25•t, or 0.3•t.
- In one or more embodiments, the glass-based article comprises a composition comprising between about 0.5 mol% P2O5 and 10 mol% P2O5.
- The stress profiles of the glass-based articles of this aspect can be obtained either via a single ion exchange step or using two or more ion exchange steps. In one or more embodiments, the ion exchange step(s) can include or incorporate any of the features described above in previous aspects. In one or more embodiments, the first thickness range is obtained by ion exchange in a potassium-containing salt.
- In one or more embodiments pertaining to a single-step ion-exchange process on a Li-containing glass, it is thought that a main control parameter is the bath concentration ratio between Na and K, driving the relative magnitude of the spike CS and the stress in the deep portion of the profile. Secondary parameters with smaller influence on that relative magnitude are the ion exchange time and temperature, both of which may be affected by the requirements for the depth of the spike and the overall stress in the profile. Thus, according to one or more embodiments, methods are provided that include a single ion exchange step including varying the concentration ratio between Na and K for a duration to achieve the stress profiles described herein.
- In one or more embodiments pertaining to chemical strengthening having two or more ion exchange steps, it is possible to further tailor the profile shape by using different Na/K ratios and different relative times of these two or more steps. In some embodiments, a range of power coefficients for the tail region of the profile can be achieved by tailoring the KNO3/NaNO3 ratio and ion exchange time. Experimental profiles provided in the present disclosure can have a power coefficient falling in a range of from 1 to 3, or from 1.7 to 2.6 for the shape of the deep region of the profile. It is thought that profiles with lower power coefficients generally have smaller slopes in the deep region, typically below 1 MPa/micrometer. Thus, according to one or more embodiments, methods are provided that include two or more ion exchange steps including varying the concentration ratio between Na and K for a duration to achieve the stress profiles described herein.
- Another aspect of the disclosure pertains to a glass-based article comprising a center plane, wherein the center plane comprises from about 2 to about 20 mol-% Li2O; a first surface and a second surface opposing the first surface defining a thickness (t) in a range of 0.1 mm and 2 mm; and a stress profile extending along the thickness (t), wherein at least one point of the stress profile in a first thickness range from about 0•t up to 0.020•t and greater than 0.98•t comprises a tangent with a slope of from about -200 MPa/micrometer to about -25 MPa/micrometer or about 25 MPa/micrometer to about 200 MPa/micrometer, wherein the stress profile comprises a surface CS of from about 200 MPa to about 1100 MPa, and wherein the stress profile comprises a DOC ranging from about 0.05•t to 0.25•t. Any of the embodiments described above, particularly with respect to the previous aspect may be applied to this aspect. In other embodiments, all points of the stress profile in the first thickness range from about 0•t up to 0.020•t and greater than 0.98•t comprise a tangent with a slope of from about -200 MPa/micrometer to about -25 MPa/micrometer or about 25 MPa/micrometer to about 200 MPa/micrometer.
- In one or more embodiments, the first thickness range is obtained by ion exchange in a K-containing salt.
- In one or more embodiments, the second thickness range is obtained by ion exchange in a Na- or K-containing salt.
- In one or more embodiments, the stress profile is obtained using a single ion-exchange step.
- In one or more embodiments, the stress profile is obtained using two or more ion-exchange steps.
- In one or more embodiments, the surface CS ranges from about 690 MPa and 950 MPa.
- In one or more embodiments, all points of the stress profile in the second thickness range from a power-law profile having a power exponent, wherein the power exponent is between about 1.2 to 3.4. In some embodiments, the power exponent is between about 1.3 and 2.8.
- In one or more embodiments, the glass-based article comprises a composition comprising from about 0.5 mol% P2O5 to about 10 mol% P2O5.
- In one or more embodiments, the center-plane further comprises a composition comprising from about 0.5 mol% to about 20 mol%Na2O. In some embodiments, the center-plane further comprises a composition comprising from about 2 mol% to about 10 mol% Li2O. In some embodiments, the concentration of Na2O in the center plane of the glass article is between about 5 mol% and 16 mol%. In some embodiments, the concentration of Na2O in the center plane of the glass article is between about 10 mol% and 15 mol%. In some embodiments, the concentration of Li2O in the center plane of the glass article is between about 3 mol% and 10 mol%.
- The glass-based articles according to one or more embodiments of the disclosure described herein provide an improved level of scratch resistance without penalty to the drop performance, particularly for glass-based articles comprising Li-based. The glass-based articles according to one or more embodiments of the disclosure described herein provide superior drop performance, as demonstrated both in 30 grit and 180 grit sand paper. The glass-based articles according to one or more embodiments of the disclosure described herein provide recipes that are non-frangible and breakage of the glass is quasi-uniform in large parts. The glass-based articles according to one or more embodiments of the disclosure described herein provide for acceptable levels of glass shape distortion for the temperatures and composition used in the ion exchange process. The glass-based articles according to one or more embodiments of the disclosure described herein comprise stress profiles that can be implemented without added complexity in the manufacturing process
- In one or more embodiments, it has been observed that the concentration profiles in glasses according to the present disclosure differ from complementary error function-based profiles that can be calculated using linear diffusion approximation. Thus, glasses according to one or more embodiments described herein do not exhibit complementary error function-based profiles that can be calculated using linear diffusion approximation.
- According to one or more embodiments, mutual diffusivities that can be used to describe NalLi, K/(Na+Li) counter-diffusion in glasses according to one or more embodiments are dependent on the local concentration of Li, Na, and K. Li-containing glasses that are chemically strengthened have been described in the literature. However, such glasses described in the literature neglect the effects of concentration-dependent diffusivity on the curvature of the stress profile, and such glasses exhibit profiles consistent with a linear diffusion approximation ( i.e., erfc-shaped shallow and deep branch of a two segment profile), distinguishing glasses of one or more embodiments of the present disclosure from those in the literature. Another difference between glasses described according to one or more embodiments of the present disclosure and those in the literature is that diffusion of the strengthening ion species (e.g., Na+ or K+ or a combination thereof) in known strengthened substrates do not extend to deeper depths of the substrate or, in some cases, to the center (i.e., in the range from about 0.4t to about 0.6t) of the substrate. Moreover, the literature does not disclose the combination of glass diffusivity, substrate thickness, and ion exchange conditions that result in the stress profiles described herein. In particular, the literatures describes thicker substrates (e.g., substrates having thicknesses exceeding 2.5 mm). These differences, among others, between glasses according to one of more embodiments of the present disclosure and those described in the literature also results in a difference in the overall shape of the profile, more specifically, the power-law approximation according to one or more embodiments.
- Various embodiments will be further clarified by the following examples. In the Examples, prior to being strengthened, the Examples are referred to as "substrates". After being subjected to strengthening, the Examples are referred to as "articles" or "glass-based articles".
- Examples 1A-1G included glass substrates having a nominal composition of about 63.46 mol% SiO2, 15.71 mol% Al2O3, 6.37 mol% Li2O, 10.69 mol% Na2O, 0.06 mol% MgO, 1.15 mol% ZnO, 2.45 mol% P2O5, and 0.04 mol% SnO2. The glass substrates have a thickness of 0.8 mm. The glass substrates of Examples 1A-1G were ion exchanged in a molten salt bath including 100% NaNO3 and having a temperature of about 390 °C, according to the conditions provided in Table 2. The resulting glass-based articles exhibited maximum CT values, which are plotted as a function of ion exchange time in
Figure 5 .Table 2: Ion exchange conditions for Examples 1A-1G. Example Time immersed in bath (hours) Maximum CT 1A 0.5 30 1B 1 42 1C 1.5 52 1D 2 56 1E 3.75 67 1F 8 63 1G 16 55 - The stress profile for Example 1E was measured using a refracted near-field (RNF) measurement, as described in
U.S. Patent No. 8,854,623 , entitled "Systems and methods for measuring a profile characteristic of a glass sample".Figure 6 shows the measured stress as a function of depth extending from the surface of the glass-based article of Example 1E into the glass-based article. The stress at specific depths is shown in Table 3, including at the knee. InFigure 6 , positive numbers are used for compressive stress, and negative numbers indicate tensile stress. This same convention (compressive stress is indicated as positive values on the y axis, and tensile stress is indicated by negative values on the y axis) is used forFIGS. 1-3 ,23 , and27 , also. However, in the remainder of the figures, compressive stress is indicated as negative values on the y axis and tensile stress is indicated as positive values on the y axis.Table 3: Stress at specific depths of Example 1E. Depth (micrometers) Stress (MPa) 12 ("knee") 161 50 95 100 36 150 0 - Example 2A included a glass substrate having the same composition as Example 1 and a thickness of 0.8 mm. The glass substrate was ion exchanged in a single molten salt bath including 51% KNO3 and 49% NaNO3, and having a temperature of about 380° C, for 3.75 hours. The resulting glass-based article exhibited the stress profile as described in Table 4.
Table 4: Stress profile of Example 2A. Surface Compressive Stress 500 MPa Depth of layer for potassium 12 micrometers Stress at DOL of potassium 161 MPa Maximum CT 70 MPa DOC 150 micrometers - Glass-based articles according to Example 2A were subjected to AROR testing as described herein. One set of glass-based articles was abraded using a load or pressure of 34.5 (5 psi), a second set of glass-based articles was abraded using a load or pressure of 172.4 kPa (25 psi), and a third set of glass-based articles was abraded using a load or pressure of 310.3 kPa (45 psi). The AROR data is shown in
Figure 7 . As shown inFigure 7 , all of the glass-based articles according to Example 2A exhibited an average load to failure of greater than about 20 kgf. - Glass-based articles according to Example 2A were retrofitted onto identical mobile phone devices. The phone devices were dropped from incremental heights starting at 20 centimeters onto 180 grit sandpaper. If a glass-based article survived the drop from one height (e.g., 20 cm), the mobile phone was dropped again from a greater height (e.g., 30 cm, 40 cm, 50 cm, etc.) up to a height of 225 cm. The surviving glass-based articles were then dropped onto 30 grit sandpaper (in the same phone devices). The height at which the glass-based article failed on both 180 grit sandpaper and 30 grit sandpaper is plotted in
Figure 8 . As shown inFigure 8 , all but two glass-based articles of Example 2A survived being dropped onto 180 grit sandpaper up to heights of about 225 cm (providing an average survival drop height of about 216 cm). The average survival drop height onto 30 grit sandpaper was 66 cm, with some surviving over 100 cm drop heights. - The glass based articles according to Example 2A exhibited a dielectric constant of about 6.9 to about 7.05 over a frequency range from about 480 mHz to about 3000 mHz. The glass-based articles according to Example 2A exhibited a dielectric loss tangent in the range from about 0.012 to about 0.015 over a frequency range from about 480 mHz to about 3000 mHz.
- The refractive index of the glass-based articles according to Example 2A is in the range from about 1.158 to about 1.49 over a range from about 380 nm to about 1550 nm, and from about 1.518 to about 1.497 over a wavelength range from about 380 nm to about 800 nm.
- The glass-based articles according to Example 2A were subjected to various chemical treatments as shown in Table 5. The chemical durability of the glass-based articles was compared to Comparative Examples 2E, 2F and 2G. Comparative Example 2E was a glass substrate having a nominal composition of 64.3 mol% SiO2, 7.02 mol% B2O3, 14 mol% Al2O3, 14 mol% Na2O, 0.5 mol% K2O, 0.03 mol% Fe2O3, and 0,1 mol% SnO2. Comparative Example 2F was a glass substrate having a nominal composition of 64.75 mol% SiO2, 5 mol% B2O3, 14 mol% Al2O3, 13.75 mol% Na2O, 2.4 mol% MgO, and 0.08 mol% SnO2. Comparative Example 2G included a glass substrate having a nominal composition of 57.5 mol% SiO2, 16.5 mol% Al2O3, 16.71 mol% Na2O, 2.8 mol% MgO and 0.05 mol% SnO2.
Table 5: Chemical durability of Example 2A. Chemical Treatment Weight loss (mg/cm2) Comparative Example 2E Comparative Example 2F Comparative Example 2G Example 2A 5% w/w HCl, 95 °C, 24 hours 29.3 6.7 50 5.77 5% w/w NaOH, 95 °C, 6 hours 2.8 2.4 5.8 2.68 10% HF, room temperature, 20 minutes 20.8 18.1 37.4 24.03 10% ammonium bifluoride (ABF), room temperature, 20 minutes 2 2.7 3.2 0.98 - Example 3A included glass substrates having the same composition as Example 1 and a thickness of 0.8mm. Comparative Example 3B included glass substrates having the same composition as Comparative Example 2G and a thickness of 0.8 mm. The glass substrates of Example 3A were chemically strengthened in a single step using a single bath, as described in Table 6. The glass substrates of Comparative Example 3B was ion exchanged in a two-step process, as described in Table 6.
Table 6: Ion exchange conditions for Example 3A and Comparative Example 3B. Example 3A Comparative Example 3B 1st Step Molten salt bath 49%NaNO3/51% 49%NaNO3/51% composition KNO3 KNO3 Bath Temperature 380 °C 460 °C Immersion time 3.75 hours 14 hours 2nd Step Molten salt bath composition - 99.5% KNO3/0.5% NaNO3 Bath Temperature - 390 °C Immersion time - 0.25 hours Properties of resulting glass article Surface CS 500 MPa 825 MPa DOL of potassium 12 micrometers 10 micrometers Stress at DOL of potassium 160 MPa 220 MPa DOC 150 micrometers 100 micrometers - The glass-based articles according to Example 3A and Comparative Example 3B were retrofitted onto identical mobile phone devices. The phone devices were dropped from incremental heights starting at 20 centimeters onto 30 grit sandpaper. The height at which the glass-based article failed on 30 grit sandpaper is plotted in
Figure 9 . As shown inFigure 9 , the glass-based articles of Example 3A exhibited an average survival drop height that is more than two times (i.e., 91 cm) the average survival drop height of Comparative Example 3B (i.e., 38 cm). - Glass-based articles according to Example 3A and Comparative Example 3B were subjected to AROR testing, as described herein, using a load or pressure of 172.4 kPa (25 psi). The glass-based substrates of Example 3A exhibited an average load to failure of about 30 kgf, while the glass-based substrates of Comparative Example 3B exhibited an average load to failure of about 27 kgf, as shown in
Figure 10 . When the abrasion load or pressure was increased to 310.3 kPa (45 psi), the difference in average load to failure for Example 3A and Comparative Example 3B increased. Specifically, under a 45 psi load or pressure, Example 3A exhibited an average load to failure of about 25.9 kgf, while Comparative Example 3B exhibited an average load to failure of about 19.6 kgf, as shown inFigure 11 . - Glass substrates having a nominal composition of 57.5 mol% SiO2, 16.5 mol% Al2O3, 16.7 mol% NazO, 2.5 mol% MgO, and 6.5 mol% P2O5, and having a thicknesses of about 0.4 mm, 0.55 mm, or 1 mm were subjected to chemical strengthening. The thicknesses and conditions of chemical strengthening are shown in Table 7.
Table 7: Thickness and chemical strengthening conditions for Examples 4A-4D. Ex. Thickness Bath Composition Bath Temperature 4A 0.4 mm 80% KNO3, 20 % NaNO3 430 ° C 4B 0.55 mm 80% KNO3, 20 % NaNO 3430 ° C 4C 0.55 mm 90% KNO3, 10 % NaNO 3430 ° C 4D 1.0 mm 70% KNO3, 30 % NaNO 3430 °C - Example 4A was immersed in a molten salt bath, as indicted in Table 7, for 4 hours, 8 hours, 16 hours, 32 hours, 64 hours and 128 hours (Examples 4A-1 through 4A-6). Example 4B was immersed in a molten salt bath, as indicated in Table 7, for 4 hours, 8 hours, 16 hours, 32 hours, 64 hours and 128 hours (Examples 4B-1 through 4B-6). Example 4C was immersed in a molten salt bath, as indicated in Table 7, for 1 hour, 2 hours, 4 hours, 8 hours, 16 hours and 32 hours (Examples 4C-1 through 4C-6). Example 4D was immersed in a molten salt bath, as indicated in Table 7, for 4 hours, 8 hours, 16 hours, 32 hours, 64 hours and 128 hours (Examples 4D-1 through 4D-6). The stress profiles of Examples 4A-1 through 4A-6, 4B-1 through 4B-6, 6C-1 through 4C-6, and 4D-1 through 4D-6 are shown in
Figures 12 ,14 ,16 and18 , respectively. InFigures 12 ,14 ,16 and18 , the depth or thickness of the glass articles is plotted on the x-axis and stress is plotted on the y-axis. The positive stress values are CT values and the negative stress values are the CS values. - The CT and DOC values as a function of time immersed in the molten salt bath for Examples 4A-1 through 4A-6, Examples 4B-1 through 4B-6, Examples 4C-1 through 4C-6 and 4D-1 through 4D-6, are shown in
Figures 13 ,15 ,17 , and19 , respectively. - Glass substrates having a nominal composition as shown in Table 8 and having a thicknesses of about 0.8 mm each were subjected to chemical strengthening in a molten salt bath including a mixture of NaNO3 and Na2SO4 and a temperature of 500 °C for 15 minutes (Comparative Example 5A) and for 16 hours (Example 5B).
Table 8: Composition of the glass substrate of Example 5, prior to chemical strengthening. Example =► 5 Oxide [mole%] SiO2 69.2 Al2O3 12.6 B2O3 1.8 Li2O 7.7 Na2O 0.4 MgO 2.9 ZnO 1.7 TiO2 3.5 SnO2 0.1 [Li 2 O+Na 2 O+MgO+ZnO+K 2 O][Al2O3+B2O3] 
[TiO 2 +SnO 2 ][SiO2+B2O3] 
- The stress profile of the glass-based articles of Examples 5A and 5B are shown in
Figure 20 . A shown inFigure 20 , Comparative Example 5A exhibited a known stress profile, whereas, Example 5B showed a stress profile according to one or more embodiments of this disclosure. The stored tensile energy of the glass-based articles of Examples 5A and 5B was calculated from the measured SCALP stress profile data and using equation (3) above. The calculated stored tensile energy is plotted as a function of measured CT (MPa), as shown inFigure 21 . - As shown in
Figure 21 ,Comparative 5A exhibited much greater stored tensile energy values for a given CT value than Example 5B (for the same CT value). In this figure, CT is the maximum CT in the sample. Specifically, at a CT of about 55 MPa, Comparative Example 5A exhibited a stored tensile energy of about 12 J/m2, whereas Example 5B exhibited a stored tensile energy of about 9 J/m2. Comparative Example 5A and Example 5B were fractured and Example 5B fractured into fewer pieces than Comparative Example 5A, which fractured into a significantly greater number of pieces. Accordingly, without being bound by theory, it is believed that controlling the stored tensile energy may provide a way to control or predict fragmentation patterns or the number of fragments that result from fracture. In these examples, the CT was varied by keeping a sample in the ion exchange bath for a longer period of time while using the same bath temperature and composition. InFigure 21 , thepoint - Glass substrates having a nominal composition as shown in Table 8 and having a thicknesses of about 1 mm each were subjected to chemical strengthening in a molten salt bath including NaNO3 and a temperature of 430 °C for 4 hours (Comparative Example 5C) and for 61.5 hours (Example 5D). Comparative Example 5C exhibited a known stress profile, whereas, Example 5D showed a stress profile according to one or more embodiments of this disclosure. The stored tensile energy of Examples 5C and 5D was calculated using the same method used with Examples 5A-5B and plotted as a function of measured CT (MPa), as shown in
Figure 22 . - As shown in
Figure 22 ,Comparative 5C exhibited much greater stored tensile energy values for a given CT value (again, as withFigure 21 , these are maximum CT values, and again the values were varied by using the same ion exchange bath temperature and composition, but with longer periods of time) than Example 5D (for the same CT value). Comparative Example 5C and Example 5D were fractured and Example 5D fractured into fewer pieces than Comparative Example 5C, which fractured into a significantly greater number of pieces. - Examples 6A-6D included glass substrates in accordance with one or more embodiments of the disclosure and having about 10 mol% Na2O and 6 mol-% Li2O in the base glass. For example, a nominal composition has about 63.46 mol% SiO2, 15.71 mol% Al2O3, 6.37 mol% Li2O, 10.69 mol% Na2O, 0.06 mol% MgO, 1.15 mol% ZnO, 2.45 mol% P2O5, and 0.04 mol% SnO2. The glass substrates have a thickness of 0.8 mm. The glass substrates of Examples 6A-6D were ion exchanged in a molten salt bath including to the conditions provided in Table 9, in which "SIOX" refers to single ion exchange, and "DIOX" refers to double ion exchange.
- Different trials for stress profiles were implemented in the glass substrates. The glass substrate has a composition containing Na and Li in the base glass. It is possible to exchange more than one ion, such as Na and K primarily for Li, simultaneously. Typically, in glasses that have just one free ion such as Na in its composition, it would take a two-step IOX process with different KNO3/NaNO3 mixtures in order to achieve a profile that has a long tail towards the center of the glass and a spike in its surface.
Table 9: IOX Conditions and Resultant Properties for Example 6 Parameter 6A. 6B. 6C. 6D. 6D. SIOX SIOX SIOX DIOX Step1 DIOX Step2 3.75 h/380 C 3.00 h/390 C 7.50 h/390 C 3.60h/380 C 0.50h/390 C 51%K/49 %Na 80%K/20 %Na 80%K/20 %Na 15%K/85 %Na 95%K/5%Na Power coefficient 2.6 2.0 1.7 - ∼2.2 CS range >465 600-750 570-720 320-400 Traditional FSM 780-950 Knee stress range 127-160 80-110 60-90 - 115-150 DOL spike range 11-12.4 12-15 20-24 9.5-11.2 Traditional FSM 7.3-8.7 - Table 9 also shows parameters and measured values via point-by point method plus prism coupler measurements (FSM instrument) for stress at immediate external surface for different ion exchange recipes. The parameters shown in Table 9 include the power coefficient of the deep region of the profile, the Surface Compressive Stress (CS), the stress at the knee where the spike connects to the deep tail, and the Depth of layer of the spike where the knee occurs. As can be seen from Examples 6A-D, the DOL of the spike can be from about .01•t to about .035•t (for example about .015•t, .02•t, .025•t, .30•t, or .35•t, and any and all subranges therebetween), i.e., from about 7.3 microns to about 24 microns of an 800 micron thick sample. The spike DOL generally corresponds to the potassium DOL. In a Li-containing glass, even a single IOX diffusion creates a spike and a tail in the stress profile. This is thought to be due to the fact that the glass containing different amounts of Li, Na and K is exchanged simultaneously at different diffusion rates. Due to minor local deviations between the actual deep stress profile and the power-law approximation, as well as precision limitations in the point-to-point stress profile measurements, up to 10-15 MPa difference between the actual stress at the bottom of the spike and the knee stress of the model spiked power profile is possible.
-
Figure 23 shows the measured stress profile via point by point refractive index metrology at TE and TM polarizations. It is noted that the stress at the surface is under-represented in the top 5 microns due resolution limitation of the measurement technique. Surface stress values in practice are higher than shown here, and are separately measured by prism-coupling techniques. A more complete range of attributes are shown in Table 9. It is noted that even a single ion exchange (SIOX) diffusion creates a spike and a tail in the stress profile when a Li-containing glass is immersed in a bath having both K and Na. While not wishing to be bound to any particular theory, it is thought that this spike and tail are due to the fact that the glass contains different amounts of Li, Na and K being exchanged simultaneously at different diffusion rates. - Examples of the stress profiles can be observed in
Figure 23 . As can be seen from the Figure, for Example 6A, the spike region is obtained by the nonlinear diffusion of potassium, while the tail of the profile is obtained by the non-linear diffusion of Na and Li. Even for short diffusion times where the Na from the ion exchange bath does not reach the center of the thickness, the tail of the profile in this case would not be described by a complementary error function which is only applicable to substantially linear diffusion. - Again in
Figure 23 one can observe the measured stress profile for a variety of stress profiles tested via point by point refractive index metrology at TE and TM polarizations. Here the stress at the surface is under-represented due to limited resolution of the measurement combined with a high slope of the spike profile. Surface stress values in practice may be higher than shown in in this figure, and are measured separately using analysis of mode spectrum obtained using prism-coupling (FSM-6000). It is noted that a single ion exchange diffusion creates a spike and a tail in the stress profile due to the diffusion of more than one ion simultaneously. -
Figure 24 shows the measured normalized microprobe data for K, Na and Li diffused using the recipe of 51 wt%K/ 49wt%Na at 380 °C for 3.75h (6A) in a glass in accordance with one or more embodiments of the disclosure and having about 10 mol% Na2O and 6 mol-% Li2O in the base glass. As can be seen from the figure, the potassium diffusion is limited to near the glass surface, producing a surface peak in the stress profile. However, the Na profile penetrates very deeply, all the way to the center of the glass. Once the Na concentration in the center starts increasing in a substantial way as a result of the two profiles of in-diffused Na meeting in the center, the shape of the Na profile becomes possible to approximate reasonably well with a power law, and is substantially different from the shape before this condition is met. In addition, the depth of compression becomes stable, changing very little with additional diffusion time. - In
Figure 24 , after ion exchange diffusion using the recipe of 51 wt%K/ 49wt%Na at 380 °C for 3.75h (Example 6A) in a glass originally containing Na and Li only is provided. One can see that the potassium diffuses only in the near-surface region generating the surface peak (spike) in the stress profile. However the Na and Li exchange relatively deeply to the center of the glass, generating a substantially curved stress profile throughout the thickness. The present inventors have obtained a regime of ion exchange where profiles of desired curvature can be obtained, and quantified using a power-law model. -
Figure 25 shows an example of ramped scratch tests for 6A-6D with a diamond tip with 30 micron radius at angle of 76.5 degree in cone angle in a ramp mode from 0 Newtons to 4 Newtons linearly increasing from top to bottom of the figure. - Table 10 below shows the percentage of scratches with cracking as evaluated by an optical microscope for the ramp scratch test as exemplified in
Figure 25 .Table 10: Example 30µm Conospherical Scratch (0-4N ramp) # scratches showing cracks/total # scratches; (% scratches showing cracks) 6A 3/3 (100%) 6B 1/3 (33%) 6C 2/4 (50%) 6D 1/3 (33%) - Tables 11-18 show a ranking of severity of scratches in several test via microscope evaluation.
Table 11: Width (microns) = scratch characterization letter 0-5=A 6-10=B 11-20=C 21-40=D 41-60=E 61-80=F Table 12: Ramped Scratch 20micron tip 76 degrees Score Score 6A Reference Glass 6A Reference Glass Start 5 3 A A 2N 10 9 B B 4N 17 27 C D max width anywhere 28 28 D D Table 13: Ramped Scratch 30microns tip 76 degrees with NO ETC 6A 6B 6C 6D Reference Glass 6A 6B 6C 6D Reference Glass Start 1 1 1 1 1 A A A A A 2N 5 5 5 5 5 A A A A A 4N 12 6 6 9 15 C B B B C max width anywhere 12 8 8 9 17 C B B B C Table 14: Ramped Scratch 30microns tip 76 degrees with ETC 6A 6B 6C 6D Reference Glass 6A 6B 6C 6D Reference Glass Start 1 1 1 1 1 A A A A A 2N 4 4 4 4 5 A A A A A 4N 10 13 8 7 11 B C B B C max width anywhere 12 13 11 9 12 C C C B C Table 15: Ramped Scratch 50micron tip 76 degrees with ETC Score Score 6A Reference Glass 6A Reference Glass Start 6 6 A A 2N 6 6 A A 4N 6 6 A A max width anywhere 6 6 A A Table 16: Ramped Scratch 110 degrees 0-2N with ETC 6A 6B 6C 6D Reference Glass 6A 6B 6C 6D Reference Glass Start 15 16 14 12 16 C C C C C 1N 30 38 26 42 26 D D D E D 2N 53 100 83 36 55 E F F D E max width anywhere 193 193 83 166 55 F F F F E Table 17: Ramped Scratch 136 degree 0-2N with ETC 6A 6B 6C 6D Reference Glass 6A 6B 6C 6D Reference Glass Start 10 26 25 3 10 B D D A B 1N 80 103 86 86 116 F F F F F 2N 93 74 56 226 133 F F E F F max width anywhere 198 123 132 226 200 F F F F F Table 18: Ramped Scratch 150 degree 0-2N with ETC 6A 6B 6C 6D Reference Glass 6A 6B 6C 6D Reference Glass Start 12 12 12 11 11 C C C C C 1N 27 18 23 28 31 D C D D D 2N 27 28 23 30 31 D D D D D max width anywhere 27 28 24 30 31 D D D D D - The different stress profiles present different levels of scratch susceptibility under certain conditions. In
figure 25 , one example is given of a ramped scratch test with a diamond tip having a 30 micron radius and a supporting-cone angle of 76.5 degree. The applied scratch force was ramped linearly over the range from 0 Newtons to 4 Newtons. Here, one can observe that compared to the Example 6A recipe of Table 9, the Example 6B-6D recipes modified to increase the spike CS, provide an improvement in scratch performance observable as narrower and less visible scratch defects. The presented images for each recipe are of 5 severe trials performed for that recipe. Observation of the scratch performance with an optical microscope, revealed some potential trends if one ranks the severity by the width developed in the scratch process. In addition, the percentage of the scratches showing cracking showed some difference, as indicated in Tables 11-18. It is noted that the knee stress is changed along with the surface CS in the modified recipes. Although not wishing to be bound to any particular theory, this example scratch test indicated that the combination of the stress at the surface, the position of the knee, and the stress at knee, and possibly even the exponent of the profile may play a role in certain types of scratch events, and the visibility of scratches. A variety of scratch tests were tried on the profiles shown infigure 23 , and Examples 6B-D modified for higher CS showed on average better performance against scratching when compared to Example 6A. -
Figure 26 shows the drop performance of samples in a 30 grit sandpaper from the different conditions in Examples 6A-D compared to a reference glass having a nominal value of 57.5 mol% SiO2, 16.5 mol% Al2O3, 16.5 mol% Na2O, 2.8 mol% MgO, 6.5 mol% P2O5, and 0.05 mol% SnO2. One can notice that Examples 6A-D have similar performance and have an improvement in drop performance in comparison to the reference glass. In some embodiments, desirable stress profiles are resistant to fracture upon face-drop on a rough surface. InFigure 26 are shown the controlled drop tests of samples on a 30 grit sandpaper from the different conditions in the inventive glass compared to the reference glass which has the most fracture-resistant profile for this test among cover glasses on products that have recently reached the market. One can notice that all the tested profiles with large depth of compression DOC>130 um have similar performance in this test, and have a substantial improvement in drop performance in comparison to the reference glass. That leads us to believe that these nonlinear-diffusion curved profiles with a spike and large DOC can provide a significant improvement in drop performance, and in some cases improved scratch resistance. - Examples 7A, and Comparative Examples 7B-7D included glass substrates in accordance with one or more embodiments of the disclosure, having a thickness of 0.8 mm and having a nominal composition of 64 mol% SiO2, 15 mol% Al2O3, 2.4 mol% B2O3, 9.2 mol% Na2O, 5.9 mol% Li2O, 1.2 mol% ZnO, 2.5 mol%P2O5. 0.05 mol% SnO2, using 3 different mixtures of NaNO3 and KNO3. The glass substrates of Examples 7A-7D were ion exchanged in a molten salt bath(s) including to the conditions provided in Table 19, with the resulting properties also listed in that table.
Table 19: IOX Conditions and Resultant Properties for Example 7 Parameter 7A. 7A 7B. 7C 7D DIOX Step1 DIOX Step2 SIOX SIOX SIOX 4.0h, 380C 40 min, 380C 4.0 h, 380C 3.5 h, 390C 3.6 h, 390C 70%Na/ 30%K 7%Na/ 93%K 70%Na/ 30 %K 40%Na/ 60%K 28%Na/ 72%K Na:K molar ratio 2.28 0.09 2.78 0.79 0.46 Surface CS 400 MPa 800 MPa 400 MPa 550-570 MPa - CS k160 MPa 125 MPa 160 MPa 125 MPa Lower than others DOLsp 9.4 microns 8.7 microns 9.4 microns 8.7 microns Larger than others DOC - 160 microns 160 microns 160 microns About the same as others CT 70 MPa 50-55 MPa 70 MPa - - Curve in Figure 28 - 2804 2801 2802 2803 -
Figure 36 shows 3 stress profiles, namely curves 2801, 2802, and 2803 corresponding to Comparative Examples 7B-D, and measured by RNF (refracted near-field scan). Due to the limited resolution of RNF, the surface CS of the spike is not fully represented (the spike is rounded in the RNF profile and has lower maximum stress than the actual CS). The salt mixtures has 70, 40, and 28 % NaNO3 by weight, the rest of the mass being KNO3, and up to 0.5 wt% silicic acid for eliminating effects of salt contaminants. This corresponds to Na:K molar ratio in the salt of 2.78, 0.79, and 0.46, respectively. All three profiles were obtained using ion-exchange conditions that lead to a regime of stable DOC, and high CT, obtained by about 3.5 hour ion exchange at 390 C (curve 2802), or about 4 hour at 380 C (curves 2801 and 2803). As can be seen from the figure, decreasing the Na:K molar ratio leads to substantial increase in the surface CS of the spike, but this is achieved at the expense of significant loss of stress CSk at the bottom of the spike, and hence significant loss of compressive stress area beyond the spike (depth integral of compressive stress from the surface to the DOC, but especially from bottom of the spike to the DOC). A phone having cover glass with a stress profile like the first SIOX profile (70%NaNO3, curve 2801) inFigure 28 will have good resistance to fracture from deep damage introduction when dropped on a crude surface, but may tend to have failures from overstress of shallow flaws around the edge or on the back side (e.g., when falling on its edge or when hitting against a blunt object) because of the relatively low surface CS. A phone having cover glass with a stress profile having the third stress profile (28%NaNO3, curve 2803) will have better resistance to fracture from significant overstress of shallow flaws, but less resistance to fracture from deep damage introduction from sharp contact. The intermediate profile (40%NaNO3 by weight, curve 2802) will exhibit a compromise between the two main modes of fracture. However, it would be beneficial to have a spike with higher CS than the third profile (28%NaNO3, curve 2803), but at the same time have a similar compression integral over the entire compression zone (e.g., similar to the first profile,curve 2801, 70%NaNO3). It would be further beneficial to increase the compressive stress at depths > 0.3 DOC, and to further increase DOC. Thecurve 2804, produced according to some embodiments disclosed herein, achieves these goals. -
Figure 36 shows a DIOX stress profile according to some embodiments of the present invention curve 2804 (Example 7A), together with three SIOX profiles (curves 2801-2803 of Comparative Examples 7B-7D) for the same 0.8mm-thick Corning Incorporated glass having a nominal composition of 64 mol% SiO2, 15 mol% Al2O3, 2.4 mol% B2O3, 9.2 mol% Na2O, 5.9 mol% Li2O, 1.2 mol% ZnO, 2.5 mol%P2O5. 0.05 mol% SnO2. The DIOX profile was obtained by a first step of ion exchange for 4 hours at 380 C in a salt having 70% NaNO3 and 30%KNO3 by weight (Na:K ratio of 2.78), and a second step of ion exchange for 40 min at 380 C in a salt having 7%NaNO3 and 93%KNO3 by weight (Na:K ratio of about 0.09). As can be seen, the Na:K ratio in the second bath is about 31 times lower than that in the first bath, and the second-bath effective ion exchange time is about 6 times shorter than the first-step ion-exchange time. The first step developed a surface spike due to K enrichment, having a surface CS of about 400 MPa and DOLsp of about 9.4 µm. The second step increased the CS of the spike to about 800 MPa, and also resulted in an effective DOLsp of about 8.7 µm. Note that the apparent reduction in the DOLsp in this particular example is an artifact resulting from a change in the shape of the spike, from mostly linear shape afterstep 1 to a somewhat curved shape with positive curvature afterstep 2. Since the DOLsp in both cases is calculated assuming a linear spike, the DOLsp appears to be somewhat smaller afterstep 2. This mostly means that the high-compression portion of the spike developed duringstep 2 is somewhat shallower than the original depth of the spike afterstep 1. In other examples, particularly with thinner glass (e.g., 0.5mm) where the effective diffusion time of the second step is only 3-5 times shorter than that of the first step, and where the CS change fromstep 1 to step 2 is less pronounced, the effective DOLsp afterstep 2 is similar and often somewhat larger than that of the first-step DOLsp. - Samples were prepared according to Example 7A, and Knoop Scratch Threshold (KST) was measured as described above. The KST was greater than 10 and less than 16.
- Further, an IBoS test was performed on the samples, with a stainless steel ball having a weight of 4.2 grams and a diameter of 10 mm, and 30 grit non-laminated sandpaper. The results of the IBoS test are shown in
Figure 37 . Particularly, the average drop height survived was 76 cm. Sixty percent (3 out of 5) samples survived a drop height of over 80 cm. More specifically, the strengthened glass articles had at least a 60% survival rate when subjected to an IBoS test with a 4.2 g stainless steel ball having a diameter of 10 mm from a height of about 80 cm onto a 30 grit sandpaper positioned above the surface of the glass so there is a 100 µm air gap between the sandpaper and the surface of the glass, wherein the survival rate was based on testing at least 5 samples. - Impact threshold value testing was then conducted with the apparatus as shown in
Figures 29 to 35 , i.e., on both the major surface of the samples, as well as on its edges. The results are shown inFigures 38 for face impact, and inFigure 39 for edge impact. - More specifically, for the face impact test, 180 grit sandpaper was used, and a 110mm x 56 mm x 0.8 mm substrate having a bullnose finished edge was put into a 0.4m bend radius according to
Figure 34 . As can be seen fromFigure 38 , the samples according to Example 7 were able to survive an impact force of over 200N, for example 250N or more, 300N or more, 350N or more, 400N or more, 450N or more, 500N or more, 550N or more, 600N or more, 650N or more, 700N or more, 750N or more, 800N or more, and even 850N or more. In fact, the samples of Example 7A reached the highest impact load of 851 N and did not break. - The results of the samples of Example 7A are compared to another glass labeled "Comparative" in
Figure 38 , but not necessarily Comparative Examples 7B-D. In particular, the Comparative Sample set consists of commercially available alkali aluminosilicate glasses (Dragontrail® Glass, manufactured by Asahi Glass Company) of identical composition (nominal composition about 65 mol% SiO2, about 8 mol% Al2O3, about 12 mol% Na2O, about 4 mol% K2O, about 0.3 mol% CaO, about 10 mol% MgO, and about 0.5 mol% ZrO2) and thickness (0.8 mm). The glasses of the Comparative sample set were ion exchanged so as to have a compressive depth of layer DOL of 24 µm and a surface compressive stress CS of 804 MPa. In contrast, the samples in the Comparative set reached an average impact force of only about 152N, with only three out of 10 (or 30%) of the samples surviving an impact force of over 200N. Accordingly, the strengthened glass according to the present disclosure, and to Example 7 in particular, is well suited to use in a mobile device, wherein drop is likely. - Next, samples according to Example 7A were tested with the configuration of
Figure 35 to evaluate the survival when the glass edge is impacted by sharp contact. The results are shown inFigure 39 . The arrow labeled for the glass of Example 7A highlights the impact force (N) or Impact Energy (J) where the onset of glass fracture was observed, so higher values translate to improved performance. In the case of samples of Example 7A, all samples that were tested survived the 1.28J condition but then all fractured at 1.58J. All samples used to generate this plot were ion exchanged, had 2.5D geometry: having ~0.8mm thickness in center and ~0.3 mm at the edge. Accordingly, according to some embodiments, glass-based articles made according to Example 7A can survive an edge impact force of 400N or more (for example 450N), or an impact energy of 1.28 J or more. - It will be apparent to those skilled in the art that various modifications and variations can be made without departing from the scope of the disclosure.
- For example, the glass-based articles disclosed herein may be incorporated into another article such as an article with a display (or display articles) (e.g., consumer electronics, including mobile phones, tablets, computers, navigation systems, wearable devices (e.g., watches) and the like), architectural articles, transportation articles (e.g., automotive, trains, aircraft, sea craft, etc.), appliance articles, or any article that would benefit from some transparency, scratch-resistance, abrasion resistance or a combination thereof. An exemplary article incorporating any of the glass-based articles disclosed herein is shown in
FIGS. 40A and 40B . Specifically,FIGS. 40A and 40B show a consumerelectronic device 4100 including ahousing 4102 havingfront 4104, back 4106, andside surfaces 4108; electrical components (not shown) that are at least partially inside or entirely within the housing and including at least a controller, a memory, and adisplay 4110 at or adjacent to the front surface of the housing; and acover substrate 4112 at or over the front surface of the housing such that it is over the display. In some embodiments, thecover substrate 4112 may include any of the glass-based articles disclosed herein. In some embodiments, at least one of a portion of the housing or the cover glass comprises the glass-based articles disclosed herein.
Claims (14)
- A glass-based article comprising:a first surface and a second surface opposing the first surface defining a thickness (t) in a range of 0.1 mm and 2 mm; anda stress profile extending along the thickness (t),wherein at least one point of the stress profile in a first thickness range from 0•t up to 0.020•t and greater than 0.98•t comprises a tangent with a slope of from -200 MPa/micrometer to -25 MPa/micrometer or 25 MPa/micrometer to 200 MPa/micrometer,wherein all points of the stress profile in a second thickness range from 0.035•t and less than 0.965•t comprise a tangent with a slope of from -15 MPa/micrometer to 15 MPa/micrometer,wherein the stress profile comprises a surface CS of from 200 MPa to 1100 MPa, andwherein the stress profile comprises a DOC ranging from 0.1•t to 0.25•tcharacterised in that the stress profile in the second thickness range forms a power-law profile having a power exponent, and in that the power exponent is between 1.2 to 3.2.
- The glass-based article of claim 1, wherein the first thickness range further comprises the thicknesses from 0.02•t up to 0.025•t and from 0.975•t to 0.98•t, and at least one point of the stress profile in the extended first thickness range comprises a tangent with a slope of from -200 MPa/micrometer to -25 MPa/micrometer or 25 MPa/micrometer to 200 MPa/micrometer.
- The glass-based article of claim 2, wherein the first thickness range further comprises the thicknesses from 0.025•t up to 0.035•t and from 0.965•t up to 0.975•t, and at least one point of the stress profile in the further extension of the first thickness range comprises a tangent with a slope of from -200 MPa/micrometer to -25 MPa/micrometer or 25 MPa/micrometer to 200 MPa/micrometer.
- A glass-based article comprising:a center plane, wherein the center plane comprises from 2 to 20 mol-% Li2O; anda stress profile extending along the thickness (t),wherein at least one point of the stress profile in a first thickness range from 0•t up to 0.020•t and greater than 0.98•t comprises a tangent with a slope of from -200 MPa/micrometer to -25 MPa/micrometer or 25 MPa/micrometer to 200 MPa/micrometer,wherein the stress profile comprises a surface CS of from 200 MPa to 1100 MPa, andwherein the stress profile comprises a DOC ranging from 0.05•t to 0.25•t; characterised in that the stress profile in the second thickness range forms a power-law profile having a power exponent, and in that the power exponent is between 1.2 to 3.4,and optionally further comprising a first surface and a second surface opposing the first surface defining a thickness (t) in a range of 0.1 mm and 2 mm.
- The glass-based article of claim 4,wherein the center-plane further comprises a composition comprising from 0.5 mol% to 20 mol% Na2O;wherein the center-plane further comprises a composition comprising from 2 mol% to 10 mol% Li2O;wherein all points of the stress profile between a thickness from 0•t to 0.3•t and from greater than 0.7•t, comprise a tangent that is less than -0.1 MPa/micrometer, or that is greater than 0.1 MPa/micrometer;wherein the article further comprises a potassium DOL that extends over the first thickness range; and/orwherein the surface CS ranges from 690 MPa and 950 MPa.
- The glass-based article of any one of claims 1-5, wherein wherein the Knoop Scratch Threshold of the strengthened glass-based substrate is greater than 10N and is less than 16N.
- The glass-based article of any one of claims 1-6, wherein the strengthened glass-based substrate comprises at least one of:(i) a survival rate of from 40% to 100%, when impacted on one of the first and second major surfaces with a force of 400N or more according to the surface Impact Threshold Test with 180 grit abrasive; and(ii) can survive an edge-impact of from more than 300N to less than 500N, or an edge-impact of from more than 0.68J to less than 1.58J according to the edge Impact Threshold Test with 30 grit abrasive.
- The glass-based article of any one of claims 1-7, further comprising a concentration of metal oxide that decreases from the first surface to a value at a point between the first surface and the second surface and increases from the value to the second surface.
- A consumer electronic product, comprising:a housing having a front surface, a back surface and side surfaces;electrical components provided at least partially within the housing, the electrical components including at least a controller, a memory, and a display, the display being provided at or adjacent the front surface of the housing; anda cover substrate disposed over the display,wherein at least one of a portion of the housing or the cover substrate comprises the glass-based article of any one of claims 1-8.
- A method of chemically strengthening a glass-based substrate comprising a first major surface, a second major surface, an average thickness t extending perpendicularly between the first and second major surfaces, and an edge extending between the first and second major surfaces, the method comprising:performing a first IOX step by holding the glass-based substrate for a first period of time in a first bath comprising a mixture of sodium and potassium ions;performing a second IOX step, after the first IOX step, by holding the glass-based substrate for a second period of time in a second bath comprising a mixture of sodium and potassium ions to form a stress profile in the glass-based substrate, the stress profile having a CS region and a CT region,wherein the stress profile in the CT region comprises a power-law profile having a power exponent, wherein the power exponent is from 1.2 to 3.4, andthe second bath has a molar ratio of Na: K that is 3-10 times smaller than the Na:K molar ratio of the first bath.
- The method of claim 10, the second bath has a molar ratio of Na to K that is from 0.03 to 0.4.
- The method of any one of claims 10-11, an effective diffusion time of the second IOX step is from 1/20 to ½ that of the first step.
- The method of any one of claims 10-12, wherein a surface CS of the glass-based article after the second IOX step is 600 MPa or more.
- The method of any one of claims 10-13, a DOLsp is: (i) from 0.5 to 1.5% of the thickness when the thickness is from 1 to 1.3mm; (ii) from 0.6 to 2% of thickness when the thickness is from 0.8 to 1mm; (iii) from 0.7 to 2.5% of the thickness when the thickness is from 0.65 to 0.8mm; (iv) from 0.9 to 3% of the thickness when the thickness is from 0.5 to 0.65mm; and (v) from 1 to 3% when the thickness is from 0.3 to 0.5mm.
Priority Applications (1)
| Application Number | Priority Date | Filing Date | Title |
|---|---|---|---|
| EP23195051.0A EP4269368A3 (en) | 2016-04-08 | 2017-04-07 | Glass-based articles including a stress profile comprising two regions, and methods of making |
Applications Claiming Priority (2)
| Application Number | Priority Date | Filing Date | Title |
|---|---|---|---|
| US201662320109P | 2016-04-08 | 2016-04-08 | |
| PCT/US2017/026554 WO2017177109A1 (en) | 2016-04-08 | 2017-04-07 | Glass-based articles including a stress profile comprising two regions, and methods of making |
Related Child Applications (2)
| Application Number | Title | Priority Date | Filing Date |
|---|---|---|---|
| EP23195051.0A Division-Into EP4269368A3 (en) | 2016-04-08 | 2017-04-07 | Glass-based articles including a stress profile comprising two regions, and methods of making |
| EP23195051.0A Division EP4269368A3 (en) | 2016-04-08 | 2017-04-07 | Glass-based articles including a stress profile comprising two regions, and methods of making |
Publications (2)
| Publication Number | Publication Date |
|---|---|
| EP3397597A1 EP3397597A1 (en) | 2018-11-07 |
| EP3397597B1 true EP3397597B1 (en) | 2023-11-08 |
Family
ID=58645394
Family Applications (2)
| Application Number | Title | Priority Date | Filing Date |
|---|---|---|---|
| EP17720633.1A Active EP3397597B1 (en) | 2016-04-08 | 2017-04-07 | Glass-based articles including a stress profile comprising two regions, and methods of making |
| EP23195051.0A Pending EP4269368A3 (en) | 2016-04-08 | 2017-04-07 | Glass-based articles including a stress profile comprising two regions, and methods of making |
Family Applications After (1)
| Application Number | Title | Priority Date | Filing Date |
|---|---|---|---|
| EP23195051.0A Pending EP4269368A3 (en) | 2016-04-08 | 2017-04-07 | Glass-based articles including a stress profile comprising two regions, and methods of making |
Country Status (8)
| Country | Link |
|---|---|
| US (3) | US10271442B2 (en) |
| EP (2) | EP3397597B1 (en) |
| JP (3) | JP6902042B2 (en) |
| KR (4) | KR20210122313A (en) |
| CN (4) | CN117623643A (en) |
| DE (1) | DE202017007024U1 (en) |
| TW (3) | TWI666190B (en) |
| WO (1) | WO2017177109A1 (en) |
Families Citing this family (60)
| Publication number | Priority date | Publication date | Assignee | Title |
|---|---|---|---|---|
| US9359251B2 (en) | 2012-02-29 | 2016-06-07 | Corning Incorporated | Ion exchanged glasses via non-error function compressive stress profiles |
| US11079309B2 (en) | 2013-07-26 | 2021-08-03 | Corning Incorporated | Strengthened glass articles having improved survivability |
| US9517968B2 (en) | 2014-02-24 | 2016-12-13 | Corning Incorporated | Strengthened glass with deep depth of compression |
| TWI705889B (en) | 2014-06-19 | 2020-10-01 | 美商康寧公司 | Glasses having non-frangible stress profiles |
| DE202015009997U1 (en) | 2014-10-08 | 2022-11-09 | Corning Incorporated | Glasses and glass-ceramics with a metal oxide concentration gradient |
| US10150698B2 (en) | 2014-10-31 | 2018-12-11 | Corning Incorporated | Strengthened glass with ultra deep depth of compression |
| EP3215471B1 (en) | 2014-11-04 | 2021-12-15 | Corning Incorporated | Deep non-frangible stress profiles and methods of making |
| US11613103B2 (en) | 2015-07-21 | 2023-03-28 | Corning Incorporated | Glass articles exhibiting improved fracture performance |
| US10579106B2 (en) | 2015-07-21 | 2020-03-03 | Corning Incorporated | Glass articles exhibiting improved fracture performance |
| DE102016101090A1 (en) | 2015-11-26 | 2017-06-01 | Schott Ag | Thermally toughened glass element and its uses |
| WO2017100399A1 (en) | 2015-12-08 | 2017-06-15 | Corning Incorporated | S-shaped stress profiles and methods of making |
| EP3386930B1 (en) | 2015-12-11 | 2021-06-16 | Corning Incorporated | Fusion-formable glass-based articles including a metal oxide concentration gradient |
| JP6536697B2 (en) | 2016-01-21 | 2019-07-03 | Agc株式会社 | Chemical tempered glass |
| DE202017007024U1 (en) * | 2016-04-08 | 2019-03-25 | Corning Incorporated | Glass-based articles including a stress profile covering two areas |
| WO2017177114A1 (en) | 2016-04-08 | 2017-10-12 | Corning Incorporated | Glass-based articles including a metal oxide concentration gradient |
| KR102515600B1 (en) * | 2016-11-07 | 2023-03-29 | 코닝 인코포레이티드 | lithium-containing glass |
| US11111173B2 (en) | 2016-11-07 | 2021-09-07 | Corning Incorporated | Lithium containing glasses |
| CN114835391B (en) * | 2017-04-06 | 2023-11-07 | Agc株式会社 | chemically strengthened glass |
| JP6897270B2 (en) * | 2017-04-20 | 2021-06-30 | Agc株式会社 | Chemically tempered glass |
| CN107226614A (en) * | 2017-05-16 | 2017-10-03 | 东旭科技集团有限公司 | A kind of glass composition and glass and its preparation method and application |
| CN116282907A (en) * | 2017-06-28 | 2023-06-23 | Agc株式会社 | Chemically strengthened glass, method for producing same, and glass for chemical strengthening |
| CN109724727B (en) * | 2017-10-31 | 2021-01-19 | 中国航发商用航空发动机有限责任公司 | Method and device for measuring residual stress of curved surface blade of gas turbine |
| US10633279B2 (en) | 2017-11-29 | 2020-04-28 | Corning Incorporated | Glasses with low excess modifier content |
| US10906834B2 (en) * | 2017-11-29 | 2021-02-02 | Corning Incorporated | Ion-exchangeable mixed alkali aluminosilicate glasses |
| US11214515B2 (en) | 2017-11-30 | 2022-01-04 | Corning Incorporated | Glass-based articles having stress profiles with high stored energy and methods of manufacture |
| US11161782B2 (en) * | 2017-11-30 | 2021-11-02 | Corning Incorporated | Method of increasing IOX processability on glass articles with multiple thicknesses |
| JP2019123658A (en) * | 2018-01-19 | 2019-07-25 | Agc株式会社 | Manufacturing method of chemically reinforced glass, and chemically reinforced glass |
| EP3743394B1 (en) * | 2018-01-24 | 2021-12-15 | Corning Incorporated | Glass-based articles having high stress magnitude at depth |
| WO2019191358A1 (en) * | 2018-03-29 | 2019-10-03 | Corning Incorporated | Ion exchanged glass-ceramic articles |
| KR20210016540A (en) * | 2018-05-31 | 2021-02-16 | 코닝 인코포레이티드 | Glass with improved drop performance |
| WO2019236975A2 (en) * | 2018-06-08 | 2019-12-12 | Corning Incorporated | Fracture resistant stress profiles in glasses |
| TWI825112B (en) * | 2018-07-02 | 2023-12-11 | 美商康寧公司 | Glass-based articles with improved stress profiles and methods of manufacturing the same |
| CN108585480B (en) * | 2018-07-10 | 2021-05-04 | 科立视材料科技有限公司 | Two-step chemically strengthened alkali aluminosilicate glass composition and preparation method thereof |
| CN112566878B (en) * | 2018-07-23 | 2022-10-18 | 康宁公司 | Automotive interiors and cover glazings having improved head impact performance and visibility after breakage |
| WO2020041057A1 (en) * | 2018-08-20 | 2020-02-27 | Corning Incorporated | Glass-ceramic articles with improved stress profiles |
| CN112789253A (en) * | 2018-09-28 | 2021-05-11 | 康宁股份有限公司 | Glass-based articles with improved stress distribution |
| DE102018124785A1 (en) * | 2018-10-08 | 2020-04-09 | Schott Ag | Glass with preferably increased storable tensile stress, chemically toughened glass article with preferably increased storable tensile stress, process for its production and its use |
| JP7367691B2 (en) * | 2018-10-09 | 2023-10-24 | 日本電気硝子株式会社 | Tempered glass and tempered glass manufacturing method |
| US20200148590A1 (en) * | 2018-11-14 | 2020-05-14 | Corning Incorporated | Glass substrates with improved compositions |
| US20220002186A1 (en) * | 2018-11-30 | 2022-01-06 | Corning Incorporated | Glass articles exhibiting high compressive stress, automotive interior systems that include such glass articles and methods for making the same |
| CN116217093A (en) * | 2018-12-11 | 2023-06-06 | Agc株式会社 | Chemically strengthened glass plate, cover glass comprising chemically strengthened glass, and electronic device |
| TW202043168A (en) | 2019-03-29 | 2020-12-01 | 美商康寧公司 | Scratch resistant glass and method of making |
| WO2021003212A1 (en) * | 2019-07-02 | 2021-01-07 | Corning Incorporated | Glass-based articles with stress profiles having regions of enhanced stress |
| KR20220029669A (en) * | 2019-07-02 | 2022-03-08 | 코닝 인코포레이티드 | Glass-Based Articles with Improved Stress Profile |
| DE102019121146A1 (en) | 2019-08-05 | 2021-02-11 | Schott Ag | Heat-formed chemically toughenable glass article with a low crystal content, in particular disk-shaped chemically toughened glass article, as well as method and device for its production |
| WO2021023757A1 (en) | 2019-08-05 | 2021-02-11 | Schott Ag | Sheet-like, chemically toughened, or chemically toughenable glass article, and method for producing same |
| DE102019121147A1 (en) | 2019-08-05 | 2021-02-11 | Schott Ag | Disc-shaped, chemically toughened glass articles and process for their manufacture |
| CN114401931A (en) * | 2019-09-13 | 2022-04-26 | 康宁股份有限公司 | Fracture-resistant glass-based articles |
| US11584681B2 (en) * | 2019-11-26 | 2023-02-21 | Corning Incorporated | Ion exchangeable alkali aluminosilicate glass compositions having improved mechanical durability |
| WO2021108138A1 (en) * | 2019-11-27 | 2021-06-03 | Corning Incorporated | Glass-based articles with fracture resistant stress profiles |
| KR20210077057A (en) * | 2019-12-16 | 2021-06-25 | 삼성디스플레이 주식회사 | Glass article and display device including the same |
| KR20210080654A (en) * | 2019-12-20 | 2021-07-01 | 삼성디스플레이 주식회사 | Glass article and display device including the same |
| KR20210081478A (en) * | 2019-12-23 | 2021-07-02 | 삼성디스플레이 주식회사 | Glass article and method for fabricating the same |
| MX2022011491A (en) * | 2020-03-17 | 2023-01-05 | Corning Inc | Salt bath compositions, salt bath systems, and processes for strengthening glass articles. |
| KR20210127268A (en) | 2020-04-13 | 2021-10-22 | 삼성디스플레이 주식회사 | Glass article and display device including the same |
| EP3909923A1 (en) * | 2020-05-15 | 2021-11-17 | Corning Incorporated | Strengthened glass articles and methods of forming the same |
| CN111890522B (en) * | 2020-07-24 | 2022-04-05 | 中国科学院上海光学精密机械研究所 | Method for processing spherical cover optical element |
| CN116420224A (en) | 2020-11-08 | 2023-07-11 | 肖特股份有限公司 | Air-tight connection device, housing and method for producing the same |
| DE202021103861U1 (en) | 2021-07-20 | 2021-10-04 | Schott Ag | Disc-shaped, chemically toughened or chemically toughened glass articles |
| JP2023044095A (en) | 2021-09-17 | 2023-03-30 | 三菱電機株式会社 | Bidirectional switch circuit and power converter |
Family Cites Families (384)
| Publication number | Priority date | Publication date | Assignee | Title |
|---|---|---|---|---|
| US1960121A (en) | 1930-02-10 | 1934-05-22 | American Optical Corp | Glass treatment |
| NL85259C (en) | 1951-04-21 | |||
| BE638146A (en) | 1962-10-04 | |||
| US3357876A (en) * | 1965-01-19 | 1967-12-12 | Pittsburgh Plate Glass Co | Method of strengthening a glass article by ion exchange |
| GB1026770A (en) | 1963-09-09 | 1966-04-20 | Corning Glass Works | Glass article and method of treatment |
| NL6410825A (en) | 1963-11-21 | 1965-05-24 | ||
| NL135450C (en) | 1964-01-31 | 1900-01-01 | ||
| US3380818A (en) * | 1964-03-18 | 1968-04-30 | Owens Illinois Inc | Glass composition and method and product |
| NL132488C (en) | 1964-05-05 | |||
| US3404015A (en) * | 1965-04-28 | 1968-10-01 | Corning Glass Works | Low thermal expansion glasses |
| US3433611A (en) * | 1965-09-09 | 1969-03-18 | Ppg Industries Inc | Strengthening glass by multiple alkali ion exchange |
| AU6452265A (en) | 1965-09-27 | 1965-10-21 | Ppg Industries Inc | Glass articles having compressive stress |
| US3490984A (en) * | 1965-12-30 | 1970-01-20 | Owens Illinois Inc | Art of producing high-strength surface-crystallized,glass bodies |
| US3844754A (en) | 1966-02-23 | 1974-10-29 | Owens Illinois Inc | Process of ion exchange of glass |
| DE1771149A1 (en) * | 1967-04-13 | 1972-03-30 | Owens Illinois Glass Co | Highly heat-resistant glasses with low thermal expansion and ceramics made from them |
| US3489097A (en) | 1968-05-08 | 1970-01-13 | William Gemeinhardt | Flexible tube pump |
| US3656923A (en) * | 1968-05-27 | 1972-04-18 | Corning Glass Works | Method for strengthening photochromic glass articles |
| US3597305A (en) | 1968-06-06 | 1971-08-03 | Corning Glass Works | Subsurface fortified glass or glass-ceramic laminates |
| GB1266257A (en) | 1969-03-27 | 1972-03-08 | ||
| GB1275653A (en) * | 1969-08-15 | 1972-05-24 | Glaverbel | Articles of chemically tempered glass |
| US3660060A (en) * | 1969-12-11 | 1972-05-02 | Owens Illinois Inc | Process of making glass lasers of increased heat dissipation capability |
| US3737294A (en) | 1970-08-28 | 1973-06-05 | Corning Glass Works | Method for making multi-layer laminated bodies |
| US3673049A (en) | 1970-10-07 | 1972-06-27 | Corning Glass Works | Glass laminated bodies comprising a tensilely stressed core and a compressively stressed surface layer fused thereto |
| JPS474192U (en) | 1971-01-27 | 1972-09-08 | ||
| FR2128031B1 (en) | 1971-03-01 | 1976-03-19 | Saint Gobain Pont A Mousson | |
| US3746526A (en) | 1971-03-10 | 1973-07-17 | Corning Glass Works | Method for forming subsurface fortified laminates |
| JPS5417765B1 (en) | 1971-04-26 | 1979-07-03 | ||
| US3931438A (en) | 1971-11-08 | 1976-01-06 | Corning Glass Works | Differential densification strengthening of glass-ceramics |
| US3765855A (en) | 1971-12-30 | 1973-10-16 | Us Navy | Electro-ionic method of strengthening glass |
| US4192688A (en) | 1972-07-07 | 1980-03-11 | Owens-Illinois, Inc. | Product and process for forming same |
| US3833388A (en) | 1972-07-26 | 1974-09-03 | Ppg Industries Inc | Method of manufacturing sheet and float glass at high production rates |
| US3811855A (en) | 1972-10-10 | 1974-05-21 | Rca Corp | Method of treating a glass body to provide an ion-depleted region therein |
| DE2263234C3 (en) | 1972-12-23 | 1975-07-10 | Jenaer Glaswerk Schott & Gen., 6500 Mainz | Process for the production of high-strength glass objects which are resistant to temperature changes by surface crystallization using ion exchange within the glass |
| US3879183A (en) | 1973-08-15 | 1975-04-22 | Rca Corp | Corona discharge method of depleting mobile ions from a glass region |
| US3936287A (en) | 1974-01-28 | 1976-02-03 | The United States Of America As Represented By The United States Energy Research And Development Administration | Method for making glass-ceramic articles exhibiting high frangibility |
| US3958052A (en) | 1974-06-12 | 1976-05-18 | Corning Glass Works | Subsurface-fortified glass laminates |
| US4018965A (en) | 1975-04-14 | 1977-04-19 | Corning Glass Works | Photochromic sheet glass compositions and articles |
| US4053679A (en) | 1975-08-15 | 1977-10-11 | Ppg Industries, Inc. | Chemically strengthened opal glass |
| US4055703A (en) | 1975-08-15 | 1977-10-25 | Ppg Industries, Inc. | Ion exchange strengthened glass containing P2 O5 |
| US4042405A (en) | 1976-03-18 | 1977-08-16 | American Optical Corporation | High strength ophthalmic lens |
| US4102664A (en) | 1977-05-18 | 1978-07-25 | Corning Glass Works | Method for making glass articles with defect-free surfaces |
| JPS5483923A (en) * | 1977-12-16 | 1979-07-04 | Asahi Glass Co Ltd | Ion exchange strengthening of glass |
| NL7800157A (en) | 1978-01-06 | 1979-07-10 | Philips Nv | PROCESS FOR THE MANUFACTURE OF OPTICAL FIBERS FOR TELECOMMUNICATIONS. |
| US4190451A (en) | 1978-03-17 | 1980-02-26 | Corning Glass Works | Photochromic glass |
| US4130437A (en) | 1978-04-12 | 1978-12-19 | Corning Glass Works | Photochromic glasses suitable for simultaneous heat treatment and shaping |
| US4156755A (en) | 1978-04-19 | 1979-05-29 | Ppg Industries, Inc. | Lithium containing ion exchange strengthened glass |
| US4214886A (en) | 1979-04-05 | 1980-07-29 | Corning Glass Works | Forming laminated sheet glass |
| US4240836A (en) | 1979-11-19 | 1980-12-23 | Corning Glass Works | Colored photochromic glasses and method |
| US4358542A (en) | 1981-04-08 | 1982-11-09 | Corning Glass Works | Photochromic glass suitable for microsheet and simultaneous heat treatment and shaping |
| FR2515635B1 (en) | 1981-10-29 | 1986-03-14 | Ceraver | METHOD FOR MANUFACTURING A TEMPERED GLASS DIELECTRIC FOR ELECTRICAL INSULATOR AND INSULATOR THEREFROM |
| US4537612A (en) | 1982-04-01 | 1985-08-27 | Corning Glass Works | Colored photochromic glasses and method |
| US4407966A (en) | 1982-09-16 | 1983-10-04 | Corning Glass Works | Very fast fading photochromic glass |
| US4468534A (en) | 1982-09-30 | 1984-08-28 | Boddicker Franc W | Method and device for cutting glass |
| DE3327072C2 (en) | 1983-07-27 | 1985-10-10 | Schott Glaswerke, 6500 Mainz | Thermally highly resilient tungsten sealing glasses in the system of alkaline earth aluminosilicate glasses |
| US4483700A (en) | 1983-08-15 | 1984-11-20 | Corning Glass Works | Chemical strengthening method |
| FR2563365B1 (en) | 1984-04-20 | 1986-12-05 | Ceraver | GLASS DIELECTRIC FOR ELECTRICAL INSULATOR |
| US4702042A (en) | 1984-09-27 | 1987-10-27 | Libbey-Owens-Ford Co. | Cutting strengthened glass |
| US4726981A (en) | 1985-06-10 | 1988-02-23 | Corning Glass Works | Strengthened glass articles and method for making |
| US4608349A (en) | 1985-11-12 | 1986-08-26 | Corning Glass Works | Photochromic glass compositions for lightweight lenses |
| JPH0676224B2 (en) | 1986-02-13 | 1994-09-28 | 旭硝子株式会社 | Tempered glass manufacturing method |
| US4736981A (en) | 1987-06-09 | 1988-04-12 | Chrysler Motors Corporation | Applique structure for the external B pillar areas of a four door vehicle |
| CS260146B1 (en) * | 1987-06-24 | 1988-12-15 | Jurij Starcev | Method of glass products' thermal treatment inteded for hardening by means of ion exchange |
| US4857485A (en) * | 1987-10-14 | 1989-08-15 | United Technologies Corporation | Oxidation resistant fiber reinforced composite article |
| JPH0686310B2 (en) | 1989-04-28 | 1994-11-02 | セントラル硝子株式会社 | Transparent non-expandable crystallized glass |
| US5273827A (en) | 1992-01-21 | 1993-12-28 | Corning Incorporated | Composite article and method |
| US5559060A (en) | 1992-05-22 | 1996-09-24 | Corning Incorporated | Glass for laminated glass articles |
| US5270269A (en) | 1992-06-08 | 1993-12-14 | Corning Incorporated | Lead-free fine crystal glassware |
| US5281562A (en) * | 1992-07-21 | 1994-01-25 | Corning Incorporated | Ultraviolet absorbing glasses |
| US5350607A (en) | 1992-10-02 | 1994-09-27 | United Technologies Corporation | Ionized cluster beam deposition of sapphire |
| FR2697242B1 (en) | 1992-10-22 | 1994-12-16 | Saint Gobain Vitrage Int | Chemical toughened glazing. |
| FR2704852B1 (en) * | 1993-05-06 | 1995-07-07 | Saint Gobain Vitrage Int | Method for reinforcing glass objects. |
| US5342426A (en) | 1993-07-16 | 1994-08-30 | Corning Incorporated | Making glass sheet with defect-free surfaces and alkali metal-free soluble glasses therefor |
| DE4325656C2 (en) | 1993-07-30 | 1996-08-29 | Schott Glaswerke | Use of a glass body for producing a tempered glass body suitable as a fire protection safety glass on a conventional air pretensioning system |
| JP3388453B2 (en) | 1994-03-25 | 2003-03-24 | Hoya株式会社 | Glass for support of X-ray mask or X-ray mask material, X-ray mask material and X-ray mask |
| DE4432235A1 (en) | 1994-09-10 | 1996-03-14 | Bayerische Motoren Werke Ag | Scratch-resistant coating on a thermally resistant substrate and process for its production |
| DE19616633C1 (en) | 1996-04-26 | 1997-05-07 | Schott Glaswerke | Chemically toughenable alumino-silicate glass |
| US6187441B1 (en) | 1996-12-26 | 2001-02-13 | Hoya Corporation | Glass substrate for information recording medium and magnetic recording medium having the substrate |
| US5972460A (en) | 1996-12-26 | 1999-10-26 | Hoya Corporation | Information recording medium |
| CH691008A5 (en) | 1997-01-15 | 2001-03-30 | Rado Montres Sa | scratchproof watch crystal, transparent and watch case equipped with such a drink. |
| JP3384286B2 (en) | 1997-06-20 | 2003-03-10 | 日本板硝子株式会社 | Glass substrate for magnetic recording media |
| FR2766816B1 (en) | 1997-08-01 | 1999-08-27 | Eurokera | VITROCERAMIC PLATE AND MANUFACTURING METHOD THEREOF |
| GB2335423A (en) | 1998-03-20 | 1999-09-22 | Pilkington Plc | Chemically toughenable glass |
| JPH11328601A (en) * | 1998-05-12 | 1999-11-30 | Asahi Techno Glass Corp | Glass board for recording medium, recording medium using glass board and manufacture of glass board for recording medium |
| US6333286B1 (en) | 1998-09-11 | 2001-12-25 | Nippon Sheet Glass Co., Ltd. | Glass composition and substrate for information recording media comprising the same |
| JP4497591B2 (en) | 1998-09-11 | 2010-07-07 | Hoya株式会社 | Glass composition, substrate for information recording medium and information recording medium using the same |
| WO2000047529A1 (en) | 1999-02-12 | 2000-08-17 | The Pennsylvania State University | Strengthening, crack arrest and multiple cracking in brittle materials using residual stresses |
| DE19917921C1 (en) | 1999-04-20 | 2000-06-29 | Schott Glas | High specific elasticity moduli aluminosilicate glasses or glass-ceramics, for hard disk substrates, contain boron, alkali and alkaline earth metal, magnesium, phosphorus and titanium oxides |
| JP2006228431A (en) | 1999-05-13 | 2006-08-31 | Nippon Sheet Glass Co Ltd | Glass substrate for magnetic disk, manufacturing method of glass substrate for magnetic disk, and magnetic disk |
| US6440531B1 (en) | 1999-05-13 | 2002-08-27 | Nippon Sheet Glass Co., Ltd | Hydrofluoric acid etched substrate for information recording medium |
| FR2796637B1 (en) * | 1999-07-21 | 2002-06-07 | Corning Inc | BOROSILICATE OR ALUMINOSILICATE GLASS FOR OPTICAL AMPLIFICATION |
| JP3762157B2 (en) | 1999-09-02 | 2006-04-05 | 旭テクノグラス株式会社 | Anodic bonding glass |
| JP2001076336A (en) | 1999-09-08 | 2001-03-23 | Hoya Corp | Glass substrate for information recording medium and information recording medium using the same |
| US6514149B2 (en) | 2000-01-07 | 2003-02-04 | Young W. Yoon | Multiloop golf net assembly |
| SG99350A1 (en) | 2000-02-17 | 2003-10-27 | Hoya Corp | Glass for cathode-ray tube, strengthened glass, method for the production thereof and use thereof |
| JP2001342036A (en) | 2000-03-31 | 2001-12-11 | Ngk Insulators Ltd | Glass material, crystallized glass product and method of manufacturing crystallized glass material |
| DE10017701C2 (en) | 2000-04-08 | 2002-03-07 | Schott Glas | Floated flat glass |
| JP4644347B2 (en) | 2000-10-06 | 2011-03-02 | 株式会社アルバック | Method for forming graphite nanofiber thin film by thermal CVD |
| US6472068B1 (en) | 2000-10-26 | 2002-10-29 | Sandia Corporation | Glass rupture disk |
| JP4512786B2 (en) | 2000-11-17 | 2010-07-28 | 独立行政法人産業技術総合研究所 | Glass substrate processing method |
| JP2002174810A (en) | 2000-12-08 | 2002-06-21 | Hoya Corp | Glass substrate for display, manufacturing method for the same and display using the same |
| JP3995902B2 (en) | 2001-05-31 | 2007-10-24 | Hoya株式会社 | Glass substrate for information recording medium and magnetic information recording medium using the same |
| ITTO20010673A1 (en) | 2001-07-10 | 2003-01-10 | Uni Di Trento Dipartiment O Di | GLASS WITH FUNCTIONALITY OF FRACTURE SENSOR, STRESS AND DEFORMATION AND RELATED METHOD OF REALIZATION. |
| DE10150884A1 (en) | 2001-10-16 | 2003-05-08 | Schott Glas | Alkali borosilicate glass used in the production of flat glass comprises oxides of silicon, boron, aluminum, sodium and potassium, and optionally calcium |
| JP3897170B2 (en) | 2002-01-21 | 2007-03-22 | 日本板硝子株式会社 | Infrared emitter and optical amplification medium |
| FR2839508B1 (en) | 2002-05-07 | 2005-03-04 | Saint Gobain | GLAZING CUTTING WITHOUT RIPPING |
| DE10228381A1 (en) | 2002-06-25 | 2004-01-22 | Degudent Gmbh | Opalescent glass ceramic |
| JP2004099370A (en) | 2002-09-10 | 2004-04-02 | Nippon Electric Glass Co Ltd | Fire prevention glass |
| WO2004058656A1 (en) * | 2002-12-25 | 2004-07-15 | Nippon Sheet Glass Company, Limited | Glass composition fluorescent in infrared wavelength region |
| US7176528B2 (en) | 2003-02-18 | 2007-02-13 | Corning Incorporated | Glass-based SOI structures |
| JP2004259402A (en) | 2003-02-27 | 2004-09-16 | Hoya Corp | Manufacturing method of glass substrate for magnetic disk and manufacturing method of magnetic disk |
| US7091141B2 (en) | 2003-04-01 | 2006-08-15 | Corning Incorporated | Lamp reflector substrate, glass, glass-ceramic materials and process for making the same |
| US7514149B2 (en) | 2003-04-04 | 2009-04-07 | Corning Incorporated | High-strength laminated sheet for optical applications |
| JP2004343008A (en) | 2003-05-19 | 2004-12-02 | Disco Abrasive Syst Ltd | Workpiece dividing method utilizing laser beam |
| JP4535692B2 (en) | 2003-05-28 | 2010-09-01 | セントラル硝子株式会社 | Chemically tempered glass |
| JP4081416B2 (en) | 2003-08-18 | 2008-04-23 | 株式会社日立製作所 | REFLECTOR, PROJECTION TYPE DISPLAY DEVICE, AND LIGHT PROJECTION DEVICE |
| US7727917B2 (en) | 2003-10-24 | 2010-06-01 | Schott Ag | Lithia-alumina-silica containing glass compositions and glasses suitable for chemical tempering and articles made using the chemically tempered glass |
| JP4378152B2 (en) | 2003-11-07 | 2009-12-02 | 岡本硝子株式会社 | Heat resistant glass |
| WO2005047647A1 (en) | 2003-11-10 | 2005-05-26 | Baker Hughes Incorporated | A method and apparatus for a downhole spectrometer based on electronically tunable optical filters |
| JP2005206406A (en) | 2004-01-21 | 2005-08-04 | Rikogaku Shinkokai | Ion exchanging method in solid |
| EP1577276A1 (en) | 2004-03-05 | 2005-09-21 | Glaverbel | Glazing panel |
| DE102004012977A1 (en) | 2004-03-17 | 2005-10-06 | Institut für Neue Materialien Gemeinnützige GmbH | Scratch-resistant multilayer optical system on a crystalline substrate |
| JP4039381B2 (en) | 2004-03-25 | 2008-01-30 | コニカミノルタオプト株式会社 | Glass substrate for information recording medium using glass composition and information recording medium using the same |
| CN100538827C (en) | 2004-03-25 | 2009-09-09 | Hoya株式会社 | Glass substrate for disc |
| JP2005289683A (en) | 2004-03-31 | 2005-10-20 | Central Glass Co Ltd | Tempered glass in which heterogeneous phase is formed by laser irradiation |
| JP2005289685A (en) | 2004-03-31 | 2005-10-20 | Central Glass Co Ltd | Tempered glass in which heterogeneous phase is formed by laser irradiation |
| DE102004022629B9 (en) | 2004-05-07 | 2008-09-04 | Schott Ag | Flooded lithium aluminosilicate flat glass with high temperature resistance, which can be preloaded chemically and thermally and its use |
| US7201965B2 (en) | 2004-12-13 | 2007-04-10 | Corning Incorporated | Glass laminate substrate having enhanced impact and static loading resistance |
| JP2006199538A (en) | 2005-01-20 | 2006-08-03 | Huzhou Daikyo Hari Seihin Yugenkoshi | Li2O-Al2O3-SiO2 CRYSTALLINE GLASS AND CRYSTALLIZED GLASS AND MANUFACTURING METHOD OF Li2O-Al2O3-SiO2 CRYSTALLIZED GLASS |
| DE102005026695A1 (en) | 2005-06-09 | 2006-12-21 | Schott Ag | Lighting device with an outer bulb, in particular high-pressure discharge lamp |
| US8959953B2 (en) | 2005-09-12 | 2015-02-24 | Saxon Glass Technologies, Inc. | Method for making strengthened glass |
| US8304078B2 (en) | 2005-09-12 | 2012-11-06 | Saxon Glass Technologies, Inc. | Chemically strengthened lithium aluminosilicate glass having high strength effective to resist fracture upon flexing |
| US8234883B2 (en) | 2005-11-29 | 2012-08-07 | Ppg Industries Ohio, Inc. | Apparatus and method for tempering glass sheets |
| US20070123410A1 (en) | 2005-11-30 | 2007-05-31 | Morena Robert M | Crystallization-free glass frit compositions and frits made therefrom for microreactor devices |
| AU2007214260B2 (en) | 2006-02-08 | 2011-04-21 | Five Y's Pty Ltd | Structural member |
| US8007913B2 (en) | 2006-02-10 | 2011-08-30 | Corning Incorporated | Laminated glass articles and methods of making thereof |
| GB0602821D0 (en) | 2006-02-10 | 2006-03-22 | Inovink Ltd | Improvements in and relating to printing |
| US20070208194A1 (en) | 2006-03-01 | 2007-09-06 | Woodruff Thomas E | Oxidation system with sidedraw secondary reactor |
| JP4841278B2 (en) | 2006-03-23 | 2011-12-21 | 富士フイルム株式会社 | Endoscope suction device |
| JP4650313B2 (en) | 2006-03-23 | 2011-03-16 | トヨタ自動車株式会社 | Variable exhaust system for internal combustion engine |
| JP4800809B2 (en) | 2006-03-24 | 2011-10-26 | 株式会社ニチベイ | Vertical blind |
| US7476633B2 (en) | 2006-03-31 | 2009-01-13 | Eurokera | β-spodumene glass-ceramic materials and process for making the same |
| JP2007314521A (en) | 2006-04-27 | 2007-12-06 | Sumitomo Chemical Co Ltd | Method for producing epoxy compound |
| US7456121B2 (en) * | 2006-06-23 | 2008-11-25 | Eurokera | Glass-ceramic materials, precursor glass thereof and process-for making the same |
| JP2008007384A (en) | 2006-06-30 | 2008-01-17 | Optrex Corp | Method for manufacturing glass substrate |
| FR2904431B1 (en) | 2006-07-31 | 2008-09-19 | Essilor Int | OPTICAL ARTICLE WITH ANTISTATIC AND ANTI-ABRASION PROPERTIES, AND METHOD OF MANUFACTURE |
| JP2008094713A (en) | 2006-09-15 | 2008-04-24 | Kyoto Univ | Surface modifying method of glass base material and surface modified glass base material |
| CN102718401B (en) | 2006-10-10 | 2015-04-01 | 日本电气硝子株式会社 | Reinforced glass substrate |
| JP5875133B2 (en) | 2006-10-10 | 2016-03-02 | 日本電気硝子株式会社 | Tempered glass substrate |
| US8975374B2 (en) | 2006-10-20 | 2015-03-10 | Chugai Seiyaku Kabushiki Kaisha | Pharmaceutical composition comprising anti-HB-EGF antibody as active ingredient |
| FR2909373B1 (en) | 2006-11-30 | 2009-02-27 | Snc Eurokera Soc En Nom Collec | TRANSPARENT AND COLORLESS BETA-QUARTZ GLAZE, FREE OF TIO2; ARTICLES THEREOF VITROCERAMIC; PRECURSOR GLASSES, METHODS OF PREPARATION. |
| US8887528B2 (en) | 2006-12-04 | 2014-11-18 | Asahi Glass Company, Limited | Process for producing surface-treated glass plate |
| JP5074042B2 (en) | 2007-01-10 | 2012-11-14 | Hoya株式会社 | Information recording medium substrate material, information recording medium substrate, and information recording medium manufacturing method |
| WO2008102848A1 (en) | 2007-02-22 | 2008-08-28 | Nippon Sheet Glass Company, Limited | Glass for anodic bonding |
| TWI424972B (en) | 2007-03-02 | 2014-02-01 | Nippon Electric Glass Co | Reinforced plate glass |
| JP5207357B2 (en) | 2007-03-29 | 2013-06-12 | 独立行政法人産業技術総合研究所 | Glass member molding method and molding apparatus |
| US7619283B2 (en) | 2007-04-20 | 2009-11-17 | Corning Incorporated | Methods of fabricating glass-based substrates and apparatus employing same |
| US7666511B2 (en) | 2007-05-18 | 2010-02-23 | Corning Incorporated | Down-drawable, chemically strengthened glass for cover plate |
| US8349454B2 (en) | 2007-06-07 | 2013-01-08 | Nippon Electric Glass Co., Ltd. | Strengthened glass substrate and process for producing the same |
| JP5467490B2 (en) | 2007-08-03 | 2014-04-09 | 日本電気硝子株式会社 | Method for producing tempered glass substrate and tempered glass substrate |
| JP5743125B2 (en) | 2007-09-27 | 2015-07-01 | 日本電気硝子株式会社 | Tempered glass and tempered glass substrate |
| MY167819A (en) | 2007-09-28 | 2018-09-26 | Hoya Corp | Glass substrate for magnetic disk and manufacturing method of the same |
| JP5393974B2 (en) | 2007-09-28 | 2014-01-22 | Hoya株式会社 | Manufacturing method of glass substrate for magnetic disk and magnetic disk |
| WO2009041618A1 (en) | 2007-09-28 | 2009-04-02 | Hoya Corporation | Glass substrate for magnetic disk, process for producing the glass substrate, and magnetic disk |
| JP5206261B2 (en) | 2007-10-26 | 2013-06-12 | 旭硝子株式会社 | Glass for information recording medium substrate, glass substrate for magnetic disk and magnetic disk |
| JP5079452B2 (en) | 2007-10-30 | 2012-11-21 | 財団法人神奈川科学技術アカデミー | Method for producing glass material having concavo-convex pattern on surface |
| CN101910079A (en) | 2007-11-29 | 2010-12-08 | 康宁股份有限公司 | Glass with improved toughness and scrath resistance |
| EP2535320A3 (en) | 2008-02-26 | 2014-05-14 | Corning Incorporated | Fining agents for silicate glasses |
| US8232218B2 (en) | 2008-02-29 | 2012-07-31 | Corning Incorporated | Ion exchanged, fast cooled glasses |
| TW200942299A (en) * | 2008-04-09 | 2009-10-16 | Chun-Sam Liu | Method and device of golf aiding with function of setting specific-point diagram |
| US8187715B2 (en) | 2008-05-13 | 2012-05-29 | Corning Incorporated | Rare-earth-containing glass material and substrate and device comprising such substrate |
| JP5416917B2 (en) | 2008-05-14 | 2014-02-12 | 株式会社オハラ | Glass |
| KR101475765B1 (en) | 2008-06-18 | 2014-12-23 | 닛폰 이타가라스 가부시키가이샤 | Glass flake and coated glass flake |
| WO2010002477A1 (en) | 2008-07-03 | 2010-01-07 | Corning Incorporated | Durable glass-ceramic housings/enclosures for electronic devices |
| JP2011527661A (en) | 2008-07-11 | 2011-11-04 | コーニング インコーポレイテッド | Glass with compression surface for consumer use |
| EP2321230A4 (en) | 2008-07-29 | 2012-10-10 | Corning Inc | Dual stage ion exchange for chemical strengthening of glass |
| KR20180015272A (en) | 2008-08-08 | 2018-02-12 | 코닝 인코포레이티드 | Strengthened glass articles and methods of making |
| DE102008038808A1 (en) | 2008-08-13 | 2010-02-25 | Zf Friedrichshafen Ag | Fußpedalmodul |
| US8347651B2 (en) | 2009-02-19 | 2013-01-08 | Corning Incorporated | Method of separating strengthened glass |
| US8327666B2 (en) | 2009-02-19 | 2012-12-11 | Corning Incorporated | Method of separating strengthened glass |
| US8341976B2 (en) * | 2009-02-19 | 2013-01-01 | Corning Incorporated | Method of separating strengthened glass |
| US8128534B2 (en) | 2009-02-19 | 2012-03-06 | Jump-Street, Llc | Trampoline |
| US8383255B2 (en) | 2009-02-24 | 2013-02-26 | Eveready Battery Company, Inc. | Closure assembly for electrochemical cells |
| CN101508524B (en) | 2009-03-31 | 2010-06-30 | 成都光明光电股份有限公司 | Glass suitable for chemically tempering and chemical tempered glass |
| JP5483923B2 (en) | 2009-04-24 | 2014-05-07 | 興和株式会社 | Oral solid preparation containing carnitine and glycyrrhizic acid |
| EP2432744B1 (en) | 2009-05-21 | 2020-07-15 | Corning Inc. | Thin substrates having mechanically durable edges |
| JP4815002B2 (en) | 2009-06-04 | 2011-11-16 | 株式会社オハラ | Crystallized glass substrate for information recording medium and manufacturing method thereof |
| US8193128B2 (en) | 2009-06-17 | 2012-06-05 | The Penn State Research Foundation | Treatment of particles for improved performance as proppants |
| US8802581B2 (en) | 2009-08-21 | 2014-08-12 | Corning Incorporated | Zircon compatible glasses for down draw |
| KR20120073249A (en) | 2009-08-28 | 2012-07-04 | 코닝 인코포레이티드 | Methods for laser cutting articles from chemically strengthened glass substrates |
| US8932510B2 (en) | 2009-08-28 | 2015-01-13 | Corning Incorporated | Methods for laser cutting glass substrates |
| JP5645099B2 (en) | 2009-09-09 | 2014-12-24 | 日本電気硝子株式会社 | Tempered glass |
| JP5115545B2 (en) | 2009-09-18 | 2013-01-09 | 旭硝子株式会社 | Glass and chemically tempered glass |
| JP5736379B2 (en) | 2009-09-30 | 2015-06-17 | アップル インコーポレイテッド | Technology to strengthen the glass cover of portable electronic devices |
| JP5689075B2 (en) | 2009-11-25 | 2015-03-25 | 旭硝子株式会社 | Glass substrate for display cover glass and method for producing the same |
| CN102092940A (en) | 2009-12-11 | 2011-06-15 | 肖特公开股份有限公司 | Aluminum silicate glass for touch screen |
| TWI401219B (en) | 2009-12-24 | 2013-07-11 | Avanstrate Inc | Glass plate manufacturing method and glass plate manufacturing apparatus |
| JP2013516387A (en) | 2010-01-07 | 2013-05-13 | コーニング インコーポレイテッド | Shock-resistant glass plate |
| EP2531459A2 (en) | 2010-02-02 | 2012-12-12 | Apple Inc. | Enhanced chemical strengthening glass of covers for portable electronic devices |
| JP2011164900A (en) | 2010-02-09 | 2011-08-25 | Sony Corp | Green power generating device, portable equipment, electric storage apparatus, and method for managing green power information |
| CN102167507B (en) | 2010-02-26 | 2016-03-16 | 肖特玻璃科技(苏州)有限公司 | For the thin lithium aluminosilicate glass of 3D tight mould pressing |
| CN102167509A (en) | 2010-02-26 | 2011-08-31 | 肖特玻璃科技(苏州)有限公司 | Chemical toughened glass capable of carrying out subsequent cutting |
| DE102010009584B4 (en) | 2010-02-26 | 2015-01-08 | Schott Ag | Chemically toughened glass, process for its preparation and use thereof |
| JP5683971B2 (en) | 2010-03-19 | 2015-03-11 | 石塚硝子株式会社 | Chemically strengthened glass composition and chemically strengthened glass material |
| TWI494284B (en) | 2010-03-19 | 2015-08-01 | Corning Inc | Mechanical scoring and separation of strengthened glass |
| US9302937B2 (en) * | 2010-05-14 | 2016-04-05 | Corning Incorporated | Damage-resistant glass articles and method |
| CN102249542B (en) | 2010-05-18 | 2015-08-19 | 肖特玻璃科技(苏州)有限公司 | For the alkali aluminosilicate glass of 3D accurate die pressing and thermal flexure |
| CN101838110B (en) | 2010-05-19 | 2014-02-26 | 巨石集团有限公司 | Composition for preparing high-performance glass fiber by tank furnace production |
| US20120132269A1 (en) | 2010-05-20 | 2012-05-31 | Cardinal Fg Company | Glass substrates for high temperature applications |
| US20110293942A1 (en) | 2010-05-26 | 2011-12-01 | Ivan A Cornejo | Variable temperature/continuous ion exchange process |
| US8778820B2 (en) | 2010-05-27 | 2014-07-15 | Corning Incorporated | Glasses having low softening temperatures and high toughness |
| US8759238B2 (en) | 2010-05-27 | 2014-06-24 | Corning Incorporated | Ion exchangeable glasses |
| US9540278B2 (en) | 2010-05-27 | 2017-01-10 | Corning Incorporated | Ion exchangeable glasses |
| JP2010202514A (en) | 2010-06-10 | 2010-09-16 | Hoya Corp | Glass substrate for mobile liquid crystal display and method for producing the same, and mobile liquid crystal display using the same |
| JP2012020921A (en) | 2010-06-18 | 2012-02-02 | Asahi Glass Co Ltd | Glass for display device and glass plate |
| DE102010031114B4 (en) | 2010-07-08 | 2014-06-05 | Schott Ag | Glass with excellent resistance to surface damage and use of alkaline earth phosphates to increase the surface resistance of glass |
| JP2012036074A (en) | 2010-07-12 | 2012-02-23 | Nippon Electric Glass Co Ltd | Glass plate |
| JP5732758B2 (en) | 2010-07-13 | 2015-06-10 | 旭硝子株式会社 | Cover glass for solid-state imaging device |
| US8741800B2 (en) | 2010-07-22 | 2014-06-03 | Uchicago Argonne, Llc | Hydrothermal performance of catalyst supports |
| US10189743B2 (en) | 2010-08-18 | 2019-01-29 | Apple Inc. | Enhanced strengthening of glass |
| US8584354B2 (en) | 2010-08-26 | 2013-11-19 | Corning Incorporated | Method for making glass interposer panels |
| US20120052271A1 (en) | 2010-08-26 | 2012-03-01 | Sinue Gomez | Two-step method for strengthening glass |
| US20120052275A1 (en) | 2010-08-30 | 2012-03-01 | Avanstrate Inc. | Glass substrate, chemically strengthened glass substrate and cover glass, and method for manufactruing the same |
| FR2964655B1 (en) * | 2010-09-13 | 2017-05-19 | Saint Gobain | GLASS SHEET |
| JP5839620B2 (en) | 2010-09-14 | 2016-01-06 | コーニング インコーポレイテッド | Home appliance facia and its installation |
| US9434644B2 (en) | 2010-09-30 | 2016-09-06 | Avanstrate Inc. | Cover glass and method for producing cover glass |
| US8950215B2 (en) | 2010-10-06 | 2015-02-10 | Apple Inc. | Non-contact polishing techniques for reducing roughness on glass surfaces |
| JP5720499B2 (en) | 2010-10-26 | 2015-05-20 | 旭硝子株式会社 | Substrate glass and glass substrate |
| ES2443592T3 (en) | 2010-11-04 | 2014-02-19 | Corning Incorporated | Transparent glass-ceramic spinel free of As2O3 and Sb2O3 |
| US20140066284A1 (en) | 2010-11-11 | 2014-03-06 | Nippon Electric Glass Co., Ltd. | Lead-free glass for semiconductor encapsulation and encapsulator for semiconductor encapsulation |
| US8883663B2 (en) | 2010-11-30 | 2014-11-11 | Corning Incorporated | Fusion formed and ion exchanged glass-ceramics |
| US9346703B2 (en) | 2010-11-30 | 2016-05-24 | Corning Incorporated | Ion exchangable glass with deep compressive layer and high damage threshold |
| WO2012074983A1 (en) | 2010-11-30 | 2012-06-07 | Corning Incorporated | Glass with surface and central regions under compression |
| FR2968070B1 (en) | 2010-11-30 | 2015-01-09 | Active Innovation Man | FLOATING SOLAR PANEL AND SOLAR INSTALLATION CONSISTING OF AN ASSEMBLY OF SUCH PANELS. |
| TWI588104B (en) * | 2010-12-14 | 2017-06-21 | 康寧公司 | Heat treatment for strengthening glasses |
| JP5834793B2 (en) | 2010-12-24 | 2015-12-24 | 旭硝子株式会社 | Method for producing chemically strengthened glass |
| JP2012214356A (en) | 2010-12-29 | 2012-11-08 | Avanstrate Inc | Cover glass and method for producing the same |
| JP2012148909A (en) | 2011-01-18 | 2012-08-09 | Nippon Electric Glass Co Ltd | Tempered glass and tempered glass plate |
| JP5839338B2 (en) | 2011-01-18 | 2016-01-06 | 日本電気硝子株式会社 | Method for producing tempered glass sheet |
| US8835007B2 (en) | 2011-01-19 | 2014-09-16 | Nippon Electric Glass Co., Ltd. | Tempered glass and tempered glass sheet |
| US20120196110A1 (en) | 2011-01-19 | 2012-08-02 | Takashi Murata | Tempered glass and tempered glass sheet |
| US8883314B2 (en) | 2011-01-25 | 2014-11-11 | Corning Incorporated | Coated articles with improved fingerprint resistance and methods of making same |
| KR101181342B1 (en) | 2011-02-16 | 2012-09-11 | 에쓰이에이치에프코리아 (주) | Touch screen |
| US20120216569A1 (en) | 2011-02-24 | 2012-08-30 | Douglas Clippinger Allan | Method of producing constancy of compressive stress in glass in an ion-exchange process |
| US20120216565A1 (en) | 2011-02-24 | 2012-08-30 | Douglas Clippinger Allan | Method of producing constancy of compressive stress in glass in an ion exchange process |
| US8756262B2 (en) | 2011-03-01 | 2014-06-17 | Splunk Inc. | Approximate order statistics of real numbers in generic data |
| KR101328832B1 (en) | 2011-03-14 | 2013-11-13 | 삼성전자주식회사 | Touch panel and touch screen having the same |
| US10781135B2 (en) | 2011-03-16 | 2020-09-22 | Apple Inc. | Strengthening variable thickness glass |
| TW201245080A (en) | 2011-03-17 | 2012-11-16 | Asahi Glass Co Ltd | Glass for chemical strengthening |
| CN102690059B (en) | 2011-03-23 | 2016-08-03 | 肖特玻璃科技(苏州)有限公司 | Aluminosilicate glass for chemical tempering and glass ceramics |
| JP2012232882A (en) | 2011-04-18 | 2012-11-29 | Asahi Glass Co Ltd | Method for producing chemically tempered glass, and glass for chemical tempering |
| US9140543B1 (en) | 2011-05-25 | 2015-09-22 | Corning Incorporated | Systems and methods for measuring the stress profile of ion-exchanged glass |
| CN103608305B (en) | 2011-05-31 | 2016-04-06 | 康宁股份有限公司 | Precision glass roller manufacturing process and equipment |
| US8889575B2 (en) | 2011-05-31 | 2014-11-18 | Corning Incorporated | Ion exchangeable alkali aluminosilicate glass articles |
| US9003835B2 (en) | 2011-05-31 | 2015-04-14 | Corning Incorporated | Precision roll forming of textured sheet glass |
| EP2722318A4 (en) | 2011-06-20 | 2015-03-11 | Asahi Glass Co Ltd | Method for producing laminated glass, and laminated glass |
| KR101302664B1 (en) | 2011-06-30 | 2013-09-03 | 박만금 | Manufacturing method of strengthed glass and strengthed glass thereby |
| TWI591039B (en) | 2011-07-01 | 2017-07-11 | 康寧公司 | Ion exchangeable glass with high compressive stress |
| US9783452B2 (en) | 2011-07-01 | 2017-10-10 | Corning Incorporated | Ion-exchanged glass of high surface compression and shallow depth of layer with high resistance to radial crack formation from vickers indentation |
| TWI572480B (en) | 2011-07-25 | 2017-03-01 | 康寧公司 | Laminated and ion-exchanged strengthened glass laminates |
| JP5737043B2 (en) * | 2011-07-29 | 2015-06-17 | 旭硝子株式会社 | Substrate glass and glass substrate |
| WO2013018774A1 (en) | 2011-08-04 | 2013-02-07 | 旭硝子株式会社 | Method for impact-testing chemically strengthened glass, method for reproducing cracks in chemically strengthened glass, and method for manufacturing chemically strengthened glass |
| JP2013035721A (en) | 2011-08-09 | 2013-02-21 | Asahi Glass Co Ltd | Method for producing glass plate, and chemically strengthened glass for display device |
| US10280112B2 (en) | 2011-08-19 | 2019-05-07 | Corning Incorporated | Ion exchanged glass with high resistance to sharp contact failure and articles made therefrom |
| JP2013043795A (en) | 2011-08-23 | 2013-03-04 | Nippon Electric Glass Co Ltd | Tempered glass and method of manufacturing the same |
| WO2013027651A1 (en) | 2011-08-23 | 2013-02-28 | Hoya株式会社 | Method for manufacturing reinforced glass substrate and reinforced glass substrate |
| US8789998B2 (en) | 2011-08-31 | 2014-07-29 | Corning Incorporated | Edge illumination of an ion-exchanged glass sheet |
| US20140227525A1 (en) | 2011-09-29 | 2014-08-14 | Central Glass Company, Limited | Cover glass for display device, and manufacturing method for same |
| EP2762461B1 (en) * | 2011-09-29 | 2018-11-21 | Central Glass Company, Limited | Chemically strengthened glass and method for producing same |
| CN103058507A (en) | 2011-10-18 | 2013-04-24 | 浙江福隆鼎玻璃科技有限公司 | Manufacturing method of fireproof glass |
| CN103058506A (en) | 2011-10-20 | 2013-04-24 | 雅士晶业股份有限公司 | Method for forming compressive stress layer pattern on glass substrate surface and glass substrate made by the same |
| US9241869B2 (en) | 2011-10-25 | 2016-01-26 | Corning Incorporated | Delamination resistant pharmaceutical glass containers containing active pharmaceutical ingredients |
| WO2013063002A2 (en) | 2011-10-25 | 2013-05-02 | Corning Incorporated | Alkaline earth alumino-silicate glass compositions with improved chemical and mechanical durability |
| US9850162B2 (en) | 2012-02-29 | 2017-12-26 | Corning Incorporated | Glass packaging ensuring container integrity |
| US10350139B2 (en) | 2011-10-25 | 2019-07-16 | Corning Incorporated | Pharmaceutical glass packaging assuring pharmaceutical sterility |
| US20130122260A1 (en) | 2011-11-10 | 2013-05-16 | Nai-Yue Liang | Glass substrate having a patterned layer of compressive stress on a surface thereof |
| CN110002745B (en) | 2011-11-16 | 2022-10-11 | 康宁股份有限公司 | Ion-exchangeable glasses with high crack initiation threshold |
| JP2013228669A (en) | 2011-11-30 | 2013-11-07 | Hoya Corp | Cover glass blank for electronic device and manufacturing method thereof, and cover glass for electronic device and manufacturing method thereof |
| WO2013082246A1 (en) | 2011-11-30 | 2013-06-06 | Corning Incorporated | Controlling alkali in cigs thin films via glass and application of voltage |
| CN102393289B (en) | 2011-12-05 | 2013-08-21 | 北京神州腾耀通信技术有限公司 | Steel ball drop test machine |
| KR20150040367A (en) | 2011-12-16 | 2015-04-14 | 아사히 가라스 가부시키가이샤 | Display cover glass and display cover glass fabrication method |
| FR2986279B1 (en) | 2012-01-27 | 2016-07-29 | Converteam Tech Ltd | HYDRAULIC ROTOR BLADE, HYDROLIAN ROTOR COMPRISING SUCH A BLADE, HYDROLENE ASSOCIATED, AND METHOD OF MANUFACTURING SUCH BLADE |
| WO2013116420A1 (en) | 2012-02-01 | 2013-08-08 | Corning Incorporated | Method of producing constancy of compressive stress in glass in an ion-exchange process |
| US9725357B2 (en) | 2012-10-12 | 2017-08-08 | Corning Incorporated | Glass articles having films with moderate adhesion and retained strength |
| DE102012002711A1 (en) | 2012-02-14 | 2013-08-14 | Thyssenkrupp Uhde Gmbh | Soil product cooling in a fluidized bed gasification |
| WO2013130665A2 (en) | 2012-02-29 | 2013-09-06 | Corning Incorporated | Low cte, ion-exchangeable glass compositions and glass articles comprising the same |
| US9359251B2 (en) * | 2012-02-29 | 2016-06-07 | Corning Incorporated | Ion exchanged glasses via non-error function compressive stress profiles |
| US10052848B2 (en) | 2012-03-06 | 2018-08-21 | Apple Inc. | Sapphire laminates |
| FR2988089A1 (en) | 2012-03-15 | 2013-09-20 | Saint Gobain | GLASS SHEET |
| UA108730C2 (en) * | 2012-03-28 | 2015-05-25 | CONTINUOUS CASTING EQUIPMENT | |
| US8664130B2 (en) | 2012-04-13 | 2014-03-04 | Corning Incorporated | White, opaque β-spodumene/rutile glass-ceramic articles and methods for making the same |
| US20130288010A1 (en) | 2012-04-27 | 2013-10-31 | Ravindra Kumar Akarapu | Strengthened glass article having shaped edge and method of making |
| JP6176241B2 (en) | 2012-04-27 | 2017-08-09 | 旭硝子株式会社 | Method for producing chemically strengthened glass |
| US20130309613A1 (en) | 2012-05-16 | 2013-11-21 | Corning Incorporated | Liquid Based Films |
| SG11201407592YA (en) | 2012-05-16 | 2015-01-29 | Hoya Corp | Glass for magnetic recording medium substrate and usage thereof |
| US9156725B2 (en) | 2012-05-30 | 2015-10-13 | Corning Incorporated | Down-drawable chemically strengthened glass for information storage devices |
| US9512029B2 (en) | 2012-05-31 | 2016-12-06 | Corning Incorporated | Cover glass article |
| KR102472180B1 (en) | 2012-05-31 | 2022-11-29 | 코닝 인코포레이티드 | Zircon compatible, ion exchangeable glass with high damage resistance |
| US9517967B2 (en) | 2012-05-31 | 2016-12-13 | Corning Incorporated | Ion exchangeable glass with high damage resistance |
| US9499431B2 (en) | 2012-06-08 | 2016-11-22 | Corning Incorporated | Strengthened glass articles and methods of making |
| KR101629779B1 (en) | 2012-06-08 | 2016-06-13 | 니폰 덴키 가라스 가부시키가이샤 | Tempered glass, tempered glass plate, and glass for tempering |
| JP6168288B2 (en) | 2012-06-13 | 2017-07-26 | 日本電気硝子株式会社 | Tempered glass and tempered glass plate |
| JP5924489B2 (en) | 2012-06-21 | 2016-05-25 | 日本電気硝子株式会社 | Method for producing tempered glass |
| KR101641980B1 (en) | 2012-06-25 | 2016-07-22 | 니폰 덴키 가라스 가부시키가이샤 | Toughened glass substrate and manufacturing process therefor |
| JP2014012611A (en) | 2012-07-03 | 2014-01-23 | Asahi Glass Co Ltd | Chemically strengthened glass plate |
| WO2014010533A1 (en) | 2012-07-09 | 2014-01-16 | 日本電気硝子株式会社 | Tempered glass and tempered glass sheet |
| JP6032468B2 (en) | 2012-07-09 | 2016-11-30 | 日本電気硝子株式会社 | Method for producing tempered glass substrate |
| US9139469B2 (en) | 2012-07-17 | 2015-09-22 | Corning Incorporated | Ion exchangeable Li-containing glass compositions for 3-D forming |
| CA2820253C (en) | 2012-08-08 | 2020-10-27 | Shrenik Shah | System and method for improving impact safety |
| EP2885253B1 (en) | 2012-08-17 | 2021-06-02 | Corning Incorporated | Ultra-thin strengthened glasses |
| US9454025B2 (en) | 2012-08-31 | 2016-09-27 | Apple Inc. | Displays with reduced driver circuit ledges |
| JP6233312B2 (en) * | 2012-09-14 | 2017-11-22 | 旭硝子株式会社 | Chemically strengthened glass, chemically strengthened glass, and method for producing chemically strengthened glass |
| FR2995887B1 (en) | 2012-09-21 | 2017-12-15 | Saint Gobain | GLASS SHEET AND DEVICE COMPRISING SAID GLASS SHEET |
| US9387651B2 (en) | 2012-09-26 | 2016-07-12 | Corning Incorporated | Methods for producing ion exchanged glass and resulting apparatus |
| US20140087193A1 (en) * | 2012-09-26 | 2014-03-27 | Jeffrey Scott Cites | Methods for producing ion exchanged glass and resulting apparatus |
| US9403716B2 (en) | 2012-09-27 | 2016-08-02 | Corning Incorporated | Glass-ceramic(s); associated formable and/or color-tunable, crystallizable glass(es); and associated process(es) |
| CN102887650B (en) | 2012-09-27 | 2014-12-24 | 中国航空工业集团公司北京航空材料研究院 | Method for comprehensively reinforcing sheet glass |
| US8957374B2 (en) | 2012-09-28 | 2015-02-17 | Corning Incorporated | Systems and methods for measuring birefringence in glass and glass-ceramics |
| KR101964492B1 (en) | 2012-10-03 | 2019-04-01 | 코닝 인코포레이티드 | Surface-modified glass substrate |
| KR101949561B1 (en) | 2012-10-12 | 2019-02-18 | 코닝 인코포레이티드 | Articles having retained strength |
| US9272945B2 (en) | 2012-10-25 | 2016-03-01 | Corning Incorporated | Thermo-electric method for texturing of glass surfaces |
| US8854623B2 (en) | 2012-10-25 | 2014-10-07 | Corning Incorporated | Systems and methods for measuring a profile characteristic of a glass sample |
| US9604871B2 (en) | 2012-11-08 | 2017-03-28 | Corning Incorporated | Durable glass ceramic cover glass for electronic devices |
| US9718249B2 (en) | 2012-11-16 | 2017-08-01 | Apple Inc. | Laminated aluminum oxide cover component |
| US10501364B2 (en) | 2012-11-21 | 2019-12-10 | Corning Incorporated | Ion exchangeable glasses having high hardness and high modulus |
| US10117806B2 (en) | 2012-11-30 | 2018-11-06 | Corning Incorporated | Strengthened glass containers resistant to delamination and damage |
| US20140154661A1 (en) | 2012-11-30 | 2014-06-05 | Corning Incorporated | Durable glass articles for use as writable erasable marker boards |
| JP5982500B2 (en) * | 2012-12-21 | 2016-08-31 | Hoya株式会社 | Glass substrate for HDD and information recording medium |
| CN105314848A (en) | 2012-12-21 | 2016-02-10 | 康宁股份有限公司 | Glass with improved total pitch stability |
| US9623628B2 (en) | 2013-01-10 | 2017-04-18 | Apple Inc. | Sapphire component with residual compressive stress |
| JP2014133683A (en) * | 2013-01-10 | 2014-07-24 | Central Glass Co Ltd | Method for manufacturing a chemically strengthened glass plate |
| JP5869500B2 (en) * | 2013-01-17 | 2016-02-24 | 旭化成ケミカルズ株式会社 | Composition and polymer |
| JP2014141363A (en) | 2013-01-23 | 2014-08-07 | Konica Minolta Inc | Chemically strengthenable glass, glass sheet, and chemically strengthened cover glass |
| US9714192B2 (en) | 2013-02-08 | 2017-07-25 | Corning Incorporated | Ion exchangeable glass with advantaged stress profile |
| JP2014208570A (en) | 2013-03-25 | 2014-11-06 | 日本電気硝子株式会社 | Tempered glass substrate and method of manufacturing the same |
| WO2014175144A1 (en) | 2013-04-25 | 2014-10-30 | 旭硝子株式会社 | Glass plate for chemical reinforcement purposes, and method for producing same |
| US9359261B2 (en) | 2013-05-07 | 2016-06-07 | Corning Incorporated | Low-color scratch-resistant articles with a multilayer optical film |
| EP3909924B1 (en) | 2013-05-07 | 2023-12-13 | AGC Glass Europe | Glass sheet with high transmission of infrared radiation |
| US20140356605A1 (en) | 2013-05-31 | 2014-12-04 | Corning Incorporated | Antimicrobial Articles and Methods of Making and Using Same |
| JP6455799B2 (en) | 2013-06-06 | 2019-01-23 | 日本電気硝子株式会社 | Glass tubes for pharmaceutical containers and pharmaceutical containers |
| US9512035B2 (en) | 2013-06-17 | 2016-12-06 | Corning Incorporated | Antimicrobial glass articles with improved strength and methods of making and using same |
| CN105531236B (en) | 2013-07-25 | 2018-11-30 | 康宁公司 | The method and apparatus for forming glass tape |
| US11079309B2 (en) | 2013-07-26 | 2021-08-03 | Corning Incorporated | Strengthened glass articles having improved survivability |
| US10941071B2 (en) | 2013-08-02 | 2021-03-09 | Corning Incorporated | Hybrid soda-lime silicate and aluminosilicate glass articles |
| US9573843B2 (en) | 2013-08-05 | 2017-02-21 | Corning Incorporated | Polymer edge-covered glass articles and methods for making and using same |
| WO2015031188A1 (en) | 2013-08-27 | 2015-03-05 | Corning Incorporated | Damage resistant glass with high coefficient of thermal expansion |
| US20150060401A1 (en) | 2013-08-29 | 2015-03-05 | Corning Incorporated | Method of edge coating a batch of glass articles |
| JP6761344B2 (en) | 2013-08-30 | 2020-09-23 | コーニング インコーポレイテッド | Ion-exchangeable glass, glass ceramics, and their manufacturing methods |
| US10160688B2 (en) * | 2013-09-13 | 2018-12-25 | Corning Incorporated | Fracture-resistant layered-substrates and articles including the same |
| CN112919828A (en) | 2013-10-14 | 2021-06-08 | 康宁股份有限公司 | Ion exchange method and chemically strengthened glass substrate obtained by the ion exchange method |
| WO2015057555A1 (en) | 2013-10-14 | 2015-04-23 | Corning Incorporated | Glass articles having films with moderate adhesion and retained strength |
| ITCO20130051A1 (en) | 2013-10-23 | 2015-04-24 | Nuovo Pignone Srl | METHOD FOR THE PRODUCTION OF A STAGE OF A STEAM TURBINE |
| US9663400B2 (en) | 2013-11-08 | 2017-05-30 | Corning Incorporated | Scratch-resistant liquid based coatings for glass |
| EP3071526B1 (en) | 2013-11-19 | 2023-12-20 | Corning Incorporated | Ion exchangeable high damage resistance glasses |
| US10442730B2 (en) * | 2013-11-25 | 2019-10-15 | Corning Incorporated | Method for achieving a stress profile in a glass |
| JP6390623B2 (en) | 2013-11-26 | 2018-09-19 | Agc株式会社 | Glass member and method for producing glass member |
| US9708216B2 (en) | 2013-11-26 | 2017-07-18 | Corning Incorporated | Phosphorous containing glass having antimicrobial efficacy |
| EP3074357B1 (en) | 2013-11-26 | 2022-11-09 | Corning Inc. | Fast ion exchangeable glasses with high indentation threshold |
| US20150166407A1 (en) * | 2013-12-08 | 2015-06-18 | Saxon Glass Technologies, Inc. | Strengthened glass and methods for making utilizing electric field assist |
| CN105829678B (en) | 2013-12-19 | 2019-10-11 | 沃尔沃卡车集团 | Internal combustion engine |
| US9517968B2 (en) | 2014-02-24 | 2016-12-13 | Corning Incorporated | Strengthened glass with deep depth of compression |
| WO2016191676A1 (en) | 2015-05-28 | 2016-12-01 | Corning Incorporated | Strengthened glass with deep depth of compression |
| US20150274585A1 (en) | 2014-03-26 | 2015-10-01 | Apple Inc. | Asymmetric chemical strengthening |
| US9359243B2 (en) | 2014-05-13 | 2016-06-07 | Corning Incorporated | Transparent glass-ceramic articles, glass-ceramic precursor glasses and methods for forming the same |
| WO2015195419A2 (en) * | 2014-06-19 | 2015-12-23 | Corning Incorporated | Strengthened glass with deep depth of compression |
| TWI705889B (en) | 2014-06-19 | 2020-10-01 | 美商康寧公司 | Glasses having non-frangible stress profiles |
| CN105293901A (en) | 2014-07-01 | 2016-02-03 | 科立视材料科技有限公司 | Glass composition for chemical intensified alkali aluminosilicate glass and production method for chemical intensified alkali aluminosilicate glass |
| CN107108345B (en) | 2014-07-25 | 2023-02-07 | 康宁股份有限公司 | Strengthened glass with deep depth of compression |
| WO2016028554A1 (en) | 2014-08-19 | 2016-02-25 | Corning Incorporated | Antimicrobial articles with copper nanoparticles and methods of making and using same |
| DE202015009997U1 (en) | 2014-10-08 | 2022-11-09 | Corning Incorporated | Glasses and glass-ceramics with a metal oxide concentration gradient |
| US10150698B2 (en) | 2014-10-31 | 2018-12-11 | Corning Incorporated | Strengthened glass with ultra deep depth of compression |
| EP3215471B1 (en) | 2014-11-04 | 2021-12-15 | Corning Incorporated | Deep non-frangible stress profiles and methods of making |
| KR101515620B1 (en) | 2014-12-29 | 2015-05-04 | 삼성전자주식회사 | User termincal device and methods for controlling the user termincal device thereof |
| US9864410B2 (en) | 2014-12-29 | 2018-01-09 | Samsung Electronics Co., Ltd. | Foldable device and method of controlling the same |
| JP6517074B2 (en) | 2015-04-27 | 2019-05-22 | 日本板硝子株式会社 | Glass composition, glass fiber, scale-like glass and coated scale-like glass |
| CN110372230B (en) | 2015-05-15 | 2020-05-19 | Agc株式会社 | Chemically strengthened glass |
| US10579106B2 (en) | 2015-07-21 | 2020-03-03 | Corning Incorporated | Glass articles exhibiting improved fracture performance |
| WO2017100399A1 (en) | 2015-12-08 | 2017-06-15 | Corning Incorporated | S-shaped stress profiles and methods of making |
| EP3386930B1 (en) | 2015-12-11 | 2021-06-16 | Corning Incorporated | Fusion-formable glass-based articles including a metal oxide concentration gradient |
| TWI736571B (en) | 2016-01-08 | 2021-08-21 | 美商康寧公司 | Chemically strengthenable lithium aluminosilicate glasses with inherent damage resistance |
| KR101952085B1 (en) | 2016-01-12 | 2019-05-21 | 코닝 인코포레이티드 | Thin, thermally and chemically tempered glass-based products |
| WO2017177114A1 (en) | 2016-04-08 | 2017-10-12 | Corning Incorporated | Glass-based articles including a metal oxide concentration gradient |
| DE202017007024U1 (en) | 2016-04-08 | 2019-03-25 | Corning Incorporated | Glass-based articles including a stress profile covering two areas |
| US11453612B2 (en) | 2016-04-20 | 2022-09-27 | Corning Incorporated | Glass-based articles including a metal oxide concentration gradient |
| KR102411111B1 (en) | 2016-05-31 | 2022-06-20 | 코닝 인코포레이티드 | Glass Articles Exhibiting Improved Fracture Performance |
-
2017
- 2017-04-07 DE DE202017007024.3U patent/DE202017007024U1/en active Active
- 2017-04-07 EP EP17720633.1A patent/EP3397597B1/en active Active
- 2017-04-07 US US15/482,160 patent/US10271442B2/en active Active
- 2017-04-07 KR KR1020217030541A patent/KR20210122313A/en not_active Application Discontinuation
- 2017-04-07 KR KR1020187029113A patent/KR20180132077A/en active Application Filing
- 2017-04-07 WO PCT/US2017/026554 patent/WO2017177109A1/en active Application Filing
- 2017-04-07 KR KR1020247003262A patent/KR20240019381A/en active Application Filing
- 2017-04-07 EP EP23195051.0A patent/EP4269368A3/en active Pending
- 2017-04-07 KR KR1020207021271A patent/KR20200091500A/en not_active Application Discontinuation
- 2017-04-07 JP JP2018540470A patent/JP6902042B2/en active Active
- 2017-04-10 TW TW106111854A patent/TWI666190B/en active
- 2017-04-10 CN CN202311610266.3A patent/CN117623643A/en active Pending
- 2017-04-10 CN CN201720370095.5U patent/CN207362073U/en not_active Ceased
- 2017-04-10 CN CN201911148250.9A patent/CN111039578A/en active Pending
- 2017-04-10 TW TW108120282A patent/TWI718556B/en active
- 2017-04-10 CN CN201710228902.4A patent/CN107265884A/en active Pending
- 2017-04-10 TW TW110101913A patent/TWI750008B/en active
-
2019
- 2019-03-06 US US16/294,022 patent/US20190208652A1/en not_active Abandoned
-
2021
- 2021-06-18 JP JP2021101484A patent/JP7356473B2/en active Active
-
2022
- 2022-10-06 US US17/961,188 patent/US11963320B2/en active Active
-
2023
- 2023-09-22 JP JP2023158257A patent/JP2023164724A/en active Pending
Also Published As
| Publication number | Publication date |
|---|---|
| TW201806894A (en) | 2018-03-01 |
| WO2017177109A1 (en) | 2017-10-12 |
| JP7356473B2 (en) | 2023-10-04 |
| CN207362073U (en) | 2018-05-15 |
| DE202017007024U1 (en) | 2019-03-25 |
| KR20200091500A (en) | 2020-07-30 |
| TW202140401A (en) | 2021-11-01 |
| EP4269368A2 (en) | 2023-11-01 |
| JP6902042B2 (en) | 2021-07-14 |
| JP2023164724A (en) | 2023-11-10 |
| JP2019513663A (en) | 2019-05-30 |
| US10271442B2 (en) | 2019-04-23 |
| CN111039578A (en) | 2020-04-21 |
| US20230057346A1 (en) | 2023-02-23 |
| KR20240019381A (en) | 2024-02-14 |
| TWI718556B (en) | 2021-02-11 |
| KR20180132077A (en) | 2018-12-11 |
| CN107265884A (en) | 2017-10-20 |
| JP2021151950A (en) | 2021-09-30 |
| EP3397597A1 (en) | 2018-11-07 |
| US11963320B2 (en) | 2024-04-16 |
| US20190208652A1 (en) | 2019-07-04 |
| CN117623643A (en) | 2024-03-01 |
| TWI666190B (en) | 2019-07-21 |
| TWI750008B (en) | 2021-12-11 |
| EP4269368A3 (en) | 2023-11-22 |
| US20170295657A1 (en) | 2017-10-12 |
| TW202003416A (en) | 2020-01-16 |
| KR20210122313A (en) | 2021-10-08 |
Similar Documents
| Publication | Publication Date | Title |
|---|---|---|
| EP3397597B1 (en) | Glass-based articles including a stress profile comprising two regions, and methods of making | |
| US11472734B2 (en) | Fusion-formable glass-based articles including a metal oxide concentration gradient | |
| EP3405441B1 (en) | Fracture and scratch resistant glass articles | |
| US11453612B2 (en) | Glass-based articles including a metal oxide concentration gradient | |
| US20180312431A1 (en) | Glass-based articles including a metal oxide concentration gradient | |
| EP4166521A1 (en) | Glasses and glass ceramics including a metal oxide concentration gradient |
Legal Events
| Date | Code | Title | Description |
|---|---|---|---|
| STAA | Information on the status of an ep patent application or granted ep patent |
Free format text: STATUS: UNKNOWN |
|
| STAA | Information on the status of an ep patent application or granted ep patent |
Free format text: STATUS: THE INTERNATIONAL PUBLICATION HAS BEEN MADE |
|
| PUAI | Public reference made under article 153(3) epc to a published international application that has entered the european phase |
Free format text: ORIGINAL CODE: 0009012 |
|
| STAA | Information on the status of an ep patent application or granted ep patent |
Free format text: STATUS: REQUEST FOR EXAMINATION WAS MADE |
|
| 17P | Request for examination filed |
Effective date: 20180802 |
|
| AK | Designated contracting states |
Kind code of ref document: A1 Designated state(s): AL AT BE BG CH CY CZ DE DK EE ES FI FR GB GR HR HU IE IS IT LI LT LU LV MC MK MT NL NO PL PT RO RS SE SI SK SM TR |
|
| AX | Request for extension of the european patent |
Extension state: BA ME |
|
| STAA | Information on the status of an ep patent application or granted ep patent |
Free format text: STATUS: REQUEST FOR EXAMINATION WAS MADE |
|
| DAV | Request for validation of the european patent (deleted) | ||
| DAX | Request for extension of the european patent (deleted) | ||
| TPAC | Observations filed by third parties |
Free format text: ORIGINAL CODE: EPIDOSNTIPA |
|
| STAA | Information on the status of an ep patent application or granted ep patent |
Free format text: STATUS: EXAMINATION IS IN PROGRESS |
|
| 17Q | First examination report despatched |
Effective date: 20210303 |
|
| STAA | Information on the status of an ep patent application or granted ep patent |
Free format text: STATUS: EXAMINATION IS IN PROGRESS |
|
| GRAP | Despatch of communication of intention to grant a patent |
Free format text: ORIGINAL CODE: EPIDOSNIGR1 |
|
| STAA | Information on the status of an ep patent application or granted ep patent |
Free format text: STATUS: GRANT OF PATENT IS INTENDED |
|
| INTG | Intention to grant announced |
Effective date: 20230530 |
|
| P01 | Opt-out of the competence of the unified patent court (upc) registered |
Effective date: 20230613 |
|
| GRAS | Grant fee paid |
Free format text: ORIGINAL CODE: EPIDOSNIGR3 |
|
| GRAA | (expected) grant |
Free format text: ORIGINAL CODE: 0009210 |
|
| STAA | Information on the status of an ep patent application or granted ep patent |
Free format text: STATUS: THE PATENT HAS BEEN GRANTED |
|
| AK | Designated contracting states |
Kind code of ref document: B1 Designated state(s): AL AT BE BG CH CY CZ DE DK EE ES FI FR GB GR HR HU IE IS IT LI LT LU LV MC MK MT NL NO PL PT RO RS SE SI SK SM TR |
|
| REG | Reference to a national code |
Ref country code: GB Ref legal event code: FG4D |
|
| REG | Reference to a national code |
Ref country code: CH Ref legal event code: EP |
|
| REG | Reference to a national code |
Ref country code: DE Ref legal event code: R096 Ref document number: 602017076270 Country of ref document: DE |
|
| REG | Reference to a national code |
Ref country code: IE Ref legal event code: FG4D |
|
| REG | Reference to a national code |
Ref country code: LT Ref legal event code: MG9D |
|
| REG | Reference to a national code |
Ref country code: NL Ref legal event code: MP Effective date: 20231108 |
|
| PG25 | Lapsed in a contracting state [announced via postgrant information from national office to epo] |
Ref country code: GR Free format text: LAPSE BECAUSE OF FAILURE TO SUBMIT A TRANSLATION OF THE DESCRIPTION OR TO PAY THE FEE WITHIN THE PRESCRIBED TIME-LIMIT Effective date: 20240209 |
|
| PG25 | Lapsed in a contracting state [announced via postgrant information from national office to epo] |
Ref country code: IS Free format text: LAPSE BECAUSE OF FAILURE TO SUBMIT A TRANSLATION OF THE DESCRIPTION OR TO PAY THE FEE WITHIN THE PRESCRIBED TIME-LIMIT Effective date: 20240308 |
|
| PG25 | Lapsed in a contracting state [announced via postgrant information from national office to epo] |
Ref country code: LT Free format text: LAPSE BECAUSE OF FAILURE TO SUBMIT A TRANSLATION OF THE DESCRIPTION OR TO PAY THE FEE WITHIN THE PRESCRIBED TIME-LIMIT Effective date: 20231108 |
|
| REG | Reference to a national code |
Ref country code: AT Ref legal event code: MK05 Ref document number: 1629493 Country of ref document: AT Kind code of ref document: T Effective date: 20231108 |
|
| PG25 | Lapsed in a contracting state [announced via postgrant information from national office to epo] |
Ref country code: NL Free format text: LAPSE BECAUSE OF FAILURE TO SUBMIT A TRANSLATION OF THE DESCRIPTION OR TO PAY THE FEE WITHIN THE PRESCRIBED TIME-LIMIT Effective date: 20231108 |