EP3385703B1 - Verbesserte spektroskopievorrichtung und verfahren zur probencharakterisierung - Google Patents
Verbesserte spektroskopievorrichtung und verfahren zur probencharakterisierung Download PDFInfo
- Publication number
- EP3385703B1 EP3385703B1 EP17305412.3A EP17305412A EP3385703B1 EP 3385703 B1 EP3385703 B1 EP 3385703B1 EP 17305412 A EP17305412 A EP 17305412A EP 3385703 B1 EP3385703 B1 EP 3385703B1
- Authority
- EP
- European Patent Office
- Prior art keywords
- sample
- spectrum
- translucent material
- corrected
- measured optical
- Prior art date
- Legal status (The legal status is an assumption and is not a legal conclusion. Google has not performed a legal analysis and makes no representation as to the accuracy of the status listed.)
- Active
Links
Images


Classifications
-
- G—PHYSICS
- G01—MEASURING; TESTING
- G01N—INVESTIGATING OR ANALYSING MATERIALS BY DETERMINING THEIR CHEMICAL OR PHYSICAL PROPERTIES
- G01N21/00—Investigating or analysing materials by the use of optical means, i.e. using sub-millimetre waves, infrared, visible or ultraviolet light
- G01N21/17—Systems in which incident light is modified in accordance with the properties of the material investigated
- G01N21/25—Colour; Spectral properties, i.e. comparison of effect of material on the light at two or more different wavelengths or wavelength bands
- G01N21/31—Investigating relative effect of material at wavelengths characteristic of specific elements or molecules, e.g. atomic absorption spectrometry
- G01N21/314—Investigating relative effect of material at wavelengths characteristic of specific elements or molecules, e.g. atomic absorption spectrometry with comparison of measurements at specific and non-specific wavelengths
-
- G—PHYSICS
- G01—MEASURING; TESTING
- G01N—INVESTIGATING OR ANALYSING MATERIALS BY DETERMINING THEIR CHEMICAL OR PHYSICAL PROPERTIES
- G01N21/00—Investigating or analysing materials by the use of optical means, i.e. using sub-millimetre waves, infrared, visible or ultraviolet light
- G01N21/17—Systems in which incident light is modified in accordance with the properties of the material investigated
- G01N21/25—Colour; Spectral properties, i.e. comparison of effect of material on the light at two or more different wavelengths or wavelength bands
-
- G—PHYSICS
- G01—MEASURING; TESTING
- G01J—MEASUREMENT OF INTENSITY, VELOCITY, SPECTRAL CONTENT, POLARISATION, PHASE OR PULSE CHARACTERISTICS OF INFRARED, VISIBLE OR ULTRAVIOLET LIGHT; COLORIMETRY; RADIATION PYROMETRY
- G01J3/00—Spectrometry; Spectrophotometry; Monochromators; Measuring colours
- G01J3/02—Details
- G01J3/0264—Electrical interface; User interface
-
- G—PHYSICS
- G01—MEASURING; TESTING
- G01J—MEASUREMENT OF INTENSITY, VELOCITY, SPECTRAL CONTENT, POLARISATION, PHASE OR PULSE CHARACTERISTICS OF INFRARED, VISIBLE OR ULTRAVIOLET LIGHT; COLORIMETRY; RADIATION PYROMETRY
- G01J3/00—Spectrometry; Spectrophotometry; Monochromators; Measuring colours
- G01J3/28—Investigating the spectrum
- G01J3/42—Absorption spectrometry; Double beam spectrometry; Flicker spectrometry; Reflection spectrometry
-
- G—PHYSICS
- G01—MEASURING; TESTING
- G01N—INVESTIGATING OR ANALYSING MATERIALS BY DETERMINING THEIR CHEMICAL OR PHYSICAL PROPERTIES
- G01N21/00—Investigating or analysing materials by the use of optical means, i.e. using sub-millimetre waves, infrared, visible or ultraviolet light
- G01N21/17—Systems in which incident light is modified in accordance with the properties of the material investigated
- G01N21/25—Colour; Spectral properties, i.e. comparison of effect of material on the light at two or more different wavelengths or wavelength bands
- G01N21/27—Colour; Spectral properties, i.e. comparison of effect of material on the light at two or more different wavelengths or wavelength bands using photo-electric detection ; circuits for computing concentration
- G01N21/274—Calibration, base line adjustment, drift correction
-
- G—PHYSICS
- G01—MEASURING; TESTING
- G01N—INVESTIGATING OR ANALYSING MATERIALS BY DETERMINING THEIR CHEMICAL OR PHYSICAL PROPERTIES
- G01N21/00—Investigating or analysing materials by the use of optical means, i.e. using sub-millimetre waves, infrared, visible or ultraviolet light
- G01N21/17—Systems in which incident light is modified in accordance with the properties of the material investigated
- G01N21/25—Colour; Spectral properties, i.e. comparison of effect of material on the light at two or more different wavelengths or wavelength bands
- G01N21/31—Investigating relative effect of material at wavelengths characteristic of specific elements or molecules, e.g. atomic absorption spectrometry
- G01N21/35—Investigating relative effect of material at wavelengths characteristic of specific elements or molecules, e.g. atomic absorption spectrometry using infrared light
-
- G—PHYSICS
- G01—MEASURING; TESTING
- G01N—INVESTIGATING OR ANALYSING MATERIALS BY DETERMINING THEIR CHEMICAL OR PHYSICAL PROPERTIES
- G01N33/00—Investigating or analysing materials by specific methods not covered by groups G01N1/00 - G01N31/00
- G01N33/02—Food
- G01N33/10—Starch-containing substances, e.g. dough
-
- G—PHYSICS
- G01—MEASURING; TESTING
- G01J—MEASUREMENT OF INTENSITY, VELOCITY, SPECTRAL CONTENT, POLARISATION, PHASE OR PULSE CHARACTERISTICS OF INFRARED, VISIBLE OR ULTRAVIOLET LIGHT; COLORIMETRY; RADIATION PYROMETRY
- G01J3/00—Spectrometry; Spectrophotometry; Monochromators; Measuring colours
- G01J3/28—Investigating the spectrum
- G01J2003/283—Investigating the spectrum computer-interfaced
- G01J2003/2833—Investigating the spectrum computer-interfaced and memorised spectra collection
-
- G—PHYSICS
- G01—MEASURING; TESTING
- G01J—MEASUREMENT OF INTENSITY, VELOCITY, SPECTRAL CONTENT, POLARISATION, PHASE OR PULSE CHARACTERISTICS OF INFRARED, VISIBLE OR ULTRAVIOLET LIGHT; COLORIMETRY; RADIATION PYROMETRY
- G01J3/00—Spectrometry; Spectrophotometry; Monochromators; Measuring colours
- G01J3/28—Investigating the spectrum
- G01J2003/283—Investigating the spectrum computer-interfaced
- G01J2003/2843—Processing for eliminating interfering spectra
-
- G—PHYSICS
- G01—MEASURING; TESTING
- G01J—MEASUREMENT OF INTENSITY, VELOCITY, SPECTRAL CONTENT, POLARISATION, PHASE OR PULSE CHARACTERISTICS OF INFRARED, VISIBLE OR ULTRAVIOLET LIGHT; COLORIMETRY; RADIATION PYROMETRY
- G01J3/00—Spectrometry; Spectrophotometry; Monochromators; Measuring colours
- G01J3/28—Investigating the spectrum
- G01J2003/2866—Markers; Calibrating of scan
- G01J2003/2869—Background correcting
-
- G—PHYSICS
- G01—MEASURING; TESTING
- G01J—MEASUREMENT OF INTENSITY, VELOCITY, SPECTRAL CONTENT, POLARISATION, PHASE OR PULSE CHARACTERISTICS OF INFRARED, VISIBLE OR ULTRAVIOLET LIGHT; COLORIMETRY; RADIATION PYROMETRY
- G01J3/00—Spectrometry; Spectrophotometry; Monochromators; Measuring colours
- G01J3/28—Investigating the spectrum
- G01J2003/2866—Markers; Calibrating of scan
- G01J2003/2873—Storing reference spectrum
-
- G—PHYSICS
- G01—MEASURING; TESTING
- G01N—INVESTIGATING OR ANALYSING MATERIALS BY DETERMINING THEIR CHEMICAL OR PHYSICAL PROPERTIES
- G01N2201/00—Features of devices classified in G01N21/00
- G01N2201/12—Circuits of general importance; Signal processing
- G01N2201/121—Correction signals
-
- G—PHYSICS
- G01—MEASURING; TESTING
- G01N—INVESTIGATING OR ANALYSING MATERIALS BY DETERMINING THEIR CHEMICAL OR PHYSICAL PROPERTIES
- G01N2201/00—Features of devices classified in G01N21/00
- G01N2201/12—Circuits of general importance; Signal processing
- G01N2201/129—Using chemometrical methods
- G01N2201/1293—Using chemometrical methods resolving multicomponent spectra
Definitions
- the invention relates in general to the field of characterization of a sample by spectrometry.
- the invention relates to a method and a characterization device to determine a corrected spectrum of a sample from an initial measured spectrum of the sample performed through a translucent material such as a transparent packaging.
- the corrected spectrum is then able to be introduced into a characterization model to perform classification or quantification operations on the sample.
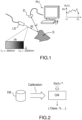
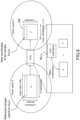
- the optical properties of a sample are determined by measuring the intensity I0 incident on the sample S, and the intensity I transmitted or reflected by the sample, for a plurality of wavelengths inside a specific range [ ⁇ 1 ; ⁇ 2], as shown on figure 1 in the case of a reflective sample S.
- the interaction between the light and the sample permits the characterization of the sample.
- the different wavelengths are generated by a light source LS, and the reflected (or transmitted) intensity is measured on a detector D.
- a processing unit PU calculates the spectrum Ss( ⁇ ) corresponding to a signal, dependant on A, determined from the ratio between I and I0 or its inverse.
- the reflection opacity O R ( ⁇ ) is defined as 1/R
- the transmission opacity O t ( ⁇ ) is defined as 1/T.
- the absorbance As( ⁇ ) is defined as:
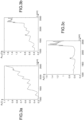
- the measured spectrum Ss( ⁇ ) is then used as an input into a characterization model CM in order for example to classify the sample or to quantify a particular compound of the sample.
- classification is the determination of the category of a flour sample among a plurality of predetermined categories of flours.
- quantification are: humidity level in a flour, quantification of gluten in a flour, percentage of cotton in a fabric...
- Another possibility is to perform a classification of the sample by determining if a compound present in the sample is below or above a threshold. All these types of characterization models are commonly defined as classification/quantification models.
- the characterization models are based on a reference database DB of a substantial number of measured spectra of reference samples, of the different categories (classification) or having a different percentage of the compound to quantify (quantification).
- the reference spectra of the database are used to calibrate the model, based for example on well known model such as partial least square discrimination (PLS-DA), Support Vector Machine (SVM), Linear Discriminant Analysis (LDA) or k Nearest Neighbours (kNN).
- PLS-DA partial least square discrimination
- SVM Support Vector Machine
- LDA Linear Discriminant Analysis
- kNN k Nearest Neighbours
- the models are trained using both reference spectra of the database and associated information related to the known class of the sample. For each type of model, different criteria are optimized in order to estimate the statistical properties of each class.
- the developed model CM is capable of extracting searched information such as class, quantified parameter...on the basis of an unknown spectrum, used as input, as illustrated on figure 2 .
- Some preprocessing can be applied to the raw spectrum before being injected into the model, such as moving average smoothing, to improve the signal to noise ratio in order to reduce the effect caused by the variability of samples.
- the characterization model is only able to determine the searched information from a spectrum of a sample which is similar to the reference spectra of the database, that is to say that the measurement of the spectrum of the sample may be performed in a manner as close as possible to that used to measure the reference spectra of the reference samples.
- a transparent or translucent material such as a packaging or a window. This may be the case for example for food, fabrics, or any kind of industrial product once packaged.
- a transparent or translucent material such as a packaging or a window.
- Such packaging typically comprises plastic materials, such as polyethylene (PE), polypropylene (PP), polyethylene terephtalate (PET).
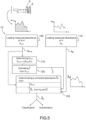
- Figure 3 illustrates the influence of a PP packaging on the absorbance of a coconut flour (reflective type sample) in the IR spectrum.
- Figure 3a shows the measured absorbance of the flour alone A s ( ⁇ )
- figure 3b shows the measured absorbance of the flour through the packaging A s+p ( ⁇ )
- figure 3c the measured absorbance of the packaging alone A p ( ⁇ ).
- the packaging alone has been measured the same way as the flour, by replacing the flour by a material having a uniform reflectivity across the IR spectrum.
- Each spectrum comprises an average of 30 measurements.
- the inventors have developed a model of classification of eight types of flours. 15 measurements of each type of flour have been performed with the flour alone that is to say in the absence of packaging material, to generate the database for the classification model (120 measurements). Based on the measurements of the database, a classification model was built, capable of identifying any sample flour of one the eight types from the measured absorbance of the sample flour alone. In this particular case, the classification model was developed using a kNN type model.
- PE1 and PE2 Two physically different packaging types, composed of polyethylene (PE), are respectively named PE1 and PE2
- the error rate of the model becomes:
- a first classification model is built from a database of spectra of apples without packaging, and a second model is built from a database of spectra of apples with packaging. The performances of the two models are compared, but this publication does not try to explain nor suppress the packaging effect.
- Document US 2009/0321646 A1 discloses a method for assessing at least one characteristic of a fluid held in a container using near IR-visible spectroscopy.
- Document US 5 614 718 A discloses a method and apparatus for rapid estimation of the gas concentration within the headspace of a production beverage container containing carbonated beverage. The method includes preparing a prediction model base on correlation between IR spectra.
- Document US 6122052 discloses a spectrometric instrument passing flashing light through a sample and having a linear detector operated by the computer to integrate signals for an established number of flashes to obtain an integrated unit of the signal data.
- Document US 20120014572 discloses a method and apparatus for obtaining a color mapping of an object in three wavelength bands and calculating interpolated image data values proportional to the spectral reflectance of the object.
- Document US 20130297254 discloses a spectrometer for identifying a mixture based on a correlation matrix and a correlation vector.
- a characterization device for characterizing a sample as defined in appended claim 11.
- the characterization device further comprises a modelling unit configured to implement a characterization model developed from a reference database of spectra of reference samples, said characterisation model using the corrected spectrum of the sample as input, and delivering a classification of the sample or a classification or a quantification of a compound present in the sample.
- the characterization device further comprises a data structuring module configured for structuring the corrected sample spectrum based on a principal component analysis, said data structuring module generating a structured corrected sample spectrum, thereby reducing the number of wavelengths of the measurement into a reduced number of variables, said structured corrected sample spectrum being the input of an improved characterization model developed from the reference database, said improved characterization model delivering a classification of the sample or a classification or a quantification of a compound present in the sample in place of said classification model.
- a data structuring module configured for structuring the corrected sample spectrum based on a principal component analysis, said data structuring module generating a structured corrected sample spectrum, thereby reducing the number of wavelengths of the measurement into a reduced number of variables, said structured corrected sample spectrum being the input of an improved characterization model developed from the reference database, said improved characterization model delivering a classification of the sample or a classification or a quantification of a compound present in the sample in place of said classification model.
- said measured optical spectra are expressed as absorbance.
- the corrected spectrum of the sample is determined by subtracting the corrected spectrum of the solid translucent material from the measured optical spectrum of the sample through the solid translucent material.
- the predetermined relationship is a linear function.
- the method comprises a previous step of measuring the measured optical spectrum of the sample through the solid translucent material.
- the method comprises a step of implementing a characterization model corresponding to a classification model or a quantification model, and using the corrected spectrum as input.
- the method comprises a step of structuring the corrected spectrum of the sample based on a principal component analysis to generate a structured corrected sample spectrum, thereby reducing the number of wavelengths of the measurement into a reduced number of variables.
- Figure 4 shows the path of the light in a spectral measurement of a sample S through a translucent material P, which may be a plastic packaging or a window, and the corresponding intensities: figure 4a for the reflective case, figure 4b for the transmissive case, in the case where the light passes twice through the material, and 4c for the transmissive case, in the case where the light passes once through the material.
- the light first passes through the material P, then through the sample S, then through the material P again (for reflective or transmissive of figure 4b ) before reaching the detector D. In transmission, it is also possible for the light to only pass once through P.
- the optical measurement is performed through a translucent material distorting the optical measurement, that is to say, that a transparent material is placed in the light path between the light source and the detector, in addition of the sample.
- the translucent material may be placed in contact with the sample. This is the case for plastic packaging of dishes. Air may be present between the translucent material and the sample, which is the case when the sample has an enclosure and is measurement through a window.
- the translucent material is a solid material.
- the optical measurement it is needed for a translucent material to permit the light to go through the material, and the material may also be transparent.
- the measurement can be performed on a reflective sample by reflection or a transparent or translucent sample by transmission.
- the absorbance A( ⁇ ) is used as the signal for the spectrum S( ⁇ ), but other definitions (such as transmittance, reflectance or opacity) of the spectrum could have been used.
- the absorbance A p may be defined as the absorbance corresponding to a one way passage of the light through it or a two way, "there and back" passage.
- a p the absorbance corresponding to the contribution of the translucent material for the measurement (there and back or one way, depending of the configuration of the measurement).
- the light is affected by absorption by the molecular vibrations of the sample/material P molecules, and in a first approximation each wavelength is assumed to be independent of the others.
- the aim is to determine an estimated measured spectrum of the sample alone (meaning without the presence of a translucent material) named ⁇ s ( ⁇ ), from the measurements of A s+p and A p , as close as possible to the "real" measured spectrum A s of the sample alone.
- a tool to evaluate the performance of an estimator ⁇ s is provided to calculate an indicator such as the root mean square error or RMSE.
- an indicator such as the root mean square error or RMSE.
- ⁇ i is the ith wavelength indexed from 1 to m, corresponding to the wavelengths used during the measurement.
- the absolute value of the RMSE obtained for a determined estimator ⁇ s is an imperfect indicator of the estimator quality, however the RMSE is useful to compare different estimators with one other.
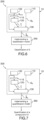
- Figure 5 illustrates the method 100 for determining a corrected spectrum ⁇ s of a sample S to characterize according to the scope of protection, as defined in appended claim 1.
- a measured spectrum A s+p of the sample performed through a translucent material P is loaded.
- the translucent material has a chemical type, a certain thickness, and may present different physical aspects.
- the measure of the spectrum was performed by an optical measurement, the optical measurement being distorted by the presence of a translucent material positioned on the light path.
- the spectrum is defined as a signal, dependant on the wavelength, arriving on the detector after passing through the translucent material and the sample.
- a measured spectrum of the translucent material alone A p is loaded.
- This spectrum A p is obtained by a measurement made in a comparable or equivalent way as the measured optical spectrum (A S+P ) of said sample spectrum or may be available from a database DBP insofar as its chemical type is known.
- the two measured spectra A s+p and A p may be performed in the same conditions, the same configuration, and with the same apparatus.
- the measurement of A p may be realized by replacing the sample S by a neutral reflecting material in the optical range of the measurement.
- the measurement of A p may be realized by simply removing the sample S.
- some preprocessing such as smoothing or averaging may be applied to the measured spectrum.
- the spectral range for the measurement is visible ([0.4 ⁇ m; 0.8 ⁇ m]), and/or near IR (for example included in [0.8; 3 ⁇ m]), and/or another bandwidth in the IR.
- the method comprises a third step 115 of determining a spectral energy E s+p of the measured spectrum A s+p of the sample through the translucent material.
- the spectral energy E s+p is proportional to the integration on wavelength of A s+p :
- the method comprises a fourth step 120 consisting of estimating a coefficient ⁇ from the spectral energy E s+p of the measured spectrum A s+p of the sample performed through a translucent material P.
- the method further comprises a step 130 of determining the corrected spectrum ⁇ s of the sample from the measured spectrum A s+p of the sample and from a corrected spectrum of the translucent material ⁇ p .
- the corrected spectrum of the translucent material ⁇ p is determined from the measured spectrum of the translucent material A p and from the estimated coefficient ⁇ .
- a coefficient ⁇ permitting the correction of the effect of the presence of the translucent material P during the spectrum measurement can be related to the spectral energy of the distorted measurement.
- the corrected spectrum ⁇ s is a spectrum obtained from the loaded measured spectrum A s+p but being less distorted by the presence of the material P during the measurement. This is possible because the spectrum A p of the material has been predetermined and loaded.
- the spectrum Ap may be either measured, or be loaded from a material database. In this last case, the chemical type of the material P has to be known.
- the estimated coefficient ⁇ permits to determine a corrected spectrum of the translucent material ⁇ p which is itself used to correct the measured spectrum As+p.
- the corrected spectrum ⁇ s may be used for classification of the sample, or classification or quantification of a compound present in the sample as explained below.
- the fact that the spectrum has been corrected will decrease the error rate due the presence of the material P during the measurement of classification/quantification models using the spectrum as input, as described in the background.
- the measured spectra A s+p and A p are expressed as absorbance defined by formula (1) (or formula (2)), depending on the context and in a consistent way.
- the corrected spectrum of the translucent material ⁇ p is determined from the product of the estimated coefficient ⁇ by the measured spectrum of the translucent material A p :
- a ⁇ p ⁇ ⁇ A p
- the coefficient ⁇ in formula (3) such as the corrected spectrum ⁇ s of the sample is determined by subtracting the corrected spectrum of the translucent material ⁇ p from the measured spectrum A s+p of the sample through the translucent material:
- a ⁇ s A s + p ⁇ ⁇ ⁇ A p
- Formula (10) corresponds to the model described in formula (3) with the adjunction of a coefficient ⁇ into A p in order to better take into account the influence of the material P on the measured spectrum.
- This coefficient according to the invention has a specific relationship R with an intrinsic feature of the measurement itself A s+p via the spectral energy E s+p .
- this spectrum may be used as input into a characterization model.
- a first example of application for the use of ⁇ is a method 200 of classification of a sample S based on the method 10 for determining a corrected spectrum ⁇ s of the sample and further comprising a step 250 of implementing a classification model CM developed from a first reference database DB1 as explained above.
- the classification model CM uses the corrected spectrum ⁇ s of the sample as input, and delivers a classification of the sample. Because the initial spectrum A s+p has been corrected by being transformed into ⁇ s , the error rate of the model CM is decreased.
- An example is the determination of the flour type among 9 different predetermined types.
- a second example of application for the use of ⁇ is a method 300 of quantification of a chemical compound C present in a sample S, based on the method 10 for determining a corrected spectrum ⁇ s of the sample and further comprising a step 350 of implementing a quantification model QM developed from a second reference database DB2.
- the quantification model uses the corrected spectrum ⁇ s of the sample as input, and delivers a quantification of the compound C present in the sample.
- it may be the humidity level or the gluten level in the flour.
- a mixed application is a classification of a sample using a quantification of a compound, the class of sample being determined as a function of the quantification.
- two different classes of flour may be defined depending on the percentage of the compound in the flour, above or below a predetermined threshold.
- PCA principal component analysis
- the departure space vector is the spectral space S containing the measured spectrum as a function of wavelength, that is to say the data matrix DMsr of the spectrum of the reference samples (n reference samples) of the reference database DB which is used to elaborate the characterization model (see figure 2 ).
- the dimension of S is m.
- a PCA algorithm is used on a DMsr containing n samples.
- the arrival vector space is an orthogonal space of dimension I, with l ⁇ m, with new coordinates ⁇ j , defining a new matrix DM' of n "samples" Astr( ⁇ ).
- the analysis in principal components uses different criteria consisting of maximizing the variance of data and of orthogonalizing the resulting coordinates.
- the matrix of coefficient M PCA is representative of the way the data are organized.
- the coefficients highlight the differences between the flours.
- the coefficients may be a weighting factor applied to the values of absorbance of the spectrum of DMs.
- PCA analysis may be used as an analysis and visualization technique. Attention is paid to the new coordinates ⁇ j named "scores”.
- the determined coefficients M PCA (from the data matrix of reference samples DMsr) are used on another matrix.
- a first option is to use them on the measured spectrum A s+p obtained by method 10 as illustrated in figure 8bis to generate a structured spectrum A' s+p ( ⁇ ).
- a new characterization model CMimp is developed taking into account the change of variable from ⁇ to ⁇ as illustrated in figure 9 , and this model CMimp is applied to the spectrum of the sample to be characterized.
- the initial spectrum A s+p ( ⁇ ) has also to be structured by the PCA coefficient before being used as input for CMimp, and is transformed into A' s+p ( ⁇ ).
- the number of variable ⁇ is I, with I ⁇ m, and among those I, only the first 2 or 3 variables may be used for calculation: ⁇ 1, ⁇ 2 ⁇ 3.
- the improved characterization model CMimp delivers a classification of the sample or a classification or a quantification of a compound present in the sample in place of the classification model CM.
- An aspect of the invention is thus a method 10 comprising a step 140 of structuring the corrected sample spectrum ⁇ s ( ⁇ ) based on a principal component analysis PCA, to generate a structured corrected sample spectrum ⁇ str ( ⁇ ) in order to reduce the plurality of wavelengths ⁇ i (i between 1 and m) of the measurement into an lower number of variables ⁇ 1, ⁇ 2, ⁇ 3.
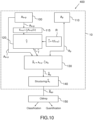
- the example of figure 10 illustrates the particular embodiment of formula (5).
- the additional step 140 of structuring ⁇ s may be included in a characterization method 400 using an adapted characterization model CMimp, implemented in a step 150, also illustrated in figure 10 .
- the characterization model may be a classification or a quantification model.
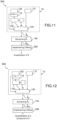
- Figure 11 illustrates an additional step 140 of structuring ⁇ s included in a classification method 500 using an adapted classification model CIMimp, implemented in a step 255.
- Figure 12 illustrates an additional step 140 of structuring ⁇ s included in a quantification method 600 using an adapted quantification model QMim, implemented in a step 355.
- k samples Sk among the j samples Sj are chosen, k ⁇ j, on specific criteria.
- For those chosen reference samples Sk in a measured spectrum A s+p (k) through the translucent material P of a known chemical nature is performed.
- an optimized coefficient ⁇ opt (k) is determined minimizing an error between A s+p (k)- ⁇ A p on one side and A s (k) on the other side. This calculation can be performed because for those samples Sk both A s+p and A s are known.
- a fourth step the cloud of points Pk with Pk having the coordinates: ⁇ E s+p (k), ⁇ opt (k) ⁇ is considered.
- This cloud of points provides a picture of the link between the optimized coefficient and the spectral energy for a certain number of samples.
- This method permits the establishment of a law based on practical measurement and representative of the effect of the material P corrupting the measurement, and thus the correction of such effect via the estimated coefficient ⁇ .
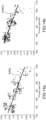
- Figure 14 illustrates the cloud points obtained in the flour example, figure 14a for PE as the translucent material and figure 14b for PET as P material.
- each point on the figures 14a and 14b corresponds to the ⁇ E, y ⁇ coordinates of each measurement of each flour (leading to 240 points for each regression plot).
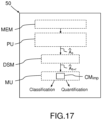
- the invention concerns a characterization device 50 for characterizing a sample S illustrated on figure 15 .
- the device comprises a memory MEM storing a measured spectrum A s+p of the sample S, performed through a translucent material P, and a measured spectrum of the translucent material A p .
- This spectrum A p may be obtained by a measurement made the same way as the sample spectrum or may be available from a database DBP insofar as its chemical type is known.
- the device 50 further comprises a processing unit PU configured to:
- the corrected spectrum of the translucent material ⁇ p is determined from the measured spectrum of the translucent material A p and from the estimated coefficient ⁇ .
- the corrected spectrum of the sample ⁇ s is intended to be used for classification of the sample, or classification or quantification of a compound present in the sample.
- the characterization device 50 further comprises a modelling unit MU configured to implement a characterization model CM developed from a reference database DB, using the corrected spectrum ⁇ s of the sample as input.
- the modelling unit delivers a classification of the sample or a classification or a quantification of a compound present in the sample.
- the characterization device 50 further comprises a data structuring module DSM, as illustrated in figure 17 , the DSM being configured for structuring the corrected sample spectrum ⁇ s based on a principal component analysis such as PCA, in order to generate a structured corrected sample spectrum ⁇ str .
- This structuring reduces the plurality of wavelengths ⁇ i of the measurement into an lower number of variables such as ⁇ 1, ⁇ 2 ⁇ 3.
- the structured corrected sample spectrum ⁇ str is the input of a improved characterization model CMimp developed from a reference database DB and taking into account the structuration of ⁇ str .
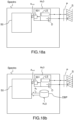
- the invention concerns a spectrophotometer Spectro as illustrated in figure 18a and comprising:
- the spectrometer Spectro is thus capable of measuring the spectrum of the sample S through a material P which may degrade the measurement, and performing an accurate characterization of the sample despite the presence of the material P during the measurement.
- the spectrum of the translucent material A p is measured the same way as the sample, with the light source LS, the detector D and the calculation module. In this case it is not necessary to know the chemical type of the translucent material.
- the chemical type of the translucent material P is identified, and the spectrum Ap is loaded from a material database DBP, which can be either included in Spectro, as shown in figure 18b , or located in a different element.
- the measuring device MeD, the characterization device 50 and the material database DBP may be located in different elements and used together in any combination.
- MeD may be linked to a computer Comp via an I/O interface 900, the characterization device 50 and the material database DBP being located in the computer, as illustrated in figure 19 ; part of the calculation module 501 may also be located in the characterization device.
- characterization device 50 and/or material database DBP may be located in a remote server 76 linked via internet 75 to the communication subsystem 720 of a computer Comp, as illustrated in figure 20 .
- the disclosed methods 10, 200, 300, 400, 500, 600 can take form of an entirely hardware embodiment (e.g. FPGA), an entirely software embodiment (for example to control a device according to the invention) or an embodiment containing both hardware and software elements.
- Software embodiments include but are not limited to firmware, resident software, microcode, etc.
- embodiments of the invention can take the form of a computer program product accessible from a computer-usable or computer-readable medium providing program code for use by or in connection with a computer or an instruction execution system.
- a computer-usable or computer-readable embodiment can be any apparatus that can contain, store, communicate, propagate, or transport the program for use by or in connection with the instruction execution system, apparatus, or device.
- the medium can be an electronic, magnetic, optical, electromagnetic, infrared, or semiconductor system (or apparatus or device) or a propagation medium.
- the methods described herein may be implemented in whole or part by a user device. These methods and processes may be implemented by computer-application programs or services, an application-programming interface (API), a library, and/or other computer-program product, or any combination of such entities.
- API application-programming interface
- the user device may be a mobile device such as a smart phone or tablet, a computer or any other device with processing capability, such as a robot or other connected device.
- Figure 21 shows a generic computing system suitable for implementation of embodiments of the invention.
- a system includes a logic device 701 and a storage device 702.
- the system may optionally include a display subsystem 711, input subsystem 712, 713, 714, communication subsystem 720, and/or other components not shown.
- Logic device 701 includes one or more physical devices configured to execute instructions.
- the logic device 701 may be configured to execute instructions that are part of one or more applications, services, programs, routines, libraries, objects, components, data structures, or other logical constructs.
- Such instructions may be implemented to perform a task, implement a data type, transform the state of one or more components, achieve a technical effect, or otherwise arrive at a desired result.
- the logic device 701 may include one or more processors configured to execute software instructions. Additionally or alternatively, the logic device may include one or more hardware or firmware logic devices configured to execute hardware or firmware instructions. Processors of the logic device may be single-core or multi-core, and the instructions executed thereon may be configured for sequential, parallel, and/or distributed processing. Individual components of the logic device 701 optionally may be distributed among two or more separate devices, which may be remotely located and/or configured for coordinated processing. Aspects of the logic device 701 may be virtualized and executed by remotely accessible, networked computing devices configured in a cloud-computing configuration.
- Storage device 702 includes one or more physical devices configured to hold instructions executable by the logic device to implement the methods and processes described herein. When such methods are implemented, the state of storage 702 device may be transformed-e.g., to hold different data.
- Storage device 702 may include removable and/or built-in devices.
- Storage device 702 may comprise one or more types of storage device including optical memory (e.g., CD, DVD, HD-DVD, Blu-ray Disc TM , etc.), semiconductor memory (e.g., RAM, EPROM, EEPROM, etc.), and/or magnetic memory (e.g., hard-disk drive, floppy-disk drive, tape drive, MRAM, etc.), among others.
- Storage device may include volatile, nonvolatile, dynamic, static, read/write, read-only, random-access, sequential-access, location-addressable, file-addressable, and/or content-addressable devices.
- the system may comprise an I/O interface 703 adapted to support communications between the Logic device 701 and further system components.
- additional system components may comprise removable and/or built-in extended storage devices.
- Extended storage devices may comprise one or more types of storage devices including optical memory 732 (e.g., CD, DVD, HD-DVD, Blu-ray Disc TM , etc.), semiconductor memory 733 (e.g., RAM, EPROM, EEPROM, FLASH etc.), and/or magnetic memory 731 (e.g., hard-disk drive, floppy-disk drive, tape drive, MRAM, etc.), among others.
- Such extended storage device may include volatile, nonvolatile, dynamic, static, read/write, read-only, random-access, sequential-access, location-addressable, file-addressable, and/or content-addressable devices.
- storage device includes one or more physical devices, and excludes propagating signals per se.
- aspects of the instructions described herein alternatively may be propagated by a communication medium (e.g., an electromagnetic signal, an optical signal, etc.), as opposed to being stored on a storage device.
- a communication medium e.g., an electromagnetic signal, an optical signal, etc.
- logic device 701 and storage device 702 may be integrated together into one or more hardware-logic components.
- Such hardware-logic components may include field-programmable gate arrays (FPGAs), program- and application-specific integrated circuits (PASIC/ASICs), program- and application-specific standard products (PSSP/ASSPs), system-on-a-chip (SOC), and complex programmable logic devices (CPLDs), for example.
- FPGAs field-programmable gate arrays
- PASIC/ASICs program- and application-specific integrated circuits
- PSSP/ASSPs program- and application-specific standard products
- SOC system-on-a-chip
- CPLDs complex programmable logic devices
- program may be used to describe an aspect of computing system implemented to perform a particular function. In some cases, a program may be instantiated via logic device executing machine-readable instructions held by storage device. It will be understood that different modules may be instantiated from the same application, service, code block, object, library, routine, API, function, etc. Likewise,
- system of figure 21 may be used to implement embodiments of the invention.
- a program implementing the steps described with respect to figures 5 , 6 , 7 , 10 , 11, or 12 may be stored in storage device 702 and executed by logic device 701.
- the material database DBP, the predetermined relationship R and the PCA coefficients needed for structuring may be stored in storage device 702 or the extended storage devices 732, 733 or 731.
- the Logic device may cause the camera 716 or Near Field interface 721 to send an order to the measurement device MeD to proceed with a measurement A s+p of a spectrum to characterize.
- Figure 22 shows a computer device Comp adaptable to constitute an embodiment.
- the computer device incorporates elements 701, 702, 703, 720, 730, 732, 714, 715, 716 as described above. It is in communication with elements 717, 712 and 713 as peripheral devices which may also be incorporated in the same computer device, and with a server 76 via the network 75.
- elements 733, 721 and 74 are omitted, and element 711 is an ordinary display with or without touchscreen functionality.
- the invention relates to a computer program adapted to implement the steps of the method as claimed.
- the invention relates to a computer readable medium incorporating the computer program.
Landscapes
- Physics & Mathematics (AREA)
- Spectroscopy & Molecular Physics (AREA)
- General Physics & Mathematics (AREA)
- Health & Medical Sciences (AREA)
- Chemical & Material Sciences (AREA)
- Life Sciences & Earth Sciences (AREA)
- Immunology (AREA)
- Analytical Chemistry (AREA)
- Biochemistry (AREA)
- General Health & Medical Sciences (AREA)
- Pathology (AREA)
- Engineering & Computer Science (AREA)
- Food Science & Technology (AREA)
- Theoretical Computer Science (AREA)
- Mathematical Physics (AREA)
- Medicinal Chemistry (AREA)
- Human Computer Interaction (AREA)
- Investigating Or Analysing Materials By Optical Means (AREA)
Claims (14)
- Verfahren (10) zur Bestimmung eines korrigierten Spektrums (ÂS) einer Probe (S), umfassend die folgenden Schritte:- Laden (100) eines gemessenen optischen Spektrums (AS+P) der Probe, das durch ein festes durchsichtiges Material (P) innerhalb des Spektralbereichs von Interesse durchgeführt wurde,- Laden (110) eines gemessenen optischen Spektrums des festen durchsichtigen Materials allein (AP), ermittelt durch eine Messung, die auf vergleichbare oder äquivalente Art und Weise wie das gemessene optische Spektrum (AS+P) der Probe erfolgt,- Bestimmen (115) einer spektralen Energie (ES+P) des gemessenen optischen Spektrums (AS+P) der Probe durch das feste durchsichtige Material (P), wobei die spektrale Energie proportional zur Integration (
 - Schätzen (120) eines Koeffizienten (γ̂) aus einer Verbindung (R) zwischen der spektralen Energie (ES+P) des gemessenen optischen Spektrums (AS+P) der Probe, die durch das feste durchsichtige Material ausgeführt wird, und dem geschätzten Koeffizienten (γ̂), wobei die Verbindung (R) basierend auf einer Datenbank (BD) von Referenzproben vorbestimmt ist,- Bestimmen (130) des korrigierten Spektrums (ÂS) der Probe aus dem gemessenen optischen Spektrum (AS+P) der Probe und aus einem korrigierten Spektrum des festen durchsichtigen Materials (ÂP),das korrigierte Spektrum des festen durchsichtigen Materials (ÂP) aus einem Produkt des gemessenen optischen Spektrums des festen durchsichtigen Materials allein (AP) und des geschätzten Koeffizienten (γ̂) bestimmt wird, undein gemessenes optisches Spektrum, das ein Signal ist, das von einer Wellenlänge in einem Spektralbereich von Interesse abhängig ist.
 - Verfahren (10) nach Anspruch 1, wobei die gemessenen optischen Spektren als Absorption ausgedrückt werden.
- Verfahren (10) nach Anspruch 1 bis 2, wobei das korrigierte Spektrum (ÂS) der Probe durch Subtrahieren des korrigierten Spektrums des festen durchsichtigen Materials (ÂP) von dem gemessenen optischen Spektrum (AS+P) der Probe, das durch das feste durchsichtige Material ausgeführt wurde, bestimmt wird.
- Verfahren nach den Ansprüchen 1 bis 3, wobei die vorbestimmte Verbindung (R) eine lineare Funktion ist.
- Verfahren nach den Ansprüchen 1 bis 4, umfassend einen vorhergehenden Schritt der Messung des gemessenen optischen Spektrums (AS+P) der Probe, der durch das feste durchsichtige Material ausgeführt wird.
- Verfahren nach den Ansprüchen 1 bis 5, umfassend einen Schritt (250, 350) der Implementierung eines Charakterisierungsmodells (CM), das einem Klassifizierungsmodell oder einem Quantifizierungsmodell entspricht, und die Verwendung des korrigierten Spektrums (ÂS) der Probe als Eingabe.
- Verfahren (10) nach den Ansprüchen 1 bis 5, umfassend einen Schritt (140) der Strukturierung des korrigierten Spektrums (ÂS) der Probe basierend auf einer Hauptkomponentenanalyse (PCA), um ein strukturiertes korrigiertes Probenspektrum (Âstr) zu erstellen, wodurch die Anzahl der Wellenlängen (λi) der Messung auf eine niedrigere Anzahl von Variablen (µ1, µ2 µ3) verringert wird.
- Verfahren zur Charakterisierung (400, 500, 600) einer Probe, umfassend ein Verfahren (10) zum Bestimmen eines korrigierten Spektrums der Probe nach Anspruch 7 und ferner umfassend einen Schritt der Implementierung (150) eines verbesserten Charakterisierungsmodells (CMimp) unter Verwendung des strukturierten korrigierten Probenspektrums (Âstr) als Eingabe.
- Computerprogramm, das Anweisungen umfasst, die, wenn das Computerprogramm von einer Verarbeitungseinheit (PU) ausgeführt wird, die Verarbeitungseinheit (PU) veranlassen, die Schritte von einem der Ansprüche 1 bis 8 zu implementieren.
- Computerlesbares Medium, das das Computerprogramm nach Anspruch 9 integriert.
- Charakterisierungsvorrichtung (50) zum Charakterisieren einer Probe (S), die Vorrichtung umfassend:- das computerlesbare Medium nach Anspruch 10,- einen Speicher (MEM) zum Speichern eines gemessenen optischen Spektrums (AS+P) der Probe, das durch ein festes durchsichtiges Material ausgeführt wurde, wobei das feste durchsichtige Material innerhalb des Spektralbereichs von Interesse durchsichtig ist, und zum Speichern eines gemessenen optischen Spektrums des festen durchsichtigen Materials allein (AP), ermittelt durch eine Messung, die auf vergleichbare oder äquivalente Art und Weise wie das gemessene optische Spektrum (AS+P) der Probe erfolgt,- eine Verarbeitungseinheit (PU), die konfiguriert ist, die Anweisungen des Computerprogramms auszuführen, zum:• Bestimmen einer spektralen Energie (ES+P) des gemessenen optischen Spektrums (AS+P) der Probe durch das feste durchsichtige Material (AS+P), wobei die spektrale Energie proportional zur Integration (
 • Schätzen eines Koeffizienten (γ̂) aus der spektralen Energie (ES+P) und,• Bestimmen eines korrigierten Spektrums (ÂS) der Probe aus dem gemessenen optischen Spektrum (AS+P) der Probe durch das feste durchsichtige Material und aus einem korrigierten Spektrum des festen durchsichtigen Materials (ÂP),wobei das korrigierte Spektrum des festen durchsichtigen Materials (ÂP) bestimmt wird aus einemProdukt aus dem gemessenen optischen Spektrum des festen durchsichtigen Materials (ÂP) und dem geschätzten Koeffizienten (γ̂), und wobei ein gemessenes optisches Spektrum ein Signal ist, das von einer Wellenlänge in einem Spektralbereich von Interesse abhängig ist.
 - Charakterisierungsvorrichtung (50) nach Anspruch 11, dadurch gekennzeichnet, dass sie ferner eine Modellierungseinheit (MU) umfasst, die konfiguriert ist, ein Charakterisierungsmodell (CM) zu implementieren, das aus einer Referenzdatenbank (DB) von Spektren von Referenzproben entwickelt wurde, wobei das genannte Charakterisierungsmodell das korrigierte Spektrum (ÂS) der Probe als Eingabe verwendet und eine Klassifizierung der Probe oder eine Klassifizierung oder eine Quantifizierung einer Verbindung, die in der Probe vorliegt, liefert.
- Charakterisierungsvorrichtung (50) nach Anspruch 12, dadurch gekennzeichnet, dass sie ein Datenstrukturierungsmodul (DSM) umfasst, das für die Strukturierung des korrigierten Spektrums (ÂS) der Probe basierend auf einer Hauptkomponentenanalyse (PCA) konfiguriert ist, wobei das Datenstrukturierungsmodul ein strukturiertes korrigiertes Probenspektrum (Âstr) erstellt, wodurch die Anzahl der Wellenlängen (λi) der Messung auf eine niedrigere Anzahl von Variablen (µ1, µ2 µ3) verringert wird, wobei das strukturierte korrigierte Probenspektrum (Âstr) die Eingabe eines verbesserten Charakterisierungsmodells (CMimp) ist, das aus der Referenzdatenbank (DB) entwickelt wurde, wobei das verbesserte Charakterisierungsmodell eine Klassifizierung der Probe oder eine Klassifizierung oder eine Quantifizierung einer Verbindung, die in der Probe vorliegt, anstelle des Klassifizierungsmodells (CM) liefert.
- Spektrophotometer (Spectro), umfassend:- eine Messvorrichtung (MeD), umfassend:- eine Lichtquelle (LS), die konfiguriert ist, eine Probe (S) zu beleuchten, wobei die genannte Probe durch ein festes durchsichtiges Material (P) beleuchtet wird,- einen Detektor (D), der konfiguriert ist, das Licht festzustellen, das von der Probe reflektiert oder gesendet wird,- ein Berechnungsmodul (501), das konfiguriert ist, ein gemessenes optisches Spektrum (AS+P) der Probe zu erstellen, und- eine Charakterisierungsvorrichtung (50) nach Ansprüchen 11 bis 13.
Priority Applications (4)
| Application Number | Priority Date | Filing Date | Title |
|---|---|---|---|
| EP17305412.3A EP3385703B1 (de) | 2017-04-07 | 2017-04-07 | Verbesserte spektroskopievorrichtung und verfahren zur probencharakterisierung |
| JP2018070588A JP6595652B2 (ja) | 2017-04-07 | 2018-04-02 | サンプル特性評価用の改良分光デバイス及び方法 |
| US15/946,887 US10444142B2 (en) | 2017-04-07 | 2018-04-06 | Spectroscopic device and method for sample characterization |
| CN201810305566.3A CN108760648B (zh) | 2017-04-07 | 2018-04-08 | 用于样本表征的改进的光谱设备和方法 |
Applications Claiming Priority (1)
| Application Number | Priority Date | Filing Date | Title |
|---|---|---|---|
| EP17305412.3A EP3385703B1 (de) | 2017-04-07 | 2017-04-07 | Verbesserte spektroskopievorrichtung und verfahren zur probencharakterisierung |
Publications (3)
| Publication Number | Publication Date |
|---|---|
| EP3385703A1 EP3385703A1 (de) | 2018-10-10 |
| EP3385703B1 true EP3385703B1 (de) | 2024-09-04 |
| EP3385703C0 EP3385703C0 (de) | 2024-09-04 |
Family
ID=58638809
Family Applications (1)
| Application Number | Title | Priority Date | Filing Date |
|---|---|---|---|
| EP17305412.3A Active EP3385703B1 (de) | 2017-04-07 | 2017-04-07 | Verbesserte spektroskopievorrichtung und verfahren zur probencharakterisierung |
Country Status (4)
| Country | Link |
|---|---|
| US (1) | US10444142B2 (de) |
| EP (1) | EP3385703B1 (de) |
| JP (1) | JP6595652B2 (de) |
| CN (1) | CN108760648B (de) |
Families Citing this family (4)
| Publication number | Priority date | Publication date | Assignee | Title |
|---|---|---|---|---|
| FR3094791B1 (fr) * | 2019-04-04 | 2021-07-02 | Greentropism | Procédé pour configurer un dispositif de spectrométrie |
| JP7423343B2 (ja) * | 2020-02-21 | 2024-01-29 | 株式会社熊平製作所 | 液体検査装置および液体検査方法 |
| JP2025033513A (ja) * | 2023-08-29 | 2025-03-13 | 横河電機株式会社 | 分光分析装置及び分光分析方法 |
| CN120253750B (zh) * | 2025-06-09 | 2025-08-26 | 广州市锦东电子科技股份有限公司 | 基于大数据分析的水汽红外光谱湿度修正方法 |
Family Cites Families (16)
| Publication number | Priority date | Publication date | Assignee | Title |
|---|---|---|---|---|
| US5510621A (en) * | 1994-10-03 | 1996-04-23 | Optical Solutions, Inc. | Apparatus and method for measuring components in a bag |
| US5614718A (en) * | 1995-10-03 | 1997-03-25 | Hoover Universal, Inc. | Apparatus and method for noninvasive assessment of pressurized container properties |
| JPH11352057A (ja) * | 1998-04-27 | 1999-12-24 | Perkin Elmer Corp:The | スペクトルメ―タ装置および集積スペクトルメ―タ装置 |
| US8174394B2 (en) * | 2001-04-11 | 2012-05-08 | Trutouch Technologies, Inc. | System for noninvasive determination of analytes in tissue |
| AU2005100565B4 (en) * | 2005-07-12 | 2006-02-02 | The Australian Wine Research Institute | Non-destructive analysis by VIS-NIR spectroscopy of fluid(s) in its original container |
| CN100414272C (zh) * | 2005-07-26 | 2008-08-27 | 潘建根 | 一种光谱解析校正的积分式光辐射度测量系统和方法 |
| US8208704B2 (en) * | 2010-07-13 | 2012-06-26 | Carestream Health, Inc. | Dental shade mapping |
| US8645082B2 (en) * | 2010-09-13 | 2014-02-04 | Mks Instruments, Inc. | Monitoring, detecting and quantifying chemical compounds in a sample |
| EP2750912A4 (de) * | 2011-08-29 | 2015-06-03 | Automotive Coalition For Traffic Safety Inc | System zur nicht-invasiven messung eines analyten bei einem fahrzeuglenker |
| US20130297254A1 (en) * | 2012-05-04 | 2013-11-07 | Morpho Detection, Inc. | Systems and methods for identifying a mixture |
| JP2015057591A (ja) * | 2013-08-09 | 2015-03-26 | 株式会社島津製作所 | 懸濁液中の懸濁物濃度の分析方法および分析装置 |
| CN104596640A (zh) * | 2015-01-08 | 2015-05-06 | 杭州远方光电信息股份有限公司 | 一种光信号接收器 |
| US10422754B2 (en) * | 2015-03-05 | 2019-09-24 | Khalifa University of Science and Technology | Online measurement of black powder in gas and oil pipelines |
| CN105466908B (zh) * | 2015-12-31 | 2018-04-20 | 安徽芯核防务装备技术股份有限公司 | 一种样品瓶固定干扰噪声的拉曼光谱去除方法 |
| CN105938013B (zh) * | 2016-04-20 | 2019-12-17 | 杭州远方光电信息股份有限公司 | 一种光谱仪及其校正方法 |
| CN106124451B (zh) * | 2016-08-31 | 2019-09-27 | 上海创和亿电子科技发展有限公司 | 一种透过包装袋在线近红外检测的修正系统及检测的方法 |
-
2017
- 2017-04-07 EP EP17305412.3A patent/EP3385703B1/de active Active
-
2018
- 2018-04-02 JP JP2018070588A patent/JP6595652B2/ja not_active Expired - Fee Related
- 2018-04-06 US US15/946,887 patent/US10444142B2/en active Active
- 2018-04-08 CN CN201810305566.3A patent/CN108760648B/zh active Active
Also Published As
| Publication number | Publication date |
|---|---|
| US10444142B2 (en) | 2019-10-15 |
| CN108760648A (zh) | 2018-11-06 |
| EP3385703A1 (de) | 2018-10-10 |
| EP3385703C0 (de) | 2024-09-04 |
| US20180299373A1 (en) | 2018-10-18 |
| JP6595652B2 (ja) | 2019-10-23 |
| JP2018179982A (ja) | 2018-11-15 |
| CN108760648B (zh) | 2022-01-04 |
Similar Documents
| Publication | Publication Date | Title |
|---|---|---|
| Kartakoullis et al. | Feasibility study of smartphone-based Near Infrared Spectroscopy (NIRS) for salted minced meat composition diagnostics at different temperatures | |
| Ye et al. | Non-destructive prediction of protein content in wheat using NIRS | |
| EP3385703B1 (de) | Verbesserte spektroskopievorrichtung und verfahren zur probencharakterisierung | |
| Yu et al. | Nondestructive determination of SSC in Korla fragrant pear using a portable near-infrared spectroscopy system | |
| McMullin et al. | Advancements in IR spectroscopic approaches for the determination of fungal derived contaminations in food crops | |
| Bouveresse et al. | Identification of significant factors by an extension of ANOVA–PCA based on multi-block analysis | |
| Xu et al. | Research on nondestructive identification of grape varieties based on EEMD‐DWT and hyperspectral image | |
| US10481081B2 (en) | Texture analysis of a coated surface using pivot-normalization | |
| US20100153048A1 (en) | Design of multivariate optical elements for nonlinear calibration | |
| JP2008539417A (ja) | 分析物の混合物における分析物の量を求める分光法 | |
| US20130197816A1 (en) | Calibration curve creation method, calibration curve creation device and target component determination device | |
| EP2828643B1 (de) | Verfahren und vorrichtung zur probencharakterisierung durch streulicht- und fluoreszenzmessung | |
| US20140297197A1 (en) | Calibration curve creation method, calibration curve creation apparatus, and target component gauging apparatus | |
| Guo et al. | Improving the detection accuracy of the nitrogen content of fresh tea leaves by combining FT-NIR with moisture removal method | |
| Zhao et al. | Hyperspectral imaging coupled with random frog and calibration models for assessment of total soluble solids in mulberries | |
| US11067447B2 (en) | Analysis apparatus, imaging system, and storage medium | |
| JP2018179982A5 (de) | ||
| CN113795748A (zh) | 用于配置光谱测定装置的方法 | |
| Li et al. | New pretreatment methods for visible–near-infrared calibration modeling of air-dry density of Ulmus pumila wood | |
| Markechová et al. | Determination of the adulterants in adulterant–brandy blends using fluorescence spectroscopy and multivariate methods | |
| Liu et al. | Feasibility of nondestructive detection of apple crispness based on spectroscopy and machine vision | |
| JP2013040832A (ja) | 食品判別装置および食品判別方法 | |
| US9423302B2 (en) | Spectroscopic analysis device, spectroscopic analysis method and program for spectroscopic analysis device | |
| CN114544530A (zh) | 一种烟丝成分检测方法、装置及计算机设备 | |
| Boulet et al. | Improvement of direct calibration in spectroscopy |
Legal Events
| Date | Code | Title | Description |
|---|---|---|---|
| PUAI | Public reference made under article 153(3) epc to a published international application that has entered the european phase |
Free format text: ORIGINAL CODE: 0009012 |
|
| STAA | Information on the status of an ep patent application or granted ep patent |
Free format text: STATUS: THE APPLICATION HAS BEEN PUBLISHED |
|
| AK | Designated contracting states |
Kind code of ref document: A1 Designated state(s): AL AT BE BG CH CY CZ DE DK EE ES FI FR GB GR HR HU IE IS IT LI LT LU LV MC MK MT NL NO PL PT RO RS SE SI SK SM TR |
|
| AX | Request for extension of the european patent |
Extension state: BA ME |
|
| STAA | Information on the status of an ep patent application or granted ep patent |
Free format text: STATUS: REQUEST FOR EXAMINATION WAS MADE |
|
| 17P | Request for examination filed |
Effective date: 20190305 |
|
| RBV | Designated contracting states (corrected) |
Designated state(s): AL AT BE BG CH CY CZ DE DK EE ES FI FR GB GR HR HU IE IS IT LI LT LU LV MC MK MT NL NO PL PT RO RS SE SI SK SM TR |
|
| STAA | Information on the status of an ep patent application or granted ep patent |
Free format text: STATUS: EXAMINATION IS IN PROGRESS |
|
| 17Q | First examination report despatched |
Effective date: 20200408 |
|
| GRAP | Despatch of communication of intention to grant a patent |
Free format text: ORIGINAL CODE: EPIDOSNIGR1 |
|
| STAA | Information on the status of an ep patent application or granted ep patent |
Free format text: STATUS: GRANT OF PATENT IS INTENDED |
|
| RIC1 | Information provided on ipc code assigned before grant |
Ipc: G01N 33/10 20060101ALI20230207BHEP Ipc: G01J 3/42 20060101ALI20230207BHEP Ipc: G01J 3/28 20060101ALI20230207BHEP Ipc: G01J 3/02 20060101ALI20230207BHEP Ipc: G01N 21/31 20060101ALI20230207BHEP Ipc: G01N 21/27 20060101AFI20230207BHEP |
|
| INTG | Intention to grant announced |
Effective date: 20230224 |
|
| GRAJ | Information related to disapproval of communication of intention to grant by the applicant or resumption of examination proceedings by the epo deleted |
Free format text: ORIGINAL CODE: EPIDOSDIGR1 |
|
| STAA | Information on the status of an ep patent application or granted ep patent |
Free format text: STATUS: EXAMINATION IS IN PROGRESS |
|
| INTC | Intention to grant announced (deleted) | ||
| RAP3 | Party data changed (applicant data changed or rights of an application transferred) |
Owner name: GREENTROPISM |
|
| GRAP | Despatch of communication of intention to grant a patent |
Free format text: ORIGINAL CODE: EPIDOSNIGR1 |
|
| STAA | Information on the status of an ep patent application or granted ep patent |
Free format text: STATUS: GRANT OF PATENT IS INTENDED |
|
| INTG | Intention to grant announced |
Effective date: 20231122 |
|
| GRAJ | Information related to disapproval of communication of intention to grant by the applicant or resumption of examination proceedings by the epo deleted |
Free format text: ORIGINAL CODE: EPIDOSDIGR1 |
|
| STAA | Information on the status of an ep patent application or granted ep patent |
Free format text: STATUS: EXAMINATION IS IN PROGRESS |
|
| GRAP | Despatch of communication of intention to grant a patent |
Free format text: ORIGINAL CODE: EPIDOSNIGR1 |
|
| STAA | Information on the status of an ep patent application or granted ep patent |
Free format text: STATUS: GRANT OF PATENT IS INTENDED |
|
| INTC | Intention to grant announced (deleted) | ||
| INTG | Intention to grant announced |
Effective date: 20240404 |
|
| GRAS | Grant fee paid |
Free format text: ORIGINAL CODE: EPIDOSNIGR3 |
|
| GRAA | (expected) grant |
Free format text: ORIGINAL CODE: 0009210 |
|
| STAA | Information on the status of an ep patent application or granted ep patent |
Free format text: STATUS: THE PATENT HAS BEEN GRANTED |
|
| AK | Designated contracting states |
Kind code of ref document: B1 Designated state(s): AL AT BE BG CH CY CZ DE DK EE ES FI FR GB GR HR HU IE IS IT LI LT LU LV MC MK MT NL NO PL PT RO RS SE SI SK SM TR |
|
| REG | Reference to a national code |
Ref country code: GB Ref legal event code: FG4D |
|
| REG | Reference to a national code |
Ref country code: CH Ref legal event code: EP |
|
| REG | Reference to a national code |
Ref country code: IE Ref legal event code: FG4D |
|
| REG | Reference to a national code |
Ref country code: DE Ref legal event code: R096 Ref document number: 602017084612 Country of ref document: DE |
|
| U01 | Request for unitary effect filed |
Effective date: 20241004 |
|
| REG | Reference to a national code |
Ref country code: LT Ref legal event code: MG9D |
|
| REG | Reference to a national code |
Ref country code: NL Ref legal event code: MP Effective date: 20240904 |
|
| PG25 | Lapsed in a contracting state [announced via postgrant information from national office to epo] |
Ref country code: NO Free format text: LAPSE BECAUSE OF FAILURE TO SUBMIT A TRANSLATION OF THE DESCRIPTION OR TO PAY THE FEE WITHIN THE PRESCRIBED TIME-LIMIT Effective date: 20241204 |
|
| PG25 | Lapsed in a contracting state [announced via postgrant information from national office to epo] |
Ref country code: PL Free format text: LAPSE BECAUSE OF FAILURE TO SUBMIT A TRANSLATION OF THE DESCRIPTION OR TO PAY THE FEE WITHIN THE PRESCRIBED TIME-LIMIT Effective date: 20240904 Ref country code: GR Free format text: LAPSE BECAUSE OF FAILURE TO SUBMIT A TRANSLATION OF THE DESCRIPTION OR TO PAY THE FEE WITHIN THE PRESCRIBED TIME-LIMIT Effective date: 20241205 |
|
| PG25 | Lapsed in a contracting state [announced via postgrant information from national office to epo] |
Ref country code: HR Free format text: LAPSE BECAUSE OF FAILURE TO SUBMIT A TRANSLATION OF THE DESCRIPTION OR TO PAY THE FEE WITHIN THE PRESCRIBED TIME-LIMIT Effective date: 20240904 |
|
| PG25 | Lapsed in a contracting state [announced via postgrant information from national office to epo] |
Ref country code: ES Free format text: LAPSE BECAUSE OF FAILURE TO SUBMIT A TRANSLATION OF THE DESCRIPTION OR TO PAY THE FEE WITHIN THE PRESCRIBED TIME-LIMIT Effective date: 20240904 |
|
| PG25 | Lapsed in a contracting state [announced via postgrant information from national office to epo] |
Ref country code: PL Free format text: LAPSE BECAUSE OF FAILURE TO SUBMIT A TRANSLATION OF THE DESCRIPTION OR TO PAY THE FEE WITHIN THE PRESCRIBED TIME-LIMIT Effective date: 20240904 Ref country code: NO Free format text: LAPSE BECAUSE OF FAILURE TO SUBMIT A TRANSLATION OF THE DESCRIPTION OR TO PAY THE FEE WITHIN THE PRESCRIBED TIME-LIMIT Effective date: 20241204 Ref country code: HR Free format text: LAPSE BECAUSE OF FAILURE TO SUBMIT A TRANSLATION OF THE DESCRIPTION OR TO PAY THE FEE WITHIN THE PRESCRIBED TIME-LIMIT Effective date: 20240904 Ref country code: GR Free format text: LAPSE BECAUSE OF FAILURE TO SUBMIT A TRANSLATION OF THE DESCRIPTION OR TO PAY THE FEE WITHIN THE PRESCRIBED TIME-LIMIT Effective date: 20241205 Ref country code: ES Free format text: LAPSE BECAUSE OF FAILURE TO SUBMIT A TRANSLATION OF THE DESCRIPTION OR TO PAY THE FEE WITHIN THE PRESCRIBED TIME-LIMIT Effective date: 20240904 |
|
| RAP2 | Party data changed (patent owner data changed or rights of a patent transferred) |
Owner name: SPORE BIOTECHNOLOGIES |
|
| U07 | Unitary effect registered |
Designated state(s): AT BE BG DE DK EE FI FR IT LT LU LV MT NL PT RO SE SI Effective date: 20250115 |
|
| PG25 | Lapsed in a contracting state [announced via postgrant information from national office to epo] |
Ref country code: IS Free format text: LAPSE BECAUSE OF FAILURE TO SUBMIT A TRANSLATION OF THE DESCRIPTION OR TO PAY THE FEE WITHIN THE PRESCRIBED TIME-LIMIT Effective date: 20250104 |
|
| PG25 | Lapsed in a contracting state [announced via postgrant information from national office to epo] |
Ref country code: SM Free format text: LAPSE BECAUSE OF FAILURE TO SUBMIT A TRANSLATION OF THE DESCRIPTION OR TO PAY THE FEE WITHIN THE PRESCRIBED TIME-LIMIT Effective date: 20240904 |
|
| PG25 | Lapsed in a contracting state [announced via postgrant information from national office to epo] |
Ref country code: CZ Free format text: LAPSE BECAUSE OF FAILURE TO SUBMIT A TRANSLATION OF THE DESCRIPTION OR TO PAY THE FEE WITHIN THE PRESCRIBED TIME-LIMIT Effective date: 20240904 |
|
| PG25 | Lapsed in a contracting state [announced via postgrant information from national office to epo] |
Ref country code: SK Free format text: LAPSE BECAUSE OF FAILURE TO SUBMIT A TRANSLATION OF THE DESCRIPTION OR TO PAY THE FEE WITHIN THE PRESCRIBED TIME-LIMIT Effective date: 20240904 |
|
| U20 | Renewal fee for the european patent with unitary effect paid |
Year of fee payment: 9 Effective date: 20250408 |
|
| PGFP | Annual fee paid to national office [announced via postgrant information from national office to epo] |
Ref country code: GB Payment date: 20250423 Year of fee payment: 9 |
|
| PLBE | No opposition filed within time limit |
Free format text: ORIGINAL CODE: 0009261 |
|
| STAA | Information on the status of an ep patent application or granted ep patent |
Free format text: STATUS: NO OPPOSITION FILED WITHIN TIME LIMIT |
|
| PGFP | Annual fee paid to national office [announced via postgrant information from national office to epo] |
Ref country code: CH Payment date: 20250501 Year of fee payment: 9 |
|
| 26N | No opposition filed |
Effective date: 20250605 |