EP3379418A1 - Trace data representation - Google Patents
Trace data representation Download PDFInfo
- Publication number
- EP3379418A1 EP3379418A1 EP18162604.5A EP18162604A EP3379418A1 EP 3379418 A1 EP3379418 A1 EP 3379418A1 EP 18162604 A EP18162604 A EP 18162604A EP 3379418 A1 EP3379418 A1 EP 3379418A1
- Authority
- EP
- European Patent Office
- Prior art keywords
- program instructions
- sequence
- trace
- executed
- branch
- Prior art date
- Legal status (The legal status is an assumption and is not a legal conclusion. Google has not performed a legal analysis and makes no representation as to the accuracy of the status listed.)
- Granted
Links
Images


Classifications
-
- G—PHYSICS
- G06—COMPUTING OR CALCULATING; COUNTING
- G06F—ELECTRIC DIGITAL DATA PROCESSING
- G06F11/00—Error detection; Error correction; Monitoring
- G06F11/30—Monitoring
- G06F11/34—Recording or statistical evaluation of computer activity, e.g. of down time, of input/output operation ; Recording or statistical evaluation of user activity, e.g. usability assessment
- G06F11/3466—Performance evaluation by tracing or monitoring
-
- G—PHYSICS
- G06—COMPUTING OR CALCULATING; COUNTING
- G06F—ELECTRIC DIGITAL DATA PROCESSING
- G06F11/00—Error detection; Error correction; Monitoring
- G06F11/30—Monitoring
- G06F11/34—Recording or statistical evaluation of computer activity, e.g. of down time, of input/output operation ; Recording or statistical evaluation of user activity, e.g. usability assessment
- G06F11/3466—Performance evaluation by tracing or monitoring
- G06F11/348—Circuit details, i.e. tracer hardware
-
- G—PHYSICS
- G06—COMPUTING OR CALCULATING; COUNTING
- G06F—ELECTRIC DIGITAL DATA PROCESSING
- G06F11/00—Error detection; Error correction; Monitoring
- G06F11/36—Prevention of errors by analysis, debugging or testing of software
- G06F11/362—Debugging of software
- G06F11/3636—Debugging of software by tracing the execution of the program
-
- G—PHYSICS
- G06—COMPUTING OR CALCULATING; COUNTING
- G06F—ELECTRIC DIGITAL DATA PROCESSING
- G06F9/00—Arrangements for program control, e.g. control units
- G06F9/06—Arrangements for program control, e.g. control units using stored programs, i.e. using an internal store of processing equipment to receive or retain programs
- G06F9/30—Arrangements for executing machine instructions, e.g. instruction decode
- G06F9/30003—Arrangements for executing specific machine instructions
- G06F9/3005—Arrangements for executing specific machine instructions to perform operations for flow control
- G06F9/30058—Conditional branch instructions
-
- G—PHYSICS
- G06—COMPUTING OR CALCULATING; COUNTING
- G06F—ELECTRIC DIGITAL DATA PROCESSING
- G06F9/00—Arrangements for program control, e.g. control units
- G06F9/06—Arrangements for program control, e.g. control units using stored programs, i.e. using an internal store of processing equipment to receive or retain programs
- G06F9/30—Arrangements for executing machine instructions, e.g. instruction decode
- G06F9/30003—Arrangements for executing specific machine instructions
- G06F9/30072—Arrangements for executing specific machine instructions to perform conditional operations, e.g. using predicates or guards
-
- G—PHYSICS
- G06—COMPUTING OR CALCULATING; COUNTING
- G06F—ELECTRIC DIGITAL DATA PROCESSING
- G06F9/00—Arrangements for program control, e.g. control units
- G06F9/06—Arrangements for program control, e.g. control units using stored programs, i.e. using an internal store of processing equipment to receive or retain programs
- G06F9/30—Arrangements for executing machine instructions, e.g. instruction decode
- G06F9/32—Address formation of the next instruction, e.g. by incrementing the instruction counter
- G06F9/322—Address formation of the next instruction, e.g. by incrementing the instruction counter for non-sequential address
- G06F9/323—Address formation of the next instruction, e.g. by incrementing the instruction counter for non-sequential address for indirect branch instructions
-
- G—PHYSICS
- G06—COMPUTING OR CALCULATING; COUNTING
- G06F—ELECTRIC DIGITAL DATA PROCESSING
- G06F11/00—Error detection; Error correction; Monitoring
- G06F11/36—Prevention of errors by analysis, debugging or testing of software
- G06F11/362—Debugging of software
- G06F11/3648—Debugging of software using additional hardware
-
- G—PHYSICS
- G06—COMPUTING OR CALCULATING; COUNTING
- G06F—ELECTRIC DIGITAL DATA PROCESSING
- G06F2201/00—Indexing scheme relating to error detection, to error correction, and to monitoring
- G06F2201/865—Monitoring of software
-
- G—PHYSICS
- G06—COMPUTING OR CALCULATING; COUNTING
- G06F—ELECTRIC DIGITAL DATA PROCESSING
- G06F2201/00—Indexing scheme relating to error detection, to error correction, and to monitoring
- G06F2201/88—Monitoring involving counting
Definitions
- This disclosure relates to the field of data processing systems. More particularly, this disclosure relates to the representation of trace data corresponding to sequences of executed program instructions within a data processing system.
- trace mechanisms to enable the execution of sequences of program instructions to be analyzed by generating trace data indicative of the execution path through the program instructions followed by the data processing system.
- trace mechanisms are useful, for example, in debug and diagnostic operations performed on increasingly complex data processing systems and their associated programs.
- a challenge arising in the provision of trace mechanisms is that they can produce large volumes of trace data that can be difficult to manage/handle.
- the amount of trace data may be reduced in a variety of different ways.
- the trace data merely gives that information required to follow the execution path through the program when the program itself is available, e.g. indications of executed or not executed outcomes for conditional branch instructions, data dependent changes of program flow and periodic synchronizing address data.
- the trace data may be subject to compression using a variety of compression techniques to reduce the data volume and ease the handling of the trace data. Such compression techniques may be improved in efficiency if the trace data is divided into streams representing different threads of execution (e.g. different threads executed by different processors within a multi-core processor) as there tends to be a higher degree of correlation within a thread enabling a higher degree of compression to be achieved compared with compressing trace data from different interleaved threads.
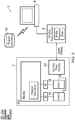
- FIG. 1 schematically illustrates a data processing system 2 using on-chip precursor data formation.
- the data processing system 2 includes a system-on-chip integrated circuitry 4 connected via off-chip trace circuitry 6 to a general purpose programmable computer 8.
- the integrated circuit 4 includes a memory 10 storing program instructions 12 to be executed by processor cores 14, 16.
- Respective cache memories 18, 20 associated with the processor cores 14, 16 store program instructions 12 and data to be manipulated.
- On-chip trace circuitry 22 is coupled to the processor cores 14, 16 and monitors their execution of program instructions.
- the processor cores 14, 16 may provide data indicative of program instruction addresses of program instructions executed by the cores 14, 16 as synchronization points, such as providing synchronization point addresses on a periodic basis.
- the on-chip trace circuitry 22 serves to buffer the data received from the cores 14, 16, and, in this example embodiment, use it to perform on-chip generation of profile precursor data comprising trace objects as will be discussed further below.
- the on-chip trace circuitry 22 receives separate streams of execution characterizing data from the respective cores 14, 16 and these may be separately processed to form respective profile precursor data, i.e. one set of profile precursor data for core 14 and a set of profile precursor data for core 16.
- the on-chip trace circuitry 22 processes the buffered data received from the cores 14, 16 to form trace objects.
- Each trace object represents a sequence of executed program instructions using a start address indicator to indicate a start address of that sequence of executed program instructions, a branch outcome indicator to indicate a sequence of branch outcomes within that sequence of executed program instruction starting from the start address and a count indicator to indicate a count of times the sequence of branch outcomes was detected within the window of execution of program instructions being monitored by the on-chip trace circuitry 22 and represented by the profile precursor data generated.
- the profile precursor data which is generated comprises a plurality of trace objects each representing a sequence of executed program instructions which were observed.
- the trace objects of the profile precursor data may be considered in combination with the program instructions 12 in order that the particular program instructions executed within the sequence of executed program instructions may be identified.
- the profile precursor data alone can be used to give a use count of taken branch instructions their respective branch target addresses.
- the profile precursor data comprising such trace objects permits a compact representation of the execution behaviour to be achieved but may not permit the precise end-to-end flow of execution through the entire window to be determined - rather it generates a more statistically based view of the execution whereby sequences of executed program instructions can be identified together with the number of times such sequences were detected.
- the count indicator may saturate at one thereby giving an indication of whether a particular code sequence has or has not executed at least once.
- a trace object may also include a next address indicator to indicate a starting address of a next sequence of program instructions to be executed following the sequence of executed program instructions of the trace object including that next address indicator.
- a trace object may effectively include link information indicating a following trace object. This can enable recovery of at least some of the information regarding how trace object link together and give a more comprehensive view of the program execution flow.
- the on-chip trace circuitry 22 when analyzing the buffered data received from the cores 14, 16 may serve to break this received data into sequences to be associated with trace objects by using received program instruction address data (e.g. data dependent branch target data, synchronization point data, etc.) to indicate the boundary between trace objects to be formed, thereby triggering the termination of tracking of a currently tracked sequence of program instructions and the starting of the tracking of a next track sequence of program instructions.
- received program instruction address data e.g. data dependent branch target data, synchronization point data, etc.
- the profile precursor data comprising the trace objects formed by the on-chip trace circuitry 22 in the example of Figure 1 may be analyzed in combination with the program instructions 12 which were executed in order to understand the actual flow of program execution. This may be achieved by transferring the profile precursor data, which is now in a compact representation, to off-chip trace circuitry 6 from which it can be read by a general purpose computer 8.
- the general purpose computer 8 also may access a separate copy of the program instructions 12 executed by the integrated circuit 4 and in combination with the profile precursor data thereby identify the particular program instructions within the various sequences of program instructions corresponding to the trace objects identified in the profile precursor data.
- the profile precursor data comprising the trace objects may have a variety of different forms.
- the start addresses of trace objects forming the profile precursor data may be represented as address offsets from start addresses of other trace objects within the profile precursor data.
- relatively few absolute addresses need be specified within the profile precursor data and the addresses of other trace objects derived using offsets from these relatively few start addresses specified absolutely. This can make the profile precursor data more compact.
- the form of the trace objects may in some embodiments be such as they each specify a single execution path.
- a trace object may specify a plurality of branching execution paths corresponding to respective sequences of branch outcomes starting from a common start address and passing through shared intermediate branching nodes until individually terminating at a respective leaf node.
- Such an arrangement may provide a more compact representation of the execution paths and so reduce the data volume of the profile precursor data.
- each leaf node may have an associated count indicator indicating a count of times the execution path terminating at that leaf node was executed as represented in the set of profile precursor data concerned.
- a given intermediate node of a trace object may have the count of how many times a sequence of program instructions extending between the common start address and passing through that given intermediate node was executed represented by a sum of the count values associated with the leaf nodes of execution paths that include that given intermediate node.
- the leaf nodes may have an associated next address indicator indicating the address of a next program instruction executed by the processing circuitry following a branching execution path terminating at that leaf node. It may be that not all of the leaf nodes have such a next address value associated with them as this might not always be available.
- the trace objects include a branch outcome indicating a sequence of branch outcomes within the sequence of executed program instructions starting from the start address for that trace object.
- the data volume of the profile precursor data may be reduced by using a branch outcome indicator which runlength encodes sequence of branch outcomes.
- Figure 1 illustrates an example embodiment in which the on-chip trace circuitry 22 forms the profile precursor data including the trace objects.
- Figure 2 illustrates an example embodiment in which it is the off-chip trace circuitry 6 which serves to form the profile precursor data containing the trace objects.
- the on-chip trace circuitry 22 passes data indicating branch instruction outcomes (E/N data) for branch instructions executed by the processing circuitry (cores 14, 16) to the off-chip trace circuitry 6.
- the on-chip trace circuitry 22 further passes address data ([addr]) to the off-chip trace circuitry 6 indicating program addresses of non-static branch targets (e.g. data dependent branch targets) of branch instructions executed as well as program instruction addresses or program instructions serving as periodic synchronization points.
- non-static branch targets e.g. data dependent branch targets
- the off-chip trace circuitry 6 forms the trace objects from the data sent to it by the on-chip trace circuitry 22.
- the profile precursor data formed by the off-chip trace circuitry is then sent to the general purpose computer 8 where it is analyzed in combination with the program instructions 12 to provide debug and diagnostic information (as well as other, information concerning the program instructions 12 and the operation of the integrated circuit 4).
- the trace circuitry which forms the target objects may be special purpose hardware provided within the on-chip trace circuitry 22 or the off-chip trace circuitry 6. It may alternatively be more general purpose hardware, such as a dedicated small processor core, which serves to form the trace objects by executing its own program code (e.g. firmware which serves to generate the trace objects). It might also be possible in other example embodiments that the trace circuitry be provided by the processing circuitry of the general purpose computer 8 executing under program control to form the profile precursor data which is then sent elsewhere for analysis with the benefit that such a profile precursor data formed by the general purpose computer 8 has a more compact representation for sending elsewhere.
- Figure 3 schematically illustrates a sequence of program instructions including branch instructions B and instructions I which are not branch instructions and accordingly cannot form points at which the program flow changes.
- the sequence of program instructions is entered at addr0 corresponding to instruction 24.
- Program flow then passes from program instruction 24 to a conditional branch instruction 26 three times.
- two further conditional branch instructions 28, 30 are passed and are not executed and then an executed (taken) branch instruction 26 is reached.
- Whether a branch instruction 26, 28, 30 is executed or not executed is indicated by an E or an N in Figure 3 .
- the branch instructions 28, 30 within the loop illustrated are each not executed on all three occasions and accordingly their branch outcomes are not-executed, not-executed, not-executed (N, N, N).
- program flow proceeds to branch instruction 32 which is executed (taken) and triggers a branch to a new starting address addr1.
- Figure 3 also schematically illustrates a trace object 34 corresponding to the sequence of execution paths shown in Figure 3 .
- the trace object 34 comprises a start address indicator [addr0] indicating the start address of the sequence corresponding to the instruction address of instruction 24.
- a branch outcome indicator indicating a sequence of branch outcomes corresponding to the branch instructions 28, 30 and 26 on the first two traverses of the sequence (path0, path1) is indicated by N, N, E, indicating not-executed, not-executed, executed.
- a count indicator #2 serves to indicate that this sequence of branch outcomes, i.e. N, N, E was detected as occurring twice.
- the trace object 34 further indicates another execution path which starts at the start address addr0, namely the one extending between instruction 24 and the branch instruction 32.
- the branch outcome indicator for this path is not-executed, not-executed, not-executed, executed corresponding to the outcomes for branch instructions 28, 30, 26 and 32 as followed along this path. This path is followed once as indicated by the count indicator #1. This execution path corresponds to path2.
- the trace objects may serve to indicate a starting address of the next sequence of program instructions to be executed following a sequence of program instructions represented by the trace object concerned, e.g. the trace object 34 may additionally include a pointer to the starting address addr2 of the sequence of program instructions to be executed following the execution of the branch instruction 32.
- the following pseudocode gives a programing representation of processing which may be performed upon received branch outcome specifying data and received address data in order to generate example trace objects.
- Such pseudocode may correspond to code executed as firmware by, for example, the on-chip trace circuitry 22 of Figure 1 or the off-chip trace circuitry of Figure 2 .
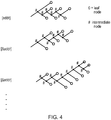
- the comments within this pseudocode also make reference to a possible form of trace object using a leaf and branch representation of multiple execution paths within each trace object such as is illustrated in Figure 4 .
- Figure 4 shows a plurality of trace objects using a leaf and branch representation of multiple execution paths within each trace object.
- the first trace object specifies an absolute address [addr].
- the following trace objects specifying their starting address by virtue of an offset value from the starting address of the first trace object, namely [ ⁇ addr].
- the individual trace objects represent execution paths which pass through branch instructions extending from the starting address and which correspond to either intermediate nodes or leaf nodes.
- a leaf node terminates an observed/detected sequence of branch outcomes and is indicated by "o” in the representation of Figure 4 .
- An intermediate node represents a branch outcome which does not terminate an observed execution path and is indicated by "#" in Figure 4 .
- a leaf node has a count indicator associated with it and optionally a next address indicator of a next address of a sequence of program instructions executed following the branch instruction corresponding to that leaf node.
- the number of times the branch instruction corresponding to an intermediate node was executed may be determined by summing the count values associated with each of the leaf nodes following that intermediate node within the branching paths represented.
- the words “configured to" are used to mean that an element of an apparatus has a configuration able to carry out the defined operation.
- a “configuration” means an arrangement or manner of interconnection of hardware or software.
- the apparatus may have dedicated hardware which provides the defined operation, or a processor or other processing device may be programmed to perform the function.
- Configured to does not imply that the apparatus element needs to be changed in any way in order to provide the defined operation.
Landscapes
- Engineering & Computer Science (AREA)
- Theoretical Computer Science (AREA)
- General Engineering & Computer Science (AREA)
- Software Systems (AREA)
- Physics & Mathematics (AREA)
- General Physics & Mathematics (AREA)
- Computer Hardware Design (AREA)
- Quality & Reliability (AREA)
- Debugging And Monitoring (AREA)
- Microcomputers (AREA)
- Advance Control (AREA)
Abstract
Description
- This disclosure relates to the field of data processing systems. More particularly, this disclosure relates to the representation of trace data corresponding to sequences of executed program instructions within a data processing system.
- It is known to provide data processing systems with trace mechanisms to enable the execution of sequences of program instructions to be analyzed by generating trace data indicative of the execution path through the program instructions followed by the data processing system. Such trace mechanisms are useful, for example, in debug and diagnostic operations performed on increasingly complex data processing systems and their associated programs.
- A challenge arising in the provision of trace mechanisms is that they can produce large volumes of trace data that can be difficult to manage/handle. The amount of trace data may be reduced in a variety of different ways. In some forms of trace mechanisms the trace data merely gives that information required to follow the execution path through the program when the program itself is available, e.g. indications of executed or not executed outcomes for conditional branch instructions, data dependent changes of program flow and periodic synchronizing address data. Furthermore, the trace data may be subject to compression using a variety of compression techniques to reduce the data volume and ease the handling of the trace data. Such compression techniques may be improved in efficiency if the trace data is divided into streams representing different threads of execution (e.g. different threads executed by different processors within a multi-core processor) as there tends to be a higher degree of correlation within a thread enabling a higher degree of compression to be achieved compared with compressing trace data from different interleaved threads.
- At least some example embodiments of the present disclosure provide apparatus for processing data comprising:
- processing circuitry to execute program instructions of a program; and
- trace circuitry to generate a plurality of trace objects, wherein
- a trace object represents a sequence of executed program instructions as:
- a start address indicator to indicate a start address of said sequence of executed program instructions;
- a branch outcome indicator to indicate a sequence of branch outcomes within said sequence of executed program instructions starting from said start address; and
- a count indicator to indicate a count of times said sequence of branch outcomes was detected.
- At least some example embodiments of the present disclosure provide trace circuitry for coupling to processing circuitry executing program instructions of a program to generate a plurality of trace objects, wherein
- a trace object represents a sequence of executed program instructions as:
- a start address indicator to indicate a start address of said sequence of executed program instructions;
- a branch outcome indicator to indicate a sequence of branch outcomes within said sequence of executed program instructions starting from said start address; and
- a count indicator to indicate a count of times said sequence of executed program instructions was executed.
- At least some example embodiments of the present disclosure provide a method of processing data comprising:
- executing program instructions of a program; and
- generating a plurality of trace objects, wherein
- a trace object represents a sequence of executed program instructions as:
- a start address indicator to indicate a start address of said sequence of executed program instructions;
- a branch outcome indicator to indicate a sequence of branch outcomes within said sequence of executed program instructions starting from said start address; and
- a count indicator to indicate a count of times said sequence of executed program instructions was executed.
- At least some embodiments of the present disclosure provide a method of analyzing execution of a program comprising:
- receiving data specifying program instructions of said program;
- receiving data specifying trace objects representing a sequence of executed program instructions as:
- a start address indicator to indicate a start address of said sequence of executed program instructions;
- a branch outcome indicator to indicate a sequence of branch outcomes within said sequence of executed program instructions starting from said start address; and
- a count indicator to indicate a count of times said sequence of executed program instructions was executed; and
- analyzing said data specifying program instructions and said data specifying trace objects to determine at least how many times a given program instruction was executed.
- Further aspects, features and advantages of the present technique will be apparent from the following description of examples, which is to be read in conjunction with the accompanying drawings, in which:
-
Figure 1 schematically illustrates a data processing system using on-chip precursor data formation; -
Figure 2 schematically illustrates a data processing system using off-chip precursor data formation; -
Figure 3 schematically illustrates a sequence of executed program instructions and associated trace objects representing that sequence; and -
Figure 4 schematically illustrates a further example of trace objects representing sequences of executed program instructions. -
Figure 1 schematically illustrates adata processing system 2 using on-chip precursor data formation. Thedata processing system 2 includes a system-on-chip integratedcircuitry 4 connected via off-chip trace circuitry 6 to a general purpose programmable computer 8. The integratedcircuit 4 includes amemory 10storing program instructions 12 to be executed byprocessor cores Respective cache memories processor cores store program instructions 12 and data to be manipulated. - On-
chip trace circuitry 22 is coupled to theprocessor cores processor cores chip trace circuitry 22 with data indicative of branch instruction outcomes for conditional branch instructions executed by thecore cores processor cores cores chip trace circuitry 22 serves to buffer the data received from thecores - The on-
chip trace circuitry 22 receives separate streams of execution characterizing data from therespective cores core 14 and a set of profile precursor data forcore 16. - The on-
chip trace circuitry 22 processes the buffered data received from thecores chip trace circuitry 22 and represented by the profile precursor data generated. The profile precursor data which is generated comprises a plurality of trace objects each representing a sequence of executed program instructions which were observed. - The trace objects of the profile precursor data may be considered in combination with the
program instructions 12 in order that the particular program instructions executed within the sequence of executed program instructions may be identified. In other example embodiments when the trace objects include the next-address indicator, the profile precursor data alone can be used to give a use count of taken branch instructions their respective branch target addresses. - The profile precursor data comprising such trace objects permits a compact representation of the execution behaviour to be achieved but may not permit the precise end-to-end flow of execution through the entire window to be determined - rather it generates a more statistically based view of the execution whereby sequences of executed program instructions can be identified together with the number of times such sequences were detected.
- In some example embodiments where the aim is to test code coverage, i.e. check which program instructions have or have not been executed within an entire program the count indicator may saturate at one thereby giving an indication of whether a particular code sequence has or has not executed at least once.
- In at least some example embodiments, a trace object may also include a next address indicator to indicate a starting address of a next sequence of program instructions to be executed following the sequence of executed program instructions of the trace object including that next address indicator. Thus, a trace object may effectively include link information indicating a following trace object. This can enable recovery of at least some of the information regarding how trace object link together and give a more comprehensive view of the program execution flow.
- The on-
chip trace circuitry 22 when analyzing the buffered data received from thecores - As previously mentioned the profile precursor data comprising the trace objects formed by the on-
chip trace circuitry 22 in the example ofFigure 1 may be analyzed in combination with theprogram instructions 12 which were executed in order to understand the actual flow of program execution. This may be achieved by transferring the profile precursor data, which is now in a compact representation, to off-chip trace circuitry 6 from which it can be read by a general purpose computer 8. The general purpose computer 8 also may access a separate copy of theprogram instructions 12 executed by the integratedcircuit 4 and in combination with the profile precursor data thereby identify the particular program instructions within the various sequences of program instructions corresponding to the trace objects identified in the profile precursor data. - The profile precursor data comprising the trace objects may have a variety of different forms. In some example forms the start addresses of trace objects forming the profile precursor data may be represented as address offsets from start addresses of other trace objects within the profile precursor data. Thus, relatively few absolute addresses need be specified within the profile precursor data and the addresses of other trace objects derived using offsets from these relatively few start addresses specified absolutely. This can make the profile precursor data more compact.
- The form of the trace objects may in some embodiments be such as they each specify a single execution path. In other embodiments a trace object may specify a plurality of branching execution paths corresponding to respective sequences of branch outcomes starting from a common start address and passing through shared intermediate branching nodes until individually terminating at a respective leaf node. Such an arrangement may provide a more compact representation of the execution paths and so reduce the data volume of the profile precursor data. Within such embodiments, each leaf node may have an associated count indicator indicating a count of times the execution path terminating at that leaf node was executed as represented in the set of profile precursor data concerned. Within such an arrangement, a given intermediate node of a trace object may have the count of how many times a sequence of program instructions extending between the common start address and passing through that given intermediate node was executed represented by a sum of the count values associated with the leaf nodes of execution paths that include that given intermediate node. Thus, tracing forward from each intermediate node to the eventual leaf nodes enables a sum of the respective leaf node counts to be obtained thereby obtaining a count for the intermediate node concerned.
- The leaf nodes may have an associated next address indicator indicating the address of a next program instruction executed by the processing circuitry following a branching execution path terminating at that leaf node. It may be that not all of the leaf nodes have such a next address value associated with them as this might not always be available. As previously discussed, the trace objects include a branch outcome indicating a sequence of branch outcomes within the sequence of executed program instructions starting from the start address for that trace object. The data volume of the profile precursor data may be reduced by using a branch outcome indicator which runlength encodes sequence of branch outcomes.
-
Figure 1 illustrates an example embodiment in which the on-chip trace circuitry 22 forms the profile precursor data including the trace objects.Figure 2 illustrates an example embodiment in which it is the off-chip trace circuitry 6 which serves to form the profile precursor data containing the trace objects. In theFigure 2 example embodiment the on-chip trace circuitry 22 passes data indicating branch instruction outcomes (E/N data) for branch instructions executed by the processing circuitry (cores 14, 16) to the off-chip trace circuitry 6. The on-chip trace circuitry 22 further passes address data ([addr]) to the off-chip trace circuitry 6 indicating program addresses of non-static branch targets (e.g. data dependent branch targets) of branch instructions executed as well as program instruction addresses or program instructions serving as periodic synchronization points. - In this example embodiment of
Figure 2 , the off-chip trace circuitry 6 forms the trace objects from the data sent to it by the on-chip trace circuitry 22. The profile precursor data formed by the off-chip trace circuitry is then sent to the general purpose computer 8 where it is analyzed in combination with theprogram instructions 12 to provide debug and diagnostic information (as well as other, information concerning theprogram instructions 12 and the operation of the integrated circuit 4). - The trace circuitry which forms the target objects may be special purpose hardware provided within the on-
chip trace circuitry 22 or the off-chip trace circuitry 6. It may alternatively be more general purpose hardware, such as a dedicated small processor core, which serves to form the trace objects by executing its own program code (e.g. firmware which serves to generate the trace objects). It might also be possible in other example embodiments that the trace circuitry be provided by the processing circuitry of the general purpose computer 8 executing under program control to form the profile precursor data which is then sent elsewhere for analysis with the benefit that such a profile precursor data formed by the general purpose computer 8 has a more compact representation for sending elsewhere. -
Figure 3 schematically illustrates a sequence of program instructions including branch instructions B and instructions I which are not branch instructions and accordingly cannot form points at which the program flow changes. In the example shown, the sequence of program instructions is entered at addr0 corresponding toinstruction 24. Program flow then passes fromprogram instruction 24 to aconditional branch instruction 26 three times. When executing the sequence of program instructions following start address addr0 two furtherconditional branch instructions 28, 30 are passed and are not executed and then an executed (taken)branch instruction 26 is reached. Whether abranch instruction Figure 3 . - The third time at which the
branch instruction 26 is encountered it is not executed and accordingly a jump back to the start address addr0 of thisinstruction 24 is not made. Accordingly, the sequence of branch outcomes for thebranch instruction 26 is executed, executed, not-executed (E, E, N). Thebranch instructions 28, 30 within the loop illustrated are each not executed on all three occasions and accordingly their branch outcomes are not-executed, not-executed, not-executed (N, N, N). - Following the non-execution of the
branch instruction 26 on its third occurrence, program flow proceeds tobranch instruction 32 which is executed (taken) and triggers a branch to a new starting address addr1. -
Figure 3 also schematically illustrates atrace object 34 corresponding to the sequence of execution paths shown inFigure 3 . In particular, thetrace object 34 comprises a start address indicator [addr0] indicating the start address of the sequence corresponding to the instruction address ofinstruction 24. A branch outcome indicator indicating a sequence of branch outcomes corresponding to thebranch instructions count indicator # 2 serves to indicate that this sequence of branch outcomes, i.e. N, N, E was detected as occurring twice. Thetrace object 34 further indicates another execution path which starts at the start address addr0, namely the one extending betweeninstruction 24 and thebranch instruction 32. The branch outcome indicator for this path is not-executed, not-executed, not-executed, executed corresponding to the outcomes forbranch instructions count indicator # 1. This execution path corresponds to path2. - Although not shown in the
trace object 34, it is possible in some embodiments that the trace objects may serve to indicate a starting address of the next sequence of program instructions to be executed following a sequence of program instructions represented by the trace object concerned, e.g. thetrace object 34 may additionally include a pointer to the starting address addr2 of the sequence of program instructions to be executed following the execution of thebranch instruction 32. - The following pseudocode gives a programing representation of processing which may be performed upon received branch outcome specifying data and received address data in order to generate example trace objects. Such pseudocode may correspond to code executed as firmware by, for example, the on-
chip trace circuitry 22 ofFigure 1 or the off-chip trace circuitry ofFigure 2 . The comments within this pseudocode also make reference to a possible form of trace object using a leaf and branch representation of multiple execution paths within each trace object such as is illustrated inFigure 4 .
 # Pseudocode for constructing a pre-decode profile.
 # The input is a sequence of events:
 # ADDR(address) - a branch to a specific address
 # BRANCH(E) - the next branch was taken
 # BRANCH(N) - the next branch was not taken
 Sequence = {
   start_addr: address
   branches: LIST OF (E or N)
  next_addr: address
 }
 # Start off with no trace objects
 MAP (Sequence -> integer) objects = []
 # The sequence we're currently building
 Sequence current_seq = None
 # Process each event
 for Event evt in trace:
   if evt is ADDR(addr):
     if current_seq:
        # This branch terminates the sequence we're working on
        current_seq.next_addr = addr
        if current seq in objects:
          # there's already an object for this sequence
          objects [current_seq] += 1
        else:
          # new sequence, add it to objects with count 1
          objects [current_seq] = 1
     # Start a new sequence
     current_seq = {start_addr: addr, [], None}
   else if evt is E or N:
     current_seq.branches.append(evt)
 # Wrap up by processing the last sequence
 if current seq in objects:
   objects [current_seq] += 1
 else:
   objects[current_seq] = 1
 # The 'objects' map now consists of a set of sequences, each of which is
 # - a start address
 # - a sequence of E/N indicators
 # - a final address
 # - a count
 # Note that a given start address will in general map to several sequences.
 # To later convert this data structure into a program profile,
 # once the program images are available:
 for Sequence s in objects:
  pc = s.start_addr
   for b in s.branches:
     inspect image to find address pc' of next branch
     add s.count to each instruction from pc to pc'
     if b == E:
       pc = target of b
        add s.count to count of banches from b to target of b
     else:
       pc = pc'
   add s.count to each instruction from pc to s.end_addr
 # The data can be more compactly represented by merging common prefixes,
 # creating a new array with one entry per start address, and the sequences
 # starting at that address represented as a branching data structure.
 # This more compact structure could be built directly.
 #
 # To create a program profile from this compact data structure it could either
 # be decompressed into the original flat data structure, or processed directly.
- 1. Apparatus for processing data comprising:
- processing circuitry to execute program instructions of a program; and
- trace circuitry to generate a plurality of trace objects, wherein
- a trace object represents a sequence of executed program instructions as:
- a start address indicator to indicate a start address of said sequence of executed program instructions;
- a branch outcome indicator to indicate a sequence of branch outcomes within said sequence of executed program instructions starting from said start address; and
- a count indicator to indicate a count of times said sequence of branch outcomes was detected.
- 2. Apparatus according to
clause 1, wherein said trace object comprises a next address indicator to indicate a starting address of a next sequence of program instructions to be executed following said sequence of executed program instructions. - 3. Apparatus according to any one of
clauses - 4. Apparatus according to any one of
clauses - 5. Apparatus according to any one of the preceding clauses, wherein processing circuitry is configured to provide said trace circuitry with data indicative of branch instruction outcomes for branch instructions executed by said processing circuitry and program instruction addresses of non-static branch targets of branch instructions executed by said processing circuitry.
- 6. Apparatus according to clause 5, wherein said processing circuitry is configured to provide said trace circuitry with data indicative of program instruction addresses of program instructions executed by said processing circuitry as synchronization points.
- 7. Apparatus according to any one of
clauses 5 and 6, wherein said trace circuitry is configured to respond to program instruction address data received from said processing circuitry to terminate tracking a currently tracked sequence of program instructions and to start tracking a next tracked sequence of program instructions. - 8. Apparatus according to any one of the preceding clauses, wherein said trace circuitry collects together said trace objects to form profile precursor data, and said profile precursor data in combination with said program represents how many times given sequences of program instructions were executed by said processing circuitry.
- 9. Apparatus according to
clause 2, wherein said trace circuitry collects together said trace objects to form profile precursor data, and said profile precursor data represents a count of pairs of branch instruction addresses with respective branch target addresses. - 10. Apparatus according to clause 9, wherein said profile precursor data comprises data representing said trace objects ordered by respective represented start addresses.
- 11. Apparatus according to
clause 10, wherein at least some of said start addresses of trace objects forming said profile precursor data are represented as address offsets from start addresses of other trace objects forming said profile precursor data. - 12. Apparatus according to any one of the preceding clauses, wherein said trace object specifies a plurality of branching execution paths corresponding to respective sequences of branch outcomes starting from a common start address passing through shared intermediate branching nodes and individually terminating in an leaf node.
- 13. Apparatus according to
clause 12, wherein each of said leaf nodes has an associated count indicator indicating a count of times a branching execution path terminating at said leaf node was executed by said processing circuitry. - 14. Apparatus according to clause 13, wherein a trace object comprising a given intermediate node represents a count of how many times a sequence of program instruction extending between said common start address and said given intermediate node was executed by a sum of count values associated with leaf nodes of executing paths that include said given intermediate node.
- 15. Apparatus according to any one of
clauses - 16. Apparatus according to clause 8, wherein said profile precursor data runlength encodes said sequences of branch outcomes.
- 17. Apparatus according to any one of the preceding clauses, wherein said processing circuitry is a processor core of an integrated circuit and said trace circuitry is one of:
- on-chip trace circuitry within said integrated circuit; and
- off-chip trace circuitry coupled via a communication interface with said integrated circuit.
- 18. Trace circuitry for coupling to processing circuitry executing program instructions of a program to generate a plurality of trace objects, wherein
a trace object represents a sequence of executed program instructions as:- a start address indicator to indicate a start address of said sequence of executed program instructions;
- a branch outcome indicator to indicate a sequence of branch outcomes within said sequence of executed program instructions starting from said start address; and
- a count indicator to indicate a count of times said sequence of executed program instructions was executed.
- 19. A method of processing data comprising:
- executing program instructions of a program; and
- generating a plurality of trace objects, wherein
- a trace object represents a sequence of executed program instructions as:
- a start address indicator to indicate a start address of said sequence of executed program instructions;
- a branch outcome indicator to indicate a sequence of branch outcomes within said sequence of executed program instructions starting from said start address; and
- a count indicator to indicate a count of times said sequence of executed program instructions was executed.
- 20. A method of analyzing execution of a program comprising:
- receiving data specifying program instructions of said program;
- receiving data specifying trace objects representing a sequence of executed program instructions as:
- a start address indicator to indicate a start address of said sequence of executed program instructions;
- a branch outcome indicator to indicate a sequence of branch outcomes within said sequence of executed program instructions starting from said start address; and
- a count indicator to indicate a count of times said sequence of executed program instructions was executed; and
- analyzing said data specifying program instructions and said data specifying trace objects to determine at least how many times a given program instruction was executed.
- 21. A method as claimed in claim 19, wherein said analyzing determines in which execution paths said given program instruction is included.
Claims (15)
- Apparatus for processing data comprising:processing circuitry to execute program instructions of a program; andtrace circuitry to generate a plurality of trace objects, whereina trace object represents a sequence of executed program instructions as:a start address indicator to indicate a start address of said sequence of executed program instructions;a branch outcome indicator to indicate a sequence of branch outcomes within said sequence of executed program instructions starting from said start address; anda count indicator to indicate a count of times said sequence of branch outcomes was detected.
- Apparatus as claimed in claim 1, wherein said trace object comprises a next address indicator to indicate a starting address of a next sequence of program instructions to be executed following said sequence of executed program instructions.
- Apparatus as claimed in any one of claims 1 and 2, wherein said count indicator saturates at one and said trace objects provide coverage data indicative of whether or not program instructions have been executed.
- Apparatus as claimed in any one of claims 1, 2 and 3, wherein said processing circuitry comprises a plurality of processors executing respective streams of program instructions and said trace circuitry is configured to generate said trace objects to represent separately said streams of program instructions.
- Apparatus as claimed in any one of the preceding claims, wherein processing circuitry is configured to provide said trace circuitry with data indicative of branch instruction outcomes for branch instructions executed by said processing circuitry and program instruction addresses of non-static branch targets of branch instructions executed by said processing circuitry.
- Apparatus as claimed in claim 5, wherein said processing circuitry is configured to provide said trace circuitry with data indicative of program instruction addresses of program instructions executed by said processing circuitry as synchronization points.
- Apparatus as claimed in any one of claims 5 and 6, wherein said trace circuitry is configured to respond to program instruction address data received from said processing circuitry to terminate tracking a currently tracked sequence of program instructions and to start tracking a next tracked sequence of program instructions.
- Apparatus as claimed in any one of the preceding claims, wherein said trace circuitry collects together said trace objects to form profile precursor data, and said profile precursor data in combination with said program represents how many times given sequences of program instructions were executed by said processing circuitry.
- Apparatus as claimed in claim 2, wherein said trace circuitry collects together said trace objects to form profile precursor data, and said profile precursor data represents a count of pairs of branch instruction addresses with respective branch target addresses.
- Apparatus as claimed in claim 9, wherein said profile precursor data comprises data representing said trace objects ordered by respective represented start addresses.
- Apparatus as claimed in claim 10, wherein at least some of said start addresses of trace objects forming said profile precursor data are represented as address offsets from start addresses of other trace objects forming said profile precursor data.
- Apparatus as claimed in any one of the preceding claims wherein said trace object specifies a plurality of branching execution paths corresponding to respective sequences of branch outcomes starting from a common start address passing through shared intermediate branching nodes and individually terminating in an leaf node.
- Trace circuitry for coupling to processing circuitry executing program instructions of a program to generate a plurality of trace objects, wherein
a trace object represents a sequence of executed program instructions as:a start address indicator to indicate a start address of said sequence of executed program instructions;a branch outcome indicator to indicate a sequence of branch outcomes within said sequence of executed program instructions starting from said start address; anda count indicator to indicate a count of times said sequence of executed program instructions was executed. - A method of processing data comprising:executing program instructions of a program; andgenerating a plurality of trace objects, whereina trace object represents a sequence of executed program instructions as:a start address indicator to indicate a start address of said sequence of executed program instructions;a branch outcome indicator to indicate a sequence of branch outcomes within said sequence of executed program instructions starting from said start address; anda count indicator to indicate a count of times said sequence of executed program instructions was executed.
- A method of analyzing execution of a program comprising:receiving data specifying program instructions of said program;receiving data specifying trace objects representing a sequence of executed program instructions as:a start address indicator to indicate a start address of said sequence of executed program instructions;a branch outcome indicator to indicate a sequence of branch outcomes within said sequence of executed program instructions starting from said start address; anda count indicator to indicate a count of times said sequence of executed program instructions was executed; andanalyzing said data specifying program instructions and said data specifying trace objects to determine at least how many times a given program instruction was executed.
Applications Claiming Priority (1)
| Application Number | Priority Date | Filing Date | Title |
|---|---|---|---|
| GB1704675.6A GB2560749B (en) | 2017-03-24 | 2017-03-24 | Trace data representation |
Publications (2)
| Publication Number | Publication Date |
|---|---|
| EP3379418A1 true EP3379418A1 (en) | 2018-09-26 |
| EP3379418B1 EP3379418B1 (en) | 2024-07-17 |
Family
ID=58687827
Family Applications (1)
| Application Number | Title | Priority Date | Filing Date |
|---|---|---|---|
| EP18162604.5A Active EP3379418B1 (en) | 2017-03-24 | 2018-03-19 | Trace data representation |
Country Status (5)
| Country | Link |
|---|---|
| US (1) | US10956303B2 (en) |
| EP (1) | EP3379418B1 (en) |
| JP (1) | JP7116562B2 (en) |
| CN (1) | CN108628637B (en) |
| GB (1) | GB2560749B (en) |
Families Citing this family (2)
| Publication number | Priority date | Publication date | Assignee | Title |
|---|---|---|---|---|
| US10802940B1 (en) * | 2017-05-22 | 2020-10-13 | Palantir Technologies Inc. | Approaches for analyzing data streams |
| EP3792770B1 (en) * | 2019-09-13 | 2023-11-08 | Accemic Technologies GmbH | Trace-data processing device |
Citations (4)
| Publication number | Priority date | Publication date | Assignee | Title |
|---|---|---|---|---|
| US5809293A (en) * | 1994-07-29 | 1998-09-15 | International Business Machines Corporation | System and method for program execution tracing within an integrated processor |
| EP0999499A2 (en) * | 1998-11-05 | 2000-05-10 | Hewlett-Packard Company | Method and apparatus for profiling of non-instrumented programs and dynamic processing of profile data |
| EP0999498A2 (en) * | 1998-11-05 | 2000-05-10 | Hewlett-Packard Company | Method for selecting active code traces for dynamic instruction translation |
| EP2873983A1 (en) * | 2013-11-14 | 2015-05-20 | Accemic GmbH & Co. KG | Trace-data processing and profiling device |
Family Cites Families (16)
| Publication number | Priority date | Publication date | Assignee | Title |
|---|---|---|---|---|
| JPS62130436A (en) * | 1985-12-03 | 1987-06-12 | Nec Corp | Trace controller |
| JPS62288946A (en) * | 1986-06-09 | 1987-12-15 | Fujitsu Ltd | Jump log recording system |
| JPH10260872A (en) * | 1997-01-20 | 1998-09-29 | Fujitsu Ltd | Computer system and recording medium |
| JP2878264B1 (en) * | 1998-03-11 | 1999-04-05 | 甲府日本電気株式会社 | Tracer device, trace data compression method, and compressed trace data reading method |
| US7802236B2 (en) * | 2002-09-09 | 2010-09-21 | The Regents Of The University Of California | Method and apparatus for identifying similar regions of a program's execution |
| US7694281B2 (en) * | 2005-09-30 | 2010-04-06 | Intel Corporation | Two-pass MRET trace selection for dynamic optimization |
| JP4892387B2 (en) | 2007-03-30 | 2012-03-07 | 財団法人福岡県産業・科学技術振興財団 | Execution path detection apparatus, information processing apparatus, execution path detection method, program, and recording medium |
| US9195462B2 (en) * | 2007-04-11 | 2015-11-24 | Freescale Semiconductor, Inc. | Techniques for tracing processes in a multi-threaded processor |
| US20090287729A1 (en) * | 2008-05-16 | 2009-11-19 | Microsoft Corporation | Source code coverage testing |
| US8959496B2 (en) * | 2010-04-21 | 2015-02-17 | Microsoft Corporation | Automatic parallelization in a tracing just-in-time compiler system |
| EP2645254A4 (en) | 2010-11-25 | 2014-01-15 | Toyota Motor Co Ltd | PROCESSOR, ELECTRONIC CONTROL DEVICE, CREATION PROGRAM |
| GB2487355B (en) * | 2011-01-13 | 2020-03-25 | Advanced Risc Mach Ltd | Processing apparatus, trace unit and diagnostic apparatus |
| US20130047169A1 (en) * | 2011-08-16 | 2013-02-21 | Computer Associates Think, Inc. | Efficient Data Structure To Gather And Distribute Transaction Events |
| JP5834991B2 (en) | 2012-02-17 | 2015-12-24 | 富士電機株式会社 | Schematic program test coverage measuring apparatus and method, and program |
| EP3144814B1 (en) * | 2015-09-16 | 2021-08-25 | ARM Limited | Method and apparatus for generating a profile of a target program |
| US20170277538A1 (en) * | 2016-03-24 | 2017-09-28 | Centipede Semi Ltd. | Speculative multi-threading trace prediction |
-
2017
- 2017-03-24 GB GB1704675.6A patent/GB2560749B/en active Active
-
2018
- 2018-03-08 US US15/915,473 patent/US10956303B2/en active Active
- 2018-03-16 CN CN201810220876.5A patent/CN108628637B/en active Active
- 2018-03-16 JP JP2018049681A patent/JP7116562B2/en active Active
- 2018-03-19 EP EP18162604.5A patent/EP3379418B1/en active Active
Patent Citations (4)
| Publication number | Priority date | Publication date | Assignee | Title |
|---|---|---|---|---|
| US5809293A (en) * | 1994-07-29 | 1998-09-15 | International Business Machines Corporation | System and method for program execution tracing within an integrated processor |
| EP0999499A2 (en) * | 1998-11-05 | 2000-05-10 | Hewlett-Packard Company | Method and apparatus for profiling of non-instrumented programs and dynamic processing of profile data |
| EP0999498A2 (en) * | 1998-11-05 | 2000-05-10 | Hewlett-Packard Company | Method for selecting active code traces for dynamic instruction translation |
| EP2873983A1 (en) * | 2013-11-14 | 2015-05-20 | Accemic GmbH & Co. KG | Trace-data processing and profiling device |
Also Published As
| Publication number | Publication date |
|---|---|
| EP3379418B1 (en) | 2024-07-17 |
| GB201704675D0 (en) | 2017-05-10 |
| US10956303B2 (en) | 2021-03-23 |
| CN108628637A (en) | 2018-10-09 |
| US20180276106A1 (en) | 2018-09-27 |
| JP7116562B2 (en) | 2022-08-10 |
| GB2560749A (en) | 2018-09-26 |
| JP2018163656A (en) | 2018-10-18 |
| CN108628637B (en) | 2024-05-03 |
| GB2560749B (en) | 2020-10-14 |
Similar Documents
| Publication | Publication Date | Title |
|---|---|---|
| US7870437B2 (en) | Trace data timestamping | |
| EP2873983B1 (en) | Trace-data processing and profiling device | |
| CN101625657B (en) | Monitoring apparatus for data processing and generalizing monitoring data | |
| KR101994636B1 (en) | Tracing of a data processing apparatus | |
| US20100149185A1 (en) | Apparatus and method for tracing activities of a shader program executed on shader circuitry of a data processing apparatus | |
| Tan et al. | Visual, log-based causal tracing for performance debugging of mapreduce systems | |
| JP5512041B2 (en) | Key assignment when tracing a data processing system | |
| US11734149B2 (en) | Trace-data processing device | |
| US8819496B2 (en) | Apparatus for collecting trace information and processing trace information, and method for collecting and processing trace information | |
| US9218199B2 (en) | Identifying thread progress information by monitoring transitions between interesting states | |
| KR101519450B1 (en) | Auto-test generation device, method and recording medium using test coverage information for multi-thread program | |
| US10956303B2 (en) | Trace data representation | |
| CN108345534B (en) | Apparatus and method for generating and processing trace stream | |
| EP2972880B1 (en) | Kernel functionality checker | |
| CN107451038B (en) | Hardware event acquisition method, processor and computing system | |
| US20120166887A1 (en) | Monitoring multiple data transfers | |
| JP4971679B2 (en) | Processor system and performance measurement method for processor system | |
| JP6666216B2 (en) | Electronic control unit, analysis system | |
| JP2014182478A (en) | Performance profiling device, and performance profiling method | |
| KR102658595B1 (en) | Apparatus and method for sorting corresponding elements in elements of multiple streams | |
| CN121211406B (en) | A method and apparatus for predicting program execution time | |
| CN110825631A (en) | Test method, test device, electronic equipment and storage medium | |
| CN103336458A (en) | Multi-thread data acquisition system synchronization control method in acquisition time control mode | |
| KR20040055629A (en) | Apparatus and method for op code extension in packet groups transmitted in trace streams | |
| CN120832291A (en) | Thread synchronization exception handling method, device and equipment |
Legal Events
| Date | Code | Title | Description |
|---|---|---|---|
| PUAI | Public reference made under article 153(3) epc to a published international application that has entered the european phase |
Free format text: ORIGINAL CODE: 0009012 |
|
| STAA | Information on the status of an ep patent application or granted ep patent |
Free format text: STATUS: THE APPLICATION HAS BEEN PUBLISHED |
|
| AK | Designated contracting states |
Kind code of ref document: A1 Designated state(s): AL AT BE BG CH CY CZ DE DK EE ES FI FR GB GR HR HU IE IS IT LI LT LU LV MC MK MT NL NO PL PT RO RS SE SI SK SM TR |
|
| AX | Request for extension of the european patent |
Extension state: BA ME |
|
| STAA | Information on the status of an ep patent application or granted ep patent |
Free format text: STATUS: REQUEST FOR EXAMINATION WAS MADE |
|
| 17P | Request for examination filed |
Effective date: 20190326 |
|
| RBV | Designated contracting states (corrected) |
Designated state(s): AL AT BE BG CH CY CZ DE DK EE ES FI FR GB GR HR HU IE IS IT LI LT LU LV MC MK MT NL NO PL PT RO RS SE SI SK SM TR |
|
| STAA | Information on the status of an ep patent application or granted ep patent |
Free format text: STATUS: EXAMINATION IS IN PROGRESS |
|
| 17Q | First examination report despatched |
Effective date: 20210528 |
|
| GRAP | Despatch of communication of intention to grant a patent |
Free format text: ORIGINAL CODE: EPIDOSNIGR1 |
|
| STAA | Information on the status of an ep patent application or granted ep patent |
Free format text: STATUS: GRANT OF PATENT IS INTENDED |
|
| INTG | Intention to grant announced |
Effective date: 20240220 |
|
| RIN1 | Information on inventor provided before grant (corrected) |
Inventor name: GRANT, ALASDAIR |
|
| P01 | Opt-out of the competence of the unified patent court (upc) registered |
Effective date: 20240306 |
|
| GRAS | Grant fee paid |
Free format text: ORIGINAL CODE: EPIDOSNIGR3 |
|
| GRAA | (expected) grant |
Free format text: ORIGINAL CODE: 0009210 |
|
| STAA | Information on the status of an ep patent application or granted ep patent |
Free format text: STATUS: THE PATENT HAS BEEN GRANTED |
|
| AK | Designated contracting states |
Kind code of ref document: B1 Designated state(s): AL AT BE BG CH CY CZ DE DK EE ES FI FR GB GR HR HU IE IS IT LI LT LU LV MC MK MT NL NO PL PT RO RS SE SI SK SM TR |
|
| REG | Reference to a national code |
Ref country code: CH Ref legal event code: EP |
|
| REG | Reference to a national code |
Ref country code: DE Ref legal event code: R096 Ref document number: 602018071783 Country of ref document: DE |
|
| REG | Reference to a national code |
Ref country code: IE Ref legal event code: FG4D |
|
| REG | Reference to a national code |
Ref country code: LT Ref legal event code: MG9D |
|
| REG | Reference to a national code |
Ref country code: NL Ref legal event code: MP Effective date: 20240717 |
|
| PG25 | Lapsed in a contracting state [announced via postgrant information from national office to epo] |
Ref country code: PT Free format text: LAPSE BECAUSE OF FAILURE TO SUBMIT A TRANSLATION OF THE DESCRIPTION OR TO PAY THE FEE WITHIN THE PRESCRIBED TIME-LIMIT Effective date: 20241118 |
|
| REG | Reference to a national code |
Ref country code: AT Ref legal event code: MK05 Ref document number: 1704789 Country of ref document: AT Kind code of ref document: T Effective date: 20240717 |
|
| PG25 | Lapsed in a contracting state [announced via postgrant information from national office to epo] |
Ref country code: NL Free format text: LAPSE BECAUSE OF FAILURE TO SUBMIT A TRANSLATION OF THE DESCRIPTION OR TO PAY THE FEE WITHIN THE PRESCRIBED TIME-LIMIT Effective date: 20240717 |
|
| PG25 | Lapsed in a contracting state [announced via postgrant information from national office to epo] |
Ref country code: PT Free format text: LAPSE BECAUSE OF FAILURE TO SUBMIT A TRANSLATION OF THE DESCRIPTION OR TO PAY THE FEE WITHIN THE PRESCRIBED TIME-LIMIT Effective date: 20241118 Ref country code: NL Free format text: LAPSE BECAUSE OF FAILURE TO SUBMIT A TRANSLATION OF THE DESCRIPTION OR TO PAY THE FEE WITHIN THE PRESCRIBED TIME-LIMIT Effective date: 20240717 |
|
| PG25 | Lapsed in a contracting state [announced via postgrant information from national office to epo] |
Ref country code: NO Free format text: LAPSE BECAUSE OF FAILURE TO SUBMIT A TRANSLATION OF THE DESCRIPTION OR TO PAY THE FEE WITHIN THE PRESCRIBED TIME-LIMIT Effective date: 20241017 |
|
| PG25 | Lapsed in a contracting state [announced via postgrant information from national office to epo] |
Ref country code: PL Free format text: LAPSE BECAUSE OF FAILURE TO SUBMIT A TRANSLATION OF THE DESCRIPTION OR TO PAY THE FEE WITHIN THE PRESCRIBED TIME-LIMIT Effective date: 20240717 Ref country code: FI Free format text: LAPSE BECAUSE OF FAILURE TO SUBMIT A TRANSLATION OF THE DESCRIPTION OR TO PAY THE FEE WITHIN THE PRESCRIBED TIME-LIMIT Effective date: 20240717 Ref country code: GR Free format text: LAPSE BECAUSE OF FAILURE TO SUBMIT A TRANSLATION OF THE DESCRIPTION OR TO PAY THE FEE WITHIN THE PRESCRIBED TIME-LIMIT Effective date: 20241018 |
|
| PG25 | Lapsed in a contracting state [announced via postgrant information from national office to epo] |
Ref country code: BG Free format text: LAPSE BECAUSE OF FAILURE TO SUBMIT A TRANSLATION OF THE DESCRIPTION OR TO PAY THE FEE WITHIN THE PRESCRIBED TIME-LIMIT Effective date: 20240717 |
|
| PG25 | Lapsed in a contracting state [announced via postgrant information from national office to epo] |
Ref country code: LV Free format text: LAPSE BECAUSE OF FAILURE TO SUBMIT A TRANSLATION OF THE DESCRIPTION OR TO PAY THE FEE WITHIN THE PRESCRIBED TIME-LIMIT Effective date: 20240717 |
|
| PG25 | Lapsed in a contracting state [announced via postgrant information from national office to epo] |
Ref country code: IS Free format text: LAPSE BECAUSE OF FAILURE TO SUBMIT A TRANSLATION OF THE DESCRIPTION OR TO PAY THE FEE WITHIN THE PRESCRIBED TIME-LIMIT Effective date: 20241117 Ref country code: AT Free format text: LAPSE BECAUSE OF FAILURE TO SUBMIT A TRANSLATION OF THE DESCRIPTION OR TO PAY THE FEE WITHIN THE PRESCRIBED TIME-LIMIT Effective date: 20240717 |
|
| PG25 | Lapsed in a contracting state [announced via postgrant information from national office to epo] |
Ref country code: HR Free format text: LAPSE BECAUSE OF FAILURE TO SUBMIT A TRANSLATION OF THE DESCRIPTION OR TO PAY THE FEE WITHIN THE PRESCRIBED TIME-LIMIT Effective date: 20240717 |
|
| PG25 | Lapsed in a contracting state [announced via postgrant information from national office to epo] |
Ref country code: ES Free format text: LAPSE BECAUSE OF FAILURE TO SUBMIT A TRANSLATION OF THE DESCRIPTION OR TO PAY THE FEE WITHIN THE PRESCRIBED TIME-LIMIT Effective date: 20240717 Ref country code: RS Free format text: LAPSE BECAUSE OF FAILURE TO SUBMIT A TRANSLATION OF THE DESCRIPTION OR TO PAY THE FEE WITHIN THE PRESCRIBED TIME-LIMIT Effective date: 20241017 |
|
| PG25 | Lapsed in a contracting state [announced via postgrant information from national office to epo] |
Ref country code: RS Free format text: LAPSE BECAUSE OF FAILURE TO SUBMIT A TRANSLATION OF THE DESCRIPTION OR TO PAY THE FEE WITHIN THE PRESCRIBED TIME-LIMIT Effective date: 20241017 Ref country code: PL Free format text: LAPSE BECAUSE OF FAILURE TO SUBMIT A TRANSLATION OF THE DESCRIPTION OR TO PAY THE FEE WITHIN THE PRESCRIBED TIME-LIMIT Effective date: 20240717 Ref country code: NO Free format text: LAPSE BECAUSE OF FAILURE TO SUBMIT A TRANSLATION OF THE DESCRIPTION OR TO PAY THE FEE WITHIN THE PRESCRIBED TIME-LIMIT Effective date: 20241017 Ref country code: LV Free format text: LAPSE BECAUSE OF FAILURE TO SUBMIT A TRANSLATION OF THE DESCRIPTION OR TO PAY THE FEE WITHIN THE PRESCRIBED TIME-LIMIT Effective date: 20240717 Ref country code: IS Free format text: LAPSE BECAUSE OF FAILURE TO SUBMIT A TRANSLATION OF THE DESCRIPTION OR TO PAY THE FEE WITHIN THE PRESCRIBED TIME-LIMIT Effective date: 20241117 Ref country code: HR Free format text: LAPSE BECAUSE OF FAILURE TO SUBMIT A TRANSLATION OF THE DESCRIPTION OR TO PAY THE FEE WITHIN THE PRESCRIBED TIME-LIMIT Effective date: 20240717 Ref country code: GR Free format text: LAPSE BECAUSE OF FAILURE TO SUBMIT A TRANSLATION OF THE DESCRIPTION OR TO PAY THE FEE WITHIN THE PRESCRIBED TIME-LIMIT Effective date: 20241018 Ref country code: FI Free format text: LAPSE BECAUSE OF FAILURE TO SUBMIT A TRANSLATION OF THE DESCRIPTION OR TO PAY THE FEE WITHIN THE PRESCRIBED TIME-LIMIT Effective date: 20240717 Ref country code: ES Free format text: LAPSE BECAUSE OF FAILURE TO SUBMIT A TRANSLATION OF THE DESCRIPTION OR TO PAY THE FEE WITHIN THE PRESCRIBED TIME-LIMIT Effective date: 20240717 Ref country code: BG Free format text: LAPSE BECAUSE OF FAILURE TO SUBMIT A TRANSLATION OF THE DESCRIPTION OR TO PAY THE FEE WITHIN THE PRESCRIBED TIME-LIMIT Effective date: 20240717 Ref country code: AT Free format text: LAPSE BECAUSE OF FAILURE TO SUBMIT A TRANSLATION OF THE DESCRIPTION OR TO PAY THE FEE WITHIN THE PRESCRIBED TIME-LIMIT Effective date: 20240717 |
|
| PG25 | Lapsed in a contracting state [announced via postgrant information from national office to epo] |
Ref country code: SM Free format text: LAPSE BECAUSE OF FAILURE TO SUBMIT A TRANSLATION OF THE DESCRIPTION OR TO PAY THE FEE WITHIN THE PRESCRIBED TIME-LIMIT Effective date: 20240717 Ref country code: DK Free format text: LAPSE BECAUSE OF FAILURE TO SUBMIT A TRANSLATION OF THE DESCRIPTION OR TO PAY THE FEE WITHIN THE PRESCRIBED TIME-LIMIT Effective date: 20240717 Ref country code: RO Free format text: LAPSE BECAUSE OF FAILURE TO SUBMIT A TRANSLATION OF THE DESCRIPTION OR TO PAY THE FEE WITHIN THE PRESCRIBED TIME-LIMIT Effective date: 20240717 |
|
| REG | Reference to a national code |
Ref country code: DE Ref legal event code: R097 Ref document number: 602018071783 Country of ref document: DE |
|
| PG25 | Lapsed in a contracting state [announced via postgrant information from national office to epo] |
Ref country code: EE Free format text: LAPSE BECAUSE OF FAILURE TO SUBMIT A TRANSLATION OF THE DESCRIPTION OR TO PAY THE FEE WITHIN THE PRESCRIBED TIME-LIMIT Effective date: 20240717 |
|
| PG25 | Lapsed in a contracting state [announced via postgrant information from national office to epo] |
Ref country code: CZ Free format text: LAPSE BECAUSE OF FAILURE TO SUBMIT A TRANSLATION OF THE DESCRIPTION OR TO PAY THE FEE WITHIN THE PRESCRIBED TIME-LIMIT Effective date: 20240717 |
|
| PG25 | Lapsed in a contracting state [announced via postgrant information from national office to epo] |
Ref country code: SK Free format text: LAPSE BECAUSE OF FAILURE TO SUBMIT A TRANSLATION OF THE DESCRIPTION OR TO PAY THE FEE WITHIN THE PRESCRIBED TIME-LIMIT Effective date: 20240717 |
|
| PLBE | No opposition filed within time limit |
Free format text: ORIGINAL CODE: 0009261 |
|
| STAA | Information on the status of an ep patent application or granted ep patent |
Free format text: STATUS: NO OPPOSITION FILED WITHIN TIME LIMIT |
|
| 26N | No opposition filed |
Effective date: 20250422 |
|
| PG25 | Lapsed in a contracting state [announced via postgrant information from national office to epo] |
Ref country code: SE Free format text: LAPSE BECAUSE OF FAILURE TO SUBMIT A TRANSLATION OF THE DESCRIPTION OR TO PAY THE FEE WITHIN THE PRESCRIBED TIME-LIMIT Effective date: 20240717 |
|
| PG25 | Lapsed in a contracting state [announced via postgrant information from national office to epo] |
Ref country code: MC Free format text: LAPSE BECAUSE OF FAILURE TO SUBMIT A TRANSLATION OF THE DESCRIPTION OR TO PAY THE FEE WITHIN THE PRESCRIBED TIME-LIMIT Effective date: 20240717 |
|
| REG | Reference to a national code |
Ref country code: CH Ref legal event code: H13 Free format text: ST27 STATUS EVENT CODE: U-0-0-H10-H13 (AS PROVIDED BY THE NATIONAL OFFICE) Effective date: 20251023 |
|
| PG25 | Lapsed in a contracting state [announced via postgrant information from national office to epo] |
Ref country code: LU Free format text: LAPSE BECAUSE OF NON-PAYMENT OF DUE FEES Effective date: 20250319 |
|
| REG | Reference to a national code |
Ref country code: BE Ref legal event code: MM Effective date: 20250331 |
|
| PG25 | Lapsed in a contracting state [announced via postgrant information from national office to epo] |
Ref country code: BE Free format text: LAPSE BECAUSE OF NON-PAYMENT OF DUE FEES Effective date: 20250331 |
|
| PG25 | Lapsed in a contracting state [announced via postgrant information from national office to epo] |
Ref country code: CH Free format text: LAPSE BECAUSE OF NON-PAYMENT OF DUE FEES Effective date: 20250331 |
|
| PG25 | Lapsed in a contracting state [announced via postgrant information from national office to epo] |
Ref country code: IE Free format text: LAPSE BECAUSE OF NON-PAYMENT OF DUE FEES Effective date: 20250319 |
|
| PG25 | Lapsed in a contracting state [announced via postgrant information from national office to epo] |
Ref country code: IT Free format text: LAPSE BECAUSE OF FAILURE TO SUBMIT A TRANSLATION OF THE DESCRIPTION OR TO PAY THE FEE WITHIN THE PRESCRIBED TIME-LIMIT Effective date: 20240717 |
|
| PGFP | Annual fee paid to national office [announced via postgrant information from national office to epo] |
Ref country code: GB Payment date: 20260220 Year of fee payment: 9 |
|
| PGFP | Annual fee paid to national office [announced via postgrant information from national office to epo] |
Ref country code: DE Payment date: 20260219 Year of fee payment: 9 |
|
| PGFP | Annual fee paid to national office [announced via postgrant information from national office to epo] |
Ref country code: FR Payment date: 20260219 Year of fee payment: 9 |