EP3301454B1 - Instrument et système d'identification rapide de micro-organismes et de test de susceptibilité d'agent antimicrobien - Google Patents
Instrument et système d'identification rapide de micro-organismes et de test de susceptibilité d'agent antimicrobien Download PDFInfo
- Publication number
- EP3301454B1 EP3301454B1 EP16192372.7A EP16192372A EP3301454B1 EP 3301454 B1 EP3301454 B1 EP 3301454B1 EP 16192372 A EP16192372 A EP 16192372A EP 3301454 B1 EP3301454 B1 EP 3301454B1
- Authority
- EP
- European Patent Office
- Prior art keywords
- sample
- microbial
- cassette
- component
- ast
- Prior art date
- Legal status (The legal status is an assumption and is not a legal conclusion. Google has not performed a legal analysis and makes no representation as to the accuracy of the status listed.)
- Active
Links
- 238000012360 testing method Methods 0.000 title claims description 241
- 244000005700 microbiome Species 0.000 title claims description 207
- 239000004599 antimicrobial Substances 0.000 title claims description 48
- 239000000523 sample Substances 0.000 claims description 496
- 238000003908 quality control method Methods 0.000 claims description 294
- 238000000034 method Methods 0.000 claims description 271
- 239000003153 chemical reaction reagent Substances 0.000 claims description 237
- 238000009635 antibiotic susceptibility testing Methods 0.000 claims description 204
- 230000008569 process Effects 0.000 claims description 163
- 230000000813 microbial effect Effects 0.000 claims description 99
- 230000012010 growth Effects 0.000 claims description 56
- 238000001514 detection method Methods 0.000 claims description 42
- 150000007523 nucleic acids Chemical class 0.000 claims description 40
- 108020004707 nucleic acids Proteins 0.000 claims description 37
- 102000039446 nucleic acids Human genes 0.000 claims description 37
- 230000000845 anti-microbial effect Effects 0.000 claims description 35
- 241000191967 Staphylococcus aureus Species 0.000 claims description 31
- 230000000295 complement effect Effects 0.000 claims description 30
- 241000588724 Escherichia coli Species 0.000 claims description 29
- 241000588914 Enterobacter Species 0.000 claims description 25
- 241000193998 Streptococcus pneumoniae Species 0.000 claims description 25
- 229940031000 streptococcus pneumoniae Drugs 0.000 claims description 25
- 229920001817 Agar Polymers 0.000 claims description 24
- 239000008272 agar Substances 0.000 claims description 24
- 230000003287 optical effect Effects 0.000 claims description 24
- 235000015097 nutrients Nutrition 0.000 claims description 21
- 241000588626 Acinetobacter baumannii Species 0.000 claims description 20
- 241000589517 Pseudomonas aeruginosa Species 0.000 claims description 20
- 241000222122 Candida albicans Species 0.000 claims description 18
- 241000194032 Enterococcus faecalis Species 0.000 claims description 18
- 241000194031 Enterococcus faecium Species 0.000 claims description 18
- 229940032049 enterococcus faecalis Drugs 0.000 claims description 17
- 241000194017 Streptococcus Species 0.000 claims description 15
- 241000607715 Serratia marcescens Species 0.000 claims description 14
- 230000027455 binding Effects 0.000 claims description 13
- 229940095731 candida albicans Drugs 0.000 claims description 12
- ULGZDMOVFRHVEP-RWJQBGPGSA-N Erythromycin Chemical compound O([C@@H]1[C@@H](C)C(=O)O[C@@H]([C@@]([C@H](O)[C@@H](C)C(=O)[C@H](C)C[C@@](C)(O)[C@H](O[C@H]2[C@@H]([C@H](C[C@@H](C)O2)N(C)C)O)[C@H]1C)(C)O)CC)[C@H]1C[C@@](C)(OC)[C@@H](O)[C@H](C)O1 ULGZDMOVFRHVEP-RWJQBGPGSA-N 0.000 claims description 10
- 241001134656 Staphylococcus lugdunensis Species 0.000 claims description 10
- 241000193985 Streptococcus agalactiae Species 0.000 claims description 10
- MYSWGUAQZAJSOK-UHFFFAOYSA-N ciprofloxacin Chemical compound C12=CC(N3CCNCC3)=C(F)C=C2C(=O)C(C(=O)O)=CN1C1CC1 MYSWGUAQZAJSOK-UHFFFAOYSA-N 0.000 claims description 10
- 239000004005 microsphere Substances 0.000 claims description 10
- LITBAYYWXZOHAW-XDZRHBBOSA-N (2s,5r,6r)-6-[[(2r)-2-[(4-ethyl-2,3-dioxopiperazine-1-carbonyl)amino]-2-phenylacetyl]amino]-3,3-dimethyl-7-oxo-4-thia-1-azabicyclo[3.2.0]heptane-2-carboxylic acid;(2s,3s,5r)-3-methyl-4,4,7-trioxo-3-(triazol-1-ylmethyl)-4$l^{6}-thia-1-azabicyclo[3.2.0]hept Chemical compound C([C@]1(C)S([C@H]2N(C(C2)=O)[C@H]1C(O)=O)(=O)=O)N1C=CN=N1.O=C1C(=O)N(CC)CCN1C(=O)N[C@H](C=1C=CC=CC=1)C(=O)N[C@@H]1C(=O)N2[C@@H](C(O)=O)C(C)(C)S[C@@H]21 LITBAYYWXZOHAW-XDZRHBBOSA-N 0.000 claims description 8
- 241000588923 Citrobacter Species 0.000 claims description 8
- 241000588748 Klebsiella Species 0.000 claims description 8
- 241000588769 Proteus <enterobacteria> Species 0.000 claims description 8
- 241000222126 [Candida] glabrata Species 0.000 claims description 8
- 208000032343 candida glabrata infection Diseases 0.000 claims description 8
- WHWDWIHXSPCOKZ-UHFFFAOYSA-N hexahydrofarnesyl acetone Natural products CC(C)CCCC(C)CCCC(C)CCCC(C)=O WHWDWIHXSPCOKZ-UHFFFAOYSA-N 0.000 claims description 8
- 241000191940 Staphylococcus Species 0.000 claims description 7
- 229960004821 amikacin Drugs 0.000 claims description 5
- LKCWBDHBTVXHDL-RMDFUYIESA-N amikacin Chemical compound O([C@@H]1[C@@H](N)C[C@H]([C@@H]([C@H]1O)O[C@@H]1[C@@H]([C@@H](N)[C@H](O)[C@@H](CO)O1)O)NC(=O)[C@@H](O)CCN)[C@H]1O[C@H](CN)[C@@H](O)[C@H](O)[C@H]1O LKCWBDHBTVXHDL-RMDFUYIESA-N 0.000 claims description 5
- 229960003405 ciprofloxacin Drugs 0.000 claims description 5
- 229960003276 erythromycin Drugs 0.000 claims description 5
- WZPBZJONDBGPKJ-UHFFFAOYSA-N Antibiotic SQ 26917 Natural products O=C1N(S(O)(=O)=O)C(C)C1NC(=O)C(=NOC(C)(C)C(O)=O)C1=CSC(N)=N1 WZPBZJONDBGPKJ-UHFFFAOYSA-N 0.000 claims description 4
- WKDDRNSBRWANNC-UHFFFAOYSA-N Thienamycin Natural products C1C(SCCN)=C(C(O)=O)N2C(=O)C(C(O)C)C21 WKDDRNSBRWANNC-UHFFFAOYSA-N 0.000 claims description 4
- 229960000723 ampicillin Drugs 0.000 claims description 4
- AVKUERGKIZMTKX-NJBDSQKTSA-N ampicillin Chemical compound C1([C@@H](N)C(=O)N[C@H]2[C@H]3SC([C@@H](N3C2=O)C(O)=O)(C)C)=CC=CC=C1 AVKUERGKIZMTKX-NJBDSQKTSA-N 0.000 claims description 4
- WZPBZJONDBGPKJ-VEHQQRBSSA-N aztreonam Chemical compound O=C1N(S([O-])(=O)=O)[C@@H](C)[C@@H]1NC(=O)C(=N/OC(C)(C)C(O)=O)\C1=CSC([NH3+])=N1 WZPBZJONDBGPKJ-VEHQQRBSSA-N 0.000 claims description 4
- 229960003644 aztreonam Drugs 0.000 claims description 4
- 229960002100 cefepime Drugs 0.000 claims description 4
- HVFLCNVBZFFHBT-ZKDACBOMSA-N cefepime Chemical compound S([C@@H]1[C@@H](C(N1C=1C([O-])=O)=O)NC(=O)\C(=N/OC)C=2N=C(N)SC=2)CC=1C[N+]1(C)CCCC1 HVFLCNVBZFFHBT-ZKDACBOMSA-N 0.000 claims description 4
- 229960003722 doxycycline Drugs 0.000 claims description 4
- 229960002182 imipenem Drugs 0.000 claims description 4
- ZSKVGTPCRGIANV-ZXFLCMHBSA-N imipenem Chemical compound C1C(SCC\N=C\N)=C(C(O)=O)N2C(=O)[C@H]([C@H](O)C)[C@H]21 ZSKVGTPCRGIANV-ZXFLCMHBSA-N 0.000 claims description 4
- 229960003907 linezolid Drugs 0.000 claims description 4
- TYZROVQLWOKYKF-ZDUSSCGKSA-N linezolid Chemical compound O=C1O[C@@H](CNC(=O)C)CN1C(C=C1F)=CC=C1N1CCOCC1 TYZROVQLWOKYKF-ZDUSSCGKSA-N 0.000 claims description 4
- 229960004023 minocycline Drugs 0.000 claims description 4
- WZRJTRPJURQBRM-UHFFFAOYSA-N 4-amino-n-(5-methyl-1,2-oxazol-3-yl)benzenesulfonamide;5-[(3,4,5-trimethoxyphenyl)methyl]pyrimidine-2,4-diamine Chemical compound O1C(C)=CC(NS(=O)(=O)C=2C=CC(N)=CC=2)=N1.COC1=C(OC)C(OC)=CC(CC=2C(=NC(N)=NC=2)N)=C1 WZRJTRPJURQBRM-UHFFFAOYSA-N 0.000 claims description 3
- 108010078777 Colistin Proteins 0.000 claims description 3
- 108010013198 Daptomycin Proteins 0.000 claims description 3
- CEAZRRDELHUEMR-URQXQFDESA-N Gentamicin Chemical compound O1[C@H](C(C)NC)CC[C@@H](N)[C@H]1O[C@H]1[C@H](O)[C@@H](O[C@@H]2[C@@H]([C@@H](NC)[C@@](C)(O)CO2)O)[C@H](N)C[C@@H]1N CEAZRRDELHUEMR-URQXQFDESA-N 0.000 claims description 3
- 229930182566 Gentamicin Natural products 0.000 claims description 3
- JUZNIMUFDBIJCM-ANEDZVCMSA-N Invanz Chemical compound O=C([C@H]1NC[C@H](C1)SC=1[C@H](C)[C@@H]2[C@H](C(N2C=1C(O)=O)=O)[C@H](O)C)NC1=CC=CC(C(O)=O)=C1 JUZNIMUFDBIJCM-ANEDZVCMSA-N 0.000 claims description 3
- 229960001139 cefazolin Drugs 0.000 claims description 3
- MLYYVTUWGNIJIB-BXKDBHETSA-N cefazolin Chemical compound S1C(C)=NN=C1SCC1=C(C(O)=O)N2C(=O)[C@@H](NC(=O)CN3N=NN=C3)[C@H]2SC1 MLYYVTUWGNIJIB-BXKDBHETSA-N 0.000 claims description 3
- 229940036735 ceftaroline Drugs 0.000 claims description 3
- ZCCUWMICIWSJIX-NQJJCJBVSA-N ceftaroline fosamil Chemical compound S([C@@H]1[C@@H](C(N1C=1C([O-])=O)=O)NC(=O)\C(=N/OCC)C=2N=C(NP(O)(O)=O)SN=2)CC=1SC(SC=1)=NC=1C1=CC=[N+](C)C=C1 ZCCUWMICIWSJIX-NQJJCJBVSA-N 0.000 claims description 3
- 229960000484 ceftazidime Drugs 0.000 claims description 3
- 229960004755 ceftriaxone Drugs 0.000 claims description 3
- VAAUVRVFOQPIGI-SPQHTLEESA-N ceftriaxone Chemical compound S([C@@H]1[C@@H](C(N1C=1C(O)=O)=O)NC(=O)\C(=N/OC)C=2N=C(N)SC=2)CC=1CSC1=NC(=O)C(=O)NN1C VAAUVRVFOQPIGI-SPQHTLEESA-N 0.000 claims description 3
- 229940047766 co-trimoxazole Drugs 0.000 claims description 3
- 229960003346 colistin Drugs 0.000 claims description 3
- 229960005484 daptomycin Drugs 0.000 claims description 3
- DOAKLVKFURWEDJ-QCMAZARJSA-N daptomycin Chemical compound C([C@H]1C(=O)O[C@H](C)[C@@H](C(NCC(=O)N[C@@H](CCCN)C(=O)N[C@@H](CC(O)=O)C(=O)N[C@H](C)C(=O)N[C@@H](CC(O)=O)C(=O)NCC(=O)N[C@H](CO)C(=O)N[C@H](C(=O)N1)[C@H](C)CC(O)=O)=O)NC(=O)[C@H](CC(O)=O)NC(=O)[C@@H](CC(N)=O)NC(=O)[C@H](CC=1C2=CC=CC=C2NC=1)NC(=O)CCCCCCCCC)C(=O)C1=CC=CC=C1N DOAKLVKFURWEDJ-QCMAZARJSA-N 0.000 claims description 3
- 229960002770 ertapenem Drugs 0.000 claims description 3
- 229960002518 gentamicin Drugs 0.000 claims description 3
- 229960002260 meropenem Drugs 0.000 claims description 3
- DMJNNHOOLUXYBV-PQTSNVLCSA-N meropenem Chemical compound C=1([C@H](C)[C@@H]2[C@H](C(N2C=1C(O)=O)=O)[C@H](O)C)S[C@@H]1CN[C@H](C(=O)N(C)C)C1 DMJNNHOOLUXYBV-PQTSNVLCSA-N 0.000 claims description 3
- JORAUNFTUVJTNG-BSTBCYLQSA-N n-[(2s)-4-amino-1-[[(2s,3r)-1-[[(2s)-4-amino-1-oxo-1-[[(3s,6s,9s,12s,15r,18s,21s)-6,9,18-tris(2-aminoethyl)-3-[(1r)-1-hydroxyethyl]-12,15-bis(2-methylpropyl)-2,5,8,11,14,17,20-heptaoxo-1,4,7,10,13,16,19-heptazacyclotricos-21-yl]amino]butan-2-yl]amino]-3-h Chemical compound CC(C)CCCCC(=O)N[C@@H](CCN)C(=O)N[C@H]([C@@H](C)O)CN[C@@H](CCN)C(=O)N[C@H]1CCNC(=O)[C@H]([C@@H](C)O)NC(=O)[C@H](CCN)NC(=O)[C@H](CCN)NC(=O)[C@H](CC(C)C)NC(=O)[C@@H](CC(C)C)NC(=O)[C@H](CCN)NC1=O.CCC(C)CCCCC(=O)N[C@@H](CCN)C(=O)N[C@H]([C@@H](C)O)CN[C@@H](CCN)C(=O)N[C@H]1CCNC(=O)[C@H]([C@@H](C)O)NC(=O)[C@H](CCN)NC(=O)[C@H](CCN)NC(=O)[C@H](CC(C)C)NC(=O)[C@@H](CC(C)C)NC(=O)[C@H](CCN)NC1=O JORAUNFTUVJTNG-BSTBCYLQSA-N 0.000 claims description 3
- XDJYMJULXQKGMM-UHFFFAOYSA-N polymyxin E1 Natural products CCC(C)CCCCC(=O)NC(CCN)C(=O)NC(C(C)O)C(=O)NC(CCN)C(=O)NC1CCNC(=O)C(C(C)O)NC(=O)C(CCN)NC(=O)C(CCN)NC(=O)C(CC(C)C)NC(=O)C(CC(C)C)NC(=O)C(CCN)NC1=O XDJYMJULXQKGMM-UHFFFAOYSA-N 0.000 claims description 3
- KNIWPHSUTGNZST-UHFFFAOYSA-N polymyxin E2 Natural products CC(C)CCCCC(=O)NC(CCN)C(=O)NC(C(C)O)C(=O)NC(CCN)C(=O)NC1CCNC(=O)C(C(C)O)NC(=O)C(CCN)NC(=O)C(CCN)NC(=O)C(CC(C)C)NC(=O)C(CC(C)C)NC(=O)C(CCN)NC1=O KNIWPHSUTGNZST-UHFFFAOYSA-N 0.000 claims description 3
- 229960000707 tobramycin Drugs 0.000 claims description 3
- NLVFBUXFDBBNBW-PBSUHMDJSA-N tobramycin Chemical compound N[C@@H]1C[C@H](O)[C@@H](CN)O[C@@H]1O[C@H]1[C@H](O)[C@@H](O[C@@H]2[C@@H]([C@@H](N)[C@H](O)[C@@H](CO)O2)O)[C@H](N)C[C@@H]1N NLVFBUXFDBBNBW-PBSUHMDJSA-N 0.000 claims description 3
- KMEGBUCIGMEPME-LQYKFRDPSA-N (2s,5r,6r)-6-[[(2r)-2-amino-2-phenylacetyl]amino]-3,3-dimethyl-7-oxo-4-thia-1-azabicyclo[3.2.0]heptane-2-carboxylic acid;(1r,4s)-3,3-dimethyl-2,2,6-trioxo-2$l^{6}-thiabicyclo[3.2.0]heptane-4-carboxylic acid Chemical compound O=S1(=O)C(C)(C)[C@H](C(O)=O)C2C(=O)C[C@H]21.C1([C@@H](N)C(=O)N[C@H]2[C@H]3SC([C@@H](N3C2=O)C(O)=O)(C)C)=CC=CC=C1 KMEGBUCIGMEPME-LQYKFRDPSA-N 0.000 claims description 2
- 241000943303 Enterococcus faecalis ATCC 29212 Species 0.000 claims description 2
- 241001360526 Escherichia coli ATCC 25922 Species 0.000 claims description 2
- MYPYJXKWCTUITO-KIIOPKALSA-N chembl3301825 Chemical compound O([C@@H]1[C@@H](O)[C@H](O)[C@@H](CO)O[C@H]1OC1=C2C=C3C=C1OC1=CC=C(C=C1Cl)[C@@H](O)[C@H](C(N[C@@H](CC(N)=O)C(=O)N[C@H]3C(=O)N[C@H]1C(=O)N[C@H](C(N[C@H](C3=CC(O)=CC(O)=C3C=3C(O)=CC=C1C=3)C(O)=O)=O)[C@H](O)C1=CC=C(C(=C1)Cl)O2)=O)NC(=O)[C@@H](CC(C)C)NC)[C@H]1C[C@](C)(N)C(O)[C@H](C)O1 MYPYJXKWCTUITO-KIIOPKALSA-N 0.000 claims description 2
- 230000009089 cytolysis Effects 0.000 claims description 2
- 238000012544 monitoring process Methods 0.000 claims description 2
- NMVPEQXCMGEDNH-TZVUEUGBSA-N ceftazidime pentahydrate Chemical compound O.O.O.O.O.S([C@@H]1[C@@H](C(N1C=1C([O-])=O)=O)NC(=O)\C(=N/OC(C)(C)C(O)=O)C=2N=C(N)SC=2)CC=1C[N+]1=CC=CC=C1 NMVPEQXCMGEDNH-TZVUEUGBSA-N 0.000 claims 1
- XQTWDDCIUJNLTR-CVHRZJFOSA-N doxycycline monohydrate Chemical compound O.O=C1C2=C(O)C=CC=C2[C@H](C)[C@@H]2C1=C(O)[C@]1(O)C(=O)C(C(N)=O)=C(O)[C@@H](N(C)C)[C@@H]1[C@H]2O XQTWDDCIUJNLTR-CVHRZJFOSA-N 0.000 claims 1
- DYKFCLLONBREIL-KVUCHLLUSA-N minocycline Chemical compound C([C@H]1C2)C3=C(N(C)C)C=CC(O)=C3C(=O)C1=C(O)[C@@]1(O)[C@@H]2[C@H](N(C)C)C(O)=C(C(N)=O)C1=O DYKFCLLONBREIL-KVUCHLLUSA-N 0.000 claims 1
- 210000004027 cell Anatomy 0.000 description 199
- 239000000306 component Substances 0.000 description 190
- 238000010790 dilution Methods 0.000 description 148
- 239000012895 dilution Substances 0.000 description 148
- 238000003556 assay Methods 0.000 description 84
- 230000001580 bacterial effect Effects 0.000 description 84
- 241000894007 species Species 0.000 description 65
- 241000894006 Bacteria Species 0.000 description 59
- 239000013610 patient sample Substances 0.000 description 54
- 239000012530 fluid Substances 0.000 description 47
- 238000009826 distribution Methods 0.000 description 43
- 238000004458 analytical method Methods 0.000 description 42
- 239000011521 glass Substances 0.000 description 39
- 239000003102 growth factor Substances 0.000 description 38
- 238000003384 imaging method Methods 0.000 description 32
- 239000010410 layer Substances 0.000 description 30
- 239000011324 bead Substances 0.000 description 28
- 239000000203 mixture Substances 0.000 description 27
- 230000003115 biocidal effect Effects 0.000 description 26
- 239000002699 waste material Substances 0.000 description 25
- 230000035945 sensitivity Effects 0.000 description 24
- 238000003860 storage Methods 0.000 description 24
- 238000005286 illumination Methods 0.000 description 23
- 238000012545 processing Methods 0.000 description 22
- 238000012549 training Methods 0.000 description 22
- 230000033001 locomotion Effects 0.000 description 21
- 238000000386 microscopy Methods 0.000 description 21
- 239000002609 medium Substances 0.000 description 20
- 230000014509 gene expression Effects 0.000 description 19
- 238000010438 heat treatment Methods 0.000 description 19
- 239000012898 sample dilution Substances 0.000 description 19
- 238000009640 blood culture Methods 0.000 description 18
- 238000004891 communication Methods 0.000 description 17
- 238000002360 preparation method Methods 0.000 description 17
- 239000003242 anti bacterial agent Substances 0.000 description 16
- 210000004369 blood Anatomy 0.000 description 16
- 239000008280 blood Substances 0.000 description 16
- 238000013459 approach Methods 0.000 description 15
- 230000008901 benefit Effects 0.000 description 15
- 230000006870 function Effects 0.000 description 15
- 239000000243 solution Substances 0.000 description 15
- 241000588747 Klebsiella pneumoniae Species 0.000 description 14
- 230000000694 effects Effects 0.000 description 14
- 239000000499 gel Substances 0.000 description 14
- 239000002054 inoculum Substances 0.000 description 14
- DPKHZNPWBDQZCN-UHFFFAOYSA-N acridine orange free base Chemical compound C1=CC(N(C)C)=CC2=NC3=CC(N(C)C)=CC=C3C=C21 DPKHZNPWBDQZCN-UHFFFAOYSA-N 0.000 description 13
- 229940088710 antibiotic agent Drugs 0.000 description 13
- DZBUGLKDJFMEHC-UHFFFAOYSA-N benzoquinolinylidene Natural products C1=CC=CC2=CC3=CC=CC=C3N=C21 DZBUGLKDJFMEHC-UHFFFAOYSA-N 0.000 description 13
- 238000011156 evaluation Methods 0.000 description 13
- 238000011282 treatment Methods 0.000 description 13
- 238000002474 experimental method Methods 0.000 description 12
- 230000004044 response Effects 0.000 description 12
- 210000005253 yeast cell Anatomy 0.000 description 12
- 238000001816 cooling Methods 0.000 description 11
- 239000000463 material Substances 0.000 description 11
- 238000012795 verification Methods 0.000 description 11
- 239000002918 waste heat Substances 0.000 description 11
- 241000233866 Fungi Species 0.000 description 10
- 230000008859 change Effects 0.000 description 10
- 238000010586 diagram Methods 0.000 description 10
- 239000001963 growth medium Substances 0.000 description 10
- 238000013095 identification testing Methods 0.000 description 10
- 239000000047 product Substances 0.000 description 10
- RJQXTJLFIWVMTO-TYNCELHUSA-N Methicillin Chemical compound COC1=CC=CC(OC)=C1C(=O)N[C@@H]1C(=O)N2[C@@H](C(O)=O)C(C)(C)S[C@@H]21 RJQXTJLFIWVMTO-TYNCELHUSA-N 0.000 description 9
- 241000607720 Serratia Species 0.000 description 9
- 230000007423 decrease Effects 0.000 description 9
- 230000005284 excitation Effects 0.000 description 9
- 229960003085 meticillin Drugs 0.000 description 9
- 229920000642 polymer Polymers 0.000 description 9
- 241000588917 Citrobacter koseri Species 0.000 description 8
- 241000194033 Enterococcus Species 0.000 description 8
- 241000588770 Proteus mirabilis Species 0.000 description 8
- 238000013461 design Methods 0.000 description 8
- 230000002401 inhibitory effect Effects 0.000 description 8
- 230000000670 limiting effect Effects 0.000 description 8
- 244000052769 pathogen Species 0.000 description 8
- 229920000729 poly(L-lysine) polymer Polymers 0.000 description 8
- 230000002829 reductive effect Effects 0.000 description 8
- UCSJYZPVAKXKNQ-HZYVHMACSA-N streptomycin Chemical compound CN[C@H]1[C@H](O)[C@@H](O)[C@H](CO)O[C@H]1O[C@@H]1[C@](C=O)(O)[C@H](C)O[C@H]1O[C@@H]1[C@@H](NC(N)=N)[C@H](O)[C@@H](NC(N)=N)[C@H](O)[C@H]1O UCSJYZPVAKXKNQ-HZYVHMACSA-N 0.000 description 8
- 241000588749 Klebsiella oxytoca Species 0.000 description 7
- 230000009471 action Effects 0.000 description 7
- 238000011043 electrofiltration Methods 0.000 description 7
- 238000009472 formulation Methods 0.000 description 7
- 238000009396 hybridization Methods 0.000 description 7
- 230000000717 retained effect Effects 0.000 description 7
- 108020004414 DNA Proteins 0.000 description 6
- 241000588697 Enterobacter cloacae Species 0.000 description 6
- 241000588915 Klebsiella aerogenes Species 0.000 description 6
- 229930182555 Penicillin Natural products 0.000 description 6
- 240000004808 Saccharomyces cerevisiae Species 0.000 description 6
- 241000193996 Streptococcus pyogenes Species 0.000 description 6
- 230000004888 barrier function Effects 0.000 description 6
- 239000000872 buffer Substances 0.000 description 6
- 230000010261 cell growth Effects 0.000 description 6
- 238000007865 diluting Methods 0.000 description 6
- 238000003113 dilution method Methods 0.000 description 6
- 230000005684 electric field Effects 0.000 description 6
- 238000005516 engineering process Methods 0.000 description 6
- 230000000977 initiatory effect Effects 0.000 description 6
- 230000036961 partial effect Effects 0.000 description 6
- 230000008823 permeabilization Effects 0.000 description 6
- 229940104641 piperacillin / tazobactam Drugs 0.000 description 6
- XJMOSONTPMZWPB-UHFFFAOYSA-M propidium iodide Chemical compound [I-].[I-].C12=CC(N)=CC=C2C2=CC=C(N)C=C2[N+](CCC[N+](C)(CC)CC)=C1C1=CC=CC=C1 XJMOSONTPMZWPB-UHFFFAOYSA-M 0.000 description 6
- 238000011002 quantification Methods 0.000 description 6
- 238000005070 sampling Methods 0.000 description 6
- 238000002560 therapeutic procedure Methods 0.000 description 6
- 108090000790 Enzymes Proteins 0.000 description 5
- 102000004190 Enzymes Human genes 0.000 description 5
- LFQSCWFLJHTTHZ-UHFFFAOYSA-N Ethanol Chemical compound CCO LFQSCWFLJHTTHZ-UHFFFAOYSA-N 0.000 description 5
- JGSARLDLIJGVTE-MBNYWOFBSA-N Penicillin G Chemical compound N([C@H]1[C@H]2SC([C@@H](N2C1=O)C(O)=O)(C)C)C(=O)CC1=CC=CC=C1 JGSARLDLIJGVTE-MBNYWOFBSA-N 0.000 description 5
- 241000295644 Staphylococcaceae Species 0.000 description 5
- 108010059993 Vancomycin Proteins 0.000 description 5
- 238000004364 calculation method Methods 0.000 description 5
- 230000001276 controlling effect Effects 0.000 description 5
- 230000008878 coupling Effects 0.000 description 5
- 238000010168 coupling process Methods 0.000 description 5
- 238000005859 coupling reaction Methods 0.000 description 5
- 229940092559 enterobacter aerogenes Drugs 0.000 description 5
- 238000001704 evaporation Methods 0.000 description 5
- 230000008020 evaporation Effects 0.000 description 5
- 239000011888 foil Substances 0.000 description 5
- 238000011068 loading method Methods 0.000 description 5
- 230000007246 mechanism Effects 0.000 description 5
- 239000013642 negative control Substances 0.000 description 5
- 229940049954 penicillin Drugs 0.000 description 5
- 239000004033 plastic Substances 0.000 description 5
- 230000001681 protective effect Effects 0.000 description 5
- 230000000241 respiratory effect Effects 0.000 description 5
- 229960003165 vancomycin Drugs 0.000 description 5
- MYPYJXKWCTUITO-LYRMYLQWSA-N vancomycin Chemical compound O([C@@H]1[C@@H](O)[C@H](O)[C@@H](CO)O[C@H]1OC1=C2C=C3C=C1OC1=CC=C(C=C1Cl)[C@@H](O)[C@H](C(N[C@@H](CC(N)=O)C(=O)N[C@H]3C(=O)N[C@H]1C(=O)N[C@H](C(N[C@@H](C3=CC(O)=CC(O)=C3C=3C(O)=CC=C1C=3)C(O)=O)=O)[C@H](O)C1=CC=C(C(=C1)Cl)O2)=O)NC(=O)[C@@H](CC(C)C)NC)[C@H]1C[C@](C)(N)[C@H](O)[C@H](C)O1 MYPYJXKWCTUITO-LYRMYLQWSA-N 0.000 description 5
- MYPYJXKWCTUITO-UHFFFAOYSA-N vancomycin Natural products O1C(C(=C2)Cl)=CC=C2C(O)C(C(NC(C2=CC(O)=CC(O)=C2C=2C(O)=CC=C3C=2)C(O)=O)=O)NC(=O)C3NC(=O)C2NC(=O)C(CC(N)=O)NC(=O)C(NC(=O)C(CC(C)C)NC)C(O)C(C=C3Cl)=CC=C3OC3=CC2=CC1=C3OC1OC(CO)C(O)C(O)C1OC1CC(C)(N)C(O)C(C)O1 MYPYJXKWCTUITO-UHFFFAOYSA-N 0.000 description 5
- XLYOFNOQVPJJNP-UHFFFAOYSA-N water Chemical compound O XLYOFNOQVPJJNP-UHFFFAOYSA-N 0.000 description 5
- 241000588919 Citrobacter freundii Species 0.000 description 4
- 238000007476 Maximum Likelihood Methods 0.000 description 4
- 241000589516 Pseudomonas Species 0.000 description 4
- 241000589886 Treponema Species 0.000 description 4
- 229910052782 aluminium Inorganic materials 0.000 description 4
- XAGFODPZIPBFFR-UHFFFAOYSA-N aluminium Chemical compound [Al] XAGFODPZIPBFFR-UHFFFAOYSA-N 0.000 description 4
- 238000013096 assay test Methods 0.000 description 4
- 239000012472 biological sample Substances 0.000 description 4
- 238000007444 cell Immobilization Methods 0.000 description 4
- 230000001413 cellular effect Effects 0.000 description 4
- 238000011161 development Methods 0.000 description 4
- 230000007613 environmental effect Effects 0.000 description 4
- 230000002538 fungal effect Effects 0.000 description 4
- 230000005484 gravity Effects 0.000 description 4
- 230000007773 growth pattern Effects 0.000 description 4
- 238000007901 in situ hybridization Methods 0.000 description 4
- 238000003780 insertion Methods 0.000 description 4
- 230000037431 insertion Effects 0.000 description 4
- 125000005647 linker group Chemical group 0.000 description 4
- 239000007788 liquid Substances 0.000 description 4
- 238000004519 manufacturing process Methods 0.000 description 4
- 238000005259 measurement Methods 0.000 description 4
- 230000000877 morphologic effect Effects 0.000 description 4
- 230000001717 pathogenic effect Effects 0.000 description 4
- 238000007747 plating Methods 0.000 description 4
- 230000001105 regulatory effect Effects 0.000 description 4
- 230000008261 resistance mechanism Effects 0.000 description 4
- 229960005322 streptomycin Drugs 0.000 description 4
- 239000000725 suspension Substances 0.000 description 4
- 210000002700 urine Anatomy 0.000 description 4
- 230000000007 visual effect Effects 0.000 description 4
- SGKRLCUYIXIAHR-AKNGSSGZSA-N (4s,4ar,5s,5ar,6r,12ar)-4-(dimethylamino)-1,5,10,11,12a-pentahydroxy-6-methyl-3,12-dioxo-4a,5,5a,6-tetrahydro-4h-tetracene-2-carboxamide Chemical compound C1=CC=C2[C@H](C)[C@@H]([C@H](O)[C@@H]3[C@](C(O)=C(C(N)=O)C(=O)[C@H]3N(C)C)(O)C3=O)C3=C(O)C2=C1O SGKRLCUYIXIAHR-AKNGSSGZSA-N 0.000 description 3
- FFTVPQUHLQBXQZ-KVUCHLLUSA-N (4s,4as,5ar,12ar)-4,7-bis(dimethylamino)-1,10,11,12a-tetrahydroxy-3,12-dioxo-4a,5,5a,6-tetrahydro-4h-tetracene-2-carboxamide Chemical compound C1C2=C(N(C)C)C=CC(O)=C2C(O)=C2[C@@H]1C[C@H]1[C@H](N(C)C)C(=O)C(C(N)=O)=C(O)[C@@]1(O)C2=O FFTVPQUHLQBXQZ-KVUCHLLUSA-N 0.000 description 3
- VLPJFMZVPMTRLU-UHFFFAOYSA-N 4-[[2-[3-(ethylamino)-6-ethylimino-4,5-disulfoxanthen-9-yl]benzoyl]-methylamino]butanoic acid Chemical compound C=12C=CC(=NCC)C(S(O)(=O)=O)=C2OC2=C(S(O)(=O)=O)C(NCC)=CC=C2C=1C1=CC=CC=C1C(=O)N(C)CCCC(O)=O VLPJFMZVPMTRLU-UHFFFAOYSA-N 0.000 description 3
- FWMNVWWHGCHHJJ-SKKKGAJSSA-N 4-amino-1-[(2r)-6-amino-2-[[(2r)-2-[[(2r)-2-[[(2r)-2-amino-3-phenylpropanoyl]amino]-3-phenylpropanoyl]amino]-4-methylpentanoyl]amino]hexanoyl]piperidine-4-carboxylic acid Chemical compound C([C@H](C(=O)N[C@H](CC(C)C)C(=O)N[C@H](CCCCN)C(=O)N1CCC(N)(CC1)C(O)=O)NC(=O)[C@H](N)CC=1C=CC=CC=1)C1=CC=CC=C1 FWMNVWWHGCHHJJ-SKKKGAJSSA-N 0.000 description 3
- 208000031729 Bacteremia Diseases 0.000 description 3
- 238000010207 Bayesian analysis Methods 0.000 description 3
- 241000186216 Corynebacterium Species 0.000 description 3
- 208000028399 Critical Illness Diseases 0.000 description 3
- 102000053602 DNA Human genes 0.000 description 3
- 108020004711 Nucleic Acid Probes Proteins 0.000 description 3
- 108091028043 Nucleic acid sequence Proteins 0.000 description 3
- 239000001888 Peptone Substances 0.000 description 3
- 108010080698 Peptones Proteins 0.000 description 3
- 206010036790 Productive cough Diseases 0.000 description 3
- 241000588767 Proteus vulgaris Species 0.000 description 3
- 241000191963 Staphylococcus epidermidis Species 0.000 description 3
- 241000191984 Staphylococcus haemolyticus Species 0.000 description 3
- 241001288016 Streptococcus gallolyticus Species 0.000 description 3
- 241001134658 Streptococcus mitis Species 0.000 description 3
- 239000004098 Tetracycline Substances 0.000 description 3
- 229940126575 aminoglycoside Drugs 0.000 description 3
- 239000012503 blood component Substances 0.000 description 3
- WZOZEZRFJCJXNZ-ZBFHGGJFSA-N cefoxitin Chemical compound N([C@]1(OC)C(N2C(=C(COC(N)=O)CS[C@@H]21)C(O)=O)=O)C(=O)CC1=CC=CS1 WZOZEZRFJCJXNZ-ZBFHGGJFSA-N 0.000 description 3
- 229960002682 cefoxitin Drugs 0.000 description 3
- JQXXHWHPUNPDRT-YOPQJBRCSA-N chembl1332716 Chemical compound O([C@](C1=O)(C)O\C=C/[C@@H]([C@H]([C@@H](OC(C)=O)[C@H](C)[C@H](O)[C@H](C)[C@@H](O)[C@@H](C)/C=C\C=C(C)/C(=O)NC=2C(O)=C3C(O)=C4C)C)OC)C4=C1C3=C(O)C=2\C=N\N1CCN(C)CC1 JQXXHWHPUNPDRT-YOPQJBRCSA-N 0.000 description 3
- 229960005091 chloramphenicol Drugs 0.000 description 3
- WIIZWVCIJKGZOK-RKDXNWHRSA-N chloramphenicol Chemical compound ClC(Cl)C(=O)N[C@H](CO)[C@H](O)C1=CC=C([N+]([O-])=O)C=C1 WIIZWVCIJKGZOK-RKDXNWHRSA-N 0.000 description 3
- 239000011248 coating agent Substances 0.000 description 3
- 238000000576 coating method Methods 0.000 description 3
- 230000001332 colony forming effect Effects 0.000 description 3
- 239000000356 contaminant Substances 0.000 description 3
- 238000012258 culturing Methods 0.000 description 3
- 238000013016 damping Methods 0.000 description 3
- 230000003111 delayed effect Effects 0.000 description 3
- 238000009792 diffusion process Methods 0.000 description 3
- 239000012470 diluted sample Substances 0.000 description 3
- 239000000975 dye Substances 0.000 description 3
- -1 fecluroxime Chemical compound 0.000 description 3
- 238000011049 filling Methods 0.000 description 3
- 239000012535 impurity Substances 0.000 description 3
- AMGQUBHHOARCQH-UHFFFAOYSA-N indium;oxotin Chemical compound [In].[Sn]=O AMGQUBHHOARCQH-UHFFFAOYSA-N 0.000 description 3
- 238000002372 labelling Methods 0.000 description 3
- 239000003550 marker Substances 0.000 description 3
- 230000005012 migration Effects 0.000 description 3
- 238000013508 migration Methods 0.000 description 3
- 239000002853 nucleic acid probe Substances 0.000 description 3
- 239000005022 packaging material Substances 0.000 description 3
- 235000019319 peptone Nutrition 0.000 description 3
- 238000007781 pre-processing Methods 0.000 description 3
- 229940007042 proteus vulgaris Drugs 0.000 description 3
- 230000010076 replication Effects 0.000 description 3
- PYWVYCXTNDRMGF-UHFFFAOYSA-N rhodamine B Chemical compound [Cl-].C=12C=CC(=[N+](CC)CC)C=C2OC2=CC(N(CC)CC)=CC=C2C=1C1=CC=CC=C1C(O)=O PYWVYCXTNDRMGF-UHFFFAOYSA-N 0.000 description 3
- 229960001225 rifampicin Drugs 0.000 description 3
- 238000007789 sealing Methods 0.000 description 3
- 238000000926 separation method Methods 0.000 description 3
- 239000002904 solvent Substances 0.000 description 3
- 229960000268 spectinomycin Drugs 0.000 description 3
- UNFWWIHTNXNPBV-WXKVUWSESA-N spectinomycin Chemical compound O([C@@H]1[C@@H](NC)[C@@H](O)[C@H]([C@@H]([C@H]1O1)O)NC)[C@]2(O)[C@H]1O[C@H](C)CC2=O UNFWWIHTNXNPBV-WXKVUWSESA-N 0.000 description 3
- 210000003802 sputum Anatomy 0.000 description 3
- 208000024794 sputum Diseases 0.000 description 3
- 239000000126 substance Substances 0.000 description 3
- 235000019364 tetracycline Nutrition 0.000 description 3
- 150000003522 tetracyclines Chemical class 0.000 description 3
- 238000012546 transfer Methods 0.000 description 3
- IEDVJHCEMCRBQM-UHFFFAOYSA-N trimethoprim Chemical compound COC1=C(OC)C(OC)=CC(CC=2C(=NC(N)=NC=2)N)=C1 IEDVJHCEMCRBQM-UHFFFAOYSA-N 0.000 description 3
- 229960001082 trimethoprim Drugs 0.000 description 3
- 238000012800 visualization Methods 0.000 description 3
- 238000005406 washing Methods 0.000 description 3
- YSGQGNQWBLYHPE-CFUSNLFHSA-N (7r,8r,9s,10r,13s,14s,17s)-17-hydroxy-7,13-dimethyl-2,6,7,8,9,10,11,12,14,15,16,17-dodecahydro-1h-cyclopenta[a]phenanthren-3-one Chemical compound C1C[C@]2(C)[C@@H](O)CC[C@H]2[C@@H]2[C@H](C)CC3=CC(=O)CC[C@@H]3[C@H]21 YSGQGNQWBLYHPE-CFUSNLFHSA-N 0.000 description 2
- FWBHETKCLVMNFS-UHFFFAOYSA-N 4',6-Diamino-2-phenylindol Chemical compound C1=CC(C(=N)N)=CC=C1C1=CC2=CC=C(C(N)=N)C=C2N1 FWBHETKCLVMNFS-UHFFFAOYSA-N 0.000 description 2
- QCPFFGGFHNZBEP-UHFFFAOYSA-N 4,5,6,7-tetrachloro-3',6'-dihydroxyspiro[2-benzofuran-3,9'-xanthene]-1-one Chemical compound O1C(=O)C(C(=C(Cl)C(Cl)=C2Cl)Cl)=C2C21C1=CC=C(O)C=C1OC1=CC(O)=CC=C21 QCPFFGGFHNZBEP-UHFFFAOYSA-N 0.000 description 2
- 241000228212 Aspergillus Species 0.000 description 2
- 241000589876 Campylobacter Species 0.000 description 2
- 108010065152 Coagulase Proteins 0.000 description 2
- 239000004971 Cross linker Substances 0.000 description 2
- 108020003215 DNA Probes Proteins 0.000 description 2
- 239000003298 DNA probe Substances 0.000 description 2
- 102100020743 Dipeptidase 1 Human genes 0.000 description 2
- 108090000204 Dipeptidase 1 Proteins 0.000 description 2
- 241000605314 Ehrlichia Species 0.000 description 2
- 108010043121 Green Fluorescent Proteins Proteins 0.000 description 2
- 241000589989 Helicobacter Species 0.000 description 2
- 241000589929 Leptospira interrogans Species 0.000 description 2
- GSDSWSVVBLHKDQ-JTQLQIEISA-N Levofloxacin Chemical compound C([C@@H](N1C2=C(C(C(C(O)=O)=C1)=O)C=C1F)C)OC2=C1N1CCN(C)CC1 GSDSWSVVBLHKDQ-JTQLQIEISA-N 0.000 description 2
- 241000588652 Neisseria gonorrhoeae Species 0.000 description 2
- 108091034117 Oligonucleotide Proteins 0.000 description 2
- 241000606693 Orientia tsutsugamushi Species 0.000 description 2
- 244000110797 Polygonum persicaria Species 0.000 description 2
- 241000607142 Salmonella Species 0.000 description 2
- BQCADISMDOOEFD-UHFFFAOYSA-N Silver Chemical compound [Ag] BQCADISMDOOEFD-UHFFFAOYSA-N 0.000 description 2
- 241000192087 Staphylococcus hominis Species 0.000 description 2
- 241000122973 Stenotrophomonas maltophilia Species 0.000 description 2
- PZBFGYYEXUXCOF-UHFFFAOYSA-N TCEP Chemical compound OC(=O)CCP(CCC(O)=O)CCC(O)=O PZBFGYYEXUXCOF-UHFFFAOYSA-N 0.000 description 2
- 241000607598 Vibrio Species 0.000 description 2
- 241000607272 Vibrio parahaemolyticus Species 0.000 description 2
- 241000607265 Vibrio vulnificus Species 0.000 description 2
- 239000000853 adhesive Substances 0.000 description 2
- 230000001070 adhesive effect Effects 0.000 description 2
- 150000001408 amides Chemical class 0.000 description 2
- 150000001413 amino acids Chemical group 0.000 description 2
- 238000000149 argon plasma sintering Methods 0.000 description 2
- 238000003149 assay kit Methods 0.000 description 2
- 230000006399 behavior Effects 0.000 description 2
- 239000003782 beta lactam antibiotic agent Substances 0.000 description 2
- 210000000601 blood cell Anatomy 0.000 description 2
- 238000002815 broth microdilution Methods 0.000 description 2
- 238000011088 calibration curve Methods 0.000 description 2
- 125000004432 carbon atom Chemical group C* 0.000 description 2
- 150000001768 cations Chemical class 0.000 description 2
- ORFOPKXBNMVMKC-DWVKKRMSSA-N ceftazidime Chemical compound S([C@@H]1[C@@H](C(N1C=1C([O-])=O)=O)NC(=O)\C(=N/OC(C)(C)C(O)=O)C=2N=C(N)SC=2)CC=1C[N+]1=CC=CC=C1 ORFOPKXBNMVMKC-DWVKKRMSSA-N 0.000 description 2
- 230000032823 cell division Effects 0.000 description 2
- 239000003795 chemical substances by application Substances 0.000 description 2
- 230000008045 co-localization Effects 0.000 description 2
- 239000002131 composite material Substances 0.000 description 2
- 238000010276 construction Methods 0.000 description 2
- 230000001351 cycling effect Effects 0.000 description 2
- 230000003247 decreasing effect Effects 0.000 description 2
- 239000003599 detergent Substances 0.000 description 2
- 238000003745 diagnosis Methods 0.000 description 2
- 238000002405 diagnostic procedure Methods 0.000 description 2
- 201000010099 disease Diseases 0.000 description 2
- 208000037265 diseases, disorders, signs and symptoms Diseases 0.000 description 2
- 238000006073 displacement reaction Methods 0.000 description 2
- 239000003814 drug Substances 0.000 description 2
- 229940079593 drug Drugs 0.000 description 2
- 238000009112 empiric therapy Methods 0.000 description 2
- AEUTYOVWOVBAKS-UWVGGRQHSA-N ethambutol Chemical compound CC[C@@H](CO)NCCN[C@@H](CC)CO AEUTYOVWOVBAKS-UWVGGRQHSA-N 0.000 description 2
- 238000000799 fluorescence microscopy Methods 0.000 description 2
- 238000001502 gel electrophoresis Methods 0.000 description 2
- 230000036541 health Effects 0.000 description 2
- 230000020169 heat generation Effects 0.000 description 2
- 230000001771 impaired effect Effects 0.000 description 2
- 230000006872 improvement Effects 0.000 description 2
- 238000011534 incubation Methods 0.000 description 2
- 230000003993 interaction Effects 0.000 description 2
- 229960003376 levofloxacin Drugs 0.000 description 2
- 239000003562 lightweight material Substances 0.000 description 2
- 239000011159 matrix material Substances 0.000 description 2
- 230000001404 mediated effect Effects 0.000 description 2
- 239000002480 mineral oil Substances 0.000 description 2
- 235000010446 mineral oil Nutrition 0.000 description 2
- 238000012986 modification Methods 0.000 description 2
- 230000004048 modification Effects 0.000 description 2
- SUWZHLCNFQWNPE-LATRNWQMSA-N optochin Chemical compound C([C@H]([C@H](C1)CC)C2)CN1[C@@H]2[C@H](O)C1=CC=NC2=CC=C(OCC)C=C21 SUWZHLCNFQWNPE-LATRNWQMSA-N 0.000 description 2
- 239000003973 paint Substances 0.000 description 2
- 239000008191 permeabilizing agent Substances 0.000 description 2
- 210000002381 plasma Anatomy 0.000 description 2
- 239000002861 polymer material Substances 0.000 description 2
- 239000011148 porous material Substances 0.000 description 2
- 230000009467 reduction Effects 0.000 description 2
- 239000013074 reference sample Substances 0.000 description 2
- 239000010832 regulated medical waste Substances 0.000 description 2
- 230000003362 replicative effect Effects 0.000 description 2
- 238000011160 research Methods 0.000 description 2
- 210000002966 serum Anatomy 0.000 description 2
- 229910052709 silver Inorganic materials 0.000 description 2
- 239000004332 silver Substances 0.000 description 2
- 238000001228 spectrum Methods 0.000 description 2
- 238000010186 staining Methods 0.000 description 2
- 238000013179 statistical model Methods 0.000 description 2
- 210000000130 stem cell Anatomy 0.000 description 2
- 239000000758 substrate Substances 0.000 description 2
- 238000004381 surface treatment Methods 0.000 description 2
- 230000008685 targeting Effects 0.000 description 2
- 229960002180 tetracycline Drugs 0.000 description 2
- 229930101283 tetracycline Natural products 0.000 description 2
- ABZLKHKQJHEPAX-UHFFFAOYSA-N tetramethylrhodamine Chemical compound C=12C=CC(N(C)C)=CC2=[O+]C2=CC(N(C)C)=CC=C2C=1C1=CC=CC=C1C([O-])=O ABZLKHKQJHEPAX-UHFFFAOYSA-N 0.000 description 2
- 230000001225 therapeutic effect Effects 0.000 description 2
- 230000003442 weekly effect Effects 0.000 description 2
- 239000002132 β-lactam antibiotic Substances 0.000 description 2
- 229940124586 β-lactam antibiotics Drugs 0.000 description 2
- XMAYWYJOQHXEEK-OZXSUGGESA-N (2R,4S)-ketoconazole Chemical compound C1CN(C(=O)C)CCN1C(C=C1)=CC=C1OC[C@@H]1O[C@@](CN2C=NC=C2)(C=2C(=CC(Cl)=CC=2)Cl)OC1 XMAYWYJOQHXEEK-OZXSUGGESA-N 0.000 description 1
- SVDOODSCHVSYEK-IFLJXUKPSA-N (4s,4ar,5s,5ar,6s,12ar)-4-(dimethylamino)-1,5,6,10,11,12a-hexahydroxy-6-methyl-3,12-dioxo-4,4a,5,5a-tetrahydrotetracene-2-carboxamide;hydron;chloride Chemical compound Cl.C1=CC=C2[C@](O)(C)[C@H]3[C@H](O)[C@H]4[C@H](N(C)C)C(=O)C(C(N)=O)=C(O)[C@@]4(O)C(=O)C3=C(O)C2=C1O SVDOODSCHVSYEK-IFLJXUKPSA-N 0.000 description 1
- SOVUOXKZCCAWOJ-HJYUBDRYSA-N (4s,4as,5ar,12ar)-9-[[2-(tert-butylamino)acetyl]amino]-4,7-bis(dimethylamino)-1,10,11,12a-tetrahydroxy-3,12-dioxo-4a,5,5a,6-tetrahydro-4h-tetracene-2-carboxamide Chemical compound C1C2=C(N(C)C)C=C(NC(=O)CNC(C)(C)C)C(O)=C2C(O)=C2[C@@H]1C[C@H]1[C@H](N(C)C)C(=O)C(C(N)=O)=C(O)[C@@]1(O)C2=O SOVUOXKZCCAWOJ-HJYUBDRYSA-N 0.000 description 1
- GUXHBMASAHGULD-SEYHBJAFSA-N (4s,4as,5as,6s,12ar)-7-chloro-4-(dimethylamino)-1,6,10,11,12a-pentahydroxy-3,12-dioxo-4a,5,5a,6-tetrahydro-4h-tetracene-2-carboxamide Chemical compound C1([C@H]2O)=C(Cl)C=CC(O)=C1C(O)=C1[C@@H]2C[C@H]2[C@H](N(C)C)C(=O)C(C(N)=O)=C(O)[C@@]2(O)C1=O GUXHBMASAHGULD-SEYHBJAFSA-N 0.000 description 1
- HBUJYEUPIIJJOS-PBHICJAKSA-N (5r)-3-[4-[1-[(2s)-2,3-dihydroxypropanoyl]-3,6-dihydro-2h-pyridin-4-yl]-3,5-difluorophenyl]-5-(1,2-oxazol-3-yloxymethyl)-1,3-oxazolidin-2-one Chemical compound C1N(C(=O)[C@@H](O)CO)CCC(C=2C(=CC(=CC=2F)N2C(O[C@@H](COC3=NOC=C3)C2)=O)F)=C1 HBUJYEUPIIJJOS-PBHICJAKSA-N 0.000 description 1
- WDLWHQDACQUCJR-ZAMMOSSLSA-N (6r,7r)-7-[[(2r)-2-azaniumyl-2-(4-hydroxyphenyl)acetyl]amino]-8-oxo-3-[(e)-prop-1-enyl]-5-thia-1-azabicyclo[4.2.0]oct-2-ene-2-carboxylate Chemical compound C1([C@@H](N)C(=O)N[C@H]2[C@@H]3N(C2=O)C(=C(CS3)/C=C/C)C(O)=O)=CC=C(O)C=C1 WDLWHQDACQUCJR-ZAMMOSSLSA-N 0.000 description 1
- RXZBMPWDPOLZGW-XMRMVWPWSA-N (E)-roxithromycin Chemical compound O([C@@H]1[C@@H](C)C(=O)O[C@@H]([C@@]([C@H](O)[C@@H](C)C(=N/OCOCCOC)/[C@H](C)C[C@@](C)(O)[C@H](O[C@H]2[C@@H]([C@H](C[C@@H](C)O2)N(C)C)O)[C@H]1C)(C)O)CC)[C@H]1C[C@@](C)(OC)[C@@H](O)[C@H](C)O1 RXZBMPWDPOLZGW-XMRMVWPWSA-N 0.000 description 1
- QKDHBVNJCZBTMR-LLVKDONJSA-N (R)-temafloxacin Chemical compound C1CN[C@H](C)CN1C(C(=C1)F)=CC2=C1C(=O)C(C(O)=O)=CN2C1=CC=C(F)C=C1F QKDHBVNJCZBTMR-LLVKDONJSA-N 0.000 description 1
- XUBOMFCQGDBHNK-JTQLQIEISA-N (S)-gatifloxacin Chemical compound FC1=CC(C(C(C(O)=O)=CN2C3CC3)=O)=C2C(OC)=C1N1CCN[C@@H](C)C1 XUBOMFCQGDBHNK-JTQLQIEISA-N 0.000 description 1
- ZCSWOYDEEZMOMR-UHFFFAOYSA-N 1-ethyl-6-fluoro-7-methyl-4-oxoquinoline-3-carboxylic acid Chemical compound FC1=C(C)C=C2N(CC)C=C(C(O)=O)C(=O)C2=C1 ZCSWOYDEEZMOMR-UHFFFAOYSA-N 0.000 description 1
- IZXIZTKNFFYFOF-UHFFFAOYSA-N 2-Oxazolidone Chemical class O=C1NCCO1 IZXIZTKNFFYFOF-UHFFFAOYSA-N 0.000 description 1
- VHVPQPYKVGDNFY-DFMJLFEVSA-N 2-[(2r)-butan-2-yl]-4-[4-[4-[4-[[(2r,4s)-2-(2,4-dichlorophenyl)-2-(1,2,4-triazol-1-ylmethyl)-1,3-dioxolan-4-yl]methoxy]phenyl]piperazin-1-yl]phenyl]-1,2,4-triazol-3-one Chemical compound O=C1N([C@H](C)CC)N=CN1C1=CC=C(N2CCN(CC2)C=2C=CC(OC[C@@H]3O[C@](CN4N=CN=C4)(OC3)C=3C(=CC(Cl)=CC=3)Cl)=CC=2)C=C1 VHVPQPYKVGDNFY-DFMJLFEVSA-N 0.000 description 1
- ACTOXUHEUCPTEW-BWHGAVFKSA-N 2-[(4r,5s,6s,7r,9r,10r,11e,13e,16r)-6-[(2s,3r,4r,5s,6r)-5-[(2s,4r,5s,6s)-4,5-dihydroxy-4,6-dimethyloxan-2-yl]oxy-4-(dimethylamino)-3-hydroxy-6-methyloxan-2-yl]oxy-10-[(2s,5s,6r)-5-(dimethylamino)-6-methyloxan-2-yl]oxy-4-hydroxy-5-methoxy-9,16-dimethyl-2-o Chemical compound O([C@H]1/C=C/C=C/C[C@@H](C)OC(=O)C[C@@H](O)[C@@H]([C@H]([C@@H](CC=O)C[C@H]1C)O[C@H]1[C@@H]([C@H]([C@H](O[C@@H]2O[C@@H](C)[C@H](O)[C@](C)(O)C2)[C@@H](C)O1)N(C)C)O)OC)[C@@H]1CC[C@H](N(C)C)[C@@H](C)O1 ACTOXUHEUCPTEW-BWHGAVFKSA-N 0.000 description 1
- 125000000143 2-carboxyethyl group Chemical group [H]OC(=O)C([H])([H])C([H])([H])* 0.000 description 1
- FUBFWTUFPGFHOJ-UHFFFAOYSA-N 2-nitrofuran Chemical class [O-][N+](=O)C1=CC=CO1 FUBFWTUFPGFHOJ-UHFFFAOYSA-N 0.000 description 1
- GOLORTLGFDVFDW-UHFFFAOYSA-N 3-(1h-benzimidazol-2-yl)-7-(diethylamino)chromen-2-one Chemical compound C1=CC=C2NC(C3=CC4=CC=C(C=C4OC3=O)N(CC)CC)=NC2=C1 GOLORTLGFDVFDW-UHFFFAOYSA-N 0.000 description 1
- MCSXGCZMEPXKIW-UHFFFAOYSA-N 3-hydroxy-4-[(4-methyl-2-nitrophenyl)diazenyl]-N-(3-nitrophenyl)naphthalene-2-carboxamide Chemical compound Cc1ccc(N=Nc2c(O)c(cc3ccccc23)C(=O)Nc2cccc(c2)[N+]([O-])=O)c(c1)[N+]([O-])=O MCSXGCZMEPXKIW-UHFFFAOYSA-N 0.000 description 1
- UHPMCKVQTMMPCG-UHFFFAOYSA-N 5,8-dihydroxy-2-methoxy-6-methyl-7-(2-oxopropyl)naphthalene-1,4-dione Chemical compound CC1=C(CC(C)=O)C(O)=C2C(=O)C(OC)=CC(=O)C2=C1O UHPMCKVQTMMPCG-UHFFFAOYSA-N 0.000 description 1
- IDLISIVVYLGCKO-UHFFFAOYSA-N 6-carboxy-4',5'-dichloro-2',7'-dimethoxyfluorescein Chemical compound O1C(=O)C2=CC=C(C(O)=O)C=C2C21C1=CC(OC)=C(O)C(Cl)=C1OC1=C2C=C(OC)C(O)=C1Cl IDLISIVVYLGCKO-UHFFFAOYSA-N 0.000 description 1
- BZTDTCNHAFUJOG-UHFFFAOYSA-N 6-carboxyfluorescein Chemical compound C12=CC=C(O)C=C2OC2=CC(O)=CC=C2C11OC(=O)C2=CC=C(C(=O)O)C=C21 BZTDTCNHAFUJOG-UHFFFAOYSA-N 0.000 description 1
- 241001673062 Achromobacter xylosoxidans Species 0.000 description 1
- 241000606750 Actinobacillus Species 0.000 description 1
- 241000186361 Actinobacteria <class> Species 0.000 description 1
- 241000186046 Actinomyces Species 0.000 description 1
- 241000186041 Actinomyces israelii Species 0.000 description 1
- 241000186045 Actinomyces naeslundii Species 0.000 description 1
- 241000251468 Actinopterygii Species 0.000 description 1
- 241000607534 Aeromonas Species 0.000 description 1
- 241000607516 Aeromonas caviae Species 0.000 description 1
- 241000607528 Aeromonas hydrophila Species 0.000 description 1
- 241000607522 Aeromonas sobria Species 0.000 description 1
- 241000198060 Aeromonas veronii bv. sobria Species 0.000 description 1
- 229920000936 Agarose Polymers 0.000 description 1
- 241000606749 Aggregatibacter actinomycetemcomitans Species 0.000 description 1
- 239000012099 Alexa Fluor family Substances 0.000 description 1
- APKFDSVGJQXUKY-KKGHZKTASA-N Amphotericin-B Natural products O[C@H]1[C@@H](N)[C@H](O)[C@@H](C)O[C@H]1O[C@H]1C=CC=CC=CC=CC=CC=CC=C[C@H](C)[C@@H](O)[C@@H](C)[C@H](C)OC(=O)C[C@H](O)C[C@H](O)CC[C@@H](O)[C@H](O)C[C@H](O)C[C@](O)(C[C@H](O)[C@H]2C(O)=O)O[C@H]2C1 APKFDSVGJQXUKY-KKGHZKTASA-N 0.000 description 1
- 241000605281 Anaplasma phagocytophilum Species 0.000 description 1
- 108010064760 Anidulafungin Proteins 0.000 description 1
- 241000228193 Aspergillus clavatus Species 0.000 description 1
- 241000228197 Aspergillus flavus Species 0.000 description 1
- 241000726103 Atta Species 0.000 description 1
- 241000271566 Aves Species 0.000 description 1
- 241000193830 Bacillus <bacterium> Species 0.000 description 1
- 241000193738 Bacillus anthracis Species 0.000 description 1
- 241000193755 Bacillus cereus Species 0.000 description 1
- 244000063299 Bacillus subtilis Species 0.000 description 1
- 235000014469 Bacillus subtilis Nutrition 0.000 description 1
- 241000193388 Bacillus thuringiensis Species 0.000 description 1
- 108010001478 Bacitracin Proteins 0.000 description 1
- 108020000946 Bacterial DNA Proteins 0.000 description 1
- 208000035143 Bacterial infection Diseases 0.000 description 1
- 241000606124 Bacteroides fragilis Species 0.000 description 1
- 241001148536 Bacteroides sp. Species 0.000 description 1
- 241000606660 Bartonella Species 0.000 description 1
- 241000606685 Bartonella bacilliformis Species 0.000 description 1
- 241001518086 Bartonella henselae Species 0.000 description 1
- 241000186000 Bifidobacterium Species 0.000 description 1
- 239000002028 Biomass Substances 0.000 description 1
- 241000228405 Blastomyces dermatitidis Species 0.000 description 1
- 241000588807 Bordetella Species 0.000 description 1
- 241000588779 Bordetella bronchiseptica Species 0.000 description 1
- 241000588780 Bordetella parapertussis Species 0.000 description 1
- 241000588832 Bordetella pertussis Species 0.000 description 1
- 241000589968 Borrelia Species 0.000 description 1
- 241000180135 Borrelia recurrentis Species 0.000 description 1
- 241000589969 Borreliella burgdorferi Species 0.000 description 1
- 241000283690 Bos taurus Species 0.000 description 1
- 241000589562 Brucella Species 0.000 description 1
- 241000589567 Brucella abortus Species 0.000 description 1
- 241001509299 Brucella canis Species 0.000 description 1
- 241000508772 Brucella sp. Species 0.000 description 1
- 241001148111 Brucella suis Species 0.000 description 1
- 241001453380 Burkholderia Species 0.000 description 1
- 241000589513 Burkholderia cepacia Species 0.000 description 1
- 241001136175 Burkholderia pseudomallei Species 0.000 description 1
- 102100021851 Calbindin Human genes 0.000 description 1
- 241000589877 Campylobacter coli Species 0.000 description 1
- 241000589874 Campylobacter fetus Species 0.000 description 1
- 241000589875 Campylobacter jejuni Species 0.000 description 1
- 241000589986 Campylobacter lari Species 0.000 description 1
- 241000222120 Candida <Saccharomycetales> Species 0.000 description 1
- 241000222173 Candida parapsilosis Species 0.000 description 1
- 241000222178 Candida tropicalis Species 0.000 description 1
- 241000282472 Canis lupus familiaris Species 0.000 description 1
- 241000190890 Capnocytophaga Species 0.000 description 1
- 241000207210 Cardiobacterium hominis Species 0.000 description 1
- 108010020326 Caspofungin Proteins 0.000 description 1
- 229930186147 Cephalosporin Natural products 0.000 description 1
- 241001647372 Chlamydia pneumoniae Species 0.000 description 1
- 241001647378 Chlamydia psittaci Species 0.000 description 1
- 241000606153 Chlamydia trachomatis Species 0.000 description 1
- HZZVJAQRINQKSD-UHFFFAOYSA-N Clavulanic acid Natural products OC(=O)C1C(=CCO)OC2CC(=O)N21 HZZVJAQRINQKSD-UHFFFAOYSA-N 0.000 description 1
- 241000193163 Clostridioides difficile Species 0.000 description 1
- 241000193403 Clostridium Species 0.000 description 1
- 241000193155 Clostridium botulinum Species 0.000 description 1
- 241000193468 Clostridium perfringens Species 0.000 description 1
- 101000822695 Clostridium perfringens (strain 13 / Type A) Small, acid-soluble spore protein C1 Proteins 0.000 description 1
- 101000655262 Clostridium perfringens (strain 13 / Type A) Small, acid-soluble spore protein C2 Proteins 0.000 description 1
- 241000193449 Clostridium tetani Species 0.000 description 1
- 208000003322 Coinfection Diseases 0.000 description 1
- RYGMFSIKBFXOCR-UHFFFAOYSA-N Copper Chemical compound [Cu] RYGMFSIKBFXOCR-UHFFFAOYSA-N 0.000 description 1
- 241000186227 Corynebacterium diphtheriae Species 0.000 description 1
- 241000606678 Coxiella burnetii Species 0.000 description 1
- 201000007336 Cryptococcosis Diseases 0.000 description 1
- 241001522864 Cryptococcus gattii VGI Species 0.000 description 1
- 241000221204 Cryptococcus neoformans Species 0.000 description 1
- 241000186427 Cutibacterium acnes Species 0.000 description 1
- FMTDIUIBLCQGJB-UHFFFAOYSA-N Demethylchlortetracyclin Natural products C1C2C(O)C3=C(Cl)C=CC(O)=C3C(=O)C2=C(O)C2(O)C1C(N(C)C)C(O)=C(C(N)=O)C2=O FMTDIUIBLCQGJB-UHFFFAOYSA-N 0.000 description 1
- 241000605312 Ehrlichia canis Species 0.000 description 1
- 241000588878 Eikenella corrodens Species 0.000 description 1
- 241000283086 Equidae Species 0.000 description 1
- 241000186810 Erysipelothrix rhusiopathiae Species 0.000 description 1
- 241000186394 Eubacterium Species 0.000 description 1
- 241000282326 Felis catus Species 0.000 description 1
- UIOFUWFRIANQPC-JKIFEVAISA-N Floxacillin Chemical compound N([C@@H]1C(N2[C@H](C(C)(C)S[C@@H]21)C(O)=O)=O)C(=O)C1=C(C)ON=C1C1=C(F)C=CC=C1Cl UIOFUWFRIANQPC-JKIFEVAISA-N 0.000 description 1
- 241000589602 Francisella tularensis Species 0.000 description 1
- 206010017523 Fungaemia Diseases 0.000 description 1
- 206010017533 Fungal infection Diseases 0.000 description 1
- 241000223218 Fusarium Species 0.000 description 1
- 241000223221 Fusarium oxysporum Species 0.000 description 1
- 241000690372 Fusarium proliferatum Species 0.000 description 1
- 241000427940 Fusarium solani Species 0.000 description 1
- 241000233732 Fusarium verticillioides Species 0.000 description 1
- 241000605986 Fusobacterium nucleatum Species 0.000 description 1
- 241000287828 Gallus gallus Species 0.000 description 1
- 241000207201 Gardnerella vaginalis Species 0.000 description 1
- 241001147749 Gemella morbillorum Species 0.000 description 1
- 241000193385 Geobacillus stearothermophilus Species 0.000 description 1
- 108010015899 Glycopeptides Proteins 0.000 description 1
- 102000002068 Glycopeptides Human genes 0.000 description 1
- AIJTTZAVMXIJGM-UHFFFAOYSA-N Grepafloxacin Chemical compound C1CNC(C)CN1C(C(=C1C)F)=CC2=C1C(=O)C(C(O)=O)=CN2C1CC1 AIJTTZAVMXIJGM-UHFFFAOYSA-N 0.000 description 1
- 241000607259 Grimontia hollisae Species 0.000 description 1
- 241000606790 Haemophilus Species 0.000 description 1
- 241001501603 Haemophilus aegyptius Species 0.000 description 1
- 241000606788 Haemophilus haemolyticus Species 0.000 description 1
- 241000606768 Haemophilus influenzae Species 0.000 description 1
- 241000606822 Haemophilus parahaemolyticus Species 0.000 description 1
- 241000606766 Haemophilus parainfluenzae Species 0.000 description 1
- 241000590014 Helicobacter cinaedi Species 0.000 description 1
- 241000590010 Helicobacter fennelliae Species 0.000 description 1
- 241000590002 Helicobacter pylori Species 0.000 description 1
- 101000898082 Homo sapiens Calbindin Proteins 0.000 description 1
- 206010021137 Hypovolaemia Diseases 0.000 description 1
- UETNIIAIRMUTSM-UHFFFAOYSA-N Jacareubin Natural products CC1(C)OC2=CC3Oc4c(O)c(O)ccc4C(=O)C3C(=C2C=C1)O UETNIIAIRMUTSM-UHFFFAOYSA-N 0.000 description 1
- 241000589014 Kingella kingae Species 0.000 description 1
- 241001534216 Klebsiella granulomatis Species 0.000 description 1
- WTDRDQBEARUVNC-LURJTMIESA-N L-DOPA Chemical compound OC(=O)[C@@H](N)CC1=CC=C(O)C(O)=C1 WTDRDQBEARUVNC-LURJTMIESA-N 0.000 description 1
- WTDRDQBEARUVNC-UHFFFAOYSA-N L-Dopa Natural products OC(=O)C(N)CC1=CC=C(O)C(O)=C1 WTDRDQBEARUVNC-UHFFFAOYSA-N 0.000 description 1
- 241000186660 Lactobacillus Species 0.000 description 1
- 241000589242 Legionella pneumophila Species 0.000 description 1
- OJMMVQQUTAEWLP-UHFFFAOYSA-N Lincomycin Natural products CN1CC(CCC)CC1C(=O)NC(C(C)O)C1C(O)C(O)C(O)C(SC)O1 OJMMVQQUTAEWLP-UHFFFAOYSA-N 0.000 description 1
- 241000186779 Listeria monocytogenes Species 0.000 description 1
- 208000016604 Lyme disease Diseases 0.000 description 1
- TYMRLRRVMHJFTF-UHFFFAOYSA-N Mafenide Chemical compound NCC1=CC=C(S(N)(=O)=O)C=C1 TYMRLRRVMHJFTF-UHFFFAOYSA-N 0.000 description 1
- 108010021062 Micafungin Proteins 0.000 description 1
- 241000192041 Micrococcus Species 0.000 description 1
- 241000203736 Mobiluncus Species 0.000 description 1
- 241000588655 Moraxella catarrhalis Species 0.000 description 1
- 241000588771 Morganella <proteobacterium> Species 0.000 description 1
- 241000186359 Mycobacterium Species 0.000 description 1
- 241000186367 Mycobacterium avium Species 0.000 description 1
- 241000186366 Mycobacterium bovis Species 0.000 description 1
- 241000186364 Mycobacterium intracellulare Species 0.000 description 1
- 241000186362 Mycobacterium leprae Species 0.000 description 1
- 241000187492 Mycobacterium marinum Species 0.000 description 1
- 241000187479 Mycobacterium tuberculosis Species 0.000 description 1
- 241000204051 Mycoplasma genitalium Species 0.000 description 1
- 241000204048 Mycoplasma hominis Species 0.000 description 1
- 241000202934 Mycoplasma pneumoniae Species 0.000 description 1
- 208000031888 Mycoses Diseases 0.000 description 1
- 241001443590 Naganishia albida Species 0.000 description 1
- 241000588653 Neisseria Species 0.000 description 1
- 241000588650 Neisseria meningitidis Species 0.000 description 1
- 229930193140 Neomycin Natural products 0.000 description 1
- IABBAGAOMDWOCW-UHFFFAOYSA-N Nicametate citrate Chemical compound OC(=O)CC(O)(C(O)=O)CC(O)=O.CCN(CC)CCOC(=O)C1=CC=CN=C1 IABBAGAOMDWOCW-UHFFFAOYSA-N 0.000 description 1
- 241000187654 Nocardia Species 0.000 description 1
- 241000187678 Nocardia asteroides Species 0.000 description 1
- 241001503696 Nocardia brasiliensis Species 0.000 description 1
- 241000948822 Nocardia cyriacigeorgica Species 0.000 description 1
- 239000004100 Oxytetracycline Substances 0.000 description 1
- 241000588912 Pantoea agglomerans Species 0.000 description 1
- 241000222051 Papiliotrema laurentii Species 0.000 description 1
- 101000655256 Paraclostridium bifermentans Small, acid-soluble spore protein alpha Proteins 0.000 description 1
- 101000655264 Paraclostridium bifermentans Small, acid-soluble spore protein beta Proteins 0.000 description 1
- UOZODPSAJZTQNH-UHFFFAOYSA-N Paromomycin II Natural products NC1C(O)C(O)C(CN)OC1OC1C(O)C(OC2C(C(N)CC(N)C2O)OC2C(C(O)C(O)C(CO)O2)N)OC1CO UOZODPSAJZTQNH-UHFFFAOYSA-N 0.000 description 1
- 241000606856 Pasteurella multocida Species 0.000 description 1
- 206010034133 Pathogen resistance Diseases 0.000 description 1
- 241001494479 Pecora Species 0.000 description 1
- 241000191992 Peptostreptococcus Species 0.000 description 1
- 241001442654 Percnon planissimum Species 0.000 description 1
- 201000005702 Pertussis Diseases 0.000 description 1
- 241001672678 Photobacterium damselae subsp. damselae Species 0.000 description 1
- 241000235645 Pichia kudriavzevii Species 0.000 description 1
- 241000606999 Plesiomonas shigelloides Species 0.000 description 1
- 108010093965 Polymyxin B Proteins 0.000 description 1
- 241000605894 Porphyromonas Species 0.000 description 1
- 241000605861 Prevotella Species 0.000 description 1
- 241001135223 Prevotella melaninogenica Species 0.000 description 1
- RWCOTTLHDJWHRS-YUMQZZPRSA-N Pro-Pro Chemical compound OC(=O)[C@@H]1CCCN1C(=O)[C@H]1NCCC1 RWCOTTLHDJWHRS-YUMQZZPRSA-N 0.000 description 1
- 241000588768 Providencia Species 0.000 description 1
- 241000576783 Providencia alcalifaciens Species 0.000 description 1
- 241000588777 Providencia rettgeri Species 0.000 description 1
- 241000588778 Providencia stuartii Species 0.000 description 1
- 101001021643 Pseudozyma antarctica Lipase B Proteins 0.000 description 1
- 240000005384 Rhizopus oryzae Species 0.000 description 1
- 235000013752 Rhizopus oryzae Nutrition 0.000 description 1
- 241000316848 Rhodococcus <scale insect> Species 0.000 description 1
- 241000158504 Rhodococcus hoagii Species 0.000 description 1
- 241000606701 Rickettsia Species 0.000 description 1
- 241000606723 Rickettsia akari Species 0.000 description 1
- 241000606697 Rickettsia prowazekii Species 0.000 description 1
- 241000606695 Rickettsia rickettsii Species 0.000 description 1
- 241000606726 Rickettsia typhi Species 0.000 description 1
- 241001138501 Salmonella enterica Species 0.000 description 1
- 241001354013 Salmonella enterica subsp. enterica serovar Enteritidis Species 0.000 description 1
- 241000531795 Salmonella enterica subsp. enterica serovar Paratyphi A Species 0.000 description 1
- 241000293871 Salmonella enterica subsp. enterica serovar Typhi Species 0.000 description 1
- 241000293869 Salmonella enterica subsp. enterica serovar Typhimurium Species 0.000 description 1
- 206010040047 Sepsis Diseases 0.000 description 1
- 241000607768 Shigella Species 0.000 description 1
- 241000607766 Shigella boydii Species 0.000 description 1
- 241000607764 Shigella dysenteriae Species 0.000 description 1
- 241000607762 Shigella flexneri Species 0.000 description 1
- 241000607760 Shigella sonnei Species 0.000 description 1
- 239000004187 Spiramycin Substances 0.000 description 1
- 241000605008 Spirillum Species 0.000 description 1
- 241001147736 Staphylococcus capitis Species 0.000 description 1
- 241001147691 Staphylococcus saprophyticus Species 0.000 description 1
- 229920002472 Starch Polymers 0.000 description 1
- 241001478880 Streptobacillus moniliformis Species 0.000 description 1
- 241000194008 Streptococcus anginosus Species 0.000 description 1
- 241000911872 Streptococcus anginosus group Species 0.000 description 1
- 241000194049 Streptococcus equinus Species 0.000 description 1
- 241000194019 Streptococcus mutans Species 0.000 description 1
- 241001505901 Streptococcus sp. 'group A' Species 0.000 description 1
- 241000282887 Suidae Species 0.000 description 1
- NHUHCSRWZMLRLA-UHFFFAOYSA-N Sulfisoxazole Chemical compound CC1=NOC(NS(=O)(=O)C=2C=CC(N)=CC=2)=C1C NHUHCSRWZMLRLA-UHFFFAOYSA-N 0.000 description 1
- 241001523006 Talaromyces marneffei Species 0.000 description 1
- 108010053950 Teicoplanin Proteins 0.000 description 1
- 241000589884 Treponema pallidum Species 0.000 description 1
- 239000007983 Tris buffer Substances 0.000 description 1
- 241000203826 Tropheryma whipplei Species 0.000 description 1
- 241000202921 Ureaplasma urealyticum Species 0.000 description 1
- 241001331543 Veillonella sp. Species 0.000 description 1
- 241000607594 Vibrio alginolyticus Species 0.000 description 1
- 241000607626 Vibrio cholerae Species 0.000 description 1
- 241000607291 Vibrio fluvialis Species 0.000 description 1
- 241001148070 Vibrio furnissii Species 0.000 description 1
- 241000607253 Vibrio mimicus Species 0.000 description 1
- 206010048038 Wound infection Diseases 0.000 description 1
- 241000607734 Yersinia <bacteria> Species 0.000 description 1
- 241000607447 Yersinia enterocolitica Species 0.000 description 1
- 241000607479 Yersinia pestis Species 0.000 description 1
- 241000607477 Yersinia pseudotuberculosis Species 0.000 description 1
- 241000606834 [Haemophilus] ducreyi Species 0.000 description 1
- 239000000980 acid dye Substances 0.000 description 1
- 230000006978 adaptation Effects 0.000 description 1
- 239000002313 adhesive film Substances 0.000 description 1
- 239000012790 adhesive layer Substances 0.000 description 1
- 230000002411 adverse Effects 0.000 description 1
- 239000000443 aerosol Substances 0.000 description 1
- 239000011543 agarose gel Substances 0.000 description 1
- 238000005054 agglomeration Methods 0.000 description 1
- 230000002776 aggregation Effects 0.000 description 1
- 230000004075 alteration Effects 0.000 description 1
- 150000001412 amines Chemical class 0.000 description 1
- 229960003022 amoxicillin Drugs 0.000 description 1
- LSQZJLSUYDQPKJ-NJBDSQKTSA-N amoxicillin Chemical compound C1([C@@H](N)C(=O)N[C@H]2[C@H]3SC([C@@H](N3C2=O)C(O)=O)(C)C)=CC=C(O)C=C1 LSQZJLSUYDQPKJ-NJBDSQKTSA-N 0.000 description 1
- 229940038195 amoxicillin / clavulanate Drugs 0.000 description 1
- APKFDSVGJQXUKY-INPOYWNPSA-N amphotericin B Chemical compound O[C@H]1[C@@H](N)[C@H](O)[C@@H](C)O[C@H]1O[C@H]1/C=C/C=C/C=C/C=C/C=C/C=C/C=C/[C@H](C)[C@@H](O)[C@@H](C)[C@H](C)OC(=O)C[C@H](O)C[C@H](O)CC[C@@H](O)[C@H](O)C[C@H](O)C[C@](O)(C[C@H](O)[C@H]2C(O)=O)O[C@H]2C1 APKFDSVGJQXUKY-INPOYWNPSA-N 0.000 description 1
- 229960003942 amphotericin b Drugs 0.000 description 1
- 229940043312 ampicillin / sulbactam Drugs 0.000 description 1
- 229960003348 anidulafungin Drugs 0.000 description 1
- JHVAMHSQVVQIOT-MFAJLEFUSA-N anidulafungin Chemical compound C1=CC(OCCCCC)=CC=C1C1=CC=C(C=2C=CC(=CC=2)C(=O)N[C@@H]2C(N[C@H](C(=O)N3C[C@H](O)C[C@H]3C(=O)N[C@H](C(=O)N[C@H](C(=O)N3C[C@H](C)[C@H](O)[C@H]3C(=O)N[C@H](O)[C@H](O)C2)[C@@H](C)O)[C@H](O)[C@@H](O)C=2C=CC(O)=CC=2)[C@@H](C)O)=O)C=C1 JHVAMHSQVVQIOT-MFAJLEFUSA-N 0.000 description 1
- 230000003466 anti-cipated effect Effects 0.000 description 1
- 229940121375 antifungal agent Drugs 0.000 description 1
- 238000003491 array Methods 0.000 description 1
- 229940003446 arsphenamine Drugs 0.000 description 1
- VLAXZGHHBIJLAD-UHFFFAOYSA-N arsphenamine Chemical compound [Cl-].[Cl-].C1=C(O)C([NH3+])=CC([As]=[As]C=2C=C([NH3+])C(O)=CC=2)=C1 VLAXZGHHBIJLAD-UHFFFAOYSA-N 0.000 description 1
- 230000003190 augmentative effect Effects 0.000 description 1
- 229960004099 azithromycin Drugs 0.000 description 1
- MQTOSJVFKKJCRP-BICOPXKESA-N azithromycin Chemical compound O([C@@H]1[C@@H](C)C(=O)O[C@@H]([C@@]([C@H](O)[C@@H](C)N(C)C[C@H](C)C[C@@](C)(O)[C@H](O[C@H]2[C@@H]([C@H](C[C@@H](C)O2)N(C)C)O)[C@H]1C)(C)O)CC)[C@H]1C[C@@](C)(OC)[C@@H](O)[C@H](C)O1 MQTOSJVFKKJCRP-BICOPXKESA-N 0.000 description 1
- 229940065181 bacillus anthracis Drugs 0.000 description 1
- 229940097012 bacillus thuringiensis Drugs 0.000 description 1
- 229960003071 bacitracin Drugs 0.000 description 1
- 229930184125 bacitracin Natural products 0.000 description 1
- CLKOFPXJLQSYAH-ABRJDSQDSA-N bacitracin A Chemical compound C1SC([C@@H](N)[C@@H](C)CC)=N[C@@H]1C(=O)N[C@@H](CC(C)C)C(=O)N[C@H](CCC(O)=O)C(=O)N[C@@H]([C@@H](C)CC)C(=O)N[C@@H]1C(=O)N[C@H](CCCN)C(=O)N[C@@H]([C@@H](C)CC)C(=O)N[C@H](CC=2C=CC=CC=2)C(=O)N[C@@H](CC=2N=CNC=2)C(=O)N[C@H](CC(O)=O)C(=O)N[C@@H](CC(N)=O)C(=O)NCCCC1 CLKOFPXJLQSYAH-ABRJDSQDSA-N 0.000 description 1
- 208000022362 bacterial infectious disease Diseases 0.000 description 1
- 244000052616 bacterial pathogen Species 0.000 description 1
- 229940092528 bartonella bacilliformis Drugs 0.000 description 1
- 229940092524 bartonella henselae Drugs 0.000 description 1
- 235000015278 beef Nutrition 0.000 description 1
- 230000009286 beneficial effect Effects 0.000 description 1
- 238000010256 biochemical assay Methods 0.000 description 1
- 230000015572 biosynthetic process Effects 0.000 description 1
- 229940056450 brucella abortus Drugs 0.000 description 1
- 229940055022 candida parapsilosis Drugs 0.000 description 1
- 108010068385 carbapenemase Proteins 0.000 description 1
- 229940041011 carbapenems Drugs 0.000 description 1
- 229910052799 carbon Inorganic materials 0.000 description 1
- 108010079058 casein hydrolysate Proteins 0.000 description 1
- 229960003034 caspofungin Drugs 0.000 description 1
- JYIKNQVWKBUSNH-WVDDFWQHSA-N caspofungin Chemical compound C1([C@H](O)[C@@H](O)[C@H]2C(=O)N[C@H](C(=O)N3CC[C@H](O)[C@H]3C(=O)N[C@H](NCCN)[C@H](O)C[C@@H](C(N[C@H](C(=O)N3C[C@H](O)C[C@H]3C(=O)N2)[C@@H](C)O)=O)NC(=O)CCCCCCCC[C@@H](C)C[C@@H](C)CC)[C@H](O)CCN)=CC=C(O)C=C1 JYIKNQVWKBUSNH-WVDDFWQHSA-N 0.000 description 1
- 125000002091 cationic group Chemical group 0.000 description 1
- QYIYFLOTGYLRGG-GPCCPHFNSA-N cefaclor Chemical compound C1([C@H](C(=O)N[C@@H]2C(N3C(=C(Cl)CS[C@@H]32)C(O)=O)=O)N)=CC=CC=C1 QYIYFLOTGYLRGG-GPCCPHFNSA-N 0.000 description 1
- 229960005361 cefaclor Drugs 0.000 description 1
- 229960004841 cefadroxil Drugs 0.000 description 1
- NBFNMSULHIODTC-CYJZLJNKSA-N cefadroxil monohydrate Chemical compound O.C1([C@@H](N)C(=O)N[C@H]2[C@@H]3N(C2=O)C(=C(CS3)C)C(O)=O)=CC=C(O)C=C1 NBFNMSULHIODTC-CYJZLJNKSA-N 0.000 description 1
- XIURVHNZVLADCM-IUODEOHRSA-N cefalotin Chemical compound N([C@H]1[C@@H]2N(C1=O)C(=C(CS2)COC(=O)C)C(O)=O)C(=O)CC1=CC=CS1 XIURVHNZVLADCM-IUODEOHRSA-N 0.000 description 1
- 229960000603 cefalotin Drugs 0.000 description 1
- 229960003719 cefdinir Drugs 0.000 description 1
- RTXOFQZKPXMALH-GHXIOONMSA-N cefdinir Chemical compound S1C(N)=NC(C(=N\O)\C(=O)N[C@@H]2C(N3C(=C(C=C)CS[C@@H]32)C(O)=O)=O)=C1 RTXOFQZKPXMALH-GHXIOONMSA-N 0.000 description 1
- 229960004069 cefditoren Drugs 0.000 description 1
- KMIPKYQIOVAHOP-YLGJWRNMSA-N cefditoren Chemical compound S([C@@H]1[C@@H](C(N1C=1C(O)=O)=O)NC(=O)\C(=N/OC)C=2N=C(N)SC=2)CC=1\C=C/C=1SC=NC=1C KMIPKYQIOVAHOP-YLGJWRNMSA-N 0.000 description 1
- 229960002129 cefixime Drugs 0.000 description 1
- OKBVVJOGVLARMR-QSWIMTSFSA-N cefixime Chemical compound S1C(N)=NC(C(=N\OCC(O)=O)\C(=O)N[C@@H]2C(N3C(=C(C=C)CS[C@@H]32)C(O)=O)=O)=C1 OKBVVJOGVLARMR-QSWIMTSFSA-N 0.000 description 1
- 229960004261 cefotaxime Drugs 0.000 description 1
- GPRBEKHLDVQUJE-VINNURBNSA-N cefotaxime Chemical compound N([C@@H]1C(N2C(=C(COC(C)=O)CS[C@@H]21)C(O)=O)=O)C(=O)/C(=N/OC)C1=CSC(N)=N1 GPRBEKHLDVQUJE-VINNURBNSA-N 0.000 description 1
- 229960005090 cefpodoxime Drugs 0.000 description 1
- WYUSVOMTXWRGEK-HBWVYFAYSA-N cefpodoxime Chemical compound N([C@H]1[C@@H]2N(C1=O)C(=C(CS2)COC)C(O)=O)C(=O)C(=N/OC)\C1=CSC(N)=N1 WYUSVOMTXWRGEK-HBWVYFAYSA-N 0.000 description 1
- 229960002580 cefprozil Drugs 0.000 description 1
- 229960004086 ceftibuten Drugs 0.000 description 1
- UNJFKXSSGBWRBZ-BJCIPQKHSA-N ceftibuten Chemical compound S1C(N)=NC(C(=C\CC(O)=O)\C(=O)N[C@@H]2C(N3C(=CCS[C@@H]32)C(O)=O)=O)=C1 UNJFKXSSGBWRBZ-BJCIPQKHSA-N 0.000 description 1
- VOAZJEPQLGBXGO-SDAWRPRTSA-N ceftobiprole Chemical compound S1C(N)=NC(C(=N\O)\C(=O)N[C@@H]2C(N3C(=C(\C=C/4C(N([C@H]5CNCC5)CC\4)=O)CS[C@@H]32)C(O)=O)=O)=N1 VOAZJEPQLGBXGO-SDAWRPRTSA-N 0.000 description 1
- 229950004259 ceftobiprole Drugs 0.000 description 1
- 210000000170 cell membrane Anatomy 0.000 description 1
- 230000003833 cell viability Effects 0.000 description 1
- 230000036755 cellular response Effects 0.000 description 1
- 229940106164 cephalexin Drugs 0.000 description 1
- ZAIPMKNFIOOWCQ-UEKVPHQBSA-N cephalexin Chemical compound C1([C@@H](N)C(=O)N[C@H]2[C@@H]3N(C2=O)C(=C(CS3)C)C(O)=O)=CC=CC=C1 ZAIPMKNFIOOWCQ-UEKVPHQBSA-N 0.000 description 1
- 229940124587 cephalosporin Drugs 0.000 description 1
- 150000001780 cephalosporins Chemical class 0.000 description 1
- 210000001175 cerebrospinal fluid Anatomy 0.000 description 1
- DDTDNCYHLGRFBM-YZEKDTGTSA-N chembl2367892 Chemical compound CC(=O)N[C@H]1[C@@H](O)[C@H](O)[C@H](CO)O[C@H]1O[C@@H]([C@H]1C(N[C@@H](C2=CC(O)=CC(O[C@@H]3[C@H]([C@H](O)[C@H](O)[C@@H](CO)O3)O)=C2C=2C(O)=CC=C(C=2)[C@@H](NC(=O)[C@@H]2NC(=O)[C@@H]3C=4C=C(O)C=C(C=4)OC=4C(O)=CC=C(C=4)[C@@H](N)C(=O)N[C@H](CC=4C=C(Cl)C(O5)=CC=4)C(=O)N3)C(=O)N1)C(O)=O)=O)C(C=C1Cl)=CC=C1OC1=C(O[C@H]3[C@H]([C@@H](O)[C@H](O)[C@H](CO)O3)NC(C)=O)C5=CC2=C1 DDTDNCYHLGRFBM-YZEKDTGTSA-N 0.000 description 1
- 238000006243 chemical reaction Methods 0.000 description 1
- 235000013330 chicken meat Nutrition 0.000 description 1
- 229940038705 chlamydia trachomatis Drugs 0.000 description 1
- 229960002626 clarithromycin Drugs 0.000 description 1
- AGOYDEPGAOXOCK-KCBOHYOISA-N clarithromycin Chemical compound O([C@@H]1[C@@H](C)C(=O)O[C@@H]([C@@]([C@H](O)[C@@H](C)C(=O)[C@H](C)C[C@](C)([C@H](O[C@H]2[C@@H]([C@H](C[C@@H](C)O2)N(C)C)O)[C@H]1C)OC)(C)O)CC)[C@H]1C[C@@](C)(OC)[C@@H](O)[C@H](C)O1 AGOYDEPGAOXOCK-KCBOHYOISA-N 0.000 description 1
- 229940090805 clavulanate Drugs 0.000 description 1
- HZZVJAQRINQKSD-PBFISZAISA-N clavulanic acid Chemical compound OC(=O)[C@H]1C(=C/CO)/O[C@@H]2CC(=O)N21 HZZVJAQRINQKSD-PBFISZAISA-N 0.000 description 1
- 229960002227 clindamycin Drugs 0.000 description 1
- KDLRVYVGXIQJDK-AWPVFWJPSA-N clindamycin Chemical compound CN1C[C@H](CCC)C[C@H]1C(=O)N[C@H]([C@H](C)Cl)[C@@H]1[C@H](O)[C@H](O)[C@@H](O)[C@@H](SC)O1 KDLRVYVGXIQJDK-AWPVFWJPSA-N 0.000 description 1
- 238000009535 clinical urine test Methods 0.000 description 1
- 229960004287 clofazimine Drugs 0.000 description 1
- WDQPAMHFFCXSNU-BGABXYSRSA-N clofazimine Chemical compound C12=CC=CC=C2N=C2C=C(NC=3C=CC(Cl)=CC=3)C(=N/C(C)C)/C=C2N1C1=CC=C(Cl)C=C1 WDQPAMHFFCXSNU-BGABXYSRSA-N 0.000 description 1
- 150000001875 compounds Chemical class 0.000 description 1
- 239000012141 concentrate Substances 0.000 description 1
- 239000012468 concentrated sample Substances 0.000 description 1
- 238000012790 confirmation Methods 0.000 description 1
- 238000011109 contamination Methods 0.000 description 1
- 229910052802 copper Inorganic materials 0.000 description 1
- 239000010949 copper Substances 0.000 description 1
- 238000012864 cross contamination Methods 0.000 description 1
- 230000001186 cumulative effect Effects 0.000 description 1
- 229960002488 dalbavancin Drugs 0.000 description 1
- 108700009376 dalbavancin Proteins 0.000 description 1
- 238000007405 data analysis Methods 0.000 description 1
- 230000034994 death Effects 0.000 description 1
- 230000007812 deficiency Effects 0.000 description 1
- 239000008367 deionised water Substances 0.000 description 1
- 229910021641 deionized water Inorganic materials 0.000 description 1
- 230000001934 delay Effects 0.000 description 1
- 229960002398 demeclocycline Drugs 0.000 description 1
- 239000003085 diluting agent Substances 0.000 description 1
- 229960004100 dirithromycin Drugs 0.000 description 1
- WLOHNSSYAXHWNR-NXPDYKKBSA-N dirithromycin Chemical compound O([C@@H]1[C@@H](C)C(=O)O[C@@H]([C@@]([C@H]2O[C@H](COCCOC)N[C@H]([C@@H]2C)[C@H](C)C[C@@](C)(O)[C@H](O[C@H]2[C@@H]([C@H](C[C@@H](C)O2)N(C)C)O)[C@H]1C)(C)O)CC)[C@H]1C[C@@](C)(OC)[C@@H](O)[C@H](C)O1 WLOHNSSYAXHWNR-NXPDYKKBSA-N 0.000 description 1
- NWOYIVRVSJDTLK-YSDBFZIDSA-L disodium;(2s,5r,6r)-6-[[(2r)-2-amino-2-phenylacetyl]amino]-3,3-dimethyl-7-oxo-4-thia-1-azabicyclo[3.2.0]heptane-2-carboxylate;(1r,4s)-3,3-dimethyl-2,2,6-trioxo-2$l^{6}-thiabicyclo[3.2.0]heptane-4-carboxylate Chemical compound [Na+].[Na+].O=S1(=O)C(C)(C)[C@H](C([O-])=O)C2C(=O)C[C@H]21.C1([C@@H](N)C(=O)N[C@H]2[C@H]3SC([C@@H](N3C2=O)C([O-])=O)(C)C)=CC=CC=C1 NWOYIVRVSJDTLK-YSDBFZIDSA-L 0.000 description 1
- 239000006185 dispersion Substances 0.000 description 1
- AVAACINZEOAHHE-VFZPANTDSA-N doripenem Chemical compound C=1([C@H](C)[C@@H]2[C@H](C(N2C=1C(O)=O)=O)[C@H](O)C)S[C@@H]1CN[C@H](CNS(N)(=O)=O)C1 AVAACINZEOAHHE-VFZPANTDSA-N 0.000 description 1
- 229960000895 doripenem Drugs 0.000 description 1
- 230000009977 dual effect Effects 0.000 description 1
- 239000000428 dust Substances 0.000 description 1
- 229940051998 ehrlichia canis Drugs 0.000 description 1
- 229960002549 enoxacin Drugs 0.000 description 1
- IDYZIJYBMGIQMJ-UHFFFAOYSA-N enoxacin Chemical compound N1=C2N(CC)C=C(C(O)=O)C(=O)C2=CC(F)=C1N1CCNCC1 IDYZIJYBMGIQMJ-UHFFFAOYSA-N 0.000 description 1
- 230000000369 enteropathogenic effect Effects 0.000 description 1
- 230000000688 enterotoxigenic effect Effects 0.000 description 1
- 238000011067 equilibration Methods 0.000 description 1
- 229960000285 ethambutol Drugs 0.000 description 1
- 230000001747 exhibiting effect Effects 0.000 description 1
- 238000013401 experimental design Methods 0.000 description 1
- 239000000284 extract Substances 0.000 description 1
- 239000000835 fiber Substances 0.000 description 1
- 239000012467 final product Substances 0.000 description 1
- 229960004273 floxacillin Drugs 0.000 description 1
- RFHAOTPXVQNOHP-UHFFFAOYSA-N fluconazole Chemical compound C1=NC=NN1CC(C=1C(=CC(F)=CC=1)F)(O)CN1C=NC=N1 RFHAOTPXVQNOHP-UHFFFAOYSA-N 0.000 description 1
- 229960004884 fluconazole Drugs 0.000 description 1
- 229960004413 flucytosine Drugs 0.000 description 1
- XRECTZIEBJDKEO-UHFFFAOYSA-N flucytosine Chemical compound NC1=NC(=O)NC=C1F XRECTZIEBJDKEO-UHFFFAOYSA-N 0.000 description 1
- GNBHRKFJIUUOQI-UHFFFAOYSA-N fluorescein Chemical compound O1C(=O)C2=CC=CC=C2C21C1=CC=C(O)C=C1OC1=CC(O)=CC=C21 GNBHRKFJIUUOQI-UHFFFAOYSA-N 0.000 description 1
- MHMNJMPURVTYEJ-UHFFFAOYSA-N fluorescein-5-isothiocyanate Chemical compound O1C(=O)C2=CC(N=C=S)=CC=C2C21C1=CC=C(O)C=C1OC1=CC(O)=CC=C21 MHMNJMPURVTYEJ-UHFFFAOYSA-N 0.000 description 1
- 238000012632 fluorescent imaging Methods 0.000 description 1
- 229960000308 fosfomycin Drugs 0.000 description 1
- YMDXZJFXQJVXBF-STHAYSLISA-N fosfomycin Chemical compound C[C@@H]1O[C@@H]1P(O)(O)=O YMDXZJFXQJVXBF-STHAYSLISA-N 0.000 description 1
- 229940118764 francisella tularensis Drugs 0.000 description 1
- 229960001625 furazolidone Drugs 0.000 description 1
- PLHJDBGFXBMTGZ-WEVVVXLNSA-N furazolidone Chemical compound O1C([N+](=O)[O-])=CC=C1\C=N\N1C(=O)OCC1 PLHJDBGFXBMTGZ-WEVVVXLNSA-N 0.000 description 1
- 229960003923 gatifloxacin Drugs 0.000 description 1
- 229960003170 gemifloxacin Drugs 0.000 description 1
- ZRCVYEYHRGVLOC-HYARGMPZSA-N gemifloxacin Chemical compound C1C(CN)C(=N/OC)/CN1C(C(=C1)F)=NC2=C1C(=O)C(C(O)=O)=CN2C1CC1 ZRCVYEYHRGVLOC-HYARGMPZSA-N 0.000 description 1
- 238000007429 general method Methods 0.000 description 1
- 230000008570 general process Effects 0.000 description 1
- 229960000642 grepafloxacin Drugs 0.000 description 1
- 238000009499 grossing Methods 0.000 description 1
- 230000009036 growth inhibition Effects 0.000 description 1
- 229940047650 haemophilus influenzae Drugs 0.000 description 1
- 229940037467 helicobacter pylori Drugs 0.000 description 1
- 238000010191 image analysis Methods 0.000 description 1
- 230000003100 immobilizing effect Effects 0.000 description 1
- 208000015181 infectious disease Diseases 0.000 description 1
- 238000001802 infusion Methods 0.000 description 1
- 239000004615 ingredient Substances 0.000 description 1
- 238000012905 input function Methods 0.000 description 1
- 238000007689 inspection Methods 0.000 description 1
- 238000009413 insulation Methods 0.000 description 1
- 230000010354 integration Effects 0.000 description 1
- 238000009830 intercalation Methods 0.000 description 1
- 230000002452 interceptive effect Effects 0.000 description 1
- 230000001788 irregular Effects 0.000 description 1
- 229960003350 isoniazid Drugs 0.000 description 1
- QRXWMOHMRWLFEY-UHFFFAOYSA-N isoniazide Chemical compound NNC(=O)C1=CC=NC=C1 QRXWMOHMRWLFEY-UHFFFAOYSA-N 0.000 description 1
- 229960004130 itraconazole Drugs 0.000 description 1
- 229960000318 kanamycin Drugs 0.000 description 1
- 229930027917 kanamycin Natural products 0.000 description 1
- SBUJHOSQTJFQJX-NOAMYHISSA-N kanamycin Chemical compound O[C@@H]1[C@@H](O)[C@H](O)[C@@H](CN)O[C@@H]1O[C@H]1[C@H](O)[C@@H](O[C@@H]2[C@@H]([C@@H](N)[C@H](O)[C@@H](CO)O2)O)[C@H](N)C[C@@H]1N SBUJHOSQTJFQJX-NOAMYHISSA-N 0.000 description 1
- 229930182823 kanamycin A Natural products 0.000 description 1
- 229960004125 ketoconazole Drugs 0.000 description 1
- 238000009533 lab test Methods 0.000 description 1
- 229940039696 lactobacillus Drugs 0.000 description 1
- 229940115932 legionella pneumophila Drugs 0.000 description 1
- 229960005287 lincomycin Drugs 0.000 description 1
- OJMMVQQUTAEWLP-KIDUDLJLSA-N lincomycin Chemical compound CN1C[C@H](CCC)C[C@H]1C(=O)N[C@H]([C@@H](C)O)[C@@H]1[C@H](O)[C@H](O)[C@@H](O)[C@@H](SC)O1 OJMMVQQUTAEWLP-KIDUDLJLSA-N 0.000 description 1
- 229940041028 lincosamides Drugs 0.000 description 1
- 229960002422 lomefloxacin Drugs 0.000 description 1
- ZEKZLJVOYLTDKK-UHFFFAOYSA-N lomefloxacin Chemical compound FC1=C2N(CC)C=C(C(O)=O)C(=O)C2=CC(F)=C1N1CCNC(C)C1 ZEKZLJVOYLTDKK-UHFFFAOYSA-N 0.000 description 1
- 239000003120 macrolide antibiotic agent Substances 0.000 description 1
- 229940041033 macrolides Drugs 0.000 description 1
- 229960003640 mafenide Drugs 0.000 description 1
- 238000013507 mapping Methods 0.000 description 1
- 238000002844 melting Methods 0.000 description 1
- 230000008018 melting Effects 0.000 description 1
- 229910044991 metal oxide Inorganic materials 0.000 description 1
- 150000004706 metal oxides Chemical class 0.000 description 1
- 229960000282 metronidazole Drugs 0.000 description 1
- VAOCPAMSLUNLGC-UHFFFAOYSA-N metronidazole Chemical compound CC1=NC=C([N+]([O-])=O)N1CCO VAOCPAMSLUNLGC-UHFFFAOYSA-N 0.000 description 1
- 229960002159 micafungin Drugs 0.000 description 1
- PIEUQSKUWLMALL-YABMTYFHSA-N micafungin Chemical compound C1=CC(OCCCCC)=CC=C1C1=CC(C=2C=CC(=CC=2)C(=O)N[C@@H]2C(N[C@H](C(=O)N3C[C@H](O)C[C@H]3C(=O)N[C@H](C(=O)N[C@H](C(=O)N3C[C@H](C)[C@H](O)[C@H]3C(=O)N[C@H](O)[C@H](O)C2)[C@H](O)CC(N)=O)[C@H](O)[C@@H](O)C=2C=C(OS(O)(=O)=O)C(O)=CC=2)[C@@H](C)O)=O)=NO1 PIEUQSKUWLMALL-YABMTYFHSA-N 0.000 description 1
- 244000000010 microbial pathogen Species 0.000 description 1
- 230000003278 mimic effect Effects 0.000 description 1
- 239000002991 molded plastic Substances 0.000 description 1
- 238000000465 moulding Methods 0.000 description 1
- 229960003702 moxifloxacin Drugs 0.000 description 1
- FABPRXSRWADJSP-MEDUHNTESA-N moxifloxacin Chemical compound COC1=C(N2C[C@H]3NCCC[C@H]3C2)C(F)=CC(C(C(C(O)=O)=C2)=O)=C1N2C1CC1 FABPRXSRWADJSP-MEDUHNTESA-N 0.000 description 1
- 229960004927 neomycin Drugs 0.000 description 1
- 229960000808 netilmicin Drugs 0.000 description 1
- ZBGPYVZLYBDXKO-HILBYHGXSA-N netilmycin Chemical compound O([C@@H]1[C@@H](N)C[C@H]([C@@H]([C@H]1O)O[C@@H]1[C@]([C@H](NC)[C@@H](O)CO1)(C)O)NCC)[C@H]1OC(CN)=CC[C@H]1N ZBGPYVZLYBDXKO-HILBYHGXSA-N 0.000 description 1
- 230000007935 neutral effect Effects 0.000 description 1
- 229960000564 nitrofurantoin Drugs 0.000 description 1
- NXFQHRVNIOXGAQ-YCRREMRBSA-N nitrofurantoin Chemical compound O1C([N+](=O)[O-])=CC=C1\C=N\N1C(=O)NC(=O)C1 NXFQHRVNIOXGAQ-YCRREMRBSA-N 0.000 description 1
- 230000009871 nonspecific binding Effects 0.000 description 1
- 229960001180 norfloxacin Drugs 0.000 description 1
- OGJPXUAPXNRGGI-UHFFFAOYSA-N norfloxacin Chemical compound C1=C2N(CC)C=C(C(O)=O)C(=O)C2=CC(F)=C1N1CCNCC1 OGJPXUAPXNRGGI-UHFFFAOYSA-N 0.000 description 1
- 239000002773 nucleotide Substances 0.000 description 1
- 125000003729 nucleotide group Chemical group 0.000 description 1
- 235000016709 nutrition Nutrition 0.000 description 1
- VHFGEBVPHAGQPI-MYYQHNLBSA-N oritavancin Chemical compound O([C@@H]1C2=CC=C(C(=C2)Cl)OC=2C=C3C=C(C=2O[C@H]2[C@@H]([C@@H](O)[C@H](O)[C@@H](CO)O2)O[C@@H]2O[C@@H](C)[C@H](O)[C@@](C)(NCC=4C=CC(=CC=4)C=4C=CC(Cl)=CC=4)C2)OC2=CC=C(C=C2Cl)[C@@H](O)[C@H](C(N[C@@H](CC(N)=O)C(=O)N[C@H]3C(=O)N[C@H]2C(=O)N[C@@H]1C(N[C@H](C1=CC(O)=CC(O)=C1C=1C(O)=CC=C2C=1)C(O)=O)=O)=O)NC(=O)[C@@H](CC(C)C)NC)[C@H]1C[C@](C)(N)[C@@H](O)[C@H](C)O1 VHFGEBVPHAGQPI-MYYQHNLBSA-N 0.000 description 1
- 229960001607 oritavancin Drugs 0.000 description 1
- 108010006945 oritavancin Proteins 0.000 description 1
- 229960000625 oxytetracycline Drugs 0.000 description 1
- IWVCMVBTMGNXQD-PXOLEDIWSA-N oxytetracycline Chemical compound C1=CC=C2[C@](O)(C)[C@H]3[C@H](O)[C@H]4[C@H](N(C)C)C(O)=C(C(N)=O)C(=O)[C@@]4(O)C(O)=C3C(=O)C2=C1O IWVCMVBTMGNXQD-PXOLEDIWSA-N 0.000 description 1
- 235000019366 oxytetracycline Nutrition 0.000 description 1
- LSQZJLSUYDQPKJ-UHFFFAOYSA-N p-Hydroxyampicillin Natural products O=C1N2C(C(O)=O)C(C)(C)SC2C1NC(=O)C(N)C1=CC=C(O)C=C1 LSQZJLSUYDQPKJ-UHFFFAOYSA-N 0.000 description 1
- 238000004806 packaging method and process Methods 0.000 description 1
- 229960001914 paromomycin Drugs 0.000 description 1
- UOZODPSAJZTQNH-LSWIJEOBSA-N paromomycin Chemical compound N[C@@H]1[C@@H](O)[C@H](O)[C@H](CN)O[C@@H]1O[C@H]1[C@@H](O)[C@H](O[C@H]2[C@@H]([C@@H](N)C[C@@H](N)[C@@H]2O)O[C@@H]2[C@@H]([C@@H](O)[C@H](O)[C@@H](CO)O2)N)O[C@@H]1CO UOZODPSAJZTQNH-LSWIJEOBSA-N 0.000 description 1
- 229940051027 pasteurella multocida Drugs 0.000 description 1
- 230000037361 pathway Effects 0.000 description 1
- 238000000059 patterning Methods 0.000 description 1
- 150000002960 penicillins Chemical class 0.000 description 1
- 230000008447 perception Effects 0.000 description 1
- 230000000737 periodic effect Effects 0.000 description 1
- 230000003285 pharmacodynamic effect Effects 0.000 description 1
- 229920000024 polymyxin B Polymers 0.000 description 1
- 229960005266 polymyxin b Drugs 0.000 description 1
- 229920001184 polypeptide Polymers 0.000 description 1
- 229960001589 posaconazole Drugs 0.000 description 1
- RAGOYPUPXAKGKH-XAKZXMRKSA-N posaconazole Chemical compound O=C1N([C@H]([C@H](C)O)CC)N=CN1C1=CC=C(N2CCN(CC2)C=2C=CC(OC[C@H]3C[C@@](CN4N=CN=C4)(OC3)C=3C(=CC(F)=CC=3)F)=CC=2)C=C1 RAGOYPUPXAKGKH-XAKZXMRKSA-N 0.000 description 1
- 229950004447 posizolid Drugs 0.000 description 1
- 238000003825 pressing Methods 0.000 description 1
- 108090000765 processed proteins & peptides Proteins 0.000 description 1
- 102000004196 processed proteins & peptides Human genes 0.000 description 1
- 108010077112 prolyl-proline Proteins 0.000 description 1
- 229940055019 propionibacterium acne Drugs 0.000 description 1
- 238000001303 quality assessment method Methods 0.000 description 1
- 150000007660 quinolones Chemical class 0.000 description 1
- BTTNOGHPGJANSW-IBGZPJMESA-N radezolid Chemical compound O=C1O[C@@H](CNC(=O)C)CN1C1=CC=C(C=2C=CC(CNCC=3NN=NC=3)=CC=2)C(F)=C1 BTTNOGHPGJANSW-IBGZPJMESA-N 0.000 description 1
- 229950009965 radezolid Drugs 0.000 description 1
- 230000008707 rearrangement Effects 0.000 description 1
- 230000002441 reversible effect Effects 0.000 description 1
- 238000012552 review Methods 0.000 description 1
- 108020004418 ribosomal RNA Proteins 0.000 description 1
- 229940046939 rickettsia prowazekii Drugs 0.000 description 1
- 229940075118 rickettsia rickettsii Drugs 0.000 description 1
- 229960003040 rifaximin Drugs 0.000 description 1
- NZCRJKRKKOLAOJ-XRCRFVBUSA-N rifaximin Chemical compound OC1=C(C(O)=C2C)C3=C4N=C5C=C(C)C=CN5C4=C1NC(=O)\C(C)=C/C=C/[C@H](C)[C@H](O)[C@@H](C)[C@@H](O)[C@@H](C)[C@H](OC(C)=O)[C@H](C)[C@@H](OC)\C=C\O[C@@]1(C)OC2=C3C1=O NZCRJKRKKOLAOJ-XRCRFVBUSA-N 0.000 description 1
- 238000012502 risk assessment Methods 0.000 description 1
- 229960005224 roxithromycin Drugs 0.000 description 1
- 210000003296 saliva Anatomy 0.000 description 1
- 239000004065 semiconductor Substances 0.000 description 1
- 238000013207 serial dilution Methods 0.000 description 1
- 229940007046 shigella dysenteriae Drugs 0.000 description 1
- 229940115939 shigella sonnei Drugs 0.000 description 1
- 210000003491 skin Anatomy 0.000 description 1
- 150000003384 small molecules Chemical class 0.000 description 1
- 238000007711 solidification Methods 0.000 description 1
- 230000008023 solidification Effects 0.000 description 1
- 229960004954 sparfloxacin Drugs 0.000 description 1
- DZZWHBIBMUVIIW-DTORHVGOSA-N sparfloxacin Chemical compound C1[C@@H](C)N[C@@H](C)CN1C1=C(F)C(N)=C2C(=O)C(C(O)=O)=CN(C3CC3)C2=C1F DZZWHBIBMUVIIW-DTORHVGOSA-N 0.000 description 1
- 229960001294 spiramycin Drugs 0.000 description 1
- 235000019372 spiramycin Nutrition 0.000 description 1
- 229930191512 spiramycin Natural products 0.000 description 1
- 229940037649 staphylococcus haemolyticus Drugs 0.000 description 1
- 235000019698 starch Nutrition 0.000 description 1
- 239000008107 starch Substances 0.000 description 1
- 230000003068 static effect Effects 0.000 description 1
- 238000012066 statistical methodology Methods 0.000 description 1
- 230000001954 sterilising effect Effects 0.000 description 1
- 238000004659 sterilization and disinfection Methods 0.000 description 1
- 229960002673 sulfacetamide Drugs 0.000 description 1
- SKIVFJLNDNKQPD-UHFFFAOYSA-N sulfacetamide Chemical compound CC(=O)NS(=O)(=O)C1=CC=C(N)C=C1 SKIVFJLNDNKQPD-UHFFFAOYSA-N 0.000 description 1
- 229960004306 sulfadiazine Drugs 0.000 description 1
- SEEPANYCNGTZFQ-UHFFFAOYSA-N sulfadiazine Chemical compound C1=CC(N)=CC=C1S(=O)(=O)NC1=NC=CC=N1 SEEPANYCNGTZFQ-UHFFFAOYSA-N 0.000 description 1
- 229960000973 sulfadimethoxine Drugs 0.000 description 1
- ZZORFUFYDOWNEF-UHFFFAOYSA-N sulfadimethoxine Chemical compound COC1=NC(OC)=CC(NS(=O)(=O)C=2C=CC(N)=CC=2)=N1 ZZORFUFYDOWNEF-UHFFFAOYSA-N 0.000 description 1
- 229960000654 sulfafurazole Drugs 0.000 description 1
- 229960005158 sulfamethizole Drugs 0.000 description 1
- VACCAVUAMIDAGB-UHFFFAOYSA-N sulfamethizole Chemical compound S1C(C)=NN=C1NS(=O)(=O)C1=CC=C(N)C=C1 VACCAVUAMIDAGB-UHFFFAOYSA-N 0.000 description 1
- 229960005404 sulfamethoxazole Drugs 0.000 description 1
- 229960001940 sulfasalazine Drugs 0.000 description 1
- NCEXYHBECQHGNR-QZQOTICOSA-N sulfasalazine Chemical compound C1=C(O)C(C(=O)O)=CC(\N=N\C=2C=CC(=CC=2)S(=O)(=O)NC=2N=CC=CC=2)=C1 NCEXYHBECQHGNR-QZQOTICOSA-N 0.000 description 1
- NCEXYHBECQHGNR-UHFFFAOYSA-N sulfasalazine Natural products C1=C(O)C(C(=O)O)=CC(N=NC=2C=CC(=CC=2)S(=O)(=O)NC=2N=CC=CC=2)=C1 NCEXYHBECQHGNR-UHFFFAOYSA-N 0.000 description 1
- JLKIGFTWXXRPMT-UHFFFAOYSA-N sulphamethoxazole Chemical compound O1C(C)=CC(NS(=O)(=O)C=2C=CC(N)=CC=2)=N1 JLKIGFTWXXRPMT-UHFFFAOYSA-N 0.000 description 1
- 230000000153 supplemental effect Effects 0.000 description 1
- 230000004083 survival effect Effects 0.000 description 1
- XFALPSLJIHVRKE-GFCCVEGCSA-N tedizolid Chemical compound CN1N=NC(C=2N=CC(=CC=2)C=2C(=CC(=CC=2)N2C(O[C@@H](CO)C2)=O)F)=N1 XFALPSLJIHVRKE-GFCCVEGCSA-N 0.000 description 1
- 229960001608 teicoplanin Drugs 0.000 description 1
- 229960005240 telavancin Drugs 0.000 description 1
- ONUMZHGUFYIKPM-MXNFEBESSA-N telavancin Chemical compound O1[C@@H](C)[C@@H](O)[C@](NCCNCCCCCCCCCC)(C)C[C@@H]1O[C@H]1[C@H](OC=2C3=CC=4[C@H](C(N[C@H]5C(=O)N[C@H](C(N[C@@H](C6=CC(O)=C(CNCP(O)(O)=O)C(O)=C6C=6C(O)=CC=C5C=6)C(O)=O)=O)[C@H](O)C5=CC=C(C(=C5)Cl)O3)=O)NC(=O)[C@H](CC(N)=O)NC(=O)[C@H](NC(=O)[C@@H](CC(C)C)NC)[C@H](O)C3=CC=C(C(=C3)Cl)OC=2C=4)O[C@H](CO)[C@@H](O)[C@@H]1O ONUMZHGUFYIKPM-MXNFEBESSA-N 0.000 description 1
- 108010089019 telavancin Proteins 0.000 description 1
- 229960003250 telithromycin Drugs 0.000 description 1
- LJVAJPDWBABPEJ-PNUFFHFMSA-N telithromycin Chemical compound O([C@@H]1[C@@H](C)C(=O)[C@@H](C)C(=O)O[C@@H]([C@]2(OC(=O)N(CCCCN3C=C(N=C3)C=3C=NC=CC=3)[C@@H]2[C@@H](C)C(=O)[C@H](C)C[C@@]1(C)OC)C)CC)[C@@H]1O[C@H](C)C[C@H](N(C)C)[C@H]1O LJVAJPDWBABPEJ-PNUFFHFMSA-N 0.000 description 1
- 229960004576 temafloxacin Drugs 0.000 description 1
- IWVCMVBTMGNXQD-UHFFFAOYSA-N terramycin dehydrate Natural products C1=CC=C2C(O)(C)C3C(O)C4C(N(C)C)C(O)=C(C(N)=O)C(=O)C4(O)C(O)=C3C(=O)C2=C1O IWVCMVBTMGNXQD-UHFFFAOYSA-N 0.000 description 1
- 238000010998 test method Methods 0.000 description 1
- 238000012956 testing procedure Methods 0.000 description 1
- 229940040944 tetracyclines Drugs 0.000 description 1
- JGVWCANSWKRBCS-UHFFFAOYSA-N tetramethylrhodamine thiocyanate Chemical compound [Cl-].C=12C=CC(N(C)C)=CC2=[O+]C2=CC(N(C)C)=CC=C2C=1C1=CC=C(SC#N)C=C1C(O)=O JGVWCANSWKRBCS-UHFFFAOYSA-N 0.000 description 1
- MPLHNVLQVRSVEE-UHFFFAOYSA-N texas red Chemical compound [O-]S(=O)(=O)C1=CC(S(Cl)(=O)=O)=CC=C1C(C1=CC=2CCCN3CCCC(C=23)=C1O1)=C2C1=C(CCC1)C3=[N+]1CCCC3=C2 MPLHNVLQVRSVEE-UHFFFAOYSA-N 0.000 description 1
- 230000008646 thermal stress Effects 0.000 description 1
- 150000003573 thiols Chemical class 0.000 description 1
- OHKOGUYZJXTSFX-KZFFXBSXSA-N ticarcillin Chemical compound C=1([C@@H](C(O)=O)C(=O)N[C@H]2[C@H]3SC([C@@H](N3C2=O)C(O)=O)(C)C)C=CSC=1 OHKOGUYZJXTSFX-KZFFXBSXSA-N 0.000 description 1
- 229960004659 ticarcillin Drugs 0.000 description 1
- 229960004089 tigecycline Drugs 0.000 description 1
- 210000001519 tissue Anatomy 0.000 description 1
- 230000007704 transition Effects 0.000 description 1
- 238000002834 transmittance Methods 0.000 description 1
- 229960000497 trovafloxacin Drugs 0.000 description 1
- WVPSKSLAZQPAKQ-CDMJZVDBSA-N trovafloxacin Chemical compound C([C@H]1[C@@H]([C@H]1C1)N)N1C(C(=CC=1C(=O)C(C(O)=O)=C2)F)=NC=1N2C1=CC=C(F)C=C1F WVPSKSLAZQPAKQ-CDMJZVDBSA-N 0.000 description 1
- 238000010200 validation analysis Methods 0.000 description 1
- 210000003462 vein Anatomy 0.000 description 1
- 230000035899 viability Effects 0.000 description 1
- 229940118696 vibrio cholerae Drugs 0.000 description 1
- 229960004740 voriconazole Drugs 0.000 description 1
- BCEHBSKCWLPMDN-MGPLVRAMSA-N voriconazole Chemical compound C1([C@H](C)[C@](O)(CN2N=CN=C2)C=2C(=CC(F)=CC=2)F)=NC=NC=C1F BCEHBSKCWLPMDN-MGPLVRAMSA-N 0.000 description 1
- 229940098232 yersinia enterocolitica Drugs 0.000 description 1
- KGPGQDLTDHGEGT-JCIKCJKQSA-N zeven Chemical compound C=1C([C@@H]2C(=O)N[C@H](C(N[C@H](C3=CC(O)=C4)C(=O)NCCCN(C)C)=O)[C@H](O)C5=CC=C(C(=C5)Cl)OC=5C=C6C=C(C=5O[C@H]5[C@@H]([C@@H](O)[C@H](O)[C@H](O5)C(O)=O)NC(=O)CCCCCCCCC(C)C)OC5=CC=C(C=C5)C[C@@H]5C(=O)N[C@H](C(N[C@H]6C(=O)N2)=O)C=2C(Cl)=C(O)C=C(C=2)OC=2C(O)=CC=C(C=2)[C@H](C(N5)=O)NC)=CC=C(O)C=1C3=C4O[C@H]1O[C@H](CO)[C@@H](O)[C@H](O)[C@@H]1O KGPGQDLTDHGEGT-JCIKCJKQSA-N 0.000 description 1
Images


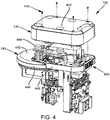


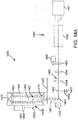
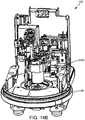


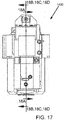

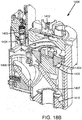


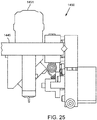


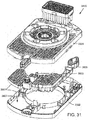
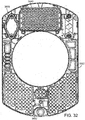
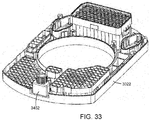
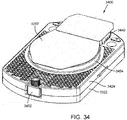


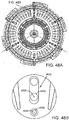

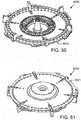


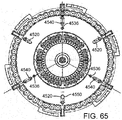
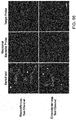

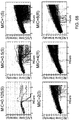


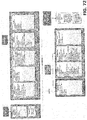


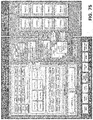
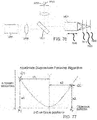
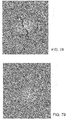


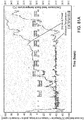


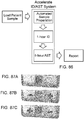


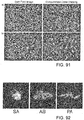


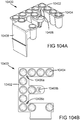


Classifications
-
- G—PHYSICS
- G01—MEASURING; TESTING
- G01N—INVESTIGATING OR ANALYSING MATERIALS BY DETERMINING THEIR CHEMICAL OR PHYSICAL PROPERTIES
- G01N35/00—Automatic analysis not limited to methods or materials provided for in any single one of groups G01N1/00 - G01N33/00; Handling materials therefor
- G01N35/00584—Control arrangements for automatic analysers
- G01N35/00594—Quality control, including calibration or testing of components of the analyser
- G01N35/00613—Quality control
-
- B—PERFORMING OPERATIONS; TRANSPORTING
- B01—PHYSICAL OR CHEMICAL PROCESSES OR APPARATUS IN GENERAL
- B01L—CHEMICAL OR PHYSICAL LABORATORY APPARATUS FOR GENERAL USE
- B01L3/00—Containers or dishes for laboratory use, e.g. laboratory glassware; Droppers
- B01L3/52—Containers specially adapted for storing or dispensing a reagent
- B01L3/527—Containers specially adapted for storing or dispensing a reagent for a plurality of reagents
-
- C—CHEMISTRY; METALLURGY
- C12—BIOCHEMISTRY; BEER; SPIRITS; WINE; VINEGAR; MICROBIOLOGY; ENZYMOLOGY; MUTATION OR GENETIC ENGINEERING
- C12Q—MEASURING OR TESTING PROCESSES INVOLVING ENZYMES, NUCLEIC ACIDS OR MICROORGANISMS; COMPOSITIONS OR TEST PAPERS THEREFOR; PROCESSES OF PREPARING SUCH COMPOSITIONS; CONDITION-RESPONSIVE CONTROL IN MICROBIOLOGICAL OR ENZYMOLOGICAL PROCESSES
- C12Q1/00—Measuring or testing processes involving enzymes, nucleic acids or microorganisms; Compositions therefor; Processes of preparing such compositions
- C12Q1/02—Measuring or testing processes involving enzymes, nucleic acids or microorganisms; Compositions therefor; Processes of preparing such compositions involving viable microorganisms
- C12Q1/18—Testing for antimicrobial activity of a material
-
- G—PHYSICS
- G01—MEASURING; TESTING
- G01N—INVESTIGATING OR ANALYSING MATERIALS BY DETERMINING THEIR CHEMICAL OR PHYSICAL PROPERTIES
- G01N35/00—Automatic analysis not limited to methods or materials provided for in any single one of groups G01N1/00 - G01N33/00; Handling materials therefor
- G01N35/00584—Control arrangements for automatic analysers
- G01N35/00722—Communications; Identification
- G01N35/00732—Identification of carriers, materials or components in automatic analysers
-
- G—PHYSICS
- G01—MEASURING; TESTING
- G01N—INVESTIGATING OR ANALYSING MATERIALS BY DETERMINING THEIR CHEMICAL OR PHYSICAL PROPERTIES
- G01N35/00—Automatic analysis not limited to methods or materials provided for in any single one of groups G01N1/00 - G01N33/00; Handling materials therefor
- G01N35/10—Devices for transferring samples or any liquids to, in, or from, the analysis apparatus, e.g. suction devices, injection devices
- G01N35/1095—Devices for transferring samples or any liquids to, in, or from, the analysis apparatus, e.g. suction devices, injection devices for supplying the samples to flow-through analysers
-
- B—PERFORMING OPERATIONS; TRANSPORTING
- B01—PHYSICAL OR CHEMICAL PROCESSES OR APPARATUS IN GENERAL
- B01L—CHEMICAL OR PHYSICAL LABORATORY APPARATUS FOR GENERAL USE
- B01L2200/00—Solutions for specific problems relating to chemical or physical laboratory apparatus
- B01L2200/02—Adapting objects or devices to another
- B01L2200/025—Align devices or objects to ensure defined positions relative to each other
-
- B—PERFORMING OPERATIONS; TRANSPORTING
- B01—PHYSICAL OR CHEMICAL PROCESSES OR APPARATUS IN GENERAL
- B01L—CHEMICAL OR PHYSICAL LABORATORY APPARATUS FOR GENERAL USE
- B01L2200/00—Solutions for specific problems relating to chemical or physical laboratory apparatus
- B01L2200/02—Adapting objects or devices to another
- B01L2200/026—Fluid interfacing between devices or objects, e.g. connectors, inlet details
-
- B—PERFORMING OPERATIONS; TRANSPORTING
- B01—PHYSICAL OR CHEMICAL PROCESSES OR APPARATUS IN GENERAL
- B01L—CHEMICAL OR PHYSICAL LABORATORY APPARATUS FOR GENERAL USE
- B01L2200/00—Solutions for specific problems relating to chemical or physical laboratory apparatus
- B01L2200/04—Exchange or ejection of cartridges, containers or reservoirs
-
- B—PERFORMING OPERATIONS; TRANSPORTING
- B01—PHYSICAL OR CHEMICAL PROCESSES OR APPARATUS IN GENERAL
- B01L—CHEMICAL OR PHYSICAL LABORATORY APPARATUS FOR GENERAL USE
- B01L2200/00—Solutions for specific problems relating to chemical or physical laboratory apparatus
- B01L2200/06—Fluid handling related problems
- B01L2200/0689—Sealing
-
- B—PERFORMING OPERATIONS; TRANSPORTING
- B01—PHYSICAL OR CHEMICAL PROCESSES OR APPARATUS IN GENERAL
- B01L—CHEMICAL OR PHYSICAL LABORATORY APPARATUS FOR GENERAL USE
- B01L2300/00—Additional constructional details
- B01L2300/02—Identification, exchange or storage of information
- B01L2300/021—Identification, e.g. bar codes
-
- B—PERFORMING OPERATIONS; TRANSPORTING
- B01—PHYSICAL OR CHEMICAL PROCESSES OR APPARATUS IN GENERAL
- B01L—CHEMICAL OR PHYSICAL LABORATORY APPARATUS FOR GENERAL USE
- B01L2300/00—Additional constructional details
- B01L2300/04—Closures and closing means
- B01L2300/041—Connecting closures to device or container
- B01L2300/044—Connecting closures to device or container pierceable, e.g. films, membranes
-
- B—PERFORMING OPERATIONS; TRANSPORTING
- B01—PHYSICAL OR CHEMICAL PROCESSES OR APPARATUS IN GENERAL
- B01L—CHEMICAL OR PHYSICAL LABORATORY APPARATUS FOR GENERAL USE
- B01L2300/00—Additional constructional details
- B01L2300/08—Geometry, shape and general structure
- B01L2300/0803—Disc shape
-
- B—PERFORMING OPERATIONS; TRANSPORTING
- B01—PHYSICAL OR CHEMICAL PROCESSES OR APPARATUS IN GENERAL
- B01L—CHEMICAL OR PHYSICAL LABORATORY APPARATUS FOR GENERAL USE
- B01L2300/00—Additional constructional details
- B01L2300/08—Geometry, shape and general structure
- B01L2300/0809—Geometry, shape and general structure rectangular shaped
- B01L2300/0829—Multi-well plates; Microtitration plates
-
- B—PERFORMING OPERATIONS; TRANSPORTING
- B01—PHYSICAL OR CHEMICAL PROCESSES OR APPARATUS IN GENERAL
- B01L—CHEMICAL OR PHYSICAL LABORATORY APPARATUS FOR GENERAL USE
- B01L2300/00—Additional constructional details
- B01L2300/16—Surface properties and coatings
- B01L2300/168—Specific optical properties, e.g. reflective coatings
-
- B—PERFORMING OPERATIONS; TRANSPORTING
- B01—PHYSICAL OR CHEMICAL PROCESSES OR APPARATUS IN GENERAL
- B01L—CHEMICAL OR PHYSICAL LABORATORY APPARATUS FOR GENERAL USE
- B01L2400/00—Moving or stopping fluids
- B01L2400/04—Moving fluids with specific forces or mechanical means
- B01L2400/0403—Moving fluids with specific forces or mechanical means specific forces
- B01L2400/0457—Moving fluids with specific forces or mechanical means specific forces passive flow or gravitation
-
- B—PERFORMING OPERATIONS; TRANSPORTING
- B01—PHYSICAL OR CHEMICAL PROCESSES OR APPARATUS IN GENERAL
- B01L—CHEMICAL OR PHYSICAL LABORATORY APPARATUS FOR GENERAL USE
- B01L3/00—Containers or dishes for laboratory use, e.g. laboratory glassware; Droppers
- B01L3/54—Labware with identification means
- B01L3/545—Labware with identification means for laboratory containers
-
- G—PHYSICS
- G01—MEASURING; TESTING
- G01N—INVESTIGATING OR ANALYSING MATERIALS BY DETERMINING THEIR CHEMICAL OR PHYSICAL PROPERTIES
- G01N15/00—Investigating characteristics of particles; Investigating permeability, pore-volume or surface-area of porous materials
- G01N15/10—Investigating individual particles
- G01N15/14—Optical investigation techniques, e.g. flow cytometry
-
- G—PHYSICS
- G01—MEASURING; TESTING
- G01N—INVESTIGATING OR ANALYSING MATERIALS BY DETERMINING THEIR CHEMICAL OR PHYSICAL PROPERTIES
- G01N35/00—Automatic analysis not limited to methods or materials provided for in any single one of groups G01N1/00 - G01N33/00; Handling materials therefor
- G01N35/02—Automatic analysis not limited to methods or materials provided for in any single one of groups G01N1/00 - G01N33/00; Handling materials therefor using a plurality of sample containers moved by a conveyor system past one or more treatment or analysis stations
- G01N35/025—Automatic analysis not limited to methods or materials provided for in any single one of groups G01N1/00 - G01N33/00; Handling materials therefor using a plurality of sample containers moved by a conveyor system past one or more treatment or analysis stations having a carousel or turntable for reaction cells or cuvettes
Definitions
- the present disclosure relates to an instrument and system for performing microorganism identification and antimicrobial susceptibility testing.
- This automated microscopy system comprises a reagent cartridge comprising a plurality of wells; a reagent stage, wherein the reagent stage comprises an annular shape defining an interior opening, wherein the regent stage is configured to rotate in a first plane, and wherein the reagent stage is configured to receive the reagent cartridge; a cassette comprising a plurality of microfluidic channels, each of the plurality of microfluidic channels comprising an inlet port configured to receive a pipette tip; a cassette stage located within the interior opening of the reagent stage, wherein the cassette stage is configured to rotate and move laterally in the first plane, and wherein the cassette stage is configured to receive the cassette; a pipettor assembly configured to move a plurality of reagents between the plurality of wells of the reagent cartridge and the inlet ports of each of the plurality of microfluidic channels; an optical detection system configured
- the system may further comprise an optical detection system comprising a rapid focus algorithm that calculates the virtual true focus position of an individual microorganism at a given location within about 500 ms, which via repeated imaging over a period of time, permits identification of responses of that microorganism to environmental conditions.
- the system can be used for imaging microorganisms tagged with fluorescent labels, such as fluorescently labeled probes that recognize and bind to complementary bacterial sequences.
- the system accomplishes this in a process that comprises utilizing custom image analysis software to assign unique spatial XY coordinates to individual microbes bound to labeled probes and to identify characteristics of them. Morphological and other data obtained from captured images are inputted to a probability expectation model of distribution to identify one or more microorganisms in patient samples.
- the system may further comprise a Proportional-Integral-Derivative ("PID") controller algorithm that dynamically adjusts motor idle torque to control heat load.
- PID Proportional-Integral-Derivative
- the system may subject identified microorganisms to antimicrobial susceptibility analysis.
- the microorganisms can be grown in Mueller-Hinton nutrient-depleted media to differentiate antimicrobial-resistant cells from filamentous, antimicrobial-susceptible cells, often within about 12 hours of growth.
- fastidious microorganisms may be grown in 1% phytone tryptose Mueller Hinton Agar for determination of antimicrobial susceptibility and/or minimum inhibitory concentration of antimicrobial agents.
- the system may further comprise a system comprising a dynamic dilution algorithm that determines a target dilution factor for a sample to achieve dilution of the sample to a target concentration (such as number of cells per field of view or number of clones or colonies per field of view).
- a system may comprise Quality Control (QC) components such as the one disclosed in prior art documents WO 2011/035304 A2 or WO 2013/130875 A1 .
- the disclosed invention relates to components and methods for quality control (QC) testing of the systems and methods for microbial identification and antibiotic susceptibility testing according to claims 1 and 9.
- An automated antibiotic susceptibility testing (AST) QC component according to claim 1 is provided.
- the AST QC component includes at least one clip that interacts with a microbial identification QC component.
- an automated microbial identification (ID) QC component is provided.
- the microbial ID QC component includes a frame including a plurality of wells; at least one clip attached to the frame; at least one target microbial nucleic acid molecule in at least one of the plurality of wells; and a means of identifying the component as an ID QC test by an automated system.
- the microbial ID QC component is configured to have a complementary shape to an antibiotic susceptibility QC component.
- at least one clip of the ID QC component interacts with an AST QC component.
- the AST QC component is provided in a kit, optionally with an ID QC component.
- the AST QC and ID QC components can be used for QC testing of microbial identification and antibiotic susceptibility testing using the systems and methods provided herein.
- an AST QC component is attached to a reagent cartridge in the sample vial position and inserted into a system disclosed herein.
- the one or more microbial isolates in the AST QC component are introduced into the plurality of microfluidic channels of the cassette of the system and the one or more microbial isolates are grown in the presence or absence of one or more antimicrobial agents.
- the growth of the microbial isolates is monitored over time and susceptibility or resistance of the one or more microbial isolates to the one or more antimicrobial agents is determined.
- the results can be provided to a user by generating a QC test report.
- the AST QC testing is carried out in conjunction with ID QC testing.
- Both the AST QC and ID QC components are attached to the reagent cartridge in the sample vial position, wherein the microbial ID QC component is configured to have a complementary shape to the AST QC component and the ID QC component is substantially flush with the AST QC component.
- the reagent cartridge including the AST QC component and the ID QC component is inserted in the system.
- At least one of the target microbial nucleic acid molecules is introduced to the plurality of microfluidic channels of the cassette and one or more labeled target probes that recognize and bind sequences of the at least one target microbial nucleic acid molecules is introduced into the at least one of the plurality of microfluidic channels containing the target microbial nucleic acid molecule.
- the labeled probes are incubated with the at least one target microbial nucleic acid molecule for a time sufficient to enable binding of the probes to target microbial nucleic acid molecule and a signal from the one or more labeled target probes is detected.
- Presence of a signal indicates a positive ID result and absence of a signal indicates a negative ID result.
- the results of the test are provided by generating an ID QC test report.
- the at least one target microbial nucleic acid molecule is coupled to a microsphere.
- nucleic acid and amino acid sequences listed herein or in the accompanying sequence listing are shown using standard letter abbreviations for nucleotide bases and amino acids. In at least some cases, only one strand of each nucleic acid sequence is shown, but the complementary strand is understood as included by any reference to the displayed strand.
- Sequence_Listing.txt which was created on September 29, 2016, and is 1494 bytes.
- AST is antimicrobial susceptibility testing, antimicrobial agent susceptibility testing, or antibiotic susceptibility testing.
- FISH fluorescence in situ hybridization
- EKC electrokinetic concentration. EKC is a process of applying an electrical field to microbial cells suspended in a fluid to produce migration of the cells toward the surface of a positive electrode.
- GEF gel electrofiltration. GEF is a process of sample preparation that relies on application of an electrical field to cause sample debris present in a sample to be separated from microorganism cells.
- ID is identification, such as a process of determining the species identity of a microorganism, for example, using FISH.
- ITO indium tin oxide
- an "LED” is a light emitting diode.
- MHA Mueller Hinton Agar
- MLSb is macrolide-lincosamide-streptogramin B resistance.
- MRS methicillin-resistant staphylococci
- MRSA methicillin-resistant Staphylococcus aureus.
- Patient samples such as blood samples, are the primary biological starting point for assessing the etiology of a patient's disease and determining the appropriate therapy course for treating that disease. Key to reducing morbidity and mortality is initiating the proper therapeutic treatment of a critically ill patient at the appropriate dosage regimen as soon as possible.
- the historically weak link in this process is sufficient cultivation of a microbial population to enable identification of pathogen(s) present and to determine which antimicrobial compounds the pathogen(s) will respond to in therapy. Reducing the assay time required to properly identify microorganism(s) in a patient sample and assess their drug sensitivity is crucial to improving patient survival odds.
- patient samples contain multiple types of microorganisms, such as mixtures of bacteria from differing genera, species, and even strains (also known as "polymicrobial" samples). Diagnostic accuracy is traditionally expressed in terms of sensitivity and specificity. Sensitivity refers to the probability of assigning a diagnostic test as positive when it is in fact, positive (the fraction of true positives), which confound the identification and antimicrobial sensitivity processes. The counter to sensitivity is specificity, which is the rate of obtaining false negative test results. Current methods of identifying unknown microorganisms are prone to failure in both false positive and false negative modes. These difficulties with sensitivity and specificity are typically fostered by factors that impede sample detection, such as noise, crosstalk, borderline resistance, and the like.
- ID identification
- AST antimicrobial susceptibility testing
- massively multiplexed automated single cell digital microscopy was developed as a fully automated, microscopy-based method that can in some embodiments perform bacterial/yeast identification in about one (1) hour and antimicrobial susceptibility testing in about five (5) or fewer hours directly from clinical specimens.
- Various embodiments disclosed herein set forth a massively multiplexed automated single cell digital microscopy system employing a process that applies a Fluorescence In Situ Hybridization (FISH)-based detection protocol for the identification of microorganisms in patient samples, whether the target sample is composed of a single, or mono-microbial population or a mixed, polymicrobial population.
- FISH Fluorescence In Situ Hybridization
- the system uses sufficient information about typical or "expected" reference sample microbe populations (such as a reference panel of known microorganisms) in order to be “trained” to establish baseline expectations for typical patient samples subjected to FISH analysis.
- typical or "expected" reference sample microbe populations such as a reference panel of known microorganisms
- the automated system can apply the baseline parameters to evaluate a patient sample of unknown composition with sufficient confidence that microbial cells can be identified from sample contaminants.
- the relevance between unknown microbes in a sample and members of a reference panel is assessed statistically.
- the identity of unknown microorganisms can be achieved without specific a priori knowledge of the type or types of organisms present in a patient sample. And the process can be performed on multiple samples loaded into a single disclosed instrument, making microbial identification highly accurate and efficient.
- the methods and systems described herein provide for microbial identification through a process that combines FISH labeling of unknown microbes and analysis of that binding by Bayesian statistical methodology using probability distribution established by system training.
- This approach enables better discrimination of microorganisms of interest from interfering noise and/or other microorganisms than is afforded by more traditional methodologies.
- These benefits are realized without impairing detection sensitivity or specificity.
- This improved technology avoids many of the pitfalls that beset "Frequentist" logic, which entails setting single a discriminatory value in order to minimize Type 1 errors (rejecting the null hypothesis when it is in fact true) and Type 2 errors (not rejecting the null hypothesis when in fact the alternate hypothesis is true).
- the methods and systems disclosed herein provide a process by which microorganisms may be discriminated and/or identified by species and/or type.
- various embodiments utilize FISH as a tool for visualizing targeted microorganisms.
- Bayesian analysis is coupled with a model derived from accumulating an extensive data set to define the characteristics/descriptors to be employed in microbial identification and sensitivity testing.
- the identity of unknown organisms is assessed in part by calculating a probability that determines the likelihood that sequences in an unknown organism are complementary to FISH probes directed to known reference organism sequences.
- the assessment includes assigning a posterior probability for one or more reference microorganisms given the observed probe binding of unknown organisms in a patient sample.
- This probability is Bayesian in nature, which assesses the likelihood of the identity of the unknown microorganisms. Once the microbial pathogens in a patient sample have been identified, the FISH results (both counts and actual posterior probabilities) will steer or direct AST sub-population analysis.
- an ID/AST System identity/antimicrobial susceptibility testing
- the disclosed ID/AST system provides clinicians information to make patient treatment decisions in a timely manner.
- an ID/AST system as described herein may aid antimicrobial stewardship efforts and lead to improved patient outcomes.
- assays for detecting methicillin-resistant Staphylococcus aureus (MRSA), methicillin-resistant staphylococci (MRS), macrolide-lincosamide-streptogramin b resistance (MLSb), and high-level aminoglycoside resistance (HLAR) are provided.
- AD-1 Accelerate Diagnostics Instrument Model
- the disclosed AD-1 instrument analyzes samples derived from various types of biological specimens, such as blood (or a fraction thereof, such as plasma or serum), respiratory samples (such as bronchoalveolar lavage, sputum, oropharyngeal swab, or nasopharyngeal swab), urine, etc., to perform identification (ID) of the species of bacteria present in the sample as well as to determine the susceptibility of the bacteria to various antibiotics from a panel of antibiotics (e.g., antibiotic susceptibility testing, or "AST").
- ID identification
- the disclosed instrument is configured to perform these processes rapidly in an automated fashion that does not require user intervention following preparation of the sample and initiation of an analytical run.
- the instrument comprises an outer housing and a base assembly.
- the base assembly supports a reagent stage, a cassette stage, a pipettor assembly for fluid handling, and an illumination and optics assembly for imaging the sample.
- An attached system controller is configured to receive input and provide output, run the instrument, and store and process image data acquired by the system.
- the system also comprises a reagent cartridge that contains all reagents and consumables required by the instrument during a run as well as the cassette used to perform the ID and AST steps and facilitate microorganism visualization and image acquisition by the instrument's illumination and optics assembly.
- a user prepares a sample to be analyzed using the system and places a portion of the sample in a sample vial provided as part of the reagent cartridge.
- the user places the sample vial containing the sample in position in the cartridge, inserts the cartridge into the reagent stage of the instrument, inserts a cassette into the cassette stage, and presses a button on the instrument to initiate the ID and AST analyses, which the instrument and system can generally complete within 8 hours or less, such as less than about 5 hours (such as 4 to 8 hours, 4 to 6 hours, or 5 to 6 hours).
- the instrument 100 may comprise an upper enclosure 110, a lower enclosure 120, a door 130, and a base assembly 140.
- the upper enclosure 110 may enclose and protect many of the instrument components, such as the illuminator, the pipettor, and the controller.
- the upper enclosure 110 may comprise a rigid and lightweight material, such as plastic, aluminum, or a composite material.
- the upper enclosure 110 may be generally rectangular with rounded corners. However, those skilled in the art will appreciate that the upper enclosure 110 may be any suitable shape.
- the upper enclosure 110 may comprise a flat top side 112.
- the upper enclosure 110 may comprise an opening for a door 130.
- the door 130 may be generally cylindrical or frustoconical.
- the instrument 100 may comprise a button 150 which causes the door 130 to open or close.
- the button 150 is located in a base assembly 140 of the instrument 100.
- the button 150 may be located at any suitable position on the instrument 100.
- the door 130 may rotate to an open position.
- FIG. 2 a perspective view of the instrument 100 with the door 130 in the open position is illustrated.
- the door 130 may rotate to open or close.
- the door 130 may be driven by an electric motor.
- the door 130 may comprise a cut out section 232 configured to receive a cartridge which contains reagents and a specimen.
- a user may also insert a cassette through the open door 130.
- a user may insert a cartridge and cassette through the cut out section 232 of the door 130, and press the button 150 to close the door 130. In various embodiments, pressing the button 150 to close the door 130 automatically starts the ID/AST process.
- the back side 314 of the upper enclosure 110 may comprise an exhaust port 316.
- the exhaust port 316 may allow an exhaust fan 320 to expel air from within the upper enclosure 110.
- the exhaust fan 320 may provide cooling to the instrument 100 as needed to maintain precise temperatures.
- the upper enclosure 110 may comprise an insulation layer configured to decrease heat escape from the interior of the instrument 100.
- Tight control of an instrument's enclosure temperature can be very difficult to achieve using only an exhaust fan, particularly in view of the substantial variations in ambient laboratory temperatures that may exist.
- Ambient laboratory temperatures may range, for example, from about 16°C to about 32°C depending upon geographic location, building heating and cooling controls, and other factors.
- the presence of one or more motors and/or heaters that exude heat in an enclosed instrument generally necessitates the use of a larger exhaust fan than otherwise would be needed for cooling the instrument. Inclusion of a larger exhaust fan necessitates enlargement of the overall size of the instrument, thereby increasing manufacturing costs.
- the instrument overcomes this heat problem by controlling its heat-generating components (e.g., motors and heaters) and - if desired - an exhaust fan with a proportional-integral-derivative (PID) controller algorithm.
- PID proportional-integral-derivative
- only heat-generating components may be subject to dynamic control by the PID controller algorithm to alter the housing temperature of the instrument.
- Each heat-generating component is independent, and the PID values for each are added together to determine the overall heat control needed for the instrument.
- the disclosure provides that each heat-generating instrument component be a dynamically controlled feature, such that the combination of PID algorithms adjusts for the total heat output within the instrument housing. In essence, every component that generates heat during operation of the instrument may be subjected to PID algorithmic control.
- control of the motors may be relinquished in view of the enclosure temperature.
- the activity of each motor may be increased or decreased as needed to help control the overall instrument housing temperature. Anything that produces waste heat may be subject to this type of control, even an instrument camera.
- a camera may be manipulated to exude more or less heat as needed to control the temperature within the instrument housing. This heat control factor is important, as the instrument may be left on for days or weeks at a time, and the ability to manipulate the waste heat from multiple components during idle time permits finer control of the overall housing temperature.
- instrument components will typically reduce their power usage when in idle mode, which improves the overall energy efficiency of the instrument. Harnessing the waste heat of multiple instrument components in this fashion requires less cycling of motors and fans, thereby extending their useful lifespans. When exhaust fans reduce their cycling, less air intake occurs, which in turn reduces the amount of dust that accumulates inside the instrument.
- the instrument When each of the motors in the instrument completes its tasks, these components return to an idle power level, where they may remain until called upon to function in a subsequent sample run.
- the instrument's motors use more power when moving than when idle. However, idle mode does not have to mean that power usage remain static at an arbitrary level.
- the instrument motors can change their power draw from about 25 watts to as much as about 45 watts at idle to cool or warm the instrument depending upon need in order to match a set point, for example a set point of 31°C. A change of 20-25 watts is equivalent to about a 100-125% increase in waste heat.
- the PID controller algorithm employs a power range extending from +100% to -100%.
- a minimum and a maximum idle torque are established which may then be scaled to fit the 0% -100% range for heat control.
- an exhaust fan of the instrument activates in the positive region of this range and the idle torque of a stepper motor activates in the negative region of this range.
- the idle torque of a stepper motor activates to generate heat within instrument until the set point temperature is reached.
- the exhaust fan activates and expels heated air through an exhaust port.
- FIG. 81A graphically depicts the results of a thermal stress challenge to the instrument in an environmental chamber simulating ambient laboratory temperatures ranging between 16°C and 32°C.
- the graph plots instrument enclosure power in direct current on the left y-axis against time in hours along the bottom x-axis.
- the right y-axis sets forth the instrument's enclosure temperature as measured and controlled throughout the experiment using feedback from a thermistor. Following an initial baseline equilibration period, a two-hour simulated assay was run at each equilibrated temperature within the range, with the test temperatures set forth in boxes in FIG. 81A .
- the enclosure temperature of the instrument was stably maintained at a set point value of 31°C when exposed to simulated laboratory environment temperatures from below 18°C to 30°C, as represented by the bottom line. Loss of enclosure temperature control occurred at a simulated laboratory temperature of 32°C, which is visualized by the upper line reaching and holding at the 100% enclosure power mark. At simulated laboratory temperatures below 22°C, the instrument enclosure temperature was controlled by modulation of stepper motor idle torque via a PID algorithm. The cooler ambient temperatures necessitated the generation of additional heat by increasing the motor idle torque (negative enclosure power on the graph), and retaining that heat by not running the exhaust fan of the instrument in order to maintain the set point temperature of 31°C.
- the same PID algorithm drove the expulsion of heated air by increasing the speed of the instrument's exhaust fan (positive enclosure power on the graph).
- the exhaust fan smoothly held the enclosure set point temperature when the ambient temperature reached the threshold for reducing heat output by instrument components and increasing removal of heated air via the exhaust fan.
- This paired dynamic activity eliminated the need for constant switching on and off of the fan, as is observable in instruments that experience far more dramatic temperature spikes.
- the instrument dynamically adjusts motor torque to maintain housing temperature, thereby facilitating slower, more gradual temperature changes within a reasonable ambient temperature range.
- the overall result is the ability of a smaller fan to perform exhausting functions, which permits the instrument to be constructed in a smaller housing space.
- the lower enclosure 120 may enclose and protect various components, such as various optics system components.
- the lower enclosure 120 may be coupled to a bottom side 442 of the base assembly 140.
- the lower enclosure 120 may comprise a plurality of apertures 422 configured to receive damping feet 444 which support the instrument 100.
- the lower enclosure 120 may comprise a rigid and lightweight material, such as plastic, aluminum, or a composite material.
- the lower enclosure 120 may be generally rectangular with rounded corners. However, those skilled in the art will appreciate that the lower enclosure 120 may be any suitable shape.
- the lower enclosure 120 and the upper enclosure 110 may be coupled to the base assembly 140 via a plurality of screws 410. However, the lower enclosure 120 and the upper enclosure 110 may be coupled to the base assembly 140 by any of a variety of suitable attachment mechanisms.
- a plurality of damping feet 444 may be coupled to the base assembly 140.
- the damping feet 444 may comprise rubber or a polymeric material which damps vibrations.
- the various instrument components such as the reagent stage, cassette stage, optics system, pipettor, and illuminator may be coupled to the base assembly 140.
- the base assembly 140, reagent and cassette stages, optics system, pipettor, and illuminator may be vibrationally coupled, such that relative movement between components due to external vibrations is limited.
- the base assembly 140 may comprise a rectangular portion 446 and a circular portion 448.
- the pipettor, the illuminator, and the optics system may be coupled to the rectangular portion 446.
- a reagent stage and a cassette stage may be coupled to the circular portion 448.
- the circular portion 448 may be coaxial with the door 130.
- a user may insert a cartridge and a cassette through the door 130 and onto the reagent stage and the cassette stage, respectively.
- the base assembly 140 may comprise various connection ports 460.
- the base assembly 140 may comprise a power input, a communication port, and a camera output port.
- the connection ports 460 may allow the instrument 100 to communicate with a computer or other processor in order to receive commands and output data and other information, such as image data or instrument status information.
- the connection ports 460 may allow multiple instruments to communicate with each other.
- the instrument 100 may comprise a reagent stage which accepts a user-inserted reagent cartridge containing all reagents used during operation, including a sample.
- the reagent stage 500 is coupled to a top side of the base assembly 140.
- the reagent stage 500 may be enclosed by the door 130.
- the reagent stage 500 is rotatable about a central axis in order to move reagents within reach of the pipettor.
- the reagent stage 500 may comprise a generally annular shape with an outer circumference 510 and an inner circumference 520.
- a pair of alignment walls 530 may be coupled to a top side 502 of the reagent stage 500.
- the alignment walls 530 may be configured to align a cartridge when inserted into the reagent stage 500 by a user.
- the alignment walls 530 may comprise curved guide surfaces 532 to direct the cartridge to the proper position as the cartridge is inserted.
- One or more holding features 534 may be coupled to the alignment walls 530 for precise alignment of the cartridge and to hold the cartridge in place relative to the reagent stage 500.
- the holding features 534 may snap the cartridge in place when the cartridge is fully inserted to provide an audible and physical indication to the user that the cartridge is fully inserted.
- the alignment walls 530 may comprise one or more teaching wells 536.
- the teaching wells 536 may be a cylindrical depression in the alignment walls 530.
- the teaching wells 536 may be used by the pipettor as a reference point in conjunction with the cartridge in order to allow the system to precisely locate all reagent wells in the cartridge.
- the pipettor may use teaching wells only in the cartridge, only in the alignment walls, or in both the cartridge and the alignment walls.
- the reagent stage 500 may comprise a plurality of GEF contacts 540.
- the GEF contacts 540 may be spring contacts configured to engage pairs of sliding contacts on the cartridge when the cartridge is inserted by the user.
- the GEF contacts 540 may supply DC voltage to the sliding contacts in order to provide electrical power for the GEF process.
- the reagent stage 500 may comprise one or more heating elements or heaters.
- the heaters may contact areas on the cartridge to maintain reagent temperatures.
- Each heater may comprise a flat plate with a printed circuit type heating element bonded to its bottom surface.
- a precision thermistor may be embedded in the plate to provide feedback for temperature control.
- the heaters may comprise an antibiotic heater 550 and an agar heater 560.
- the antibiotic heater 550 may be configured to heat an area beneath antibiotic wells in the cartridge.
- the antibiotic heater 550 may extend between a portion of the inner circumference 520 and a portion of the outer circumference 510 of the reagent stage 500.
- the antibiotic heater 550 may be configured to maintain the temperature of the antibiotic wells to approximately 41 °C.
- the agar heater 560 may be configured to heat an area beneath agar wells in the cartridge.
- the agar heater 560 may be located adjacent to the inner circumference 520 of the reagent stage 500.
- Agar is a semisolid, and it may be desirable to melt the agar prior to use.
- the agar heater may heat the agar to above its melting point (approximately 100°C). Once the agar is melted, the agar heater 560 may be configured to lower the temperature of the agar to just above its solidification temperature (approximately 50°C).
- the reagent stage 500 may comprise a sensor which detects the presence or absence of a cartridge.
- the GEF contacts 540 may be used to detect the presence of sliding contacts on the cartridge. Additionally, the sensor may detect whether the cartridge was properly inserted.
- the reagent stage 500 may comprise a platform 610 which is rotatable about a central axis. The rotation of the platform 610 may allow for the pipettor to access the sample and different reagents in the cartridge.
- the platform 610 may be rotated by a stepper motor 620.
- the platform 610 may be rotated using a spur gear 622 on a motor shaft 624 of the stepper motor 620 and a ring gear 630 coupled to the platform 610.
- the platform 610 may ride on a bearing 710.
- the bearing 710 may be a stage bearing.
- the platform 610 may rotate relative to the ring gear 630 and a stator 720.
- a plurality of conductive rings 730 may be coupled to a top side of the stator 720.
- the conductive rings 730 may comprise nickel-plated copper.
- a rotor 740 may be coupled to a bottom side of the platform 610.
- the rotor 740 may comprise a series of spring loaded contacts 742.
- the spring loaded contacts 742 may maintain contact with the conductive rings 730 as the platform 610 rotates. Power may be applied to the heaters, thermistors, and GEF contacts, or any other components coupled to the platform 610, via the spring loaded contacts 742 and the conductive rings 730.
- the instrument 100 may comprise a cassette stage 800.
- the cassette stage 800 may be coupled to the top side of the base assembly 140.
- the cassette stage 800 is configured to receive a user-inserted cassette.
- the cassette stage may be circumscribed by the inner circumference of the reagent stage.
- the cassette stage 800 is rotatable about a central axis and may also translate in order to precisely locate the cassette with respect to the illuminator and optics system objective.
- the cassette stage 800 may translate on a y -axis.
- the rotation of at least one of the cassette stage 800, the reagent stage, and the door 130 may be coaxial.
- the cassette stage 800 may comprise a cassette nest 810 and a heater plate 820.
- the cassette nest 810 may be generally annular and define a receiving well 812 configured to receive the cassette within the cassette nest 810.
- the heater plate 820 may define a bottom of the receiving well 812.
- a user may insert the cassette into the receiving well 812.
- the user may rotate the cassette to interface attachment features on the cassette with locating pins 814 on an inner wall 816 of the cassette nest 810.
- the interface between the attachment features and the locating pins 814 may align and secure the cassette within the cassette nest 810.
- FIG. 8B a cross-section view of a cassette 850 in the cassette nest 810 is illustrated.
- the cassette 850 may be supported by a glass ring 852 at an outer annulus of the bottom of the cassette 850.
- An air gap 860 may be present between the heater plate 820 and the cassette 850.
- the heater plate 820 may be coaxial with the cassette.
- the heater plate 820 may comprise a flat plate with a printed circuit type heating element bonded to a bottom surface of the heater plate 820.
- a precision thermistor may be embedded in the heater plate 820 to provide feedback for temperature monitoring.
- An infrared temperature sensor 830 may be mounted to the cassette stage 800 below the heater plate 820.
- the infrared temperature sensor 830 may be aimed through a viewing hole 822 in the heater plate 820.
- the infrared temperature sensor 830 may be aimed at a bottom surface of the cassette in order to accurately measure the temperature of the cassette.
- the temperature of the cassette may be used to approximate the temperature of the liquid in the channels.
- cassette stage 800 may rotate the cassette for pipetting, EKC, and imaging.
- the cassette nest 810 may ride in a bearing 1010.
- the cassette nest 810 may be rotated by a stepper motor 1020.
- the stepper motor 1020 may use a spur gear 1022 on a motor shaft 1024 and a ring gear 1030 on the cassette nest 810 to rotate the cassette nest 810.
- the stepper motor 1020 may rotate the cassette nest 810 to align particular channels with the pipettor or illuminator.
- the cassette stage 800 may be mounted on one or more bearings 1010 (illustrated in FIG. 10 ).
- the bearings 1010 may comprise "X-contact" ball bearings manufactured by Kaydon Corporation, Inc. (Muskegon, Michigan). However, the bearings 1010 may comprise cross roller bearings or any other suitable bearings.
- a linear actuator 1120 may comprise a lead screw 1122, a nut 1124 and a stepper motor 1126. The linear actuator 1120 may drive the cassette stage 800 in the positive or negative y-direction. The linear actuator 1120 may work in conjunction with the stepper motor 1020 which rotates the cassette stage 800 to position the cassette for pipetting, EKC, and imaging.
- FIG. 12 a perspective view of an instrument 100 with the upper enclosure and the lower enclosure removed is illustrated.
- the instrument 100 may comprise a pipettor 1200.
- the pipettor 1200 may be coupled to the rectangular portion 446 of the base assembly 140.
- the pipettor 1200 may be cantilevered over the reagent stage 500 and the cassette stage 800 in order to access the cartridge and the cassette.
- the pipettor 1200 may comprise a fluid transfer pipette 1210 which uses a positive displacement air pump 1220 connected with a tube to a disposable pipette tip (not shown).
- the pipettor 1200 may comprise two motor driven axes.
- a z-axis motor 1230 may drive a pipettor mandrel 1240 in the positive or negative z-direction to raise or lower the pipettor mandrel 1240.
- a theta-axis motor 1250 may rotate the pipettor mandrel 1240 in the theta direction.
- the z-axis motor 1230 and the theta-axis motor 1250 may work in conjunction with the reagent stage motor and the cassette stage motors to accomplish the instrument's pipetting tasks during ID and AST processes.
- the pipettor 1200 may be used to determine the precise location and orientation of the cartridge after insertion. In some cases, the cartridge may not be inserted in exactly the same position each time.
- the pipettor 1200 may comprise a tip stripper collar 1260.
- the tip stripper collar 1260 may be substantially cylindrical.
- the tip stripper collar 1260 may be concentric around the pipettor mandrel 1240.
- the tip stripper collar 1260 may contact the edges of the teaching wells in the cartridge and/or the reagent stage.
- the instrument may calculate the position of the cartridge based on the location of the edges of the teaching wells.
- the pipettor mandrel 1240 may be the interface between the pipettor 1200 and pipette tips included in the cartridge.
- the pipettor 1200 may comprise a z-contact sensor and a tip presence sensor.
- the z-contact sensor may indicate that the z-axis drive has moved down (negative z-direction) without a corresponding movement of the pipette arm 1270.
- the tip presence sensor may indicate that the tip stripper collar 1260 has been raised (positive z-direction) relative to the pipettor mandrel 1240.
- the presence of a pipette tip is expected within a height range to indicate that a sealing portion of the pipette tip has been contacted by the pipettor mandrel 1240.
- the z-axis motor 1230 drives the pipettor mandrel 1240 down.
- the downward motion may be translated to a predictable and repeatable sealing force through a lost motion spring's 1280 spring constant.
- the tip presence sensor may indicate that the pipette tip is coupled to the pipettor mandrel 1240.
- the instrument may determine that the seal between the pipettor mandrel 1240 and the pipette tip is unsatisfactory, and the pipettor 1200 may remove the pipette tip and select a different pipette tip.
- the pipettor 1200 may move in the theta and z-directions to remove reagents or specimens from the cartridge.
- the pipettor 1200 may use a pipette tip to pierce a film seal in a reagent well and obtain a reagent.
- the pipettor 1200 may move to a desired input port in the cassette and form a seal between the pipette tip and the input port.
- the pipettor 1200 may deposit the reagent into the input port and force the reagent into the sample channel.
- the pipettor 1200 may then remove the pipette tip and replace the pipette tip into the cartridge.
- the pipettor 1200 may comprise a solenoid 1290 coupled to the theta-axis of the pipettor 1200.
- the solenoid 1290 may extend and insert a removal pin 1292 into a removal receiver in the tip stripper collar 1260. Contact between the removal pin 1292 and the removal receiver may prevent upward (positive z-direction) movement of the tip stripper collar 1260.
- the z-axis motor 1230 may lift the pipettor mandrel 1240 upward, and the pipette tip may contact the tip stripper collar 1260.
- the tip stripper collar 1260 may force the pipette tip away from the pipettor mandrel 1240, and the pipette tip may free fall into the cartridge.
- the pipettor 1200 may subsequently force the pipette tip downward in the event that the pipette tip does not fall completely into the desired position in the cartridge.
- a system may comprise an illumination system and an optics system.
- An illumination system 1400 and optics system 1450 in accordance with various examples are illustrated in FIGS. 14-32 .
- the illumination system 1400 is primarily described with reference to FIGS. 14A-18E .
- the optics system 1450 is primarily described with reference to FIG. 14A and FIGS. 19-29 .
- An illumination system 1400 (also referred to as an "illuminator”) can comprise a housing 1401, a stage configured to provide movement of the illumination system 1400, one or more light sources, mirrors, and condensers.
- an illuminator 1400 may also comprise an EKC electrode assembly.
- An optics system 1450 can include an objective 1451, a focuser 1452, a fold mirror 1461, a focus LED 1453, a beam splitter 1462, a dual band filter 1454, a single band filter changer 1466, a tube lens 1456, and a camera 1457. Each of these optics system components is described in greater detail below.
- An illuminator 1400 provides sample illumination for image acquisition.
- An illuminator 1400 may be configured to provide a plurality of light sources, such as white light 1402 and laser diode light sources 1403, 1404. Each of the plurality of light sources may provide illumination along a single optical path from the sample in cassette 1420 to the objective 1451 and camera 1457.
- An illuminator 1400 comprising a plurality of light sources having the same optical path can facilitate overlaying images containing the same image features (i.e., a field of view containing the same sample objects at the same sample object locations within the field of view) acquired using different illumination, such as overlaying a dark field image of a field of view with green and red fluorescence imaging to determine which image features are debris (i.e., not marked with a hybridized FISH probe) and which are microorganism cells.
- image features i.e., a field of view containing the same sample objects at the same sample object locations within the field of view
- different illumination such as overlaying a dark field image of a field of view with green and red fluorescence imaging to determine which image features are debris (i.e., not marked with a hybridized FISH probe) and which are microorganism cells.
- the illuminator 1400 can comprise an aluminum cylindrical tube housing 1401, the red 1404 and green 1403 laser diodes, and the dark field LED 1402.
- the illuminator housing 1401 may be mounted to the base assembly 140 by an illuminator stage configured to provide z-axis and theta-axis movement suitable to position the illuminator 1400 directly above the cassette and in coaxial alignment with the objective 1451.
- Z-axis movement permits the laser 1403, 1404 and dark field 1402 light sources to be positioned at different vertical positions above the cassette to enable proper focusing of the light emitted by the light source relative to the sample contained in a cassette sample channel flowcell.
- Z-axis movement together with theta-axis movement allows rotation of the illuminator 1400 away from the area above the cassette permitting pipettor access to the cassette.
- the green 1403 and red 1404 laser diodes can be mounted on the outside of the aluminum illuminator housing 1401 described above.
- the lasers 1403 and 1404 may be aimed downward and reflected off a 45 degree diagonal mirror 1405 mounted midway along the housing 1401.
- the laser light passes through a hole 1406 in the side of the housing 1401 and is reflected downward off another 45 degree diagonal mirror 1407 (located below the optical stop 1408, described below) so that the light is coincident with the axis of the objective 1451 (i.e., coaxial with the objective 1451).
- the upper collimating lens 1409 shapes the light into a cylinder.
- a lower condenser lens 1410 At the bottom of the housing 1401 a lower condenser lens 1410 re-shapes the light into a cone with a focal point suitable for dark field illumination.
- An illuminator subassembly may be configured with an EKC electrode assembly.
- an EKC electrode assembly 1430 can comprise two spring-loaded, rhodium-plated pins that are mounted in a nonconductive (polymer) block on the side of the illuminator 1400.
- the system may perform an EKC procedure by positioning the illuminator so that the EKC-electrode assembly pins are received by corresponding EKC-electrode ports in the cassette and contact electrodes located in the EKC-electrode ports.
- a first pin 1431 contacts an electrode located on and operatively connected to the top surface of the glass layer of the cassette.
- a second pin 1432 contacts an electrode located on and operatively connected to the lower surface of the molded plastic upper housing of the cassette.
- the EKC electrode assembly 1430 may be used to deliver an electrical potential to the sample channels in the cassette. For example, a low voltage (0.6 to 1.6 volts DC) may be applied to the cassette sample channels by the instrument using the EKC electrode assembly 1430 located on the illuminator subassembly 1400. The electrical potential may be applied for a defined period of time, such as several minutes, as described in greater detail elsewhere herein.
- the sample cassette 1420 placed in the system by a user may be positioned by the cassette stage so that a sample channel (or flowcell) is located just below the illuminator 1400 and just above the objective 1451 (i.e., so that a portion of the sample channel comprising an objective field-of-view is positioned in-line between the illuminator 1400 and the objective 1451).
- a sample channel or flowcell
- An optics system 1450 may comprise an objective 1451.
- the objective 1451 may be mounted to the base assembly 140 and located below the base assembly 140 such that the objective 1451 is positioned beneath the cassette stage.
- An objective 1451 can comprise a standard "off the shelf' microscope objective suitable to collimate an image. For example, an objective with a numerical aperture of 0.45, a field number of 22 mm, and a magnification of 20x may be used. Objectives with other specifications may be used in accordance with various embodiments of the present disclosure.
- the objective 1451 may be mounted to a focuser mechanism 1452.
- the focuser mechanism 1452 may be configured to move the objective 1451 along a z-axis (i.e., substantially normal to the horizontally-oriented sample channel holding the sample) to focus the image.
- the objective 1451 may be moved in the z-axis by means of a stepper motor with a precision cam mounted on its shaft.
- the cam can comprise a round disk with an offset mounting hole.
- a stepper motor with a microstepping mode may be used to drive the cam.
- the stepper motor may provide, for example, a 200 step/revolution movement in standard mode, with a microstepping mode yielding 25,600 microsteps per revolution to provide sub-micron resolution movement of the objective 1451.
- the optics system 1450 may further comprise a fold mirror 1461.
- the fold mirror 1461 may be used to fold the optical path 90 degrees to redirect the optical path from the z-axis (i.e., coaxial to the illuminator 1400 and objective 1451) to the y -axis direction beneath the base plate and toward a tube lens 1456 and camera 1457 used for image acquisition, described below.
- the optics system 1450 may comprise a focus light system.
- a focus light system can comprise a focus LED 1453 and a beam splitter 1462.
- a focus LED 1453 may be used to provide a separate light source that is reflected off the top (glass) surface of the cassette to facilitate focusing the objective 1451.
- the focus LED 1453, a pinhole aperture 1463, and a collimating lens may be positioned at a right angle to the main optical path.
- a beam splitter 1462 can be placed in the optical path and used to fold the focusing light source into the optical path.
- the focus light system may be used in conjunction with a rapid focus method performed by the system in response to directions provided by the controller, wherein the rapid focus method is configured to acquire and process image information based on focus light illumination reflected off of the cassette 1420 and to adjust the position of the objective 1451 accordingly.
- the optics system 1450 may comprise a field stop 1464.
- the field stop 1464 may comprise a circular aperture 1465 configured to block stray light from reaching the camera 1457.
- the optics system 1450 may further comprise a filter or a plurality of filters.
- the filter or plurality of filters may be placed in a fixed position in the optical path.
- the filter or plurality of filters may be configured to block one or more wavelength of light, such as wavelengths of light used for fluorescence excitation (e.g., the red laser diode excitation wavelength 637 nm) and pass dark field light and emission wavelengths (e.g., a 669 nm red wavelength and a 553 nm green wavelength) used for a FISH ID procedure.
- the optics system may further comprise a single band filter 1455.
- the single band filter 1455 may be located on a single band filter changer 1466.
- the single band filter changer 1466 may be configured to reversibly interpose the single band filter 1455 in the light path to permit the emission green wavelength (553 nm) and block all other wavelengths during the FISH ID procedure.
- the single band filter changer 1466 may use a stepper motor to move the single band filter 1455 in or out of the optical path.
- the single band filter 1455 is introduced into the path only when imaging the emitted green light (553 nm).
- an optics system can comprise any suitable number of filters, including a plurality of reversibly interposable filters.
- the filters may be selected based on the combinations of light sources and fluorophores used, and various combinations of light sources, fluorophores, and stationary and movable filters are possible and within the scope of the present disclosure.
- the optics system may further comprise a tube lens 1456.
- the tube lens 1456 can be a multi-element lens configured to reimage light in the optical path onto a camera sensor surface.
- the optics system 1450 provides a 6.1-fold magnification of the field of view (i.e., a 20x magnification objective and a 0.305x magnification tube lens).
- the optics system comprises a telecentric lens providing orthographic projection, thereby permitting measurements to be taken without scaling, although other lens types may be suitable.
- the optics system 1450 may further comprise an image sensor (not separately shown, but embedded within the camera 1457).
- An image sensor may be used to acquire images of the sample.
- an image sensor can comprise a complementary metal-oxide semiconductor ("CMOS") sensor or active pixel sensor camera.
- CMOS complementary metal-oxide semiconductor
- a CMOS sensor camera can be a five megapixel grayscale camera used to acquire images for processing.
- a passive pixel sensor camera such as a charge-coupled device image sensor, may be used.
- an image sensor is operatively connected to a controller and transmits acquired images to the controller for storage and data processing.
- Automated high speed microscopy requires a system configured to rapidly adjust the relative distance between a microscope objective lens and a sample in order to arrive at a correct distance between the two. Establishing this correct distance ensures that sample features of interest are imaged in the proper focal plane for accurate sample analysis.
- the optics system 1450 of the present disclosure may be configured to enable very rapid focusing of a series of successive images (frames) of microorganisms in a given sample during an analytical run of the instrument. To achieve this, the instrument undertakes a method for quickly focusing the optics system 1450 on an object of interest, (e.g., a microorganism) in less than about 500 ms.
- the optics system 1450 can establish a focal plane with as few as only two trial images coupled with a learning algorithm that may allow as few as two test images to be used in this process.
- Image data can be stored digitally and compared over time for changes in one or more sample features.
- the disclosed process provide a very fast method for rapid focusing in a series of successive frames captured at a specific location in a field of view, the process does not require expensive or specially manufactured components to be accomplished.
- the optics system 1450 may employ a rapid focusing algorithm to mathematically calculate the true focus position for an individual microorganism or an individual colony in a sample, as illustrated in FIGS. 76-80B and FIGS. 82A-82C .
- a rapid focusing algorithm to mathematically calculate the true focus position for an individual microorganism or an individual colony in a sample, as illustrated in FIGS. 76-80B and FIGS. 82A-82C .
- this disclosed fast focusing method can be used with other systems and methods (such as those used to detect cells or microorganisms), in addition to those disclosed herein.
- Control of movement of the objective and processing of the algorithms described below can be accomplished using hardware components shown in FIG. 101 , which can be imbedded on the control board 321.
- Movement of the objective causes defocus of a reflected point source image on both sides of the image plane for a sample feature of interest (e.g., a microbe), as shown in FIGS. 78 and 79 .
- the rapid focusing algorithm derives a virtual true focus position ( p t) by acquiring two focus data points p 1 and p 2, which lie on either side of the true focus position delineated by plotting point source spot areas in pixels on the x-coordinate against the positions of the instrument's objective, as set forth in FIGS. 77 , 80A and 80B .
- the true focus point p t is the local minimum of the curve created by computing the linear proportional position between p 1 and p 2.
- the best image will have the smallest spot which is nearly the same as the diameter of pinhole 1463 ( e.g., about 25 microns).
- the instrument may comprise software that directs objective 1451 through the following algorithmic steps:
- the center spot locations can be computed for a grayscale focus image, the content of which can be irregular and of varying intensities. Knowing the center of the focus image spot provides the focusing algorithm with the directional components required for fast focusing. Pixels in the image are indexed by row and column, and have intensity values from 0-4095 (12 bit grayscale) in one implementation. All pixels in the image are examined. Each pixel intensity value is multiplied by its row and added to a 'row sum'. Each pixel intensity value is multiplied by its column and added to a 'column sum'. Also, each pixel intensity value is added to a 'full image sum'.
- the order of the steps may be altered for this learning algorithm (by which the instrument learns or identifies the specific location in the field of view of a given microorganism). For example movement of the objective to the out-of-focus - near position and imaging of the near point source spot may be performed before the objective is moved to an out-of-focus far position and imaging of the far point source spot is performed.
- Site-to-site variations in reflectance and other such parameters may change the absolute values of the focal curve (e.g., raising or lowering the curve along the x-axis) but this type of variation does not alter the resultant computed true focus position.
- the initial pass of focusing at a given site can take more than two focus images before two "qualified" focus images are achieved and true focus can be computed.
- the learning algorithm uses neighboring sites that are close to the same height as initial starting points for focus trial images. During successive passes, the learning algorithm uses the previous pass focus trial image positions for the site to guide the focus trial images. In all cases, the focus trial images must not be "too near” or “too far” away from the true focus point. If they are, then new focus trial images are taken.
- a prescan 8000 is performed in FIG. 80C in order to obtain the graphs shown in FIGS. 80A and 80B .
- a coarse focus discovery is initiated.
- the focus discovery is accomplished in two passes: a coarse focus discovery pass 8002 and then a fine focus discovery pass 8004.
- the coarse focus discovery pass is used to locate a position of the light source (e.g., LED).
- the focus LED appears in the camera image in a different location for every instrument, and if an instrument has been serviced, it may change.
- a location of a reflection generated by the light source needs to be determined.
- full-screen images e.g., 2592x1944 pixels
- the coarse pass is repeated for multiple iterations of different focus positions, such as different focus positions between 100 to 500 microns (50 micron increments, for example).
- the coarse focus discovery is started.
- the objective is moved to a position of 100 microns (though one will recognize that other starting positions can be used).
- a full screen image is captured.
- a weighted spot area and spot offset are determined using the techniques described herein. Computing the weighted spot area involves computing the area for just a single image. The weighted spot area is computed using grey-scale values (light intensity) for the pixels and relative row and column position of the pixels. The spot offset is calculated as an offset from image center.
- a check is made whether the focus position has reached a predetermined distance (e.g., 500 microns, in this example, but other distances can be used). If not, then in process block 8016, the next focus position is computed, and process blocks 8010 and 8012 are repeated so that the image is re-captured. Once decision block 8014 is answered in the affirmative, then in process block 8018, the captured image spot areas are analyzed. Analyzing the captured image spot areas involves using the computed weighted spot areas of all of the images together (the curve), and looking for the best focus position. The spot areas are used to find the curve bottom. Once the bottom is found, fixed delta positions on either side of the best focus position are used to lookup the spot offset ranges to later use when focusing.
- a predetermined distance e.g. 500 microns, in this example, but other distances can be used.
- FIG. 77 shows a portion of an M-shaped graph that can be obtained through performance of process blocks 8010, 8012, and 8018.
- the figure shows the M-shaped curve in a trough between the two legs (not shown) of the "M."
- a good focus position is at the valley at the center of the M-shaped curve.
- the algorithm learns the direction of movement and uses such direction for future calculations.
- This coarse phase 8002 results in targeting where to perform the fine focus discovery pass 8004.
- the fine focus discovery pass uses much finer focus position steps, centered around the best coarse focus position, and uses smaller (e.g ., 401x401 pixels) images, because it is known at which part of the image the LED appears.
- Fine focus discovery 8004 starts at process block 8040.
- the focuser objective
- a spot can be displayed on the image from a light source and a camera can be used to capture the spot.
- intensity weightings and spot offset are computed in a similar fashion as was described above.
- decision block 8050 a check is made whether the focus position is greater than a last focus position, which is a predetermined number. If not, then in process block 8052, a next focus position is computed, such as by adding a predetermined distance to the focus position (e.g., 10 microns).
- the captured image spot areas are analyzed. For example, the spot areas can be computed, such as by measuring a distance across the spot. Additionally, an offset from the center of the image can be computed. In process block 8056, a minimum spot area is determined. The minimum spot area is associated with the best focus position. In process block 8058, left and right offset ranges are determined for the autofocus feature. The ranges dictate whether a captured image of a spot is acceptable or not. Once the ranges are chosen, then the prescan phase ends in process block 8060.
- autofocus can be accomplished using as little as two images.
- an image is captured with the focus position in front of and behind the image plane by predetermined amounts.
- an intensity weighting can be computed for each spot and mapped onto the prescan data to determine the best focus position for the objective.
- the overall decision path followed by the instrument can be visualized in the process flow depicted in FIG. 82A .
- the process begins at process block 8202.
- a first image is captured or acquired for a first curve side.
- a predetermined focus position (PI, FIG. 77 ) is used wherein the objective is moved in order to estimate a first spot offset.
- the objective 1451 is moved so that the focus point is a predetermined distance in front of the image plane.
- an image plane 7620 that includes a glass/liquid interface i.e., the microorganism positioned upon a glass substrate
- the objective 1451 is moved to the left, as shown by arrow 7640 so as to change the focus point to a predetermined distance in front of the image plane 7620. Consequently, the focus point is changed to a position shown at 7610, purposely a predetermined distance in front of the image plane. If the image initially obtained from the first side of the curve is outside of the required range, then the instrument makes slight parameter adjustments and acquires an image of that position again. Thus, in decision block 8206 of FIG. 82A , a check is made whether the image is within the required range. Specifically, a range was determined in process block 8058 of FIG. 80C during the prescan. That range relates to spot offset versus focus position information obtained during the prescan and shown in FIG. 80B .
- a spot offset is an offset of the center of the spot from dead center, which is a known center.
- a known center of the image is shown at 7810.
- the center of the spot is shown at 7820 and is calculated by measuring from one point on the edge of the spot to an opposite edge at several locations.
- the offset is a distance between the center of the image 7810 and the center of the spot 7820. That distance is used in decision block 8206 to determine whether the captured image includes a spot that is within the required range. If decision block 8206 is answered in the negative, then in decision block 8208, a check is made whether the number of attempts made to capture the image exceeds a threshold. If so, then a failure occurs in process block 8210.
- a position of the objective is changed in a direction necessary to move the spot offset within the desired range in process block 8212.
- the proper direction can be determined using the prescan spot offset data of FIG. 80B .
- an image of the spot can be reacquired.
- the process includes repeatedly moving the objective and re-capturing the first image until the offset distance is within the predetermined limits. If this image is within the required range, then the same procedure is followed on the opposite (second) side of the curve in process block 8220.
- the objective position is moved to point P2 ( FIG. 77 ).
- the focus point is thus changed to a new out-of-focus position 7630 ( FIG. 76 ) at a distance behind the image plane, as shown at 7630.
- an image is acquired for the newly selected out-of-focus position.
- Process blocks 8224, 8226, 8228, and 8230 are similar to those described above for the first image acquisition and will not be re-described for purposes of brevity.
- the true focus position is calculated from the out-of-focus images from the first and second sides of the focus point curve in process block 8250.
- the prescan curve of FIG. 77 can be used.
- An intensity weighting is determined for each image and mapped onto the prescan information as shown at points Q1 and Q2 ( FIG. 77 ).
- the intensity weighting can be determined by taking a 12 bit grayscale image of the reflected light from the focus LED, and computing a representative spot area. Each pixel in the image has an intensity value of between 0-4095.
- the computing of the spot area is determined knowing that actual focus images can be quite bright or quite dim, so an algorithm that operates on it should be insensitive to actual image brightness. To accomplish that, first the average pixel value for all pixels in the image is computed. Then, a pixel intensity threshold is computed by taking 80% of that average. All pixels meeting or exceeding that pixel intensity threshold are counted to produce the spot area. The resultant spot area is thus insensitive to absolute image intensity.
- a predetermined offset a known offset
- the visual focus position is computed and the instrument employs this information to move to the true focus position of the microorganism of interest and then acquires an image. If during the learning process a particular image is unable to be obtained in the required range within a certain number of attempts (for example, 20 attempts), then the instrument will deem that position to be unfocusable, abandon the image location, and move on to another object of interest to begin the process anew. In some embodiments, two or slightly more than two - but rarely more than five - focus images may be required to establish the true focus point of an image.
- the instrument utilizes offset spots (pixels of offset) to set zones on either side of a focus point that permit mathematical calculation of the true focus point.
- the instrument After the initial pass at the first site, the instrument "learns" from the initial data and may reduce the number of images needed for calculation of the true focus point to only two per site at additional locations in the field of view. This learning process substantially reduces the amount of time needed to focus upon and repeatedly capture images of multiple microorganisms in a microfluidic sample channel 5702.
- the ability to mathematically calculate the precise location of the true focus point of an object - without the instrument's objective having to actually go to that site to home in on the location by trial and error - is desirable to obtaining images in a fast, accurate manner.
- the instrument will store location data for that microorganism, thereby permitting the instrument to move on to the next microorganism in a sample within a microfluidic sample channel 5702 of the cassette 4500 and repeat the process, thus imaging this next microorganism.
- the instrument may retrieve stored image location data and repeatedly return to a specific microorganism in a given field of view to capture multiple images over time, thereby memorializing any responses or changes the microorganism exhibits under a test condition (e.g., growth in the presence or absence of an antibiotic).
- the rapidity with which this step-wise determination of the true focus position of a microbe in a biological sample is achieved is key to facilitating within a matter of a few hours (preferably less than eight hours, more preferably less than seven hours, and even more preferably less than four hours, such as 3-8 hours, 4-8 hours, 4-7 hours, or 4-6 hours) the identification of microorganisms in the sample as well as their sensitivity to treatments, such as the sensitivity of bacteria to particular antibiotics.
- a light source 1453 illuminates a sample.
- Objective 1451 is moved through the z-plane to locate the best image locale. Once identified, the targeted reflective spot may be revisited multiple times, the first time establishing a baseline against which additional images may be compared for changes or modifications.
- the z-height of focuser 1452 does not change much from site-to-site on a given glass support, although there will be slight variations due to imperfections introduced to the glass support during manufacture.
- initial data obtained from a first image pass can be used to inform the instrument about where to target a second site on glass support 4400 for imaging a second object (microorganism) of interest.
- microorganisms are three-dimensional entities, and because the contours of a microorganism may change with growth or exposure to environmental challenges (temperature alterations, nutritional conditions, antibiotics, etc.) during an analysis period, objective 1451 targets the bottom or glass contacting area of a microorganism for consistency in measurement over time.
- objective 1451 targets the bottom or glass contacting area of a microorganism for consistency in measurement over time.
- focusing on the top of a microorganism during baseline measurement would make it difficult to locate the exact same spot some minutes to hours later after the microorganism has grown in size or multiplied. Under this scenario, the depth of the original focal spot would differ at each return visit by the objective due to additional cell mass, introducing the potential for error in measuring from the originally targeted position.
- the rapid focus algorithm described herein overcomes this deficiency.
- microorganisms are immobilized in a medium (such as one including agar or agarose) and therefore remain in the same location during the analysis time period, permitting repeated imaging via the bottom or glass contacting area of a microorganism which the tracks features that change in response to changes in environmental conditions.
- a medium such as one including agar or agarose
- the microorganism can be retained on a surface of the support (such as a flowcell or glass support), thereby producing a retained microorganism.
- camera 1457 communicates with a system controller, which may be a host computer.
- the system controller comprises software that instructs instrument 100 where to move focuser 1452.
- the system controller instructs LED light source 1453 to turn on and camera 1457 to capture an image.
- no image data is stored in the instrument module; image data is stored in - and later retrieved from - the system controller.
- FIG. 82B is a flowchart according to one example for autofocusing on a microorganism.
- prescan information is provided that includes intensity weightings versus focus position. The prescan flow was described in FIG. 80C , above.
- a plurality of intensity weighting versus focus position information is obtained for a range of different focus positions. The results can be plotted as shown in FIG. 80A .
- spot offset versus focus position can be obtained in some embodiments over a plurality of focus points as shown in FIG. 80B .
- a light can be projected from a light source through the objective at an image plane.
- the light source can be a first light source designed to project a beam of light that generates a reflection off of a glass/liquid interface.
- Example light sources include an LED, laser diode, etc. (such as diode 1403 or 1404).
- the light source can be a colored light source so that the reflection is easily visible. However, using greyscale analysis, greyscale values are used to measure the reflection, so colored light is not required.
- the light source used to generate the reflection is a different light source than that used for imaging the microorganism.
- a first image is captured of the reflected light with the objective (e.g. , 1451) at a first position.
- the first position is an intentionally out-of-focus position with a focal point in front of the true focal point.
- an out-of-focus position is shown by focus point 7610 in FIG. 76 .
- a second image is captured of reflective light with the objective at a second position.
- the second position is an intentionally out-of-focus position behind the true focal point.
- An example of such an out-of-focus position is shown by focus point 7630 in FIG. 76 .
- intensity weightings are computed for the reflected light of the first and second images. As described above, the intensity weightings take into account the greyscale values and row/column information to provide a weighting to each pixel in the image.
- a focus position is calculated using the computed intensity weightings in association with the prescan information.
- the computed intensity weighting can be mapped onto the prescan information and a lowest point (lowest intensity weighting) of the prescan information can be determined.
- the focus position associated with that determined point is the desired focus position (although some additional calibration may be required).
- the objective is moved to the calculated focus position. At this point, the focus position should be the true focus position on the image plane, as shown at 7620 in FIG. 76 .
- process block, 8280 with the objective properly positioned, an image of the microorganism can be captured.
- the autofocus feature can be accomplished in as little as two images, making it faster than other solutions.
- FIG. 82C shows a flowchart according to another example.
- an objective e.g., 1451
- the image plane e.g., 7620
- the image plane is typically a glass substrate with a microorganism-based liquid thereon.
- the focus point is in-between the image plane and the objective.
- the objective is moved in a direction away from the image plane to make the focus position intentionally out-of-focus.
- a first spot-shaped reflection is generated using the objective at the out-of-focus position.
- a first light source such as diode 1403 or 1404, can be used. Based on the objective position, different greyscale values and offsets will be generated.
- a first image is captured of the first spot-shaped reflection.
- the camera 1457 is used to capture the first image under direction of the controller.
- the objective is moved to a second position (see P2, FIG. 77 ) so that a focus point is a predetermined distance behind the image plane. By being behind the image plane it is meant that the image plane is in-between the focus point and the objective.
- the first light source is projected through the objective to generate a second spot-shaped reflection.
- first light source it is meant a first type of light source.
- laser diodes 1403 and 1404 are both considered a first light source as they are used for generating reflections.
- a second image is captured of the second spot-shaped reflection.
- an intensity weighting analysis is performed on the first and second images. The intensity weighting analysis is used to determine a focus position of the objective. For example, the intensity weighting values Q1 and Q2 can be determined ( FIG. 77 ) and the prescan graph adjusted to fit Q1 and Q2. Then the focus position P can be calculated as being in line with the lowest point on the parabola. It should be noted that while a linear curve aspect of a parabola has been used for focus mapping in certain embodiments, the process described herein may be applied to other curves using a different underlying equation.
- FIGS. 81A and 81B relate to controlling temperature within the upper enclosure 110 above the cassette.
- the control board 321 can include one or more temperature sensors and a controller (e.g., processor, microcontroller, ASIC, etc.) for controlling a temperature control algorithm.
- the control board 321 can further include one or more of the components described in FIG. 101 . It is desirable to maintain a constant air temperature within the enclosure 110 so that the biological samples are not adversely impacted by temperature variations.
- the controller controls existing components that have a function unrelated to heating, in order to heat the enclosure.
- stepper motors that are not actively being used can have their idle currents increased so as to generate additional heat to heat the enclosure.
- FIG. 81B A simple flow diagram is shown in FIG. 81B for dynamically controlling waste heat.
- the enclosure temperature control flow diagram begins. Although described for stepper motors, the flow diagram can be extended to other components that have a primary purpose unrelated to heating.
- a temperature of the enclosure is read.
- a temperature sensor such as a thermistor or thermocouple, can be used to provide temperature information of a temperature within the enclosure.
- Such as temperature sensor can be mounted on the control board 321.
- the temperature reading can be used to compute a proportional-integral-derivative (PID) heater or fan output.
- PID proportional-integral-derivative
- the controller on board 321 can use PID algorithms to compute an output number. That output number can be a percentage of a maximum potential output.
- PID algorithms are known in the art and any desired PID algorithm can be used.
- PID parameters may be provided - namely the P, I and D terms, which act as multipliers in the PID algorithm to allow tuning of the algorithm to the application at hand.
- the PID algorithm can be used to determine whether heating or cooling is needed, and, in addition, what amount of heating or cooling is to be performed. For example, if the PID algorithm produces a control output that is a negative number then heating of the enclosure temperature is needed. On the other hand, if the PID algorithm outputs a positive number then cooling is needed.
- the output of the PID algorithm can have a range between a negative maximum and a positive maximum and the output can be a percentage of a maximum to further control heating or cooling.
- the computed percentage can be used to adjust the speed of the fan with a corresponding percentage of the maximum fan speed.
- the fan speed can be set at 70% of its maximum speed.
- a number of components or percentage power increase associated with those components can be computed based on the percentage of the maximum PID output.
- the stepper motors can have a minimum current requirement for hold torque (when stepping motion is not occurring). However, additional current to the stepper motors is acceptable and will generate additional waste heat up to a maximum current as specified by the manufacturer of the stepper motor. Using the maximum and minimum values for the stepper motors as a 100% and 0%, a scale can be generated based on the PID algorithm output. If cooling is required, the stepper motors can have the hold torque set to a minimum so that a minimum amount of waste heat is generated.
- the stepper motor can either be active (moving) or inactive (not moving and maintaining its current position) for a predetermined threshold period of time (e.g., 5 seconds). When active, the stepper motor can be considered in an active mode.
- the controller can maintain a timer on each stepper motor and simply reset the timer when the motor becomes active, which is also under the control of the controller. In this way, the controller can monitor the status of all of the stepper motors. Stepper motors that are not being used actively can be utilized for heat control, which is unrelated to movement.
- decision block 8118 a determination is made whether a motor is eligible for heat control.
- a next motor is checked in process block 8120.
- An example of when a motor is not eligible is when the motor is active and performing rotational motion of components in the system. In such a state, the stepper motor uses motion control parameters for its torque.
- decision block 8118 is answered in the affirmative, then in process block 8122, the motor idle torque is adjusted up or down according to whether the PID output indicated heating or cooling. For example, if the PID algorithm indicated that the temperature of the enclosure should be heated, then the controller can transmit a command to the stepper motor to increase its idle torque current to a desired value.
- an Application Programming Interface (API) request can be sent from the controller to the stepper motor with a parameter used to set the idle torque current.
- API Application Programming Interface
- the idle torque current can be set to the minimum, which is the minimum required to hold the current position.
- power is decreased to the components, which includes setting currents associated with the components to minimum allowable currents.
- decision block 8124 a check is made whether all motors have had their idle torque current set. If not, the process returns to process block 8120 to select a next motor. Decision blocks 8118 and 8122 are then repeated. After all the motors have had their idle torque current adjusted, then in process block 8126, the enclosure fan 320 can have its speed adjusted.
- the fan 320 can be turned off.
- the fan can be activated and the holding torque on each idle stepper motor is set to a minimum (the current needed to maintain the motor position).
- the speed (RPM) of the fan is variable and can be controlled based on the PID output.
- the enclosure temperature routine ends. The routine can be rerun at predetermined intervals so as to consistently control temperature within the enclosure.
- a separate flowchart shows the process used when a stepper motor is activated to perform its normal stepper functionality.
- the routine starts.
- process block 8142 a determination is made by the controller that motor movement is required.
- process block 8146 the controller can then set the motor as ineligible for enclosure heat control. Typically, the motor is only eligible when it becomes inactive for a predetermined period of time.
- process block 8148 normal motor torque is restored to the motor.
- process block 8150 the flow terminates. If the motor is later stopped, it can become eligible again for heat control after a predetermined period of time has passed.
- components that have a function that is typically not related to heating can have their current altered so as to maximize heat generation.
- their current can be lowered and fan speed increased to lower temperature.
- a graph shown in FIG. 81A shows the enclosure temperature as a function of power consumption.
- the controller increases power to various components so that the temperature of the enclosure increases. Increasing power can be unrelated to improving functionality of the individual components, but rather to simply increase heat generation. Alternatively, when the controller attempts to cool the enclosure, power consumption can be reduced.
- a system can comprise a computer operably connected to the instrument and configured to control instrument operations and/or receive, store and process data received from the instrument.
- a computer can be a special purpose computer or a general purpose computer configured to run custom software.
- a computer can include a display.
- a display configured to receive user inputs may be used, such as a touchscreen display.
- An example controller is shown in FIG. 101 .
- the system can comprise a reagent cartridge.
- a reagent cartridge 3300 is illustrated in FIGS. 26-34 .
- the reagent cartridge can be configured to hold and/or store one, two, three, four, five, or more (or even all) reagents and consumables required for an ID/AST operation in a predefined reagent arrangement within the cartridge.
- reagents can include sterile deionized water, antimicrobial agents, buffers such as GEF buffer and EKC buffer, growth media, FISH-related reagents such as nucleic acid probes, permeabilization agents, stringency wash solutions, cell stains or dyes, and the like.
- Reagents may be included as solutions or as dried or lyophilized reagents that are reconstituted by the instrument during operation.
- reagents may be sealed in a plurality of reagent wells 3310 distributed around the reagent cartridge.
- the reagent wells may be sealed with a foil seal pierceable by the instrument pipettor fitted with a pipette tip, such as a pipette tip 3441.
- Consumables can include suitable pipette tips 3441 for use with the instrument pipettor, such as aerosol barrier filter tips.
- the cartridge may also comprise subassemblies for performing various sample preparation functions, such as one or more GEF apparatuses, groups of reagent wells, or consumables racks (e.g., a pipette tip rack).
- Cartridge subassemblies may be operatively connected to or exposed to portions of the reagent stage, such as heating elements and electrical contacts (e.g., GEF contacts).
- the reagent cartridge 3300 may be constructed of a polymer or other suitable material.
- the reagent cartridge may comprise polymer housing (or other suitable material) 3320.
- the housing may have a generally rectangular shape (with rounded corners and curved ends) and may define a circular opening 3330 within the housing configured to accommodate independent operation of the cassette stage with an attached cassette and access to the cassette by other components of the instrument, such as the pipettor, the illuminator, and the optics system.
- the housing 3320 may be configured with a plurality of ports 3312 in the upper surface of the housing, with the ports providing access by the pipettor to wells containing various reagents or cartridge subcomponents.
- the upper surface of the housing may also comprise one or more teaching wells 3314.
- a teaching well 3314 can be an opening in the cartridge housing, such as a circular opening, that the pipettor may use to spatially orient itself to the cartridge, such as in an initial pipettor orientation step after user insertion of the cartridge and initiation of an ID/AST process and/or in periodic pipettor orientation steps throughout instrument operation.
- a teaching post or other structural feature that extends from the reagent cartridge may be used as a teaching feature for pipettor orientation.
- the locations of all cartridge ports or other openings may be known (i.e., addressed, such as using a coordinate system) relative to the location of the teaching well(s) or other teaching feature.
- the contents of the cartridge at each cartridge port or opening may be associated with the port or opening location by the system based on one of user input regarding the reagent cartridge used for an ID/AST process or information acquired by the instrument from the cartridge itself, such as a barcode or other identifier that may be sensed by the instrument.
- the reagent cartridge housing may be configured to provide a friction fit with alignment walls of the instrument reagent stage.
- the width of the reagent cartridge may be configured to interface with the alignment walls on either side of the cartridge.
- the reagent cartridge housing may further include on or more features such as a cleat 3316 that interfaces with holding features coupled to the alignment walls of the reagent stage, further providing for secure insertion and precise positioning of the reagent cartridge in the reagent stage, such as by providing a positive stop for reagent cartridge insertion into the reagent stage and/or a snap friction fit.
- the reagent cartridge may include a pipette tip rack 3340.
- the pipette tip rack 3340 may be integral to the reagent cartridge housing, or the pipette tip rack may be a separate component that is assembled into the reagent cartridge housing by a friction fit or by any other suitable attachment mechanism.
- the reagent cartridge housing may comprise two or more separate housing components.
- a housing may comprise a lower housing component 3322 and an upper housing component 3324.
- the lower and upper housing components may be attached to one another by a friction fit or by any other suitable attachment housing.
- the housing may define an interior space.
- the interior space may be configured to house a plurality of reagent cartridge components such as reagent racks 3801 comprising reagent wells in various configurations, reagent tubs (e.g., tub 3803), GEF wells 3805 configured to house GEF apparatus, and the like.
- the lower housing component 3322 may include openings for access and/or contact between the reagent stage and reagent cartridge components, such as between reagent stage heating elements and reagent racks (e.g., opening 3807).
- the lower housing component 3322 may also include components such as electrical contacts to provide an electrical interface between the reagent stage and one or more reagent cartridge components.
- the reagent cartridge may include electrical contacts 3606 ( FIG. 29 ) in a portion of the reagent cartridge housing configured to engage GEF contacts 540 ( FIG. 5 ) located on the reagent stage when the cartridge is inserted by a user.
- at least one electrical contact is accessible from an exterior of the reagent cartridge.
- the at least one contact includes a pair of spaced apart contacts positioned at one end of the reagent cartridge and configured for engagement by causing the reagent cartridge to translate and engage other electrical contacts of the system.
- At least some of the various wells and tubs included in the reagent cartridge may be sealed with a film, such as a film that may be pierced by a pipette tip mounted on the pipettor. The film may be located on the ports of the reagent cartridge housing, or the film may be located on the reagent wells and reagent tubs housed by the reagent cartridge housing.
- certain reagents included in the reagent cartridge may be dried or lyophilized.
- an antimicrobial agent may be dried into a film on the interior surface of a reagent well.
- Dried or lyophilized reagents may be reconstituted by the instrument by addition of water or buffers included in the reagent cartridge.
- Reagents included in the reagent cartridge may include any of a variety of reagents that may be used to perform microorganism ID and AST.
- reagents can include water, various detergents or buffers, growth media, permeabilization agents, probes, dyes or stains, solvents, and the like.
- the reagent cartridge may comprise a part of a reagent cartridge kit 3400 ( FIGS. 27-31 and 34 ).
- the reagent cartridge kit may be packaged in a sealed package, with each of the reagent cartridge kit components intended to be used for a single ID/AST operation.
- the reagent cartridge kit may further include a sample vial 3452 (for example, a sample vial insertable in the reagent cartridge) and a cassette 3454.
- the cassette may be housed or set in a disposable cassette holder 3455 configured to sit within a circular opening in the body of the reagent cartridge 3300 configured to accommodate operation of the cassette and cassette stage when the reagent cartridge is inserted in the instrument.
- the cassette holder may be shaped to receive the cassette, for example, having an outer dimension shaped for coupling the cassette holder over or in the opening in the reagent cartridge.
- the cassette and the pipette tip rack 3440 containing pipette tips 3441 may further be covered with a removable seal 4257 ( FIG. 34 ) within the sealed cartridge kit package.
- an instrument user may obtain a reagent cartridge kit, remove the reagent cartridge from the sealed package, remove the sample vial from the cartridge to place a clinical or research specimen in the sample vial, remove the film seal cover from the cassette housing and pipette tip rack, remove the cassette and/or cassette housing from the cartridge, and place the cartridge in the instrument, placing the cartridge in the reagent stage.
- different reagents may be included in a reagent cartridge and cartridges comprising different sets of reagents may be offered as kits for different research and diagnostic purposes. Different cartridge kits may be offered for different clinical specimen types or different differential diagnoses.
- kits may be offered for ID/AST of blood cultures, bronchiolar lavage specimens, sputum, wound infections, urine samples, and the like.
- the reagents included in the reagent cartridge may vary according to kit type, with different FISH probes, sample preparation reagents, and antimicrobial agents included in different kits in accordance with the specimen type and anticipated pathogens that may be present the specimen type.
- various Gram-positive and Gram-negative bacteria and fungi can be identified using an ID/AST cartridge kit for a positive blood culture assay, including but not limited to: Staphylococcus aureus, Staphylococcus lugdunensis, coagulase-negative Staphylococcus species ( Staphylococcus epidermidis, Staphylococcus haemolyticus, Staphylococcus hominis, Staphylococcus capitis, not differentiated), Enterococcus faecalis, Enterococcus faecium ( Enterococcus faecium and other Enterococcus spp., not differentiated, excluding Enterococcus faecalis), Streptococcus pneumoniae, Streptococcus pyogenes, Streptococcus agalactiae, Streptococcus spp., ( Streptococcus aureus, Staphylococcus
- Klebsiella pneumoniae, Klebsiella oxytoca, not differentiated Escherichia coli, Enterobacter spp.
- Enterobacter cloacae Enterobacter aerogenes, not differentiated
- Proteus spp. Proteus mirabilis, Proteus vulgaris, not differentiated
- Citrobacter spp. Citrobacter freundii, Citrobacter koseri, not differentiated
- Serratia marcescens Candida albicans, and Candida glabrata.
- bacteria that can be detected with the disclosed systems and methods, include without limitation: Acinetobacter baumannii, Actinobacillus spp., Actinomycetes, Actinomyces spp. (such as Actinomyces israelii and Actinomyces naeslundii ), Aeromonas spp. (such as Aeromonas hydrophila, Aeromonas veronii biovar sobria ( Aeromonas sobria ), and Aeromonas caviae ), Anaplasma phagocytophilum, Alcaligenes xylosoxidans, Actinobacillus actinomycetemcomitans, Bacillus spp.
- Acinetobacter baumannii Actinobacillus spp.
- Actinomycetes such as Actinomyces israelii and Actinomyces naeslundii
- Aeromonas spp. such as Aeromonas hydrophila, Aeromon
- Bacteroides spp. such as Bacteroides fragilis
- Bartonella spp. such as Bartonella bacilliformis and Bartonella henselae
- Bordetella spp. such as Bordetella pertussis, Bordetella parapertussis, and Bordetella bronchiseptica
- Borrelia spp. such as Borrelia recurrentis, and Borrelia burgdorferi ) , Brucella sp.
- Coxiella burnetii Corynebacterium spp. (such as, Corynebacterium diphtheriae, Corynebacterium jeikeum and Corynebacterium ) , Clostridium spp. (such as Clostridium perfringens, Clostridium difficile, Clostridium botulinum and Clostridium tetani ) , Eikenella corrodens, Enterobacter spp. (such as Enterobacter aerogenes, Enterobacter agglomerans, Enterobacter cloacae and Escherichia coli, including opportunistic Escherichia coli, such as enterotoxigenic E. coli, enteroinvasive E.
- Corynebacterium spp. such as, Corynebacterium diphtheriae, Corynebacterium jeikeum and Corynebacterium
- Clostridium spp. such as Clostridium perfringens, Clos
- Enterococcus spp. such as Enterococcus faecalis and Enterococcus faecium
- Ehrlichia spp. such as Ehrlichia chafeensia and Ehrlichia canis
- Erysipelothrix rhusiopathiae Eubacterium spp.
- Francisella tularensis Fusobacterium nucleatum, Gardnerella vaginalis, Gemella morbillorum, Haemophilus spp.
- Helicobacter spp. such as Helicobacter pylori, Helicobacter cinaedi and Helicobacter fennelliae ) , Kingella kingii, Klebsiella spp.
- Lactobacillus spp. Listeria monocytogenes, Leptospira interrogans, Legionella pneumophila, Leptospira interrogans, Peptostreptococcus spp., Moraxella catarrhalis, Morganella spp., Mobiluncus spp., Micrococcus spp., Mycobacterium spp.
- Mycoplasm spp. such as Mycoplasma pneumoniae, Mycoplasma hominis, and Mycoplasma genitalium
- Nocardia spp. such as Nocardia asteroides, Nocardia cyriacigeorgica and Nocardia brasiliensis )
- Prevotella spp. Porphyromonas spp., Prevotella melaninogenica, Proteus spp. (such as Proteus vulgaris and Proteus mirabilis ) , Providencia spp.
- Shigella spp. such as Shigella dysenteriae, Shigella flexneri, Shigella boydii and Shigella sonnei
- Staphylococcus spp. such as Staphylococcus aureus, Staphylococcus epidermidis, Staphylococcus hemolyticus, Staphylococcus saprophyticus
- Streptococcus pneumoniae for example chloramphenicol-resistant serotype 4 Streptococcus pneumoniae, spectinomycin-resistant serotype 6B Streptococcus pneumoniae, streptomycin-resistant serotype 9V Streptococcus pneumoniae, erythromycin-resistant serotype 14 Streptococcus pneumoniae, optochin-resistant serotype 14 Streptococcus pneumoniae, rifampicin-resistant serotype 18C Streptococcus pneumoniae, tetracycline-resistant serotype 19F Streptococcus pneumoniae, penicillin-resistant serotype 19F Streptococcus pneumoniae, and trimethoprim-resistant serotype 23F Streptococcus pneumoniae, chloramphenicol-resistant serotype 4 Streptococcus pneumoniae, spectinomycin-resistant serotype 6B Streptococcus pneumoniae, streptomycin-resistant serotype 9V Streptococcus pneumoniae, chlor
- Yersinia spp. such as Yersinia enterocolitica, Yersinia pestis, and Yersinia pseudotuberculosis
- Xanthomonas maltophilia among others.
- Candida spp. such as Candida albicans, Candida glabrata, Candida tropicalis, Candida parapsilosis, and Candida krusei
- Aspergillus spp. such as Aspergillus fumigatous, Aspergillus flavus, Aspergillus clavatus
- Cryptococcous spp. such as Cryptococcus neoformans, Cryptococcus gattii, Cryptococcus laurentii, and Cryptococcus albidus
- the ID/AST cartridge kit for a positive blood culture assay may be indicated as an aid in the diagnosis of bacteremia and fungemia. It may also be indicated for susceptibility testing of specific pathogenic bacteria commonly associated with or causing bacteremia. Results optimally should be used in conjunction with other clinical and laboratory findings.
- An ID/AST cartridge kit (such as one for use with a blood culture assay) may include the following antimicrobial agents: amikacin, ampicillin, ampicillin-sulbactam, aztreonam, ceftazidime, ceftaroline, cefazolin, cefepime, ceftriaxone, ciprofloxacin, colistin, daptomycin, oxycycline, erythromycin, ertapenem, gentamicin, imipenem, linezolid, meropenem, minocycline, piperacillin-tazobactam, trimethoprim-sulfamethoxazole, tobramycin, vancomycin, or combinations of two or more thereof.
- Additional antimicrobial agents that may be used in the systems and methods disclosed herein also include aminoglycosides (including but not limited to kanamycin, neomycin, netilmicin, paromomycin, streptomycin, and spectinomycin), ansamycins (including but not limited to rifaximin), carbapenems (including but not limited to doripenem), cephalosporins (including but not limited to cefadroxil, cefalotin, cephalexin, cefaclor, cefprozil, fecluroxime, cefixime, cefdinir, cefditoren, cefotaxime, cefpodoxime, ceftibuten, and ceftobiprole), glycopeptides (including but not limited to teicoplanin, telavancin, dalbavancin, and oritavancin), lincosamides (including but not limited to clindamycin and linco
- antimicrobial agents include amphotericin B, ketoconazole, fluconazole, itraconazole, posaconazole, voriconazole, anidulafungin, caspofungin, micafungin, flucytosine, or any combination of two or more thereof.
- the reagent cartridge includes at least one probe (such as 1, 2, 3, 4, 5, 6, 7, 8, 9, 10, 11, 12, 13, 14, 15, 16, 17, 18, 19, 20, or more) and at least one antimicrobial agent (such as 1, 2, 3, 4, 5, 6, 7, 8, 9, 10, 11, 12, 13, 14, 15, 16, 17, 18, 19, 20, or more) in one or more wells of the reagent cartridge.
- the reagent cartridge includes at least one well including a Staphylococcus aureus probe, a well including a coagulase-negative staphylococci probe (for example, a probe hybridizing to S. epidermidis, S. haemolyticus, S. hominis, S.
- a well including a Staphylococcus lugdunensis probe for example, a well including an Enterococcus faecalis probe, a well including an Enterococcus faecium probe, a well including a Streptococcus agalactiae probe, a well including a Streptococcus spp. probe (for example, a probe hybridizing to S. mitis, S. gallolyticus, S. agalactiae, S. pneumoniae, not differentiated), a well including an Escherichia coli probe, a well including a Klebsiella spp. probe (for example, a probe hybridizing to K. pneumoniae and K.
- a well including an Enterobacter spp. probe for example, a probe hybridizing to E. aerogenes and E. cloacae, not differentiated
- a well including a Citrobacter spp. probe for example, a probe hybridizing to C freundii and C. koseri, not differentiated
- a well including a Proteus spp. probe for example, a probe hybridizing to P. mirabilis and P.
- quality control (QC) components that may be utilized with the reagent cartridge and systems disclosed herein, such as an AST QC component and an ID QC component.
- the AST QC component is configured to fit in the reagent cartridge in place of the patient sample vial.
- the ID QC component is configured to fit in the reagent cartridge sample vial position along with the AST QC component, for example, the ID QC component has a complementary shape to the AST QC component.
- the Quality Control assay tests may be packaged in the form of disposable kits containing all reagents and tools necessary to perform the assays.
- the disposable units may be configured to fit onto the reagent cartridge used to run patient samples tested in the AD-1 Instrument System.
- QC test components may take the form of an insert having a multiwell format.
- the insert may be formed of any suitable material, such as plastic or other suitable polymer, and may be constructed to snap onto the reagent cartridge over the open well that typically houses patient samples.
- the inserts housing the QC test materials may take any shape.
- the AST QC test component may be fashioned and configured in the shape of the Greek letter pi (II).
- Assay reagents may be located in the wells of the insert that form the "pi" shape.
- the wells may be covered with a film, foil, or other barrier to protect the QC assay reagents during transport and storage.
- the protective barrier optionally is removable.
- the ID QC test component may comprise wells formed into a shape complementary to the AST insert.
- the ID QC test insert may be configured in the shape of the letter "E” such that it snaps into place on the reagent cartridge of the AD-1 Instrument System as a mate to the "pi"-shaped AST QC test insert.
- ID QC assay reagents may be contained in wells of the insert formed in an "E" shape.
- the tops of the reagent wells may be covered by a film, foil, or other barrier to protect the reagents during transport and storage. In some embodiments, the protective barrier optionally is removable.
- both the AST and ID QC disposable inserts are flush with one another when seated correctly on the reagent cartridge of the AD-1 Instrument System.
- Each QC assay test kit insert may have a label for identification purposes, such as a one-dimensional bar code, a two-dimensional bar code (such as a datamatrix code), an RFID tag, and the like.
- each component QC kit may have a tab onto which the label is affixed for recognition by the instrument.
- an optical scanning device within the instrument system scans the label on a QC insert and reads the information embedded in the label to identify the type of quality control test to be run in connection with the reagents contained in the insert, e.g., ID QC or AST QC.
- an exemplary ID QC test component 10400 is shown, including a frame 10402 generally in the shape of the letter "E" and having a plurality of wells 10404 and one or more clips 10406 attached to the frame 10402, which can interact with complementary clips on the AST QC test component (discussed below, e.g., FIGS. 105A-105D , 10500).
- FIGS. 104A-104D illustrate an embodiment with three clips 10404a, 10404b, and 10404c that interlock with complementary clips in the AST QC test component.
- the ID QC test component 10400 has 11 wells; however ID QC test components with more or fewer wells (such as 1, 2, 3, 4, 5, 6, 7, 8, 9, 10, 11, 12, 13, 14, 15, 16, 17, 18, 19, 20, or more) are also contemplated.
- the ID QC test component 10400 also includes a tab 10408 that is attached to frame 10402 and extends below the level of wells 10404.
- an identification label such as a bar code is affixed to the tab 10408.
- the ID QC test component is shown in FIGS. 104A-D as being in the shape of the letter "E" additional configurations are also contemplated. In addition to clips, other suitable structures to permit coupling of the ID QC component to the AST QC component can be used.
- the ID QC test component includes one or more target nucleic acids having a sequence complementary to at least one probe in the probe cocktail(s) to be tested.
- each well contains a plurality of beads (such as microspheres) coupled to a nucleic acid complementary to a single probe in the probe cocktail.
- at least one well includes a plurality of beads coupled to a nucleic acid complementary to a first probe in the probe cocktail and a plurality of beads coupled to a nucleic acid complementary to a second probe in the probe cocktail.
- At least one well includes at least three sets of beads (such as at least 4, at least 5, at least 6, or more) wherein each set of beads includes a plurality of beads coupled to a nucleic acid complementary to a different probe in the probe cocktail.
- the number of target beads that may occupy a single well ultimately depends upon a given test design.
- an ID QC test component is kept in refrigerated storage (such as about 1-12°C, about 2-8°C, or about 3-6°C) prior to use.
- an ID QC test component includes in at least one well beads conjugated to a target sequence complementary to a probe in a probe cocktail, where the target sequence is from Acinetobacter baumannii, Citrobacter spp., Enterobacter spp., Escherichia coli, Klebsiella spp., Proteus spp., Pseudomonas aeruginosa, Serratia marcescens, Coagulase-negative Staphylococcus spp., Enterococcus faecalis, Enterococcus faecium, Staphylococcus aureus, Staphylococcus lugdunensis, Streptococcus spp., Candida albicans, or Candida glabrata.
- microbial targets may be included in the ID QC test component, either in addition to, or in place of these microbes.
- One of skill in the art can select other microbial targets for ID QC testing, including any of the microbes described herein, based on the assay for which the ID QC test component is designed, to provide appropriate QC testing.
- One exemplary embodiment of a QC ID test component having at least one set of beads in 10 of 13 wells is shown in FIG. 108 .
- an exemplary AST QC test component 10500 is shown, including a frame 10502 generally in the shape of the Greek letter "pi" and having a plurality of wells 10504, one or more clips 10506 attached to the frame 10502 that can interact with complementary clips on the reagent cartridge (discussed below), and one or more clips 10510 attached to the frame 10502 that can interact with complementary clips on the ID QC test component.
- clips 10510a, 10510b, and 10510c interact with clips 10406a, 10406b, and 10406c of the ID QC test component shown in FIG. 104B , respectively.
- the exemplary AST QC test component shown in FIGS. 105A-105D has 8 wells; however AST QC test components with more or fewer wells (such as 1, 2, 3, 4, 5, 6, 7, 8, 9, 10, 11, 12, 13, 14, 15, 16, 17, 18, 19, 20, or more) are also contemplated.
- the AST QC test component 10500 also includes a tab 10508 that is attached to frame 10502 and extends below the level of wells 10504. In some embodiments, an identification label, such as a bar code, is affixed to the tab 10508.
- the AST QC test component is shown in FIGS. 105A-105D as being in the shape of the letter "pi," additional configurations are also contemplated. In addition to clips, other suitable structures to permit coupling of the AST QC component to the reagent cartridge and/or the ID QC component can be used.
- Reagents for AST QC testing are placed in one or more wells of the AST QC test component.
- the AST QC test component includes one or more microbial isolates to be tested in one or more of the wells.
- each well contains one microbial isolate.
- polymicrobial isolate mixtures may be used, depending upon the test design.
- the microbial isolates are included in the AST QC test component in a pre-selected amount, such as a McFarland standard of 1-2. Higher or lower McFarland standards (such as 0.5-5) may be employed, as needed based on assay design.
- the AST QC test component is kept in frozen storage (such as about -60 to -85°C, about -65 to -80°C or about -70 to -80°C) until use.
- the AST QC test component may include microbial isolates from both antibiotic susceptible and antibiotic resistant strains of the same microbial species (such as one Staphylococcus aureus susceptible strain and one Staphylococcus aureus resistant strain).
- the AST QC test component includes one or more microbial isolates in different wells, for example, one or more of E. coli (such as E. coli ATCC 25922 and/or E.
- coli ATCC 352148 Pseudomonas aeruginosa (such as P. aeruginosa ATCC 27853), Enterococcus faecalis (such as E. faecalis ATCC 29212), Staphylococcus aureus (such as S. aureus ATCC 29213, S. aureus ATCC 43300, and/or S. aureus ATCC BAA-977), and/or Candida albicans (such as C. albicans ATCC 96268).
- Pseudomonas aeruginosa such as P. aeruginosa ATCC 27853
- Enterococcus faecalis such as E. faecalis ATCC 29212
- Staphylococcus aureus such as S. aureus ATCC 29213, S. aureus ATCC 43300, and/or S. aureus ATCC BAA-977
- Candida albicans such as C. albican
- One of skill in the art can select other microbial isolates for AST QC testing, including any of the microbes described herein, based on the assay for which the AST QC test component is designed, to provide appropriate QC testing.
- One exemplary embodiment of an AST QC test component having at least one microbial isolate in 8 of 12 wells is shown in FIG. 109 .
- the ID QC test component interlocks with the AST QC component when both components are utilized together and placed in a reagent cartridge (for example, as shown in FIG. 106 , discussed below). Therefore, in some embodiments, the ID QC test component includes one or more clips that interlock with clips on the AST QC test component and/or the reagent cartridge, or other suitable structures to permit their coupling. Referring to FIG. 104B , clips 10406 interlock with clips 10510 shown in FIG. 105D . In additional embodiments, the AST QC test component also can include one or more clips that interlock with clips on the reagent cartridge, such as one or more components in the sample vial position of the reagent cartridge. Referring to FIG.
- clips 10506 interlock with the reagent cartridge (not shown).
- clips 10506 are substantially straight vertical projections extending downward from frame 10502. These vertical projections snap into corresponding holes on the reagent cartridge close to or adjacent to the sample vial position.
- clips 10510 are lateral projections that snap in place sideways to the ID QC insert clips 10406.
- FIGS. 106A and 106B illustrate embodiments of a reagent cartridge showing the AST QC and ID QC test components inserted in place of the sample vial.
- ID QC test component 10400 and AST QC test component 10500 are inserted in reagent cartridge 10602 at sample vial holder 10604.
- the patient sample is inserted at sample vial holder 10604.
- the "E" shaped ID QC test component 10400 and the "pi" shaped AST QC test component 10500 interlock to fit in the sample vial position.
- a system can comprise a cassette.
- the cassette may be configured to receive portions of the sample and other reagents in microfluidic sample channels.
- the cassette and sample channels facilitate performing EKC, FISH ID, AST, pharmacodynamics testing, and other assays and imaging microorganism cells with the instrument illumination and optics systems.
- Cassettes are illustrated in FIGS. 35-65 and described in greater detail below.
- a cassette 4500 may be a disk-shaped device comprising a glass support 4400, a laminate layer 4601, and a cassette top 4300 (see FIG. 46 ), also referred to as a cassette component.
- the laminate layer 4601 may comprise a polymer material with an adhesive layer or adhesive treatment on both sides of the laminate layer polymer material.
- the glass support 4400 may be adhered to the cassette top 4300 by the adhesive-treated laminate layer 4601.
- the three components may be pressed together to form the assembled cassette 4500.
- the assembled cassette 4500 can feature a plurality of microfluidic sample channels 5702 (e.g., 48 sample channels) (see FIGS.
- the microfluidic channels are formed in the laminate layer or in the laminate layer and in the cassette component.
- the sample channels are oriented with the inlet ports 4503 toward the outer perimeter of the cassette and the outlet ports 4504 oriented toward the center of the cassette.
- the inlet ports may be near the center of the cassette and the outlet ports near the perimeter of the cassette.
- cassette includes a glass support adhered to a molded polymer disc and a plurality of microfluidic channels arranged in a radial configuration across the cassette.
- the cassette 4500 may also include features for user handling, such as a central cone or spindle 4505 and/or tabs 4506 distributed around the perimeter of the cassette.
- the cassette may include features for interfacing with a cassette stage, such as a plurality of locking spring arms 4507 around the perimeter of the cassette that provide a friction fit with a corresponding feature located on the cassette stage such that the cassette is stably and vibrationally coupled to the cassette stage.
- a common waste well 4515 can be defined in a central area that is bounded by a circular waste retaining wall 4519.
- the cassette top 4300 can comprise a polymeric portion/region of the cassette that may be molded from an injection-moldable optically clear polymer such as ZEONOR (e.g., ZEONORE 1060R) and ZEONEX.
- the bottom surface of cassette top 4300 may be coated with an optically clear conductive layer such as ITO, either entirely or in the area of the sample channel, such as the bottom surface 4308 of the cassette top 4300 forming the top of a sample channel flowcell (i.e., a flowcell-forming relief area 4309 of a cassette top 4300) as well as the side walls of a flowcell-forming relief area in the bottom of the cassette top 4300.
- ITO may be applied to the cassette top 4300 to provide a sheet resistance of about 5 to about 200 ohms/sq., or about 30 to about 170 ohms/sq., or about 50 to about 120 ohms/sq., or about 70 to about 100 ohms/sq.
- the sheet resistance may be less than about 100 ohms/sq., or less than about 80 ohms/sq., or less than about 60 ohms/sq., or less than about 40 ohms/sq., or less than about 20 ohms/sq., or less than about 10 ohms/sq.
- FIGS. 37A-37C show details of the cassette top 4300.
- FIG. 37B shows a mask 4311 around a slot in the cassette top 4300.
- FIG. 41 shows a section of the cassette top in elevation illustrating one of the inlet ports 4503 in relation to its associated outlet port 4504. Select surfaces of the inlet port 4503 can be coated with ITO.
- the glass support 4400 as shown in FIGS. 38-40 may comprise a flat, annular-shaped glass slide with an outer diameter and an interior opening 4410 defined by an interior diameter.
- the glass may have properties of high light transmittance and high chemical stability, such as Schott B 270 i Ultra-White Glass or similar glass material.
- the interior opening 4410 may be configured to receive a central depression of the plastic top portion of the cassette.
- ITO may be applied to a surface of the glass support to provide a sheet resistance of about 5 to about 200 ohms/sq., or about 30 to about 170 ohms/sq., or about 50 to about 120 ohms/sq., or about 70 to about 100 ohms/sq.
- the sheet resistance may be less than about 100 ohms/sq., or less than about 80 ohms/sq., or less than about 60 ohms/sq., or less than about 40 ohms/sq., or less than about 20 ohms/sq., or less than about 10 ohms/sq.
- the glass support may be masked near the interior opening, such as is represented at region 4412 in FIG. 38 , so that the ITO coating does not extend to the edge of the interior opening 4410 of the glass support.
- the region can have boundaries of an inner diameter (ID) and an outer diameter (OD) as shown.
- the glass support may be further coated with poly-L-lysine ("PLL").
- PLL poly-L-lysine
- inner and outer edges of the glass support 4400 may be edge chipped or chamfered to the outside of the boundary 4414 and to the inside of the inner boundary 4416.
- the cassette 4500 can include EKC slots 4520 and EKC holes 4522, which are shown aligned in FIG. 41 . In the illustrated embodiment, there are three evenly spaced sets of the EKC slots 4520 and the EKC holes 4522. In addition, the cassette 4500 can include inner fiducial holes 4530 and outer fiducial holes 4532. In the illustrated implementation, there are three evenly spaced sets of the inner fiducial holes 4530 and the outer fiducial holes 4532 that are interspersed between the three sets of the EKC slots and holes.
- each EKC slot 4520 and each EKC hole 4522 can be selectively coated with silver paint or other suitable substance to ensure conductivity throughout the aligned slots and holes in the various components.
- FIG. 48A and the detail view of FIG. 48B show the inner fiducial holes 4530 and the outer fiducial holes 4532.
- a fiducial mark 4534 on the glass support 4400 is positioned to be centered within a circular hole 4536 in the laminate layer 4601.
- a fiducial mark 4538 on the glass support 4400 is positioned to be centered within a circular hole 4540 in the laminate layer 4601.
- FIG. 53A shows a portion of a cassette without an ejector pad E ( FIG. 52A ), in an alternate embodiment.
- FIG. 52B shows a portion of a cassette and FIG. 53B shows the same portion in which pockets P have been formed in an alternate embodiment.
- FIG. 52C shows a hole in a portion of the cassette and FIG. 53C shows a chamfer C added to the hole H in an alternate embodiment.
- FIG. 65 is a plan view an alternate design of the cassette 4500, in which the inner slot 4520 is painted with silver paint after being masked when the glass support 4400 is coated with ITO, the fiducial marks are aligned within the respective holes 4540 and 4536, and a barcode 4550 is provided.
- FIGS. 54 and 55 are perspective views of alternative laminate layers.
- the alternative laminate layer 4601' has a thickness of approximately 0.0035 inch, with a construction comprising 0.001 inch PSA (clear), 0.0015 inch PET (blue) and 0.001 inch PSA (clear).
- the alternative laminate layer 4601" has a thickness of approximately 0.0135 inch, with a construction comprising 0.00175 inch PSA (clear or blue), 0.010 inch PET (clear) and 0.00175 inch PSA (clear or blue).
- FIG. 59 A schematic cross section of a cassette 4700 with a thinner laminate layer is shown in FIG. 59 . As shown, the gap between the glass support and the cassette top is smaller, so fluid tends to be trapped in the gap during processing. Because the gap is smaller, the EKC electrical fields are about four times greater than in implementations with larger gaps.
- FIG. 60 is a schematic cross section of a cassette 4702 with a thicker laminate layer. As shown, the gap between the glass support and the cassette top is larger. The thicker laminate layer can be cut more cleanly. In addition, the thicker PSA layer component may provide better sealing.
- FIGS. 61 and 63 show top plan and bottom plan views, respectively, of a cassette 4704 in which the channels are formed in both the cassette top and in the laminate layer.
- FIGS. 62 and 64 show top plan and bottom plan views, respectively, of a cassette 4706 in which the channels are formed only in the laminate layer.
- each individual sample channel 5702 comprises one of the inlet ports 4503 in fluid communication with a flowcell 5711, with the flowcell further in fluid communication with the associated one of the outlet ports 4504.
- the inlet port 4503 is configured to receive a pipette tip attached to the pipettor assembly and to interface with the pipette tip in a manner that creates a seal suitable to substantially prevent fluid expelled from a pipette tip from filling the inlet port above the tip end (i.e., fluid expelled from the tip is preferentially directed into the inlet port channel and the flowcell due to the seal created by the interface between the pipette tip and the inlet port).
- the inlet port 4503 may have a conical shape with an inside diameter at the top of the inlet port that is greater than the outside diameter of the pipette tip.
- the inside diameter of the inlet port may decrease toward the bottom of the inlet port, tapering toward an inlet port channel 5712 that is smaller than the pipette tip to facilitate receiving the pipette tip lowered into the inlet well by the pipettor and guiding the pipette tip to a position substantially coaxial with the vertically oriented inlet port channel.
- the inlet port structure may be configured so that the top of the inlet port and/or inlet port channel is located at a raised inlet port height in relation to the level of the flowcell in a manner configured to create a positive pressure head (i.e., a hydraulic head) with respect to the flowcell to further produce gravity-driven fluid flow from the inlet port into the flowcell (i.e., the sample channel design and configuration of the inlet port, the sample channel flowcell, and the outlet port are suitable to facilitate pipettor-driven fluid flow through the sample channel in response to positive pressure at the inlet port by the pipettor, as well as gravity and surface tension driven flow through the sample channel from the inlet port to the outlet port when each port is at ambient pressure and the channel is fluid-filed with the fluid level reaching the tops of the inlet port channel and the outlet port channel (i.e., the outlet port nozzle)).
- a positive pressure head i.e., a hydraulic head
- the configuration of the inlet port 4503, the flowcell 5711 and the outlet port 4504 may be suitable to prevent fluid backflow when the sample channel is fluid-filled and the fluid level reaches the top of the inlet port channel and the outlet port nozzle 4512, respectively (i.e., the sample channel is continuously fluid filled from the top of the inlet port channel to the top of the outlet port channel (i.e., the outlet port nozzle)) with the inlet port and the outlet port at ambient pressure.
- the flowcell 5711 can comprise a horizontally oriented chamber configured to facilitate distribution of sample objects across a region of the cassette defined by the flowcell boundaries for EKC and imaging.
- a flowcell may have a height of about 300 ⁇ m to about 350 ⁇ m, a width of about 2.2 mm (in an imaging region), and a length of about 22.5 mm.
- a flowcell may comprise a flowcell imaging region 5713 and a flowcell outlet region 5714.
- the flowcell imaging region 5713 may be about 16.5 mm in length.
- the flowcell outlet region 5714 may be about 6 mm in length and decrease or taper in width from the width of about 2.2 mm in the imaging region to a narrower width at the interior end (i.e., located radially inward) of the flowcell located near the outlet port.
- FIG. 58 is an alternative view/perspective of FIG. 57 .
- FIG. 56 is a drawing of a portion of a cassette showing a configuration having a misaligned channel, which may be disadvantageous, but still may be functional under many conditions.
- the flowcell 5711 is an alternative design that avoids this challenge because there is no channel misalignment, there is no fluid flow over the laminate layer and the exit transition is smoother. There is also increased tolerance for slight deviations in the imaging location. Further, the EKC gap is uniform in this example and no ITO is required in the sides of the channel. The estimated change in the volume of the channel is on the order of +1 microliter from the example configured in FIG. 56 .
- the configuration of the flowcell outlet region may reduce or substantially eliminate diffusion of waste products or contaminants from the outlet channel.
- D is a diffusion coefficient that depends on the size and shape of the molecule in question as well as its interaction with the solvent and the viscosity of the solvent.
- a value of D of 1E-3 mm 2 /s may be used to represent a typical small molecule that may be present in a fluid used in a cassette. Using this value of D in the equation above, the time required for a molecule to diffuse 1 mm is 1000 s.
- reagents may be exchanged through the flowcell in a manner calculated to move waste reagents from the flowcell into the outlet channel, and the separation of the imaging region of the flowcell from the outlet port channel by the flowcell outlet region may prevent solutes in the outlet channel from diffusing into the imaging region of the flowcell in a timeframe in which ID, AST, or other assays are performed.
- An outlet port of a sample channel may be configured to permit excess fluid to exit the sample channel upon displacement by fluid expelled into the inlet port by the pipettor.
- a cassette may be configured with a common waste well 4515 that receives excess fluid exiting from the each of the plurality of sample channel outlet ports 4504.
- an outlet port 4504 may be configured to prevent fluid backflow from the outlet port or a waste well back to the sample channel.
- a cassette and/or each sample channel outlet port may be configured to encourage fluid flow into the common waste well 4515.
- Pressure head differentials between an outlet port and an inlet port i.e., negative pressure head from the inlet port to the outlet port
- a variety of phenomena can produce fluid flow against gravity that can result in backflow or contamination from a common waste well, including various surface tension-induced effects such as capillary action, wicking, and Marangoni flows.
- an outlet port may be configured to provide desired outlet port performance with respect to waste fluid. These parameters include (but are not limited to): the length, the diameter, the surface treatment of an outlet port channel; the orientation of the outlet port channel end (i.e., the outlet port "nozzle"); the configuration and surface treatment of the surface surrounding the outlet port nozzle; the height of the outlet port nozzle above common waste well; the distance of the outlet port channel structure (i.e., the structure housing the outlet port channel) from adjacent outlet port channel structures; and the like.
- These features may be configured to produce capillary action within the outlet port channel and other hydraulic effects with respect to droplet formation and droplet behavior at the outlet port nozzle for the various fluids and fluid mixtures used in the sample channel over the course of instrument operation to perform ID and AST. These parameters may be configured to reduce the occurrence of backflow from the outlet port channel toward the sample channel and to prevent fluid flow from the common waste well into the outlet port.
- an outlet port may comprise a cylindrical channel located above the end of the flowcell and oriented vertically upward.
- the outlet port channel may have a small diameter suitable to provide surface effects that create a level of capillary action to extend the height of the outlet port channel sufficiently above the common waste level to create a separation barrier while maintaining a negative pressure head relative to the inlet port filled to the top of the inlet port channel (at ambient pressure; i.e., without a positive pressure from the pipettor).
- the outlet port channel may be located in an outlet port structure 4516.
- the outlet port structure 4516 may be configured to extend vertically upward from the top surface 4517 of the cassette.
- the outlet port structure may define the outlet port channel as a substantially vertically oriented cylindrical channel within the outlet port structure.
- the outlet port structure may comprise an arcuate fin or rib 4518 extending radially inward toward the central common waste well 4515.
- the plane of the outlet port nozzle may be oriented orthogonally to the outlet port channel axis.
- the area of the tops of the outlet port structures surrounding the outlet port nozzles and the distance between the tops of adjacent outlet port structures may be configured to prevent waste fluid droplets that form at the outlet port nozzles from contacting the tops and/or nozzles of adjacent outlet port structures.
- the outlet port structure may be configured with a geometry having a ratio of height to distance between outlet port structures that exceeds a critical value such that fluid surface forces are insufficient to overcome fluid body forces, thereby preventing fluid backflow by wicking and/or capillary action.
- each outlet port structure and the distance between adjacent outlet port structures may be sufficient to prevent capillary action of fluid in the common waste well from overcoming gravity and reaching the tops of the outlet port structures.
- the arcuate conformation of the outlet port structure fin may wick a waste fluid droplet downward toward the common waste well.
- the configuration of the outlet port structures may provide for capillary action between adjacent outlet port structures in a direction away from the outlet port nozzles, drawing waste fluid downward and/or radially inward toward the center of the cassette and the common waste well.
- the configuration of the cassette and the outlet ports does not require individual outlet ports or waste wells to be emptied by a pipettor.
- the common waste well can be emptied periodically if necessary when the pipettor is not required for other operations.
- the outlet port does not require a mineral oil overlay or similar treatment to reduce or prevent evaporation in the sample channel. Fluid evaporation from the outlet port may reduce a pressure head in the outlet port, producing fluid flow through the sample channel from the inlet port, reducing a fluid level in the inlet port channel.
- both the inlet port channel and the outlet port channel may be configured such that evaporation of fluid from the open surfaces of each over the course of an assay such as ID or AST is less than a critical value such that each of the inlet port channel and the outlet port channel store excess fluid volume and fluid volume depletion by evaporation does not deplete fluid from the flowcell and/or otherwise influence the solution properties of the fluid contained in the flowcell.
- the inlet port and/or the outlet port may be covered with mineral oil or any other reagent suitable to overlay an aqueous fluid and reduce evaporation of the fluid.
- an outlet port may be configured to provide a reduced pressure head relative to a pressure head of the inlet port, thereby reducing or substantially preventing backflow into the sample channel.
- An outlet port may be configured to provide a reduced pressure head by maintaining a small outlet port channel volume, such as by configuring the outlet port channel with a low outlet port channel height.
- an outlet port channel may be configured with a reduced channel diameter, such that a reduced outlet port channel volume is provided per unit of outlet port channel height, and further providing for an increased surface tension force (i.e., capillary action) on fluid in the outlet port channel that counteracts the gravitational force contributing to the pressure head.
- the outlet port channel may be configured to maintain a low pressure head while increasing the head height to prevent backflow from the waste well into the outlet port.
- configuring the outlet port to provide a low outlet port pressure head may permit the sample channel inlet port to be configured with a low head height while providing a positive pressure head relative to the outlet port, thereby reducing the height of the inlet port structure required to provide the positive pressure head at the inlet port relative to the outlet port.
- sample channels comprising an outlet port channel diameter that is smaller than the inlet port and/or inlet port channel permits an increased number of sample channels per unit surface area as compared to a cassette comprising sample channels of the same overall configuration but having an outlet port channel of the same diameter as the inlet port channel.
- a vertical outlet port channel configuration is compatible with manufacturing in a single molding stage without additional side-actions or pick outs.
- FIGS. 69-75 An instrument and system may be used to perform microorganism identification, quantitation, and antimicrobial susceptibility testing in an automated fashion.
- System architectures and process flows for a system and method of operation in accordance with various embodiments are illustrated in FIGS. 69-75 .
- An overview of the disclosed ID/AST methods is provided, with additional details for various aspects of the methods provided in the following sections.
- a patient sample (or portion thereof) is loaded in a sample vial and loaded into the instrument.
- Patients can include human and veterinary subjects, such as cats, dogs, cows, pigs, horses, sheep, chickens and other birds, fish, and the like.
- a patient is one who is known to have or is suspected of having an infection (such as a bacterial or fungal infection).
- the patient is septic.
- Patient samples include but are not limited to blood (e.g., whole blood, plasma, or serum), respiratory samples (such as bronchoalveolar lavage, oropharyngeal swab, nasopharyngeal swab, or sputum), saliva, urine, rectal swab, vaginal swab, tissue samples, or other biological specimens. Samples can be concentrated, diluted, and/or separated before analysis with the disclosed method and systems. Portions of the sample are introduced into a plurality of microfluidic channels in the cassette.
- One or more detectably labeled nucleic acid probes are introduced into each of the microfluidic channels.
- the detectably labeled probes include species-specific (also referred to as target-specific) probes and/or universal probes.
- Each species-specific probe specifically hybridizes to nucleic acids from a specific target organism (e.g., E. coli ) or group of target organisms ( e.g., Klebsiella spp., such as K . pneumoniae, K. oxytoca, not differentiated).
- the species-specific probes each specifically hybridize to rRNA of a target organism or group of organisms.
- Each universal probe hybridizes to nucleic acids from a group of class of organisms, such as all bacteria and/or fungi.
- one species-specific probe is introduced into each microfluidic channel (e.g ., a different species-specific probe in each channel) and the universal probe is introduced into all of the channels.
- the detectably labeled probes are incubated with the sample under conditions sufficient for the probes to hybridize to microorganisms present in the sample.
- Images of one or more (such as 1-100, for example, 2-25, 10-40, 30-80, or 50-100) fields of view of one or more microorganisms are captured. Multiple images of the same field of view may be captured, for example under one or more different imaging modalities.
- each field of view is imaged under conditions to detect each of the labeled probes (such as the species-specific probe and the universal probe) and optionally under dark field conditions.
- the images are subjected to morphological or other analysis (such as morphokinetic analysis) to identify characteristics of the imaged microorganisms, including one or more of signal intensity of the one or more detectably labeled probes, noise, cross-talk, and microorganism morphology.
- the information from the morphological analysis is input to a probability expectation model of distribution to identify one or more microorganisms present in the patient sample.
- the microorganism is identified based on a combination of posterior probabilities from one or more of the plurality of microfluidic channels.
- the signal pattern of the detected microorganism(s) in the sample are compared or matched with a posterior probability density function (PDF) of a labeled target probe using an empirical threshold value.
- PDF posterior probability density function
- the posterior distributions are passed through Kernel Density Estimator and integrated to provide a resulting likelihood or probability of an event (e.g ., presence or absence of a specific microorganism) in a microfluidic channel.
- the sample includes one microbe (such as one "target" microbe), while in other examples, the sample includes two or more microbes (for example, 2, 3, 4, or more), which is referred to herein as a "polymicrobial" sample.
- the patient sample is subjected to one or more pre-processing steps prior to contacting the sample with the one or more detectably labeled probes.
- pre-processing steps include GEF (for example, to remove or reduce lysed cells and debris in the sample) and/or EKC (for example to localize microorganisms to a surface for analysis).
- the patient sample (or a subsample thereof) is subjected to AST analysis. Based on the identity of the microorganism(s) in the sample, a portion of the sample is grown in the presence or absence of one or more antimicrobials and the growth of the identified microorganisms is monitored over time (for example, at least 30 minutes, at least 1 hour, at least 2 hours, at least 3 hours, at least 4 hours, at least 5 hours, or at least 6 hours, such as about 1-6 hours).
- the growth of the microorganisms is monitored by capturing images of the microorganisms at repeated time intervals (such as every 10 minutes for 4.5 hours) and qualitatively or quantitatively measuring the growth (or amount of growth), lack of growth, or lysis of the microorganisms. Based on the behavior of the microorganisms over time in the presence of the one or more antimicrobials (for example, compared to a control that is not exposed to the antimicrobial(s)), a determination of susceptibility (or indeterminate susceptibility) or resistance of the identified microorganisms to each antimicrobial is made. In some examples, the methods also include determining a MIC of the identified microorganisms to one or more antimicrobials.
- the concentration of the microorganism(s) in the patient sample is determined, in order to calculate an appropriate dilution of the sample to utilize in AST. In some examples, the concentration is determined using the dynamic dilution methods described herein. In additional examples, the sample or portion thereof is subjected to one or more pre-processing steps prior to AST, for example GEF and/or EKC.
- An instrument user may perform various input functions to prepare an instrument for operation and to prepare the system components and a sample for processing.
- a user may obtain a sample, such as a biological or clinical specimen.
- the user may also obtain a package comprising a reagent cartridge kit.
- the reagent cartridge kit contained in the package may further comprise a sample vial and a cassette.
- the user may transfer all or a portion of a biological or clinical specimen to the sample vial and load the reagent cartridge and sample vial in the instrument.
- the user may also insert the cassette into the instrument.
- the user may enter order information into the controller via a user interface.
- the instrument may comprise one or more devices for scanning a barcode or otherwise recognizing information encoded on a cartridge, cassette, and/or sample vial.
- the instrument may record various information and/or perform instrument functions based on information encoded on the cartridge, cassette, and/or sample vial and recognized by the instrument itself. After all sample preparation, sample loading, and order entry steps are completed, the user may press a "Run" button located on the instrument to initiation the ID/AST process. In accordance with various embodiments, the user input steps that must be completed by a user prior to initiation of an instrument run may be completed by a user in about 15 minutes or less.
- Sample preparation may be performed using gel electro filtration ("GEF"), such as in the manner described in U.S. Patent Publication No. 2014/0038171A1 .
- GEF gel electro filtration
- An aliquot of the sample may be removed from the sample vial by the instrument pipettor and transferred to a GEF device.
- a GEF step is performed to separate sample debris from microorganism cells that may be present in the sample.
- the electric field is briefly reversed to displace microorganism cells from the surface of the gel matrix and the prepared sample comprising microorganism cells present in the sample can be removed from the GEF device.
- the instrument and system may be configured to perform two separate GEF steps, with a first GEF step performed to prepare a portion of the sample for FISH ID, and a second GEF step performed to prepare a portion of the sample for AST.
- Any number of GEF sample preparation steps may be performed to prepare one or more portions of a sample for various assays that may be performed by an instrument in accordance with various embodiments.
- the sample may be a polymicrobial patient sample in which multiple strains, species or types of microorganisms are present (such as at least 2, at least 3, at least 4, or at least 5 different strains, species or types of microorganisms).
- the sample may be a direct-from-patient sample.
- recovered sample is aliquoted by the pipettor into one or more sample channels of a cassette.
- EKC is performed to capture cells on a capture surface of each sample channel flowcell.
- cells are immobilized by entombing them in three-dimensional space in a medium that can be phase changed after contacting the cells (e.g., agar). The entombing can occur with or without first performing the capture step.
- the entombing creates a microenvironment around the immobilized microorganism, the characteristics of which are not influenced by neighboring microorganisms during the identification and/or susceptibility testing periods.
- the method includes retaining the microorganism on a detection surface of the sample channel, thereby producing a retained microorganism, and subsequently introducing a gel medium (such as one containing agar) into the sample channel, wherein the gel medium is in contact with the retained microorganism following introduction into the sample channel; immobilizing the retained microorganism in the sample channel at the same location where the microorganism is retained, to produce an immobilized microorganism, wherein offspring of the immobilized microorganism remain over time at a location with the immobilized microorganism; and incubating the immobilized microorganism for a period of time to allow for growth of the microorganism.
- a gel medium such as one containing agar
- Microorganism identification may be performed by hybridization of one or more (such as 1, 2, 3, 4, 5, 6, 7, 8, 9, 10, 11, 12, 13, 14, 15, 16, 17, 18, 19, 20, or more) species-specific probes and/or one or more universal microbial probes (such as a universal bacterial and/or universal fungal probe) in a FISH assay.
- species-specific probes such as 1, 2, 3, 4, 5, 6, 7, 8, 9, 10, 11, 12, 13, 14, 15, 16, 17, 18, 19, 20, or more
- one or more universal microbial probes such as a universal bacterial and/or universal fungal probe
- Cell permeabilization and washing steps may be performed by the instrument using reagents contained in the reagent cartridge, followed by a hybridization step in which the species-specific probes attach to a target microbial species if cells of the target microbial species are present in the sample and captured in the sample channel.
- the universal probe hybridizes to any microorganism nucleic acid molecules present.
- probe migration and hybridization to microorganism nucleic acids may be accelerated by application of an electrical field in the flowcell by the instrument.
- Unattached (e.g. , non-hybridized) probes may be rinsed out of the channel by the instrument following hybridization.
- Each FISH probe has an attached fluorophore that emits light at a peak emission wavelength when illuminated with an appropriate excitation wavelength.
- the species specific probes may be labeled with a first fluorophore, such as ATTO-532, that provides for emission detection at a first emission wavelength, such as 553 nm, when illuminated by the illuminator using a first laser, such as a green laser providing a first excitation wavelength, such as 520 nm.
- a first fluorophore such as ATTO-532
- a first laser such as a green laser providing a first excitation wavelength, such as 520 nm.
- each of the species-specific probes is labeled with the same fluorophore, while in other examples, one or more of the species-specific probes is labeled with a different fluorophore than at least one of the species-specific probes.
- the "universal" FISH probe is configured to hybridize to a plurality of microorganism species, and in some examples is used in conjunction with a second laser, such as a red laser.
- a universal probe may serve to facilitate identification of polymicrobial specimens comprising more than one bacterial or fungal species and observing the presence of bacteria not marked by any of the seventeen species-specific probes.
- the fluorophore used for a universal probe can comprise a second fluorophore (e.g., a different fluorophore than that used to label one or more of the species-specific probes), such as ATTO-647, that provides for emission detection at a second emission wavelength, such as 669 nm, when illuminated by the illuminator using a red laser providing a second excitation wavelength, such as 637 nm.
- a second fluorophore e.g., a different fluorophore than that used to label one or more of the species-specific probes
- ATTO-647 that provides for emission detection at a second emission wavelength, such as 669 nm, when illuminated by the illuminator using a red laser providing a second excitation wavelength, such as 637 nm.
- fluorophores include but are not limited to Alexa Fluor® fluorophores, coumarin, fluorescein (FITC), rhodamine, rhodamine Green, rhodamine Red, tetramethylrhodamine (TRITC), Cy®3, Cy®7, and Cy®5 fluorophores, Pacific GreenTM, Oregon GreenTM, Pacific BlueTM, Pacific OrangeTM, and Texas Red® fluorophores, PlatinumBrightTM fluorophores (Leica), 6-FAM, TAMRA, JOE (6-carboxy-4',5'-dichloro-2',7'-dimethoxyfluorescein), VIC, tetrachlorofluorescein (TET), hexachlorofluorescein (HEX), ROX (carboxy-X-rhodamine), IRDyes® fluorophores (Li-Cor), and ATTOTM fluorophores.
- FITC fluorescein
- rhodamine rhod
- the system may exclude sample debris from analysis by considering only image objects colocalized using both dark-field imaging and fluorescence imaging during image processing by the controller.
- An example of FISH ID image data acquired using the AD-1 instrument is illustrated in FIG. 66 .
- a universal control stain (such as a DNA intercalating dye) may be combined with a prepared sample and introduced into a sample channel.
- exemplary universal control stains include but are not limited to acridine orange, propidium iodide, and 4'6-diamidino-2-phenylindole (DAPI).
- Image data from all flowcells may be used to determine the total number of organisms present in a sample and permit evaluation of the sample for the presence of non-target organisms and polymicrobial samples.
- the instrument can report FISH ID results approximately one hour after sample loading.
- the ID results may be used by the system to determine the selection of appropriate antibiotics or antifungals for performing AST from the antimicrobial reagent panel included in the reagent cartridge.
- Direct-from-patient samples are generally complex milieus, containing live cells, dead cells and debris that interfere with testing procedures.
- Typical methods for the identification of microorganisms in patient samples often results in ambiguous quantitation results.
- Potential errors include organism misclassification, wrong identification and improper quantification of viable organisms.
- the problem has been addressed in the past by non-quantitative operator judgment.
- the instrument system employs a dynamic dilution procedure with automated interpretation of data from multiplexed channels and probes to improve accuracy and reduce errors in microbial quantification.
- aliquots of the sample may be subjected to antimicrobial susceptibility testing to determine the best course of therapy to treat the particular strain of microorganism (or strains of multiple microorganisms) infecting an individual.
- the instrument may combine a sample prepared by GEF (or a subsample thereof) with growth media and subject the sample to a pre-growth step during the approximately 1-hour FISH ID assay.
- the pre-growth step performed by the instrument may normalize microorganism growth rates prior to AST.
- the instrument may determine organism concentration in the pre-grown sample by performing (and/or repeating) a cell quantitation process using a universal nucleic acid-binding stain. Based on the organism concentration of a sample following the pre-growth step, the instrument may dilute the sample to provide an appropriate cell concentration for AST.
- the instrument may add growth media (e.g ., MHA) containing single concentrations of each test antimicrobial (such as antibiotics prepared by the instrument) to separate sample channels.
- growth media e.g ., MHA
- the instrument may provide temperature control of the enclosure, the cassette, and reagents in the reagent cartridge.
- different temperatures may be provided by the instrument over time and/or for specific components of the instrument.
- the instrument may provide separate temperature control and temperature profiles (e.g ., changes in temperature over the time course of an assay and/or instrument operation) for the subassemblies of the cassette that contain the MHA and the antibiotic reagents.
- AST various microorganism clone features are measured, such as division rates of specific species and the light intensity of a growing clone, and used for analysis. For example, a quantitative measurement of an individual clone growth rate over time can be used to determine antimicrobial efficacy. Onboard software algorithms determine quantitative identification of the target organism(s), derive minimum inhibitory concentration (MIC) values, and apply appropriate expert rules for proper interpretation and reporting of categorical interpretations such as "S,” "I,” or “R” (susceptible, intermediate, or resistant) or "S” or “NS” (susceptible or not susceptible). In accordance with various embodiments, AST can be performed in approximately 5 hours. Examples of microorganism growth curves demonstrating S, I, and R growth interpretations are illustrated in FIG. 68 .
- the system reports susceptibility, intermediate, or resistance to one or more antimicrobials (e.g., susceptible to one or more of the antimicrobials in Table 5 or other antimicrobial provided herein) and/or an MIC for one or more antimicrobials.
- the following resistance phenotypes may be reported by the system in response to AST data analysis: Methicillin-resistant Staphylococcus aureus (MRSA), methicillin-resistant staphylococci (MRS), vancomycin-resistant S. aureus (VRSA), vancomycin-resistant Enterococcus species (VRE), high-level aminoglycoside resistance (HLAR) and macrolide-lincosamide-streptogramin B resistance (MLSb).
- susceptibility testing requires that standard concentrations of viable inoculates be combined with set concentrations of antimicrobial agents. Accordingly, in order to perform an antimicrobial susceptibility test on an unknown bacterial sample, the starting concentration of the sample inoculum must be determined. Commonly, the inoculum concentration is determined by plating - which takes one to two days to complete - or through use of a McFarland turbidity assay. Although faster than traditional plating assays, turbidometric measure of bacterial cell concentration in a sample is not highly accurate, as this method only provides an approximation of colony forming units. This approximation is calculated from the amount of scatter achieved when light passes through a suspension of microorganisms, which serves as an indicator of the biomass of cells present in the suspension.
- turbidity assays rely on light scattering through a bacterial culture, these assays neither directly count the number of bacterial cells present, nor do they directly measure colony forming units as is accomplished with plating. According to the United States Pharmacopeia, the estimated measure of cells obtained via a turbidity assay should be confirmed by a plate count as a control after the test is underway. The confirmation value is then utilized to calibrate the size of the inoculum used in the subsequent susceptibility test. Such techniques prolong the time for identifying the best course of therapy for critically ill patients. And because light scattering is a gross approach to estimating bacterial mass, a typical McFarland-based test is nonlinear.
- Nonlinearity is due in part to errors that arise because volumetric turbidity tests cannot discern between dead cells and viable ones. Yet, scientists generally treat such test data as linear. In addition, McFarland-based tests do not distinguish multiple species or strains of microorganisms in a single patient sample. Proper identification of the members of polymicrobial populations of microorganisms in patient blood samples can be important in the accurate diagnosis and treatment of bacteremia and sepsis.
- This system is designed to accurately and precisely quantitate bacterial concentrations in a patient sample by 1) quantifying the relative abundance of viable microbial cells and 2) using that quantification, dynamically calculating the dilution factor needed to initiate antimicrobial testing.
- One beneficial aspect of the disclosed system which reduces the time required to tailor a treatment to the specific microbe (e.g ., bacterium), infecting a patient, is its ability to accept a larger sample concentration input range than other antimicrobial susceptibility test systems.
- the process starts with the most concentrated amount of a specimen at hand, from which one or more aliquots are diluted as needed.
- the process follows this conservative approach as it is easier to further dilute a sample into the target range than it is to concentrate samples that have been diluted past the lower end of the target range.
- the objective is to obtain the most concentrated sample possible that will work within the disclosed instrument/device. Detecting a sample's microbial concentration and diluting it to a target concentration can be accomplished by known methods, albeit rather slowly and somewhat inaccurately. But dynamically diluting a microbial (e.g ., bacterial) inoculum to achieve an appropriate range for accurate susceptibility testing of a given organism during each run is a unique aspect of the disclosed system.
- a microbial e.g ., bacterial
- Certain prior art instruments have a specified, pre-determined concentration range (set a priori ) that is targeted for sample dilution.
- set a priori a specified, pre-determined concentration range
- one known system requires growing colonies on a plate, picking them, and placing the colonies in a tube to establish a culture of the bacterial isolate. Samples are mixed with a diluent to achieve a suspension, and then inserted into a spectrophotometer to obtain a concentration reading.
- the lab technician must acquire a densiometric reading in a narrow range, such as 0.46-0.54 (less than about 300 CFU (x10 6 /mL)), to estimate the number of colony forming units present ( e.g ., using a McFarland scale).
- the final dilution of the sample will not accurately reflect the number of viable cells present in the sample for antimicrobial sensitivity testing.
- the population of bacteria may have doubled one or more times, thereby introducing further error into the concentration calculus.
- the disclosed system utilizes a target range of 10-130 clones per field of view (such as about 10-100, 20-80, 30-60, 10-50, 40-80, or 50-100 clones per field of view) to achieve optimal bacterial growth.
- a target range of 10-130 clones per field of view such as about 10-100, 20-80, 30-60, 10-50, 40-80, or 50-100 clones per field of view
- about 20-80 (such as about 20, 25, 30, 35, 40, 45, 50, 55, 60, 65, 70, 75, or 80) growing clones per field of view is the target range. If too few clones are present, then statistically more fields must be viewed to detect bacteria, if they can be detected at all. Too many microbial clones in a field causes crowding and growth inhibition.
- the ideal dilution point of a bacterial sample destined for AST evaluation can be the midpoint of the upper limit and the lower limit of the targeted range (e.g ., target number of clones per field of view) of the bacterial inoculum.
- an inoculum sample is polymicrobial, for example containing a mixture of bacterial species or strains, then two paths may be followed for obtaining the ideal dilution point.
- One option is to dilute the samples such that the bacterial counts of both species (e.g. , bacterial species A and B) are centered between the upper and lower limits of the inoculum.
- a second option is to dilute the sample such that the amount of one bacterial species (for example, species A) is diluted to the midpoint of the inoculum upper and lower limits, which dilutes bacterial species B to a point below the lower limit of the inoculum. Under these circumstances, antimicrobial susceptibility testing for bacterial species B is not initiated, and culturing or a second run would be required to quantitate the amount of species B present in the sample.
- species A for example, species A
- the disclosed system uses a process superior to McFarland-based turbidity methods typically used in the clinical laboratory in order to obtain the concentration of bacteria needed for MIC assessment.
- the detection system and staining process together comprise the dynamic dilution aspect of the disclosed system.
- the disclosed dynamic dilution method can be used with other systems and methods (such as other systems for detecting or measuring microorganisms), in addition to those disclosed herein.
- an effective dilution curve for a sample can be non-linear.
- the disclosed system uses one or more subsamples of a patient sample (such as 1, 2, 3, 4, 5, or more subsamples) to estimate a non-linear effective dilution curve for a sample.
- the estimated non-linear dilution curve is then used to determine a target dilution factor for diluting the sample to achieve the target number of clones per field of view prior to antimicrobial sensitivity testing.
- FIG. 102 is a flowchart of an example method 10200 of determining a target dilution factor using dynamic dilution and diluting a sample using the target dilution.
- the different process blocks described below for FIG. 102 and FIG. 103 can be accomplished using the hardware components shown in FIG. 101 . Additionally, such a method can be used with the disclosed methods and systems, or can be used with other antimicrobial detection and AST systems and methods.
- cell concentrations are determined for multiple subsamples of a sample, wherein each subsample is diluted using a different dilution factor.
- the dilution factors include one or more of 0.04, 0.2, and 0.625 (or 25-fold, 5-fold, and 1.6-fold) from a post-GEF sample.
- additional or different dilution factors including, but not limited to 2-fold, 3-fold, 10-fold, or 20-fold
- the multiple subsamples can be extracted from the sample and stored separately from the remaining sample.
- an instrument pipettor can be used to extract the subsamples from a sample vial and to place in separate flowcells of a cassette.
- at least three subsamples (such as at least 3, 4, or 5 subsamples) are used in the dynamic dilution process.
- a trade-off can exist between storage space and estimation accuracy.
- Using a higher number of subsamples can lead to a more accurate model of the effective non-linear dilution curve for the sample.
- a higher number of subsamples take up more flowcells on the cassette.
- a range of three to five subsamples can provide a good balance between accuracy and available flowcells on the cassette.
- Each subsample is diluted using a distinct sample dilution factor, e.g., no two subsamples are diluted using the same dilution factor.
- the sample dilution factors are preselected to produce diluted subsamples that are representative of a range of possible sample concentrations.
- sample dilution factors are selected such that a target cell concentration is likely to fall within a range created by the diluted subsamples.
- a cell concentration of each diluted subsample is determined. Determining a cell concentration can comprise counting a number of cells in a diluted subsample. In particular non-limiting examples, cell number is determined by contacting each subsample with a universal nucleic acid stain (such as acridine orange or propidium iodide) and counting the number of cells. In some examples, the cells are imaged and cell counting is determined from the image.
- a universal nucleic acid stain such as acridine orange or propidium iodide
- determining a cell concentration of a subsample comprises using electrokinetic concentration to produce a migration of cells in the subsample toward a surface (e.g., a glass surface of a cassette) prior to staining, optionally imaging, and counting the cells in the subsample.
- the cell concentration for a subsample can be a ratio between a number of cells in a diluted subsample and a volume of fluid in the diluted subsample.
- a non-linear dilution curve is approximated using the subsample concentrations and the associated dilution factors.
- Approximating the non-linear dilution curve can comprise creating dilution test points for the subsamples, wherein each dilution test point comprises one of the subsample cell concentrations and the corresponding sample dilution factor that was used to dilute the subsample.
- the dilution test points can represent points on a non-linear effective dilution curve in a two-dimensional space, wherein dilution factor is one dimension and resulting cell concentration is the other dimension.
- the non-linear dilution curve is estimated by interpolating between the dilution test points.
- the dilution curve can be estimated by performing multiple linear interpolations and/or multiple spline interpolations between the dilution test points.
- the non-linear dilution curve can be estimated by creating a model of the curve.
- a model of the non-linear dilution curve can be created using multiple interpolations between the dilution test points.
- a model of the dilution curve is created using linear interpolations between multiple dilution test points corresponding to multiple subsamples.
- creating the model of the non-linear dilution curve comprises determining an average cell concentration using a proportionality constant.
- the average cell concentration can be determined by multiplying each subsample cell concentration by its corresponding sample dilution factor raised to a power of a proportionality constant, summing the products, and dividing the sum by a count of the subsamples.
- the value chosen for the proportionality constant can be an important factor in accurately estimating the non-linear dilution curve.
- the proportionality constant is a value less than 1 and greater than or equal to 0.5. In some cases where cells are captured on a two dimensional surface, a proportionality constant of 0.75 can be effective.
- a value for the proportionality constant can be determined empirically by experimenting with multiple possible values and comparing expected cell concentrations with observed cell concentrations.
- the approximation of the non-linear dilution curve is used, along with a target cell concentration for the sample, to determine a target dilution factor.
- the target cell concentration can be a cellular concentration for the sample that is conducive to performing antimicrobial susceptibility testing. In some cases, a range of possible cellular concentrations are acceptable. In such cases, the target cell concentration can be a selected value within the range of acceptable values, such as a midpoint.
- determining the target dilution factor can comprise identifying a first of the multiple dilution test points with a subsample cell concentration that is less than the target cell concentration, identifying a second of the multiple dilution test points with a subsample cell concentration that is greater than or equal to the target cell concentration, and using an interpolation between the first and second identified dilution test points to determine the target dilution factor.
- using the interpolation between the first and second identified subsample comprises using a linear interpolation between the test points.
- D T is the target dilution factor
- C T is the target cell concentration for the sample
- C 1 is the cell concentration of the first identified dilution test point
- D 1 is the corresponding dilution factor for C 1
- C 2 is the cell concentration of the second identified dilution test point
- D 2 is the corresponding dilution factor for C 2 .
- determining the target dilution factor can comprise using a ratio between a product of the lowest subsample cell concentration and its corresponding dilution factor and the target cell concentration.
- D T is the target dilution factor
- C T is the target cell concentration for the sample
- C 1 is the lowest subsample cell concentration
- D 1 is the corresponding dilution factor for C 1 .
- determining the target dilution factor can comprise determining a ratio between the average cell concentration and the target cell concentration, and then raising the ratio to a power of a reciprocal of the proportionality constant.
- a portion of the sample is diluted to the target concentration using the target dilution factor.
- the portion of the sample is the remainder of the sample that is left after the subsamples are extracted.
- only part of the remaining sample is diluted for antimicrobial susceptibility testing and the rest of the sample is left undiluted for other purposes.
- cell population in a sample can continue to increase while the target dilution factor is being determined. If this continued cell growth is not accounted for, then diluting the sample using the target dilution factor can result in a diluted sample with a cell concentration different from the target cell concentration.
- the target dilution factor can be adjusted to account for cell growth in the sample while the target dilution factor is being determined.
- a portion of the cells counted in the subsample cell concentrations may be non-viable cells. Such non-viable cells may be included in the approximation of the estimate of the non-linear dilution curve. However, these non-viable cells will not contribute to growing cell concentrations.
- a growth factor can be used to adjust a determined target dilution factor to account for cell growth in the sample.
- the growth factor can also adjust the target dilution factor to account for a rate of non-viable cells, for example a rate of non-viable cells associated with the identified species.
- Microbial cell viability is generally accounted for by developing an assay that maximizes the health of the sample regardless of what type of microorganism is in it. Nonetheless, some targets will produce more viable growing clones as a proportion of the total number of microorganisms than others. For example, a particular targeted bacteria might have a growth rate that would cause a doubling in number during the period in which the dynamic dilution occurs.
- growth factors can be determined using data across multiple runs and many isolates per target group (for example 10, 50, 100, or more samples per growth factor). Because the growth factor is determined empirically, it is ultimately a factor of the timing of the assay itself, the health of the bacteria during the process of sample preparation and dilution, the growth rate for the individual target, and the growth "efficiency" of the individual target (non-growing clones/growing clones).
- FIG. 103 is a flowchart of an example method 10300 of determining a target dilution factor for a sample using a growth factor.
- a growth factor associated with a microorganism in the sample is identified.
- the growth factor can be a single factor that accounts for both a growth rate of the microorganism and a rate of nonviable cells.
- Identifying a growth factor associated with a microorganism in the sample can comprise identifying a species of the microorganism in the sample and selecting a predetermined growth factor associated with the identified species.
- the growth factor is used to adjust the determined target dilution factor, for example, to take into account cell growth in the sample while the target dilution factor is being determined.
- the growth factor is determined empirically for each microbe (or combination of microbes) being tested.
- the growth factor is determined for a particular microbe or combination of microbes by selecting a median of the ratio of the actual number of growing clones and the intended number of clones, determined from multiple experiments where a sample is diluted to a dilution expected to produce the target number of clones.
- Table 1 Example growth factors for microorganisms.
- FISH ID Growth Factor Proteus vulgaris, Proteus mirabilis (PRO) 0.75 Acinetobacter baumannii (ABA) 1 Enterobacter aerogenes, Enterobacter cloacae (ENT) 0.78 Enterococcus faecalis (EFS) 0.86 Enterococcus faecium (EFM) 0.75 Klebsiella oxytoca, Klebsiella pneumoniae(KLE) 0.93 Pseudomonas aeruginosa (PAE) 0.57 Staphylococcus lugdunensis (SLU) 1.21 Staphylococcus aureus (SAU) 1.15 Coagulase negative staphylococcus (CNS) 0.86 Citrobacter freundii, Citrobacter koseri (CIT) 1.11 Serratia marcescens (SMA) 1.3 Escherichia coli (ECO) 0.99
- At 10304 at least three subsamples of the sample are diluted using different sample dilution factors.
- the dilution factors can be similar to the dilution factors described above with respect to example method 10200.
- cell concentrations are determined for each of the three or more diluted subsamples. Any of the example methods for determining cell concentrations described herein can be used to determine the concentrations of the diluted subsamples.
- a model of a non-linear dilution curve is created using the at least three determined cell concentrations and the at least three sample dilution factors.
- Techniques used to create the model of the non-linear dilution curve can be similar to at least some of the techniques described above with respect to example method 10200, such as interpolation between multiple dilution test points, determining an average cell concentration using a proportionality constant, etc.
- the model of the non-linear dilution curve can be adjusted to account for the growth factor.
- the growth factor is selected based on the identity of the microbe, which in some examples can be determined by the FISH assays described herein.
- D T ⁇ C 1 D 1 G C T , for C T ⁇ GC 1 C T G ⁇ C 1 + D 2 ⁇ 1 ⁇ D 1 ⁇ 1 C 2 ⁇ C 1 D 1 ⁇ 1 ⁇ 1 C 2 ⁇ C 1 D 2 ⁇ 1 ⁇ D 1 ⁇ 1 , for GC 1 ⁇ C T ⁇ GC 2 C T G ⁇ C 2 + D 3 ⁇ 1 ⁇ D 2 ⁇ 1 C 3 ⁇ C 2 D 2 ⁇ 1 ⁇ 1 C 3 ⁇ C 2 D 3 ⁇ 1 ⁇ D 2 ⁇ 1 , for C T ⁇ GC 2 wherein, G is the growth factor, D T is the target dilution factor, C T is the target cell concentration, C 1 is a first determined cell concentration for a first subsample, D 1 is a first sample dil
- a target dilution factor is determined for the sample using the model of the non-linear dilution curve, the growth factor, and a target cell concentration for the sample.
- determining the target dilution factor can comprise identifying a first of the dilution test points with a subsample cell concentration that, when adjusted by the growth factor, is less than the target cell concentration; identifying a second of the dilution test points with a subsample cell concentration that, when adjusted by the growth factor, is greater than or equal to the target cell concentration, and using an interpolation between the first and second identified dilution test points to determine the target dilution factor and adjust the target dilution factor using the growth factor.
- D T C T G ⁇ C 1 + D 2 ⁇ 1 ⁇ D 1 ⁇ 1 C 2 ⁇ C 1 D 1 ⁇ 1 ⁇ 1 C 2 ⁇ C 1 D 2 ⁇ 1 ⁇ D 1 ⁇ 1
- G is the growth factor
- D T is the target dilution factor
- C T is the target cell concentration for the sample
- C 1 is the cell concentration of the first identified dilution test point
- D 1 is the corresponding dilution factor for C 1
- C 2 is the cell concentration of the second identified dilution test point
- D 2 is the corresponding dilution factor for C 2 .
- determining the target dilution can comprise determining a product of the lowest subsample cell concentration, the dilution factor corresponding to the lowest concentration, and the growth factor.
- a ratio between the determined product and the target cell concentration can then be used as the target dilution factor.
- G is the growth factor
- D T is the target dilution factor
- C T is the target cell concentration for the sample
- C 1 is the lowest subsample cell concentration
- D 1 is the corresponding dilution factor for C 1 .
- determining a target dilution factor, and adjusting it using the growth factor can comprise adjusting the average concentration using the growth factor, determining a ratio between the adjusted average cell concentration and the target cell concentration, and raising the ratio to a power of a reciprocal of the proportionality constant.
- the dilution of the sample can be validated during a subsequent antimicrobial sensitivity testing.
- a growing cell density of the diluted sample can be quantified in a growth control channel during antimicrobial sensitivity testing. If a final growing clone density of the diluted sample is outside an acceptable range, then the antimicrobial sensitivity testing can be aborted.
- any of the example dilution methods described herein can be performed by a system comprising a system controller.
- the system controller comprises a processor and a computer-readable storage medium.
- the computer-readable storage medium can store instructions that, when executed by the processor, cause the system controller to perform any of the dilution method described herein.
- the system comprises disclosed instrument (e.g., instrument 100 in FIG. 1 ) with an attached system controller operable to control the instrument.
- Another aspect of the disclosed system is its ability to account for morphology changes of microorganisms during antibiotic susceptibility testing.
- Some bacteria change morphology during the first few hours of antibiotic exposure during growth in nutrient medium. For example, some Pseudomonas and Enteric bacteria species elongate and become filamentous during the first few hours of growth in the presence of beta-lactam antibiotics. This morphology shift toward larger bacterial cells may be perceived by automated microscopy systems as growth in the presence of such antibiotics. Under these circumstances, the bacteria would be erroneously characterized as antibiotic resistant by the automated system, even though the bacteria eventually may lyse and die in response to the antibiotic.
- the bacterial system addresses this problem by employing an innovative medium formulation containing a reduced level of nutrient components compared to standard growth media. This is counter to standard thinking, as nutrient depletion typically would retard growth of bacterial cells and therefore hasten their death.
- significantly reducing the solute concentration of Mueller-Hinton agar creates an efficient testing system for differentiating true antibiotic-resistant bacterial cells from susceptible bacterial cells that pass through a temporary filamentous phase before dying.
- Truly resistant bacterial cells continue to grow for up to about 4-5 hours under such nutrient-depleted conditions, whereas susceptible bacterial cells undergo a short period of elongation and then lyse within the first 1-2 hours of antibiotic exposure.
- certain bacterial species exhibit delayed or slower growth patterns under standard AST conditions.
- fastidious bacterial species such as Streptococcus typically require special nutrient media containing blood components to grow in an AST system, and grow slowly without blood enrichment. Without proper growth conditions, these bacteria are difficult to test for antibiotic susceptibility, particularly in automated systems designed to produce results in less than 5 hours. Therefore, a novel media was developed for enhanced antibiotic susceptibility testing with bacterial species that demonstrate fastidious or delayed growth patterns under standard culture conditions.
- novel medium formulation combined peptone ingredients in specific proportions without added blood to support the growth of Serratia in the presence of antibiotics and fastidious Streptococcus during AST evaluations for establishing minimal inhibitory concentrations for bacterial isolates from patient samples.
- This new culture medium demonstrated excellent results, enabling rapid susceptibility testing of problematic organisms/antimicrobial combinations to yield minimal inhibitory concentration and categorization (SIR) results.
- an automated quality control (QC) assay is performed, for example using the disclosed system.
- quality control generally refers to the control of errors in the performance of laboratory tests and the verification of test results.
- quality control testing ensures that the product performs to a defined set of criteria. All materials, equipment and procedures utilized in an assay protocol are adequately controlled to ensure accurate test results.
- QC testing was performed manually, even for automated instruments. The traditional approach is complex, labor-intensive, and wasteful. Typically, Master clones of reference microorganisms used in a testing panel are streaked onto agar nutrient plates, cultured, and then aliquoted for storage.
- test organisms are removed from the Master stock, streaked on agar nutrient plates, and cultured for each QC test run. This latter streaking process generally requires 18-24 hours to accomplish. Colonies of the microorganisms are then harvested and suspended in solution, the concentration of which is estimated using a McFarland turbidity assay incorporating a 0.5 standard (1.5x10 8 cfu/mL, which are created for each assay). Only after each of these steps is performed can a laboratory professional manually load the microorganisms onto an automated platform to initiate a Quality Control analysis.
- ID microorganism identification
- "synthetic" ID QC assays may be designed to test blood culture kit probe cocktails and permeabilization solutions, while enzymes, the universal bacterial probe, and universal eukaryotic probe are tested with two frozen isolates ( e.g., C. albicans and S. aureus ) .
- the synthetic ID test assesses the function of probe cocktails in the blood culture kit by testing them against a complementary target sequence unique to each probe cocktail. This complementary sequence is coupled to polymer microspheres that are close to bacterial cells in size. The probes hybridize to these target beads in the same manner as the probes would hybridize to cellular rRNA sequences in the blood culture ID assay performed on patient samples.
- a positive ID is indicated by a fluorescent signal from a detectable label associated with the probe (such as a fluorescent green signal).
- a fluorescent signal from a detectable label associated with the probe such as a fluorescent green signal.
- An increase in fluorescent signal of a different wavelength (such as a red fluorescent signal) from the universal probe above expected background levels indicates a failure of the negative control.
- a cocktail of ATTO-532 (green) fluorescently labeled DNA probe(s) designed to bind to the rRNA of each identification target is added to different flowcells.
- Each cocktail also includes an ATTO-647 (red) labeled universal microbial probe capable of binding bacterial or yeast cells. In the negative control flowcell, no signal should be present; however, presence of signal from the universal probe indicates failure of the negative control, as it indicates that the universal probe is binding to something where nothing should be present.
- FIG. 107 shows an exemplary target sequence (SEQ ID NO: 1) coupled to a microsphere, which is complementary to a fluorescently labeled probe sequence (SEQ ID NO: 2). Binding of the detectably labeled probe to the target sequence results in fluorescence from the label.
- FIG. 107 illustrates this with a random target sequence and complementary probe; however, any target sequence that allows microbial identification and its complementary probe can be used in the ID QC test component and methods using the ID QC test component.
- each probe cocktail in a sample test kit is QC tested with a unique target bead.
- a small number of pathogens may be used to test multiple probe cocktails.
- C . albicans and S. aureus may be used to test their respective cocktails as well as the other components used for the ID portion of a blood culture test kit.
- a cross-linker can be used to couple an amine-modified ssDNA sequence that is a complement of the probes used in a given sample test kit. This reaction results in an amide linkage between the amine on the ssDNA and the carboxyl-modified polymer microsphere.
- linkers may be used with blood culture or other types of sample kits, e.g., respiratory, skin, cerebrospinal fluid, or urine test kits.
- a zero-length cross-linker is preferred.
- the ssDNA is coupled to a microsphere through a linker moiety such as a chain of 1-15 carbon atoms (such as 1, 2, 3, 4, 5, 6, 7, 8, 9, 10, 11, 12, 13, 14, or 15 carbon atoms) or other known linking groups (such as amide, hydrazide, thiol, or polyalkeneglycol).
- Suitable linking groups can be identified by one of ordinary skill in the art.
- ID QC tests are designed to be run in conjunction with a second automated Quality Control assay as an external QC process for assessing the accuracy of antimicrobial susceptibility testing ("AST") calls made by the AD-1 Instrument System.
- An automated AST QC test may be designed to comply with published verification guidelines.
- antimicrobial agents employed in assessing antibiotic susceptibility of pathogens from blood culture samples may be included in an automated QC assay.
- Such QC assays may be designed to use each antimicrobial agent with one of the isolates connected with accepted published standards.
- ATCC QC isolates recognized by the Clinical Laboratory Standards Institution (CLSI M100-S26, Performance Standards for Antimicrobial Susceptibility Testing) may be used.
- the reportable range for the AST QC assay in some examples are adjusted such that the selected QC isolates have an MIC that is within the reportable range of the QC Assay. These extended ranges are only applied to QC testing and are not applied to AST assessment of patient samples.
- the process for assigning an MIC value to the QC organisms is the same or similar to that used for patient samples. However, the concentration of antimicrobial agent is modified (typically lowered) to accommodate the QC range for the isolate and the interpretation algorithms may be slightly adjusted for this range. This approach allows testing of, for example, CLSI recommended QC isolates without affecting the algorithms that are optimized around antimicrobial breakpoints.
- ID QC or AST QC testing include those described above, for example, when the QC test samples are microbial isolates.
- positive detection is achieved by comparing the cumulative count in the target (e.g., Green fluorescence channel) only against a threshold of objects that have brightness exceeding bead autofluorescence.
- Negative control detection is achieved by doing the same for eubacteria (e.g ., Red fluorescence) channel only. For example, the number of bright red objects should not exceed a threshold in order to pass negative control.
- the CLSI required QC isolates for the relevant antimicrobial resistance phenotype assays may also be tested.
- routine testing of a designated susceptible isolate as well as testing of designated resistant isolates for each new lot and /or new shipment of reagent kits should be performed.
- These isolates, therefore, may be included in the QC Assay.
- Cefoxitin may be tested with Staphylococcus aureus ATCC 29213 as the susceptible isolate and Staphylococcus aureus ATCC 43300 may be tested as the resistant isolate.
- each of the automated ID QC and AST QC tests may be run independently of one another. However, the ID and AST QC test criteria should match the ID and AST criteria relevant to the regulatory clearances and registration requirements of a given jurisdiction.
- ID and AST Quality Control assays are simple to run, permitting minimally trained personnel to conduct the assays and obtain Quality Control results within about 8 hours of initiating these assays.
- inventive automated QC assays eliminate the need to maintain frozen stocks of microorganisms, avoid multiple culturing steps, obviate the need to create McFarland standards, and eschew the manual loading of pathogenic inocula onto an ID/AST platform. This is not an insignificant achievement compared to the standard manual Quality Control assays currently used in clinical microbiology.
- This new automated QC test methodology has demonstrated about a 20%-30% improvement in the effective pass rate over manual QC test procedures.
- the percentage of units that fail to meet specific standards decreases when the quality control process itself is improved and is therefore more reliable.
- Automating the QC procedure permits the validation of test results in a much shorter period of time than the traditional manual protocol, and reduces the amount of biohazardous waste produced in the process. This outcome is better for both patients and the environment.
- an AST QC test component is inserted in the patient sample location of a reagent cartridge described herein. If present, the protective cover over the AST QC component is removed. If an ID QC test is to be performed simultaneously, an ID QC test component is also inserted in the sample vial location of the reagent cartridge; the AST QC test component and the ID QC test component should fit together snugly and be flush with one another. The protective cover on the ID QC test component is left in place. A cassette is inserted in the system and the reagent cartridge is then inserted in the system. A QC run is performed and results are provided in a report indicating pass/fail of the test for each microbe and/or antibiotic tested. The report may include additional information, including but not limited to, expected results and the results of each test.
- the ID QC and AST QC test components are supplied as a kit.
- the kit includes at least one ID QC test component and at least one AST QC test component.
- the kit includes one or more AST QC test components.
- the AST and ID QC assay test kits may be kept in cold storage to improve shelf life.
- AST QC assay kits may be stored at temperatures between - 60°C and -85°C.
- microbial ID QC assay test kits are stored, for example, at between 2°C and 8°C until used.
- such QC test kits should be stable for at least 15 minutes at room temperature after removal from cold storage; longer periods of stability at room temperature are even more preferred.
- identification and antimicrobial susceptibility test QC kits should be formulated to be robust and stable upon deployment for routine laboratory use. Optimally, such QC assays perform reliably in order to pass at a high enough rate to meet laboratory regulatory requirements. A run-to-run QC pass rate of greater than 95% assessed across multiple days, lots, and operators is preferred.
- Quality Control reports may be generated to display the results of each assay.
- Each microorganism and antimicrobial agent tested may have a set of results reported for each assay. For example, MIC acceptance range, measured MIC, and pass/fail readings may be compiled.
- a graphical user interface on a display screen and printed reports preferably delineate Quality Control data from patient sample runs to avoid confusion. Pass or fail information may be viewed for individual organisms and antimicrobial agents tested.
- Exemplary QC reports are presented with the QC Example below (Example 6).
- Each QC assay should profile every AST and ID test run on a patient sample.
- the results of QC assay runs may be portable to Laboratory Information Systems for storage and retrieval purposes. If desired, laboratory personnel may retrieve multiple QC reports over a period of time to satisfy regulatory inspection or auditing needs. After a QC assay is complete, all testing components may be disposed of as biohazardous waste.
- Verification of the platform confirms that the AD-1 System performs to intended specifications. Verification procedures also are geared to ensuring that laboratory staff can accurately produce test results using the System. Both of these activities are typically governed by the regulatory requirements of a given locality. For example, an Individualized Quality Control Plan (“IQCP”) may be required to establish a daily or alternate QC procedure that embraces risk assessment, a quality control plan, and a quality assessment review.
- IQCP Individualized Quality Control Plan
- a preferred verification study designed for the AD-1 Instrument System calls for inclusion of a minimum of 30 microorganisms for ID and AST QC testing. Ideally, every antimicrobial agent should be tested 30 times during the verification process. QC test results are employed to assess reproducibility of this analysis.
- microorganisms In addition to the minimum 30 microorganisms, a supplemental set of microorganisms demonstrating high and low Minimum Inhibitory Concentration ("MIC") values that are not found in routine testing should be included.
- this "challenge set" of microorganisms may test known resistance phenotypes, such as Methicillin-resistant Staphylococcus aureus (“MRSA”), Extended spectrum beta-lactamase (“ESBL”)-producing organisms, and Klebsiella pneumoniae carbapenemase- (“KPC”) producing bacteria.
- MRSA Methicillin-resistant Staphylococcus aureus
- ESBL Extended spectrum beta-lactamase
- KPC Klebsiella pneumoniae carbapenemase-
- a verification schedule may include the use of 25x fresh/prospective clinical blood culture samples and 37x seeded/challenge isolates seeded into blood culture bottles.
- ID and AST QC assays may be run in parallel for about 20-30 days to establish the maximum QC test interval for ID and AST QC post-verification. After a daily ICPQ is established, ID and AST QC analysis may be run weekly. After verification has been established, post-verification AST analysis may be run weekly and ID analysis may be run monthly. Verification acceptance criteria may include, for example:
- the disclosed system performs a rapid microbial counting assay immediately before commencing antimicrobial susceptibility testing (AST). This requires calibration across multiple dilutions. An equivalent McFarland-based test using FISH takes too much time to complete (at least one hour or more).
- the disclosed bacterial counting procedure begins by subjecting a sample containing (or suspected of containing) microorganisms to gel electrofiltration (GEF) to substantially remove debris. Then, in some instances, the sample is mixed with L-DOPA and introduced into microfluidic flowcells. In the presence of an electrical potential and a poly-l-lysine coated flowcell channel surface, sample bacteria adhere to the poly-l-lysine coated surface in the chamber.
- GEF gel electrofiltration
- the captured bacteria are concentrated onto the flowcell surface via electrokinetic concentration (EKC). Unbound bacteria are washed from the flowcell, and then a dynamic dilution (discussed above) is performed.
- EKC electrokinetic concentration
- the bacterial sample is subjected to treatment with one or more permeabilizing agents, such as alcohol, an enzyme, a detergent, and the like.
- one or more permeabilizing agents such as alcohol, an enzyme, a detergent, and the like.
- 80% ethanol is pipetted into the channel to permeabilize the bacteria present when small molecular sized stains (e.g., propidium iodide) are used.
- permeabilizing agents such as ethanol and one or more enzymes.
- the permeabilization process enables stain molecules to enter the bacterial cells for visualization as discussed above.
- a nucleic acid stain such as 1 ⁇ g/mL propidium iodide, PI
- PI propidium iodide
- the sample is then illuminated at an appropriate excitation wavelength (e.g., 535 nm for PI) and bound stain fluoresces (e.g., for PI, green at an emission maximum of 617 nm).
- the automated detection component of the disclosed system quantifies the signal emitted from stained bacterial cells. This is achieved by overlaying dark field images of the field of view, which permits visualization of cells and debris not present in green fluorescent laser images of stained cells.
- the signal cutoff is 5-fold signal over background, thereby eliminating from the count any auto-fluorescence emanating from debris.
- the concentration of bacteria in the channel is back-calculated to establish a total amount of bacteria in the sample. If the calculated amount is, for example, 60 clones, then the sample is within the middle of the target range necessary to get an accurate viewing of bacteria upon dilution. If the calculated amount is too high (for example, 3,000 clones), then the sample must be diluted to a range of 40-80 clones. The objective is to hit the middle of this target range in each channel for every run.
- a comparison of calibration curves for the output range for Klebsiella pneumoniae highlights the effect of using a multipoint, non-linear curve for quantitating bacteria for dynamic dilution versus a simple, single point linear curve approximation.
- a sample having a relative concentration of 1 (set forth on the x-axis) should theoretically have a relative concentration of 0.1 following a 1:10 dilution, which would plot as a straight line.
- Klebsiella pneumoniae like most other microorganisms
- FIGS. 84A-D further demonstrate this principle in the form of a normal probability plot comparing the effect of sample dilution of simple linear dilution curves compared to three-point dilution curves utilizing a growth factor specific for each of the four types of bacteria tested ( Acinetobacter baumannii - FIG. 84A , Pseudomonas aeruginosa - FIG. 84B , Klebsiella pneumoniae - FIG. 84C , and Serratia marcescens - FIG. 84D ).
- Each plot summarizes approximately 1500 experiments.
- the three-point curves demonstrate that dilution merely shifted the curve to the left along the x-axis, but did not discernably alter the lower end of the curve.
- the simple linear curves demonstrate that dilution not only shifts the curve to the left, but also drives the lower range downward forming a tail, leading to inaccurate concentration estimations.
- a series of growth media was formulated with 0.5%, 0.25%, and 0.125 % strength of standard Mueller-Hinton nutrients (3g beef infusion, 17.5g casein hydrolysate, 1.5g starch, the final product being pH adjusted to neutral at 25°C) while maintaining the agar concentration at 0.94% in the culture media.
- the effect of this depleted-nutrient media formulation on bacterial cell growth was evaluated with more than 50 strains of Pseudomonas in the presence of a panel of beta-lactam antibiotics. Cells were imaged using automated microscopy as described above. Exemplary results are shown in FIGS.
- FIGS. 85A-F in which Pseudomonas strains were grown in nutrient-depleted media in the presence of a piperacillin/tazobactam antibiotic combination
- FIGS. 85A-B demonstrates the effect the antibiotic combination on bacterial growth in a medium having an approximately 87% reduction in Mueller-Hinton nutrients, compared to growth in standard Mueller-Hinton media as shown in FIG. 85C .
- FIGS.85A-C plots the log of bacterial dark phase intensity versus time, which is proportional to measuring cell mass in culture.
- FIGS. 85D-F are a quantitative representation of the data presented in panels FIGS. 85A-C expressed as rate of bacterial cell division.
- the light colored line in FIG. 85C is generally straight over most of the time course, indicating normal bacterial replication with a small bit of variation in the tail end.
- the light colored lines in FIGS. 85A-B are curved with a high degree of variability, indicative of impaired replication.
- FIGS. 85D-F bacterial growth at 2 hours, 3 hours and 3.5 hours is depicted graphically.
- Bacterial cells grown in depleted nutrient media ( FIGS. 85D-E ) demonstrated great variability in the presence of antibiotics between 2 hours and 3.5 hours of exposure, whereas little variability was exhibited by cells replicating in nutrient-rich media ( FIG. 85F ).
- the new medium formulation was evaluated with at least 50 strains each of Serratia or Streptococcus in the presence of various antibiotics.
- Serratia isolates were tested with piperacillin/tazobactam, Aztreonam, Cefepime, and Ceftazidime.
- For Streptococcus pneumoniae the growth response of the isolates along with the following antibiotics were tested, Cefrtiaxone, Erythromycin, Levofloxacin, Penicillin.
- the disclosed system rapidly and accurately informed users of the susceptibility growth patterns of Serratia without experiencing delayed or slow growth typical of this bacteria.
- Fastidious Streptococcus strains showed healthy growth in the new medium without added blood components and were rapidly evaluated with the disclosed system.
- the combination of customized phytone tryptose Mueller-Hinton Agar with the disclosed system technologies provides a means for quickly obtaining the minimal inhibitory concentrations of various antibiotics that are effective against Serratia and Streptococcus species.
- This customized media approach should aid in the accurate susceptibility testing of other fastidious microorganisms (including but not limited to Neisseria gonorrhoeae, Bordatella pertussis, Haemohilus influenzae, Campylobacter spp., or Helicobacter spp.).
- the disclosure provides an improvement in fluorescence identification of unknown microorganisms, particularly a mixture of microorganisms, in patient samples using a rapid, massively multiplexed automated single cell microscopy system.
- Traditional microscopy relies upon subjective human evaluation of microbial specimens when looking though a microscope.
- the microscopist identifies microorganisms by assessing objects in a field of view that are recognizable by shape, size, etc.
- a novice microscopist tends to be far less accurate than a highly experienced scientist, who - after reviewing many, many specimens - will have developed a trained eye for recognizing the characteristics of particular microorganisms.
- an automated single cell microscopy system such as the disclosed instrument system
- the accuracy of an automated single cell microscopy system turns on the ability of that system to recognize features characteristic of a given microbe.
- Accurate identification in such a system requires proper training of the system to reflect the same type of experience acquired by a seasoned human microscopist.
- One advantage to using a properly trained automated microscopy system is the efficiency with which it can accurately identify microorganisms in multiple samples in a short period of time.
- a universal probe as a control and one or more target probes in the same analysis.
- the control and target probes can be tagged with different detectable labels that can be co-locally detected on a single microorganism following excitation at different wavelengths.
- the universal control probe will indicate that an object is a microbe (e.g., bacterium or fungi) and the second color probe will identify the species of the microbe.
- a third color probe (three layer system) enables system identification of an object, for example identifying the object as a bacterium, its category, and species.
- Labeled FISH probes may be designed to recognize microorganisms in many ways, including - but not limited to - native and synthetically derived probes that recognize and bind to rRNA sequences in the target organism.
- Some microbial identification tests are commercially available, but do not employ an internal control for each test, which leads to increased levels of inaccuracy.
- examples of the innovative identification process and system disclosed herein provide internal controls for each individual identification test.
- Variation exists to some degree within most - if not all - aspects of biologically-based microbial identification assays. For example, variation may arise between species of bacteria, between bacterial isolates, and within components of a given detection system. Within a detection system, each probe channel may demonstrate signal variation. There may be variable noise, variation from reagents, variation due to temperature shifts, etc., all of which contribute to system variation. Thus, for example, a single bacterial population will exhibit variation and noise within each probe channel of a detection instrument. It is important to ensure robust signal detection from such probes, to quantify how many objects are present in a visual field, and then to determine the confidence with which the probes in question actually bind to target rRNA sequences.
- the identification process disclosed herein takes into account this complex mix of sources that can contribute to microbial misidentification.
- the disclosed system employs probabilistic expectation models of multiple sources of signal and noise during the microbe identification process. This approach 1) ensures that what is being detected is not merely an artifact emitting a signal due to non-specific probe interaction, and 2) discriminates between known and unknown microorganisms.
- the disclosed process and system determines how to account for the milieu of sources of variability that may emanate from a given probe channel. Recognizing and accounting for these variables permits the innovative identification process disclosed herein to be continuously refined during training to incorporate this variation into multiple probabilistic expectation models.
- the disclosed system combines, e.g., signal, noise (for example, background), and crosstalk (such as binding of a species-specific probe to non-target species) data points to inform the system of microbial identification parameters with a certain level of confidence.
- Expectations are constructed in the model such that observations will generate optimal fit. Fitting expectations over a number of queries is the automated system's equivalent of human learning.
- the probabilistic expectation model provides a unified framework for assigning probability scores for a plurality of events that arise during identification assays.
- the disclosed system uses Bayesian techniques to assign weighted probabilities to each answer received based on prior knowledge acquired during training, and (when applicable) previous sample runs. In essence, the system learns what noise and crosstalk look like for each target probe and heavily leverages this knowledge in order to identify a signature signal pattern for each target probe. This combination of bits of pertinent information for decision making by the system permits the distinction between signal, crosstalk and noise. Even the lack of an apparent target signal can produce data indicative of the presence of a microorganism, e.g., one that is not represented by a target probe in the assay panel.
- a human technician by contrast, would likely not recognize this, as they are biased toward identifying positive target probe signals, but not able to assimilate the information present in what might otherwise be considered negative results.
- the outcome is a high degree of both sensitivity and specificity not possible with conventional identification processes.
- the methods and systems herein place more confidence in producing signal than parsing out irrelevant data sources (noise, etc.). Accordingly, the identification process prospectively models noise-connected signals as well as structure noise (e.g., crosstalk, etc.) because noise can be reproducibly measured and yields superior performance results.
- the inventive identification process employs an agglomerative approach to decision making. This decision making methodology subscribes to the notion that with an increasing number of observations of a given population, one approaches a finite point for quantifying important features of objects (e.g., mean, dispersion, etc.).
- the instrument system crafts a normal distribution of microbes in a reference panel, such as a standard panel of bacterial and fungal probes.
- An informed distribution pattern acts like a fingerprint specific for each target organism represented in the panel. If an object fluoresces during a patient sample run that does not fit model expectations, then the system determines that the object is an outlier. In doing so, the system and its operator can tell which experiments worked and which ones did not.
- the goal is 95% accuracy for an identification system
- a microscopist should be able to determine whether the identification system is working by observing probe patterns. If the probes are dim, or are not specific, the microscopist will know based on the expectation model whether the 95% accuracy threshold will be met.
- the trained system can recognize signal patterns that do not fit a microorganism represented in the reference panel, but are not simply noise.
- the system can detect the presence of an off-panel microbe in a sample. That information can then direct a clinician to test the patient sample against additional probes to identify the off-panel organism.
- Bayesian analysis was used to set system accuracy and performance levels. Thus, the total system performance was in view of normal variance and system components adjusted to reach a 95% accuracy level. More particularly, a Bayesian solution is a statement of probability concerning a parameter value given fixed bounds (data). Bayesian reasoning assesses the likelihood of a thing being true in view of the evidence at hand, which is captured in a theorem: p A
- B p B
- This equation provides for the probability of A given B ("p(A
- Bayes theorem in, for example, the microbial identification context, directs that the true likelihood of a microorganism being properly identified in laboratory testing turns on inputting the right data into the identification calculus, as opposed to relying upon intuitive perception.
- the methodology begins with existing prior beliefs in a given subject. These existing beliefs are updated with new information to formulate "posterior" beliefs, which are subsequently used as a foundation for inferential decisions.
- the model enables the accurate detection of multiple microorganisms in a single sample.
- the probabilistic expectation model is built on an expectation for expression of unknown organisms in a patient sample, and can discriminate their signals from noise.
- This process incorporates probabilistic modeling as feedback for experimental design such that overall system performance (via probe selection, etc.) is optimized.
- a key aspect of the model is the creation of a relationship by good estimation of cell counts based on signals, not noise. This is especially important when trying to unmix multiple bacteria in a sample, especially if the proportion of the bacteria in the sample is unknown. Accordingly, accurate identification of bacteria according to aspects of the invention hinge on model driven development, artifact discrimination, and model driven performance.
- the disclosed FISH identification algorithm begins with the development of a large reference dataset from which a given unknown microbial type can be identified based on predictable, known features or parameters characteristic of that microbe.
- FIG. 93A an initial dataset was established in an experimental assay consisting of 17 bacterial probe flow cells plus an acridine orange (AO) control flow cell applied to a blood sample spiked with known bacteria.
- AO acridine orange
- These reference samples were processed in standard fashion and subjected to automated FISH analysis using dark field, green fluorescent (target microbe) and red fluorescent (universal for bacteria and fungi) illumination conditions.
- Three images were captured per site, with 10 to 24 sites per flow cell. The images were processed to identify true expression, defined to be signal-over-background in target/universal probe space per object per flow cell.
- FIG. 94 graphically depicts the distribution of signal emissions plotting target probe detection on the x-axis and universal microbial probe on the y-axis.
- Flow cells containing samples are invariably populated with a milieu of materials in addition to the targeted microbial cells.
- samples may contain contaminants that include - but are not limited to - biological debris (such as ruptured cells, partial cell membranes, etc.) and artifacts (such as bubbles, instrument cassette impurities).
- the sample debris and/or artifacts may generate background noise that will skew quantification unless taken into account during the analysis process.
- This sample debris and/or artifacts compete with signals emitted from targeted microbial cells bound to fluorescently tagged probes, thereby making it difficult to distinguish images of "true" targets from debris and artifacts.
- tagged target cells are "light-starved" increasing signal-to-noise variability over the field of view.
- flow cell cross-talk may arise, such as through cross-hybridization between target probes.
- unknown organisms may be fluorescently tagged by FISH probes due to an overlap of sequences shared with target organisms, and these organisms may not be represented in a reference panel utilized in the experiment.
- a microorganism(s) is present in a sample only in very low concentrations (e.g., ⁇ 10 clones per field of view), then it may be difficult to achieve confident detection of the organism of interest.
- signal-mediated probabilistic expression models may be updated post-hoc to include Bayesian information that can modify priors to ensure accurate probability.
- the algorithm permits instruments to mimic the human learning process to generate a teaching system that conveys what is viewed through the microscope as if viewed by a person. The result is that the error rate decreases with time and then stabilizes at some point due to data from the large reference population being enhanced by patient sampling data, which is a feature of agglomerative decision theory, as noted previously.
- the process typically begins with quantifying a "normal” or baseline expression of target microorganisms and/or probes in a reference sample subjected to analysis.
- This aspect of the analysis process generates models for use in evaluation of subsequent sample observations.
- the cross-talk expression of probes is quantified to account for noise that would impair the accuracy of the microbial discrimination/identification analysis.
- Such cross-talk related noise may arise from numerous sources, including - but not limited to - off-target "noise” and background/process “noise.” Quantification of the "normal” expression of target organisms together with the quantification of cross-talk expression of probes permits generalization for polymicrobial expression interpretation of samples.
- the identification of microorganisms from patient samples can be accomplished in about an hour once an aliquot of is loaded into the disclosed instrument for analysis.
- the exemplary Enterobacter distribution panel of FIG. 93A demonstrates that with proper system training and the use of appropriately specific probes, the disclosed system was able to craft a probability density function ("PDF") that behaves as an expression "fingerprint" for identifying Enterobacter bacteria in a patient sample.
- PDF probability density function
- the process further comprises:
- FIG. 93B is a flowchart of an exemplary method for the identification algorithm.
- image 9312 is a dark field image
- images 9314, 9316 are two different fluorescent images using light sources of different wavelengths.
- image acquisition occurs with at least three modes of illumination.
- different laser diodes can be used to generate the fluorescent signals
- the dark field image can be generated using a broadband LED.
- the images are input into an image processing stack 9320, which extracts features for a plurality of objects in the images.
- Example features include shape features, intensity, orientation, fluorescent channel matching, etc.
- the image processing stack 9320 generates an object/features matrix table 9330, which describes each of the features found for all objects in the flow cells. Based on the features found, some of the objects can be filtered as known noise, debris, etc. in module 9340.
- the remaining objects/features are compared in parallel to multiple models, shown generally at 9350.
- the multiple models 9350 take into account signal, noise and cross-talk information for each of the dark field and fluorescent imaging wavelengths.
- the models 9350 are generated as described below and can be based on past observations of known microorganisms.
- the models are associated with expectations of features attributable to known microorganisms and represent statistical models that take into account variability that arises through observations of large populations of cells. Such observations are used to train the models so that probabilities can be determined from the models during cell identification.
- the signal information relates to the intensity of light from probes attached to the imaged objects.
- the noise information can be defined as background signal, for example, due to binding of a detectably labeled probe or nucleic acid dye to non-nucleic acid components in a sample, such as debris.
- Noise also includes background signal in a field of view (for example, fluorescence in a field of view containing a detectably labeled probe but no biological sample).
- the cross-talk signal relates to how the presence of other organisms in other channels impacts the organism being identified.
- the cross-talk can be associated with non-specific probe binding and is a repeatable signal that is modeled. More specifically, cross-talk includes hybridization of a detectably labeled species-specific probe to a non-target microorganism (also referred to as non-specific binding or non-specific hybridization).
- Cross-talk can occur when a species-specific probe hybridizes non-specifically or at a lower stringency (for example, lower Tm) to a non-target microorganism, such as a microorganisms that is relatively closely related to the target microorganism.
- a species-specific probe hybridizes non-specifically or at a lower stringency (for example, lower Tm) to a non-target microorganism, such as a microorganisms that is relatively closely related to the target microorganism.
- a species-specific probe hybridizes non-specifically or at a lower stringency (for example, lower Tm) to a non-target microorganism, such as a microorganisms that is relatively closely related to the target microorganism.
- an E. coli species-specific probe may also hybridize to a lesser extent to related microorganisms, such as Citrobacter spp.
- the models 9350 are coupled in parallel to a target presence module 9360 that computes a probability distribution for signal (S i ), noise (N;) and cross-talk (C;) for each object identified. Additionally, module 9360 determines a quantity of objects that meet thresholds for satisfying each of the signal, noise and cross-talk models. If module 9360 determines that there is a low-probability of a signal and cross-talk, then identification for the object of interest has not succeeded and control is passed to module 9370, which determines an off-panel presence.
- the off-panel presence module receives a nucleic acid stain signal (such as an acridine orange control 9372) and can definitively determine whether or not an organism is present that is not on the panel.
- module 9360 If a target is identified in module 9360, off-panel presence can still be determined at module 9380, which also receives the acridine orange control 9372.
- the output of module 9380 is the identified target plus any off-panel presence information, or just the target if no further off-panel information is provided.
- image acquisition occurs for at least three modes of illumination, including multiple fluorescent modes and a dark field mode for a single cell.
- Additional controls such as a non-specific nucleic acid stain (for example, acridine orange) image can be used.
- Imaging a target probe with imaging any other optical control such as dark field imaging and/or imaging of a universal probe, can be used on a per-cell level in the identification process described herein.
- Cell-specific control with multiple modes of illumination at the same field of view and same resolution and modeling for signal, noise and cross-talk provides optimal identification of the cells, as well as definitively concluding that a cell is present, as well as that a cell is not present.
- one channel can be determined positive for a specific microorganism (such as E.
- target information and non-target information such as noise and cross-talk
- the individual probabilities of the signal, cross-talk and noise combine to maximize the probability of proper identification.
- An aspect of various examples employing the probabilistic model using Bayesian analysis is the determination of the likelihood per expression for each probe. The process directs the evaluation of some posterior quality per probe according to the formula: L i ⁇ ⁇ P
- the FISH identification algorithmic process uses fairly robust methods for building expectations. Identification of organisms can be made utilizing various characteristics, such as bacteria-specific morphology features.
- the characteristic variables measured are not necessarily orthogonal, thus requiring full Bayesian formulation.
- the assessment may be increased by one or two more dimensions, if the additional data points will improve microbe discrimination.
- Population-based metrics have a requirement of a higher minimum clone count per flow cell. In one example, the overall minimum limit of detection is 12 cells per flow cell. In other examples, methods were employed for thresholding at 50 ⁇ count ⁇ 150 experiments.
- Intra-channel "polymicrobial populations” can be a confounding factor in identifying microbial entities in a patient sample.
- Process and/or fluidics artifacts can lead to sub-populations within a flow cell, meaning that off-panel organisms can produce additional expressing populations.
- Posterior PDF estimates allow for detection of multiple sub-populations (Gaussian Mixture Models or the like are employed).
- a Gaussian mixture model is a probabilistic statistical model that assumes all data points pertinent to an analysis are generated from a mixture of a finite number of Gaussian distributions with unknown parameters.
- the Gaussian mixture model is a semiparametric approach to density estimation based on the use of a model that best fits the input data.
- Various estimations of Gaussian mixture models may be crafted to correspond to different estimation strategies.
- a Gaussian Mixture Model object may implement an Expectation-Maximization (EM) or Maximum Likelihood Estimation algorithm for fitting a mixture of Gaussian models and determining model parameters. It can also draw confidence ellipsoids for multivariate models, and compute the Bayesian Information Criterion to assess the number of clusters in the data.
- EM Expectation-Maximization
- a Gaussian Mixture Model learns from a training data set to find the probability density function of a data set based on the criteria found in images acquired from the training set.
- the mean and standard deviation of each descriptor may be obtained from a large sampling population and then the assumption of that the descriptor will be approximated by Gaussian distribution. In this case, objects in a sample field of view whose descriptors are lower than 3 standard deviations of the mean will be rejected.
- the method can assign to each sample the class of the Gaussian it mostly probably belongs to using a Gaussian Mixture Model "predict" method.
- Gaussian Mixture Models come with different options to constrain the covariance of the different classes estimated. This class approach allows for easier evaluation of, sampling from, and maximum-likelihood estimation of the parameters of a Gaussian Mixture Model distribution.
- FIG. 93C is a flowchart of a method for identifying a target microorganism.
- process block 9385 multiple images are captured using a camera of an object using different modalities of light. The different modalities can include different wavelengths of light.
- process block 9387 features of the objects identified can be determined. Typically, the hardware components in FIG. 101 are used to perform such a determination, which can be embedded on the control board 321. Features can include shape, orientation, intensity, etc.
- a plurality of models are provided based on signals, noise and/or cross-talk. The models can include only signals and noise or signals and cross-talk.
- the models can be stored in memory, such as memory 10120 or 10125.
- the models can further be stored in storage 10140.
- a probability distribution is calculated for a signal and at least one of the noise or cross-talk.
- the probability distribution can be computed using the central processing unit 10110 or the graphics processing unit 10115.
- a determination is made whether or not the microorganism is present in at least one of the captured multiple images using the calculated probability distribution. Such a determination can be made using the computing environment 10100.
- FIG. 94 takes the expression data presented in FIG. 93A and presents it as bivariate PDF patterns for each of the microorganisms tested.
- the PDF patterns were "learned" by the disclosed system independent of bias and provide a reliable expectation of how these microbes would respond to probes tested against an unknown patient sample.
- the disclosed system applies an empirical threshold value for matching the signal pattern of an unknown microorganism with the PDF of a panel probe.
- some of the PDF patterns are highly skewed along the y-axis, whereas others are highly aligned along the x-axis. Dead center of each ellipse is colored deep red, which indicates the location of the majority of signal distribution for each microorganism tested.
- the Enterobacter sample (framed in a black rectangle in FIG. 94 ) shows a balanced Log-Normal distribution.
- variability in microbial identification can arise from multiple sources, including (but not limited to), probes, instruments, reagents, and the like, which can shift a sample reading to outlier status. These sources of variability were taken into account when performing test runs while developing the training data set. Test runs were performed on multiple instruments in order to observe normal between-instrument variability. Readings outside of normal values were rejected. Initial instrument training began with between approximately 50 and 466 isolates per species of microorganism. The second set of training runs utilized about 25 isolates per species of microorganism. Training of the automated instrument was undertaken to generate a Maximum Likelihood Estimation ("MLE”) which incorporates values that maximize the likelihood function given a set of observed data.
- MLE Maximum Likelihood Estimation
- the MLE was intended to estimate expression patterns of fluorescently tagged bacteria and fungi using observational data from the reference panel of microorganisms.
- the primary goal of modeling is to deduce the form of the underlying process by testing the viability of a model.
- the model is tested by evaluating the goodness of fit of observed data, i.e., assessing how well the model fits the observed data. Goodness of fit is measured by parameter estimation, which entails finding the parameter values of a model that best fit the observed data.
- FIG. 95 multiple test runs of Enterobacter samples were performed to generate distribution patterns during instrument training.
- the graphs plot target signal distribution on the x-axis against universal probe signal distribution along the y-axis.
- the pink spots represent noise which is used in the calculus for modeling signal.
- the MLE calculation involved combining the estimated likelihood of an occurrence being present for the distribution patterns for Enterobacter.
- a subset of the estimated 466 total experiments used for training the instrument were combined to craft the MLE for each probe.
- the ENT "model" (delineated as MENT) was created.
- posterior distribution of the Enterobacter training is: p M
- Fg , Fr p ( Fg Fr
- p( ⁇ Fg,Fr ⁇ ) is a normalizing constant representing all possible expressions over the parameter space involved.
- MAP Maximum-a-Posteriori
- the inventive process assigns a probability as to whether probe binding by microorganisms in a patient sample will match that of known microorganisms in a reference panel. Identification of pathogens using this process is based on a combination of posterior probabilities from multiple flow channels.
- a probability model can be "finalized” based on a given training regimen, the process can continue to monitor microorganism identification data to augment posterior beliefs of the probes used, permitting continual evaluation of expectations - and thus the identification models based on those expectations.
- This provides user confidence for augmenting the system with new probes to address newly developed variability should it arise.
- an identification expectation model was developed using a reference panel of bacteria and fungi that included 90% of blood pathogens, creating a great knowledge base. Microscopists using this model know what the majority of pathogenic blood microbes look like in the inventive system, and provides confidence that testing for these pathogens using this system is both sensitive and specific. But there is room for improving the expectation models should new bacterial strains arise.
- Enterobacter modeling is presented as an exemplary case, but the principles apply equally to any probe for microbes in the reference panel.
- a good match case is illustrated in FIG. 96 , in which model fit was 0.94 (94%).
- the left upper panel of FIG. 96 is a graphic that shows fluorescing microbial cells detected by the system. As before, the x-axis plots target probe signal distribution, while the y-axis plots universal probe signal distribution. The right panel of FIG.
- 96 adds a colored probability scale to the graphic, in which 0 indicates no probability of Enterobacter being present (noise, as depicted by white dots in the elliptical pattern) and 1.0 representing a 100% probability of the presence of Enterobacter (as depicted by black dots in the elliptical pattern).
- a small tail is evident toward the graph origin, which is noise (not present in dark field) and therefore is not counted toward signal.
- Experimental evaluation assessed cell signal against kernel density, which approached nearly 100% probability.
- a kernel density estimation is a fundamental data smoothing tool useful where inferences are made about a population in light of a finite data sample. Kernel modeling takes the posterior distribution and provides a PDF, from which a Maximum-a-Posteriori estimate may be derived.
- Kernel modeling will scan across an entire histogram and the observation is assigned a value of 1; the PDF must then integrate to 1 to fill in gaps, as shown in the bottom right histogram of FIG. 96 . Because the innovative process uses a kernel density estimation on a posterior distribution - as opposed to, for example, raw input data - the system can compare probability for experiments having varying sample population densities.
- FIG. 97 depicts the probability model for a less robust Enterobacter test, which generated a model fit at 0.74 (74%).
- the data points are fairly confined to a specific region of the expected distribution pattern, but are sparse, and therefore gaps exist in the ellipse.
- Kernel modeling as noted above, provided a posterior PDF distribution and a PDF, which is particularly useful when data points are sparse in a given model. It normalizes for cells by evaluating and filling in gaps assuming local Gaussian distribution. This gap filling essentially permits the genesis of continuous space for data that needs to be fit to a model.
- the root cause of the scarce data may be due to problems such as dimmer isolates or a shift in the entire operating point (high background is one dimension, etc.).
- a compact model of Enterobacter signal distribution has a lower score of 0.64 (64%) than the more robust model depicted in FIG. 95 . Nonetheless, the compact model exhibited more bacterial data points than were present in, for example, the "scarce' model of FIG. 97 .
- FIG. 99 shows an example of a "not-so-good" case of this type of modeling, with an MAP estimate of 0.13 (13%).
- the data points are skewed toward the 0,0 origin and there were not enough points to fill most of the elliptical patterning space. This may be due to few or even no target cells being present, meaning that most of the "signal" is actually noise or artifacts.
- Multiplexed automated digital microscopy uses a multichannel test cassette and cell immobilization to enable microscopy-based, single-cell analysis for organism identification in about one (1) hour and antimicrobial susceptibility testing in about five (5) hours directly from clinical specimens.
- Bacterial and fungal (yeast) cell-by-cell identification was performed using fluorescence in situ hybridization.
- Susceptibility reports were generated by digital microscopic observation of individual, live, growing immobilized microbial cells in near real-time (approximately every 10 minutes) in the presence of antimicrobial agents.
- Antimicrobials for susceptibility testing were selected based on the organism identification result.
- Organisms that were not identified by a specific FISH assay were reported as detected but not identified, and susceptibility testing was not performed on these microbes.
- the technology enables the analysis of polymicrobial specimens, and an integrated, automated sample preparation process was developed for certain specimen types. The general process flow for a fully automated system is illustrated in FIG. 86 .
- EKC Electrokinetic Concentration
- a multichannel test cassette composed of a transparent glass bottom and plastic top that is molded to form parallel flowcell channels was used.
- the top and bottom surfaces of each flowcell channel were coated with a layer of conductive indium tin oxide (ITO) that serves as electrodes.
- ITO conductive indium tin oxide
- the bottom surface has an additional cationic poly-L-lysine layer that acts as a capture surface.
- Inoculum was added to the flowcell and a low voltage briefly applied that caused negatively-charged bacterial and yeast cells to migrate to the lower surface where they were captured, and ready to undergo identification or antimicrobial susceptibility testing ( FIG. 88 ).
- a FISH assay was performed for identification. Following permeabilization and washing steps, cocktails of ATTO-532 (green) fluorescently labeled DNA probe(s) designed to bind to the rRNA of each identification target were added to different flowcells. Each cocktail also contained an ATTO-647 (red) labeled universal microbial probe capable of binding bacterial or yeast cells. The universal microbial probe binds to rRNA of all bacterial and yeast cells, thereby identifying the presence of such cells even if they are not recognized by target probes. This aids in the detection of off-panel microorganisms in biological samples. Each microfluidic flowcell was imaged using an epifluorescence microscope with a camera at 532 nm, 647 nm and in dark-field.
- custom image analysis software measured the signal-to-background ratio for each fluorescent and dark-field object in each microfluidic flowcell. To exclude debris, only dark-field objects co-localized with universal probe signal were included in the analysis. Co-localization of target probe signal and universal probe signal identified a target organism ( FIG. 89 ).
- the software can also be used to quantitate the number of objects in a flowcell.
- a universal nucleic acid stain e.g ., acridine orange, propidium iodide, or DAPI
- DAPI digital image analysis
- the results of the identification assay drive antibiotic selection for antimicrobial susceptibility testing.
- the remaining samples undergo a pre-growth step to normalize growth rates during the approximately 1-hour FISH ID assay.
- the concentration of organisms in the purified inoculum was determined by repeating the quantitation process with a universal nucleic acid stain as previously described herein. Based on these results, additional flowcells were filled with the purified inoculum subjected to dynamic dilution to the appropriate target range for antimicrobial susceptibility testing. Following cell immobilization, antimicrobial solutions in Mueller-Hinton agar were dispensed into the flowcells. Different antimicrobials were tested in separate flowcells, and only a single concentration of each antimicrobial was used.
- a growth control consisting of Mueller-Hinton agar without any antimicrobial was included for each run.
- a dark-field microscope and camera produced time-lapse images approximately every 10 minutes of progenitor cells growing into clones of daughter cells in each flowcell.
- the agar ensured daughter cells were immobilized and remained localized to each growing clone. Resistant clones grew while susceptible clones arrest or lyse over time ( FIG. 90 ).
- Custom image analysis software assigned unique spatial XY coordinates to individual progenitor cells ( FIG. 91 ), allowing each growing clone across a series of time-lapse images to be identified.
- the intensity of each clone can be used as a metric of clone mass in each image. By measuring over time, this metric was used to generate growth curves for each individual clone ( FIG. 92 ).
- the pattern of cell responses was used to determine the susceptibility of the overall population.
- Computer algorithms developed for each organism-antimicrobial combination convert microbial growth response into an MIC value using a mathematical regression model based on the response of isolates with known MICs for a single-concentration of a given antimicrobial.
- MIC values were interpreted using FDA, CLSI or EUCAST breakpoints along with expert rules to determine the categorical result (susceptible (S), intermediate (I) or resistant (R)). In addition to MICs, this technique was applied to phenotypic resistance mechanism detection.
- the determination of antimicrobial susceptibility may further comprise subjecting identified microorganisms to antimicrobial susceptibility analysis, wherein the microorganisms are grown in Mueller Hinton nutrient-depleted media to differentiate antimicrobial-resistant cells from filamentous, antimicrobial-susceptible cells within about 12 hours of growth.
- fastidious microorganisms are grown in 1% phytone tryptose Mueller Hinton Agar for determination of antimicrobial susceptibility and/or minimum inhibitory concentration of antimicrobials.
- FISH ID was performed in several different flowcells.
- Target channels enabled the identification of multiple target species as well as the detection of non-target species in polymicrobial samples.
- Antimicrobial susceptibility testing was performed on up to two target organisms in the same sample.
- Cell morphokinetic image analysis was used for species recognition in polymicrobial infections, and enabled the analysis software to assign an MIC to each species during AST testing. Morphokinetic features including cell morphology ( FIG. 93A ), division rates, growth patterns and signal intensity were used to distinguish organism species.
- Quantitative FISH assay results provided an estimation of the relative abundance of multiple species in polymicrobial samples so both species can be diluted to the appropriate concentration for AST testing in the same test run. However, if dilution of one species causes the other species to be out of range, only the AST results for the in-range species was reported. In addition, if morphokinetic features were insufficient to distinguish multiple species from one another, MIC values were not reported, and additional susceptibility testing was required.
- Organism Antibiotic Essential Agreement Staphylococcus aureus Doxycycline 45/47 (96%) Staphylococcus aureus Ceftaroline 43/44 (98%) Streptococcus pneumoniae Penicillin 27/28 (96%) Streptococcus pneumoniae Ceftriaxone 18/19 (95%) Enterococcus spp. Ampicillin 43/45 (96%) Enterococcus spp. Vancomycin 44/48 (92%) Enterococcus spp.
- FIG. 101 depicts a generalized example of a suitable computing environment 10100 in which the described innovations may be implemented.
- the computing environment 10100 is not intended to suggest any limitation as to scope of use or functionality, as the innovations may be implemented in diverse general-purpose or special-purpose computing systems.
- the computing environment 10100 can be any of a variety of computing devices (e.g., desktop computer, laptop computer, server computer, tablet computer, etc.)
- the computing environment 10100 can be part of the control board 321 of FIG. 3 .
- the computing environment 10100 includes one or more processing units 10110, 10115 and memory 10120, 10125.
- this basic configuration 10130 is included within a dashed line.
- the processing units 10110, 10115 execute computer-executable instructions.
- a processing unit can be a general-purpose central processing unit (CPU), processor in an application-specific integrated circuit (ASIC) or any other type of processor.
- ASIC application-specific integrated circuit
- FIG. 101 shows a central processing unit 10110 as well as a graphics processing unit or co-processing unit 10115.
- the tangible memory 10120, 10125 may be volatile memory (e.g., registers, cache, RAM), non-volatile memory (e.g., ROM, EEPROM, flash memory, etc.), or some combination of the two, accessible by the processing unit(s).
- the memory 10120, 10125 stores software 10180 implementing one or more innovations described herein, in the form of computer-executable instructions suitable for execution by the processing unit(s).
- computing environment 10100 can be a system controller attached to an instrument and operable to control the instrument.
- a computing system may have additional features.
- the computing environment 10100 includes storage 10140, one or more input devices 10150, one or more output devices 10160, and one or more communication connections 10170.
- An interconnection mechanism such as a bus, controller, or network interconnects the components of the computing environment 10100.
- operating system software (not shown) provides an operating environment for other software executing in the computing environment 10100, and coordinates activities of the components of the computing environment 10100.
- the tangible storage 10140 may be removable or non-removable, and includes magnetic disks, magnetic tapes or cassettes, CD-ROMs, DVDs, or any other medium which can be used to store information in a non-transitory way and which can be accessed within the computing environment 10100.
- the storage 10140 stores instructions for the software 10180 implementing one or more innovations described herein.
- the input device(s) 10150 may be a touch input device such as a keyboard, mouse, pen, or trackball, a voice input device, a scanning device, or another device that provides input to the computing environment 10100.
- the output device(s) 10160 may be a display, printer, speaker, CD-writer, or another device that provides output from the computing environment 10100.
- the communication connection(s) 10170 enable communication over a communication medium to another computing entity.
- the communication medium conveys information such as computer-executable instructions, audio or video input or output, or other data in a modulated data signal.
- a modulated data signal is a signal that has one or more of its characteristics set or changed in such a manner as to encode information in the signal.
- communication media can use an electrical, optical, RF, or other carrier.
- a reagent cartridge designed for patient sample testing was removed from refrigerated storage.
- the empty patient sample vial was removed from the cartridge and discarded, as Quality Control components were used in lieu of patient sample material during the QC test run.
- An antimicrobial susceptibility test QC assay consumable insert (AST QC assay insert) in a "pi" configuration was removed from -70°C storage.
- AST QC assay insert an antimicrobial susceptibility test QC assay consumable insert in a "pi" configuration was removed from -70°C storage.
- AST QC assay insert Using the top edge of the AST QC assay insert, a post and top edge clips were guided into holes located on the reagent cartridge just above the semi-circle location typically occupied by a sample vial. Thereafter, the bottom edge of the AST QC insert was pressed until clips on the bottom of the insert snapped into place within the sample vial location on the reagent cartridge.
- the AST QC test insert was seated level
- an ID QC assay insert was removed from refrigerated storage and was positioned adjacent to the AST QC assay insert that was previously attached to the reagent cartridge.
- the "E" configuration of the ID QC assay insert complemented the "pi" configuration of the AST QC assay insert, allowing the center post and edges of the ID QC assay consumable to be pressed into place.
- Security clips on the ID QC assay insert were engaged on the AST QC assay insert.
- a foil seal covering the reagent wells on the ID QC assay insert remained intact during the attachment process; the foil seal was pierced by the instrument when interacting with the reagents contained therein. Barcode tabs from each QC insert aligned vertically such that the barcodes on these tabs were on top of one another.
- a cassette was removed from its packaging and was nested in the center of the AD-1 Instrument.
- the protective cover was removed from the pipette tips section of the reagent cartridge containing the AST and ID QC assay inserts; thereafter, the reagent cartridge was inserted into the AD-1 Instrument.
- the instrument start button was pressed, at which point the instrument read the barcodes identifying the AST and ID inserts, and then automatically initiated the QC run.
- the ID portion of the automated QC assay consisted of testing both frozen isolates and target beads with sequences that are specific to each probe cocktail tested.
- the frozen isolates ( Candida albicans and Staphylococcus aureus ) were located in the AST component of the consumable QC insert (wells 18 and 25 in the dark gray shaded "pi" shaped aspect of FIG. 108 ).
- These frozen isolates tested the functionality of tris (2-carboxyethyl) phosphoine ("TCEP”) and gel electro filtration components of the AD-1 Instrument System using C. albicans, and the enzymes were tested using S. aureus. Each isolate was also tested with its respective probe cocktail.
- the target beads were located in the ID component (E-shaped) portion of the consumable QC insert, as depicted in light gray shading in FIG. 108 .
- Eleven wells in the E-shaped aspect of the QC insert contained a total of 14 different target beads.
- Three wells (wells 1, 3, and 4) contained two sets of target beads in each well. All other wells contained a single target bead. This configuration reflects the limited space afforded in this particular QC insert, but may not be necessary for other QC insert designs. All beads, except for the KLE/CNS beads (well 1), were tested independently in different flowcells (FC).
- well 3 in FIG. 108 contained both EFM and CGL target beads. The contents from this well were loaded into flowcells 23 and 29.
- Flowcell 23 was treated with the EFM probe cocktail, while flowcell 29 was treated with the CGL cocktail.
- Table 8 depicts the cassette layout and probes tested. For the wells containing multiple target beads, the QC insert layout was designed to match the ID assay conditions for both target beads present in each of those wells. Table 8.
- the AST QC consumable insert consisted of 8 wells configured in a "pi" shape, as shown in the dark gray shading in FIG. 109 .
- the AST QC panel was composed of seven CLSI recommended isolates that provide "on-scale” MIC results for all of the antimicrobial agents included in a sample blood culture test.
- a C. albicans isolate was used for Quality Control assessment of the gel electrophoresis component of the AD-1 Instrument System.
- Table 9 lists each organism and the corresponding antimicrobial agent that was tested in the AST QC assay. All isolates were simultaneously tested in a single run by loading the AST QC insert containing pre-prepared 1 McFarland frozen isolates. The instrument ran the QC-specific program that directed the addition of various organism suspensions to specific flow cells containing corresponding antimicrobial agents. At the conclusion of the run, a report was generated listing the MIC values (or interpretation for phenotypic positive/negative tests), the expected result, and a pass/fail outcome for each antimicrobial agent. These results are presented below in Tables 10 and 11. Cells with shading used a concentration of antimicrobial agent that is different from that which is used for patient testing. This approach is consistent with industry practice of using extended dilutions of antimicrobial agents to cover QC organisms.
- Any of the disclosed methods can be implemented as computer-executable instructions stored on one or more computer-readable storage media (e.g., one or more optical media discs, volatile memory components (such as DRAM or SRAM), or non-volatile memory components (such as flash memory or hard drives)) and executed on a computer (e.g., any commercially available computer, including smart phones or other mobile devices that include computing hardware).
- a computer e.g., any commercially available computer, including smart phones or other mobile devices that include computing hardware.
- the term computer-readable storage media does not include communication connections, such as signals and carrier waves.
- Any of the computer-executable instructions for implementing the disclosed techniques as well as any data created and used during implementation of the disclosed embodiments can be stored on one or more computer-readable storage media.
- the computer-executable instructions can be part of, for example, a dedicated software application or a software application that is accessed or downloaded via a web browser or other software application (such as a remote computing application).
- Such software can be executed, for example, on a single local computer (e.g., any suitable commercially available computer) or in a network environment (e.g., via the Internet, a wide-area network, a local-area network, a client-server network (such as a cloud computing network), or other such network) using one or more network computers.
- any functionality described herein can be performed, at least in part, by one or more hardware logic components, instead of software.
- illustrative types of hardware logic components include Field-programmable Gate Arrays (FPGAs), Application-specific Integrated Circuits (ASICs), Program-specific Standard Products (ASSPs), System-on-a-chip systems (SOCs), Complex Programmable Logic Devices (CPLDs), etc.
- any of the software-based examples can be uploaded, downloaded, or remotely accessed through a suitable communication means.
- suitable communication means include, for example, the Internet, the World Wide Web, an intranet, software applications, cable (including fiber optic cable), magnetic communications, electromagnetic communications (including RF, microwave, and infrared communications), electronic communications, or other such communication means.
- references to "one embodiment,” “an embodiment,” “an example embodiment,” etc. indicate that the embodiment described may include a particular feature, structure, or characteristic, but every embodiment may not necessarily include the particular feature, structure, or characteristic. Moreover, such phrases are not necessarily referring to the same embodiment. Further, when a particular feature, structure, or characteristic is described in connection with an embodiment, it is submitted that it is within the knowledge of one skilled in the art to affect such feature, structure, or characteristic in connection with other embodiments whether or not explicitly described. After reading the description, it will be apparent to one skilled in the relevant art(s) how to implement the disclosure in alternative embodiments.
- the terms "comprises,” “comprising,” or any other variation thereof, are intended to cover a non-exclusive inclusion, such that a process, method, article, or apparatus that comprises a list of elements does not include only those elements but may include other elements not expressly listed or inherent to such process, method, article, or apparatus.
Landscapes
- Chemical & Material Sciences (AREA)
- Health & Medical Sciences (AREA)
- Life Sciences & Earth Sciences (AREA)
- Engineering & Computer Science (AREA)
- Analytical Chemistry (AREA)
- Biochemistry (AREA)
- General Health & Medical Sciences (AREA)
- Physics & Mathematics (AREA)
- Immunology (AREA)
- Organic Chemistry (AREA)
- Pathology (AREA)
- General Physics & Mathematics (AREA)
- Wood Science & Technology (AREA)
- Proteomics, Peptides & Aminoacids (AREA)
- Quality & Reliability (AREA)
- Zoology (AREA)
- Clinical Laboratory Science (AREA)
- Biophysics (AREA)
- Biotechnology (AREA)
- Microbiology (AREA)
- Molecular Biology (AREA)
- Chemical Kinetics & Catalysis (AREA)
- Medicinal Chemistry (AREA)
- Toxicology (AREA)
- Bioinformatics & Cheminformatics (AREA)
- General Engineering & Computer Science (AREA)
- Genetics & Genomics (AREA)
- Apparatus Associated With Microorganisms And Enzymes (AREA)
- Measuring Or Testing Involving Enzymes Or Micro-Organisms (AREA)
Claims (14)
- Composant de contrôle qualité (CQ) de test de susceptibilité antibiotique automatique (AST) comprenant :un châssis incluant une pluralité de puits ;au moins une pince fixée au châssis ;un moyen d'identification du composant en tant que test de CQ d'AST par un système automatique, caractérisé en ce que le composant de CQ d'AST comprend en outre au moins un isolat microbien dans au moins l'un de la pluralité de puits, et dans lequel l'au moins une pince inclut au moins une pince qui interagit avec une cartouche de réactif.
- Composant de CQ d'AST selon la revendication 1, dans lequel l'au moins une pince inclut au moins une pince qui interagit avec un composant de CQ d'identification microbienne, et dans lequel la pluralité de puits comprend de préférence de 8 à 12 puits.
- Composant de CQ d'AST selon la revendication 1 ou la revendication 2, dans lequel l'isolat microbien est sélectionné parmi Escherichia coli, Pseudomonas aeruginosa, Enterococcus faecalis, Staphylococcus aureus, et Candida albicans, et de préférence l'E. coli est E. coli ATCC 25922 et/ou E. coli ATCC 35218, Pseudomonas aeruginosa est P. aeruginosa ATCC 27853, Enterococcus faecalis est E. faecalis ATCC 29212, Staphylococcus aureus est S. aureus ATCC 29213, S. aureus ATCC 43300, et/ou S. aureus ATCC BAA-977, et/ou Candida albicans est C. albicans ATCC 96268.
- Composant de contrôle qualité (CQ) d'identification (ID) microbienne automatique, comprenant
un châssis incluant une pluralité de puits ;
au moins une pince fixée au châssis ;
au moins une molécule d'acide nucléique microbienne cible dans au moins l'un de la pluralité de puits, dans lequel le composant de CQ d'ID microbienne est configuré pour avoir une forme complémentaire pour s'enclencher avec un composant de CQ de test de susceptibilité antibiotique selon l'une quelconque des revendications 1 à 3, et
un moyen d'identification du composant en tant que test de CQ d'ID microbienne par un système automatique. - Composant de CQ d'ID microbienne selon la revendication 4, dans lequel l'au moins une pince interagit avec un composant de CQ de test de susceptibilité antibiotique selon l'une quelconque des revendications 1 à 3, et dans lequel la pluralité de puits comprend de préférence 11 à 13 puits.
- Composant de CQ d'ID microbienne selon la revendication 4 ou la revendication 5, dans lequel l'au moins une molécule d'acide nucléique cible provient d'un microbe sélectionné parmi Acinetobacter baumannii, Citrobacter spp., Enterobacter spp., Escherichia coli, Klebsiella spp., Proteus spp., Pseudomonas aeruginosa, Serratia marcescens, Staphylococcus spp. coagulase-négatif, Enterococcus faecalis, Enterococcus faecium, Staphylococcus aureus, Staphylococcus lugdunensis, Streptococcus spp., Candida albicans, et Candida glabrata.
- Composant de CQ d'ID microbienne selon l'une quelconque des revendications 1 à 6, dans lequel le moyen d'identification des composants en tant que composant de CQ d'AST ou composant de CQ d'ID microbienne comprend un code à barres ou une étiquette RFID.
- Kit comprenant un ou plusieurs composants de CQ automatique selon l'une quelconque des revendications 1 à 7.
- Procédé de réalisation d'un test de contrôle qualité (CQ) automatique, comprenant :(a) la fixation du composant de CQ d'AST selon la revendication 1 à une cartouche de réactif, dans lequel la cartouche de réactif comprend :une pluralité de puits comprenant des réactifs ; etune ouverture,dans lequel la pluralité de puits comprenant des réactifs comprennent au moins un puits comprenant une sonde et au moins un puits comprenant un agent antimicrobien ;(b) l'insertion de la cartouche de réactif avec le composant de CQ d'AST fixé dans un système, dans lequel le système comprend :un étage réactif comprenant une forme annulaire définissant une ouverture intérieure, dans lequel l'étage réactif est configuré pour pivoter dans un premier plan et dans lequel l'étage réactif est configuré pour recevoir la cartouche de réactif ;une cassette comprenant une pluralité de canaux d'échantillons microfluidiques structurés pour recevoir des échantillons, chacun des canaux d'échantillons microfluidiques comprenant un orifice d'entrée configuré pour recevoir un embout de pipette ;un étage cassette situé à l'intérieur de l'ouverture de l'étage réactif, dans lequel l'étage cassette est configuré pour pivoter et se déplacer latéralement dans le premier plan, et dans lequel l'étage cassette est configuré pour recevoir la cassette ;un ensemble pipette configuré pour déplacer une pluralité de réactifs entre la pluralité de puits de la cartouche de réactif et les orifices d'entrée de chacun de la pluralité de canaux d'échantillons microfluidiques ;un dispositif de balayage optique configuré pour identifier un composant de CQ ;un système de détection optique configuré pour obtenir des microphotographies sur fond noir et en fluorescence d'un ou plusieurs microorganismes contenus dans la pluralité de canaux d'échantillons microfluidiques ; etun dispositif de commande configuré pour diriger le fonctionnement du système et traiter les informations de microorganismes dérivées des microphotographies obtenues par le système de détection optique ;(c) l'introduction d'un ou plusieurs isolats microbiens à partir du composant de CQ d'AST dans la pluralité de canaux microfluidiques de la cassette du système ;(d) la culture des un ou plusieurs isolats microbiens en présence ou en l'absence d'un ou plusieurs agents antimicrobiens ;(e) la surveillance de la croissance des isolats microbiens dans le temps ;(f) la détermination de la susceptibilité ou de la résistance des un ou plusieurs isolats microbiens aux un ou plusieurs agents antimicrobiens ; et(g) le rapport de la précision de détermination de la résistance ou de la susceptibilité antimicrobienne des isolats microbiens fournie par le système.
- Procédé selon la revendication 9, dans lequel la détermination de la susceptibilité ou de la résistance des un ou plusieurs isolats microbiens aux un ou plusieurs agents antimicrobiens comprend la mesure qualitative ou quantitative de la croissance ou de la lyse des un ou plusieurs isolats microbiens en présence des un ou plusieurs agents antimicrobiens comparé à un témoin qui n'est pas exposé aux agents antimicrobiens et dans lequel les un ou plusieurs agents antimicrobiens comprennent un ou plusieurs de l'amikacine, l'ampicilline, l'ampicilline-sulbactam, l'aztréonam, la céfazoline, le céfépime, la ceftaroline, le ceftazidime, la ceftriaxone, la ciprofloxacine, la colistine, la daptomycine, la doxycycline, l'érythromycine, l'ertapénem, la gentamicine, l'imipénem, le linézolid, le méropénem, la minocycline, la pipéracilline-tazobactam, la tobramycine, le triméthoprime-sulfaméthoxazole et la vancomycine.
- Procédé selon la revendication 9 ou la revendication 10, dans lequel les un ou plusieurs isolats microbiens sont cultivés dans un milieu de Mueller-Hinton pauvre en nutriments ou sont cultivés dans une gélose Mueller-Hinton à 1 % de phytone tryptose.
- Procédé selon la revendication 10 ou la revendication 11, comprenant en outre :(a) la fixation d'un composant de contrôle qualité (CQ) d'identification (ID) microbienne à la cartouche de réactif avant l'insertion de la cartouche de réactif dans le système, dans lequel le composant de CQ d'ID microbienne comprend :un châssis incluant une pluralité de puits ;au moins une pince fixée au châssis ;au moins une molécule d'acide nucléique microbienne cible dans au moins l'un de la pluralité de puits, dans lequel le composant de CQ d'ID microbienne est configuré pour avoir une forme complémentaire pour s'enclencher avec le composant de CQ d'AST ; etun moyen d'identification du composant en tant que test de CQ d'ID microbienne par un système automatique ;(b) l'introduction de l'au moins une molécule d'acide nucléique microbienne cible dans la pluralité de canaux microfluidiques de la cassette ;(c) l'introduction d'une ou plusieurs sondes cibles marquées qui reconnaissent les séquences de l'au moins une molécule d'acide nucléique microbienne cible, et s'y lient, dans l'au moins un de la pluralité de canaux microfluidiques ;(d) l'incubation des sondes marquées avec l'au moins une molécule d'acide nucléique microbienne cible pendant une durée suffisance pour permettre la liaison des sondes aux molécules d'acide nucléique microbiennes cibles ; et(e) la détection d'un signal à partir des une ou plusieurs sondes cibles marquées, dans lequel la présence d'un signal indique un résultat d'ID positif et l'absence d'un signal indique un résultat d'ID négatif ; et(f) la génération d'un rapport de test de CQ d'ID.
- Procédé selon la revendication 12, dans lequel l'au moins une molécule d'acide nucléique microbienne cible est couplée à une microsphère.
- Procédé selon la revendication 12, dans lequel l'au moins une molécule d'acide nucléique microbienne cible est complémentaire d'un acide nucléique d'un ou plusieurs de Staphylococcus aureus, Staphylococcus lugdunensis, les espèces de Staphylococcus coagulase-négatives, Enterococcus faecalis, Enterococcus faecium, Streptococcus pneumoniae, Streptococcus agalactiae, Streptococcus spp., Pseudomonas aeruginosa, Acinetobacter baumannii, Klebsiella spp., Escherichia coli, Enterobacter spp., Proteus spp., Citrobacter spp., Serratia marcescens, Candida albicans et Candida glabrata.
Applications Claiming Priority (1)
| Application Number | Priority Date | Filing Date | Title |
|---|---|---|---|
| US15/283,922 US10253355B2 (en) | 2015-03-30 | 2016-10-03 | Instrument and system for rapid microorganism identification and antimicrobial agent susceptibility testing |
Publications (2)
| Publication Number | Publication Date |
|---|---|
| EP3301454A1 EP3301454A1 (fr) | 2018-04-04 |
| EP3301454B1 true EP3301454B1 (fr) | 2019-08-28 |
Family
ID=57209184
Family Applications (1)
| Application Number | Title | Priority Date | Filing Date |
|---|---|---|---|
| EP16192372.7A Active EP3301454B1 (fr) | 2016-10-03 | 2016-10-05 | Instrument et système d'identification rapide de micro-organismes et de test de susceptibilité d'agent antimicrobien |
Country Status (1)
| Country | Link |
|---|---|
| EP (1) | EP3301454B1 (fr) |
Families Citing this family (12)
| Publication number | Priority date | Publication date | Assignee | Title |
|---|---|---|---|---|
| US20190276871A1 (en) * | 2017-02-03 | 2019-09-12 | SeLux Diagnostics, Inc. | Antimicrobial Cartridges and Processes for Antimicrobial Susceptibility Testing |
| JP2021526813A (ja) * | 2018-06-08 | 2021-10-11 | セルックス・ダイアグノスティクス・インコーポレイテッド | 多重化抗菌薬感受性試験用の抗菌カートリッジ及びプロセス |
| WO2020035767A1 (fr) * | 2018-08-13 | 2020-02-20 | Beckman Coulter Inc. | Instrument de laboratoire pour tester un échantillon de patient |
| EP3859346A4 (fr) * | 2018-09-25 | 2022-06-15 | Kyocera Corporation | Procédé d'introduction d'un échantillon dans un dispositif de traitement d'échantillon |
| CA3115262A1 (fr) * | 2018-10-04 | 2020-04-09 | First Light Diagnostics, Inc. | Detection et analyse de cellules |
| GB201818478D0 (en) | 2018-11-13 | 2018-12-26 | Great North Res & Innovation Ltd | Apparatus |
| CN111753613B (zh) * | 2019-09-18 | 2023-10-10 | 杭州海康威视数字技术股份有限公司 | 基于实验操作的图像分析方法、装置、设备及存储介质 |
| CN111778137B (zh) * | 2020-06-29 | 2023-01-31 | 上海思路迪生物医学科技有限公司 | 一种三自由度文库制备卡盒及方法 |
| WO2023135574A1 (fr) * | 2022-01-14 | 2023-07-20 | Deepull Diagnostics S.L. | Systèmes, procédés et dispositifs de test de sensibilité antimicrobienne |
| CN116058884B (zh) * | 2023-02-02 | 2023-11-14 | 沈苏科技(苏州)股份有限公司 | 一种自动控制采样设备 |
| IL300843A (en) * | 2023-02-21 | 2024-09-01 | Gyntools Ltd | A test system that includes a test device and disposable test assemblies and a method of use for it |
| CN116381264B (zh) * | 2023-04-24 | 2024-09-03 | 中元汇吉生物技术股份有限公司 | 药敏连续加样系统、方法和全自动药敏检测仪 |
Family Cites Families (6)
| Publication number | Priority date | Publication date | Assignee | Title |
|---|---|---|---|---|
| US4877659A (en) * | 1988-08-02 | 1989-10-31 | Inti Corporation | Multiwell assay/culture strip |
| US10288632B2 (en) * | 2009-09-21 | 2019-05-14 | Pocared Diagnostics Ltd. | System for conducting the identification of bacteria in biological samples |
| EP2683831B1 (fr) | 2011-03-07 | 2015-09-23 | Accelerate Diagnostics, Inc. | Systèmes de purification rapide de cellules |
| US10012664B2 (en) * | 2011-09-25 | 2018-07-03 | Theranos Ip Company, Llc | Systems and methods for fluid and component handling |
| EP2820147B1 (fr) * | 2012-02-29 | 2018-08-08 | President and Fellows of Harvard College | Test rapide de sensibilité aux antibiotiques |
| WO2013177277A1 (fr) * | 2012-05-24 | 2013-11-28 | Becton, Dickinson And Company | Concentration microbienne utilisant de l'acide poly-l-glutamique (pga) pour éviter la centrifugation |
-
2016
- 2016-10-05 EP EP16192372.7A patent/EP3301454B1/fr active Active
Non-Patent Citations (1)
| Title |
|---|
| None * |
Also Published As
| Publication number | Publication date |
|---|---|
| EP3301454A1 (fr) | 2018-04-04 |
Similar Documents
| Publication | Publication Date | Title |
|---|---|---|
| US11085064B2 (en) | Instrument and system for rapid microorganism identification and antimicrobial agent susceptibility testing | |
| US10253355B2 (en) | Instrument and system for rapid microorganism identification and antimicrobial agent susceptibility testing | |
| EP3301454B1 (fr) | Instrument et système d'identification rapide de micro-organismes et de test de susceptibilité d'agent antimicrobien | |
| Maquelin et al. | Prospective study of the performance of vibrational spectroscopies for rapid identification of bacterial and fungal pathogens recovered from blood cultures | |
| EP2430461B1 (fr) | Instrument de détection combiné pour récipients à échantillons de culture et instrument pour l'identification et/ou la caractérisation d'un agent microbien dans un échantillon | |
| CA2760982C (fr) | Systeme et procedes d'identification et/ou de caracterisation rapides d'un agent microbien dans un echantillon | |
| CA2942815A1 (fr) | Determination rapide de la croissance microbienne et de la sensibilite antimicrobienne | |
| Song et al. | Mini-review: Recent advances in imaging-based rapid antibiotic susceptibility testing | |
| JP7127033B2 (ja) | デジタル顕微鏡を使用する抗菌剤感受性試験 | |
| US20220282304A1 (en) | Same-sample antibiotic susceptibility test and related compositions, methods and systems | |
| Helleckes et al. | From frozen cell bank to product assay: high-throughput strain characterisation for autonomous Design-Build-Test-Learn cycles | |
| WO2022047683A1 (fr) | Système et procédé de test rapide | |
| Alabdulsalam et al. | EVALUATION OF NEW TECHNOLOGIES FOR RAPID DIAGNOSTIC TESTING IN THE LABORATORY | |
| US20220111380A1 (en) | System and method for target detection with applications in characterizing food quality and improving food safety | |
| US20240247224A1 (en) | System and method for rapid susceptibility testing | |
| Eden | Considerations in the evaluation of rapid microbiological methods |
Legal Events
| Date | Code | Title | Description |
|---|---|---|---|
| PUAI | Public reference made under article 153(3) epc to a published international application that has entered the european phase |
Free format text: ORIGINAL CODE: 0009012 |
|
| STAA | Information on the status of an ep patent application or granted ep patent |
Free format text: STATUS: THE APPLICATION HAS BEEN PUBLISHED |
|
| AK | Designated contracting states |
Kind code of ref document: A1 Designated state(s): AL AT BE BG CH CY CZ DE DK EE ES FI FR GB GR HR HU IE IS IT LI LT LU LV MC MK MT NL NO PL PT RO RS SE SI SK SM TR |
|
| AX | Request for extension of the european patent |
Extension state: BA ME |
|
| STAA | Information on the status of an ep patent application or granted ep patent |
Free format text: STATUS: REQUEST FOR EXAMINATION WAS MADE |
|
| 17P | Request for examination filed |
Effective date: 20180926 |
|
| RBV | Designated contracting states (corrected) |
Designated state(s): AL AT BE BG CH CY CZ DE DK EE ES FI FR GB GR HR HU IE IS IT LI LT LU LV MC MK MT NL NO PL PT RO RS SE SI SK SM TR |
|
| GRAP | Despatch of communication of intention to grant a patent |
Free format text: ORIGINAL CODE: EPIDOSNIGR1 |
|
| STAA | Information on the status of an ep patent application or granted ep patent |
Free format text: STATUS: GRANT OF PATENT IS INTENDED |
|
| INTG | Intention to grant announced |
Effective date: 20190614 |
|
| GRAS | Grant fee paid |
Free format text: ORIGINAL CODE: EPIDOSNIGR3 |
|
| GRAA | (expected) grant |
Free format text: ORIGINAL CODE: 0009210 |
|
| STAA | Information on the status of an ep patent application or granted ep patent |
Free format text: STATUS: THE PATENT HAS BEEN GRANTED |
|
| AK | Designated contracting states |
Kind code of ref document: B1 Designated state(s): AL AT BE BG CH CY CZ DE DK EE ES FI FR GB GR HR HU IE IS IT LI LT LU LV MC MK MT NL NO PL PT RO RS SE SI SK SM TR |
|
| REG | Reference to a national code |
Ref country code: GB Ref legal event code: FG4D |
|
| REG | Reference to a national code |
Ref country code: CH Ref legal event code: EP |
|
| REG | Reference to a national code |
Ref country code: NL Ref legal event code: FP |
|
| REG | Reference to a national code |
Ref country code: AT Ref legal event code: REF Ref document number: 1173048 Country of ref document: AT Kind code of ref document: T Effective date: 20190915 |
|
| REG | Reference to a national code |
Ref country code: IE Ref legal event code: FG4D |
|
| REG | Reference to a national code |
Ref country code: DE Ref legal event code: R096 Ref document number: 602016019305 Country of ref document: DE |
|
| REG | Reference to a national code |
Ref country code: CH Ref legal event code: NV Representative=s name: STOLMAR AND PARTNER INTELLECTUAL PROPERTY S.A., CH |
|
| PGFP | Annual fee paid to national office [announced via postgrant information from national office to epo] |
Ref country code: BE Payment date: 20190917 Year of fee payment: 4 |
|
| REG | Reference to a national code |
Ref country code: LT Ref legal event code: MG4D |
|
| PG25 | Lapsed in a contracting state [announced via postgrant information from national office to epo] |
Ref country code: BG Free format text: LAPSE BECAUSE OF FAILURE TO SUBMIT A TRANSLATION OF THE DESCRIPTION OR TO PAY THE FEE WITHIN THE PRESCRIBED TIME-LIMIT Effective date: 20191128 Ref country code: PT Free format text: LAPSE BECAUSE OF FAILURE TO SUBMIT A TRANSLATION OF THE DESCRIPTION OR TO PAY THE FEE WITHIN THE PRESCRIBED TIME-LIMIT Effective date: 20191230 Ref country code: LT Free format text: LAPSE BECAUSE OF FAILURE TO SUBMIT A TRANSLATION OF THE DESCRIPTION OR TO PAY THE FEE WITHIN THE PRESCRIBED TIME-LIMIT Effective date: 20190828 Ref country code: HR Free format text: LAPSE BECAUSE OF FAILURE TO SUBMIT A TRANSLATION OF THE DESCRIPTION OR TO PAY THE FEE WITHIN THE PRESCRIBED TIME-LIMIT Effective date: 20190828 Ref country code: SE Free format text: LAPSE BECAUSE OF FAILURE TO SUBMIT A TRANSLATION OF THE DESCRIPTION OR TO PAY THE FEE WITHIN THE PRESCRIBED TIME-LIMIT Effective date: 20190828 Ref country code: FI Free format text: LAPSE BECAUSE OF FAILURE TO SUBMIT A TRANSLATION OF THE DESCRIPTION OR TO PAY THE FEE WITHIN THE PRESCRIBED TIME-LIMIT Effective date: 20190828 Ref country code: NO Free format text: LAPSE BECAUSE OF FAILURE TO SUBMIT A TRANSLATION OF THE DESCRIPTION OR TO PAY THE FEE WITHIN THE PRESCRIBED TIME-LIMIT Effective date: 20191128 |
|
| PGFP | Annual fee paid to national office [announced via postgrant information from national office to epo] |
Ref country code: NL Payment date: 20191014 Year of fee payment: 4 |
|
| PG25 | Lapsed in a contracting state [announced via postgrant information from national office to epo] |
Ref country code: ES Free format text: LAPSE BECAUSE OF FAILURE TO SUBMIT A TRANSLATION OF THE DESCRIPTION OR TO PAY THE FEE WITHIN THE PRESCRIBED TIME-LIMIT Effective date: 20190828 Ref country code: RS Free format text: LAPSE BECAUSE OF FAILURE TO SUBMIT A TRANSLATION OF THE DESCRIPTION OR TO PAY THE FEE WITHIN THE PRESCRIBED TIME-LIMIT Effective date: 20190828 Ref country code: IS Free format text: LAPSE BECAUSE OF FAILURE TO SUBMIT A TRANSLATION OF THE DESCRIPTION OR TO PAY THE FEE WITHIN THE PRESCRIBED TIME-LIMIT Effective date: 20191228 Ref country code: GR Free format text: LAPSE BECAUSE OF FAILURE TO SUBMIT A TRANSLATION OF THE DESCRIPTION OR TO PAY THE FEE WITHIN THE PRESCRIBED TIME-LIMIT Effective date: 20191129 Ref country code: LV Free format text: LAPSE BECAUSE OF FAILURE TO SUBMIT A TRANSLATION OF THE DESCRIPTION OR TO PAY THE FEE WITHIN THE PRESCRIBED TIME-LIMIT Effective date: 20190828 Ref country code: AL Free format text: LAPSE BECAUSE OF FAILURE TO SUBMIT A TRANSLATION OF THE DESCRIPTION OR TO PAY THE FEE WITHIN THE PRESCRIBED TIME-LIMIT Effective date: 20190828 |
|
| REG | Reference to a national code |
Ref country code: AT Ref legal event code: MK05 Ref document number: 1173048 Country of ref document: AT Kind code of ref document: T Effective date: 20190828 |
|
| PG25 | Lapsed in a contracting state [announced via postgrant information from national office to epo] |
Ref country code: TR Free format text: LAPSE BECAUSE OF FAILURE TO SUBMIT A TRANSLATION OF THE DESCRIPTION OR TO PAY THE FEE WITHIN THE PRESCRIBED TIME-LIMIT Effective date: 20190828 |
|
| PGFP | Annual fee paid to national office [announced via postgrant information from national office to epo] |
Ref country code: CH Payment date: 20191015 Year of fee payment: 4 |
|
| PG25 | Lapsed in a contracting state [announced via postgrant information from national office to epo] |
Ref country code: IT Free format text: LAPSE BECAUSE OF FAILURE TO SUBMIT A TRANSLATION OF THE DESCRIPTION OR TO PAY THE FEE WITHIN THE PRESCRIBED TIME-LIMIT Effective date: 20190828 Ref country code: RO Free format text: LAPSE BECAUSE OF FAILURE TO SUBMIT A TRANSLATION OF THE DESCRIPTION OR TO PAY THE FEE WITHIN THE PRESCRIBED TIME-LIMIT Effective date: 20190828 Ref country code: EE Free format text: LAPSE BECAUSE OF FAILURE TO SUBMIT A TRANSLATION OF THE DESCRIPTION OR TO PAY THE FEE WITHIN THE PRESCRIBED TIME-LIMIT Effective date: 20190828 Ref country code: DK Free format text: LAPSE BECAUSE OF FAILURE TO SUBMIT A TRANSLATION OF THE DESCRIPTION OR TO PAY THE FEE WITHIN THE PRESCRIBED TIME-LIMIT Effective date: 20190828 Ref country code: AT Free format text: LAPSE BECAUSE OF FAILURE TO SUBMIT A TRANSLATION OF THE DESCRIPTION OR TO PAY THE FEE WITHIN THE PRESCRIBED TIME-LIMIT Effective date: 20190828 Ref country code: PL Free format text: LAPSE BECAUSE OF FAILURE TO SUBMIT A TRANSLATION OF THE DESCRIPTION OR TO PAY THE FEE WITHIN THE PRESCRIBED TIME-LIMIT Effective date: 20190828 |
|
| PG25 | Lapsed in a contracting state [announced via postgrant information from national office to epo] |
Ref country code: SK Free format text: LAPSE BECAUSE OF FAILURE TO SUBMIT A TRANSLATION OF THE DESCRIPTION OR TO PAY THE FEE WITHIN THE PRESCRIBED TIME-LIMIT Effective date: 20190828 Ref country code: IS Free format text: LAPSE BECAUSE OF FAILURE TO SUBMIT A TRANSLATION OF THE DESCRIPTION OR TO PAY THE FEE WITHIN THE PRESCRIBED TIME-LIMIT Effective date: 20200224 Ref country code: MC Free format text: LAPSE BECAUSE OF FAILURE TO SUBMIT A TRANSLATION OF THE DESCRIPTION OR TO PAY THE FEE WITHIN THE PRESCRIBED TIME-LIMIT Effective date: 20190828 Ref country code: SM Free format text: LAPSE BECAUSE OF FAILURE TO SUBMIT A TRANSLATION OF THE DESCRIPTION OR TO PAY THE FEE WITHIN THE PRESCRIBED TIME-LIMIT Effective date: 20190828 Ref country code: CZ Free format text: LAPSE BECAUSE OF FAILURE TO SUBMIT A TRANSLATION OF THE DESCRIPTION OR TO PAY THE FEE WITHIN THE PRESCRIBED TIME-LIMIT Effective date: 20190828 |
|
| REG | Reference to a national code |
Ref country code: DE Ref legal event code: R097 Ref document number: 602016019305 Country of ref document: DE |
|
| PLBE | No opposition filed within time limit |
Free format text: ORIGINAL CODE: 0009261 |
|
| STAA | Information on the status of an ep patent application or granted ep patent |
Free format text: STATUS: NO OPPOSITION FILED WITHIN TIME LIMIT |
|
| PG2D | Information on lapse in contracting state deleted |
Ref country code: IS |
|
| PG25 | Lapsed in a contracting state [announced via postgrant information from national office to epo] |
Ref country code: LU Free format text: LAPSE BECAUSE OF NON-PAYMENT OF DUE FEES Effective date: 20191005 |
|
| 26N | No opposition filed |
Effective date: 20200603 |
|
| PG25 | Lapsed in a contracting state [announced via postgrant information from national office to epo] |
Ref country code: SI Free format text: LAPSE BECAUSE OF FAILURE TO SUBMIT A TRANSLATION OF THE DESCRIPTION OR TO PAY THE FEE WITHIN THE PRESCRIBED TIME-LIMIT Effective date: 20190828 |
|
| PG25 | Lapsed in a contracting state [announced via postgrant information from national office to epo] |
Ref country code: IE Free format text: LAPSE BECAUSE OF NON-PAYMENT OF DUE FEES Effective date: 20191005 |
|
| PG25 | Lapsed in a contracting state [announced via postgrant information from national office to epo] |
Ref country code: CY Free format text: LAPSE BECAUSE OF FAILURE TO SUBMIT A TRANSLATION OF THE DESCRIPTION OR TO PAY THE FEE WITHIN THE PRESCRIBED TIME-LIMIT Effective date: 20190828 |
|
| REG | Reference to a national code |
Ref country code: CH Ref legal event code: PL |
|
| REG | Reference to a national code |
Ref country code: NL Ref legal event code: MM Effective date: 20201101 |
|
| REG | Reference to a national code |
Ref country code: BE Ref legal event code: MM Effective date: 20201031 |
|
| PG25 | Lapsed in a contracting state [announced via postgrant information from national office to epo] |
Ref country code: HU Free format text: LAPSE BECAUSE OF FAILURE TO SUBMIT A TRANSLATION OF THE DESCRIPTION OR TO PAY THE FEE WITHIN THE PRESCRIBED TIME-LIMIT; INVALID AB INITIO Effective date: 20161005 Ref country code: MT Free format text: LAPSE BECAUSE OF FAILURE TO SUBMIT A TRANSLATION OF THE DESCRIPTION OR TO PAY THE FEE WITHIN THE PRESCRIBED TIME-LIMIT Effective date: 20190828 |
|
| PG25 | Lapsed in a contracting state [announced via postgrant information from national office to epo] |
Ref country code: CH Free format text: LAPSE BECAUSE OF NON-PAYMENT OF DUE FEES Effective date: 20201031 Ref country code: BE Free format text: LAPSE BECAUSE OF NON-PAYMENT OF DUE FEES Effective date: 20201031 Ref country code: LI Free format text: LAPSE BECAUSE OF NON-PAYMENT OF DUE FEES Effective date: 20201031 |
|
| PG25 | Lapsed in a contracting state [announced via postgrant information from national office to epo] |
Ref country code: MK Free format text: LAPSE BECAUSE OF FAILURE TO SUBMIT A TRANSLATION OF THE DESCRIPTION OR TO PAY THE FEE WITHIN THE PRESCRIBED TIME-LIMIT Effective date: 20190828 |
|
| PG25 | Lapsed in a contracting state [announced via postgrant information from national office to epo] |
Ref country code: NL Free format text: LAPSE BECAUSE OF NON-PAYMENT OF DUE FEES Effective date: 20200101 |
|
| P01 | Opt-out of the competence of the unified patent court (upc) registered |
Effective date: 20230530 |
|
| PGFP | Annual fee paid to national office [announced via postgrant information from national office to epo] |
Ref country code: GB Payment date: 20240410 Year of fee payment: 8 |
|
| PGFP | Annual fee paid to national office [announced via postgrant information from national office to epo] |
Ref country code: DE Payment date: 20240420 Year of fee payment: 8 |
|
| PGFP | Annual fee paid to national office [announced via postgrant information from national office to epo] |
Ref country code: FR Payment date: 20240409 Year of fee payment: 8 |