EP3290908B1 - Procédé de détermination d'échantillon inconnu - Google Patents
Procédé de détermination d'échantillon inconnu Download PDFInfo
- Publication number
- EP3290908B1 EP3290908B1 EP17189696.2A EP17189696A EP3290908B1 EP 3290908 B1 EP3290908 B1 EP 3290908B1 EP 17189696 A EP17189696 A EP 17189696A EP 3290908 B1 EP3290908 B1 EP 3290908B1
- Authority
- EP
- European Patent Office
- Prior art keywords
- fluorescence
- spectrum
- candidate
- sample
- peak
- Prior art date
- Legal status (The legal status is an assumption and is not a legal conclusion. Google has not performed a legal analysis and makes no representation as to the accuracy of the status listed.)
- Active
Links
- 238000000034 method Methods 0.000 title claims description 100
- 239000000126 substance Substances 0.000 claims description 207
- 238000002189 fluorescence spectrum Methods 0.000 claims description 126
- 238000005259 measurement Methods 0.000 claims description 123
- 238000001228 spectrum Methods 0.000 claims description 117
- 230000005284 excitation Effects 0.000 claims description 97
- 230000008569 process Effects 0.000 claims description 76
- 238000012545 processing Methods 0.000 claims description 43
- 238000000491 multivariate analysis Methods 0.000 claims description 37
- 239000000284 extract Substances 0.000 claims description 2
- 239000000523 sample Substances 0.000 description 130
- 238000004458 analytical method Methods 0.000 description 33
- 238000010238 partial least squares regression Methods 0.000 description 10
- 235000012907 honey Nutrition 0.000 description 8
- 238000010606 normalization Methods 0.000 description 8
- 230000003287 optical effect Effects 0.000 description 8
- 235000013305 food Nutrition 0.000 description 7
- 230000004044 response Effects 0.000 description 7
- 150000001875 compounds Chemical class 0.000 description 6
- 238000001506 fluorescence spectroscopy Methods 0.000 description 6
- 238000004364 calculation method Methods 0.000 description 5
- 238000004519 manufacturing process Methods 0.000 description 5
- 239000000463 material Substances 0.000 description 5
- 239000005446 dissolved organic matter Substances 0.000 description 4
- 239000003256 environmental substance Substances 0.000 description 4
- 238000000695 excitation spectrum Methods 0.000 description 4
- 238000000605 extraction Methods 0.000 description 4
- 239000011159 matrix material Substances 0.000 description 4
- 230000035945 sensitivity Effects 0.000 description 4
- 238000001542 size-exclusion chromatography Methods 0.000 description 4
- 239000000149 chemical water pollutant Substances 0.000 description 3
- 238000010586 diagram Methods 0.000 description 3
- 229910010272 inorganic material Inorganic materials 0.000 description 3
- GVJHHUAWPYXKBD-UHFFFAOYSA-N (±)-α-Tocopherol Chemical compound OC1=C(C)C(C)=C2OC(CCCC(C)CCCC(C)CCCC(C)C)(C)CCC2=C1C GVJHHUAWPYXKBD-UHFFFAOYSA-N 0.000 description 2
- 241000251468 Actinopterygii Species 0.000 description 2
- 229930195730 Aflatoxin Natural products 0.000 description 2
- XWIYFDMXXLINPU-UHFFFAOYSA-N Aflatoxin G Chemical compound O=C1OCCC2=C1C(=O)OC1=C2C(OC)=CC2=C1C1C=COC1O2 XWIYFDMXXLINPU-UHFFFAOYSA-N 0.000 description 2
- OUYCCCASQSFEME-QMMMGPOBSA-N L-tyrosine Chemical compound OC(=O)[C@@H](N)CC1=CC=C(O)C=C1 OUYCCCASQSFEME-QMMMGPOBSA-N 0.000 description 2
- 239000005409 aflatoxin Substances 0.000 description 2
- 230000008901 benefit Effects 0.000 description 2
- 239000003814 drug Substances 0.000 description 2
- 235000019688 fish Nutrition 0.000 description 2
- 238000004128 high performance liquid chromatography Methods 0.000 description 2
- 239000011147 inorganic material Substances 0.000 description 2
- 238000013178 mathematical model Methods 0.000 description 2
- 238000012544 monitoring process Methods 0.000 description 2
- 150000002894 organic compounds Chemical class 0.000 description 2
- 239000011368 organic material Substances 0.000 description 2
- 238000007781 pre-processing Methods 0.000 description 2
- 238000000513 principal component analysis Methods 0.000 description 2
- 238000000611 regression analysis Methods 0.000 description 2
- 238000004904 shortening Methods 0.000 description 2
- 230000003595 spectral effect Effects 0.000 description 2
- 238000011282 treatment Methods 0.000 description 2
- PUKLDDOGISCFCP-JSQCKWNTSA-N 21-Deoxycortisone Chemical compound C1CC2=CC(=O)CC[C@]2(C)[C@@H]2[C@@H]1[C@@H]1CC[C@@](C(=O)C)(O)[C@@]1(C)CC2=O PUKLDDOGISCFCP-JSQCKWNTSA-N 0.000 description 1
- QJZYHAIUNVAGQP-UHFFFAOYSA-N 3-nitrobicyclo[2.2.1]hept-5-ene-2,3-dicarboxylic acid Chemical compound C1C2C=CC1C(C(=O)O)C2(C(O)=O)[N+]([O-])=O QJZYHAIUNVAGQP-UHFFFAOYSA-N 0.000 description 1
- 229910052693 Europium Inorganic materials 0.000 description 1
- FCYKAQOGGFGCMD-UHFFFAOYSA-N Fulvic acid Natural products O1C2=CC(O)=C(O)C(C(O)=O)=C2C(=O)C2=C1CC(C)(O)OC2 FCYKAQOGGFGCMD-UHFFFAOYSA-N 0.000 description 1
- 229910052771 Terbium Inorganic materials 0.000 description 1
- 241001648776 Trachurus japonicus Species 0.000 description 1
- 241001504592 Trachurus trachurus Species 0.000 description 1
- 229930003427 Vitamin E Natural products 0.000 description 1
- 229940024606 amino acid Drugs 0.000 description 1
- 150000001413 amino acids Chemical class 0.000 description 1
- 230000015556 catabolic process Effects 0.000 description 1
- 229930002875 chlorophyll Natural products 0.000 description 1
- 235000019804 chlorophyll Nutrition 0.000 description 1
- 229940106705 chlorophyll Drugs 0.000 description 1
- ATNHDLDRLWWWCB-AENOIHSZSA-M chlorophyll a Chemical compound C1([C@@H](C(=O)OC)C(=O)C2=C3C)=C2N2C3=CC(C(CC)=C3C)=[N+]4C3=CC3=C(C=C)C(C)=C5N3[Mg-2]42[N+]2=C1[C@@H](CCC(=O)OC\C=C(/C)CCC[C@H](C)CCC[C@H](C)CCCC(C)C)[C@H](C)C2=C5 ATNHDLDRLWWWCB-AENOIHSZSA-M 0.000 description 1
- 230000008878 coupling Effects 0.000 description 1
- 238000010168 coupling process Methods 0.000 description 1
- 238000005859 coupling reaction Methods 0.000 description 1
- 230000001066 destructive effect Effects 0.000 description 1
- -1 europium and terbium Chemical class 0.000 description 1
- OGPBJKLSAFTDLK-UHFFFAOYSA-N europium atom Chemical compound [Eu] OGPBJKLSAFTDLK-UHFFFAOYSA-N 0.000 description 1
- 238000011156 evaluation Methods 0.000 description 1
- 238000002474 experimental method Methods 0.000 description 1
- 239000000835 fiber Substances 0.000 description 1
- 235000021588 free fatty acids Nutrition 0.000 description 1
- 239000002509 fulvic acid Substances 0.000 description 1
- 229940095100 fulvic acid Drugs 0.000 description 1
- WIGCFUFOHFEKBI-UHFFFAOYSA-N gamma-tocopherol Natural products CC(C)CCCC(C)CCCC(C)CCCC1CCC2C(C)C(O)C(C)C(C)C2O1 WIGCFUFOHFEKBI-UHFFFAOYSA-N 0.000 description 1
- 238000009499 grossing Methods 0.000 description 1
- 239000004021 humic acid Substances 0.000 description 1
- 230000002209 hydrophobic effect Effects 0.000 description 1
- 150000002484 inorganic compounds Chemical class 0.000 description 1
- 230000003993 interaction Effects 0.000 description 1
- 238000011068 loading method Methods 0.000 description 1
- 239000002773 nucleotide Substances 0.000 description 1
- 125000003729 nucleotide group Chemical group 0.000 description 1
- 238000004445 quantitative analysis Methods 0.000 description 1
- 229920005989 resin Polymers 0.000 description 1
- 239000011347 resin Substances 0.000 description 1
- 238000010187 selection method Methods 0.000 description 1
- IFGCUJZIWBUILZ-UHFFFAOYSA-N sodium 2-[[2-[[hydroxy-(3,4,5-trihydroxy-6-methyloxan-2-yl)oxyphosphoryl]amino]-4-methylpentanoyl]amino]-3-(1H-indol-3-yl)propanoic acid Chemical compound [Na+].C=1NC2=CC=CC=C2C=1CC(C(O)=O)NC(=O)C(CC(C)C)NP(O)(=O)OC1OC(C)C(O)C(O)C1O IFGCUJZIWBUILZ-UHFFFAOYSA-N 0.000 description 1
- 238000003860 storage Methods 0.000 description 1
- 239000013076 target substance Substances 0.000 description 1
- GZCRRIHWUXGPOV-UHFFFAOYSA-N terbium atom Chemical compound [Tb] GZCRRIHWUXGPOV-UHFFFAOYSA-N 0.000 description 1
- 238000012360 testing method Methods 0.000 description 1
- 229960004441 tyrosine Drugs 0.000 description 1
- 229940046009 vitamin E Drugs 0.000 description 1
- 235000019165 vitamin E Nutrition 0.000 description 1
- 239000011709 vitamin E Substances 0.000 description 1
Images


Classifications
-
- G—PHYSICS
- G01—MEASURING; TESTING
- G01N—INVESTIGATING OR ANALYSING MATERIALS BY DETERMINING THEIR CHEMICAL OR PHYSICAL PROPERTIES
- G01N21/00—Investigating or analysing materials by the use of optical means, i.e. using sub-millimetre waves, infrared, visible or ultraviolet light
- G01N21/62—Systems in which the material investigated is excited whereby it emits light or causes a change in wavelength of the incident light
- G01N21/63—Systems in which the material investigated is excited whereby it emits light or causes a change in wavelength of the incident light optically excited
- G01N21/64—Fluorescence; Phosphorescence
- G01N21/645—Specially adapted constructive features of fluorimeters
-
- G—PHYSICS
- G01—MEASURING; TESTING
- G01J—MEASUREMENT OF INTENSITY, VELOCITY, SPECTRAL CONTENT, POLARISATION, PHASE OR PULSE CHARACTERISTICS OF INFRARED, VISIBLE OR ULTRAVIOLET LIGHT; COLORIMETRY; RADIATION PYROMETRY
- G01J1/00—Photometry, e.g. photographic exposure meter
- G01J1/02—Details
- G01J1/0219—Electrical interface; User interface
-
- G—PHYSICS
- G01—MEASURING; TESTING
- G01J—MEASUREMENT OF INTENSITY, VELOCITY, SPECTRAL CONTENT, POLARISATION, PHASE OR PULSE CHARACTERISTICS OF INFRARED, VISIBLE OR ULTRAVIOLET LIGHT; COLORIMETRY; RADIATION PYROMETRY
- G01J3/00—Spectrometry; Spectrophotometry; Monochromators; Measuring colours
-
- G—PHYSICS
- G01—MEASURING; TESTING
- G01J—MEASUREMENT OF INTENSITY, VELOCITY, SPECTRAL CONTENT, POLARISATION, PHASE OR PULSE CHARACTERISTICS OF INFRARED, VISIBLE OR ULTRAVIOLET LIGHT; COLORIMETRY; RADIATION PYROMETRY
- G01J3/00—Spectrometry; Spectrophotometry; Monochromators; Measuring colours
- G01J3/02—Details
- G01J3/0264—Electrical interface; User interface
-
- G—PHYSICS
- G01—MEASURING; TESTING
- G01J—MEASUREMENT OF INTENSITY, VELOCITY, SPECTRAL CONTENT, POLARISATION, PHASE OR PULSE CHARACTERISTICS OF INFRARED, VISIBLE OR ULTRAVIOLET LIGHT; COLORIMETRY; RADIATION PYROMETRY
- G01J3/00—Spectrometry; Spectrophotometry; Monochromators; Measuring colours
- G01J3/28—Investigating the spectrum
- G01J3/2823—Imaging spectrometer
-
- G—PHYSICS
- G01—MEASURING; TESTING
- G01J—MEASUREMENT OF INTENSITY, VELOCITY, SPECTRAL CONTENT, POLARISATION, PHASE OR PULSE CHARACTERISTICS OF INFRARED, VISIBLE OR ULTRAVIOLET LIGHT; COLORIMETRY; RADIATION PYROMETRY
- G01J3/00—Spectrometry; Spectrophotometry; Monochromators; Measuring colours
- G01J3/28—Investigating the spectrum
- G01J3/44—Raman spectrometry; Scattering spectrometry ; Fluorescence spectrometry
- G01J3/4406—Fluorescence spectrometry
-
- G—PHYSICS
- G01—MEASURING; TESTING
- G01N—INVESTIGATING OR ANALYSING MATERIALS BY DETERMINING THEIR CHEMICAL OR PHYSICAL PROPERTIES
- G01N21/00—Investigating or analysing materials by the use of optical means, i.e. using sub-millimetre waves, infrared, visible or ultraviolet light
- G01N21/17—Systems in which incident light is modified in accordance with the properties of the material investigated
- G01N21/25—Colour; Spectral properties, i.e. comparison of effect of material on the light at two or more different wavelengths or wavelength bands
- G01N21/27—Colour; Spectral properties, i.e. comparison of effect of material on the light at two or more different wavelengths or wavelength bands using photo-electric detection ; circuits for computing concentration
- G01N21/274—Calibration, base line adjustment, drift correction
-
- G—PHYSICS
- G01—MEASURING; TESTING
- G01N—INVESTIGATING OR ANALYSING MATERIALS BY DETERMINING THEIR CHEMICAL OR PHYSICAL PROPERTIES
- G01N21/00—Investigating or analysing materials by the use of optical means, i.e. using sub-millimetre waves, infrared, visible or ultraviolet light
- G01N21/62—Systems in which the material investigated is excited whereby it emits light or causes a change in wavelength of the incident light
- G01N21/63—Systems in which the material investigated is excited whereby it emits light or causes a change in wavelength of the incident light optically excited
- G01N21/64—Fluorescence; Phosphorescence
-
- G—PHYSICS
- G01—MEASURING; TESTING
- G01J—MEASUREMENT OF INTENSITY, VELOCITY, SPECTRAL CONTENT, POLARISATION, PHASE OR PULSE CHARACTERISTICS OF INFRARED, VISIBLE OR ULTRAVIOLET LIGHT; COLORIMETRY; RADIATION PYROMETRY
- G01J3/00—Spectrometry; Spectrophotometry; Monochromators; Measuring colours
- G01J3/28—Investigating the spectrum
- G01J2003/283—Investigating the spectrum computer-interfaced
- G01J2003/284—Spectral construction
-
- G—PHYSICS
- G01—MEASURING; TESTING
- G01N—INVESTIGATING OR ANALYSING MATERIALS BY DETERMINING THEIR CHEMICAL OR PHYSICAL PROPERTIES
- G01N21/00—Investigating or analysing materials by the use of optical means, i.e. using sub-millimetre waves, infrared, visible or ultraviolet light
- G01N21/62—Systems in which the material investigated is excited whereby it emits light or causes a change in wavelength of the incident light
- G01N21/63—Systems in which the material investigated is excited whereby it emits light or causes a change in wavelength of the incident light optically excited
- G01N21/64—Fluorescence; Phosphorescence
- G01N2021/6417—Spectrofluorimetric devices
- G01N2021/6419—Excitation at two or more wavelengths
-
- G—PHYSICS
- G01—MEASURING; TESTING
- G01N—INVESTIGATING OR ANALYSING MATERIALS BY DETERMINING THEIR CHEMICAL OR PHYSICAL PROPERTIES
- G01N21/00—Investigating or analysing materials by the use of optical means, i.e. using sub-millimetre waves, infrared, visible or ultraviolet light
- G01N21/62—Systems in which the material investigated is excited whereby it emits light or causes a change in wavelength of the incident light
- G01N21/63—Systems in which the material investigated is excited whereby it emits light or causes a change in wavelength of the incident light optically excited
- G01N21/64—Fluorescence; Phosphorescence
- G01N2021/6417—Spectrofluorimetric devices
- G01N2021/6421—Measuring at two or more wavelengths
-
- G—PHYSICS
- G01—MEASURING; TESTING
- G01N—INVESTIGATING OR ANALYSING MATERIALS BY DETERMINING THEIR CHEMICAL OR PHYSICAL PROPERTIES
- G01N21/00—Investigating or analysing materials by the use of optical means, i.e. using sub-millimetre waves, infrared, visible or ultraviolet light
- G01N21/17—Systems in which incident light is modified in accordance with the properties of the material investigated
- G01N21/25—Colour; Spectral properties, i.e. comparison of effect of material on the light at two or more different wavelengths or wavelength bands
- G01N21/27—Colour; Spectral properties, i.e. comparison of effect of material on the light at two or more different wavelengths or wavelength bands using photo-electric detection ; circuits for computing concentration
- G01N21/274—Calibration, base line adjustment, drift correction
- G01N21/276—Calibration, base line adjustment, drift correction with alternation of sample and standard in optical path
-
- G—PHYSICS
- G01—MEASURING; TESTING
- G01N—INVESTIGATING OR ANALYSING MATERIALS BY DETERMINING THEIR CHEMICAL OR PHYSICAL PROPERTIES
- G01N21/00—Investigating or analysing materials by the use of optical means, i.e. using sub-millimetre waves, infrared, visible or ultraviolet light
- G01N21/62—Systems in which the material investigated is excited whereby it emits light or causes a change in wavelength of the incident light
- G01N21/63—Systems in which the material investigated is excited whereby it emits light or causes a change in wavelength of the incident light optically excited
- G01N21/64—Fluorescence; Phosphorescence
- G01N21/6486—Measuring fluorescence of biological material, e.g. DNA, RNA, cells
-
- G—PHYSICS
- G01—MEASURING; TESTING
- G01N—INVESTIGATING OR ANALYSING MATERIALS BY DETERMINING THEIR CHEMICAL OR PHYSICAL PROPERTIES
- G01N2201/00—Features of devices classified in G01N21/00
- G01N2201/12—Circuits of general importance; Signal processing
Definitions
- the present disclosure relates to a method for acquiring a three-dimensional (3D) spectrum of the excitation wavelength, the fluorescence wavelength, and the fluorescence intensity and determining an unknown sample based on the acquired fluorescence characteristic.
- the mainstream of fluorescence measurements is to measure a two-dimensional excitation-fluorescence spectrum in which fluorescence intensity values are plotted with respect to the excitation wavelength or the fluorescence wavelength. And a quantitative analysis is performed using a standard curve with respect to the fluorescence intensity that is obtained at a single pair of an excitation wavelength and a fluorescence wavelength using a standard having a known density.
- Nonpatent document 1 3D fluorescence spectra of plural samples are acquired and converted into a data matrix, which is read into multivariate analysis software.
- a PLS regression formula is determined using, as known teacher data, measurement values of a chemical analysis on free amino acid, free fatty acid, or the like (target variable) and 3D fluorescence spectrum data (explanatory variable) and a target value of an unknown sample is obtained using the determined PLS regression formula.
- the PLS regression analysis is an analyzing method for obtaining a quantitative value of a target substance.
- a peak in a 3D fluorescence spectrum can be identified as long as a fluorescence wavelength of a compound that emits measurement target fluorescence.
- a measurement target such as a food, a chemical material, or an environmental substance in many cases contains plural fluorescent substances, in which case compounds other than a target compound for which a quantitative value is to be obtained emit fluorescence.
- a final target value is obtained by extracting characteristics of plural fluorescent substances at pairs of an excitation wavelength and a fluorescence wavelength. There may occur a case that an unknown fluorescence wavelength contributes to a model, in which case it cannot be determined to what fluorescent substances 3D fluorescence spectrum data of the model are attributed.
- the model is a combination of the wavelengths and the coefficients.
- the analysis accuracy is increased by eliminating noise such as scattered light, second-order light, and third-order light.
- a sample whose fluorescence characteristic is known such as aflatoxin which is referred to in JP-B-5856741
- data in an excitation wavelength range and a fluorescence wavelength range of a 3D fluorescence spectrum that represents the features of aflatoxin contained in a measurement target are mainly extracted.
- Non-Patent Document 2 Gamal Elmasry et al "Non-invasive sensing of freshness indices of frozen fish and fillets using pretreated excitation-emission matrices " discloses fluorescence spectroscopy with a fiber optic probe was utilized to estimate different freshness indices of whole and filleted horse mackerel (Trachurus japonicus) directly in the frozen state. The actual freshness values were assessed using the nucleotide-based method depending on the determination of ATP and its breakdown derivatives with high pressure liquid chromatography (HPLC). Different spectral treatments (i.e.
- WO 2012/074413 A1 discloses a method for determining the botanical origin of honey: (a) estimating the botanical origin of standard honey samples, by: (i) obtaining key chemical concentrations; (ii) assigning the botanical origin as a value on the abundance of chemical compounds characteristic of botanical groups; (b) generating the fluorescence signature of standard honey samples, by: (i) measuring the intensity and wavelength of the fluorescent light emitted from a diluted light-excited honey solution; (ii) combining excitation and emitted light as 2-dimensional excitation-emission matrix (EEM); (c) constructing a predictive mathematical model from standard honey data; (d) generate the fluorescence EEM signature of an unknown honey sample or samples, as outlined in step (b); and (e) using the unknown honey fluorescence EEM data from step (d) with the mathematical model of step (c) to predict and assign value of botanical origin of honey.
- EEM 2-dimensional excitation-emission matrix
- LU F et al "Dissolved organic matter with multi-peak fluorophores in landfill leachate" discusses an experiment in which dissolved organic matter (DOM) sampled from municipal landfill leachate of different ages with/without anoxic or aerobic treatment, was intensively fractionated via size exclusion chromatography (SEC) and hydrophobic resins and was studied with fluorescence excitation and emission matrix (EEM). he spectral characteristics of these fluorophores were discussed using fractional EEM and apparent molecular weight (AMW) data obtained via SEC analysis. This paper revealed that the coupling of SEC and EEM can be useful to track the fluorescent DOM fraction in landfill leachate.
- SEC size exclusion chromatography
- EEM fluorescence excitation and emission matrix
- a sample without such property information can be determined by sequentially identifying fluorescent substances to which respective fluorescence characteristic-indicative fluorescence spectrum peaks are attributed. It is necessary to determine a spectrum range and sub peaks that indicate a fluorescence characteristic based on a peak of attention of a measured 3D fluorescence spectrum and to determine a fluorescent substan ce by comparing an excitation wavelength and a fluorescence w avelength of the peak of attention and the determined spectrum range and sub peaks with a known fluorescent substance library. It is further necessary to set an effective spectrum range and perform a multivariate analysis.
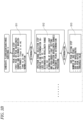
- the fluorescence spectrophotometer includes a photometer unit 100, a computer unit 200, and an interface unit 300.
- An analyst inputs measurement conditions through an operating panel 32 of the interface unit 300.
- continuous wave light emitted from a light source 1 is split by an excitation-side spectroscope 2 to produce excitation light, part of which is shone, via a beam splitter 3, on a measurement sample 6 that is mounted on a sample mounting stage 5.
- An excitation-side slit is included in the excitation-side spectroscope 2, and resolution of monochrome light that is extracted from continuous wave light is determined by setting a width of the slit.
- a light quantity of the part, separated by the beam splitter 3, of the excitation light is measured by a monitoring detector 4, whereby a variation in the light source 1 is corrected.
- Fluorescent light emitted from the sample 6 is split by a fluorescence-side spectroscope 7 to produce monochrome light, which is detected by a detector 8.
- a fluorescence-side slit is included in the fluorescence-side spectroscope 7, and resolution of monochrome light that is separated from fluorescent light is determined by setting a width of the slit.
- a signal detected by the detector 8 is received by a data processing unit 23 as a signal intensity via an A/D converter 21, and a measurement result is displayed on a monitor 31.
- An excitation-side pulse motor 12 is driven according to an instruction from a controller 22 and the excitation-side spectroscope 2 is thereby set at an intended wavelength.
- a fluorescence-side pulse motor 11 is driven according to an instruction from the controller 22 and the fluorescence-side spectroscope 7 is thereby set at an intended wavelength.
- An excitation-side filter 15 is disposed between the excitation-side spectroscope 2 and the measurement sample 6.
- One of plural cut filters is inserted into the optical path as the excitation-side filter 15 by an excitation-side filter pulse motor 13.
- a fluorescence-side filter 16 is disposed between the measurement sample 6 and the fluorescence-side spectroscope 7.
- One of plural cut filters is inserted into the optical path as the fluorescence-side filter 16 by a fluorescence-side filter pulse motor 14.
- fluorescent substance as used herein is a generic term of compounds that emit fluorescent light.
- Example fluorescent compounds are organic compounds such as L-tyrosine, L-tryptophan, vitamin E, and chlorophyll and inorganic compounds such as europium and terbium, as well as amorphous organic compounds such as humic acid and fulvic acid. Scattered light of excitation light appears at the same wavelength as the excitation light, and high-order light such as second-order light appears at a wavelength that is N times the wavelength of scattered light (N: integer).
- a peak selection step S11 an excitation wavelength and a fluorescence wavelength of a peak of attention as a first peak are selected in a measured 3D fluorescence spectrum.
- Fig. 4 shows an example first peak selected in a 3D fluorescence spectrum.
- An excitation wavelength range and a fluorescence wavelength range (e.g., ⁇ 5 nm) with respect to the peak wavelengths are also input as search allowable ranges to be used in referring to a candidate fluorescent substance library.
- a spectrum range selection step S12 spectrum ranges corresponding to a region enclosed by a broken line in area (a) of Fig. 5 are acquired.
- a spectrum range is defined by an excitation wavelength range and a fluorescence wavelength range and is set for each contour line determination value.
- the contour line determination value is a parameter that is specified by a measurer and indicates a threshold value for extraction of intensity data from a 3D fluorescence spectrum.
- peaks of two fluorescent substances are located close to each other as shown in area (a) of Fig. 6 , sets of contour lines of the two fluorescent substances overlap with each other, that is, contour lines of one fluorescent substance extend to wavelength ranges of the other fluorescent substance.
- an excitation wavelength that is located on the shorter wavelength side or the longer wavelength side is set instead of an excitation wavelength corresponding to a maximum fluorescence intensity (proximate peaks determination processing), whereby a single fluorescence spectrum range that does not overlap with a fluorescence spectrum range of another fluorescent substance.
- a candidate fluorescent substance is extracted through collation with a candidate fluorescent substance library that is prepared in advance.
- the candidate fluorescent substance library is a library of fluorescent substances produced by performing, in advance, measurements on fluorescent substances to become candidates, and contains, for each fluorescent substance, a peak excitation wavelength range and a peak fluorescence wavelength range that were obtained at the peak selection step S11, spectrum ranges that were set for respective contour line determination values at the spectrum range selection step S12, and the number of sub peaks, sub peak ratios, sub peak excitation wavelengths, and sub peak fluorescence wavelengths that were obtained at the sub peak selection step S13.
- Wavelength range conditions are set that include an excitation start wavelength, an excitation end wavelength, an excitation data interval, a fluorescence start wavelength, a fluorescence end wavelength, and a fluorescence data interval.
- a condition that dictates a measurement speed is a wavelength scanning rate.
- Conditions that dictate resolution are an excitation-side slit width and a fluorescence-side slit width.
- a condition relating to a data response speed is a response setting value that relates to noise and resolution.
- a condition that determines sensitivity is a detector voltage.
- step S22 To perform a multivariate analysis, measurement data of plural standards are necessary.
- standards that are supposed to be subjected to measurement are registered in a standard table in advance.
- information to become a target variable that is, determination information (production area information when a production area determination is intended and success/failure information when a success/failure determination is intended) and density information (for a regression analysis such as PLS), is input for each standard.
- step S23 3D fluorescence spectra of the standards are measured based on the standard table.
- step S24 the candidate fluorescent substance determining process shown in Figs. 3A-3D is executed on each measured 3D fluorescence spectrum, whereby candidate fluorescent substances are determined.
- a model is obtained by performing a multivariate analysis such as a PLS regression analysis or a discriminant analysis using the data that have been set as a subject of the multivariate analysis. Since model coefficients obtained here are basically ones obtained based on the data in the spectrum ranges, correlation is made between sets of model coefficients corresponding to respective pairs of wavelengths and candidate fluorescent substances involved.
- An average of model coefficients corresponding to each candidate fluorescent substance serves as an index to be used for determining whether the candidate fluorescent substance contributes to obtaining a target value.
- model coefficients corresponding to each pair of wavelengths are important finally, an average of model coefficients is useful for evaluation of influence of interaction between components that occurs in a case that plural fluorescent substances are included. For example, in the case of a PLS regression analysis, a component an average of whose model coefficients is negative has no correlation with a target value. On the other hand, a component an average of whose model coefficients is positive has correlation with a target value.
- sample measurement conditions are set. Basically, the sample measurement conditions are set the same as the standard measurement conditions. However, to shorten the measurement time, the excitation start wavelength, the excitation end wavelength, the excitation data interval, the fluorescence start wavelength, the fluorescence end wavelength, the fluorescence data interval, etc. that relate to the measurement wavelength ranges may be changed according to the measurement wavelength ranges that were selected at step S25 of the standard process.
- step S33 it is determined whether the pairs of an excitation wavelength and a fluorescence wavelength corresponding to the sets of model coefficients that were read at step S31 are included in the respective pairs of measurement wavelength ranges, and whether the wavelength scanning rate, the excitation-side slit width, the fluorescence-side slit width, the response setting value, and the detector voltage are the same as those of the standard measurement conditions. Since the measurement conditions influence the resolution and sensitivity and hence fluorescence intensity values, the measurement conditions other than the measurement wavelength ranges should not be changed. The determination step S33 is executed to equalize these sample measurement conditions to the corresponding standard measurement conditions, to avoid measurement errors.
- a sample table is set in advance for a sample to be subjected to measurement.
- a success/failure determination condition and determination value names may be determined.
- An example of the success/failure determination condition is a threshold value for a determination on a target value obtained by a multivariate analysis. Examples of the determination value names are "larger” indicating that a target value obtained is larger than the threshold value, "smaller” indicating that a target value obtained is smaller than the threshold value, "larger or smaller” indicating a destination item of a case that a target value obtained is the same as the threshold value.
- a 3D fluorescence spectrum of the sample is measured according to the sample table set at step S34.
- candidate fluorescent substances are determined according to the candidate fluorescent substance determining process shown in Figs. 3A-3D .
- a success/failure determination is made and a result is output.
- the 3D fluorescence spectrum and a result of determination of candidate fluorescent substances are displayed as shown in Fig. 10 .
- a final measurement result of the entire process including the standard process and the sample process is displayed as shown in Fig. 11 .
- Information of the standard table that was set in the standard process is displayed in a top-left part of the screen.
- Values of the calculation that was performed using the model coefficients that were read at step S31 and results of success/failure determinations made according to the success/failure determination condition that was set in the sample table at step S34 are added to the sample table that was set in the sample process, and resulting information is displayed in a bottom-left part of the screen.
- a 3D fluorescence spectrum of an item selected from the standard information displayed in the top-left part or the sample information displayed in the bottom-left part is displayed in a top-right part of the screen.
- Displayed in a bottom-right part of the screen is a list of candidate fluorescent substances, obtained at step S24, of the item selected from the standard information displayed in the top-left part or a list of candidate fluorescent substances, obtained at step S36, of the item selected from the sample information displayed in the bottom-left part. Also displayed is an average of the model coefficients, calculated at step S26 in the standard process, of each candidate fluorescent substance. If a fluorescent substance other than the candidate fluorescent substances that were obtained in the standard process is obtained in the sample process, no average of model coefficients of that fluorescent substance is displayed.
- the candidate fluorescent substance for a peak of attention can be recognized visually.
- its peak wavelengths and spectrum range may be highlighted for determination.
- Embodiment 2 fluorescent substances are identified using fluorescence characteristics of 3D fluorescence spectra of standards measured in the standard process.
- the sample is identified by executing the candidate fluorescent substance determining process shown in Figs. 3A-3D .
- Sample measurement conditions are set at step S32, a sample table is set at step S34 by inputting pieces of sample information, and a 3D fluorescence spectrum of the sample is measured at step S35 according to the conditions that were set at step S32.
- the candidate fluorescent substance determining process shown in Figs. 3A-3D which includes the peak selection step S11, the spectrum range selection step S12, and the sub peak selection step S13, is performed on a 3D fluorescence spectrum obtained, whereby pieces of fluorescence characteristic information are obtained.
- Candidate fluorescent substances are determined by collating obtained peak wavelengths, spectrum ranges, and pieces of sub peak information with a candidate fluorescent substance library. A sample containing the thus-determined candidate fluorescent substances is extracted from a candidate fluorescent sample library.
- a measurement target sample such as a food, a chemical material, or an environmental substance in many cases contains plural fluorescent substances and plural kinds of fluorescence characteristics may be obtained from a 3D fluorescence spectrum. Where plural kinds of fluorescence characteristics are obtained from a 3D fluorescence spectrum, as shown in Fig. 12 , determination of candidate fluorescent substances of an unknown sample and extraction of a candidate sample that were described above are performed repeatedly and candidate samples are thereby narrowed down. A candidate sample that exhibits an effective fluorescence characteristic is extracted finally from the candidate fluorescent sample library.
- an unknown sample determining instrument according to Embodiment 3 of the present disclosure will be described below with reference to Fig. 1 .
- the unknown sample determining instrument according to Embodiment 3 can be used suitably for the above-described unknown sample determining method, the measuring device used therein is not limited to the one described below.
- Fig. 1 shows a fluorescence spectrophotometer which includes a photometer unit 100, a computer unit 200, and an interface unit 300.
- An analyst inputs measurement conditions through an operating panel 32 of the interface unit 300.
- Continuous wave light emitted from a light source 1 is split by an excitation-side spectroscope 2 to produce excitation light, part of which is shone, via a beam splitter 3, on a measurement sample 6 that is mounted on a sample mounting stage 5.
- An excitation-side slit is included in the excitation-side spectroscope 2, and resolution of monochrome light that is extracted from white light is determined by setting a width of the slit.
- a light quantity of the part, separated by the beam splitter 3, of the excitation light is measured by a monitoring detector 4, whereby a variation in the light source 1 is corrected.
- Fluorescent light emitted from the sample 6 is split by a fluorescence-side spectroscope 7 to produce monochrome light, which is detected by a detector 8.
- a fluorescence-side slit is included in the fluorescence-side spectroscope 7, and resolution of monochrome light that is separated from fluorescent light is determined by setting a width of the slit.
- a signal detected by the detector 8 is received by a data processing unit 23 as a signal intensity via an A/D converter 21, and a measurement result is displayed on a monitor 31.
- An excitation-side pulse motor 12 is driven according to an instruction from a controller 22 and the excitation-side spectroscope 2 is thereby set at an intended wavelength.
- a fluorescence-side pulse motor 11 is driven according to an instruction from the controller 22 and the fluorescence-side spectroscope 7 is thereby set at an intended wavelength.
- Each of the excitation-side spectroscope 2 and the fluorescence-side spectroscope 7 employs such an optical element as a diffraction grating or a prism, and a spectrum scan is performed by rotating the optical element via gears and a cam using motive power produced by the excitation-side pulse motor 12 or the fluorescence-side pulse motor 11.
- An excitation-side filter 15 is disposed between the excitation-side spectroscope 2 and the measurement sample 6.
- One of plural cut filters is inserted into the optical path as the excitation-side filter 15 by an excitation-side filter pulse motor 13.
- a fluorescence-side filter 16 is disposed between the measurement sample 6 and the fluorescence-side spectroscope 7.
- One of plural cut filters is inserted into the optical path as the fluorescence-side filter 16 by a fluorescence-side filter pulse motor 14.
- the fluorescence spectrophotometer shown in Fig. 1 is a monochrometer in which a wavelength scan of the fluorescence-side spectroscope 7 is performed by the fluorescence-side pulse motor 11 and monochromatic light is detected by the detector 8 such as a photomultiplier, it can be implemented as a polychrometer that does not include the fluorescence-side pulse motor 11 and employs, as the detector 8, an area detector such as a CCD.
- Fluorescence intensity values of a 3D fluorescence spectrum are shown with the vertical axis and the horizontal axis representing the excitation wavelength EX and the fluorescence wavelength EM, respectively.
- the vertical axis and the horizontal axis may represent the fluorescence wavelength and the excitation wavelength, respectively.
- the input measurement conditions of sample measurement includes excitation wavelength and fluorescence wavelength at the time of calculating model coefficients are within the measurement wavelength range and whether the input measurement conditions of sample measurement includes wavelength scanning rate, an excitation-side slit width, a fluorescence-side slit width, a response setting value, and a detector voltage that matches the measurement conditions being set in the condition setting step in the standard process.
- the data processing unit 23 extracts a candidate fluorescent substance by collating, with the candidate fluorescent substance library, results obtained for a measured 3D fluorescence spectrum of an unknown measurement target sample whose determination information is not available, that is, an excitation wavelength and a fluorescence wavelength of a first peak selected at the peak selection step S11 of the fluorescent substance determining process shown in Figs. 3A-3D , spectrum ranges that were set for respective contour determination values at the spectrum range selection step S12, and the number of sub peaks, sub peak ratios, sub peak excitation wavelengths, and sub peak fluorescence wavelengths that were obtained at the sub peak selection step S13.
- sets of a peak wavelength, spectrum ranges, and pieces of sub peak information are sequentially collated with the candidate fluorescent sample library, whereby candidate fluorescent substances that satisfy the above sets of pieces of peak information are extracted.
- a sample containing the extracted candidate fluorescent substances is extracted from the candidate fluorescent sample library, and the 3D fluorescence spectrum and the sample table of the measurement target sample and the extracted candidate sample are displayed on the monitor 31.
- the program causes setting, through the operating panel 32, of conditions under which to measure a 3D fluorescence spectrum of each standard by means of the photometer unit 100 by sending an instruction from the controller 22 to it.
- Wavelength range conditions are set that include an excitation start wavelength, an excitation end wavelength, an excitation data interval, a fluorescence start wavelength, a fluorescence end wavelength, and a fluorescence data interval.
- a condition that dictates a measurement speed is a wavelength scanning rate.
- Conditions that dictate resolution are an excitation-side slit width and a fluorescence-side slit width.
- a condition relating to a data response speed is a response setting value that relates to noise and resolution.
- a condition that determines sensitivity is a detector voltage.
- the program causes input, through the operating panel 32, of a sample name, information to become a target variable, and density information, and storage of them in the data processing unit 23.
- the program causes the data processing unit 23 to read the model coefficients obtained at the multivariate analysis step S26.
- the program sets sample measurement conditions by receiving them through the operating panel 32 or select sample measurement conditions stored in the data processing unit 23. Basically, the sample measurement conditions are set the same as the standard measurement conditions. However, to shorten the measurement time, the excitation start wavelength, the excitation end wavelength, the excitation data interval, the fluorescence start wavelength, the fluorescence end wavelength, the fluorescence data interval, etc. that relate to the measurement wavelength ranges may be changed according to the measurement wavelength ranges that were selected at step S25 of the standard process.
- the program causes the photometer unit 100 to measure a 3D fluorescence spectrum of the sample according to the sample table that was set at step S34 and according to an instruction from the controller 31 that are based on the thus-set measurement conditions.
- the program stores the measured 3D fluorescence spectrum in the data processing unit 23 in the form of 3D data, that is, excitation wavelengths, fluorescence wavelengths, and fluorescence intensity values, and determine candidate fluorescent substances according to the candidate fluorescent substance determining process shown in Figs. 3A-3D .
- the program causes the monitor 31 to display candidate fluorescent substance search results, that is, a 3D fluorescence spectrum and a result of determination of candidate fluorescent substances (see Fig. 10 ).
- the peak wavelengths and the sub peak wavelengths of the candidate fluorescent substances may be plotted so as to be recognizable, in the same manner as in the 3D fluorescence spectrum shown in Fig. 10 .
- Spectrum ranges corresponding to contour line determination values "50" and "10" may further be displayed using a broken line or the like. Since the list of candidate fluorescent substances and the 3D fluorescence spectrum are displayed on the same screen, the candidate fluorescent substance for a peak of attention can be recognized visually. When one candidate fluorescent substance is selected, its peak wavelengths and spectrum range may be highlighted for determination.
- the program causes the data processing unit 23 to normalize the peak intensity of the selected first peak selected by itself to a prescribed value to facilitate data comparison.
- the program causes the data processing unit 23 to select a spectrum range corresponding to a region enclosed by a broken line in area (a) of Fig. 5 .
- a spectrum range is defined by an excitation wavelength range and a fluorescence wavelength range and is set for each contour line determination value, and information indicating it is stored in the data processing unit 23.
- the contour line determination value is a parameter that is specified by a measurer and indicates a threshold value for extraction of intensity data from a 3D fluorescence spectrum. For example, where the contour line determination value is set at "10,” a spectrum range corresponding to an intensity "10" with respect to the normalized intensity "100" of the first peak that was set at the peak selection step S11 is searched for.
- a target area is set that is defined by an excitation wavelength range and a fluorescence wavelength range. Widest wavelength ranges of a closed contour line that connects the same fluorescence intensity values are set. Then it is determined whether the thus-set spectrum range is included in measurement wavelength ranges. If the spectrum range is out of the measurement wavelength ranges, another spectrum range is set.
- the program causes the data processing unit 23 to perform proximate peaks determination processing.
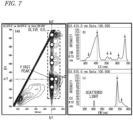
- the program causes the data processing unit 23 to set sub peak wavelengths as shown in area (a) of Fig. 7 (a range enclosed by a broken line) and areas (b) and (c) of Fig. 7 .
- Sub peaks may be set either automatically by setting an intensity threshold value and extracting peaks that exceed the threshold value or manually by an operator.
- the program causes the monitor 31 to display results obtained at the peak selection step S11, the spectrum range selection step S12, and the sub peak selection step S13 of each process in the form of a list. More specifically, the list contains peak wavelengths of a first peak that was specified at the peak selection step S11, a spectrum range (spectrum range-50) corresponding to a contour line determination value "50" and a spectrum range (spectrum range-10) corresponding to a contour line determination value "10" that were obtained at the spectrum range selection step S12, and sub peak information that was obtained at the sub peak selection step S13, that is, the number of sub peaks, sub peak ratios, sub peak excitation wavelengths EX, and sub peak fluorescence wavelengths EM.
- the program causes the monitor 31 to display a result of determination, from the candidate fluorescent substance library, of a candidate fluorescent substance that satisfies the above conditions in the form of a candidate fluorescent substance list.
- the program causes the data processing unit 23 to select another first peak at the peak selection step S11 and determine a candidate fluorescent substance corresponding to peaks selected at the spectrum range selection step S12 and the sub peak selection step S13. Fluorescent substances are thus identified sequentially.
- fluorescent substances are identified using fluorescence characteristics of 3D fluorescence spectra of standards measured in the standard process.
- the sample is identified by executing the candidate fluorescent substance determining process shown in Figs. 3A-3D .
- Sample measurement conditions are set at step S32, a sample table is set at step S34 by inputting pieces of sample information, and a 3D fluorescence spectrum of the sample is measured at step S35 according to the conditions that were set at step S32.
- the candidate fluorescent substance determining process shown in Figs. 3A-3D which includes the peak selection step S11, the spectrum range selection step S12, and the sub peak selection step S13, is performed on the 3D fluorescence spectrum obtained, whereby pieces of fluorescence characteristic information are obtained.
- Candidate fluorescent substances are determined by collating obtained peak wavelengths, spectrum ranges, and pieces of sub peak information with the candidate fluorescent substance library. A sample containing the thus-determined candidate fluorescent substances is extracted from the candidate fluorescent sample library.
- a measurement target sample such as a food, a chemical material, or an environmental substance in many cases contains plural fluorescent substances and plural kinds of fluorescence characteristics may be obtained from a 3D fluorescence spectrum. Where plural kinds of fluorescence characteristics are obtained from a 3D fluorescence spectrum, as shown in Fig. 12 , determination of candidate fluorescent substances of an unknown sample and extraction of a candidate sample that were described above are performed repeatedly and candidate samples are thereby narrowed down. A candidate sample that exhibits an effective fluorescence characteristic is extracted finally from the candidate fluorescent substance library.
- the unknown sample determining method that, in analysis techniques of performing a multivariate analysis on 3D fluorescence spectrum data, is capable to identify fluorescent substances corresponding to peaks of a 3D fluorescence spectrum of a sample and display their list and can also be applied to identification and same/different determination of the sample itself that are made based on identification results of fluorescent substances corresponding to plural respective peaks.
- the use of this method can also provide advantages of increase of the accuracy of a multivariate analysis and shortening of its execution time.
Landscapes
- Physics & Mathematics (AREA)
- Spectroscopy & Molecular Physics (AREA)
- General Physics & Mathematics (AREA)
- Health & Medical Sciences (AREA)
- Engineering & Computer Science (AREA)
- Analytical Chemistry (AREA)
- Biochemistry (AREA)
- General Health & Medical Sciences (AREA)
- Chemical & Material Sciences (AREA)
- Immunology (AREA)
- Pathology (AREA)
- Life Sciences & Earth Sciences (AREA)
- Human Computer Interaction (AREA)
- Nuclear Medicine, Radiotherapy & Molecular Imaging (AREA)
- Mathematical Physics (AREA)
- Theoretical Computer Science (AREA)
- Investigating, Analyzing Materials By Fluorescence Or Luminescence (AREA)
Claims (6)
- Procédé de détermination d'échantillon inconnu pour la détermination d'un échantillon inconnu en calculant des coefficients de modèle en extrayant une caractéristique de fluorescence de résultats de mesure de spectres de fluorescence 3D de normes, ce procédé comprenant :un processus standard de réalisation de mesures sur des normes, incluant :une étape d'établissement de conditions de mesure (S21) pour l'établissement de conditions de mesure dans lesquelles mesurer des spectres de fluorescence 3D des normes ;une étape d'enregistrement de tableau de normes (S22) pour l'enregistrement, dans un tableau de normes, de normes sous la forme de combinaisons d'au moins un nom type, d'informations de détermination, et d'informations de densité ;une étape de mesure de spectre de fluorescence 3D (S23) pour mesurer des spectres de fluorescence 3D des normes enregistrées dans le tableau de normes dans les conditions établies dans l'étape d'établissement de conditions de mesure ;une étape de détermination de substances fluorescentes candidates (S24) pour la détermination de substances fluorescentes candidates contenues dans chacune des normes en extrayant des caractéristiques de fluorescence du spectre de fluorescence 3D de la norme et en comparant les caractéristiques de fluorescence extraites à des caractéristiques de fluorescence enregistrées dans une bibliothèque de substances fluorescentes candidates ;l'étape de détermination de substances fluorescentes candidates extrayant les caractéristiques de fluorescence par les étapes suivantes :une étape de sélection de crêtes (S11) pour extraire des premières crêtes représentant des parties de la caractéristique de fluorescence du spectre de fluorescence 3D de chacune des normes obtenue dans l'étape de mesure de spectre de fluorescence 3D, et pour normaliser la première crête ;une étape de sélection de plages de spectre (S12) pour établir des plages de spectre correspondant à une valeur de détermination de lignes de contour d'intensité de fluorescence ; etune étape de sélection de sous-crêtes (S13) dans chacune des plages de spectre dans l'étape de sélection de plages de spectre,le processus standard de réalisation de mesures sur des normes comprenant en outre une étape d'émission de coefficients de modèle (S26) pour calculer des coefficients de modèle en réalisant une analyse multivariable en se basant sur des données limitées à la plage de spectre établie dans l'étape de sélection de plages de spectre (S12), l'étape d'émission de coefficients de modèle étant réalisée après l'étape de détermination de substances fluorescentes candidates (S24) ;le procédé comprenant en outre :
un processus type de réalisation d'une mesure sur un échantillon inconnu, incluant :une étape de lecture de coefficients de modèle (S31) pour lire les coefficients de modèle qui ont été émis à partir du processus standard ;une étape d'établissement de conditions de mesure (S32) pour l'établissement de conditions dans lesquelles mesurer un spectre de fluorescence 3D de l'échantillon inconnu ;une étape de détermination de conditions de mesure (S33) pour déterminer si les conditions de mesure établies dans l'étape d'établissement de conditions de mesure sont équivalentes aux conditions établies dans l'étape de détermination de conditions de mesure du processus standard ou incluent une plage de spectre d'une caractéristique de fluorescence ;une étape d'établissement de tableau type (S34) pour établir, sous forme d'un tableau type, un nom type de l'échantillon inconnu et une condition de détermination qui est une valeur seuil de détermination sur une valeur cible obtenue par une analyse multivariable et en se basant sur les coefficients de modèle lus dans l'étape de lecture de coefficients de modèle (S31) ;une étape de mesure de spectre de fluorescence 3D (S35) pour réaliser une mesure sur l'échantillon inconnu dans les conditions établies dans l'étape d'établissement de conditions de mesure (S32) ;une étape de détermination de substances fluorescentes candidates (S36) pour déterminer des substances fluorescentes candidates en se basant sur la comparaison de caractéristiques de fluorescence incluant des premières crêtes, des plages de spectre et des sous-crêtes d'un spectre de fluorescence 3D obtenu dans l'étape de mesure de spectre de fluorescence 3D (S35) avec des caractéristiques de fluorescence enregistrées dans une bibliothèque de substances fluorescentes candidates ;une étape de détermination (S37) pour calculer si la condition de détermination est remplie par la valeur cible ; etune étape d'extraction d'échantillon de candidat pour l'extraction d'un échantillon candidat en comparant une combinaison des substances fluorescentes candidates déterminées dans l'étape de détermination de substances fluorescentes candidates à une bibliothèque d'échantillons candidats ;une étape d'affichage de substances fluorescentes candidates pour afficher une liste de noms des substances fluorescentes candidates extraites et les caractéristiques de fluorescence utilisées pour la détermination des substances fluorescentes candidates ; etune étape d'affichage d'échantillon candidat pour afficher un nom de l'échantillon candidat extrait avec des caractéristiques de fluorescence des substances fluorescentes candidates respectives. - Procédé de détermination d'échantillon inconnu selon la revendication 1,dans lequel l'étape de détermination de substances fluorescentes candidates (S24, S36) de chacun des processus standards et du processus type inclut :une étape de sélection de crêtes (S11) pour sélectionner des premières crêtes dont chacune représente une intensité de fluorescence maximale locale du spectre de fluorescence 3D mesurée dans l'étape de mesure de spectre de fluorescence 3D du processus standard ou du processus type ou représente une caractéristique de fluorescence dominante dans une plage de spectre spécifiée du spectre de fluorescence 3D mesuré, pour normaliser les premières crêtes, et établir une plage de longueur d'onde permissible des premières crêtes ;une étape de sélection de plages de spectre (S12) pour réaliser un processus de détermination de crêtes imminentes de manière à ce que plusieurs de l'ensemble des plages de spectre ne se chevauchent pas mutuellement, celles-ci étant établies en sélectionnant des plages de spectre dont chacune est définie par une plage de longueur d'onde d'excitation et une plage de longueur d'onde de fluorescence et correspond à une valeur de détermination de lignes de contour et pour exclure des plages de spectre de lumière diffuse, de lumière d'ordre supérieur et similaire qui sont inutiles pour la détermination de la caractéristique de fluorescence ; etune étape de sélection de sous-crêtes (S13) pour établir au moins le nombre, les longueurs d'onde de crêtes, et les rapports d'intensité de crêtes pour la première crête des sous-crêtes dans chacune des plages de spectre correspondant à la valeur de détermination de lignes de contour, l'étape de détermination de substances fluorescentes candidates (S24) du processus standard incluant une étape de détermination pour déterminer si les premières crêtes établies dans l'étape de sélection de crêtes, les plages de spectre établies dans l'étape de sélection de plages de spectre, et les éléments d'informations ou de sous-crêtes établis dans l'étape de sélection de sous-crêtes coïncident avec des éléments correspondants d'information de substances fluorescentes candidates enregistrées dans la bibliothèque de substances fluorescentes candidates,l'étape de détermination de substances fluorescentes candidates (S36) du processus incluant une étape de détermination pour déterminer si les premières crêtes établies dans l'étape de sélection de crêtes, les plages de spectre établies dans l'étape de sélection de plages de spectre, et les éléments d'information de sous-crêtes établies dans l'étape de sélection de sous-crêtes coïncident avec des éléments correspondants d'information des substances fluorescentes candidates déterminées dans le processus standard, etl'étape de détermination de substances fluorescentes candidates de chacun parmi le processus standard et le processus type incluant en outre :
une étape d'affichage d'une liste de noms de substances fluorescentes candidates qui ont été décelées comme en coïncidence dans l'étape de détermination du processus type, des premières crêtes établies dans étape de sélection de crêtes, des plages de spectre établies dans l'étape de sélection de plages de spectre, et des éléments d'information de sous-crêtes établies dans l'étape de sélection de sous-crêtes. - Procédé de détermination d'échantillon inconnu selon la revendication 1,
dans lequel l'étape de sélection de plages de spectre (S12) inclut un processus de détermination de crêtes imminentes qui est réalisé lorsque des premières crêtes attribuées à pluralité de substances fluorescentes respectives sont proches les unes des autres, ces plages de spectre correspondant à la valeur de détermination de lignes de contour se chevauchent mutuellement, le processus de détermination de crêtes imminentes incluant :la sélection de plages de longueur d'onde de fluorescence de manière à ce que les lignes de contour d'intensité de fluorescence ne se chevauchent pas mutuellement ; etl'établissement de plages de longueur d'onde d'excitation en se basant sur les plages de longueur d'onde de fluorescence sélectionnées, en empêchant ainsi les caractéristiques de fluorescence de la pluralité de substances fluorescentes d'interférer les unes avec les autres. - Procédé de détermination d'échantillon inconnu selon la revendication 1,
dans lequel l'étape d'extraction d'échantillon candidat inclut :l'identification d'une pluralité de combinaisons de substances fluorescentes lorsqu'une pluralité de combinaisons de substances fluorescentes sont déterminées dans l'étape de détermination de substances fluorescentes candidates du processus type, par extraction répétée, un nombre de fois qui est égal au nombre de combinaisons de substances fluorescentes, d'une combinaison de substances fluorescentes candidates dans l'étape de sélection de crêtes, l'étape de sélection de plages de spectre, et l'étape de sélection de sous-crêtes ; etl'extraction d'un échantillon candidat en comparant la pluralité de combinaisons identifiées de substances fluorescentes à la bibliothèque d'échantillons candidats. - Procédé de détermination d'échantillon inconnu selon la revendication 1,
dans lequel l'étape d'affichage de substances fluorescentes candidates inclut l'affichage d'une liste des noms des substances fluorescentes candidates extraites et au moins de deux paires de longueur d'onde des premières crêtes, des plages de spectre, et des ensembles d'éléments d'information de sous-crêtes sur la base desquels la caractéristique de fluorescentes a été déterminée et des coefficients de modèle. - Procédé de détermination d'échantillon inconnu selon la revendication 1,
dans lequel l'étape d'affichage d'échantillon candidat inclut l'affichage sélectif, en même temps que les noms des substances fluorescentes candidates extraites :d'une première zone dans laquelle le tableau de norme enregistré est affiché ;d'une deuxième zone dans laquelle une liste des noms des substances fluorescentes candidates extraites et au moins deux paires de longueur d'onde des premières crêtes, les plages de spectre, et des ensembles d'éléments d'information de sous-crêtes sur la base desquels la caractéristique de fluorescence a été déterminée et les coefficients de modèle sont affichés ; etd'une troisième zone dans laquelle une zone sélectionnée des spectres de fluorescence 3D qui est marquée est affichée de manière à ce qu'une substance correspondante parmi les substances fluorescentes de la liste et sa première crête soient reconnaissables.
Applications Claiming Priority (1)
| Application Number | Priority Date | Filing Date | Title |
|---|---|---|---|
| JP2016186207A JP6831094B2 (ja) | 2016-09-06 | 2016-09-06 | 未知試料判定方法、未知試料判定装置及び未知試料判定プログラム |
Publications (3)
| Publication Number | Publication Date |
|---|---|
| EP3290908A1 EP3290908A1 (fr) | 2018-03-07 |
| EP3290908B1 true EP3290908B1 (fr) | 2023-12-20 |
| EP3290908B8 EP3290908B8 (fr) | 2024-01-24 |
Family
ID=59811127
Family Applications (1)
| Application Number | Title | Priority Date | Filing Date |
|---|---|---|---|
| EP17189696.2A Active EP3290908B8 (fr) | 2016-09-06 | 2017-09-06 | Procédé de détermination d'échantillon inconnu |
Country Status (3)
| Country | Link |
|---|---|
| US (1) | US10718713B2 (fr) |
| EP (1) | EP3290908B8 (fr) |
| JP (1) | JP6831094B2 (fr) |
Families Citing this family (6)
| Publication number | Priority date | Publication date | Assignee | Title |
|---|---|---|---|---|
| WO2020053919A1 (fr) | 2018-09-10 | 2020-03-19 | 日本たばこ産業株式会社 | Procédé, programme et appareil utilisant une analyse d'empreinte de fluorescence pour quantifier des tsna dans une matière première transformée |
| CN109444071B (zh) * | 2018-12-14 | 2020-12-11 | 江苏东交工程检测股份有限公司 | 基于分波段的沥青红外光谱质量检测方法和装置 |
| JP2022061391A (ja) * | 2020-10-06 | 2022-04-18 | オリンパス株式会社 | 実験支援装置、実験支援システム、実験支援方法、プログラム |
| CN113418896B (zh) * | 2021-05-18 | 2023-01-10 | 中国农业大学 | 一种用于在线高通量检测玉米籽粒中黄曲霉毒素的方法 |
| CN114739960B (zh) * | 2022-03-18 | 2024-08-16 | 中南大学 | 一种基于荧光光谱的总氮快速检测方法、装置、设备及介质 |
| JP2024009542A (ja) * | 2022-07-11 | 2024-01-23 | 株式会社日立ハイテクサイエンス | 分光分析システム及び分光分析方法 |
Family Cites Families (11)
| Publication number | Priority date | Publication date | Assignee | Title |
|---|---|---|---|---|
| JPS5856741B2 (ja) | 1979-11-27 | 1983-12-16 | 学校法人 岐阜歯科大学 | 歯科充填材料としての水銀アマルガム用金属混合粉末 |
| US7015484B2 (en) * | 2001-04-16 | 2006-03-21 | Dakota Technologies, Inc. | Multi-dimensional fluorescence apparatus and method for rapid and highly sensitive quantitative analysis of mixtures |
| US20030215791A1 (en) * | 2002-05-20 | 2003-11-20 | Applied Spectral Imaging Ltd. | Method of and system for multiplexed analysis by spectral imaging |
| GB0719373D0 (en) * | 2007-10-04 | 2007-11-14 | Univ Cranfield | Optical multisensor |
| NZ589582A (en) * | 2010-11-29 | 2013-03-28 | Comvita Ltd | Method and Apparatus For Honey Measurement |
| JP5856741B2 (ja) | 2011-02-25 | 2016-02-10 | 国立研究開発法人農業・食品産業技術総合研究機構 | アフラトキシン定量方法、アフラトキシン定量装置、および、プログラム |
| US8901513B2 (en) * | 2011-03-08 | 2014-12-02 | Horiba Instruments, Incorporated | System and method for fluorescence and absorbance analysis |
| US8913240B2 (en) * | 2011-09-30 | 2014-12-16 | Shimadzu Corporation | Fluorescence spectrophotometer |
| JP5974559B2 (ja) * | 2012-03-14 | 2016-08-23 | 株式会社リコー | 感光体及びその製造方法 |
| WO2013190618A1 (fr) * | 2012-06-18 | 2013-12-27 | 株式会社島津製作所 | Spectrophotofluorimètre |
| JP6212454B2 (ja) | 2014-08-26 | 2017-10-11 | 国立研究開発法人農業・食品産業技術総合研究機構 | チーズの熟成度指標推定方法、チーズの熟成度指標推定装置、コンピュータが実行可能なプログラム、及びプロセスチーズの製造方法 |
-
2016
- 2016-09-06 JP JP2016186207A patent/JP6831094B2/ja active Active
-
2017
- 2017-09-06 US US15/696,392 patent/US10718713B2/en active Active
- 2017-09-06 EP EP17189696.2A patent/EP3290908B8/fr active Active
Also Published As
| Publication number | Publication date |
|---|---|
| JP6831094B2 (ja) | 2021-02-17 |
| EP3290908A1 (fr) | 2018-03-07 |
| US20180067048A1 (en) | 2018-03-08 |
| US10718713B2 (en) | 2020-07-21 |
| JP2018040779A (ja) | 2018-03-15 |
| EP3290908B8 (fr) | 2024-01-24 |
Similar Documents
| Publication | Publication Date | Title |
|---|---|---|
| EP3290908B1 (fr) | Procédé de détermination d'échantillon inconnu | |
| EP2710353B1 (fr) | Appareil spectroscopique et procédé pour déterminer les composants présents dans un échantillon | |
| EP2976620B1 (fr) | Système pour investigations par spectroscopie par claquage induit par éclairs laser (libs) et spectroscopie d'absorption infrarouge (ir) combinées, et méthode l'utilisant | |
| JP6089345B2 (ja) | 時および/または空間系列ファイルの多成分回帰/多成分分析 | |
| Mu et al. | Portable detection and quantification of olive oil adulteration by 473-nm laser-induced fluorescence | |
| US20090210194A1 (en) | Efficient spectral matching, particularly for multicomponent spectra | |
| Bricklemyer et al. | Comparing vis–NIRS, LIBS, and combined vis–NIRS‐LIBS for intact soil core soil carbon measurement | |
| Micó et al. | EEMlab: A graphical user-friendly interface for fluorimetry experiments based on the drEEM toolbox | |
| US20230375522A1 (en) | Method for analyzing soil pollution | |
| CN116030310A (zh) | 一种基于激光诱导击穿光谱技术的样品分类方法及系统 | |
| CN112673250B (zh) | 利用荧光指纹分析的处理原料中的TSNAs定量方法、程序以及装置 | |
| CN116026808A (zh) | 一种拉曼光谱判别方法和系统 | |
| KR101951758B1 (ko) | 라만 분광을 이용한 지방 혼합물 내의 돼지 지방 정량 분석 방법 및 장치 | |
| CN113435115B (zh) | 一种荧光光谱特征波长筛选方法、装置、计算机设备及可读储存介质 | |
| CN116399836A (zh) | 基于交替梯度下降算法的串扰荧光光谱分解方法 | |
| Chen et al. | Adaptive multiscale regression for reliable Raman quantitative analysis | |
| AU2019100481A4 (en) | Quick and nondestructive cubilose authenticity discrimination method | |
| Breitman et al. | Study of Raman spectra of pigment mixtures | |
| CN110582692B (zh) | 荧光分光光度计、分光测定方法以及荧光分光光度计用控制软件 | |
| Kumar | Non-negative factor (NNF) assisted partial Least Square (PLS) analysis of excitation-emission matrix fluorescence spectroscopic data sets: automating the identification and quantification of Multifluorophoric mixtures | |
| Li et al. | A spectral recovery method for Raman spectroscopy utilizing prior datasets | |
| LU502068B1 (en) | Quantitative detection method and system for cadmium in rice root systems | |
| CN111103259B (zh) | 基于光谱技术的煎炸油品质快速检测方法 | |
| Rasekh et al. | Environmental assessment of soluble solids contents and pH of orange using hyperspectral method and machine learning | |
| CN106872426A (zh) | 应用于定量荧光录井技术的内标双段法消除含油量误差的方法 |
Legal Events
| Date | Code | Title | Description |
|---|---|---|---|
| PUAI | Public reference made under article 153(3) epc to a published international application that has entered the european phase |
Free format text: ORIGINAL CODE: 0009012 |
|
| STAA | Information on the status of an ep patent application or granted ep patent |
Free format text: STATUS: THE APPLICATION HAS BEEN PUBLISHED |
|
| AK | Designated contracting states |
Kind code of ref document: A1 Designated state(s): AL AT BE BG CH CY CZ DE DK EE ES FI FR GB GR HR HU IE IS IT LI LT LU LV MC MK MT NL NO PL PT RO RS SE SI SK SM TR |
|
| AX | Request for extension of the european patent |
Extension state: BA ME |
|
| STAA | Information on the status of an ep patent application or granted ep patent |
Free format text: STATUS: REQUEST FOR EXAMINATION WAS MADE |
|
| 17P | Request for examination filed |
Effective date: 20180907 |
|
| RBV | Designated contracting states (corrected) |
Designated state(s): AL AT BE BG CH CY CZ DE DK EE ES FI FR GB GR HR HU IE IS IT LI LT LU LV MC MK MT NL NO PL PT RO RS SE SI SK SM TR |
|
| STAA | Information on the status of an ep patent application or granted ep patent |
Free format text: STATUS: EXAMINATION IS IN PROGRESS |
|
| 17Q | First examination report despatched |
Effective date: 20210429 |
|
| STAA | Information on the status of an ep patent application or granted ep patent |
Free format text: STATUS: EXAMINATION IS IN PROGRESS |
|
| GRAP | Despatch of communication of intention to grant a patent |
Free format text: ORIGINAL CODE: EPIDOSNIGR1 |
|
| STAA | Information on the status of an ep patent application or granted ep patent |
Free format text: STATUS: GRANT OF PATENT IS INTENDED |
|
| RIC1 | Information provided on ipc code assigned before grant |
Ipc: G01J 3/28 20060101ALN20230628BHEP Ipc: G01J 3/02 20060101ALI20230628BHEP Ipc: G01J 3/44 20060101ALI20230628BHEP Ipc: G01J 1/02 20060101ALI20230628BHEP Ipc: G01N 21/27 20060101ALI20230628BHEP Ipc: G01N 21/64 20060101AFI20230628BHEP |
|
| INTG | Intention to grant announced |
Effective date: 20230713 |
|
| GRAS | Grant fee paid |
Free format text: ORIGINAL CODE: EPIDOSNIGR3 |
|
| GRAA | (expected) grant |
Free format text: ORIGINAL CODE: 0009210 |
|
| STAA | Information on the status of an ep patent application or granted ep patent |
Free format text: STATUS: THE PATENT HAS BEEN GRANTED |
|
| AK | Designated contracting states |
Kind code of ref document: B1 Designated state(s): AL AT BE BG CH CY CZ DE DK EE ES FI FR GB GR HR HU IE IS IT LI LT LU LV MC MK MT NL NO PL PT RO RS SE SI SK SM TR |
|
| REG | Reference to a national code |
Ref country code: GB Ref legal event code: FG4D |
|
| RAP4 | Party data changed (patent owner data changed or rights of a patent transferred) |
Owner name: HITACHI HIGH-TECH SCIENCE CORPORATION |
|
| RIN2 | Information on inventor provided after grant (corrected) |
Inventor name: KOZUMA, MICHINARI Inventor name: HOSEN, YUSUKE Inventor name: SATO, YOICHI Inventor name: NAKAMURA, KOICHI Inventor name: HORIGOME, JUN |
|
| REG | Reference to a national code |
Ref country code: DE Ref legal event code: R096 Ref document number: 602017077649 Country of ref document: DE |
|
| REG | Reference to a national code |
Ref country code: CH Ref legal event code: PK Free format text: BERICHTIGUNG B8 Ref country code: CH Ref legal event code: EP |
|
| REG | Reference to a national code |
Ref country code: IE Ref legal event code: FG4D |
|
| PG25 | Lapsed in a contracting state [announced via postgrant information from national office to epo] |
Ref country code: GR Free format text: LAPSE BECAUSE OF FAILURE TO SUBMIT A TRANSLATION OF THE DESCRIPTION OR TO PAY THE FEE WITHIN THE PRESCRIBED TIME-LIMIT Effective date: 20240321 |
|
| REG | Reference to a national code |
Ref country code: LT Ref legal event code: MG9D |
|
| PG25 | Lapsed in a contracting state [announced via postgrant information from national office to epo] |
Ref country code: LT Free format text: LAPSE BECAUSE OF FAILURE TO SUBMIT A TRANSLATION OF THE DESCRIPTION OR TO PAY THE FEE WITHIN THE PRESCRIBED TIME-LIMIT Effective date: 20231220 |
|
| REG | Reference to a national code |
Ref country code: NL Ref legal event code: MP Effective date: 20231220 |
|
| PG25 | Lapsed in a contracting state [announced via postgrant information from national office to epo] |
Ref country code: ES Free format text: LAPSE BECAUSE OF FAILURE TO SUBMIT A TRANSLATION OF THE DESCRIPTION OR TO PAY THE FEE WITHIN THE PRESCRIBED TIME-LIMIT Effective date: 20231220 |
|
| PG25 | Lapsed in a contracting state [announced via postgrant information from national office to epo] |
Ref country code: LT Free format text: LAPSE BECAUSE OF FAILURE TO SUBMIT A TRANSLATION OF THE DESCRIPTION OR TO PAY THE FEE WITHIN THE PRESCRIBED TIME-LIMIT Effective date: 20231220 Ref country code: GR Free format text: LAPSE BECAUSE OF FAILURE TO SUBMIT A TRANSLATION OF THE DESCRIPTION OR TO PAY THE FEE WITHIN THE PRESCRIBED TIME-LIMIT Effective date: 20240321 Ref country code: FI Free format text: LAPSE BECAUSE OF FAILURE TO SUBMIT A TRANSLATION OF THE DESCRIPTION OR TO PAY THE FEE WITHIN THE PRESCRIBED TIME-LIMIT Effective date: 20231220 Ref country code: ES Free format text: LAPSE BECAUSE OF FAILURE TO SUBMIT A TRANSLATION OF THE DESCRIPTION OR TO PAY THE FEE WITHIN THE PRESCRIBED TIME-LIMIT Effective date: 20231220 Ref country code: BG Free format text: LAPSE BECAUSE OF FAILURE TO SUBMIT A TRANSLATION OF THE DESCRIPTION OR TO PAY THE FEE WITHIN THE PRESCRIBED TIME-LIMIT Effective date: 20240320 |
|
| REG | Reference to a national code |
Ref country code: AT Ref legal event code: MK05 Ref document number: 1642867 Country of ref document: AT Kind code of ref document: T Effective date: 20231220 |
|
| PG25 | Lapsed in a contracting state [announced via postgrant information from national office to epo] |
Ref country code: NL Free format text: LAPSE BECAUSE OF FAILURE TO SUBMIT A TRANSLATION OF THE DESCRIPTION OR TO PAY THE FEE WITHIN THE PRESCRIBED TIME-LIMIT Effective date: 20231220 |
|
| PG25 | Lapsed in a contracting state [announced via postgrant information from national office to epo] |
Ref country code: SE Free format text: LAPSE BECAUSE OF FAILURE TO SUBMIT A TRANSLATION OF THE DESCRIPTION OR TO PAY THE FEE WITHIN THE PRESCRIBED TIME-LIMIT Effective date: 20231220 Ref country code: RS Free format text: LAPSE BECAUSE OF FAILURE TO SUBMIT A TRANSLATION OF THE DESCRIPTION OR TO PAY THE FEE WITHIN THE PRESCRIBED TIME-LIMIT Effective date: 20231220 Ref country code: NO Free format text: LAPSE BECAUSE OF FAILURE TO SUBMIT A TRANSLATION OF THE DESCRIPTION OR TO PAY THE FEE WITHIN THE PRESCRIBED TIME-LIMIT Effective date: 20240320 Ref country code: NL Free format text: LAPSE BECAUSE OF FAILURE TO SUBMIT A TRANSLATION OF THE DESCRIPTION OR TO PAY THE FEE WITHIN THE PRESCRIBED TIME-LIMIT Effective date: 20231220 Ref country code: LV Free format text: LAPSE BECAUSE OF FAILURE TO SUBMIT A TRANSLATION OF THE DESCRIPTION OR TO PAY THE FEE WITHIN THE PRESCRIBED TIME-LIMIT Effective date: 20231220 Ref country code: HR Free format text: LAPSE BECAUSE OF FAILURE TO SUBMIT A TRANSLATION OF THE DESCRIPTION OR TO PAY THE FEE WITHIN THE PRESCRIBED TIME-LIMIT Effective date: 20231220 |
|
| PG25 | Lapsed in a contracting state [announced via postgrant information from national office to epo] |
Ref country code: IS Free format text: LAPSE BECAUSE OF FAILURE TO SUBMIT A TRANSLATION OF THE DESCRIPTION OR TO PAY THE FEE WITHIN THE PRESCRIBED TIME-LIMIT Effective date: 20240420 |
|
| PG25 | Lapsed in a contracting state [announced via postgrant information from national office to epo] |
Ref country code: AT Free format text: LAPSE BECAUSE OF FAILURE TO SUBMIT A TRANSLATION OF THE DESCRIPTION OR TO PAY THE FEE WITHIN THE PRESCRIBED TIME-LIMIT Effective date: 20231220 Ref country code: CZ Free format text: LAPSE BECAUSE OF FAILURE TO SUBMIT A TRANSLATION OF THE DESCRIPTION OR TO PAY THE FEE WITHIN THE PRESCRIBED TIME-LIMIT Effective date: 20231220 |
|
| PG25 | Lapsed in a contracting state [announced via postgrant information from national office to epo] |
Ref country code: SK Free format text: LAPSE BECAUSE OF FAILURE TO SUBMIT A TRANSLATION OF THE DESCRIPTION OR TO PAY THE FEE WITHIN THE PRESCRIBED TIME-LIMIT Effective date: 20231220 |
|
| PG25 | Lapsed in a contracting state [announced via postgrant information from national office to epo] |
Ref country code: SM Free format text: LAPSE BECAUSE OF FAILURE TO SUBMIT A TRANSLATION OF THE DESCRIPTION OR TO PAY THE FEE WITHIN THE PRESCRIBED TIME-LIMIT Effective date: 20231220 Ref country code: SK Free format text: LAPSE BECAUSE OF FAILURE TO SUBMIT A TRANSLATION OF THE DESCRIPTION OR TO PAY THE FEE WITHIN THE PRESCRIBED TIME-LIMIT Effective date: 20231220 Ref country code: RO Free format text: LAPSE BECAUSE OF FAILURE TO SUBMIT A TRANSLATION OF THE DESCRIPTION OR TO PAY THE FEE WITHIN THE PRESCRIBED TIME-LIMIT Effective date: 20231220 Ref country code: IT Free format text: LAPSE BECAUSE OF FAILURE TO SUBMIT A TRANSLATION OF THE DESCRIPTION OR TO PAY THE FEE WITHIN THE PRESCRIBED TIME-LIMIT Effective date: 20231220 Ref country code: IS Free format text: LAPSE BECAUSE OF FAILURE TO SUBMIT A TRANSLATION OF THE DESCRIPTION OR TO PAY THE FEE WITHIN THE PRESCRIBED TIME-LIMIT Effective date: 20240420 Ref country code: EE Free format text: LAPSE BECAUSE OF FAILURE TO SUBMIT A TRANSLATION OF THE DESCRIPTION OR TO PAY THE FEE WITHIN THE PRESCRIBED TIME-LIMIT Effective date: 20231220 Ref country code: CZ Free format text: LAPSE BECAUSE OF FAILURE TO SUBMIT A TRANSLATION OF THE DESCRIPTION OR TO PAY THE FEE WITHIN THE PRESCRIBED TIME-LIMIT Effective date: 20231220 Ref country code: AT Free format text: LAPSE BECAUSE OF FAILURE TO SUBMIT A TRANSLATION OF THE DESCRIPTION OR TO PAY THE FEE WITHIN THE PRESCRIBED TIME-LIMIT Effective date: 20231220 |
|
| PG25 | Lapsed in a contracting state [announced via postgrant information from national office to epo] |
Ref country code: PT Free format text: LAPSE BECAUSE OF FAILURE TO SUBMIT A TRANSLATION OF THE DESCRIPTION OR TO PAY THE FEE WITHIN THE PRESCRIBED TIME-LIMIT Effective date: 20240422 Ref country code: PL Free format text: LAPSE BECAUSE OF FAILURE TO SUBMIT A TRANSLATION OF THE DESCRIPTION OR TO PAY THE FEE WITHIN THE PRESCRIBED TIME-LIMIT Effective date: 20231220 |