EP3267182B1 - Optical measuring device and toothbrush provided with same - Google Patents
Optical measuring device and toothbrush provided with same Download PDFInfo
- Publication number
- EP3267182B1 EP3267182B1 EP16758892.0A EP16758892A EP3267182B1 EP 3267182 B1 EP3267182 B1 EP 3267182B1 EP 16758892 A EP16758892 A EP 16758892A EP 3267182 B1 EP3267182 B1 EP 3267182B1
- Authority
- EP
- European Patent Office
- Prior art keywords
- light
- fluorescence
- wavelength
- light source
- intensity
- Prior art date
- Legal status (The legal status is an assumption and is not a legal conclusion. Google has not performed a legal analysis and makes no representation as to the accuracy of the status listed.)
- Active
Links
- 230000003287 optical effect Effects 0.000 title claims description 138
- 208000002064 Dental Plaque Diseases 0.000 claims description 144
- 238000001514 detection method Methods 0.000 claims description 95
- 239000000126 substance Substances 0.000 claims description 89
- 230000005284 excitation Effects 0.000 claims description 80
- 238000001228 spectrum Methods 0.000 claims description 44
- 239000000203 mixture Substances 0.000 claims description 31
- 230000007613 environmental effect Effects 0.000 claims description 14
- 238000009826 distribution Methods 0.000 claims description 13
- 230000003247 decreasing effect Effects 0.000 claims description 6
- KSFOVUSSGSKXFI-GAQDCDSVSA-N CC1=C/2NC(\C=C3/N=C(/C=C4\N\C(=C/C5=N/C(=C\2)/C(C=C)=C5C)C(C=C)=C4C)C(C)=C3CCC(O)=O)=C1CCC(O)=O Chemical group CC1=C/2NC(\C=C3/N=C(/C=C4\N\C(=C/C5=N/C(=C\2)/C(C=C)=C5C)C(C=C)=C4C)C(C)=C3CCC(O)=O)=C1CCC(O)=O KSFOVUSSGSKXFI-GAQDCDSVSA-N 0.000 claims description 2
- 229950003776 protoporphyrin Drugs 0.000 claims description 2
- 230000004044 response Effects 0.000 claims description 2
- 230000014509 gene expression Effects 0.000 description 29
- 238000000034 method Methods 0.000 description 28
- 238000012545 processing Methods 0.000 description 18
- 238000002189 fluorescence spectrum Methods 0.000 description 15
- 238000005259 measurement Methods 0.000 description 15
- 238000009833 condensation Methods 0.000 description 12
- 230000005494 condensation Effects 0.000 description 12
- 230000001678 irradiating effect Effects 0.000 description 12
- 208000002925 dental caries Diseases 0.000 description 11
- 238000004364 calculation method Methods 0.000 description 9
- 230000000694 effects Effects 0.000 description 9
- 230000035945 sensitivity Effects 0.000 description 9
- 238000010521 absorption reaction Methods 0.000 description 8
- 230000007423 decrease Effects 0.000 description 8
- 230000006870 function Effects 0.000 description 7
- 238000012937 correction Methods 0.000 description 6
- 210000003298 dental enamel Anatomy 0.000 description 6
- 238000010586 diagram Methods 0.000 description 6
- 238000001506 fluorescence spectroscopy Methods 0.000 description 5
- 239000004033 plastic Substances 0.000 description 5
- 241000894006 Bacteria Species 0.000 description 4
- 238000004458 analytical method Methods 0.000 description 4
- 230000008859 change Effects 0.000 description 4
- 239000000463 material Substances 0.000 description 4
- 230000005855 radiation Effects 0.000 description 4
- 239000000853 adhesive Substances 0.000 description 3
- 230000001070 adhesive effect Effects 0.000 description 3
- 230000001680 brushing effect Effects 0.000 description 3
- 238000006243 chemical reaction Methods 0.000 description 3
- 238000002474 experimental method Methods 0.000 description 3
- 239000000835 fiber Substances 0.000 description 3
- 208000028169 periodontal disease Diseases 0.000 description 3
- 238000012935 Averaging Methods 0.000 description 2
- 101150074789 Timd2 gene Proteins 0.000 description 2
- 238000000149 argon plasma sintering Methods 0.000 description 2
- 230000001580 bacterial effect Effects 0.000 description 2
- 239000011248 coating agent Substances 0.000 description 2
- 238000000576 coating method Methods 0.000 description 2
- 238000004891 communication Methods 0.000 description 2
- 230000008021 deposition Effects 0.000 description 2
- 238000013461 design Methods 0.000 description 2
- 238000005516 engineering process Methods 0.000 description 2
- 238000010348 incorporation Methods 0.000 description 2
- 230000010355 oscillation Effects 0.000 description 2
- 239000002245 particle Substances 0.000 description 2
- 239000000758 substrate Substances 0.000 description 2
- 208000005888 Periodontal Pocket Diseases 0.000 description 1
- 208000008617 Tooth Demineralization Diseases 0.000 description 1
- 206010072665 Tooth demineralisation Diseases 0.000 description 1
- 230000009471 action Effects 0.000 description 1
- 238000013459 approach Methods 0.000 description 1
- 230000015572 biosynthetic process Effects 0.000 description 1
- 239000003795 chemical substances by application Substances 0.000 description 1
- 238000004590 computer program Methods 0.000 description 1
- 230000008878 coupling Effects 0.000 description 1
- 238000010168 coupling process Methods 0.000 description 1
- 238000005859 coupling reaction Methods 0.000 description 1
- 230000001419 dependent effect Effects 0.000 description 1
- 238000011161 development Methods 0.000 description 1
- 230000018109 developmental process Effects 0.000 description 1
- 230000004069 differentiation Effects 0.000 description 1
- 230000008030 elimination Effects 0.000 description 1
- 238000003379 elimination reaction Methods 0.000 description 1
- 238000000295 emission spectrum Methods 0.000 description 1
- 238000001917 fluorescence detection Methods 0.000 description 1
- 239000011521 glass Substances 0.000 description 1
- 238000005286 illumination Methods 0.000 description 1
- 230000006872 improvement Effects 0.000 description 1
- 230000001788 irregular Effects 0.000 description 1
- 239000004973 liquid crystal related substance Substances 0.000 description 1
- 230000007246 mechanism Effects 0.000 description 1
- 239000002184 metal Substances 0.000 description 1
- 238000012544 monitoring process Methods 0.000 description 1
- 238000010606 normalization Methods 0.000 description 1
- 239000013307 optical fiber Substances 0.000 description 1
- 230000002265 prevention Effects 0.000 description 1
- 238000011158 quantitative evaluation Methods 0.000 description 1
- 239000011347 resin Substances 0.000 description 1
- 229920005989 resin Polymers 0.000 description 1
- 230000000630 rising effect Effects 0.000 description 1
- 238000007789 sealing Methods 0.000 description 1
- 239000004065 semiconductor Substances 0.000 description 1
- 238000003786 synthesis reaction Methods 0.000 description 1
- 238000012360 testing method Methods 0.000 description 1
- 238000013519 translation Methods 0.000 description 1
- 238000002834 transmittance Methods 0.000 description 1
Images


Classifications
-
- A—HUMAN NECESSITIES
- A61—MEDICAL OR VETERINARY SCIENCE; HYGIENE
- A61B—DIAGNOSIS; SURGERY; IDENTIFICATION
- A61B5/00—Measuring for diagnostic purposes; Identification of persons
- A61B5/0059—Measuring for diagnostic purposes; Identification of persons using light, e.g. diagnosis by transillumination, diascopy, fluorescence
- A61B5/0082—Measuring for diagnostic purposes; Identification of persons using light, e.g. diagnosis by transillumination, diascopy, fluorescence adapted for particular medical purposes
- A61B5/0088—Measuring for diagnostic purposes; Identification of persons using light, e.g. diagnosis by transillumination, diascopy, fluorescence adapted for particular medical purposes for oral or dental tissue
-
- A—HUMAN NECESSITIES
- A46—BRUSHWARE
- A46B—BRUSHES
- A46B15/00—Other brushes; Brushes with additional arrangements
- A46B15/0002—Arrangements for enhancing monitoring or controlling the brushing process
- A46B15/0016—Arrangements for enhancing monitoring or controlling the brushing process with enhancing means
- A46B15/0036—Arrangements for enhancing monitoring or controlling the brushing process with enhancing means with a lighting means, e.g. laser, bulb
-
- A—HUMAN NECESSITIES
- A46—BRUSHWARE
- A46B—BRUSHES
- A46B9/00—Arrangements of the bristles in the brush body
- A46B9/02—Position or arrangement of bristles in relation to surface of the brush body, e.g. inclined, in rows, in groups
- A46B9/04—Arranged like in or for toothbrushes
-
- A—HUMAN NECESSITIES
- A61—MEDICAL OR VETERINARY SCIENCE; HYGIENE
- A61B—DIAGNOSIS; SURGERY; IDENTIFICATION
- A61B1/00—Instruments for performing medical examinations of the interior of cavities or tubes of the body by visual or photographical inspection, e.g. endoscopes; Illuminating arrangements therefor
- A61B1/24—Instruments for performing medical examinations of the interior of cavities or tubes of the body by visual or photographical inspection, e.g. endoscopes; Illuminating arrangements therefor for the mouth, i.e. stomatoscopes, e.g. with tongue depressors; Instruments for opening or keeping open the mouth
-
- A—HUMAN NECESSITIES
- A61—MEDICAL OR VETERINARY SCIENCE; HYGIENE
- A61C—DENTISTRY; APPARATUS OR METHODS FOR ORAL OR DENTAL HYGIENE
- A61C17/00—Devices for cleaning, polishing, rinsing or drying teeth, teeth cavities or prostheses; Saliva removers; Dental appliances for receiving spittle
- A61C17/16—Power-driven cleaning or polishing devices
- A61C17/22—Power-driven cleaning or polishing devices with brushes, cushions, cups, or the like
- A61C17/221—Control arrangements therefor
-
- G—PHYSICS
- G01—MEASURING; TESTING
- G01N—INVESTIGATING OR ANALYSING MATERIALS BY DETERMINING THEIR CHEMICAL OR PHYSICAL PROPERTIES
- G01N21/00—Investigating or analysing materials by the use of optical means, i.e. using sub-millimetre waves, infrared, visible or ultraviolet light
- G01N21/62—Systems in which the material investigated is excited whereby it emits light or causes a change in wavelength of the incident light
- G01N21/63—Systems in which the material investigated is excited whereby it emits light or causes a change in wavelength of the incident light optically excited
- G01N21/64—Fluorescence; Phosphorescence
-
- A—HUMAN NECESSITIES
- A46—BRUSHWARE
- A46B—BRUSHES
- A46B2200/00—Brushes characterized by their functions, uses or applications
- A46B2200/10—For human or animal care
- A46B2200/1066—Toothbrush for cleaning the teeth or dentures
Definitions
- the present invention relates to an optical measuring device that detects examined light generated from dental plaque adhering to a tooth.
- Dental plaque can be effectively removed in a short time by concentratedly brushing a portion to which the dental plaque adheres while monitoring the adhering amount of the dental plaque. Therefore, several methods for optically detecting dental plaque have been conventionally proposed. Typical examples thereof include a method utilizing the fact that bacteria included in dental plaque or bacteria in dental caries produce protoporphyrin IX (hereinafter referred to as "PPIX”), which is a fluorescent substance, in the intraoral environment.
- PPIX protoporphyrin IX
- a fluorescence measuring method has been known in which a tooth is irradiated with excitation light having a certain wavelength, and fluorescence emitted by a fluorescent substance is detected, thereby quantitating the amount of dental plaque or the degree of dental caries.
- fluorescence spectra from enamel obtained by irradiating the enamel of a healthy tooth and the enamel of a carious tooth only with excitation light having a wavelength of 406 nm are illustrated in Patent Literature 1. Peaks at wavelengths of 636 nm and 673 nm indicate fluorescent emissions peculiar to carious enamel. Measurement of such fluorescence enables discrimination between the enamel of a healthy tooth and the enamel of a carious tooth. It is found that examination of a fluorescence spectrum is effective for diagnosing dental caries, because the shape of the fluorescence spectrum is obviously changed due to a worsening of dental caries.
- Patent Literature 1 describes a method in which the amount S1 of fluorescence having a wavelength band of 636 nm or 673 nm and the amount S2 of fluorescence having a band of 550 nm are measured using a filter, and the ratio S1/S2 thereof is used for quantitative evaluation of dental caries.
- Patent Literature 2 The autofluorescence spectrum of a tooth from a tooth surface from which a biological deposit has been removed, and a fluorescence spectrum from a tooth surface covered with a new dental plaque layer are illustrated in Patent Literature 2.
- the spectra are measured using an excitation light sources at a wavelength of 420 nm or less.
- Patent Literature 2 illustrates a magnified view of a region indicating the intensity of autofluorescence at a wavelength longer than 530 nm, and represents that the autofluorescence intensity is decreased with gradually increasing a biological deposition layer. This can be understood to be because excitation light is absorbed or scattered by the dental plaque layer, whereby the intensity of excitation light arriving at the tooth surface is decreased, and thus the autofluorescence from the tooth is reduced.
- Patent Literature 2 also describes that the maximum values of strongly emitted light are observed at 530 nm and 630 nm in a fluorescence spectrum obtained from a test tooth surface with a thick layer of a biological deposit considered to be new dental plaque.
- fluorescence from dental plaque is not directly detected, but a tooth is irradiated with blue light at 480 nm, and the autofluorescence components of the tooth in reflected light are measured using a dichroic mirror. Then, a change in the intensity of autofluorescence from the tooth in movement of a toothbrush along the tooth in toothbrushing is observed to determine whether there is a biological deposition layer or not.
- Patent Literature 3 describes a method for preventing the amount of plaque detected by a toothbrush-type plaque detection device from changing even when a distance between a tooth and a toothbrush is changed.
- Patent Literature 3 primarily describes a method for quantifying secondary fluorescence from a fluorescent agent bound to plaque. This method compensates for an apparent variation in the amount of plaque due to the distance by using a signal from an amplifier, i.e., the total amount of the fluorescence components and reflection components of excitation light.
- a compensated plaque value is determined using a compensation equation in which a coefficient has been determined by measurement performed in advance.
- the US 2003/156788 A1 discloses a method and a device for the detection of caries, plaque, calculus, bacterial attack, etc.
- the WO 2014/097135 A1 discloses a dental apparatus.
- the dental apparatus includes a handle.
- a controller operably couples to the housing.
- a subsystem is in operable communication with the controller and configured to generate an excitation signal causing an emitted fluorescence light to be reflected back to the subsystem and to the controller for analyzing one or more properties of the emitted fluorescence light.
- the one or more properties are corresponding to a decay time of the emitted fluorescence light, wherein plaque emitted florescence light decays faster than tooth emitted florescence light.
- the controller is programmed to analyze detected emitted fluorescence light to determine if the emitted fluorescence light is indicative of a plaque emitted fluorescence decay time or tooth emitted florescence light decay time to detect the presence of one of dental plaque and tooth demineralization.
- the US 2007/105069 A1 discloses a dental caries detecting system including an ultraviolet irradiation device, a fluorescence receiving device that receives fluorescence from a tooth based on ultraviolet irradiation from the ultraviolet irradiation device, a fluorescence data analysis portion that analyzes fluorescence data transmitted from the fluorescence receiving device, and a display that displays analysis data analyzed by the fluorescence data analysis portion.
- the fluorescence data analysis portion is adapted to analyze said fluorescence data based on the fluorescence intensities in at least two wavelength bands in a visible light range.
- Patent Literature 1 when the amount of dental plaque adhering to a surface of a tooth is small, the amount of detected fluorescence is changed by the influence of environmental light and a distance between the tooth and a detector due to little fluorescence from the dental plaque, and it is therefore difficult to detect a slight amount of dental plaque adhering to a surface of a healthy tooth.
- the configuration of Patent Literature 1 has the effect of compensating for a fluctuation due to a distance between a tooth and the detector by determining the ratio S1/S2 between the fluorescence intensities in the two wavelength regions selected by the optical filter among fluorescence intensities obtained by irradiating the tooth with light at a certain wavelength.
- the fluorescence components may be selected as components in the two wavelength regions, the configuration of the optical filter is complicated, which may become an impediment to incorporation of the optical filter into a toothbrush.
- Patent Literature 2 when the amount of dental plaque is small, the amount of change in the attenuation of intrinsic fluorescence is also small, and a measurement error may therefore be increased due to the influence of a distance between a detection unit and a tooth, generated by movement of a brush in toothbrushing. Primarily, there is concern about no detection of fluorescence proportional to the amount of bacteria causing tooth decay and periodontal diseases.
- Patent Literature 3 it may be difficult to detect a small amount of dental plaque, because the amount of fluorescence including intrinsic fluorescence from a tooth is primarily measured as the amount of the plaque.
- the compensation for the amount of the plaque due to the distance is effective; but there remains a possibility that an error is caused due to an individual difference in the case of incorporation into the toothbrush, a positional relationship between the toothbrush and the tooth, and the like because the coefficient in the compensation equation is determined by the measurement performed in advance.
- An object of the present invention is to provide an optical measuring device that can properly detect a small amount of dental plaque, can be easily incorporated into a toothbrush, and has a simple configuration.
- a fluorescence measuring device that irradiates a sample with light having wavelengths different from each other and measures intensities of fluorescence generated from the sample
- the fluorescence measuring device including a first light source that emits light having a first wavelength, a second light source that emits light having a second wavelength longer than the wavelength of the light emitted by the first light source, a detection unit that detects intensities of fluorescence generated when the same sample is irradiated with the light having the first wavelength and the light having the second wavelength, and a control unit that calculates an amount of fluorescent substance to be measured, based on a first intensity of fluorescence detected by the detection unit when the sample is irradiated with the light having the first wavelength and a second intensity of fluorescence detected by the detection unit when the sample is irradiated with the light having the second wavelength.
- an optical measuring device including a plurality of light sources that irradiate a sample with light having a plurality of wavelengths different from each other, respectively, a detection unit that detects intensities of examined light generated when the sample is irradiated with the light having the plurality of wavelengths, and a control unit that calculates an amount of fluorescent substance to be measured, based on the intensities of the examined light detected by the detection unit in response to the light having the plurality of wavelengths.
- the plurality of light sources include a first light source that emits light having a first wavelength, and a second light source that emits light having a second wavelength longer than the wavelength of the light emitted by the first light source, the detection unit detects a first intensity of fluorescence generated when the sample is irradiated with the light having the first wavelength, and a second intensity of fluorescence generated when the sample is irradiated with the light having the second wavelength, and the control unit calculates the amount of the fluorescent substance using a difference or ratio between the first intensity of the fluorescence and the second intensity of the fluorescence.
- the sample is irradiated alternately with the light having the first wavelength and the light having the second wavelength.
- the first wavelength is a wavelength in a range from 350 nm to 430 nm
- the second wavelength is a wavelength in a range from 435 nm to 500 nm.
- the first and second wavelengths are wavelengths in a range from 350 nm to 430 nm, and a difference between the first wavelength and the light of the second wavelength is 5 nm or more.
- the above optical measuring device further includes a color mixture unit that uniformalizes intensity distributions in a surface irradiated with the light emitted from the first light source and the second light source.
- the detection unit includes an optical filter for receiving light that cuts a wavelength region excluding a range of a wavelength of fluorescence emitted by a fluorescent substance to be measured, contained in the sample.
- the above optical measuring device further includes an optical filter for emitting light that cuts a wavelength region excluding the wavelengths of the light from the first light source and the second light source.
- the plurality of light sources include an optical waveguide for emitting light, through which the light having the first wavelength and the light having the second wavelength with which the sample is irradiated are guided
- the detection unit includes an optical waveguide for receiving light, through which the detected examined light is guided, and the optical waveguide for emitting light and the optical waveguide for receiving light are formed by a same optical waveguide.
- the plurality of light sources include a first light source that emits light having a first wavelength, and a second light source that emits light having a second wavelength longer than the wavelength of the light emitted by the first light source, the detection unit detects a first intensity of light reflected when the sample is irradiated with the light having the first wavelength, and a second intensity of light reflected when the sample is irradiated with the light having the second wavelength, and the control unit calculates the amount of the fluorescent substance using a difference or ratio between the first intensity of the reflected light and the second intensity of the reflected light.
- the above optical measuring device can also be included in a toothbrush.
- This optical measuring method includes: alternately irradiating the same tooth with excitation light having two different wavelengths; detecting fluorescence generated on the tooth due to the excitation light having the respective wavelengths, in a fluorescence wavelength region originating from dental plaque; and separating and detecting fluorescence to be measured that is superimposed on intrinsic fluorescence from the tooth and originates from the dental plaque, by using a ratio or difference between the intensities of the fluorescence.
- FIG. 1 is a graph illustrating the spectra of light obtained from a clean tooth and a tooth to which dental plaque adheres, respectively, when the teeth are irradiated with purple light having a peak wavelength of 405 nm as a first wavelength.
- the horizontal axis of the graph indicates a wavelength ⁇ (nm), while the vertical axis of the graph indicates a fluorescence intensity I which is a first fluorescence intensity.
- a thin line represents a spectrum S1 obtained from the clean tooth, while a thick line represents a spectrum S1' obtained from the tooth to which the dental plaque adheres.
- a peak E1 at around 405 nm represents excitation light detected due to reflection or scattering of purple light of 405 nm, with which the irradiation has been performed, by a tooth surface.
- Broad fluorescence having a peak P0 at around 500 nm is intrinsic fluorescence from the teeth.
- Peaks P1 and P2 at around 635 nm and around 675 nm represent fluorescence spectra obtained from a fluorescent substance PPIX included in the dental plaque.
- the peaks P1 and P2 originating from the dental plaque are not observed in the spectrum S1 obtained from the clean tooth, whereas the peaks P1 and P2 of fluorescence originating from the dental plaque are observed in the spectrum S1' obtained from the tooth to which the dental plaque adheres.
- the spectrum S1' undergoes a uniform attenuation in the entire wavelength region in comparison with the spectrum S1. This attenuation is an attenuation caused by absorption of excitation light by the adhering dental plaque, depends on the amount of the dental plaque, and represents an approximately uniform attenuation without depending on a wavelength.
- FIG. 2 is a graph illustrating the spectra of light obtained from a clean tooth and a tooth to which dental plaque adheres, respectively, when the teeth are irradiated with blue light having a peak wavelength of 465 nm as a second wavelength.
- the horizontal axis of the graph indicates a wavelength ⁇ (nm)
- the vertical axis of the graph indicates a fluorescence intensity I which is a second fluorescence intensity.
- a thin line represents a spectrum S2 obtained from the clean tooth
- a thick line represents a spectrum S2' obtained from the tooth to which the dental plaque adheres.
- the broad peak P0 of intrinsic fluorescence from the teeth is observed similarly in the case of the irradiation with purple light having a wavelength of 405 nm; however, since PPIX is weakly excited, peaks P1 and P2 originating from the dental plaque are not observed. Accordingly, the component t2' of the intrinsic fluorescence from the teeth excited at the second wavelength can be substituted for the component t1' of the intrinsic fluorescence excited at the first wavelength, and the amount ⁇ p of fluorescent substance originating from the dental plaque can be determined on an approximate basis by the following mathematical expression (2). ⁇ p ⁇ p1' ⁇ t2'
- the fluorescence that is superimposed on the intrinsic fluorescence from the teeth and originates from the dental plaque can be separated and detected by alternately irradiating the teeth with the excitation light having the two different wavelengths, detecting, in the fluorescence wavelength region originating from the dental plaque, fluorescence generated on the teeth by the excitation light having the respective wavelengths, and using a ratio or difference between the first fluorescence intensity and the second fluorescence intensity which are the intensities of the fluorescence.
- FIG. 3 is a configuration view of a fluorescence measuring device 1.
- the fluorescence measuring device 1 is an example of optical measuring devices using fluorescence as examined light.
- the fluorescence measuring device 1 includes three blocks of a light source unit 100 for exciting a fluorescent substance included in dental plaque, a detection unit 200 for detecting the intensities of fluorescence generated on a tooth surface, and a control unit 300 for determining the adhering amount of the dental plaque from the measured fluorescence intensities and notifying a user of the amount.
- the light source unit 100 includes a first light source 2 that emits light at a first wavelength, a second light source 3 that emits light at a second wavelength, a color mixture unit 4, an optical filter 5 for emitting light, an optical waveguide 6 for emitting light, and a light condensation unit 7 for emitting light.
- the color mixture unit 4, the optical filter 5 for emitting light, the optical waveguide 6 for emitting light, and the light condensation unit 7 for emitting light are included in a light path portion for irradiating a tooth to be measured with light from the first light source 2 and the second light source 3.
- Light-emitting diodes and semiconductor lasers which are small-sized and inexpensive can be used as the first light source 2 and the second light source 3.
- the wavelengths of light generated by the first light source 2 or the second light source 3 are selected as follows.
- the first wavelength is included in wavelengths with high excitation efficiency for a fluorescent substance included in dental plaque, and the second wavelength is set at a wavelength which is longer than the first wavelength and of which the excitation efficiency is lower than that of the first wavelength or is approximately zero.
- the first wavelength is preferably in a range from 350 nm to 430 nm
- the second wavelength is preferably in a range from 435 nm to 500 nm.
- the first light source 2 may be a purple LED having a peak wavelength of 405 nm
- the second light source 3 may be a blue LED having a peak wavelength of 465 nm.
- the color mixture unit 4 has the function of uniformalizing light intensity distributions in a surface irradiated with light between light having the first wavelength and light having the second wavelength, in order to prevent color unevenness from occurring when the tooth to be measured is irradiated with light generated by the first light source 2 and the second light source 3. It is important to allow the light intensity distributions between light having the first wavelength and light having the second wavelength to be coincident with each other, and it is allowable that the light intensity distributions are present. Therefore, the freedom of design of the color mixture unit 4 becomes relatively higher.
- the optical filter 5 for emitting light is a filter through which light from the first light source 2 and the second light source 3 passes, and which cuts fluorescence in a wavelength region originating from dental plaque.
- a short-pass filter is used as the optical filter 5 for emitting light, it is preferable to select a cutoff wavelength that is sufficiently longer than the second wavelength and is sufficiently shorter than the fluorescence wavelength of a fluorescent substance included in dental plaque.
- the setting of cutting wavelengths of 500 nm or more is performed.
- the optical waveguide 6 for emitting light is used for guiding light from the first light source 2 or the second light source 3 to the vicinity of the tooth to be measured without attenuating the light.
- Plastic or glass can be used as the material of the optical waveguide 6 for emitting light. It is more preferable to form a mirror coating on the outer periphery of the optical waveguide 6 for emitting light, thereby preventing light from leaking.
- a hollow optical waveguide surrounded by a mirror, such as a light pipe, can also be used as the optical waveguide 6 for emitting light.
- the light condensation unit 7 for emitting light includes a lens for condensing, into about the size of a tooth, light which propagates into the optical waveguide 6 for emitting light, and for performing irradiation with the light.
- the detection unit 200 includes a light condensation unit 21 for receiving light, an optical waveguide 22 for receiving light, an optical filter 23 for receiving light, and a light detector 24.
- the light condensation unit 21 for receiving light condenses examined light 20 including fluorescence generated on the tooth.
- the optical waveguide 22 for receiving light is, together with the light condensation unit 21 for receiving light, included in a light path portion for allowing condensed light to propagate to the light detector 24.
- the brush portion of the toothbrush may be used as the optical waveguide 22 for receiving light, and the leading end of the toothbrush may be used as the light condensation unit 21 for receiving light.
- the optical filter 23 for receiving light is a filter for cutting wavelength components except fluorescence of interest. It is preferable to set the optical filter 23 for receiving light to cut a wavelength region excluding a range of 620 nm to 690 nm which is the wavelength region of fluorescence emitted by a fluorescent substance included in dental plaque. Since the reflected light of light from the light sources, directly reflected by the tooth, strongly appears particularly in a short-wavelength side, it is preferable to allow the optical filter 23 for receiving light to have sharp attenuation properties to cut the reflected light.
- Fluorescence spectra from dental plaque have two strong peaks at around 630 to 640 nm and around 670 to 680 nm, and an S/N ratio can be therefore improved by using, as the optical filter 23 for receiving light, a band-pass filter having transmittance properties similar to the shapes of the fluorescence spectra.
- the control unit 300 includes a control circuit 30 and a notification unit 31.
- the control circuit 30 controls the brightnesses and turning-on times of the first light source 2 and the second light source 3 to allow the tooth to be alternately irradiated with light having two wavelengths. Such differentiation between the turning-on time of the first light source 2 and the turning-on time of the second light source 3 enables fluorescence from a fluorescent substance, obtained by irradiating the tooth with the light from the respective light sources, to be received in distinction from each other.
- the control circuit 30 determines a ratio P1/P2 or difference (PI - P2) between the fluorescence intensities, thereby determining the amount of the fluorescent substance included in the dental plaque, as described in the section of the principle.
- the notification unit 31 notifies a user of the toothbrush of the determined amount of the fluorescent substance.
- Buzzer sound or electronic sound generated by using a piezoelectric element may be used in such notification.
- feedback can be given to the user by changing the pitch or loudness of the sound, or the pitch of the intermittent sound according to the amount of the fluorescent substance.
- a voice messages generated by voice synthesis, music, or the like may also be used.
- the control unit 300 may record the fluorescence intensities detected according to the light having the two wavelengths, respectively, and may perform averaging processing of the fluorescence intensities arbitrary times, whereby noise can be reduced.
- the control unit 300 may set the turning-on times of the first light source 2 and the second light source 3 at times different from the cycle of a commercial power supply, in order to avoid the influence of indoor light from a fluorescent lamp or the like, whereby the influence of illumination light can be reduced.
- the control unit 300 may alternately perform irradiation with light emitted from the first light source 2 or the second light source 3 so that the light sources are turned off between the emissions of the light from the light sources, as needed.
- the influence of environmental light can be reduced by subtracting the amount of fluorescent substance, acquired by turning off the light sources, from the amount of fluorescent substance, acquired by turning on the first light source 2 or the second light source 3.
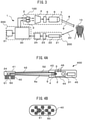
- FIG. 4A is a configuration view of a toothbrush-type fluorescence measuring device 400
- FIG. 4B is a configuration view of the toothbrush head of the fluorescence measuring device 400.
- the toothbrush-type fluorescence measuring device 400 is an example of optical measuring devices using fluorescence as examined light, and includes a toothbrush head 41, a stem unit 42, and a grip unit 43.
- Light from the first light source 2 and the second light source 3 is guided to the toothbrush head 41 through a color mixture unit 4 and an optical filter 5 for emitting light, disposed in the grip unit 43, as well as an optical waveguide 6a for emitting light with a long tapered shape, disposed in the stem unit 42.
- the direction of the guided light is changed using means such as a mirror or the like in the toothbrush head 41, and a tooth surface is irradiated with the light as excitation light from a light irradiation unit 50 on the toothbrush head 41.
- Fluorescence generated on a tooth is guided to a light detector 24 through brushes 40 that are arranged in a light detection unit 51 of the toothbrush head 41 and are made of a material that transmits fluorescence.
- the light irradiation unit 50 is arranged in the center of the toothbrush head, and the light detection unit 51 is disposed adjacently to the light irradiation unit 50, as illustrated in FIG. 4B .
- the arrangement is not limited to such an example but encompasses various possible variations.
- multiple light irradiation units 50 and light detection units 51 may be disposed in the toothbrush head, and the light irradiation units 50 and the light detection units 51 may be linearly alternately arranged.
- Fluorescence detected by the light detector 24 is converted into photocurrent, which is passed to the circuit board 44 through a wiring 52.
- the amount of fluorescent substance is determined by the control circuit 30 disposed in the circuit board 44, and a user is notified of the amount of the fluorescent substance with buzzer, electronic sound, or the like by the notification unit 31.
- a battery 45 is placed as a power supply for driving the fluorescence measuring device 400.
- two switches 46 are disposed in the grip unit 43. For example, a fluorescence measuring function can be switched on/off using one of the switches 46, and notification sound can be switched and fluorescence detection sensitivity can be adjusted using the other switch 46.
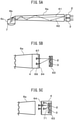
- the detailed configuration of the color mixture unit 4 will be described with reference to FIG. 5A to FIG. 5C . It is important that the in-plane intensity distribution of light with which a tooth is irradiated from the first light source 2 or the second light source 3 is not changed in the fluorescence measuring device 400. Such unchangingness of the in-plane intensity distribution is an important factor for determining a detection limit. Therefore, it is necessary that the in-plane intensity distribution of irradiation light has no wavelength dependence in a stage in which light arrives at a light condensation unit 7 for emitting light disposed in the toothbrush head 41.
- the color mixture unit 4 performs the action of eliminating the wavelength dependence of the in-plane intensity distribution of irradiation light.
- FIG. 5A is a view illustrating a configuration example of a color mixture unit using a light pipe with a tapered shape.
- a long optical path can be obtained by arranging a light pipe as the optical waveguide 6a for emitting light from the stem unit 42 to the toothbrush head 41 in the toothbrush-type fluorescence measuring device 400.
- Plurally repeated reflection of light from the first light source 2 or the second light source 3 in the light pipe results in uniformalization of the in-plane distribution of the light, and therefore enables the effect of color mixture to be easily enhanced.
- the optical waveguide 6a for emitting light itself functions as a color mixture unit.
- Light 62 obliquely emitted from the first light source 2 or the second light source 3 is repeatedly reflected plural times, while light 61 emitted approximately perpendicularly to an end face of the optical waveguide 6a for emitting light is reflected less times; however, the long optical path can result in effective color mixture.
- the use of the light pipe with the tapered shape illustrated in FIG. 5A as the optical waveguide 6a for emitting light enables the optical waveguide 6a for emitting light to have the function of a color mixture unit even when the color mixture unit 4 is not separately disposed, and enables the in-plane intensity distribution of irradiation light to approximate uniformity in a simple configuration. Extremely obliquely emitted light is reflected many times in the light pipe, and the reflection loss of the light is therefore unignorable; however, use of shell-shaped LEDs with a low emission angle as the first light source 2 and the second light source 3 enables such a reflection loss to be reduced and optical coupling efficiency to be simultaneously increased.
- the light pipe may be a hollow-type light pipe using a mirror or may be a plastic light pipe.
- the light pipe is a plastic light pipe, leaking light can be reduced by coating the outer periphery of the light pipe with a metal mirror.
- the shape of the light pipe may be a simple linear shape or a tapered shape. The effect of the color mixture can be easily enhanced by disposing a regular or irregular reflection surface in the pipe.
- a cross-sectional shape of the light pipe may be a round shape, an elliptical shape, a rectangular shape, a polygonal shape, or the like, and it is also easy to properly use a structure suitable for the shape and design of a toothbrush from such various shapes.
- FIG. 5B is an explanatory diagram of a form in which the color mixture unit 4 is added to the optical waveguide 6a for emitting light illustrated in FIG. 5A .
- a color mixture unit in which a microlens array 64 is arranged on an incidence end face is used as the color mixture unit 4.
- the effect of the color mixture is further enhanced by converting light from the first light source 2 or the second light source 3 into light 67 and 69 from multiple point light sources in such a manner.
- LED chips as the first light source 2 and the second light source 3 are mounted on a substrate 63 with a mirror which is a 45-degree reflection mirror.
- a mirror which is a 45-degree reflection mirror.
- Such a structure allows light emitted from the first light source 2 and the second light source 3 to be guided forward, and therefore results in a reduced emission angle.
- the use of the LED chips enables the spacing between the light sources to be decreased, and therefore enables the in-plane intensity distribution of irradiation light to further approximate uniformity.
- FIG. 5C is an explanatory diagram of a form in which a color mixture unit 4 having another configuration is added to the optical waveguide 6a for emitting light illustrating in FIG. 5A .
- a color mixture unit including a scatterer that scatters light emitted from the first light source 2 and the second light source 3 is used as the color mixture unit 4.
- This color mixture unit 4 is formed by sealing the first light source 2 and the second light source 3 placed in the substrate 63 with a mirror, with a transparent resin including light-scattering particles 71.
- the in-plane intensity distribution of irradiation light is enabled to approximate uniformity by allowing the many light-scattering particles 71 to multiply scatter light from each light source.
- the microlens array 64 may be added to an emission end face of the color mixture unit 4, whereby the effect of the color mixture can be further enhanced.
- FIG. 6 is a configuration view illustrating the interior of the toothbrush head 41.
- the light passed through the optical waveguide 6a for emitting light changes its direction at a mirror 6b in the toothbrush head 41 and passes through an optical waveguide 6c for emitting light, and then a tooth 10 is irradiated with the light as excitation light from the light condensation unit 7 for emitting light.
- Fluorescence generated from dental plaque adhering to a surface of the tooth and the tooth in the vicinity of the dental plaque is detected by the light detector 24 through the brushes 40 and an optical filter 23 for receiving light.
- the leading ends of the brushes 40 are allowed to have a curvature, thereby functioning as light condensation units 21 for receiving light.
- the brushes 40 except the leading ends function as optical waveguides 22 for receiving light.
- a light-shielding body 23a is arranged to surround the optical filter 23 for receiving light. The light-shielding body 23a prevents environmental light and excitation light from being directly incident on the optical filter 23 for receiving light without through the brushes 40.
- a scattering loss can be prevented by allowing the optical filter 23 for receiving light and end faces of the brushes 40 to adhere to each other with an optical adhesive having a refractive index close to the refractive indices of the brushes 40 and the optical filter 23 for receiving light.
- the end faces of the brushes 40 and an opening 24a of the light detector 24 can be allowed to adhere to each other with an optical adhesive having the function of the optical filter 23 for receiving light.
- a material functioning as an optical filter can also be used as the material of the brushes 40. In such a case, the end faces of the brushes 40 are arranged on the opening 24a of the light detector 24, and are allowed to adhere to the opening 24a with an optical adhesive.
- FIG. 7 is a block diagram illustrating an example of the circuit configuration of a control unit 300.
- the control unit 300 includes switches 80 and 81, light source drive circuits 82 and 83, an amplifier 85, an A/D converter 86, and a data-processing circuit 87, which are disposed on the circuit board 44 (see FIG. 4 ) in the grip unit 43.
- the control circuit 30 controls the light source drive circuits 82 and 83 on the basis of a signal that controls the timing of turning on the first light source 2 and the second light source 3 and lighting intensities thereof.
- Light incident on the light detector 24 is converted into an electric signal by the amplifier 85, and the electric signal is converted into a digital signal by the A/D converter 86.
- the data-processing circuit 87 performs calculation for determining the amount of fluorescent substance on the basis of the digital signal. Specifically, the data-processing circuit 87 calculates the amount ⁇ p of fluorescent substance originating from the dental plaque using the mathematical expression (3) described above.
- the data-processing circuit 87 stores a ratio t1/t2 between the components t1 and t2 of intrinsic fluorescence, measured in advance for a clean tooth.
- the A/D converter 86 can be operated in synchronization with the timing of turning on the first light source 2 and the second light source 3, thereby digitally performing signal processing of the amount of fluorescent substance in light having a first wavelength and the amount of fluorescent substance in light having a second wavelength.
- digital signal processing is adopted in the example illustrated in FIG. 7 , equivalent processing may be performed as analog signal processing.
- the switch 80 functions as an electric power switch.
- the switch 81 is used for the switching of notification sound, the setting of sensitivity, and the like.
- the notification unit 31 may provide not only notification with the already described buzzer and electronic sound but also vibration notification using an eccentric motor, notification with LED flashing and light with a changed color tone, and notification with a language, graphics and a graph on a liquid crystal display. It is also acceptable to adopt a method in which wireless communication is used together in the notification unit 31, and notification information or information about the measurement is sent to an external instrument such as a mobile phone or a personal computer, thereby notifying a user with the external instrument.
- an external instrument such as a mobile phone or a personal computer
- FIG. 8 is a timing chart representing the operation timing of the electronic circuits of the control unit 300.
- the timing of turning on the first light source 2 is represented by LED1
- the timing of turning on the second light source 3 is represented by LED2.
- LED1 and LED2 are alternately turned on n times, periods in which LED1 is turned on are denoted by V1 to Vn, and periods in which LED2 is turned on are denoted by B1 to Bn.
- Fluorescence is generated from the tooth simultaneously with the tuning on of the first light source 2 or the second light source 3, detected by the light detector 24, and converted into an electric signal by the amplifier 85.
- the detected light signal is represented by PD.
- PD As such light signals PD, a high signal is output when LED1 is turned on, and a lower signal than the signal output when LED1 is turned on is output when LED2 is turned on. These signals are alternately output.
- the analog light signals PD are converted into digital signals AD by the A/D converter 86 simultaneously with the ends of tuning-on cycles. Then, a digital average circuit Va averages the n items of data of V1 to Vn acquired when LED1 is turned on, thereby removing noise included in the signals. Similarly, a digital average circuit Ba averages the n items of data of B1 to Bn acquired when LED2 is turned on, thereby removing noise included in the signals.
- a subtraction processing circuit Diff determines a difference signal of the signals from which the noise has been removed.
- the amount ⁇ p of fluorescent substance originating from dental plaque obtained by subtracting, from measured fluorescence, intrinsic fluorescence from the tooth, can be determined.
- the effect of removing the influence of environmental light can also be obtained by the subtraction processing, when an environmental light component added in the period in which LED1 is turned on and an environmental light component added in the period in which LED2 is turned on are almost the same.
- a component that changes with moving a toothbrush and a component that relates to the frequency of a commercial power supply due to a fluorescent lamp or the like can be considered as the influence due to environmental light.
- the LEDs may be turned on at a sufficiently higher frequency than the frequency of the commercial power supply.
- fluctuations may be averaged by turning on the LEDs for time over multiple cycles, with the utilization of regular fluctuations.
- the correction may be made by multiplying such an emission intensity by a certain coefficient in the digital average circuit Va or Ba.
- such an emission intensity may be multiplied by a ratio t1/t2 between the components t1 and t2 of intrinsic fluorescence in the digital average circuit Ba.
- such an emission intensity may be multiplied by the coefficient t2 in the digital average circuit Va, and may be multiplied by the coefficient t1 in the digital average circuit Ba.
- the influence of environmental light may be eliminated by inserting turning-off periods between the periods in which the LEDs are turned on, and subtracting digital signals AD in the most recent turning-off periods from the digital signals AD in the turning-on periods. Such elimination enables a correction in a digital average circuit.
- the amount ⁇ p of the fluorescent substance originating from the dental plaque, obtained by the method described above, is sent to the control circuit 30. Processing and storage of the data are carried out in the control circuit 30, and a user is notified of the data by the notification unit 31.
- the processing is performed using the difference in order to obtain the amount ⁇ p of the fluorescent substance originating from the dental plaque; however, when the adhering amount of the dental plaque is intended to be evaluated using the ratio between the amount of the fluorescent substance originating from the dental plaque and the amount of the fluorescent substance originating from the tooth, the control circuit may be changed to perform division processing instead of the subtraction processing Diff.
- a fluorescence measuring device for confirming the principle of the optical measuring method described above was produced, and an experiment was carried out in which an actual tooth was irradiated with excitation light having the first wavelength and excitation light having the second wavelength, and fluorescence spectra from the tooth were measured.
- Shell-shaped LEDs having a diameter of 3 mm were used as the light sources.
- the wavelength of the first light source 2 was set at 405 nm (purple), and the wavelength of the second light source 3 was set at 465 nm (blue).
- three purple LEDs and three blue LEDs were equally spaced in an alternating manner on six places on a circumference having a radius of 3 mm to make an LED ring, and a plastic plate with a scattering effect was further arranged as the color mixture unit 4 on the front faces of the LEDs.
- the optical filter 5 for emitting light was not used, because the full-widths at half maximum of the emission spectra of the LED light sources used in the experiment were as low as 30 nm or less.
- Such an optical system was arranged so that the tooth surface could be uniformly irradiated with light with a mixed color.
- a plastic fiber having a core diameter of 1 mm was used as the optical waveguide 22 for receiving light, and arranged at the center of the LED ring. A scatter plate abutting on the front face of the fiber for receiving light was removed. An optical filter cutting wavelengths of 540 nm or less was used as the optical filter 23 for receiving light, and inserted into some midpoint of the optical fiber as the optical waveguide 22 for receiving light, thereby cutting the wavelength components of excitation light.
- a fiber light-receiving type spectroscope was used as the light detector 24, and an integral time was set at 50 mS.
- a personal computer was used for measurement control and data processing.
- a stable light intensity was obtained by driving each LED with a constant current using a constant current source.
- a procedure was repeated five times by a computer program in which a current was passed to each LED in the order of turning on the purple LEDs, turning off all the LEDs, turning on the blue LEDs, and turning off all the LEDs.
- the turning-on time of each LED was set at 50 mS, and both of the LED currents passed to the purple LEDs and the blue LEDs were set at 10 mA.
- Spectra obtained by the spectroscope were captured into the computer through a USB interface, and data processing of the spectra was carried out.
- FIG. 9 is a graph illustrating examples of fluorescence spectra obtained by measuring a tooth to which dental plaque adhered
- FIG. 10 is a graph illustrating examples of fluorescence spectra obtained by measuring a clean tooth.
- the horizontal axis of each graph indicates a wavelengths ⁇ (nm), and the vertical axis of each graph indicate a fluorescence intensity I and a fluorescence intensity ratio r.
- the fluorescence intensity I is plotted with digital data (count value) from a 16-bit A/D converter incorporated into the spectroscope.
- the solid lines represent spectra obtained by irradiation with light having a wavelength of 405 nm
- the dotted lines represent spectra obtained by irradiation with light having a wavelength of 465 nm.
- Each alternate long and short dash line represents the ratio r of both the fluorescence intensities, i.e., a value obtained by dividing the fluorescence intensity I obtained by the irradiation with light having a wavelength of 405 nm by the fluorescence intensity I obtained by the irradiation with light having a wavelength of 465 nm.
- FIG. 9 corresponds to a plot of the spectrum S1' of FIG. 1 and the spectrum S2' of FIG. 2
- FIG. 10 corresponds to a plot of the spectrum S1 of FIG. 1 and the spectrum S2 of FIG. 2 .
- FIG. 11 is a table representing the result of the quantified amount ⁇ p of fluorescent substance originating from the dental plaque, based on the spectra of FIG. 9 and FIG. 10 .
- the intensity t1 of fluorescence from the clean tooth irradiated with light having the first wavelength, the intensity p1' of fluorescence from the tooth to which the dental plaque adhered and which was irradiated with light having the first wavelength, the intensity t2 of fluorescence from the clean tooth irradiated with light having the second wavelength, and the intensity t2' of fluorescence from the tooth to which the dental plaque adhered and which was irradiated with light having the second wavelength are listed in FIG. 11 .
- the substitutional value of the intensity t1' of the intrinsic fluorescence from the tooth was calculated based on t2' x t1/t2, and the amount ⁇ p of the fluorescent substance originating from the dental plaque was determined by subtracting the substitutional value of the intensity t1' of the intrinsic fluorescence from the tooth from the intensity p1' of the fluorescence from the tooth to which the dental plaque adhered and which was irradiated with light having the first wavelength.
- the count number of the amount ⁇ p was 1146.
- the teeth are irradiated with the excitation light having two wavelengths of 405 nm and 465 nm, and the amount of the dental plaque is determined based on the difference between the amounts of fluorescent substance in the examined light of the two wavelengths, on the assumption that the examined light detected in the irradiation with the excitation light at 465 nm does not include the fluorescence from the dental plaque.
- the fluorescence absorption peak of a fluorescent substance included in dental plaque is at around 400 nm, and absorbed fluorescence significantly decreases in a wavelength difference of around ⁇ 5 nm; in contrast, the fluorescence absorption peak of a tooth is very broad in comparison with the fluorescent substance included in the dental plaque, and can be regarded as approximately constant in a range of around ⁇ 5 nm. Therefore, the excitation light is not limited to excitation light at 405 nm and 465 nm, and a difference between the amounts of fluorescent substance due to dental plaque can be measured even when excitation light having two similar wavelengths between which the difference is around 5 nm, for example, is used. Thus, an optical measuring method in which excitation light having two wavelengths similar to each other is used will be described below.
- the amounts of fluorescent substance at around 635 nm generated by irradiating a tooth to which dental plaque adheres with excitation light having two similar wavelengths ⁇ 1 and ⁇ 2 are y1 and y2, respectively, the amounts of the fluorescent substance are expressed by the following mathematical expressions (4) and (5) .
- y1 yt + p ⁇ ⁇ 1
- y2 yt + p ⁇ ⁇ 2
- yt represents the amount of the fluorescent substance generated from the tooth
- p represents the amount of the dental plaque.
- ⁇ 1 and ⁇ 2 are constants representing the fluorescence efficiency of the fluorescent substance included in the dental plaque for the excitation light having the wavelengths ⁇ 1 and ⁇ 2, respectively.
- the amount p of the dental plaque and the amount yt of the fluorescent substance generated by the tooth can be determined by the following mathematical expressions (7) and (8), on the assumption that the difference ⁇ between ⁇ 1 and ⁇ 2 is defined as the following mathematical expression (6), because ⁇ 1 and ⁇ 2 are the constants.
- the losses of light occur in optical systems in an excitation side and a detection side, respectively.
- the wavelength dependence of such losses can be corrected in advance and the wavelengths ⁇ 1 and ⁇ 2 of excitation light are similar, a difference between such losses due to the wavelengths may also be sufficiently reduced.
- ⁇ is a constant, and the inverse 1/ ⁇ thereof corresponds to the sensitivity of detection of dental plaque.
- the value of the detection sensitivity may be experimentally determined and may be set at an optimal value.
- a sensitivity adjustment dial may be disposed in a fluorescence measuring device so that a user can adjust the value (1/ ⁇ ) of the detection sensitivity.
- the entire configuration of a fluorescence measuring device in which the excitation light having the two similar wavelengths is used is similar to the entire configuration of the already described fluorescence measuring device 1 or 400.
- the circuit configuration of the control unit 300 is different from the circuit configurations of the fluorescence measuring devices 1 and 400, a configuration example of the detection circuit of the control unit 300 in which excitation light having two similar wavelengths is used is described below.
- FIG. 12 is a view illustrating a configuration example of a detection circuit 310 using a lock-in amplifier.
- An LED having a wavelength of 400 nm and an LED having a wavelength of 405 nm are used as a first light source 2 and a second light source 3, respectively.
- the respective LEDs are alternately driven by light source drive circuits 82 and 83 on the basis of a timing signal 101 from an oscillation circuit 100A.
- the first light source 2 is turned on in phase with the timing signal 101; and the second light source 3 is turned on in a phase opposite to the timing signal 101, since the second light source 3 is connected through an inverter 102.
- Fluorescence generated on a tooth is detected by a light detector 24, and is converted into a voltage signal by a current-voltage conversion circuit 85A. Then, phase detection is performed in a lock-in amplifier 103 including a phase detector 104. As a result, a difference component between fluorescence generated in excitation light having a wavelength of 400 nm and fluorescence generated in excitation light having a wavelength of 405 nm is output as an in-phase detection output 105.
- the in-phase detection output 105 is converted into an in-phase detection digital output 107 by an A/D converter 106. Calculation of the digital signal is carried out by a control circuit 90, and the amount p of dental plaque in the mathematical expression (7) is calculated from fluorescence intensities.
- FIG. 13 is a timing chart indicating the timing of operation of the detection circuit 310.
- the timing signal 101 is denoted by TIM
- the first light source 2 and the second light source 3 are denoted by LED1 and LED2, respectively.
- a light signal obtained after a photocurrent obtained in the light detector 24 has been converted into a voltage in the current-voltage conversion circuit 85A is denoted by PD
- the in-phase detection output 105 is denoted by IOUT.
- the signal intensity of the light signal PD is increased in proportion to the fluorescence efficiency of dental plaque during a period in which LED1 is turned on, and is relatively lower during a period in which LED2 is turned on.
- the in-phase detection output 105 (IOUT) which is the difference component of fluorescence is obtained by phase detection of the light signal PD.
- the rising properties of IOUT are determined by the properties of a low-pass filter disposed in the phase detector 104.
- FIG. 14 is a view illustrating a configuration example of a detection circuit 320 using a two-phase lock-in amplifier.
- the detection circuit 310 illustrated in FIG. 12 measures only the amount of dental plaque p, while the detection circuit 320 of FIG. 14 simultaneously detects the amount p of dental plaque and the amount yt of the fluorescent substance of a tooth using a lock-in amplifier 103A which operates in two phases.
- the detection circuit 320 differs from the detection circuit 310 in addition of a 90° phase shifter 108, a phase detector 109, and an A/D converter 111 to the lock-in amplifier 103A.
- phase detection is carried out using a timing signal 101 and a signal obtained by delaying the timing signal 101 by the 90° phase shifter 108.
- An in-phase detection output 105 from a phase detector 104 is converted into an in-phase detection digital output 107 by an A/D converter 106, and a 90° phase detection output 110 from the phase detector 109 is converted into a 90° phase detection digital output 112 by the A/D converter 111.
- Calculation of such digital signals is carried out by a control circuit 90, and the amount p of dental plaque and the amount yt of the fluorescent substance of a tooth are calculated from fluorescence intensities on the basis of the mathematical expressions (7) and (8).
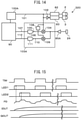
- FIG. 15 is a timing chart indicating the timing of operation of the detection circuit 320.
- the timing signal 101, a first light source 2, a second light source 3, an output signal (light signal) from a current-voltage conversion circuit 85A, and the in-phase detection output 105 are denoted by TIM, LED1, LED2, PD, and IOUT, respectively.
- the 90° phase detection output 110 is denoted by QOUT.
- LED2 is turned on with delay of a phase of 90° with respect to the timing of turning on LED1.
- the light signal PD fluorescence due to excitation light of LED1 is detected at a phase of 0°, and this fluorescence with fluorescence due to excitation light of LED2 superimposed thereon is detected at a phase of 90°, as indicated by the arrows in the figure.
- phase detection of the light signal PD at 0° and 90° the amount y1 of fluorescent substance due to excitation light of LED1 and the amount y2 of fluorescent substance are directly obtained as the in-phase detection output 105 (IOUT) and the 90° phase detection output 110 (QOUT), respectively.
- the amount p of dental plaque and the amount yt of the fluorescent substance of a tooth can be simultaneously measured using the mathematical expressions (7) and (8). Therefore, in the detection circuit 320, the distance between the tooth and a detection unit 200 can be corrected by normalization of the amount p of the dental plaque with the amount yt of the fluorescent substance of the tooth.
- the detection circuit 320 use of a drive waveform in which the first light source 2 and the second light source 3 (LED1 and LED2) are neither simultaneously turned on nor simultaneously turned off enables a change in the signal intensity of the light signal PD to be reduced to a low level, whereby the dynamic range of detection of the amount of fluorescent substance can be improved.
- the timing of operation of the detection circuit 320 in such a case will now be described.
- FIG. 16 is a timing chart indicating other timing of operation of the detection circuit 320. Symbols TIM, LED1, LED2, and PD in the figure are the same as those in FIG. 15 . In the example indicated in FIG. 16 , LED1 and LED2 are alternately turned on by a timing signal TIM2 having a frequency two times the frequency of the timing signal 101 (TIM). TIM and TIM2 are used as phase signals for phase detection. Currents for driving LED1 and LED2 are modulated to ⁇ times (about 0.5 time in the illustrated example) in an interval in which TIM is L.
- y1' and y2' are obtained as the sum signal and difference signal of y1 and y2 as indicated in the following mathematical expressions (9) and (10).
- the sensitivity of detection of dental plaque is increased and the sensitivity of detection of a tooth is decreased by allowing ⁇ to approach 1, when the amount of fluorescent substance originating from the dental plaque is smaller than the amount of fluorescent substance generated by the tooth. As a result, a dynamic range can be improved.
- the first wavelength of light emitted by the first light source 2 and the second wavelength of light emitted by the second light source 3 be, for example, in a range from 350 nm to 430 nm, and that the difference between the first wavelength and the second wavelength be 5 nm or more.
- the difference between the first wavelength and the second wavelength is 1 nm or more, on the basis of the features of the fluorescence absorption peak of the fluorescent substance included in the dental plaque and the fluorescence absorption peak of the tooth. Therefore, the first wavelength and the second wavelength may be in a range from 350 nm to 430 nm, and the difference between the first wavelength and the second wavelength may be 1 nm or more.
- wavelengths similar to each other as the first wavelength and the second wavelength as described above enables the wavelength dependence of the optical system and fluorescence from a tooth or dental plaque to be canceled with higher precision than use of two wavelengths, such as 405 nm and 465 nm, between which the difference is great, and therefore allows measurement precision to be improved.
- a tooth is irradiated with excitation light having two wavelengths.
- the wavelengths of excitation light are not limited to two wavelengths and may be three or more wavelengths.
- an example in which a tooth is irradiated with excitation light having three wavelengths and the amount of dental plaque is measured is described below.
- yt is the amount of fluorescent substance generated by the tooth
- p is the amount of the dental plaque
- ⁇ 1, ⁇ 2, and ⁇ 3 are the fluorescence efficiencies (constant) of the dental plaque for the excitation light having the wavelengths ⁇ 1, ⁇ 2, and ⁇ 3, respectively.
- the amount p of the dental plaque can be determined by averaging values obtained from three combinations of two equations among the mathematical expressions (11) to (13) .
- the amounts y1, y2, and y3 of the fluorescent substance may be measured several times, and the estimated value of the amount p of the dental plaque may be calculated from measurement data sets of the amounts using a least square method as described below.
- n sets of data in which each set includes three values of y1, y2, and y3, are obtained.
- yli i-th measurement data
- all the items of obtained data are represented by the following mathematical expressions (14) .
- the mathematical expressions (14) are expressed in a vector form as the following mathematical expression (15) .
- Y yt + pX
- Y is a vector including 3n components (y11, y21, y31, ...)
- X is also a vector including 3n components ( ⁇ 1, ⁇ 2, ⁇ 3, ).
- the amount p of the dental plaque can be calculated by a least square method using the mathematical expression (15) as an observation equation.
- the entire configuration of a fluorescence measuring device in which the excitation light having the three wavelengths is used is similar to the entire configuration of the already described fluorescence measuring device 1 or 400.
- the circuit configuration of the control unit 300 is different from the circuit configurations of the fluorescence measuring devices 1 and 400, a configuration example of the detection circuit of the control unit 300 in which excitation light having three similar wavelengths is used is described below.
- FIG. 17 is a view illustrating a configuration example of a detection circuit 330 in which excitation light having three wavelengths is used.
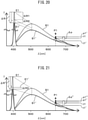
- FIG. 18 is a timing chart indicating the timing of operation of the detection circuit 330.
- the detection circuit 330 is a detection circuit in which the detection circuit 320 of FIG. 14 is further generalized, and the number of the phases of the lock-in amplifier is increased to three.
- the detection circuit 330 includes three light sources 2, 2A, and 2B that emit excitation light having wavelengths ⁇ 1, ⁇ 2, and ⁇ 3, respectively, and three light source drive circuits 82, 82A, and 82B that drive the respective light sources. Further, the detection circuit 330 includes three phase detectors 104, 104A, and 104B corresponding to the three wavelengths ⁇ 1, ⁇ 2, and ⁇ 3, as well as 60° phase shifters 108A and 108B. In the detection circuit 330, a timing signal 101 from an oscillation circuit 100A is used as an in-phase signal, and phase signals of 60° and 120° are generated by the 60° phase shifters 108A and 108B. An example in which the phase signals which are not orthogonal to each other are used is described here in order to simplify the circuit, although phase signals orthogonal to each other are used in ordinary phase detection.
- Output signals from the phase detectors 104, 104A, and 104B are converted into digital detection signals 107, 107A, and 107B by A/D converters 106, 106A, and 106B, respectively. Since detected fluorescence due to the excitation light having the three wavelengths ⁇ 1, ⁇ 2, and ⁇ 3 are mixed in the detection signals 107, 107A, and 107B, the amount of fluorescent substance corresponding to each wavelength is separated by calculation in a control circuit 90 as described below.
- phase detection outputs detection signals 107, 107A, and 107B
- the amounts y1, y2, and y3 of fluorescent substance due to the excitation light having the three wavelengths ⁇ 1, ⁇ 2, and ⁇ 3 are mixed in a manner as represented in the following mathematical expressions (16) to (18).
- y 1 ′ 3 y 1 + y 2 ⁇ y 3 / 3
- y 2 ′ y 1 + 3 y 2 ⁇ y 3 / 3
- y3 ′ -y 1 + y 2 + 3 y 3 / 3
- control circuit 90 determines the amounts y1, y2, and y3 of fluorescent substance corresponding to the wavelengths ⁇ 1, ⁇ 2, and ⁇ 3, respectively, according to the mathematical expressions (19) to (21).
- the amount yt of fluorescent substance generated from a tooth is constant in the above calculation.
- the amount of dental plaque can also be determined as follows, in consideration of a difference between fluorescence efficiencies due to the wavelengths of excitation light.
- the amount q of fluorescent substance and the amount p of dental plaque can be simultaneously determined from n sets of data in the same manner as described above, by defining an observation equation as the following mathematical expression (25) in which Z is a vector including 3n components ( ⁇ t1, ⁇ t2, ⁇ t3, ...), according to the calculation method by the least square method described above.
- Y qZ + pX
- An optical measuring method using excitation light having three wavelengths is insusceptible to noise such as environmental light. This is because only a component in which the amount of fluorescent substance desirably varies can be detected, in a reflection of a variation in fluorescence efficiency due to the wavelengths.
- the probability that signal intensity desirably varies due to noise by accident is decreased with increasing the complexity of wavelengths (fluorescence efficiencies) and the order thereof. Accordingly, with increasing the number of wavelengths, resistance to noise is enhanced, and an improvement of S/N ratio and enhancement of sensitivity can be expected.
- the dynamic range of detection of the amount of fluorescent substance can be similarly improved by using a drive waveform in which light sources are neither simultaneously turned on nor simultaneously turned off, as the operation timing indicated in FIG. 16 .
- a method is suitable in which the same optical waveguide is used in common as the optical waveguide 6 for emitting light and the optical waveguide 22 for receiving light in the fluorescence measuring device 1 or 400 described above, and thereby the emission unit and the light-receiving unit are allowed to be the same.
- a fluorescence measuring device in which the same optical waveguide is disposed as the optical waveguide 6 for emitting light and the optical waveguide 22 for receiving light is described below.
- FIG. 19 is a configuration view of another fluorescence measuring device 500.
- Components common to the components of the fluorescence measuring device 1 or 400 described above are denoted by the same reference characters as those of the fluorescence measuring devices, and the overlapping description thereof is omitted.
- a shared optical waveguide 6A is used as an optical waveguide for emitting light and an optical waveguide for receiving light in common.
- excitation light from a first light source 2 or a second light source 3 is incident on a mirror M through a color mixture unit 4, an optical filter 5 for emitting light, and an optical waveguide 6 for emitting light.
- the mirror M includes a dichroic mirror, a half mirror, or the like, and has the properties of reflecting light in the wavelength region of excitation light and transmitting light in the wavelength region of fluorescence.
- excitation light from the first light source 2 or the second light source 3 is reflected by the mirror M, and passes through the shared optical waveguide 6A, and a tooth 10 including a portion 11 to which dental plaque adheres is irradiated with the excitation light as first irradiation light 8 or second irradiation light 9 from a light condensation unit 7 for emitting light.
- Examined light 20 (fluorescence) from the tooth 10 is incident on the light condensation unit for emitting light, re-passes through the shared optical waveguide 6A, and arrives at the mirror M.
- the examined light 20 passes through the mirror M and arrives at a light detector 24 through an optical waveguide 22 for receiving light and an optical filter 23 for receiving light.
- the optical filter 5 for emitting light and the optical filter 23 for receiving light can be omitted.
- one brush of a toothbrush can be used as the shared optical waveguide 6A in the fluorescence measuring device 500.
- dental plaque can be stably detected because emitted light is not shielded by a brush other than brushes for receiving light. Accordingly, detection can be reliably performed particularly in a gap portion such as an interdental space or a periodontal pocket, to which dental plaque easily adheres, and practical usefulness is therefore provided.
- fluorescence is detected as examined light from a tooth.
- the amount of dental plaque can also be measured by detecting a change in the intensity of the reflected light of excitation light with which a tooth has been irradiated.
- an optical measuring method in which reflected light of excitation light is used as examined light is described below.
- FIG. 20 is a graph illustrating the spectra of reflected light and fluorescence obtained by irradiating a tooth to which dental plaque adheres and a clean tooth with excitation light at 405 nm.
- FIG. 21 is a graph illustrating the spectra of reflected light and fluorescence obtained by irradiating the tooth to which the dental plaque adheres and the clean tooth with excitation light at 400 nm.
- the horizontal axis of each graph indicates a wavelength ⁇ (nm), and the vertical axis of each graph indicates the intensity I of fluorescence or reflected light.
- the thin line of each graph represents the spectrum S1 obtained from the clean tooth
- the thick line of each graph represents the spectrum S1' obtained from the tooth to which the dental plaque adheres.
- the spectra S1' are observed with attention to fluorescence at 635 nm indicated by P1 in the figures.
- the amount ⁇ p" of fluorescent substance originating from the dental plaque in excitation of the tooth to which the dental plaque adheres at a wavelength of 400 nm is larger than the amount ⁇ p of fluorescent substance originating from the dental plaque in excitation of the same tooth at a wavelength of 405 nm, because the fluorescence efficiency of the fluorescent substance included in the dental plaque is high.
- the intensity of fluorescence having a wavelength of 635 nm corresponds to the sum of the amount t1' of the fluorescent substance of the tooth and the amount ⁇ p of the fluorescent substance of the dental plaque in the excitation at a wavelength of 405 nm, and corresponds to the sum of the amount t1' of the fluorescent substance of the tooth and the amount ⁇ p" (> ⁇ p) of the fluorescent substance of the dental plaque in the excitation at a wavelength of 400 nm.
- the intensity E1' of reflected light in excitation of the tooth to which the dental plaque adheres at a wavelength of 405 nm is less than the intensity E1 of reflected light in excitation of the clean tooth at a wavelength of 405 nm for the following two reasons.
- the first reason is that a decrease ⁇ R1 occurs due to scattering on the dental plaque because the dental plaque itself has the property of scattering light.
- the second reason is that a decrease ⁇ R2 occurs due to the absorption of fluorescence by the fluorescent substance included in the dental plaque. Because part of light energy absorbed by the fluorescent substance included in the tooth is released as fluorescence at a wavelength of around 635 nm, the decrease ⁇ R2 is proportional to the amount ⁇ p of the fluorescent substance.
- the intensity of the reflected light at a wavelength of 405 nm corresponds to the sum of a decrease due to scattering on the dental plaque and a decrease due to the absorption of fluorescence by the dental plaque.
- ⁇ R" in the excitation at a wavelength of 400 nm is larger than ⁇ R in the excitation at a wavelength of 405 nm, because the absorption of fluorescence by the dental plaque increases as indicated by symbol ⁇ R3 in FIG. 21 . Accordingly, the amount of the dental plaque can be estimated from the ratio or difference between the intensities of light reflected when the tooth is irradiated with the excitation light having the wavelengths different from each other.
- an optical measuring device in which reflected light is used as examined light is similar to the entire configuration of the already described fluorescence measuring device 1, 400, or 500.
- the optical filter 5 for emitting light is not necessary in the reflected-light measuring device, because it is not needed to cut a frequency region corresponding to a fluorescence region.
- an optical filter that cuts 430 nm or more is preferably used as the optical filter 23 for receiving light.
Description
- The present invention relates to an optical measuring device that detects examined light generated from dental plaque adhering to a tooth.
- When dental plaque adhering to teeth is left undisturbed, bacteria in the dental plaque grow, thereby causing tooth decay and periodontal diseases. Proper removal of dental plaque by daily toothbrushing is important for prevention of such tooth decay and periodontal diseases. For effective toothbrushing, manners of moving toothbrushes are devised, and electric toothbrushes are used; however, portions with much dental plaque and portions with little dental plaque are often brushed only for a certain time on an average. Brushing the portions with little dental plaque leads to negative effects of excessive brushing, while the portions with much dental plaque are insufficiently brushed.
- Dental plaque can be effectively removed in a short time by concentratedly brushing a portion to which the dental plaque adheres while monitoring the adhering amount of the dental plaque. Therefore, several methods for optically detecting dental plaque have been conventionally proposed. Typical examples thereof include a method utilizing the fact that bacteria included in dental plaque or bacteria in dental caries produce protoporphyrin IX (hereinafter referred to as "PPIX"), which is a fluorescent substance, in the intraoral environment. A fluorescence measuring method has been known in which a tooth is irradiated with excitation light having a certain wavelength, and fluorescence emitted by a fluorescent substance is detected, thereby quantitating the amount of dental plaque or the degree of dental caries.
- For example, fluorescence spectra from enamel obtained by irradiating the enamel of a healthy tooth and the enamel of a carious tooth only with excitation light having a wavelength of 406 nm are illustrated in
Patent Literature 1. Peaks at wavelengths of 636 nm and 673 nm indicate fluorescent emissions peculiar to carious enamel. Measurement of such fluorescence enables discrimination between the enamel of a healthy tooth and the enamel of a carious tooth. It is found that examination of a fluorescence spectrum is effective for diagnosing dental caries, because the shape of the fluorescence spectrum is obviously changed due to a worsening of dental caries. In addition,Patent Literature 1 describes a method in which the amount S1 of fluorescence having a wavelength band of 636 nm or 673 nm and the amount S2 of fluorescence having a band of 550 nm are measured using a filter, and the ratio S1/S2 thereof is used for quantitative evaluation of dental caries. - The autofluorescence spectrum of a tooth from a tooth surface from which a biological deposit has been removed, and a fluorescence spectrum from a tooth surface covered with a new dental plaque layer are illustrated in
Patent Literature 2. The spectra are measured using an excitation light sources at a wavelength of 420 nm or less. In addition,Patent Literature 2 illustrates a magnified view of a region indicating the intensity of autofluorescence at a wavelength longer than 530 nm, and represents that the autofluorescence intensity is decreased with gradually increasing a biological deposition layer. This can be understood to be because excitation light is absorbed or scattered by the dental plaque layer, whereby the intensity of excitation light arriving at the tooth surface is decreased, and thus the autofluorescence from the tooth is reduced. -
Patent Literature 2 also describes that the maximum values of strongly emitted light are observed at 530 nm and 630 nm in a fluorescence spectrum obtained from a test tooth surface with a thick layer of a biological deposit considered to be new dental plaque. In the optical system ofPatent Literature 2, fluorescence from dental plaque is not directly detected, but a tooth is irradiated with blue light at 480 nm, and the autofluorescence components of the tooth in reflected light are measured using a dichroic mirror. Then, a change in the intensity of autofluorescence from the tooth in movement of a toothbrush along the tooth in toothbrushing is observed to determine whether there is a biological deposition layer or not. -
Patent Literature 3 describes a method for preventing the amount of plaque detected by a toothbrush-type plaque detection device from changing even when a distance between a tooth and a toothbrush is changed.Patent Literature 3 primarily describes a method for quantifying secondary fluorescence from a fluorescent agent bound to plaque. This method compensates for an apparent variation in the amount of plaque due to the distance by using a signal from an amplifier, i.e., the total amount of the fluorescence components and reflection components of excitation light. A compensated plaque value is determined using a compensation equation in which a coefficient has been determined by measurement performed in advance. TheUS 2003/156788 A1 discloses a method and a device for the detection of caries, plaque, calculus, bacterial attack, etc. in/on teeth, a radiation being generated using a light source and directed at a tooth to be examined, producing a reflected radiation there. The reflected radiation is detected and evaluated using a detection device. The tooth is irradiated using two or more wavelength ranges, the measured reflected intensities of the two wavelength ranges being related to one another as a characteristic value for the presence of caries, plaque, calculus, bacterial attack. As a supporting measure, the fluorescence radiation is also be evaluated. TheWO 2014/097135 A1 discloses a dental apparatus. The dental apparatus includes a handle. A controller operably couples to the housing. A subsystem is in operable communication with the controller and configured to generate an excitation signal causing an emitted fluorescence light to be reflected back to the subsystem and to the controller for analyzing one or more properties of the emitted fluorescence light. The one or more properties are corresponding to a decay time of the emitted fluorescence light, wherein plaque emitted florescence light decays faster than tooth emitted florescence light. The controller is programmed to analyze detected emitted fluorescence light to determine if the emitted fluorescence light is indicative of a plaque emitted fluorescence decay time or tooth emitted florescence light decay time to detect the presence of one of dental plaque and tooth demineralization. TheUS 2007/105069 A1 discloses a dental caries detecting system including an ultraviolet irradiation device, a fluorescence receiving device that receives fluorescence from a tooth based on ultraviolet irradiation from the ultraviolet irradiation device, a fluorescence data analysis portion that analyzes fluorescence data transmitted from the fluorescence receiving device, and a display that displays analysis data analyzed by the fluorescence data analysis portion. The fluorescence data analysis portion is adapted to analyze said fluorescence data based on the fluorescence intensities in at least two wavelength bands in a visible light range. -
- Patent Literature 1:
Japanese Examined Patent Publication (Kokoku) No. 6-73531 page 1,FIG. 4 ) - Patent Literature 2: Published
Japanese Translation of International Publication for Patent Application (Kohyo) No. 2002-515276 page 1,FIG. 1 ) - Patent Literature 3:
Japanese Unexamined Patent Publication (Kokai) No. 2011-131057 page 1,FIG. 1 ) - When the amount of dental plaque adhering to a tooth is small, the intensity of intrinsic fluorescence from the tooth is high, and fluorescence originating from the dental plaque is very weak in fluorescence obtained by irradiating, with excitation light, a portion to which the dental plaque adheres. The weak fluorescence originating from the dental plaque is superimposed on the strong intrinsic fluorescence from the tooth, in view of the wavelength band (630 to 680 nm) of the fluorescence from the dental plaque. A technique that can effectively separate and detect the weak fluorescence and the strong intrinsic fluorescence is demanded. In addition, a simple configuration in which such a mechanism is easily incorporated into a toothbrush is demanded.
- The conventional technologies are considered from the above viewpoint as follows: in the configuration of
Patent Literature 1, when the amount of dental plaque adhering to a surface of a tooth is small, the amount of detected fluorescence is changed by the influence of environmental light and a distance between the tooth and a detector due to little fluorescence from the dental plaque, and it is therefore difficult to detect a slight amount of dental plaque adhering to a surface of a healthy tooth. The configuration ofPatent Literature 1 has the effect of compensating for a fluctuation due to a distance between a tooth and the detector by determining the ratio S1/S2 between the fluorescence intensities in the two wavelength regions selected by the optical filter among fluorescence intensities obtained by irradiating the tooth with light at a certain wavelength. However, in order that the fluorescence components may be selected as components in the two wavelength regions, the configuration of the optical filter is complicated, which may become an impediment to incorporation of the optical filter into a toothbrush. - In the configuration of
Patent Literature 2, when the amount of dental plaque is small, the amount of change in the attenuation of intrinsic fluorescence is also small, and a measurement error may therefore be increased due to the influence of a distance between a detection unit and a tooth, generated by movement of a brush in toothbrushing. Primarily, there is concern about no detection of fluorescence proportional to the amount of bacteria causing tooth decay and periodontal diseases. - In the configuration of
Patent Literature 3, it may be difficult to detect a small amount of dental plaque, because the amount of fluorescence including intrinsic fluorescence from a tooth is primarily measured as the amount of the plaque. The compensation for the amount of the plaque due to the distance is effective; but there remains a possibility that an error is caused due to an individual difference in the case of incorporation into the toothbrush, a positional relationship between the toothbrush and the tooth, and the like because the coefficient in the compensation equation is determined by the measurement performed in advance. - As described above, the conventional technologies do not provide a method that can properly detect a small amount of dental plaque. An object of the present invention is to provide an optical measuring device that can properly detect a small amount of dental plaque, can be easily incorporated into a toothbrush, and has a simple configuration.
- The problem of the present invention is solved by an optical measuring device according to the
independent claim 1. The dependent claims refer to advantageous developments of the present invention. Provided is a fluorescence measuring device that irradiates a sample with light having wavelengths different from each other and measures intensities of fluorescence generated from the sample, the fluorescence measuring device including a first light source that emits light having a first wavelength, a second light source that emits light having a second wavelength longer than the wavelength of the light emitted by the first light source, a detection unit that detects intensities of fluorescence generated when the same sample is irradiated with the light having the first wavelength and the light having the second wavelength, and a control unit that calculates an amount of fluorescent substance to be measured, based on a first intensity of fluorescence detected by the detection unit when the sample is irradiated with the light having the first wavelength and a second intensity of fluorescence detected by the detection unit when the sample is irradiated with the light having the second wavelength. - Provided is an optical measuring device including a plurality of light sources that irradiate a sample with light having a plurality of wavelengths different from each other, respectively, a detection unit that detects intensities of examined light generated when the sample is irradiated with the light having the plurality of wavelengths, and a control unit that calculates an amount of fluorescent substance to be measured, based on the intensities of the examined light detected by the detection unit in response to the light having the plurality of wavelengths.
- Preferably, in the above optical measuring device, the plurality of light sources include a first light source that emits light having a first wavelength, and a second light source that emits light having a second wavelength longer than the wavelength of the light emitted by the first light source, the detection unit detects a first intensity of fluorescence generated when the sample is irradiated with the light having the first wavelength, and a second intensity of fluorescence generated when the sample is irradiated with the light having the second wavelength, and the control unit calculates the amount of the fluorescent substance using a difference or ratio between the first intensity of the fluorescence and the second intensity of the fluorescence.
- Preferably, in the above optical measuring device, the sample is irradiated alternately with the light having the first wavelength and the light having the second wavelength.
- Preferably, in the above optical measuring device, the first wavelength is a wavelength in a range from 350 nm to 430 nm, and the second wavelength is a wavelength in a range from 435 nm to 500 nm.
- Preferably, in the above optical measuring device, the first and second wavelengths are wavelengths in a range from 350 nm to 430 nm, and a difference between the first wavelength and the light of the second wavelength is 5 nm or more.
- Preferably, the above optical measuring device further includes a color mixture unit that uniformalizes intensity distributions in a surface irradiated with the light emitted from the first light source and the second light source.
- Preferably, in the above optical measuring device, the detection unit includes an optical filter for receiving light that cuts a wavelength region excluding a range of a wavelength of fluorescence emitted by a fluorescent substance to be measured, contained in the sample.
- Preferably, the above optical measuring device further includes an optical filter for emitting light that cuts a wavelength region excluding the wavelengths of the light from the first light source and the second light source.
- Preferably, in the above optical measuring device, the plurality of light sources include an optical waveguide for emitting light, through which the light having the first wavelength and the light having the second wavelength with which the sample is irradiated are guided, the detection unit includes an optical waveguide for receiving light, through which the detected examined light is guided, and the optical waveguide for emitting light and the optical waveguide for receiving light are formed by a same optical waveguide.
- Preferably, in the above optical measuring device, the plurality of light sources include a first light source that emits light having a first wavelength, and a second light source that emits light having a second wavelength longer than the wavelength of the light emitted by the first light source, the detection unit detects a first intensity of light reflected when the sample is irradiated with the light having the first wavelength, and a second intensity of light reflected when the sample is irradiated with the light having the second wavelength, and the control unit calculates the amount of the fluorescent substance using a difference or ratio between the first intensity of the reflected light and the second intensity of the reflected light.
- The above optical measuring device can also be included in a toothbrush.
-
-
FIG. 1 is a graph illustrating the spectra of light obtained from a clean tooth and a tooth to which dental plaque adheres, respectively, when the teeth are irradiated with purple light. -
FIG. 2 is a graph illustrating the spectra of light obtained from a clean tooth and a tooth to which dental plaque adheres, respectively, when the teeth are irradiated with blue light. -
FIG. 3 is a configuration view of afluorescence measuring device 1. -
FIG. 4A is a configuration view of a toothbrush-typefluorescence measuring device 400. -
FIG. 4B is a configuration view of the toothbrush head of thefluorescence measuring device 400. -
FIG. 5A is a view illustrating a configuration example of a color mixture unit using a light pipe with a tapered shape. -
FIG. 5B is an explanatory diagram of a form in which thecolor mixture unit 4 is added to theoptical waveguide 6a for emitting light illustrated inFIG. 5A . -
FIG. 5C is an explanatory diagram of a form in which acolor mixture unit 4 having another configuration is added to theoptical waveguide 6a for emitting light illustrating inFIG. 5A . -
FIG. 6 is a configuration view illustrating the interior of thetoothbrush head 41. -
FIG. 7 is a block diagram illustrating an example of the circuit configuration of acontrol unit 300. -
FIG. 8 is a timing chart representing the operation timing of the electronic circuits of thecontrol unit 300. -
FIG. 9 is a graph illustrating examples of fluorescence spectra obtained by measuring a tooth to which dental plaque adhered. -
FIG. 10 is a graph illustrating examples of fluorescence spectra obtained by measuring a clean tooth. -
FIG. 11 is a table representing the result of the quantified amount Δp of fluorescent substance originating from the dental plaque, based on the spectra ofFIG. 9 andFIG. 10 . -
FIG. 12 is a view illustrating a configuration example of adetection circuit 310 using a lock-in amplifier. -
FIG. 13 is a timing chart indicating the timing of operation of thedetection circuit 310. -
FIG. 14 is a view illustrating a configuration example of adetection circuit 320 using a two-phase lock-in amplifier. -
FIG. 15 is a timing chart indicating the timing of operation of thedetection circuit 320. -
FIG. 16 is a timing chart indicating other timing of operation of thedetection circuit 320. -
FIG. 17 is a view illustrating a configuration example of adetection circuit 330 in which excitation light having three wavelengths is used. -
FIG. 18 is a timing chart indicating the timing of operation of thedetection circuit 330. -
FIG. 19 is a configuration view of anotherfluorescence measuring device 500. -
FIG. 20 is a graph illustrating the spectra of reflected light and fluorescence obtained by irradiating a tooth to which dental plaque adheres and a clean tooth with excitation light at 405 nm. -
FIG. 21 is a graph illustrating the spectra of reflected light and fluorescence obtained by irradiating the tooth to which the dental plaque adheres and the clean tooth with excitation light at 400 nm. - Hereinafter, with reference to the drawings, optical measuring devices and optical measuring methods will be explained in detail. However, the technical scope of the present invention is not limited to embodiments thereof, and includes the invention described in the claims and equivalents thereof.
- First, the principle of the optical measuring method will be described with reference to
FIG. 1 and FIG. 2 . This optical measuring method includes: alternately irradiating the same tooth with excitation light having two different wavelengths; detecting fluorescence generated on the tooth due to the excitation light having the respective wavelengths, in a fluorescence wavelength region originating from dental plaque; and separating and detecting fluorescence to be measured that is superimposed on intrinsic fluorescence from the tooth and originates from the dental plaque, by using a ratio or difference between the intensities of the fluorescence. -
FIG. 1 is a graph illustrating the spectra of light obtained from a clean tooth and a tooth to which dental plaque adheres, respectively, when the teeth are irradiated with purple light having a peak wavelength of 405 nm as a first wavelength. The horizontal axis of the graph indicates a wavelength λ (nm), while the vertical axis of the graph indicates a fluorescence intensity I which is a first fluorescence intensity. A thin line represents a spectrum S1 obtained from the clean tooth, while a thick line represents a spectrum S1' obtained from the tooth to which the dental plaque adheres. A peak E1 at around 405 nm represents excitation light detected due to reflection or scattering of purple light of 405 nm, with which the irradiation has been performed, by a tooth surface. Broad fluorescence having a peak P0 at around 500 nm is intrinsic fluorescence from the teeth. Peaks P1 and P2 at around 635 nm and around 675 nm represent fluorescence spectra obtained from a fluorescent substance PPIX included in the dental plaque. - The peaks P1 and P2 originating from the dental plaque are not observed in the spectrum S1 obtained from the clean tooth, whereas the peaks P1 and P2 of fluorescence originating from the dental plaque are observed in the spectrum S1' obtained from the tooth to which the dental plaque adheres. The spectrum S1' undergoes a uniform attenuation in the entire wavelength region in comparison with the spectrum S1. This attenuation is an attenuation caused by absorption of excitation light by the adhering dental plaque, depends on the amount of the dental plaque, and represents an approximately uniform attenuation without depending on a wavelength.
- In order to measure the peak P1 of the fluorescence originating from the dental plaque with higher precision, it is necessary to determine the amount Δp of fluorescent substance originating from the dental plaque, obtained by subtracting the component t1' of the intrinsic fluorescence from the teeth, from a spectrum intensity p1' at the wavelength of the peak PI, as represented in the following mathematical expression (1).

- In other words, it is necessary to determine the component t1' of the intrinsic fluorescence from the teeth in a state in which the dental plaque adheres and without causing fluorescence originating from the dental plaque. As a result of intensive examination of such conditions, it was found that it is preferable to acquire a spectrum obtained by using a light source having a second wavelength which is a longer wavelength than the first wavelength, which is 405 nm in this case.
-
FIG. 2 is a graph illustrating the spectra of light obtained from a clean tooth and a tooth to which dental plaque adheres, respectively, when the teeth are irradiated with blue light having a peak wavelength of 465 nm as a second wavelength. LikeFIG. 1 , the horizontal axis of the graph indicates a wavelength λ (nm), while the vertical axis of the graph indicates a fluorescence intensity I which is a second fluorescence intensity. A thin line represents a spectrum S2 obtained from the clean tooth, while a thick line represents a spectrum S2' obtained from the tooth to which the dental plaque adheres. - When the clean tooth and the tooth to which the dental plaque adheres are irradiated with blue light having a wavelength of 465 nm, the broad peak P0 of intrinsic fluorescence from the teeth is observed similarly in the case of the irradiation with purple light having a wavelength of 405 nm; however, since PPIX is weakly excited, peaks P1 and P2 originating from the dental plaque are not observed. Accordingly, the component t2' of the intrinsic fluorescence from the teeth excited at the second wavelength can be substituted for the component t1' of the intrinsic fluorescence excited at the first wavelength, and the amount Δp of fluorescent substance originating from the dental plaque can be determined on an approximate basis by the following mathematical expression (2).

- In order to achieve such an approximation, it is necessary to uniformalize the components t1' and t2' of the intrinsic fluorescence by adjusting in advance the intensities of excitation light at the first wavelength and the second wavelength. The intensities of excitation light may be adjusted, using the proportional relation of the attenuation of intrinsic fluorescence with respect to the amount of dental plaque, so that the components t1 and t2 of the intrinsic fluorescence, measured on the clean teeth, are equal to each other. Alternatively, such a correction as described in the following mathematical expression (3) can be made by measuring the ratio t1/t2 between the components t1 and t2 of the intrinsic fluorescence from the clean teeth in advance.

- On the basis of the principle described above, the fluorescence that is superimposed on the intrinsic fluorescence from the teeth and originates from the dental plaque can be separated and detected by alternately irradiating the teeth with the excitation light having the two different wavelengths, detecting, in the fluorescence wavelength region originating from the dental plaque, fluorescence generated on the teeth by the excitation light having the respective wavelengths, and using a ratio or difference between the first fluorescence intensity and the second fluorescence intensity which are the intensities of the fluorescence.
- A fluorescence measuring device for actualizing the principle of the optical measuring method described above will now be described with reference to the drawings.
FIG. 3 is a configuration view of afluorescence measuring device 1. Thefluorescence measuring device 1 is an example of optical measuring devices using fluorescence as examined light. Thefluorescence measuring device 1 includes three blocks of alight source unit 100 for exciting a fluorescent substance included in dental plaque, adetection unit 200 for detecting the intensities of fluorescence generated on a tooth surface, and acontrol unit 300 for determining the adhering amount of the dental plaque from the measured fluorescence intensities and notifying a user of the amount. - The
light source unit 100 includes a firstlight source 2 that emits light at a first wavelength, a secondlight source 3 that emits light at a second wavelength, acolor mixture unit 4, anoptical filter 5 for emitting light, anoptical waveguide 6 for emitting light, and alight condensation unit 7 for emitting light. Thecolor mixture unit 4, theoptical filter 5 for emitting light, theoptical waveguide 6 for emitting light, and thelight condensation unit 7 for emitting light are included in a light path portion for irradiating a tooth to be measured with light from the firstlight source 2 and the secondlight source 3. - Light-emitting diodes and semiconductor lasers which are small-sized and inexpensive can be used as the first
light source 2 and the secondlight source 3. The wavelengths of light generated by the firstlight source 2 or the secondlight source 3 are selected as follows. The first wavelength is included in wavelengths with high excitation efficiency for a fluorescent substance included in dental plaque, and the second wavelength is set at a wavelength which is longer than the first wavelength and of which the excitation efficiency is lower than that of the first wavelength or is approximately zero. The first wavelength is preferably in a range from 350 nm to 430 nm, and the second wavelength is preferably in a range from 435 nm to 500 nm. As a specific example, the firstlight source 2 may be a purple LED having a peak wavelength of 405 nm, and the secondlight source 3 may be a blue LED having a peak wavelength of 465 nm. - The
color mixture unit 4 has the function of uniformalizing light intensity distributions in a surface irradiated with light between light having the first wavelength and light having the second wavelength, in order to prevent color unevenness from occurring when the tooth to be measured is irradiated with light generated by the firstlight source 2 and the secondlight source 3. It is important to allow the light intensity distributions between light having the first wavelength and light having the second wavelength to be coincident with each other, and it is allowable that the light intensity distributions are present. Therefore, the freedom of design of thecolor mixture unit 4 becomes relatively higher. - The
optical filter 5 for emitting light is a filter through which light from the firstlight source 2 and the secondlight source 3 passes, and which cuts fluorescence in a wavelength region originating from dental plaque. When a short-pass filter is used as theoptical filter 5 for emitting light, it is preferable to select a cutoff wavelength that is sufficiently longer than the second wavelength and is sufficiently shorter than the fluorescence wavelength of a fluorescent substance included in dental plaque. In the present embodiment, the setting of cutting wavelengths of 500 nm or more is performed. - The
optical waveguide 6 for emitting light is used for guiding light from the firstlight source 2 or the secondlight source 3 to the vicinity of the tooth to be measured without attenuating the light. Plastic or glass can be used as the material of theoptical waveguide 6 for emitting light. It is more preferable to form a mirror coating on the outer periphery of theoptical waveguide 6 for emitting light, thereby preventing light from leaking. A hollow optical waveguide surrounded by a mirror, such as a light pipe, can also be used as theoptical waveguide 6 for emitting light. - The
light condensation unit 7 for emitting light includes a lens for condensing, into about the size of a tooth, light which propagates into theoptical waveguide 6 for emitting light, and for performing irradiation with the light. - The
detection unit 200 includes alight condensation unit 21 for receiving light, anoptical waveguide 22 for receiving light, anoptical filter 23 for receiving light, and alight detector 24. - The
light condensation unit 21 for receiving light condenses examined light 20 including fluorescence generated on the tooth. Theoptical waveguide 22 for receiving light is, together with thelight condensation unit 21 for receiving light, included in a light path portion for allowing condensed light to propagate to thelight detector 24. When thefluorescence measuring device 1 is incorporated into a toothbrush, the brush portion of the toothbrush may be used as theoptical waveguide 22 for receiving light, and the leading end of the toothbrush may be used as thelight condensation unit 21 for receiving light. - The
optical filter 23 for receiving light is a filter for cutting wavelength components except fluorescence of interest. It is preferable to set theoptical filter 23 for receiving light to cut a wavelength region excluding a range of 620 nm to 690 nm which is the wavelength region of fluorescence emitted by a fluorescent substance included in dental plaque. Since the reflected light of light from the light sources, directly reflected by the tooth, strongly appears particularly in a short-wavelength side, it is preferable to allow theoptical filter 23 for receiving light to have sharp attenuation properties to cut the reflected light. Fluorescence spectra from dental plaque have two strong peaks at around 630 to 640 nm and around 670 to 680 nm, and an S/N ratio can be therefore improved by using, as theoptical filter 23 for receiving light, a band-pass filter having transmittance properties similar to the shapes of the fluorescence spectra. - The
control unit 300 includes acontrol circuit 30 and anotification unit 31. - The
control circuit 30 controls the brightnesses and turning-on times of the firstlight source 2 and the secondlight source 3 to allow the tooth to be alternately irradiated with light having two wavelengths. Such differentiation between the turning-on time of the firstlight source 2 and the turning-on time of the secondlight source 3 enables fluorescence from a fluorescent substance, obtained by irradiating the tooth with the light from the respective light sources, to be received in distinction from each other. Assuming that the intensity of the fluorescence obtained by turning on the firstlight source 2 is P1 and the intensity of the fluorescence obtained by turning on the secondlight source 3 is P2, thecontrol circuit 30 determines a ratio P1/P2 or difference (PI - P2) between the fluorescence intensities, thereby determining the amount of the fluorescent substance included in the dental plaque, as described in the section of the principle. - The
notification unit 31 notifies a user of the toothbrush of the determined amount of the fluorescent substance. Buzzer sound, or electronic sound generated by using a piezoelectric element may be used in such notification. In the case of the electronic sound, feedback can be given to the user by changing the pitch or loudness of the sound, or the pitch of the intermittent sound according to the amount of the fluorescent substance. A voice messages generated by voice synthesis, music, or the like may also be used. - The
control unit 300 may record the fluorescence intensities detected according to the light having the two wavelengths, respectively, and may perform averaging processing of the fluorescence intensities arbitrary times, whereby noise can be reduced. Thecontrol unit 300 may set the turning-on times of the firstlight source 2 and the secondlight source 3 at times different from the cycle of a commercial power supply, in order to avoid the influence of indoor light from a fluorescent lamp or the like, whereby the influence of illumination light can be reduced. - The
control unit 300 may alternately perform irradiation with light emitted from the firstlight source 2 or the secondlight source 3 so that the light sources are turned off between the emissions of the light from the light sources, as needed. The influence of environmental light can be reduced by subtracting the amount of fluorescent substance, acquired by turning off the light sources, from the amount of fluorescent substance, acquired by turning on the firstlight source 2 or the secondlight source 3. - A second embodiment in which a fluorescence measuring device is incorporated into a toothbrush will now be described with reference to the drawings.
FIG. 4A is a configuration view of a toothbrush-typefluorescence measuring device 400, andFIG. 4B is a configuration view of the toothbrush head of thefluorescence measuring device 400. - The toothbrush-type
fluorescence measuring device 400 is an example of optical measuring devices using fluorescence as examined light, and includes atoothbrush head 41, astem unit 42, and agrip unit 43. Afirst light source 2 and a secondlight source 3, together with a control circuit 30 (seeFIG. 3 ) and anotification unit 31, are placed on acircuit board 44 disposed in thegrip unit 43. Light from the firstlight source 2 and the secondlight source 3 is guided to thetoothbrush head 41 through acolor mixture unit 4 and anoptical filter 5 for emitting light, disposed in thegrip unit 43, as well as anoptical waveguide 6a for emitting light with a long tapered shape, disposed in thestem unit 42. The direction of the guided light is changed using means such as a mirror or the like in thetoothbrush head 41, and a tooth surface is irradiated with the light as excitation light from alight irradiation unit 50 on thetoothbrush head 41. Fluorescence generated on a tooth is guided to alight detector 24 throughbrushes 40 that are arranged in alight detection unit 51 of thetoothbrush head 41 and are made of a material that transmits fluorescence. - In the present embodiment, the
light irradiation unit 50 is arranged in the center of the toothbrush head, and thelight detection unit 51 is disposed adjacently to thelight irradiation unit 50, as illustrated inFIG. 4B . However, the arrangement is not limited to such an example but encompasses various possible variations. For example, multiplelight irradiation units 50 andlight detection units 51 may be disposed in the toothbrush head, and thelight irradiation units 50 and thelight detection units 51 may be linearly alternately arranged. - Fluorescence detected by the
light detector 24 is converted into photocurrent, which is passed to thecircuit board 44 through awiring 52. The amount of fluorescent substance is determined by thecontrol circuit 30 disposed in thecircuit board 44, and a user is notified of the amount of the fluorescent substance with buzzer, electronic sound, or the like by thenotification unit 31. - In the
grip unit 43, abattery 45 is placed as a power supply for driving thefluorescence measuring device 400. Further, twoswitches 46 are disposed in thegrip unit 43. For example, a fluorescence measuring function can be switched on/off using one of theswitches 46, and notification sound can be switched and fluorescence detection sensitivity can be adjusted using theother switch 46. - The detailed configuration of the
color mixture unit 4 will be described with reference toFIG. 5A to FIG. 5C . It is important that the in-plane intensity distribution of light with which a tooth is irradiated from the firstlight source 2 or the secondlight source 3 is not changed in thefluorescence measuring device 400. Such unchangingness of the in-plane intensity distribution is an important factor for determining a detection limit. Therefore, it is necessary that the in-plane intensity distribution of irradiation light has no wavelength dependence in a stage in which light arrives at alight condensation unit 7 for emitting light disposed in thetoothbrush head 41. Thecolor mixture unit 4 performs the action of eliminating the wavelength dependence of the in-plane intensity distribution of irradiation light. -
FIG. 5A is a view illustrating a configuration example of a color mixture unit using a light pipe with a tapered shape. A long optical path can be obtained by arranging a light pipe as theoptical waveguide 6a for emitting light from thestem unit 42 to thetoothbrush head 41 in the toothbrush-typefluorescence measuring device 400. Plurally repeated reflection of light from the firstlight source 2 or the secondlight source 3 in the light pipe results in uniformalization of the in-plane distribution of the light, and therefore enables the effect of color mixture to be easily enhanced. In other words, theoptical waveguide 6a for emitting light itself functions as a color mixture unit.Light 62 obliquely emitted from the firstlight source 2 or the secondlight source 3 is repeatedly reflected plural times, while light 61 emitted approximately perpendicularly to an end face of theoptical waveguide 6a for emitting light is reflected less times; however, the long optical path can result in effective color mixture. - The use of the light pipe with the tapered shape illustrated in
FIG. 5A as theoptical waveguide 6a for emitting light enables theoptical waveguide 6a for emitting light to have the function of a color mixture unit even when thecolor mixture unit 4 is not separately disposed, and enables the in-plane intensity distribution of irradiation light to approximate uniformity in a simple configuration. Extremely obliquely emitted light is reflected many times in the light pipe, and the reflection loss of the light is therefore unignorable; however, use of shell-shaped LEDs with a low emission angle as the firstlight source 2 and the secondlight source 3 enables such a reflection loss to be reduced and optical coupling efficiency to be simultaneously increased. - The light pipe may be a hollow-type light pipe using a mirror or may be a plastic light pipe. When the light pipe is a plastic light pipe, leaking light can be reduced by coating the outer periphery of the light pipe with a metal mirror. The shape of the light pipe may be a simple linear shape or a tapered shape. The effect of the color mixture can be easily enhanced by disposing a regular or irregular reflection surface in the pipe. A cross-sectional shape of the light pipe may be a round shape, an elliptical shape, a rectangular shape, a polygonal shape, or the like, and it is also easy to properly use a structure suitable for the shape and design of a toothbrush from such various shapes.
-
FIG. 5B is an explanatory diagram of a form in which thecolor mixture unit 4 is added to theoptical waveguide 6a for emitting light illustrated inFIG. 5A . In the example illustrated inFIG. 5B , a color mixture unit in which amicrolens array 64 is arranged on an incidence end face is used as thecolor mixture unit 4. The effect of the color mixture is further enhanced by converting light from the firstlight source 2 or the secondlight source 3 intolight - In the example illustrated in
FIG. 5B , LED chips as the firstlight source 2 and the secondlight source 3 are mounted on asubstrate 63 with a mirror which is a 45-degree reflection mirror. Such a structure allows light emitted from the firstlight source 2 and the secondlight source 3 to be guided forward, and therefore results in a reduced emission angle. In addition, the use of the LED chips enables the spacing between the light sources to be decreased, and therefore enables the in-plane intensity distribution of irradiation light to further approximate uniformity. -
FIG. 5C is an explanatory diagram of a form in which acolor mixture unit 4 having another configuration is added to theoptical waveguide 6a for emitting light illustrating inFIG. 5A . In the example illustrated inFIG. 5C , a color mixture unit including a scatterer that scatters light emitted from the firstlight source 2 and the secondlight source 3 is used as thecolor mixture unit 4. Thiscolor mixture unit 4 is formed by sealing the firstlight source 2 and the secondlight source 3 placed in thesubstrate 63 with a mirror, with a transparent resin including light-scatteringparticles 71. The in-plane intensity distribution of irradiation light is enabled to approximate uniformity by allowing the many light-scatteringparticles 71 to multiply scatter light from each light source. Further, themicrolens array 64 may be added to an emission end face of thecolor mixture unit 4, whereby the effect of the color mixture can be further enhanced. -
FIG. 6 is a configuration view illustrating the interior of thetoothbrush head 41. The light passed through theoptical waveguide 6a for emitting light changes its direction at amirror 6b in thetoothbrush head 41 and passes through anoptical waveguide 6c for emitting light, and then atooth 10 is irradiated with the light as excitation light from thelight condensation unit 7 for emitting light. Fluorescence generated from dental plaque adhering to a surface of the tooth and the tooth in the vicinity of the dental plaque is detected by thelight detector 24 through thebrushes 40 and anoptical filter 23 for receiving light. The leading ends of thebrushes 40 are allowed to have a curvature, thereby functioning aslight condensation units 21 for receiving light. Thebrushes 40 except the leading ends function asoptical waveguides 22 for receiving light. A light-shieldingbody 23a is arranged to surround theoptical filter 23 for receiving light. The light-shieldingbody 23a prevents environmental light and excitation light from being directly incident on theoptical filter 23 for receiving light without through thebrushes 40. - A scattering loss can be prevented by allowing the
optical filter 23 for receiving light and end faces of thebrushes 40 to adhere to each other with an optical adhesive having a refractive index close to the refractive indices of thebrushes 40 and theoptical filter 23 for receiving light. Alternatively, the end faces of thebrushes 40 and anopening 24a of thelight detector 24 can be allowed to adhere to each other with an optical adhesive having the function of theoptical filter 23 for receiving light. A material functioning as an optical filter can also be used as the material of thebrushes 40. In such a case, the end faces of thebrushes 40 are arranged on theopening 24a of thelight detector 24, and are allowed to adhere to theopening 24a with an optical adhesive. -
FIG. 7 is a block diagram illustrating an example of the circuit configuration of acontrol unit 300. Thecontrol unit 300 includesswitches source drive circuits amplifier 85, an A/D converter 86, and a data-processing circuit 87, which are disposed on the circuit board 44 (seeFIG. 4 ) in thegrip unit 43. - The
control circuit 30 controls the lightsource drive circuits light source 2 and the secondlight source 3 and lighting intensities thereof. Light incident on thelight detector 24 is converted into an electric signal by theamplifier 85, and the electric signal is converted into a digital signal by the A/D converter 86. The data-processing circuit 87 performs calculation for determining the amount of fluorescent substance on the basis of the digital signal. Specifically, the data-processing circuit 87 calculates the amount Δp of fluorescent substance originating from the dental plaque using the mathematical expression (3) described above. In addition, the data-processing circuit 87 stores a ratio t1/t2 between the components t1 and t2 of intrinsic fluorescence, measured in advance for a clean tooth. - The A/
D converter 86 can be operated in synchronization with the timing of turning on the firstlight source 2 and the secondlight source 3, thereby digitally performing signal processing of the amount of fluorescent substance in light having a first wavelength and the amount of fluorescent substance in light having a second wavelength. Although the digital signal processing is adopted in the example illustrated inFIG. 7 , equivalent processing may be performed as analog signal processing. - The
switch 80 functions as an electric power switch. Theswitch 81 is used for the switching of notification sound, the setting of sensitivity, and the like. - The
notification unit 31 may provide not only notification with the already described buzzer and electronic sound but also vibration notification using an eccentric motor, notification with LED flashing and light with a changed color tone, and notification with a language, graphics and a graph on a liquid crystal display. It is also acceptable to adopt a method in which wireless communication is used together in thenotification unit 31, and notification information or information about the measurement is sent to an external instrument such as a mobile phone or a personal computer, thereby notifying a user with the external instrument. -
FIG. 8 is a timing chart representing the operation timing of the electronic circuits of thecontrol unit 300. InFIG. 8 , the timing of turning on the firstlight source 2 is represented by LED1, and the timing of turning on the secondlight source 3 is represented by LED2. In the example represented inFIG. 8 , LED1 and LED2 are alternately turned on n times, periods in which LED1 is turned on are denoted by V1 to Vn, and periods in which LED2 is turned on are denoted by B1 to Bn. - Fluorescence is generated from the tooth simultaneously with the tuning on of the first
light source 2 or the secondlight source 3, detected by thelight detector 24, and converted into an electric signal by theamplifier 85. InFIG. 8 , the detected light signal is represented by PD. As such light signals PD, a high signal is output when LED1 is turned on, and a lower signal than the signal output when LED1 is turned on is output when LED2 is turned on. These signals are alternately output. - The analog light signals PD are converted into digital signals AD by the A/
D converter 86 simultaneously with the ends of tuning-on cycles. Then, a digital average circuit Va averages the n items of data of V1 to Vn acquired when LED1 is turned on, thereby removing noise included in the signals. Similarly, a digital average circuit Ba averages the n items of data of B1 to Bn acquired when LED2 is turned on, thereby removing noise included in the signals. - Then, a subtraction processing circuit Diff determines a difference signal of the signals from which the noise has been removed. As a result, the amount Δp of fluorescent substance originating from dental plaque, obtained by subtracting, from measured fluorescence, intrinsic fluorescence from the tooth, can be determined.
- The effect of removing the influence of environmental light can also be obtained by the subtraction processing, when an environmental light component added in the period in which LED1 is turned on and an environmental light component added in the period in which LED2 is turned on are almost the same.
- A component that changes with moving a toothbrush and a component that relates to the frequency of a commercial power supply due to a fluorescent lamp or the like can be considered as the influence due to environmental light. In order to remove the influence of the latter component, the LEDs may be turned on at a sufficiently higher frequency than the frequency of the commercial power supply. Alternatively, fluctuations may be averaged by turning on the LEDs for time over multiple cycles, with the utilization of regular fluctuations. In order to remove the influence of the former component, it is preferable to reduce the turning-on period so that the LEDs are turned on at a sufficiently higher speed than the speed of the movement of the toothbrush, because the former component irregularly fluctuates.
- When it is necessary to make a correction for the emission intensities of LED1 and LED2, the correction may be made by multiplying such an emission intensity by a certain coefficient in the digital average circuit Va or Ba. In accordance with the mathematical expression (3), such an emission intensity may be multiplied by a ratio t1/t2 between the components t1 and t2 of intrinsic fluorescence in the digital average circuit Ba. Alternatively, such an emission intensity may be multiplied by the coefficient t2 in the digital average circuit Va, and may be multiplied by the coefficient t1 in the digital average circuit Ba.
- However, since it is impossible to obtain the effect of eliminating the influence of environmental light when the above-described correction is made, it is preferable to make such a correction by adjusting the intensities of the LED light sources. Alternatively, although not illustrated, the influence of environmental light may be eliminated by inserting turning-off periods between the periods in which the LEDs are turned on, and subtracting digital signals AD in the most recent turning-off periods from the digital signals AD in the turning-on periods. Such elimination enables a correction in a digital average circuit.
- The amount Δp of the fluorescent substance originating from the dental plaque, obtained by the method described above, is sent to the
control circuit 30. Processing and storage of the data are carried out in thecontrol circuit 30, and a user is notified of the data by thenotification unit 31. - In the above description, the processing is performed using the difference in order to obtain the amount Δp of the fluorescent substance originating from the dental plaque; however, when the adhering amount of the dental plaque is intended to be evaluated using the ratio between the amount of the fluorescent substance originating from the dental plaque and the amount of the fluorescent substance originating from the tooth, the control circuit may be changed to perform division processing instead of the subtraction processing Diff.
- A fluorescence measuring device for confirming the principle of the optical measuring method described above was produced, and an experiment was carried out in which an actual tooth was irradiated with excitation light having the first wavelength and excitation light having the second wavelength, and fluorescence spectra from the tooth were measured.
- Shell-shaped LEDs having a diameter of 3 mm were used as the light sources. In consideration of the availability of the LEDs, the wavelength of the first
light source 2 was set at 405 nm (purple), and the wavelength of the secondlight source 3 was set at 465 nm (blue). In order to irradiate a tooth surface with excitation light with a mixed color, three purple LEDs and three blue LEDs were equally spaced in an alternating manner on six places on a circumference having a radius of 3 mm to make an LED ring, and a plastic plate with a scattering effect was further arranged as thecolor mixture unit 4 on the front faces of the LEDs. Theoptical filter 5 for emitting light was not used, because the full-widths at half maximum of the emission spectra of the LED light sources used in the experiment were as low as 30 nm or less. Such an optical system was arranged so that the tooth surface could be uniformly irradiated with light with a mixed color. - A plastic fiber having a core diameter of 1 mm was used as the
optical waveguide 22 for receiving light, and arranged at the center of the LED ring. A scatter plate abutting on the front face of the fiber for receiving light was removed. An optical filter cutting wavelengths of 540 nm or less was used as theoptical filter 23 for receiving light, and inserted into some midpoint of the optical fiber as theoptical waveguide 22 for receiving light, thereby cutting the wavelength components of excitation light. A fiber light-receiving type spectroscope was used as thelight detector 24, and an integral time was set at 50 mS. - A personal computer was used for measurement control and data processing. A stable light intensity was obtained by driving each LED with a constant current using a constant current source. A procedure was repeated five times by a computer program in which a current was passed to each LED in the order of turning on the purple LEDs, turning off all the LEDs, turning on the blue LEDs, and turning off all the LEDs. The turning-on time of each LED was set at 50 mS, and both of the LED currents passed to the purple LEDs and the blue LEDs were set at 10 mA. Spectra obtained by the spectroscope were captured into the computer through a USB interface, and data processing of the spectra was carried out.
- A spectrum obtained by subtracting, from the spectrum captured when the purple LEDs were turned on, the spectrum captured when all the LEDs were subsequently turned off, thereby eliminating the influence of environmental light, was regarded as one fluorescence spectrum obtained when the purple LEDs were turned on. An average spectrum of such five fluorescence spectra was determined. Similar processing was carried out for the blue LEDs, thereby determining an average spectrum. The spectra determined in such a manner are illustrated in
FIG. 9 andFIG. 10 . -
FIG. 9 is a graph illustrating examples of fluorescence spectra obtained by measuring a tooth to which dental plaque adhered, andFIG. 10 is a graph illustrating examples of fluorescence spectra obtained by measuring a clean tooth. The horizontal axis of each graph indicates a wavelengths λ (nm), and the vertical axis of each graph indicate a fluorescence intensity I and a fluorescence intensity ratio r. The fluorescence intensity I is plotted with digital data (count value) from a 16-bit A/D converter incorporated into the spectroscope. InFIG. 9 andFIG. 10 , the solid lines represent spectra obtained by irradiation with light having a wavelength of 405 nm, and the dotted lines represent spectra obtained by irradiation with light having a wavelength of 465 nm. Each alternate long and short dash line represents the ratio r of both the fluorescence intensities, i.e., a value obtained by dividing the fluorescence intensity I obtained by the irradiation with light having a wavelength of 405 nm by the fluorescence intensity I obtained by the irradiation with light having a wavelength of 465 nm. - The combination of data described in each graph for the spectra of
FIG. 9 andFIG. 10 and the combination of data described in each graph for the spectra ofFIG. 1 and FIG. 2 used for describing the principle are different from each other.FIG. 9 corresponds to a plot of the spectrum S1' ofFIG. 1 and the spectrum S2' ofFIG. 2 , andFIG. 10 corresponds to a plot of the spectrum S1 ofFIG. 1 and the spectrum S2 ofFIG. 2 . - In the fluorescence intensity ratio r of the tooth to which the dental plaque adhered, represented in
FIG. 9 , the peaks P1 and P2 of the fluorescence originating from the dental plaque were clearly observed at around 639 nm and around 667 nm. In the fluorescence intensity ratio r of the clean tooth, represented inFIG. 10 , the peaks P1 and P2 of the fluorescence originating from the dental plaque were not observed, although intrinsic fluorescence from the tooth was seen. -
FIG. 11 is a table representing the result of the quantified amount Δp of fluorescent substance originating from the dental plaque, based on the spectra ofFIG. 9 andFIG. 10 . The intensity t1 of fluorescence from the clean tooth irradiated with light having the first wavelength, the intensity p1' of fluorescence from the tooth to which the dental plaque adhered and which was irradiated with light having the first wavelength, the intensity t2 of fluorescence from the clean tooth irradiated with light having the second wavelength, and the intensity t2' of fluorescence from the tooth to which the dental plaque adhered and which was irradiated with light having the second wavelength are listed inFIG. 11 . - The substitutional value of the intensity t1' of the intrinsic fluorescence from the tooth was calculated based on t2' x t1/t2, and the amount Δp of the fluorescent substance originating from the dental plaque was determined by subtracting the substitutional value of the intensity t1' of the intrinsic fluorescence from the tooth from the intensity p1' of the fluorescence from the tooth to which the dental plaque adhered and which was irradiated with light having the first wavelength. As a result, the count number of the amount Δp was 1146.
- In the experiment, LED currents were selected so that the intensities (corresponding to t1 in
FIG. 1 and t2 inFIG. 2 ) of the intrinsic fluorescence at a wavelength of 638 nm from the tooth irradiated with light having the first wavelength and light having the second wavelength were approximately equal. However, purple light was found to be set at a level that is approximately 5.5% higher, as indicated by a value of the excitation light intensity ratio t1/t2 inFIG. 11 of 1.055. A difference between such intensities can be corrected by using the mathematical expression (3), even after measurement. - The above results revealed that measurement of fluorescence at one wavelength obtained by excitation of a tooth by light having two different wavelengths enables fluorescence originating from dental plaque to be separated from intrinsic fluorescence and to be measured, whereby a fluorescence measuring device capable of detecting dental plaque with high precision can be obtained. When the amount Δp of fluorescent substance originating from dental plaque is determined in such a manner and such a count number is almost zero, it is found that a tooth is in a clean state. Thus, one can brush one's teeth with a toothbrush including the fluorescence measuring device while numerically confirming whether the teeth are properly brushed.
- In the optical measuring method described above, the teeth are irradiated with the excitation light having two wavelengths of 405 nm and 465 nm, and the amount of the dental plaque is determined based on the difference between the amounts of fluorescent substance in the examined light of the two wavelengths, on the assumption that the examined light detected in the irradiation with the excitation light at 465 nm does not include the fluorescence from the dental plaque. However, the fluorescence absorption peak of a fluorescent substance included in dental plaque is at around 400 nm, and absorbed fluorescence significantly decreases in a wavelength difference of around ±5 nm; in contrast, the fluorescence absorption peak of a tooth is very broad in comparison with the fluorescent substance included in the dental plaque, and can be regarded as approximately constant in a range of around ±5 nm. Therefore, the excitation light is not limited to excitation light at 405 nm and 465 nm, and a difference between the amounts of fluorescent substance due to dental plaque can be measured even when excitation light having two similar wavelengths between which the difference is around 5 nm, for example, is used. Thus, an optical measuring method in which excitation light having two wavelengths similar to each other is used will be described below.
- Assuming that the amounts of fluorescent substance at around 635 nm generated by irradiating a tooth to which dental plaque adheres with excitation light having two similar wavelengths λ1 and λ2 (for example, λ1 = 400 nm and λ2 = 405 nm) are y1 and y2, respectively, the amounts of the fluorescent substance are expressed by the following mathematical expressions (4) and (5) .


- In the mathematical expressions, yt represents the amount of the fluorescent substance generated from the tooth, and p represents the amount of the dental plaque. η1 and η2 are constants representing the fluorescence efficiency of the fluorescent substance included in the dental plaque for the excitation light having the wavelengths λ1 and λ2, respectively.
- When the amounts y1 and y2 of the fluorescent substance are obtained by measurement with the two wavelengths, the amount p of the dental plaque and the amount yt of the fluorescent substance generated by the tooth can be determined by the following mathematical expressions (7) and (8), on the assumption that the difference Δη between η1 and η2 is defined as the following mathematical expression (6), because η1 and η2 are the constants.


- In actual measurement, the losses of light occur in optical systems in an excitation side and a detection side, respectively. However, since the wavelength dependence of such losses can be corrected in advance and the wavelengths λ1 and λ2 of excitation light are similar, a difference between such losses due to the wavelengths may also be sufficiently reduced.
- Δη is a constant, and the
inverse 1/Δη thereof corresponds to the sensitivity of detection of dental plaque. The value of the detection sensitivity may be experimentally determined and may be set at an optimal value. Alternatively, a sensitivity adjustment dial may be disposed in a fluorescence measuring device so that a user can adjust the value (1/Δη) of the detection sensitivity. - The entire configuration of a fluorescence measuring device in which the excitation light having the two similar wavelengths is used is similar to the entire configuration of the already described
fluorescence measuring device control unit 300 is different from the circuit configurations of thefluorescence measuring devices control unit 300 in which excitation light having two similar wavelengths is used is described below. -
FIG. 12 is a view illustrating a configuration example of adetection circuit 310 using a lock-in amplifier. An LED having a wavelength of 400 nm and an LED having a wavelength of 405 nm are used as a firstlight source 2 and a secondlight source 3, respectively. The respective LEDs are alternately driven by lightsource drive circuits timing signal 101 from anoscillation circuit 100A. The firstlight source 2 is turned on in phase with thetiming signal 101; and the secondlight source 3 is turned on in a phase opposite to thetiming signal 101, since the secondlight source 3 is connected through aninverter 102. - Fluorescence generated on a tooth is detected by a
light detector 24, and is converted into a voltage signal by a current-voltage conversion circuit 85A. Then, phase detection is performed in a lock-inamplifier 103 including aphase detector 104. As a result, a difference component between fluorescence generated in excitation light having a wavelength of 400 nm and fluorescence generated in excitation light having a wavelength of 405 nm is output as an in-phase detection output 105. The in-phase detection output 105 is converted into an in-phase detectiondigital output 107 by an A/D converter 106. Calculation of the digital signal is carried out by acontrol circuit 90, and the amount p of dental plaque in the mathematical expression (7) is calculated from fluorescence intensities. -
FIG. 13 is a timing chart indicating the timing of operation of thedetection circuit 310. InFIG. 13 , thetiming signal 101 is denoted by TIM, and the firstlight source 2 and the secondlight source 3 are denoted by LED1 and LED2, respectively. A light signal obtained after a photocurrent obtained in thelight detector 24 has been converted into a voltage in the current-voltage conversion circuit 85A is denoted by PD, and the in-phase detection output 105 is denoted by IOUT. - The signal intensity of the light signal PD is increased in proportion to the fluorescence efficiency of dental plaque during a period in which LED1 is turned on, and is relatively lower during a period in which LED2 is turned on. The in-phase detection output 105 (IOUT) which is the difference component of fluorescence is obtained by phase detection of the light signal PD. The rising properties of IOUT are determined by the properties of a low-pass filter disposed in the
phase detector 104. -
FIG. 14 is a view illustrating a configuration example of adetection circuit 320 using a two-phase lock-in amplifier. Thedetection circuit 310 illustrated inFIG. 12 measures only the amount of dental plaque p, while thedetection circuit 320 ofFIG. 14 simultaneously detects the amount p of dental plaque and the amount yt of the fluorescent substance of a tooth using a lock-inamplifier 103A which operates in two phases. Thedetection circuit 320 differs from thedetection circuit 310 in addition of a 90°phase shifter 108, aphase detector 109, and an A/D converter 111 to the lock-inamplifier 103A. - In the
detection circuit 320, phase detection is carried out using atiming signal 101 and a signal obtained by delaying thetiming signal 101 by the 90°phase shifter 108. An in-phase detection output 105 from aphase detector 104 is converted into an in-phase detectiondigital output 107 by an A/D converter 106, and a 90°phase detection output 110 from thephase detector 109 is converted into a 90° phase detectiondigital output 112 by the A/D converter 111. Calculation of such digital signals is carried out by acontrol circuit 90, and the amount p of dental plaque and the amount yt of the fluorescent substance of a tooth are calculated from fluorescence intensities on the basis of the mathematical expressions (7) and (8). -
FIG. 15 is a timing chart indicating the timing of operation of thedetection circuit 320. LikeFIG. 13 , thetiming signal 101, a firstlight source 2, a secondlight source 3, an output signal (light signal) from a current-voltage conversion circuit 85A, and the in-phase detection output 105 are denoted by TIM, LED1, LED2, PD, and IOUT, respectively. The 90°phase detection output 110 is denoted by QOUT. - In the
detection circuit 320, LED2 is turned on with delay of a phase of 90° with respect to the timing of turning on LED1. In the light signal PD, fluorescence due to excitation light of LED1 is detected at a phase of 0°, and this fluorescence with fluorescence due to excitation light of LED2 superimposed thereon is detected at a phase of 90°, as indicated by the arrows in the figure. By phase detection of the light signal PD at 0° and 90°, the amount y1 of fluorescent substance due to excitation light of LED1 and the amount y2 of fluorescent substance are directly obtained as the in-phase detection output 105 (IOUT) and the 90° phase detection output 110 (QOUT), respectively. Accordingly, the amount p of dental plaque and the amount yt of the fluorescent substance of a tooth can be simultaneously measured using the mathematical expressions (7) and (8). Therefore, in thedetection circuit 320, the distance between the tooth and adetection unit 200 can be corrected by normalization of the amount p of the dental plaque with the amount yt of the fluorescent substance of the tooth. - Alternatively, in the
detection circuit 320, use of a drive waveform in which the firstlight source 2 and the second light source 3 (LED1 and LED2) are neither simultaneously turned on nor simultaneously turned off enables a change in the signal intensity of the light signal PD to be reduced to a low level, whereby the dynamic range of detection of the amount of fluorescent substance can be improved. Thus, the timing of operation of thedetection circuit 320 in such a case will now be described. -
FIG. 16 is a timing chart indicating other timing of operation of thedetection circuit 320. Symbols TIM, LED1, LED2, and PD in the figure are the same as those inFIG. 15 . In the example indicated inFIG. 16 , LED1 and LED2 are alternately turned on by a timing signal TIM2 having a frequency two times the frequency of the timing signal 101 (TIM). TIM and TIM2 are used as phase signals for phase detection. Currents for driving LED1 and LED2 are modulated to α times (about 0.5 time in the illustrated example) in an interval in which TIM is L. - Assuming that the in-
phase detection output 105 and the 90°phase detection output 110 are y1' and y2', respectively, y1' and y2' are obtained as the sum signal and difference signal of y1 and y2 as indicated in the following mathematical expressions (9) and (10).

- It is preferable that the first wavelength of light emitted by the first
light source 2 and the second wavelength of light emitted by the secondlight source 3 be, for example, in a range from 350 nm to 430 nm, and that the difference between the first wavelength and the second wavelength be 5 nm or more. However, measurement similar to the above-described measurement may be possible, when the difference between the first wavelength and the second wavelength is 1 nm or more, on the basis of the features of the fluorescence absorption peak of the fluorescent substance included in the dental plaque and the fluorescence absorption peak of the tooth. Therefore, the first wavelength and the second wavelength may be in a range from 350 nm to 430 nm, and the difference between the first wavelength and the second wavelength may be 1 nm or more. Use of wavelengths similar to each other as the first wavelength and the second wavelength as described above enables the wavelength dependence of the optical system and fluorescence from a tooth or dental plaque to be canceled with higher precision than use of two wavelengths, such as 405 nm and 465 nm, between which the difference is great, and therefore allows measurement precision to be improved. - In all of the optical measuring methods described above, a tooth is irradiated with excitation light having two wavelengths. However, the wavelengths of excitation light are not limited to two wavelengths and may be three or more wavelengths. Thus, an example in which a tooth is irradiated with excitation light having three wavelengths and the amount of dental plaque is measured is described below.
- In the use of the excitation light having three wavelengths, the following mathematical expressions (11) to (13) corresponding to the mathematical expressions (4) and (5) described above are obtained.


- Alternatively, the amounts y1, y2, and y3 of the fluorescent substance may be measured several times, and the estimated value of the amount p of the dental plaque may be calculated from measurement data sets of the amounts using a least square method as described below.
- When the amount of the fluorescent substance is measured n times, n sets of data, in which each set includes three values of y1, y2, and y3, are obtained. For example, when i-th measurement data y1 is denoted by yli or the like, all the items of obtained data are represented by the following mathematical expressions (14) .

- The mathematical expressions (14) are expressed in a vector form as the following mathematical expression (15) .

- The entire configuration of a fluorescence measuring device in which the excitation light having the three wavelengths is used is similar to the entire configuration of the already described
fluorescence measuring device control unit 300 is different from the circuit configurations of thefluorescence measuring devices control unit 300 in which excitation light having three similar wavelengths is used is described below. -
FIG. 17 is a view illustrating a configuration example of adetection circuit 330 in which excitation light having three wavelengths is used.FIG. 18 is a timing chart indicating the timing of operation of thedetection circuit 330. Thedetection circuit 330 is a detection circuit in which thedetection circuit 320 ofFIG. 14 is further generalized, and the number of the phases of the lock-in amplifier is increased to three. - The
detection circuit 330 includes threelight sources source drive circuits detection circuit 330 includes threephase detectors phase shifters detection circuit 330, atiming signal 101 from anoscillation circuit 100A is used as an in-phase signal, and phase signals of 60° and 120° are generated by the 60°phase shifters - Output signals from the
phase detectors D converters control circuit 90 as described below. - Assuming that phase detection outputs (detection signals 107, 107A, and 107B) in three phases are y1', y2', and y3', respectively, the amounts y1, y2, and y3 of fluorescent substance due to the excitation light having the three wavelengths λ1, λ2, and λ3 are mixed in a manner as represented in the following mathematical expressions (16) to (18).


- The simultaneous equations can be solved for y1, y2, and y3 as represented in the following mathematical expressions (19) to (21).


- Accordingly, the
control circuit 90 determines the amounts y1, y2, and y3 of fluorescent substance corresponding to the wavelengths λ1, λ2, and λ3, respectively, according to the mathematical expressions (19) to (21). - It is assumed that the amount yt of fluorescent substance generated from a tooth is constant in the above calculation. However, the amount of dental plaque can also be determined as follows, in consideration of a difference between fluorescence efficiencies due to the wavelengths of excitation light.
- Assuming that the amount of fluorescent substance causing fluorescence to be generated from a tooth is q and the fluorescence efficiencies according to the wavelengths are ηt1, ηt2, and ηt3, the amounts y1, y2, and y3 of fluorescent substance are represented by the following mathematical expressions (22) to (24).


- The amount q of fluorescent substance and the amount p of dental plaque can be simultaneously determined from n sets of data in the same manner as described above, by defining an observation equation as the following mathematical expression (25) in which Z is a vector including 3n components (ηt1, ηt2, ηt3, ...), according to the calculation method by the least square method described above.

- An optical measuring method using excitation light having three wavelengths is insusceptible to noise such as environmental light. This is because only a component in which the amount of fluorescent substance desirably varies can be detected, in a reflection of a variation in fluorescence efficiency due to the wavelengths. The probability that signal intensity desirably varies due to noise by accident is decreased with increasing the complexity of wavelengths (fluorescence efficiencies) and the order thereof. Accordingly, with increasing the number of wavelengths, resistance to noise is enhanced, and an improvement of S/N ratio and enhancement of sensitivity can be expected.
- Although not illustrated, even when excitation light having three wavelengths is used, the dynamic range of detection of the amount of fluorescent substance can be similarly improved by using a drive waveform in which light sources are neither simultaneously turned on nor simultaneously turned off, as the operation timing indicated in
FIG. 16 . - When the amount of dental plaque is fed back to a user in real time by sound or vibrations during toothbrushing, usability may be improved by feeding back, at the time of touching a tooth with the leading ends of the brushes, the amount of dental plaque on the touched location. For such a purpose, a method is suitable in which the same optical waveguide is used in common as the
optical waveguide 6 for emitting light and theoptical waveguide 22 for receiving light in thefluorescence measuring device optical waveguide 6 for emitting light and theoptical waveguide 22 for receiving light is described below. -
FIG. 19 is a configuration view of anotherfluorescence measuring device 500. Components common to the components of thefluorescence measuring device fluorescence measuring device 500, a sharedoptical waveguide 6A is used as an optical waveguide for emitting light and an optical waveguide for receiving light in common. - In the
fluorescence measuring device 500, excitation light from a firstlight source 2 or a secondlight source 3 is incident on a mirror M through acolor mixture unit 4, anoptical filter 5 for emitting light, and anoptical waveguide 6 for emitting light. The mirror M includes a dichroic mirror, a half mirror, or the like, and has the properties of reflecting light in the wavelength region of excitation light and transmitting light in the wavelength region of fluorescence. Accordingly, excitation light from the firstlight source 2 or the secondlight source 3 is reflected by the mirror M, and passes through the sharedoptical waveguide 6A, and atooth 10 including aportion 11 to which dental plaque adheres is irradiated with the excitation light asfirst irradiation light 8 or second irradiation light 9 from alight condensation unit 7 for emitting light. Examined light 20 (fluorescence) from thetooth 10 is incident on the light condensation unit for emitting light, re-passes through the sharedoptical waveguide 6A, and arrives at the mirror M. However, since the mirror M transmits light in the wavelength region of fluorescence, the examined light 20 passes through the mirror M and arrives at alight detector 24 through anoptical waveguide 22 for receiving light and anoptical filter 23 for receiving light. - In the
fluorescence measuring device 500, theoptical filter 5 for emitting light and theoptical filter 23 for receiving light can be omitted. - For example, one brush of a toothbrush can be used as the shared
optical waveguide 6A in thefluorescence measuring device 500. In such a case, dental plaque can be stably detected because emitted light is not shielded by a brush other than brushes for receiving light. Accordingly, detection can be reliably performed particularly in a gap portion such as an interdental space or a periodontal pocket, to which dental plaque easily adheres, and practical usefulness is therefore provided. - In all the optical measuring methods described above, fluorescence is detected as examined light from a tooth. However, the amount of dental plaque can also be measured by detecting a change in the intensity of the reflected light of excitation light with which a tooth has been irradiated. Thus, an optical measuring method in which reflected light of excitation light is used as examined light is described below.
-
FIG. 20 is a graph illustrating the spectra of reflected light and fluorescence obtained by irradiating a tooth to which dental plaque adheres and a clean tooth with excitation light at 405 nm.FIG. 21 is a graph illustrating the spectra of reflected light and fluorescence obtained by irradiating the tooth to which the dental plaque adheres and the clean tooth with excitation light at 400 nm. The horizontal axis of each graph indicates a wavelength λ (nm), and the vertical axis of each graph indicates the intensity I of fluorescence or reflected light. LikeFIG. 1 and FIG. 2 , the thin line of each graph represents the spectrum S1 obtained from the clean tooth, and the thick line of each graph represents the spectrum S1' obtained from the tooth to which the dental plaque adheres. - First, the spectra S1' are observed with attention to fluorescence at 635 nm indicated by P1 in the figures. The amount Δp" of fluorescent substance originating from the dental plaque in excitation of the tooth to which the dental plaque adheres at a wavelength of 400 nm is larger than the amount Δp of fluorescent substance originating from the dental plaque in excitation of the same tooth at a wavelength of 405 nm, because the fluorescence efficiency of the fluorescent substance included in the dental plaque is high. In other words, the intensity of fluorescence having a wavelength of 635 nm corresponds to the sum of the amount t1' of the fluorescent substance of the tooth and the amount Δp of the fluorescent substance of the dental plaque in the excitation at a wavelength of 405 nm, and corresponds to the sum of the amount t1' of the fluorescent substance of the tooth and the amount Δp" (>Δp) of the fluorescent substance of the dental plaque in the excitation at a wavelength of 400 nm.
- Then, the spectra are observed with attention to reflected light. The intensity E1' of reflected light in excitation of the tooth to which the dental plaque adheres at a wavelength of 405 nm is less than the intensity E1 of reflected light in excitation of the clean tooth at a wavelength of 405 nm for the following two reasons. The first reason is that a decrease ΔR1 occurs due to scattering on the dental plaque because the dental plaque itself has the property of scattering light. The second reason is that a decrease ΔR2 occurs due to the absorption of fluorescence by the fluorescent substance included in the dental plaque. Because part of light energy absorbed by the fluorescent substance included in the tooth is released as fluorescence at a wavelength of around 635 nm, the decrease ΔR2 is proportional to the amount Δp of the fluorescent substance.
- The intensity of the reflected light at a wavelength of 405 nm corresponds to the sum of a decrease due to scattering on the dental plaque and a decrease due to the absorption of fluorescence by the dental plaque. With regard to the sum, ΔR" in the excitation at a wavelength of 400 nm is larger than ΔR in the excitation at a wavelength of 405 nm, because the absorption of fluorescence by the dental plaque increases as indicated by symbol ΔR3 in
FIG. 21 . Accordingly, the amount of the dental plaque can be estimated from the ratio or difference between the intensities of light reflected when the tooth is irradiated with the excitation light having the wavelengths different from each other. - With attention to the fact that a decrease in the intensity of reflected light represents an increase in the amount of dental plaque, a specific calculation method in which reflected light is used as examined light is fundamentally the same as the calculation method in which fluorescence is used as examined light, except that the directions of variations (increase and decrease) are opposite to each other.
- The entire configuration of an optical measuring device (reflected-light measuring device) in which reflected light is used as examined light is similar to the entire configuration of the already described
fluorescence measuring device optical filter 5 for emitting light is not necessary in the reflected-light measuring device, because it is not needed to cut a frequency region corresponding to a fluorescence region. In the reflected-light measuring device, an optical filter that cuts 430 nm or more is preferably used as theoptical filter 23 for receiving light.
Claims (14)
- An optical measuring device (1, 400, 500) comprising:a first light source (2) that emits light having a first wavelength and exciting a fluorescent substance included in a sample emitting autofluorescence, and generating fluorescence in a fluorescence wavelength region;a second light source (3) that emits light having a second wavelength longer than the first wavelength and having lower excitation efficiency for the fluorescent substance than the first light;a detection unit (200) that detects a first intensity of fluorescence generated when the sample is irradiated with the first light, and a second intensity of fluorescence generated when the sample is irradiated with the second light; anda control unit (300), characterized in thatthe control unit (300) calculates an amount of the fluorescent substance based on the intensities of the examined light detected by the detection unit (200) in response to the light having the plurality of wavelengths using a difference or ratio between the first intensity and the second intensity, by using said difference or ratio to separate the fluorescence originated from the fluorescent substance which issuperimposed on the autofluorescence of the sample, andthe first intensity and the second intensity are spectrum intensities of fluorescence at the same wavelength.
- The optical measuring device (1, 400, 500) according to claim 1, wherein the sample is irradiated alternately with the first light and the second light.
- The optical measuring device (1, 400, 500) according to claim 1 or 2, whereinthe first wavelength is a wavelength in a range from 350 nm to 430 nm, andthe second wavelength is a wavelength in a range from 435 nm to 500 nm.
- The optical measuring device (1, 400, 500) according to claim 1 or 2, whereinthe first and second wavelengths are wavelengths in a range from 350 nm to 430 nm, anda difference between the first wavelength and the second wavelength is 5 nm or more.
- The optical measuring device (1, 400, 500) according to any one of claims 1 to 4, further comprising a color mixture unit (4) that makes intensity distributions uniform in a surface irradiated with the light emitted from the first light source (2) and the second light source (3).
- The optical measuring device (1, 400, 500) according to any one of claims 1 to 5, wherein the detection unit (200) comprises an optical filter (23) for receiving light that cuts a wavelength region excluding a range of a wavelength of fluorescence emitted by the fluorescent substance.
- The optical measuring device (1, 400, 500) according to any one of claims 1 to 6, further comprising an optical filter (5) for emitting light that cuts a wavelength region excluding the wavelengths of the light from the first light source (2) and the second light source (3).
- The optical measuring device (1, 400, 500) according to any one of claims 1 to 7, whereinthe first light source (2) and the second light source (3) comprise an optical waveguide (6) for emitting light, through which the first light and the second light are guided,the detection unit (200) comprises an optical waveguide (22) for receiving light, through which the fluorescence emitted by the fluorescent substance is guided, andthe optical waveguide (6) for emitting light and the optical waveguide (22) for receiving light are formed by a same optical waveguide (6A).
- The optical measuring device (1, 400, 500) according to any one of claims 1 to 8, whereinthe sample is a tooth (10),the fluorescent substance is protoporphyrin IX included in dental plaque, andthe first intensity and the second intensity are intensities of fluorescence at a wavelength corresponding to a peak at around 635 nm in a spectrum of fluorescence of the dental plaque.
- The optical measuring device (1, 400, 500) according to any one of claims 1 to 9, whereinturning on the first light source (2), turning on the second light source (3), and turning off both the first light source (2) and the second light source (3) are repeated,the detection unit (200) further detects an intensity of environmental light when both the first light source (2) and the second light source (3) are turned off, andthe control unit (300) calculates the amount of the fluorescent substance, based on a difference between the first intensity and the intensity of environmental light, and a difference between the second intensity and the intensity of environmental light.
- The optical measuring device (1, 400, 500) according to any one of claims 1 to 9, whereinthe first light source (2, LED1) is turned on in phase with a timing signal (101, TIM),the second light source (3, LED2) is turned on in a phase opposite to the timing signal (101, TIM), andthe control unit (300) includesa phase detector (104) that performs phase detection using the timing signal (101, TIM) and thereby outputs a difference between the first intensity and the second intensity, anda control circuit (90) that calculates the amount of the fluorescent substance from the difference.
- The optical measuring device (1, 400, 500) according to any one of claims 1 to 9, whereinthe first light source (2, LED1) is turned on in phase with a timing signal (101, TIM),the second light source (3, LED2) is turned on with delay of a 90 degree phase with respect to timing of turning on the first light source (2, LED1), andthe control unit (300) includesa first phase detector (104) that performs phase detection using the timing signal (101, TIM) and thereby generates a first output signal according to the first intensity and the second intensity,a second phase detector (109) that performs phase detection using a signal obtained by delaying the timing signal (101, TIM) and thereby generates a second output signal according to the first intensity and the second intensity, anda control circuit (90) that calculates the amount of the fluorescent substance to be measured and an amount of a fluorescent substance of the sample, from the first output signal and the second output signal.
- The optical measuring device (1, 400, 500) according to claim 12, whereinthe first light source (2) and the second light source (3) are light-emitting diodes (LED1, LED2), and are alternately turned on in accordance with a second timing signal (TIM2) having a frequency twice as large as the timing signal (TIM), andcurrents for driving the light-emitting diodes (LED1, LED2) are decreased by a factor of a predetermined constant in intervals where the timing signal (TIM) is low, as compared to the currents in intervals where the timing signal (TIM) is high.
- A toothbrush comprising the optical measuring device (400) according to any one of claims 1 to 13.
Applications Claiming Priority (2)
| Application Number | Priority Date | Filing Date | Title |
|---|---|---|---|
| JP2015040228 | 2015-03-02 | ||
| PCT/JP2016/056112 WO2016140199A1 (en) | 2015-03-02 | 2016-02-29 | Optical measuring device and toothbrush provided with same |
Publications (3)
| Publication Number | Publication Date |
|---|---|
| EP3267182A1 EP3267182A1 (en) | 2018-01-10 |
| EP3267182A4 EP3267182A4 (en) | 2018-11-07 |
| EP3267182B1 true EP3267182B1 (en) | 2022-02-23 |
Family
ID=56848481
Family Applications (1)
| Application Number | Title | Priority Date | Filing Date |
|---|---|---|---|
| EP16758892.0A Active EP3267182B1 (en) | 2015-03-02 | 2016-02-29 | Optical measuring device and toothbrush provided with same |
Country Status (5)
| Country | Link |
|---|---|
| US (1) | US10390708B2 (en) |
| EP (1) | EP3267182B1 (en) |
| JP (1) | JP6681875B2 (en) |
| CN (1) | CN107430072B (en) |
| WO (1) | WO2016140199A1 (en) |
Families Citing this family (20)
| Publication number | Priority date | Publication date | Assignee | Title |
|---|---|---|---|---|
| EP3288415B1 (en) * | 2015-06-12 | 2023-08-23 | Colgate-Palmolive Company | Electric toothbrush and brush unit |
| JP2017056198A (en) * | 2015-09-14 | 2017-03-23 | シチズン時計株式会社 | toothbrush |
| EP4000453B1 (en) * | 2015-12-28 | 2024-03-27 | Colgate-Palmolive Company | Light emitting oral care implement |
| WO2017164026A1 (en) * | 2016-03-24 | 2017-09-28 | オムロンヘルスケア株式会社 | Plaque detecting device and toothbrush |
| JP6892772B2 (en) * | 2017-03-17 | 2021-06-23 | シチズン時計株式会社 | Dental plaque inspection device |
| JP2018165708A (en) * | 2017-03-28 | 2018-10-25 | シチズン時計株式会社 | Spectral device |
| JP6854681B2 (en) * | 2017-03-29 | 2021-04-07 | シチズン時計株式会社 | Judgment device |
| JP6910175B2 (en) * | 2017-03-30 | 2021-07-28 | シチズン時計株式会社 | Light measuring device and toothbrush equipped with it |
| JP6827382B2 (en) * | 2017-07-18 | 2021-02-10 | 能美防災株式会社 | Mobile smoke detector |
| CN107550579A (en) * | 2017-10-13 | 2018-01-09 | 北京唯诺卡科技有限公司 | A kind of dental handpiece |
| WO2019115364A1 (en) * | 2017-12-12 | 2019-06-20 | Koninklijke Philips N.V. | Method and system for improved measurement of localized oral inflammation using centroid sampling |
| JPWO2019188264A1 (en) * | 2018-03-29 | 2021-04-15 | シチズン時計株式会社 | Light irradiation device |
| JP6985969B2 (en) * | 2018-03-29 | 2021-12-22 | シチズン時計株式会社 | Light measuring device and toothbrush equipped with it |
| JP7004600B2 (en) * | 2018-03-29 | 2022-01-21 | シチズン時計株式会社 | Tooth condition detector and toothbrush |
| US20210290071A1 (en) * | 2018-07-13 | 2021-09-23 | Plaqless Ltd | An apparatus for detecting oral diseases and hazards |
| WO2020045110A1 (en) * | 2018-08-27 | 2020-03-05 | シチズン時計株式会社 | Light detection module and light detection device |
| JP7094195B2 (en) * | 2018-10-18 | 2022-07-01 | シチズン時計株式会社 | Fluorescence detector |
| WO2020126569A1 (en) * | 2018-12-20 | 2020-06-25 | Empident Gmbh | Method and system for oral hygiene inspection |
| JP2022145164A (en) * | 2021-03-19 | 2022-10-03 | 株式会社ジャパンディスプレイ | Brush with LED light source |
| KR102635706B1 (en) * | 2023-08-07 | 2024-02-13 | 주식회사 빅스캔 | Ultra-fine 3D Camera Device for Imaging Root Canal |
Family Cites Families (23)
| Publication number | Priority date | Publication date | Assignee | Title |
|---|---|---|---|---|
| JP2799191B2 (en) * | 1989-08-24 | 1998-09-17 | オリンパス光学工業株式会社 | Method for forming two-dimensional concentration distribution image of intracellular ions |
| DE4200741C2 (en) | 1992-01-14 | 2000-06-15 | Kaltenbach & Voigt | Device for the detection of caries on teeth |
| JP3487933B2 (en) * | 1993-12-03 | 2004-01-19 | オリンパス株式会社 | Fluorescence observation device |
| NO953680D0 (en) | 1995-09-18 | 1995-09-18 | Hans Prydz | Cell cycle Enzymes |
| AU2945799A (en) * | 1998-03-30 | 1999-10-18 | Packard Instrument Company, Inc. | Improvements in and relating to biomedical assays |
| GB9810471D0 (en) | 1998-05-16 | 1998-07-15 | Helmet Hund Gmbh | Toothbrush |
| DE10133451B4 (en) * | 2001-07-10 | 2012-01-26 | Ferton Holding S.A. | Device for detecting caries, plaque, concrements or bacterial infestation of teeth |
| JP2003075348A (en) * | 2001-08-31 | 2003-03-12 | Dkk Toa Corp | Method and instrument for measuring water quality |
| JP2003210497A (en) * | 2002-01-23 | 2003-07-29 | Matsushita Electric Ind Co Ltd | Dental plaque examining device |
| JP4471709B2 (en) * | 2003-04-03 | 2010-06-02 | 花王株式会社 | Caries detection device |
| EP1614378A4 (en) * | 2003-04-03 | 2009-07-29 | Kao Corp | Carious tooth detection device |
| JP2008229024A (en) * | 2007-03-20 | 2008-10-02 | Olympus Corp | Fluorescence observation device |
| US9042967B2 (en) * | 2008-05-20 | 2015-05-26 | University Health Network | Device and method for wound imaging and monitoring |
| JP5161755B2 (en) * | 2008-12-25 | 2013-03-13 | 浜松ホトニクス株式会社 | Spectrometer, spectroscopic method, and spectroscopic program |
| WO2011035372A1 (en) | 2009-09-22 | 2011-03-31 | Topstore Pty Ltd | Illuminating dental instrument, coupling and method of use |
| US8314377B2 (en) * | 2009-12-23 | 2012-11-20 | Mcneil-Ppc, Inc. | Device and method for detecting plaque in the oral cavity |
| JP4979777B2 (en) * | 2010-01-18 | 2012-07-18 | オリンパス株式会社 | Microscope image processing device |
| JP2013034569A (en) * | 2011-08-05 | 2013-02-21 | Gc Corp | Intraoral examination device and method for operating the same |
| JP2013172903A (en) * | 2012-02-27 | 2013-09-05 | Fujifilm Corp | Electronic endoscope |
| KR101410739B1 (en) * | 2012-07-09 | 2014-06-24 | 한국전기연구원 | Transmitted light detection type measurement apparatus for skin autofluorescence |
| CN103536275B (en) * | 2012-07-09 | 2016-08-10 | 韩国电气研究院 | Reflection detection type for skin autofluorescence measures equipment |
| CN105050488A (en) | 2012-12-19 | 2015-11-11 | 皇家飞利浦有限公司 | Dental apparatus and method of utilizing the same |
| EP2934286A1 (en) * | 2012-12-21 | 2015-10-28 | Koninklijke Philips N.V. | Dental apparatus and method of utilizing the same |
-
2016
- 2016-02-29 US US15/555,405 patent/US10390708B2/en active Active
- 2016-02-29 WO PCT/JP2016/056112 patent/WO2016140199A1/en active Application Filing
- 2016-02-29 CN CN201680013325.0A patent/CN107430072B/en active Active
- 2016-02-29 EP EP16758892.0A patent/EP3267182B1/en active Active
- 2016-02-29 JP JP2017503650A patent/JP6681875B2/en active Active
Non-Patent Citations (1)
| Title |
|---|
| None * |
Also Published As
| Publication number | Publication date |
|---|---|
| JP6681875B2 (en) | 2020-04-15 |
| US10390708B2 (en) | 2019-08-27 |
| EP3267182A4 (en) | 2018-11-07 |
| JPWO2016140199A1 (en) | 2017-12-14 |
| CN107430072B (en) | 2021-04-30 |
| CN107430072A (en) | 2017-12-01 |
| US20180035896A1 (en) | 2018-02-08 |
| WO2016140199A1 (en) | 2016-09-09 |
| EP3267182A1 (en) | 2018-01-10 |
Similar Documents
| Publication | Publication Date | Title |
|---|---|---|
| EP3267182B1 (en) | Optical measuring device and toothbrush provided with same | |
| US9517015B2 (en) | Dental apparatus and method of utilizing the same | |
| US6186780B1 (en) | Method and device for the recognition of caries, plaque, concretions or bacterial infection on teeth | |
| JP6302931B2 (en) | Frequency domain time-resolved fluorescence method and system for plaque detection | |
| MX2010014352A (en) | Device and method for detecting plaque in the oral cavity. | |
| JP6067879B2 (en) | Plaque detection with drive noise tolerance | |
| CN105050488A (en) | Dental apparatus and method of utilizing the same | |
| TW201317558A (en) | Optical detection apparatus and optical measurement system | |
| US9632031B2 (en) | System for in vitro detection and/or quantification by fluorometry | |
| KR20120099109A (en) | Measuring system and measuring method, in particular for determining blood glucose | |
| JP2017534336A (en) | Apparatus and method for plaque detection | |
| JP4902582B2 (en) | Fluorescence detection device | |
| CN109688967A (en) | Dental curing photosystem and method | |
| US10010250B2 (en) | Dental apparatus and method of utilizing the same | |
| JP6910175B2 (en) | Light measuring device and toothbrush equipped with it | |
| JP2017153841A (en) | Dental plaque detecting device and toothbrush | |
| JP6985969B2 (en) | Light measuring device and toothbrush equipped with it | |
| CN104880391B (en) | For detecting the device of particulate matter in saliva | |
| JP2009233404A (en) | Non-invasive type quantifying instrument of biological component | |
| JP2017143955A (en) | Dental plaque detection device | |
| JP7004600B2 (en) | Tooth condition detector and toothbrush | |
| JPH1147166A (en) | Plaque detector | |
| JP2018166776A (en) | Determination device | |
| JP2018169388A (en) | Optical device | |
| US20140364708A1 (en) | Apparatus for enhancing the mold-in algorithm |
Legal Events
| Date | Code | Title | Description |
|---|---|---|---|
| STAA | Information on the status of an ep patent application or granted ep patent |
Free format text: STATUS: THE INTERNATIONAL PUBLICATION HAS BEEN MADE |
|
| PUAI | Public reference made under article 153(3) epc to a published international application that has entered the european phase |
Free format text: ORIGINAL CODE: 0009012 |
|
| STAA | Information on the status of an ep patent application or granted ep patent |
Free format text: STATUS: REQUEST FOR EXAMINATION WAS MADE |
|
| 17P | Request for examination filed |
Effective date: 20170905 |
|
| AK | Designated contracting states |
Kind code of ref document: A1 Designated state(s): AL AT BE BG CH CY CZ DE DK EE ES FI FR GB GR HR HU IE IS IT LI LT LU LV MC MK MT NL NO PL PT RO RS SE SI SK SM TR |
|
| AX | Request for extension of the european patent |
Extension state: BA ME |
|
| DAV | Request for validation of the european patent (deleted) | ||
| DAX | Request for extension of the european patent (deleted) | ||
| REG | Reference to a national code |
Ref country code: DE Ref legal event code: R079 Ref document number: 602016069354 Country of ref document: DE Free format text: PREVIOUS MAIN CLASS: G01N0021640000 Ipc: A61B0001240000 |
|
| A4 | Supplementary search report drawn up and despatched |
Effective date: 20181010 |
|
| RIC1 | Information provided on ipc code assigned before grant |
Ipc: A61B 5/00 20060101ALI20181004BHEP Ipc: A61B 1/24 20060101AFI20181004BHEP |
|
| STAA | Information on the status of an ep patent application or granted ep patent |
Free format text: STATUS: EXAMINATION IS IN PROGRESS |
|
| 17Q | First examination report despatched |
Effective date: 20200312 |
|
| STAA | Information on the status of an ep patent application or granted ep patent |
Free format text: STATUS: EXAMINATION IS IN PROGRESS |
|
| GRAP | Despatch of communication of intention to grant a patent |
Free format text: ORIGINAL CODE: EPIDOSNIGR1 |
|
| STAA | Information on the status of an ep patent application or granted ep patent |
Free format text: STATUS: GRANT OF PATENT IS INTENDED |
|
| INTG | Intention to grant announced |
Effective date: 20210928 |
|
| GRAS | Grant fee paid |
Free format text: ORIGINAL CODE: EPIDOSNIGR3 |
|
| GRAA | (expected) grant |
Free format text: ORIGINAL CODE: 0009210 |
|
| STAA | Information on the status of an ep patent application or granted ep patent |
Free format text: STATUS: THE PATENT HAS BEEN GRANTED |
|
| AK | Designated contracting states |
Kind code of ref document: B1 Designated state(s): AL AT BE BG CH CY CZ DE DK EE ES FI FR GB GR HR HU IE IS IT LI LT LU LV MC MK MT NL NO PL PT RO RS SE SI SK SM TR |
|
| REG | Reference to a national code |
Ref country code: GB Ref legal event code: FG4D |
|
| REG | Reference to a national code |
Ref country code: CH Ref legal event code: EP |
|
| REG | Reference to a national code |
Ref country code: DE Ref legal event code: R096 Ref document number: 602016069354 Country of ref document: DE |
|
| REG | Reference to a national code |
Ref country code: AT Ref legal event code: REF Ref document number: 1469803 Country of ref document: AT Kind code of ref document: T Effective date: 20220315 |
|
| REG | Reference to a national code |
Ref country code: IE Ref legal event code: FG4D |
|
| REG | Reference to a national code |
Ref country code: LT Ref legal event code: MG9D |
|
| REG | Reference to a national code |
Ref country code: NL Ref legal event code: MP Effective date: 20220223 |
|
| REG | Reference to a national code |
Ref country code: AT Ref legal event code: MK05 Ref document number: 1469803 Country of ref document: AT Kind code of ref document: T Effective date: 20220223 |
|
| PG25 | Lapsed in a contracting state [announced via postgrant information from national office to epo] |
Ref country code: SE Free format text: LAPSE BECAUSE OF FAILURE TO SUBMIT A TRANSLATION OF THE DESCRIPTION OR TO PAY THE FEE WITHIN THE PRESCRIBED TIME-LIMIT Effective date: 20220223 Ref country code: RS Free format text: LAPSE BECAUSE OF FAILURE TO SUBMIT A TRANSLATION OF THE DESCRIPTION OR TO PAY THE FEE WITHIN THE PRESCRIBED TIME-LIMIT Effective date: 20220223 Ref country code: PT Free format text: LAPSE BECAUSE OF FAILURE TO SUBMIT A TRANSLATION OF THE DESCRIPTION OR TO PAY THE FEE WITHIN THE PRESCRIBED TIME-LIMIT Effective date: 20220623 Ref country code: NO Free format text: LAPSE BECAUSE OF FAILURE TO SUBMIT A TRANSLATION OF THE DESCRIPTION OR TO PAY THE FEE WITHIN THE PRESCRIBED TIME-LIMIT Effective date: 20220523 Ref country code: NL Free format text: LAPSE BECAUSE OF FAILURE TO SUBMIT A TRANSLATION OF THE DESCRIPTION OR TO PAY THE FEE WITHIN THE PRESCRIBED TIME-LIMIT Effective date: 20220223 Ref country code: LT Free format text: LAPSE BECAUSE OF FAILURE TO SUBMIT A TRANSLATION OF THE DESCRIPTION OR TO PAY THE FEE WITHIN THE PRESCRIBED TIME-LIMIT Effective date: 20220223 Ref country code: HR Free format text: LAPSE BECAUSE OF FAILURE TO SUBMIT A TRANSLATION OF THE DESCRIPTION OR TO PAY THE FEE WITHIN THE PRESCRIBED TIME-LIMIT Effective date: 20220223 Ref country code: ES Free format text: LAPSE BECAUSE OF FAILURE TO SUBMIT A TRANSLATION OF THE DESCRIPTION OR TO PAY THE FEE WITHIN THE PRESCRIBED TIME-LIMIT Effective date: 20220223 Ref country code: BG Free format text: LAPSE BECAUSE OF FAILURE TO SUBMIT A TRANSLATION OF THE DESCRIPTION OR TO PAY THE FEE WITHIN THE PRESCRIBED TIME-LIMIT Effective date: 20220523 |
|
| PG25 | Lapsed in a contracting state [announced via postgrant information from national office to epo] |
Ref country code: PL Free format text: LAPSE BECAUSE OF FAILURE TO SUBMIT A TRANSLATION OF THE DESCRIPTION OR TO PAY THE FEE WITHIN THE PRESCRIBED TIME-LIMIT Effective date: 20220223 Ref country code: LV Free format text: LAPSE BECAUSE OF FAILURE TO SUBMIT A TRANSLATION OF THE DESCRIPTION OR TO PAY THE FEE WITHIN THE PRESCRIBED TIME-LIMIT Effective date: 20220223 Ref country code: GR Free format text: LAPSE BECAUSE OF FAILURE TO SUBMIT A TRANSLATION OF THE DESCRIPTION OR TO PAY THE FEE WITHIN THE PRESCRIBED TIME-LIMIT Effective date: 20220524 Ref country code: FI Free format text: LAPSE BECAUSE OF FAILURE TO SUBMIT A TRANSLATION OF THE DESCRIPTION OR TO PAY THE FEE WITHIN THE PRESCRIBED TIME-LIMIT Effective date: 20220223 Ref country code: AT Free format text: LAPSE BECAUSE OF FAILURE TO SUBMIT A TRANSLATION OF THE DESCRIPTION OR TO PAY THE FEE WITHIN THE PRESCRIBED TIME-LIMIT Effective date: 20220223 |
|
| PG25 | Lapsed in a contracting state [announced via postgrant information from national office to epo] |
Ref country code: IS Free format text: LAPSE BECAUSE OF FAILURE TO SUBMIT A TRANSLATION OF THE DESCRIPTION OR TO PAY THE FEE WITHIN THE PRESCRIBED TIME-LIMIT Effective date: 20220623 |
|
| REG | Reference to a national code |
Ref country code: CH Ref legal event code: PL |
|
| REG | Reference to a national code |
Ref country code: BE Ref legal event code: MM Effective date: 20220228 |
|
| PG25 | Lapsed in a contracting state [announced via postgrant information from national office to epo] |
Ref country code: SM Free format text: LAPSE BECAUSE OF FAILURE TO SUBMIT A TRANSLATION OF THE DESCRIPTION OR TO PAY THE FEE WITHIN THE PRESCRIBED TIME-LIMIT Effective date: 20220223 Ref country code: SK Free format text: LAPSE BECAUSE OF FAILURE TO SUBMIT A TRANSLATION OF THE DESCRIPTION OR TO PAY THE FEE WITHIN THE PRESCRIBED TIME-LIMIT Effective date: 20220223 Ref country code: RO Free format text: LAPSE BECAUSE OF FAILURE TO SUBMIT A TRANSLATION OF THE DESCRIPTION OR TO PAY THE FEE WITHIN THE PRESCRIBED TIME-LIMIT Effective date: 20220223 Ref country code: LU Free format text: LAPSE BECAUSE OF NON-PAYMENT OF DUE FEES Effective date: 20220228 Ref country code: EE Free format text: LAPSE BECAUSE OF FAILURE TO SUBMIT A TRANSLATION OF THE DESCRIPTION OR TO PAY THE FEE WITHIN THE PRESCRIBED TIME-LIMIT Effective date: 20220223 Ref country code: DK Free format text: LAPSE BECAUSE OF FAILURE TO SUBMIT A TRANSLATION OF THE DESCRIPTION OR TO PAY THE FEE WITHIN THE PRESCRIBED TIME-LIMIT Effective date: 20220223 Ref country code: CZ Free format text: LAPSE BECAUSE OF FAILURE TO SUBMIT A TRANSLATION OF THE DESCRIPTION OR TO PAY THE FEE WITHIN THE PRESCRIBED TIME-LIMIT Effective date: 20220223 |
|
| REG | Reference to a national code |
Ref country code: DE Ref legal event code: R097 Ref document number: 602016069354 Country of ref document: DE |
|
| PG25 | Lapsed in a contracting state [announced via postgrant information from national office to epo] |
Ref country code: MC Free format text: LAPSE BECAUSE OF FAILURE TO SUBMIT A TRANSLATION OF THE DESCRIPTION OR TO PAY THE FEE WITHIN THE PRESCRIBED TIME-LIMIT Effective date: 20220223 Ref country code: AL Free format text: LAPSE BECAUSE OF FAILURE TO SUBMIT A TRANSLATION OF THE DESCRIPTION OR TO PAY THE FEE WITHIN THE PRESCRIBED TIME-LIMIT Effective date: 20220223 |
|
| PLBE | No opposition filed within time limit |
Free format text: ORIGINAL CODE: 0009261 |
|
| STAA | Information on the status of an ep patent application or granted ep patent |
Free format text: STATUS: NO OPPOSITION FILED WITHIN TIME LIMIT |
|
| PG25 | Lapsed in a contracting state [announced via postgrant information from national office to epo] |
Ref country code: LI Free format text: LAPSE BECAUSE OF NON-PAYMENT OF DUE FEES Effective date: 20220228 Ref country code: IE Free format text: LAPSE BECAUSE OF NON-PAYMENT OF DUE FEES Effective date: 20220228 Ref country code: CH Free format text: LAPSE BECAUSE OF NON-PAYMENT OF DUE FEES Effective date: 20220228 |
|
| 26N | No opposition filed |
Effective date: 20221124 |
|
| PG25 | Lapsed in a contracting state [announced via postgrant information from national office to epo] |
Ref country code: SI Free format text: LAPSE BECAUSE OF FAILURE TO SUBMIT A TRANSLATION OF THE DESCRIPTION OR TO PAY THE FEE WITHIN THE PRESCRIBED TIME-LIMIT Effective date: 20220223 Ref country code: BE Free format text: LAPSE BECAUSE OF NON-PAYMENT OF DUE FEES Effective date: 20220228 |
|
| PGFP | Annual fee paid to national office [announced via postgrant information from national office to epo] |
Ref country code: FR Payment date: 20230110 Year of fee payment: 8 |
|
| PGFP | Annual fee paid to national office [announced via postgrant information from national office to epo] |
Ref country code: GB Payment date: 20230105 Year of fee payment: 8 Ref country code: DE Payment date: 20221230 Year of fee payment: 8 |
|
| PG25 | Lapsed in a contracting state [announced via postgrant information from national office to epo] |
Ref country code: IT Free format text: LAPSE BECAUSE OF FAILURE TO SUBMIT A TRANSLATION OF THE DESCRIPTION OR TO PAY THE FEE WITHIN THE PRESCRIBED TIME-LIMIT Effective date: 20220223 |
|
| PG25 | Lapsed in a contracting state [announced via postgrant information from national office to epo] |
Ref country code: HU Free format text: LAPSE BECAUSE OF FAILURE TO SUBMIT A TRANSLATION OF THE DESCRIPTION OR TO PAY THE FEE WITHIN THE PRESCRIBED TIME-LIMIT; INVALID AB INITIO Effective date: 20160229 |