EP3203218B1 - Image analysis device, image analysis method, and program - Google Patents
Image analysis device, image analysis method, and program Download PDFInfo
- Publication number
- EP3203218B1 EP3203218B1 EP15846683.9A EP15846683A EP3203218B1 EP 3203218 B1 EP3203218 B1 EP 3203218B1 EP 15846683 A EP15846683 A EP 15846683A EP 3203218 B1 EP3203218 B1 EP 3203218B1
- Authority
- EP
- European Patent Office
- Prior art keywords
- yarns
- image
- fiber bundles
- overlapping area
- processing
- Prior art date
- Legal status (The legal status is an assumption and is not a legal conclusion. Google has not performed a legal analysis and makes no representation as to the accuracy of the status listed.)
- Active
Links
- 238000010191 image analysis Methods 0.000 title claims description 79
- 238000003703 image analysis method Methods 0.000 title claims description 10
- 239000000835 fiber Substances 0.000 claims description 202
- 238000012545 processing Methods 0.000 claims description 162
- 238000000034 method Methods 0.000 claims description 66
- 239000002759 woven fabric Substances 0.000 claims description 26
- 238000000605 extraction Methods 0.000 claims description 22
- 230000010339 dilation Effects 0.000 claims description 12
- 239000000284 extract Substances 0.000 claims description 9
- 230000003628 erosive effect Effects 0.000 claims description 6
- 238000012935 Averaging Methods 0.000 claims description 4
- 238000002591 computed tomography Methods 0.000 claims 3
- 238000004458 analytical method Methods 0.000 description 54
- 238000010586 diagram Methods 0.000 description 38
- 230000000877 morphologic effect Effects 0.000 description 37
- 238000009941 weaving Methods 0.000 description 23
- 239000011153 ceramic matrix composite Substances 0.000 description 21
- 230000002159 abnormal effect Effects 0.000 description 17
- 238000004364 calculation method Methods 0.000 description 10
- 238000004519 manufacturing process Methods 0.000 description 7
- 238000003860 storage Methods 0.000 description 7
- 230000014509 gene expression Effects 0.000 description 6
- 239000000919 ceramic Substances 0.000 description 5
- 230000007547 defect Effects 0.000 description 5
- 230000002950 deficient Effects 0.000 description 5
- 230000005484 gravity Effects 0.000 description 5
- 230000007935 neutral effect Effects 0.000 description 5
- 230000008569 process Effects 0.000 description 5
- 239000013598 vector Substances 0.000 description 5
- 238000002372 labelling Methods 0.000 description 4
- 239000000463 material Substances 0.000 description 4
- 238000001514 detection method Methods 0.000 description 3
- 230000000694 effects Effects 0.000 description 3
- 239000003733 fiber-reinforced composite Substances 0.000 description 3
- NRNCYVBFPDDJNE-UHFFFAOYSA-N pemoline Chemical compound O1C(N)=NC(=O)C1C1=CC=CC=C1 NRNCYVBFPDDJNE-UHFFFAOYSA-N 0.000 description 3
- 239000004753 textile Substances 0.000 description 3
- 238000004804 winding Methods 0.000 description 3
- 230000008859 change Effects 0.000 description 2
- 239000011248 coating agent Substances 0.000 description 2
- 238000000576 coating method Methods 0.000 description 2
- 239000002131 composite material Substances 0.000 description 2
- 238000000354 decomposition reaction Methods 0.000 description 2
- 239000000945 filler Substances 0.000 description 2
- 238000005470 impregnation Methods 0.000 description 2
- 230000008595 infiltration Effects 0.000 description 2
- 238000001764 infiltration Methods 0.000 description 2
- 229920000642 polymer Polymers 0.000 description 2
- 238000000197 pyrolysis Methods 0.000 description 2
- 239000011347 resin Substances 0.000 description 2
- 229920005989 resin Polymers 0.000 description 2
- 238000001228 spectrum Methods 0.000 description 2
- 239000000126 substance Substances 0.000 description 2
- 102100022907 Acrosin-binding protein Human genes 0.000 description 1
- 101000756551 Homo sapiens Acrosin-binding protein Proteins 0.000 description 1
- 102100022465 Methanethiol oxidase Human genes 0.000 description 1
- 101710134383 Methanethiol oxidase Proteins 0.000 description 1
- 238000005452 bending Methods 0.000 description 1
- 230000001419 dependent effect Effects 0.000 description 1
- 238000011161 development Methods 0.000 description 1
- 239000004744 fabric Substances 0.000 description 1
- 239000000446 fuel Substances 0.000 description 1
- 230000006870 function Effects 0.000 description 1
- 238000007429 general method Methods 0.000 description 1
- 238000003384 imaging method Methods 0.000 description 1
- 230000006872 improvement Effects 0.000 description 1
- 230000001788 irregular Effects 0.000 description 1
- 239000004973 liquid crystal related substance Substances 0.000 description 1
- 238000003754 machining Methods 0.000 description 1
- 239000011159 matrix material Substances 0.000 description 1
- 238000010603 microCT Methods 0.000 description 1
- 238000011160 research Methods 0.000 description 1
- 238000012360 testing method Methods 0.000 description 1
- 230000009466 transformation Effects 0.000 description 1
- 230000001960 triggered effect Effects 0.000 description 1
Images


Classifications
-
- G—PHYSICS
- G06—COMPUTING; CALCULATING OR COUNTING
- G06T—IMAGE DATA PROCESSING OR GENERATION, IN GENERAL
- G06T7/00—Image analysis
- G06T7/60—Analysis of geometric attributes
-
- D—TEXTILES; PAPER
- D06—TREATMENT OF TEXTILES OR THE LIKE; LAUNDERING; FLEXIBLE MATERIALS NOT OTHERWISE PROVIDED FOR
- D06H—MARKING, INSPECTING, SEAMING OR SEVERING TEXTILE MATERIALS
- D06H3/00—Inspecting textile materials
- D06H3/08—Inspecting textile materials by photo-electric or television means
-
- G—PHYSICS
- G01—MEASURING; TESTING
- G01N—INVESTIGATING OR ANALYSING MATERIALS BY DETERMINING THEIR CHEMICAL OR PHYSICAL PROPERTIES
- G01N21/00—Investigating or analysing materials by the use of optical means, i.e. using sub-millimetre waves, infrared, visible or ultraviolet light
- G01N21/84—Systems specially adapted for particular applications
- G01N21/88—Investigating the presence of flaws or contamination
- G01N21/8851—Scan or image signal processing specially adapted therefor, e.g. for scan signal adjustment, for detecting different kinds of defects, for compensating for structures, markings, edges
-
- G—PHYSICS
- G01—MEASURING; TESTING
- G01N—INVESTIGATING OR ANALYSING MATERIALS BY DETERMINING THEIR CHEMICAL OR PHYSICAL PROPERTIES
- G01N23/00—Investigating or analysing materials by the use of wave or particle radiation, e.g. X-rays or neutrons, not covered by groups G01N3/00 – G01N17/00, G01N21/00 or G01N22/00
- G01N23/02—Investigating or analysing materials by the use of wave or particle radiation, e.g. X-rays or neutrons, not covered by groups G01N3/00 – G01N17/00, G01N21/00 or G01N22/00 by transmitting the radiation through the material
- G01N23/04—Investigating or analysing materials by the use of wave or particle radiation, e.g. X-rays or neutrons, not covered by groups G01N3/00 – G01N17/00, G01N21/00 or G01N22/00 by transmitting the radiation through the material and forming images of the material
- G01N23/046—Investigating or analysing materials by the use of wave or particle radiation, e.g. X-rays or neutrons, not covered by groups G01N3/00 – G01N17/00, G01N21/00 or G01N22/00 by transmitting the radiation through the material and forming images of the material using tomography, e.g. computed tomography [CT]
-
- G—PHYSICS
- G06—COMPUTING; CALCULATING OR COUNTING
- G06T—IMAGE DATA PROCESSING OR GENERATION, IN GENERAL
- G06T7/00—Image analysis
-
- G—PHYSICS
- G06—COMPUTING; CALCULATING OR COUNTING
- G06T—IMAGE DATA PROCESSING OR GENERATION, IN GENERAL
- G06T7/00—Image analysis
- G06T7/70—Determining position or orientation of objects or cameras
- G06T7/73—Determining position or orientation of objects or cameras using feature-based methods
-
- G—PHYSICS
- G01—MEASURING; TESTING
- G01N—INVESTIGATING OR ANALYSING MATERIALS BY DETERMINING THEIR CHEMICAL OR PHYSICAL PROPERTIES
- G01N21/00—Investigating or analysing materials by the use of optical means, i.e. using sub-millimetre waves, infrared, visible or ultraviolet light
- G01N21/84—Systems specially adapted for particular applications
- G01N2021/8444—Fibrous material
-
- G—PHYSICS
- G01—MEASURING; TESTING
- G01N—INVESTIGATING OR ANALYSING MATERIALS BY DETERMINING THEIR CHEMICAL OR PHYSICAL PROPERTIES
- G01N21/00—Investigating or analysing materials by the use of optical means, i.e. using sub-millimetre waves, infrared, visible or ultraviolet light
- G01N21/84—Systems specially adapted for particular applications
- G01N21/88—Investigating the presence of flaws or contamination
- G01N21/8851—Scan or image signal processing specially adapted therefor, e.g. for scan signal adjustment, for detecting different kinds of defects, for compensating for structures, markings, edges
- G01N2021/8887—Scan or image signal processing specially adapted therefor, e.g. for scan signal adjustment, for detecting different kinds of defects, for compensating for structures, markings, edges based on image processing techniques
-
- G—PHYSICS
- G06—COMPUTING; CALCULATING OR COUNTING
- G06T—IMAGE DATA PROCESSING OR GENERATION, IN GENERAL
- G06T2207/00—Indexing scheme for image analysis or image enhancement
- G06T2207/30—Subject of image; Context of image processing
- G06T2207/30108—Industrial image inspection
- G06T2207/30124—Fabrics; Textile; Paper
Definitions
- the present invention relates to an image analysis apparatus, an image analysis method, and a program.
- the invention is suited for use in an image analysis apparatus, image analysis method, and program for analyzing orientations of fiber bundles included in a fiber-reinforced composite material.
- a generic image analysis apparatus having the features defined in the preamble of claim 1 is for instance known from HRISHIKESH BALE ET AL: "Characterizing Three-Dimensional Textile Ceramic Composites Using Synchrotron X-Ray Micro-Computed-Tomography", JOURNAL OF THE AMERICAN CERAMIC SOCIETY. , vol.95, no. 1, 31 January 2012, pages 392-402 .
- CMC Ceramic Matrix Composites
- the CMC is a composite material which is ceramic fibers reinforced with a base material (matrix) and is characterized by light weight and excellent heat resistance.
- the use of the CMC as, for example, aircraft engine components by utilizing these characteristics is being examined and its practical use is currently being promoted. A significant improvement in fuel efficiency can be expected by using the CMC as the aircraft engine components.
- a general forming process of the CMC is described as follows. Firstly, about several hundreds of ceramic fibers are tied together to make fiber bundles and these fiber bundles are woven to manufacture a woven fabric.
- Methods for weaving the fiber bundles include, for example, three-dimensional weaving or plain weaving.
- the three-dimensional weaving is a method for manufacturing the woven fabric by weaving the fiber bundles in three directions, that is, XYZ-directions and the plain weaving is a method for manufacturing the woven fabric by weaving the fiber bundles in two directions, that is, XY-directions.
- PTL 1 discloses an orientation analysis method for acquiring a binary image by binarizing a slice image of a resin molded product, acquiring a power spectrum image by performing Fourier transformation of this binary image, and determining a main axial direction of an ellipse perpendicular to an ellipse drawn by this power spectrum image to be an orientation direction of a filler (fibers) contained in the resin molded product.
- NPL 1 discloses a technique that acquires an X-ray CT image of a woven fabric, in which fiber bundles are woven, by capturing the image using an X-ray CT scanner and performs calculation by using a special filter function on this X-ray CT image, thereby analyzing the orientation of each one of fibers constituting the fiber bundles.
- NPL 1 T. Shinohara, J. Takayama, S. Ohyama, and A. Kobayashi, "Extraction of Yarn Positional Information from a Three-dimensional CT Image of Textile Fabric using Yarn Tracing with a Filament Model for Structure Analysis", Textile Research Journal, Vol. 80, No. 7, pp.623-630 (2010 )
- the technique of PTL 1 can obtain only one direction as the analysis result with respect to the orientation of the filler (fibers) contained in the slice image. Therefore, when the fiber bundles are arranged in a plurality of directions as in, for example, the three-dimensional weaving or the plain weaving, the orientations of the respective fiber bundles cannot be obtained as the analysis results. It is also impossible to analyze whether or not the fiber bundles are properly arranged and aligned in certain directions without winding, deviating, or breaking.
- the present invention is disclosed in consideration of the above-described circumstances and proposes an image analysis apparatus, image analysis method, and program capable of easily analyzing the orientations of fiber bundles from a three-dimensional image of the CMC.
- the present invention provides an image analysis apparatus having the features defined in claim 1. Moreover, it is provided an image analysis method having the features defined in claim 10. Additionally it is provided a program for analyzing orientation of fiber bundles, which program has the feature defined in claim 11. Further preferred embodiments of the image analysis apparatus are defined in the dependent claims 2 to 9.
- the orientations of fiber bundles can be easily analyzed from a three-dimensional image of the CMC.
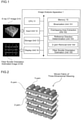
- Fig. 1 illustrates an overall configuration of an image analysis apparatus 1 according to this embodiment.
- the image analysis apparatus 1 is a computer configured by including a CPU (Central Processing Unit) 11, an input unit 12, a storage unit 13, a display unit 14, and a memory 15.
- CPU Central Processing Unit
- the CPU 11 is a processor for controlling the operation of the image analysis apparatus 1 in a supervisory manner in cooperation with various programs stored in the memory 15.
- the input unit 12 is an interface for accepting inputs from a user and is, for example, a keyboard and a mouse.
- the input unit 12 according to this embodiment is also an interface for inputting an X-ray CT image G10 of a woven fabric which constitutes a CMC (Ceramic Matrix Composite).
- the CMC herein used is a fiber-reinforced composite material formed by making fiber bundles by tying about several hundreds of ceramic fibers together, manufacturing a woven fabric by weaving these fiber bundles, then coating the surfaces of the fibers with carbons or the like, and then performing, for example, a CVI (Chemical Vapor Infiltration) process and a PIP (Polymer Impregnation and Pyrolysis) process to form matrixes.
- CVI Chemical Vapor Infiltration
- PIP Polymer Impregnation and Pyrolysis
- Weaving methods for manufacturing a woven fabric include those called three-dimensional weaving or plain weaving.
- the three-dimensional weaving is a method for manufacturing the woven fabric by weaving the fiber bundles in three directions, that is, XYZ-directions and the plain weaving is a method for manufacturing the woven fabric by weaving the fiber bundles in two directions, that is, XY-directions.
- Fig. 2 illustrates a conceptual diagram of a woven fabric of three-dimensional weaving.
- an image of the woven fabric manufactured by particularly complicated three-dimensional weaving or an image of a CMC formed from this woven fabric is captured by using an X-ray CT scanner and an attempt is made to automatically analyze orientations of fiber bundles from the obtained X-ray CT image G10.
- the woven fabric of three-dimensional weaving is formed as illustrated in Fig. 2 by alternately placing fiber layers, which are made of fiber bundles of X-yarns arranged at equal distances, and fiber layers, which are made of fiber bundles of Y-yarns arranged at equal distances, one on top of another and fixing the multiplicity of accumulated fiber layers with fiber bundles of Z-yarns so as to prevent the fiber layers from falling off during the CMC forming process.
- the CMC which is formed from this woven fabric is designed by assuming that it expands and contracts normally in the X-yarn direction or the Y-yarn direction. Therefore, the Z-yarns which are interlaced substantially perpendicularly with the X-yarns and the Y-yarns do not directly influence the strength of the CMC. On the other hand, the existence of the Z-yarns may cause poor accuracy when analyzing the orientations of the X-yarns and the Y-yarns.
- this embodiment is designed to remove the Z-yarns from the X-ray CT image G10 of the woven fabric of three-dimensional weaving and analyze the orientations of the fiber bundles of the X-yarns and the Y-yarns with good accuracy.
- the orientation(s) is a term that generally means arrangement aligned, or a state of being arranged, in a certain direction(s) and is used with the same meaning in this embodiment. Even if the fiber bundles are arranged in a state of winding, deviating, or breaking, the state of their arrangement will be called the "orientation(s)" as long as the fiber bundles are arranged in a state of being aligned in a certain direction(s).
- the storage unit 13 is a storage medium that stores the X-ray CT image G10 which is input from the input unit 12, and processed images obtained by executing various processing on this X-ray CT image G10.
- the display unit 14 is a display device such as an LCD (Liquid Crystal Display) that, for example, displays the X-ray CT image G10, images, and processed images. For example, the display unit 14 automatically analyzes the orientations of the fiber bundles from the X-ray CT image G10 and displays a fiber bundle orientation estimated image G100 on a display screen.
- LCD Liquid Crystal Display
- the memory 15 is a storage medium that stores various programs for executing image analysis processing in cooperation with the CPU 11.
- the various programs include a binarization unit 151, an overlapping area extraction unit 152, a reference direction determination unit 153, a Z-yarn removal unit 154, and a fiber bundle orientation estimation unit 155.
- the image analysis processing ( Fig. 3 ) executed by these various programs will be explained later.
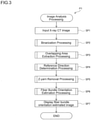
- FIG. 3 illustrates an entire flowchart of image analysis processing P1 according to this embodiment.
- This image analysis processing is executed in cooperation between the CPU 11 and the various programs stored in the memory 15 as triggered by the reception of an execution instruction from the user by the input unit 12.
- the following explanation will be given by referring to the various programs as processing subjects.
- the binarization unit 151 After the binarization unit 151 firstly inputs the X-ray CT image G10 via the input unit 12 (SP1), it binarizes the input X-ray CT image G10 on the basis of a specified threshold value and creates a binary image in which respective fiber bundles of the X-yarns, the Y-yarns, and the Z-yarns are indicated on the foreground (SP2).
- the overlapping area extraction unit 152 extracts an overlapping area in which the X-yarns and the Y-yarns perpendicularly and three-dimensionally intersect with each other (SP3); and the reference direction determination unit 153 determines an overlapping direction of the extracted overlapping area as a reference direction (SP4).
- the reason for extracting the overlapping area at this point is to estimate the overlapping direction by applying a normal directional distance method to the extracted overlapping area.
- the normal directional distance method will be explained later.
- the reason for determining the overlapping direction as the reference direction is to estimate the orientations of the fiber bundles by applying the two-dimensional normal directional distance method on a plane perpendicular to this reference direction.
- the plane perpendicular to the reference direction will be referred to as a "reference plane” and a method for applying the two-dimensional normal directional distance method on the reference plane will be referred to as a “referenced directional distance method.”
- the orientations of the fiber bundles of the X-yarns and the Y-yarns can be estimated with good accuracy by applying the referenced directional distance method.
- the referenced directional distance method will be explained later.
- the Z-yarn removal unit 154 estimates the orientations of the fiber bundles of the X-yarns, the Y-yarns, and the Z-yarns by applying the referenced directional distance method to the binary image. Then, the Z-yarn removal unit 154 removes the Z-yarns included in the binary image on the basis of the estimated orientations (SP5).
- the fiber bundle orientation estimation unit 155 estimates the orientations of the fiber bundles of the X-yarns and the Y-yarns by applying the referenced directional distance method again to the binary image from which the Z-yarns have been removed (SP6).
- the fiber bundle orientation estimation unit 155 creates the fiber bundle orientation estimated image G100, has the display unit 14 display the fiber bundle orientation estimated image G100 (SP7), and terminates this image analysis processing.
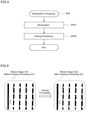
- Fig. 4 illustrates a detailed flowchart of binarization processing.
- the binarization unit 151 firstly creates a binary image by binarizing the X-ray CT image G10, which has been input via the input unit 12, on the basis of a specified threshold value (SP21). Black dot defects may sometimes occur in the created binary image due to uneven density of fibers in the fiber bundles. Specifically speaking, there are some voxels which should originally be the background and are made to become foreground voxels.
- the binarization unit 151 executes closing processing of morphology processing (SP22).
- SP22 morphology processing
- the black dot defects which have occurred in the binary image can be eliminated by executing the closing processing.
- the binarization unit 151 creates a binary image, from which the black dot defects have been eliminated and cleaned, and terminates this processing.
- Fig. 5 illustrates processed images created by the binarization processing. Specifically speaking, Fig. 5 illustrates a binary image G21 before the closing processing and a binary image G22 after the closing processing.
- the binary image G21 includes some voxels which should originally be the background and are made to become foreground voxels as illustrated in Fig. 5 .
- the binary image G22 after the closing processing, from which the black dot defects have been eliminated, can be obtained by executing the closing processing.
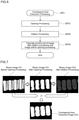
- Fig. 6 illustrates a detailed flowchart of the overlapping area extraction processing.
- the overlapping area extraction unit 152 executes opening processing of the morphology processing in order to extract the overlapping area in which the X-yarns and the Y-yarns three-dimensionally intersect with each other (SP31).
- a rough overlapping area can be extracted by executing the opening processing.
- the shape of the binary image after the opening processing has changed and there are some positions where the foreground voxels which should originally be located in the overlapping area are made to become the background voxels in areas that are not the overlapping area.
- the overlapping area extraction unit 152 executes the dilation processing of the morphology processing (SP32).
- the overlapping area extraction unit 152 extracts an accurate overlapping area by calculating a product set of the binary image after the dilation processing and the binary image before the opening processing (SP33).
- the overlapping area extraction unit 152 creates an overlapping area extracted image with the extracted overlapping area and terminates this processing.
- Fig. 7 illustrates processed images formed by the overlapping area extraction processing. Specifically speaking, Fig. 7 illustrates a binary image G3 before the opening processing, a binary image G31 after the opening processing, a binary image G32 after the dilation processing, and an overlapping area extracted image G33.
- the overlapping area extracted image G33 with the extracted accurate overlapping area can be obtained by calculating a product set of the binary image before the opening processing G3 and the binary image after the dilation processing G32 as illustrated in Fig. 7 .
- Fig. 8 illustrates a detailed flowchart of reference direction determination processing.
- the reference direction determination unit 153 applies the normal directional distance method to the overlapping area extracted image G33 ( Fig. 7 ) and estimates the overlapping direction with respect to each voxel in the overlapping area (SP41).
- Fig. 9 illustrates the outlines of processing for estimating a directional distance of a voxel of interest by applying the normal directional distance method.
- the directional distance to the background is calculated with respect to the voxel of interest.
- Directions to voxels close to the voxel of interest are eight directions in a case to the two dimensions or 26 directions in a case of the three dimensions.
- a directional distance d( ⁇ vs i ) in ⁇ vs i directions is expressed by Expression 1 below.
- a directional vector P i and a directional tensor M are defined by Expressions 2 and 3 below, respectively.
- an eigenvector for the maximum eigenvalue indicates the orientation of a fiber bundle.
- an eigenvector for the second largest eigenvalue indicates a widthwise direction of the fiber bundle.
- an eigenvector for the minimum eigenvalue indicates a thickness direction.
- the overlapping direction estimated in step SP41 is not calculated accurately with respect to voxels in a border region between the overlapping area and the background due to the properties of the directional distance method.
- the reference direction determination unit 153 executes erosion processing of the morphology processing and extracts a central area from the overlapping area (SP42).
- the reference direction determination unit 153 executes 6-neighbour labeling processing on each extracted central area to divide the area and separates the overlapping areas (SP43).
- the reference direction determination unit 153 averages the overlapping directions of the respective voxels in the central area from among the overlapping directions estimated in step SP41, determines the direction obtained by averaging as a reference direction (SP44), and terminates this processing.
- Fig. 10 illustrates processed images created by reference direction determination processing. Specifically speaking, Fig. 10 illustrates an overlapping direction estimated image G41, a central area extracted image G42, a labeling image G43, and a reference direction image G44.
- the overlapping direction estimated image G41 can be obtained by applying the normal directional distance method to the overlapping area extracted image G33 ( Fig. 7 ) as illustrated in Fig. 10 .
- the central area extracted image G42 can be obtained by executing the erosion processing on the overlapping direction estimated image G41.
- the labeling image G43 can be obtained by executing the labeling processing on the central area extracted image G42. Furthermore, the reference direction image G44 can be obtained by averaging the overlapping direction in the central area.
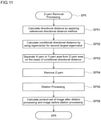
- Fig. 11 illustrates a detailed flowchart of Z-yarn removal processing.
- the Z-yarn removal unit 154 calculates the directional distance by applying a referenced directional distance method on the binary image G22 ( Fig. 5 ) obtained in step SP2 (SP51).
- the referenced directional distance method is a method for rotating the plane, on which the directional distance is to be calculated, to a plane perpendicular to the reference direction (a reference plane) and calculating the directional distance on this reference plane by the two-dimensional normal directional distance method.
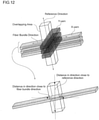
- Fig. 12 illustrates a conceptual diagram of a case where the directional distance is calculated by applying the normal directional distance method.
- the distance in a direction close to the orientation of a fiber bundle shortly reaches the background and becomes short because the thickness of the fiber bundles of the X-yarn and the Y-yarn is thin.
- the distance in a direction close to the reference direction hardly reaches the background and becomes long because a cross section of the overlapping area is thick.
- the distance in the direction close to the reference direction becomes longer than the distance in the direction close to the orientation of the fiber bundle.
- the problem is that the directional distance in the direction close to the reference direction is calculated as the directional distance in the overlapping area. So, in this embodiment, the directional distance is calculated by applying the referenced directional distance method.
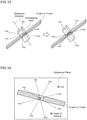
- Fig. 13 illustrates a conceptual diagram of the referenced directional distance method.
- the referenced directional distance method is a method for rotating the plane which is a target of calculation of the directional distance, and calculating the directional distance by applying the two-dimensional directional distance method on the plane which has been rotated.
- a direction ⁇ vs 0 is rotated so as to match the reference direction and other directions ⁇ vs 1 and ⁇ vs 2 perpendicular to ⁇ vs 0 are also rotated by the angle of rotation of ⁇ vs 0 .
- directions obtained after the rotations are expressed as ⁇ vs 0 ', ⁇ vs 1 ', and ⁇ vs 2 ' respectively, the X-yarns or the Y-yarns exist on a plane defined by ⁇ vs 1 ' and ⁇ vs 2 ' (reference plane).
- the orientations of the fiber bundles can be estimated without being influenced by the overlapping area by calculating the directional distance by applying the two-dimensional directional distance method on this reference plane.
- Fig. 14 illustrates a conceptual diagram in a case where the directional distance of the X-yarns or the Y-yarns on the reference plane is calculated by applying the referenced directional distance method.
- the directional distance is calculated by applying the referenced directional distance method.
- the direction ⁇ vs 0 is rotated so as to match the reference direction and other directions ⁇ vs 1 , ⁇ vs 2 , ⁇ vs 3 , and ⁇ vs 4 perpendicular to ⁇ vs 0 are also rotated by a similar angle as described above.
- the directional distance is calculated by applying the two-dimensional directional distance method on the reference plane defined by ⁇ vs 1 ', ⁇ vs 2 ', ⁇ vs 3 ', and ⁇ vs 4 '.
- the Z-yarn removal unit 154 calculates a conditional directional distance by using the eigenvector for the second largest eigenvalue obtained by the calculation of the referenced directional distance method (SP52). Then, the Z-yarn removal unit 154 separates the X-yarn or Y-yarn area from the Z-yarn area on the basis of the conditional directional distance (SP53).
- the conditional directional distance is a directional distance calculated under a condition that the processing stops proceeding when the processing proceeds from a voxel of interest on the image and reaches the background or when an angle formed by a direction indicated by an eigenvector of a voxel at a position, to which the processing will proceed next, and an advancing direction is larger than a specified threshold value.
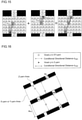
- Fig. 15 illustrates the outlines of processing for estimating the conditional directional distance.
- the processing starts at a voxel of interest at position x as a point of origin, proceeds on the image in a direction indicated by an eigenvector v 2 (x) for the voxel of interest, and stops proceeding when it reaches the background.
- the distance from the last reached voxel to the voxel of interest is expressed as x e1 .
- the processing also proceeds on the image in a direction of an opposite direction vector -v 2 (x) and stops proceeding when an angle formed by the direction indicated by an eigenvector v 2 (x') for a voxel located at position x', to which the processing will proceed next, and the direction indicated by -v 2 (x) is larger than a specified threshold value.
- the distance from the last reached voxel to the voxel of interest is expressed as x e2 .
- a total of absolute values of the distances x e1 and x e2 is the conditional directional distance d c (x).
- Fig. 16 illustrates a conceptual diagram in which the X-yarn or Y-yarn areas are separated from the Z-yarn areas on the basis of the conditional directional distance. Since the width Wxy of the X-yarn or the Y-yarn is larger than the diagonal distance Wz of the cross section of the Z-yarn, the conditional directional distance d c (p) of voxel p in the X-yarn or Y-yarn area is larger than the conditional directional distance d c (q) of voxel q in the Z-yarn area.
- a value larger than the diagonal distance Wz of the cross section of the Z-yarn and smaller than the width Wxy of the X-yarn or the Y-yarn can be set as the threshold value
- voxels with the conditional directional distance larger than this threshold value can be included in the X-yarn or Y-yarn area
- voxels with the conditional directional distance smaller than the threshold value can be included in the Z-yarn area.
- the Z-yarn removal unit 154 removes Z-yarns from the binary image G22 ( Fig. 5 ) by deleting voxels included in the Z-yarn area (SP54). If the Z-yarns are removed, part of the X-yarn or Y-yarn area may sometimes be removed.
- the Z-yarn removal unit 154 executes dilation processing of the morphology processing on the image from which the Z-yarns have been removed (SP55); extracts the X-yarns and the Y-yarns by calculating a product set of the image after the dilation processing and the image before the dilation processing (SP56); and terminates this processing.
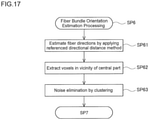
- Fig. 17 illustrates a detailed flowchart of fiber bundle orientation estimation processing.
- the fiber bundle orientation estimation unit 155 estimates the fiber directions of the X-yarns and the Y-yarns by applying the referenced directional distance method again on the image in which the X-yarns and the Y-yarns are extracted (SP61).
- the fiber bundle orientation estimation unit 155 deletes other voxels by leaving voxels in the vicinity of a central part with relatively better accuracy, from among the voxels with the estimated fiber directions, thereby extracting the voxels in the vicinity of the central part (SP62).
- the fiber bundle orientation estimation unit 155 executes clustering processing in order to connect voxels of similar directions with respect to the voxels in the vicinity of the central part, make the connected group of voxels belong to the same cluster, and make voxels whose vectors suddenly change in the middle of the fiber bundles belong to a different cluster.
- the orientation of a fiber bundle does not abruptly change in a short distance of several voxels. Therefore, it is possible to determine that a voxel whose vector abruptly changes in the middle of a fiber bundle is noise. So, the fiber bundle orientation estimation unit 155 eliminates the noise by deleting a cluster to which a small number of voxels belong (SP63), and terminates this processing.
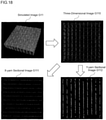
- Fig. 18 illustrates processed images obtained by executing the image analysis processing when the input image is a simulated image G11.
- the simulated image G11 is a three-dimensional image created by setting, for example, the length, width, and thickness of fiber bundles of the X-yarns and the Y-yarns, the number of accumulated X-yarn fiber layers and Y-yarn fiber layers, spaces between the fiber bundles, and a cross-sectional shape of the Z-yarn. In other words, it is an image regarding which various kinds of information are already known.
- the three-dimensional image G110 is a three-dimensional image indicating orientations of fiber bundles of the X-yarns and the Y-yarns.
- the X-yarn sectional image G111 is a two-dimensional image indicating the orientation of the fiber bundles of the X-yarns; and the Y-yarn sectional image G112 is a two-dimensional image indicating the orientation of the fiber bundles of the Y-yarns.
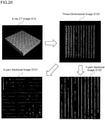
- Fig. 19 illustrates processed images obtained by executing the image analysis processing when the input image is an X-ray CT image G10.
- the X-ray CT image G10 is a three-dimensional image obtained by capturing an image of an actual woven fabric by using the X-ray CT scanner. Furthermore, the X-ray CT image G10 is of high definition quality as compared to an X-ray CT image G12 illustrated in Fig. 20 .
- a three-dimensional image G100 (fiber bundle orientation estimated image G100), an X-yarn sectional image G101, and a Y-yarn sectional image G102 can be obtained.
- the three-dimensional image G100 is a three-dimensional image indicating orientations of fiber bundles of the X-yarns and the Y-yarns.
- the X-yarn sectional image G101 is a two-dimensional image indicating the orientation of the fiber bundles of the X-yarns
- the Y-yarn sectional image G102 is a two-dimensional image indicating the orientation of the fiber bundles of the Y-yarns.
- the orientations of the fiber bundles of the X-yarns and the Y-yarns can be easily identified by referring to these processed image G100 to G102.
- calculation time was approximately 243.8 seconds. Conventionally, it takes about 20 times as long as the above-mentioned calculation time in order to analyze an image of approximately the same number of voxels. Therefore, the calculation time can be reduced by executing the image analysis processing according to this embodiment.
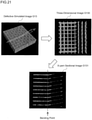
- Fig. 20 illustrates processed images obtained by executing the image analysis processing when the input image is the X-ray CT image G12.
- the difference between the X-ray CT image G12 and the X-ray CT image G10 illustrated in Fig. 19 is that the X-ray CT image G12 is of low definition quality as compared to the X-ray CT image G10.
- a three-dimensional image G120, an X-yarn sectional image G121, and a Y-yarn sectional image G122 can be obtained.
- the orientations of most of the fiber bundles can be easily identified with reference to these processed images G120 to G122 although some parts of the fiber bundles are missing.
- Fig. 21 illustrates processed images obtained by executing the image analysis processing when the input image is a defective simulated image G13.
- the difference between the defective simulated image G13 and the simulated image G11 illustrated in Fig. 18 is that the defective simulated image G13 has a defect in fiber bundles of the X-yarns being bent by 10 degrees in the middle as compared to the simulated image G11.
- a three-dimensional image G130 and an X-yarn sectional image G131 can be obtained. It is possible to easily identify, with reference to these processed images G130 and G131, that fiber bundles of the X-yarns are bent at a bending point although there is some error.
- Fig. 22 illustrates processed images obtained by executing the image analysis processing when the input image is a curved surface simulated image G14.
- the difference between the curved surface simulated image G14 and the simulated image G11 illustrated in Fig. 18 is that the curved surface simulated image G14 has a curved surface portion deformed in an arc-like shape as compared to the simulated image G11.
- a three-dimensional image G140 and an X-yarn sectional image G141 can be obtained. It is possible to easily identify, with reference to these processed image G140 and G141, that the fiber bundles are oriented in an arc.
- the image analysis apparatus, the image analysis method, and the program according to this embodiment is designed as described above to remove the Z-yarns by applying the referenced directional distance method to the X-ray CT image of the woven fabric manufactured by the three-dimensional weaving and estimate the orientations of the fiber bundles of the X-yarns and the Y-yarns by applying the referenced directional distance method again to the image from which the Z-yarns have been removed, so that the orientations of the fiber bundles can be estimated with good accuracy and in a short amount of time by eliminating the influence of the Z-yarns. Furthermore, the orientations of the fiber bundles can be estimated also with respect to the X-ray CT image of the woven fabric having a curved surface shape. Therefore, the image analysis apparatus, the image analysis method, and the program according to this embodiment can be used for actual product examinations.
- Image analysis apparatus 2 includes, as illustrated in Fig. 23 , the CPU 11, the input unit 12, the storage unit 13, the display unit 14, and the memory 15 which are the same as those of the image analysis apparatus 1 in Fig. 1 ; and the memory 15 has the binarization unit 151 and the overlapping area extraction unit 152. Since these components are the same as those having the same names and reference numerals in Fig. 1 and are designed to execute the same processing, any redundant explanation is omitted. Under this circumstance, the image analysis apparatus 2 according to this example includes an overlapping area morphological analysis unit 253 in the memory 15. The overlapping area morphological analysis unit 253 analyzes the form of the "overlapping area"
- the form of the overlapping area includes not only the form of one overlapping area, but also the form of a combination of a plurality of overlapping areas which are dotted in the image.
- the image analysis apparatus 2 has the display unit 14 as illustrated
- Fig. 24 illustrates a flowchart of image analysis processing P2 executed by the image analysis apparatus 2.
- the image analysis processing P2 is designed as illustrated in this flowchart to firstly input an X-ray CT image (SP1) and execute binarization processing (SP2) and overlapping area extraction processing (SP3).
- SP1 X-ray CT image
- SP2 binarization processing
- SP3 overlapping area extraction processing
- the overlapping area morphological analysis unit 253 executes processing of morphological analysis of an overlapping area 21 by using the overlapping area extracted image G33 (see Fig. 7 ) obtained by the overlapping area extraction processing.
- pillars 21 individual overlapping areas 21 in the overlapping area extracted image G33 will be hereinafter referred to as "pillars 21".
- the overlapping area morphological analysis unit 253 may calculate the volume of each pillar 21 by, for example, counting the number of voxels included in a three-dimensional image of the pillar 21.
- Fig. 25 illustrates pixels in a pillar 21, which are indicated as black dots in the two-dimensional image; however, the number of voxels can be counted in the same manner with respect to a three-dimensional image.
- whether the volume of a certain pillar 21 is appropriate or not may be judged by, for example, using an average of the volume of a plurality of pillars 21 as a reference value and comparing it with the volume of the certain pillar 21.
- not only the average of the plurality of pillars 21, but also other values such as a reference value in designing may be used as the reference value of the volume.
- the volume of the pillar 21 is calculated; however, in a case of analysis by using a two-dimensional image, the area may be calculated. As a result of such processing for calculating the volume,
- the fiber bundles it is possible to provide useful information for detection of abnormal orientations of the fiber bundles, for example, information indicating that the volume of the certain pillar 21 is different from the volume of surrounding pillars 21. Furthermore, it is possible to detect the abnormal orientation of the fiber bundles, for example, to detect insufficiency in the number of the X-yarns or the Y-yarns which should three-dimensionally interest with each other, on the basis of the provided information.
- the overlapping area morphological analysis unit 253 may calculate a direction in which the pillar 21 extends.
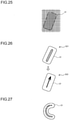
- the extending direction of the pillar 21 may be made visible, for example, as illustrated in Fig. 26 (a shaded area in S21) by using erosion processing of the morphology image processing, and may be vectorized (S22), or the extending direction can be found by using other image processing.
- the overlapping area morphological analysis unit 253 can judge whether the extending direction of a specified pillar 21 is appropriate or not, by using an average of extending directions of a plurality of pillars 21 as a reference value and comparing it with the extending direction of the specified pillar 21.
- a neutral axial shape of the pillar 21 may be found separately from the extending direction of the pillar 21.
- the neutral axis can be extracted by, for example, using the erosion processing of the morphology image processing as illustrated in the shaded area in Fig. 27 .
- the overlapping area morphological analysis unit 253 may calculate centroid positions of a plurality of pillars 21. Since a line connecting centroid positions of adjacent pillars 21 ideally constitutes extending directions of the X-yarns and the Y-yarns, whether the centroid positions are appropriate or not can be judged by finding irregular centroid positions by, for example, detecting that such centroid positions are not aligned along a smooth line on the XY-plane.
- Fig. 28 illustrates a state where the center of gravity G of a pillar 21 indicated with diagonal lines is not aligned smoothly as compared to the centers of gravity G of surrounding pillars 21.
- a pillar 21 which is irregularly arranged exists or not may be judged by determining a certain area and finding whether an appropriate number of centers of gravity G exist in the area or not by, for example, counting the number of the centers of gravity G in that area.
- the aforementioned example of the overlapping area morphological analysis processing has described the case including the processing for detecting the abnormal orientations of the fiber bundles; however, the processing of the overlapping area morphological analysis unit 253 may be designed to execute only the morphological analysis of the overlapping area such as calculation of the volume of the pillars 21, calculation of the extending directions of the pillars 21, or calculation of the centroid positions of the pillars 21, and may only provide processed information by, for example, outputting the information to the display unit 14 or transmitting calculated data to another apparatus. As a result of such processing, it is possible to provide useful information to detect abnormal orientations of the fiber bundles.
- Figs. 29 to 46 Specific examples of abnormal orientations of the fiber bundles detected by the morphological analysis of the pillars 21 will be explained by using Figs. 29 to 46 .
- a case in which the overlapping area morphological analysis processing executed by the overlapping area morphological analysis unit 253 includes detection of abnormal orientations of the fiber bundles will be also described; however, the processing of the overlapping area morphological analysis unit 253 may not include such judgment, but may only provide information about the orientations of the fiber bundles as obtained by the morphological analysis of the pillars 21.
- Fig. 30 , 33 , 36 , 38 , 40, 41 , 43 , 44 , and 46 are illustrated with reference to a report "DOT/FAA/AR-06/10" issued by FAA (Federal Aviation Administration).
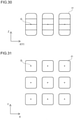
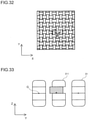
- Fig. 29 illustrates an example of an ideal arrangement of fiber bundles of the X-yarns and the Y-yarns on the XY-plane; and Figs. 30 and 31 respectively schematically illustrate overlapping area extracted images on the XZ-plane (or the YZ-plane) and the XY-plane with respect to the ideal fiber bundle arrangement as in Fig. 29 .
- a pillar 21 extends without any break in an accumulated direction (Z-direction) of the fiber bundles of the X-yarns and the Y-yarns in the ideal arrangement of the fiber bundles of the X-yarns and the Y-yarns; and referring to Fig. 31 , pillars 21 (or the centers of gravity G of the pillars 21) are arranged regularly.
- Fig. 32 (-Y-direction) illustrates a state on the XY-plane where a portion of a fiber bundle extends in another direction, on the XY-plane, that is different from the direction to which it should extends.
- Fig. 33 and 34 respectively schematically illustrate overlapping area extracted images on the YZ-plane and the XY-plane in the state of the fiber bundles in Fig. 32 .
- the centroid position G of a pillar 211 having a fiber bundle extending in the -Y-direction has moved to the -Y-direction due to the influence by that fiber bundle extending in the -Y-direction in the overlapping area extracted image in Fig. 33 .
- the centroid position G of the pillar 211 does not follow the regularity of the centroid positions of the vicinal pillars 21. Therefore, the overlapping area morphological analysis unit 253 can, for example, analyze the centroid positions G of the respective pillars 21 in the overlapping area extracted image and detects an area where a portion of the fiber bundles extends in another direction, on the XY-plane, different from the direction to which it should extend.
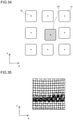
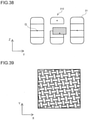
- Fig. 35 illustrates a state on the XY-plane where a portion of the fiber bundles extends in the Z-direction different from the direction to which it should extend.
- Fig. 36 schematically illustrates an overlapping area extracted image on the YZ-plane in the state of the fiber bundles in Fig. 35 .
- a pillar 212 in the overlapping area extracted image in Fig. 36 is divided into a plurality of portions due to the influence of the fiber bundle extending in the Z-direction (shaded area). Therefore, the overlapping area morphological analysis unit 253 can detect the area in which a portion of the fiber bundles extends in the Z-direction different from the direction to which it should extend, by using the overlapping area extracted image.
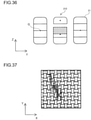
- Fig. 37 illustrates a state on the XY-plane where a portion of the fiber bundles extends in a direction that is different from the direction, to which it should extends, and has both a directional component on the XY-plane and a Z-directional component.
- Fig. 38 schematically illustrates an overlapping area extracted image on the YZ-plane in the state of the fiber bundles in Fig. 37 .
- a pillar 213 in the overlapping area extracted image in Fig. 38 is divided into a plurality of portions due to the influence of the fiber bundle extending in the - Z-direction and the -Y-direction (shaded area).
- the centroid position G of one of the divided pillars 213 has moved to the +Y-direction. Therefore, the overlapping area morphological analysis unit 253 can detect the area in which a portion of the fiber bundles extends in the direction that is different from the direction, to which it should extend, and has both the directional component on the XY-plane and the Z-directional component, by using the overlapping area extracted image.
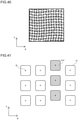
- Figs. 39 and 40 respectively illustrate a state on the XY-plane where the fiber bundles generally extend in inclined directions.
- Fig. 41 schematically illustrates an overlapping area extracted image on the XY-plane in the state of the fiber bundles illustrated in Fig. 39 or 40 .
- pillars 214 which constitute a row that is part of regularly arranged pillars 21 are misaligned in the overlapping area extracted image in Fig. 41 . Therefore, the overlapping area morphological analysis unit 253 can detect the area in which the fiber bundles generally extend in the inclined directions, by detecting, for example, that the centroid positions G of the pillars 214 do not follow specified regularity, by using the overlapping area extracted image.
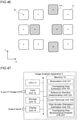
- Fig. 42 illustrates a state on the XY-plane where a portion of the fiber bundles (for example, an X-yarn) is missing.
- Fig. 43 illustrates a case where the thickness of a portion of the fiber bundles is thicker or narrower than that of other fiber bundles on the XY-plane.
- Fig. 44 schematically illustrates an overlapping area extracted image of the YZ-plane in the state of the fiber bundles in Fig. 42 or Fig. 43 .
- some pillar 215 is divided into a plurality of portions and the total volume of a plurality of divided pillars 215 becomes smaller than the volume of a normal pillar 21.
- the overlapping area morphological analysis unit 253 can detect the case where a portion of the fiber bundle is missing, and the area where the thickness of a portion of the fiber bundles is thicker or narrower than that of other fiber bundles, by using the overlapping area extracted image.
- Fig. 45 illustrates a state on the XY-plane where a portion of a fiber bundle (for example, an X-yarn) is folded back.
- Fig. 46 schematically illustrates an overlapping area extracted image of the XY-plane in the state of the fiber bundles in Fig. 45 .
- pillars 216 surrounding the loop are pushed aside by the loop of the portion of the fiber bundle and the centroid positions G of the pillars 216 are disordered as compared to the centroid positions G of the surrounding regularly-arranged pillars 21. Therefore, the overlapping area morphological analysis unit 253 can detect the area in which a portion of the fiber bundle is looped, by analyzing the disordered arrangement of the centroid positions G by using the overlapping area extracted image.
- the image analysis apparatus 2 of this example is designed as described above so that: the binarization unit 151 binarizes the three-dimensional image of the woven fabric made of the fiber bundles of the X-yarns, the Y-yarns, and the Z-yarns; the overlapping area extraction unit 152 extracts the overlapping area, in which the X-yarns and the Y-yarns three-dimensionally intersect with each other, from the binarized image; and the overlapping area morphological analysis unit 253 analyzes the form of the extracted overlapping area.
- the analysis is performed by only a combination of image processing in a short amount of processing time, so that it is possible to provide information about the orientations of the fiber bundles of the X-yarns and the Y-yarns more easily and in a shorter amount of time.
- the overlapping area morphological analysis unit 253 further detects abnormal orientations of the fiber bundles, it is possible to find the abnormal orientations of the fiber bundles more easily and in a shorter amount of time. Furthermore, even when detailed analysis of the abnormal orientations of the fiber bundles is required, it is only necessary to separately perform the detailed analysis only with respect to the area including the detected abnormal orientations. So, analysis time can be shortened as a whole.
- the morphological analysis of the overlapping area can be employed regardless of whether the general shape of the entire fiber bundles is a flat surface or a curved surface. Since the overlapping area can be extracted no matter what general shape the fiber bundles is, the overlapping area morphological analysis processing can be applied. Furthermore, since the pillars 21 are arranged regularly over the general shape of the fiber bundles, for example, problems of the orientations of the fiber bundles can be also detected by analyzing the form of the overlapping area regardless of whether the general shape of the fiber bundles is a flat surface or a curved surface.
- the overlapping area morphological analysis unit 253 may calculate the volume of the overlapping area.
- the volume of the overlapping area can be compared with a "reference volume value" of the overlapping area; and furthermore, this "reference volume value" can be an average value of the volume of a plurality of overlapping areas.
- the overlapping area morphological analysis unit 253 may calculate the direction in which the overlapping area extends.
- the direction in which the overlapping area extends can be compared with a "reference direction value" of the overlapping area; and this "reference direction value" can be an average value of the directions of the plurality of overlapping areas.
- the overlapping area morphological analysis unit 253 may calculate centroid positions of the plurality of overlapping areas.
- the overlapping area morphological analysis unit 253 can detect an area where the centroid positions are arranged irregularly.
- the area where the centroid positions are arranged irregularly may be detected by, for example, finding a reference line where the centroid positions are aligned and calculating how much the relevant centroid position(s) is displaced from the reference line, or by calculating the number of centroid positions included in a certain area.
- the overlapping area morphological analysis unit 253 may calculate the neutral axis of the overlapping area and compare it with a reference shape. In this case, the erosion processing of the morphology can be used to calculate the neutral axis.
- this example image analysis method is characterized in that it includes: a step of binarizing a three-dimensional image of the woven fabric made of the fiber bundles of the X-yarns, the Y-yarns, and the Z-yarns; a step of extracting an overlapping area, in which the X-yarns and the Y-yarns three-dimensionally intersect with each other, from the binarized image; and a step of analyzing the form of the extracted overlapping area.
- the program according to this example is a program for causing a computer to execute: a step of binarizing a three-dimensional image of the woven fabric made of the fiber bundles of the X-yarns, the Y-yarns, and the Z-yarns; a step of extracting an overlapping area, in which the X-yarns and the Y-yarns three-dimensionally intersect with each other, from the binarized image; and a step of analyzing the form of the extracted overlapping area.
- FIG. 47 illustrates the configuration of an image analysis apparatus 3 which is an arrangement for executing these processing steps by combining them.
- the image analysis apparatus 3 includes the CPU 11, the input unit 12, the storage unit 13, the display unit 14, and the memory 15 in the same manner as the aforementioned image analysis apparatus 1 or 2; and the memory 15 has the binarization unit 151, the overlapping area extraction unit 152, the reference direction determination unit 153, the Z-yarn removal unit 154, the fiber bundle orientation estimation unit 155, and the overlapping area morphological analysis unit 253. Each component executes the same processing as that of the aforementioned corresponding component.
- Fig. 48 illustrates a flowchart of image analysis processing P3 by this image analysis apparatus 3.
- the image analysis processing P3 firstly inputs an X-ray CT image (SP1) and executes binarization processing (SP2), overlapping area extraction processing (SP3), and overlapping area morphological analysis processing (SP14).
- SP1 X-ray CT image
- SP3 overlapping area extraction processing
- SP14 overlapping area morphological analysis processing
- SP4 reference direction determination processing
- SP5 Z-yarn removal processing
- SP6 fiber bundle orientation estimation processing
- the problem in the orientation of the fiber bundles can be analyzed more efficiently and in detail by applying the image analysis processing P2, whose processing time is short, to, for example, the X-ray CT image which is the examination target, and applying the image analysis processing P1, whose processing time is relatively long and which performs detailed analysis, on the area including the abnormal orientation of the fiber bundles which is detected by the image analysis processing P2.
Description
- The present invention relates to an image analysis apparatus, an image analysis method, and a program. Particularly, the invention is suited for use in an image analysis apparatus, image analysis method, and program for analyzing orientations of fiber bundles included in a fiber-reinforced composite material.
- A generic image analysis apparatus having the features defined in the preamble of
claim 1 is for instance known from HRISHIKESH BALE ET AL: "Characterizing Three-Dimensional Textile Ceramic Composites Using Synchrotron X-Ray Micro-Computed-Tomography", JOURNAL OF THE AMERICAN CERAMIC SOCIETY. , vol.95, no. 1, 31 January 2012, pages 392-402. - In recent years, the development of Ceramic Matrix Composites (CMC), a type of fiber-reinforced composite materials, has been being promoted. The CMC is a composite material which is ceramic fibers reinforced with a base material (matrix) and is characterized by light weight and excellent heat resistance. The use of the CMC as, for example, aircraft engine components by utilizing these characteristics is being examined and its practical use is currently being promoted. A significant improvement in fuel efficiency can be expected by using the CMC as the aircraft engine components.
- A general forming process of the CMC is described as follows. Firstly, about several hundreds of ceramic fibers are tied together to make fiber bundles and these fiber bundles are woven to manufacture a woven fabric. Methods for weaving the fiber bundles include, for example, three-dimensional weaving or plain weaving. The three-dimensional weaving is a method for manufacturing the woven fabric by weaving the fiber bundles in three directions, that is, XYZ-directions and the plain weaving is a method for manufacturing the woven fabric by weaving the fiber bundles in two directions, that is, XY-directions.
- After the woven fabric is manufactured, matrixes are formed by means of CVI (Chemical Vapor Infiltration) and PIP (Polymer Impregnation and Pyrolysis); and lastly, machining, surface coating, and so on are performed, thereby forming the CMC. Under this circumstance, orientations of the fiber bundles of the then-formed CMC significantly influence the strength of the CMC.
- Specifically speaking, when the fiber bundles wind at places where they should be straight, or when the fiber bundles generally deviate from their reference axis where they should originally be located, or when the fiber bundles break in the middle of the CMC forming process, the strength of the CMC degrades. On the other hand, when the fiber bundles are properly arranged in certain directions without winding, deviating, or breaking, high strength and excellent heat resistance are achieved. Therefore, it is important to evaluates orientations of the fiber bundles in order to check if the strength of the formed CMC is sufficient or not.
-
PTL 1 discloses an orientation analysis method for acquiring a binary image by binarizing a slice image of a resin molded product, acquiring a power spectrum image by performing Fourier transformation of this binary image, and determining a main axial direction of an ellipse perpendicular to an ellipse drawn by this power spectrum image to be an orientation direction of a filler (fibers) contained in the resin molded product. - Furthermore, NPL 1 discloses a technique that acquires an X-ray CT image of a woven fabric, in which fiber bundles are woven, by capturing the image using an X-ray CT scanner and performs calculation by using a special filter function on this X-ray CT image, thereby analyzing the orientation of each one of fibers constituting the fiber bundles.
- Further in the following document OLIVER WIRJADI ET AL: "APPLICATIONS OF ANISOTROPIC IMAGE FILTERS FOR COMPUTING 2D AND 3D-FIBER ORIENTATIONS", PROCEEDINGS OF THE 10™ EUROPEAN CONFERENCE IN IMAGE ANALYSIS AND STEREOLOGY (ECS10), 29 June 2009, pages 1-6, there is described an application of anisotropic image filters for computing 2D and 3D fiber orientations.
- PTL 1:
Japanese Patent Application Laid-Open (Kokai) Publication No. 2012-2547 - NPL 1: T. Shinohara, J. Takayama, S. Ohyama, and A. Kobayashi, "Extraction of Yarn Positional Information from a Three-dimensional CT Image of Textile Fabric using Yarn Tracing with a Filament Model for Structure Analysis", Textile Research Journal, Vol. 80, No. 7, pp.623-630 (2010)
- However, the technique of
PTL 1 can obtain only one direction as the analysis result with respect to the orientation of the filler (fibers) contained in the slice image. Therefore, when the fiber bundles are arranged in a plurality of directions as in, for example, the three-dimensional weaving or the plain weaving, the orientations of the respective fiber bundles cannot be obtained as the analysis results. It is also impossible to analyze whether or not the fiber bundles are properly arranged and aligned in certain directions without winding, deviating, or breaking. - Moreover, regarding the technique described in
NPL 1, it is necessary to obtain a high-definition X-ray CT image in which each one of the fibers constituting the fiber bundles can be identified. In this case, imaging time to obtain the X-ray CT image becomes long, so that this technique cannot be used for product testing and, therefore, is not practical. Furthermore, this technique is effective for fibers which have a circular cross section; however, this technique cannot be used directly as a technique to analyze orientations of fiber bundles which have a fattened cross section. Furthermore, it is necessary to input a starting point of each fiber in the X-ray CT image, which results in a problem of troublesome operations. - The present invention is disclosed in consideration of the above-described circumstances and proposes an image analysis apparatus, image analysis method, and program capable of easily analyzing the orientations of fiber bundles from a three-dimensional image of the CMC.
- To solve the aforementioned problem, the present invention provides an image analysis apparatus having the features defined in
claim 1. Moreover, it is provided an image analysis method having the features defined in claim 10. Additionally it is provided a program for analyzing orientation of fiber bundles, which program has the feature defined inclaim 11. Further preferred embodiments of the image analysis apparatus are defined in the dependent claims 2 to 9. - According to the disclosure of the present invention, the orientations of fiber bundles can be easily analyzed from a three-dimensional image of the CMC.
-
- [
Fig. 1] Fig. 1 is an overall configuration diagram of an image analysis apparatus; - [
Fig. 2] Fig. 2 is a conceptual diagram of a woven fabric of three-dimensional weaving; - [
Fig. 3] Fig. 3 is an entire flowchart of image analysis processing; - [
Fig. 4] Fig. 4 is a detailed flowchart of binarization processing; - [
Fig. 5] Fig. 5 illustrates processed images created by the binarization processing; - [
Fig. 6] Fig. 6 is a detailed flowchart of overlapping area extraction processing; - [
Fig. 7] Fig. 7 illustrates processed images created by the overlapping area extraction processing; . - [
Fig. 8] Fig. 8 is a detailed flowchart of reference direction determination processing; - [
Fig. 9] Fig. 9 is a schematic diagram of processing for estimating directional distances by applying a normal directional distance method; - [
Fig. 10] Fig. 10 illustrates processed images created by the reference direction determination processing; - [
Fig. 11] Fig. 11 is a detailed flowchart of Z-yarn removal processing; - [
Fig. 12] Fig. 12 is a conceptual diagram when the normal directional distance method is applied; - [
Fig. 13] Fig. 13 is a conceptual diagram of a referenced directional distance method; - [
Fig. 14] Fig. 14 is a conceptual diagram when the referenced directional distance method is applied; - [
Fig. 15] Fig. 15 is a schematic diagram of processing for estimating a conditional directional distance; - [
Fig. 16] Fig. 16 is a conceptual diagram illustrating X-yarn or Y-yarn areas and Z-yarn areas; - [
Fig. 17] Fig. 17 is a detailed flowchart of fiber bundle orientation estimation processing; - [
Fig. 18] Fig. 18 illustrates analysis results when an input image is a simulated image; - [
Fig. 19] Fig. 19 illustrates analysis results when an input image is a high-definition X-ray CT image; - [
Fig. 20] Fig. 20 illustrates analysis results when an input image is a low-definition X-ray CT image; - [
Fig. 21] Fig. 21 illustrates analysis results when an input image is a defective simulated image; - [
Fig. 22] Fig. 22 illustrates analysis results when an input image is a curved surface simulated image; - [
Fig. 23] Fig. 23 is an overall configuration diagram of an image analysis apparatus; [Fig. 24] Fig. 24 is an entire flowchart of image analysis processing; - [
Fig. 25] Fig. 25 is a diagram illustrating an example of calculating a volume of a pillar; - [
Fig. 26] Fig. 26 is a diagram illustrating an example of calculating an extending direction of the pillar; - [
Fig. 27] Fig. 27 is a diagram illustrating image processing executed when the pillar is bent; - [
Fig. 28] Fig. 28 is a diagram illustrating an example in which pillars are arranged partly irregularly; - [
Fig. 29] Fig. 29 is a diagram illustrating an ideal arrangement of X-yarn and Y-yarn fiber bundles on an XY-plane; - [
Fig. 30] Fig. 30 is a diagram schematically illustrating an overlapping area extracted image on an XZ-plane (or a YZ-plane) in the arrangement of the fiber bundles inFig. 29 ; - [
Fig. 31] Fig. 31 is a diagram schematically illustrating an overlapping area extracted image on the XY-plane in the arrangement of the fiber bundles inFig. 29 ; [Fig. 32] Fig. 32 is a diagram illustrating a state where part of the fiber bundles extends in a direction, on the XY-plane, which is different from a direction it should extend on the XY-plane; - [
Fig. 33] Fig. 33 is a diagram schematically illustrating an overlapping area extracted image on the YZ-plane in the state of the fiber bundles inFig. 32 ; - [
Fig. 34] Fig. 34 is a diagram schematically illustrating an overlapping area extracted image on the XY-plane in the state of the fiber bundles inFig. 32 ; - [
Fig. 35] Fig. 35 is a diagram illustrating a state where part of the fiber bundles extends in a Z-direction different from a direction it should extend on the XY-plane; [Fig. 36] Fig. 36 is a diagram schematically illustrating an overlapping area extracted image on the YZ-plane in the state of the fiber bundles inFig. 35 ; - [
Fig. 37] Fig. 37 is a diagram illustrating a state where part of the fiber bundles extends in a direction which is different from a direction it should extend on the XY-plane and which has both a directional component within the XY-plane and a Z-directional component; - [
Fig. 38] Fig. 38 is a diagram schematically illustrating an overlapping area extracted image on the YZ-plane in the state of the fiber bundles inFig. 37 ; - [
Fig. 39] Fig. 39 is a diagram illustrating a state in which the respective fiber bundles extend in tilted directions as a whole on the XY-plane; - [
Fig. 40] Fig. 40 is a diagram illustrating a state in which the respective fiber bundles extend in tilted directions as a whole on the XY-plane; - [
Fig. 41] Fig. 41 is a diagram schematically illustrating an overlapping area extracted image on the XY-plane in the state of the fiber bundles inFig. 39 or40 ; [Fig. 42] Fig. 42 is a diagram illustrating a state where part of fiber bundles (for example, an X-yarn) is missing on the XY-plane; - [
Fig. 43] Fig. 43 is a diagram illustrating a state where the thickness of part of the fiber bundles is thicker or narrower than that of other fiber bundles on the XY-plane; - [
Fig. 44] Fig. 44 is a diagram schematically illustrating an overlapping area extracted image on the YZ-plane in the state of the fiber bundles inFig. 42 or Fig. 43 ; - [
Fig. 45] Fig. 45 is a diagram illustrating a state where part of the fiber bundles (such as the X-yarn) is folded back on the XY-plane; - [
Fig. 46] Fig. 46 is a diagram schematically illustrating an overlapping area extracted image on the XY-plane in the state of the fiber bundles inFig. 45 ; - [
Fig. 47] Fig. 47 is an overall configuration diagram of an image analysis apparatus; and - [
Fig. 48] Fig. 48 is an entire flowchart of the image analysis processing. - An embodiment of the present invention will be explained in detail with reference to drawings.
-
Fig. 1 illustrates an overall configuration of animage analysis apparatus 1 according to this embodiment. Theimage analysis apparatus 1 is a computer configured by including a CPU (Central Processing Unit) 11, aninput unit 12, astorage unit 13, adisplay unit 14, and amemory 15. - The
CPU 11 is a processor for controlling the operation of theimage analysis apparatus 1 in a supervisory manner in cooperation with various programs stored in thememory 15. Theinput unit 12 is an interface for accepting inputs from a user and is, for example, a keyboard and a mouse. Theinput unit 12 according to this embodiment is also an interface for inputting an X-ray CT image G10 of a woven fabric which constitutes a CMC (Ceramic Matrix Composite). - The CMC herein used is a fiber-reinforced composite material formed by making fiber bundles by tying about several hundreds of ceramic fibers together, manufacturing a woven fabric by weaving these fiber bundles, then coating the surfaces of the fibers with carbons or the like, and then performing, for example, a CVI (Chemical Vapor Infiltration) process and a PIP (Polymer Impregnation and Pyrolysis) process to form matrixes.
- Weaving methods for manufacturing a woven fabric include those called three-dimensional weaving or plain weaving. The three-dimensional weaving is a method for manufacturing the woven fabric by weaving the fiber bundles in three directions, that is, XYZ-directions and the plain weaving is a method for manufacturing the woven fabric by weaving the fiber bundles in two directions, that is, XY-directions.
-
Fig. 2 illustrates a conceptual diagram of a woven fabric of three-dimensional weaving. In this embodiment, an image of the woven fabric manufactured by particularly complicated three-dimensional weaving or an image of a CMC formed from this woven fabric is captured by using an X-ray CT scanner and an attempt is made to automatically analyze orientations of fiber bundles from the obtained X-ray CT image G10. - The woven fabric of three-dimensional weaving is formed as illustrated in
Fig. 2 by alternately placing fiber layers, which are made of fiber bundles of X-yarns arranged at equal distances, and fiber layers, which are made of fiber bundles of Y-yarns arranged at equal distances, one on top of another and fixing the multiplicity of accumulated fiber layers with fiber bundles of Z-yarns so as to prevent the fiber layers from falling off during the CMC forming process. - The CMC which is formed from this woven fabric is designed by assuming that it expands and contracts normally in the X-yarn direction or the Y-yarn direction. Therefore, the Z-yarns which are interlaced substantially perpendicularly with the X-yarns and the Y-yarns do not directly influence the strength of the CMC. On the other hand, the existence of the Z-yarns may cause poor accuracy when analyzing the orientations of the X-yarns and the Y-yarns.
- So, this embodiment is designed to remove the Z-yarns from the X-ray CT image G10 of the woven fabric of three-dimensional weaving and analyze the orientations of the fiber bundles of the X-yarns and the Y-yarns with good accuracy.
- Incidentally, the orientation(s) is a term that generally means arrangement aligned, or a state of being arranged, in a certain direction(s) and is used with the same meaning in this embodiment. Even if the fiber bundles are arranged in a state of winding, deviating, or breaking, the state of their arrangement will be called the "orientation(s)" as long as the fiber bundles are arranged in a state of being aligned in a certain direction(s).
- Referring back to
Fig. 1 , thestorage unit 13 is a storage medium that stores the X-ray CT image G10 which is input from theinput unit 12, and processed images obtained by executing various processing on this X-ray CT image G10. Thedisplay unit 14 is a display device such as an LCD (Liquid Crystal Display) that, for example, displays the X-ray CT image G10, images, and processed images. For example, thedisplay unit 14 automatically analyzes the orientations of the fiber bundles from the X-ray CT image G10 and displays a fiber bundle orientation estimated image G100 on a display screen. - The
memory 15 is a storage medium that stores various programs for executing image analysis processing in cooperation with theCPU 11. The various programs include abinarization unit 151, an overlappingarea extraction unit 152, a referencedirection determination unit 153, a Z-yarn removal unit 154, and a fiber bundleorientation estimation unit 155. The image analysis processing (Fig. 3 ) executed by these various programs will be explained later. -
Fig. 3 illustrates an entire flowchart of image analysis processing P1 according to this embodiment. This image analysis processing is executed in cooperation between theCPU 11 and the various programs stored in thememory 15 as triggered by the reception of an execution instruction from the user by theinput unit 12. For ease of explanation, the following explanation will be given by referring to the various programs as processing subjects. - After the
binarization unit 151 firstly inputs the X-ray CT image G10 via the input unit 12 (SP1), it binarizes the input X-ray CT image G10 on the basis of a specified threshold value and creates a binary image in which respective fiber bundles of the X-yarns, the Y-yarns, and the Z-yarns are indicated on the foreground (SP2). - Then, the overlapping
area extraction unit 152 extracts an overlapping area in which the X-yarns and the Y-yarns perpendicularly and three-dimensionally intersect with each other (SP3); and the referencedirection determination unit 153 determines an overlapping direction of the extracted overlapping area as a reference direction (SP4). - The reason for extracting the overlapping area at this point is to estimate the overlapping direction by applying a normal directional distance method to the extracted overlapping area. The normal directional distance method will be explained later.
- Furthermore, the reason for determining the overlapping direction as the reference direction is to estimate the orientations of the fiber bundles by applying the two-dimensional normal directional distance method on a plane perpendicular to this reference direction.
- The plane perpendicular to the reference direction will be referred to as a "reference plane" and a method for applying the two-dimensional normal directional distance method on the reference plane will be referred to as a "referenced directional distance method."
- Since the X-yarns or the Y-yarns exist on the reference plane, the orientations of the fiber bundles of the X-yarns and the Y-yarns can be estimated with good accuracy by applying the referenced directional distance method. The referenced directional distance method will be explained later.
- Next, the Z-
yarn removal unit 154 estimates the orientations of the fiber bundles of the X-yarns, the Y-yarns, and the Z-yarns by applying the referenced directional distance method to the binary image. Then, the Z-yarn removal unit 154 removes the Z-yarns included in the binary image on the basis of the estimated orientations (SP5). - Subsequently, the fiber bundle
orientation estimation unit 155 estimates the orientations of the fiber bundles of the X-yarns and the Y-yarns by applying the referenced directional distance method again to the binary image from which the Z-yarns have been removed (SP6). - Then, the fiber bundle
orientation estimation unit 155 creates the fiber bundle orientation estimated image G100, has thedisplay unit 14 display the fiber bundle orientation estimated image G100 (SP7), and terminates this image analysis processing. - The details of each processing (SP2 to SP6) explained with reference to
Fig. 3 will be explained below with reference toFig. 4 to Fig. 17 and by using mathematical expressions (Expression 1 to Expression 3). Incidentally, since processing for inputting the X-ray CT image G10 (SP1) and processing for displaying the fiber bundle orientation estimated image G100 (SP7) are general methods, an explanation about them is omitted. -
Fig. 4 illustrates a detailed flowchart of binarization processing. Thebinarization unit 151 firstly creates a binary image by binarizing the X-ray CT image G10, which has been input via theinput unit 12, on the basis of a specified threshold value (SP21). Black dot defects may sometimes occur in the created binary image due to uneven density of fibers in the fiber bundles. Specifically speaking, there are some voxels which should originally be the background and are made to become foreground voxels. - In order to make these foreground voxels which should originally be the background return to background voxels, the
binarization unit 151 executes closing processing of morphology processing (SP22). The black dot defects which have occurred in the binary image can be eliminated by executing the closing processing. Thebinarization unit 151 creates a binary image, from which the black dot defects have been eliminated and cleaned, and terminates this processing. -
Fig. 5 illustrates processed images created by the binarization processing. Specifically speaking,Fig. 5 illustrates a binary image G21 before the closing processing and a binary image G22 after the closing processing. - The binary image G21 includes some voxels which should originally be the background and are made to become foreground voxels as illustrated in
Fig. 5 . The binary image G22 after the closing processing, from which the black dot defects have been eliminated, can be obtained by executing the closing processing. -
Fig. 6 illustrates a detailed flowchart of the overlapping area extraction processing. The overlappingarea extraction unit 152 executes opening processing of the morphology processing in order to extract the overlapping area in which the X-yarns and the Y-yarns three-dimensionally intersect with each other (SP31). - A rough overlapping area can be extracted by executing the opening processing. The shape of the binary image after the opening processing has changed and there are some positions where the foreground voxels which should originally be located in the overlapping area are made to become the background voxels in areas that are not the overlapping area.
- In order to make these background voxels which should originally be in the overlapping area return to the foreground voxels, the overlapping
area extraction unit 152 executes the dilation processing of the morphology processing (SP32). - Next, the overlapping
area extraction unit 152 extracts an accurate overlapping area by calculating a product set of the binary image after the dilation processing and the binary image before the opening processing (SP33). The overlappingarea extraction unit 152 creates an overlapping area extracted image with the extracted overlapping area and terminates this processing. -
Fig. 7 illustrates processed images formed by the overlapping area extraction processing. Specifically speaking,Fig. 7 illustrates a binary image G3 before the opening processing, a binary image G31 after the opening processing, a binary image G32 after the dilation processing, and an overlapping area extracted image G33. - The overlapping area extracted image G33 with the extracted accurate overlapping area can be obtained by calculating a product set of the binary image before the opening processing G3 and the binary image after the dilation processing G32 as illustrated in
Fig. 7 . -
Fig. 8 illustrates a detailed flowchart of reference direction determination processing. The referencedirection determination unit 153 applies the normal directional distance method to the overlapping area extracted image G33 (Fig. 7 ) and estimates the overlapping direction with respect to each voxel in the overlapping area (SP41). -
Fig. 9 illustrates the outlines of processing for estimating a directional distance of a voxel of interest by applying the normal directional distance method. When a binarized input image G411 is input, the directional distance to the background is calculated with respect to the voxel of interest. Directions to voxels close to the voxel of interest are eight directions in a case to the two dimensions or 26 directions in a case of the three dimensions. - Now, the case of the two dimensions will be explained. When vsi represents voxels from which vectors of opposite directions are excluded, the processing proceeds in four directions on the image and stops proceeding when it reaches the background. Similarly, regarding -vsi, the processing proceeds in four directions on the image and stops proceeding when it reaches the background.
- When d(vsi) represents an advanced distance in a vsi direction and d(-vsi) represents an advanced distance in a -vsi direction, a directional distance d(±vsi) in ±vsi directions is expressed by
Expression 1 below. - [Math. 1]

- Furthermore, a directional vector Pi and a directional tensor M are defined by
Expressions 2 and 3 below, respectively. When eigenvalue decomposition of the directional tensor M is performed, an eigenvector for the maximum eigenvalue indicates the orientation of a fiber bundle. Furthermore, an eigenvector for the second largest eigenvalue indicates a widthwise direction of the fiber bundle. In the case of the three dimensions, an eigenvector for the minimum eigenvalue indicates a thickness direction. - [Math. 2]

- [Math. 3]

- Referring back to
Fig. 8 , the overlapping direction estimated in step SP41 is not calculated accurately with respect to voxels in a border region between the overlapping area and the background due to the properties of the directional distance method. In order to remove these voxels in the border region regarding which the calculation cannot be performed accurately, the referencedirection determination unit 153 executes erosion processing of the morphology processing and extracts a central area from the overlapping area (SP42). - Next, since each of overlapping areas constitutes an independent connecting component, the reference
direction determination unit 153 executes 6-neighbour labeling processing on each extracted central area to divide the area and separates the overlapping areas (SP43). - Subsequently, the reference
direction determination unit 153 averages the overlapping directions of the respective voxels in the central area from among the overlapping directions estimated in step SP41, determines the direction obtained by averaging as a reference direction (SP44), and terminates this processing. -
Fig. 10 illustrates processed images created by reference direction determination processing. Specifically speaking,Fig. 10 illustrates an overlapping direction estimated image G41, a central area extracted image G42, a labeling image G43, and a reference direction image G44. - The overlapping direction estimated image G41 can be obtained by applying the normal directional distance method to the overlapping area extracted image G33 (
Fig. 7 ) as illustrated inFig. 10 . Moreover, the central area extracted image G42 can be obtained by executing the erosion processing on the overlapping direction estimated image G41. - Furthermore, the labeling image G43 can be obtained by executing the labeling processing on the central area extracted image G42. Furthermore, the reference direction image G44 can be obtained by averaging the overlapping direction in the central area.
-
Fig. 11 illustrates a detailed flowchart of Z-yarn removal processing. The Z-yarn removal unit 154 calculates the directional distance by applying a referenced directional distance method on the binary image G22 (Fig. 5 ) obtained in step SP2 (SP51). - The referenced directional distance method is a method for rotating the plane, on which the directional distance is to be calculated, to a plane perpendicular to the reference direction (a reference plane) and calculating the directional distance on this reference plane by the two-dimensional normal directional distance method.
-
Fig. 12 illustrates a conceptual diagram of a case where the directional distance is calculated by applying the normal directional distance method. When calculating the directional distance in the overlapping area, in which the X-yarns and the Y-yarns three-dimensionally intersect with each other, by applying the normal directional distance method, there is a problem of incapability to calculate the directional distance accurately. - Specifically speaking, the distance in a direction close to the orientation of a fiber bundle shortly reaches the background and becomes short because the thickness of the fiber bundles of the X-yarn and the Y-yarn is thin. On the other hand, the distance in a direction close to the reference direction hardly reaches the background and becomes long because a cross section of the overlapping area is thick.
- Therefore, the distance in the direction close to the reference direction becomes longer than the distance in the direction close to the orientation of the fiber bundle. As a result, the problem is that the directional distance in the direction close to the reference direction is calculated as the directional distance in the overlapping area. So, in this embodiment, the directional distance is calculated by applying the referenced directional distance method.
-
Fig. 13 illustrates a conceptual diagram of the referenced directional distance method. The referenced directional distance method is a method for rotating the plane which is a target of calculation of the directional distance, and calculating the directional distance by applying the two-dimensional directional distance method on the plane which has been rotated. - Specifically speaking, a direction ±vs0 is rotated so as to match the reference direction and other directions ±vs1 and ±vs2 perpendicular to ±vs0 are also rotated by the angle of rotation of ±vs0. When directions obtained after the rotations are expressed as ±vs0', ±vs1', and ±vs2' respectively, the X-yarns or the Y-yarns exist on a plane defined by ±vs1' and ±vs2' (reference plane).
- The orientations of the fiber bundles can be estimated without being influenced by the overlapping area by calculating the directional distance by applying the two-dimensional directional distance method on this reference plane.
-
Fig. 14 illustrates a conceptual diagram in a case where the directional distance of the X-yarns or the Y-yarns on the reference plane is calculated by applying the referenced directional distance method. When calculating the directional distance with respect to a voxel of interest located in the overlapping area, the directional distance is calculated by applying the referenced directional distance method. - Specifically speaking, the direction ±vs0 is rotated so as to match the reference direction and other directions ±vs1, ±vs2, ±vs3, and ±vs4 perpendicular to ±vs0 are also rotated by a similar angle as described above.
- When the directions after the rotation are expressed as ±vs0', ±vs1', ±vs2', ±vs3', and ±vs4' respectively, the directional distance is calculated by applying the two-dimensional directional distance method on the reference plane defined by ±vs1', ±vs2', ±vs3', and ±vs4'.
- The aforementioned relationships indicated by
Expressions 1 to 3 are also established when calculating the directional distance by applying the referenced directional distance method. Specifically speaking, when eigenvalue decomposition of the directional tensor M is performed, an eigenvector for the maximum eigenvalue indicates the orientation of a fiber bundle. Furthermore, an eigenvector for the second largest eigenvalue represents a widthwise direction of the fiber bundle. In a case of the three dimensions, an eigenvector for the minimum eigenvalue represents a thickness direction. - Referring back to
Fig. 11 , the Z-yarn removal unit 154 calculates a conditional directional distance by using the eigenvector for the second largest eigenvalue obtained by the calculation of the referenced directional distance method (SP52). Then, the Z-yarn removal unit 154 separates the X-yarn or Y-yarn area from the Z-yarn area on the basis of the conditional directional distance (SP53). - The conditional directional distance is a directional distance calculated under a condition that the processing stops proceeding when the processing proceeds from a voxel of interest on the image and reaches the background or when an angle formed by a direction indicated by an eigenvector of a voxel at a position, to which the processing will proceed next, and an advancing direction is larger than a specified threshold value.
-
Fig. 15 illustrates the outlines of processing for estimating the conditional directional distance. The processing starts at a voxel of interest at position x as a point of origin, proceeds on the image in a direction indicated by an eigenvector v2(x) for the voxel of interest, and stops proceeding when it reaches the background. The distance from the last reached voxel to the voxel of interest is expressed as xe1. - Meanwhile, the processing also proceeds on the image in a direction of an opposite direction vector -v2(x) and stops proceeding when an angle formed by the direction indicated by an eigenvector v2(x') for a voxel located at position x', to which the processing will proceed next, and the direction indicated by -v2(x) is larger than a specified threshold value. The distance from the last reached voxel to the voxel of interest is expressed as xe2. Then, a total of absolute values of the distances xe1 and xe2 is the conditional directional distance dc(x).
-
Fig. 16 illustrates a conceptual diagram in which the X-yarn or Y-yarn areas are separated from the Z-yarn areas on the basis of the conditional directional distance. Since the width Wxy of the X-yarn or the Y-yarn is larger than the diagonal distance Wz of the cross section of the Z-yarn, the conditional directional distance dc(p) of voxel p in the X-yarn or Y-yarn area is larger than the conditional directional distance dc(q) of voxel q in the Z-yarn area. - For example, a value larger than the diagonal distance Wz of the cross section of the Z-yarn and smaller than the width Wxy of the X-yarn or the Y-yarn can be set as the threshold value, voxels with the conditional directional distance larger than this threshold value can be included in the X-yarn or Y-yarn area, and voxels with the conditional directional distance smaller than the threshold value can be included in the Z-yarn area.
- Referring back to
Fig. 11 , the Z-yarn removal unit 154 removes Z-yarns from the binary image G22 (Fig. 5 ) by deleting voxels included in the Z-yarn area (SP54). If the Z-yarns are removed, part of the X-yarn or Y-yarn area may sometimes be removed. - So, the Z-yarn removal unit 154: executes dilation processing of the morphology processing on the image from which the Z-yarns have been removed (SP55); extracts the X-yarns and the Y-yarns by calculating a product set of the image after the dilation processing and the image before the dilation processing (SP56); and terminates this processing.
-
Fig. 17 illustrates a detailed flowchart of fiber bundle orientation estimation processing. The fiber bundleorientation estimation unit 155 estimates the fiber directions of the X-yarns and the Y-yarns by applying the referenced directional distance method again on the image in which the X-yarns and the Y-yarns are extracted (SP61). - Next, the fiber bundle
orientation estimation unit 155 deletes other voxels by leaving voxels in the vicinity of a central part with relatively better accuracy, from among the voxels with the estimated fiber directions, thereby extracting the voxels in the vicinity of the central part (SP62). - Subsequently, the fiber bundle
orientation estimation unit 155 executes clustering processing in order to connect voxels of similar directions with respect to the voxels in the vicinity of the central part, make the connected group of voxels belong to the same cluster, and make voxels whose vectors suddenly change in the middle of the fiber bundles belong to a different cluster. - The orientation of a fiber bundle does not abruptly change in a short distance of several voxels. Therefore, it is possible to determine that a voxel whose vector abruptly changes in the middle of a fiber bundle is noise. So, the fiber bundle
orientation estimation unit 155 eliminates the noise by deleting a cluster to which a small number of voxels belong (SP63), and terminates this processing. - Processed images obtained when executing the image analysis processing according to this embodiment explained above on various input images will be explained below with reference to
Fig. 18 to Fig. 21 . -
Fig. 18 illustrates processed images obtained by executing the image analysis processing when the input image is a simulated image G11. The simulated image G11 is a three-dimensional image created by setting, for example, the length, width, and thickness of fiber bundles of the X-yarns and the Y-yarns, the number of accumulated X-yarn fiber layers and Y-yarn fiber layers, spaces between the fiber bundles, and a cross-sectional shape of the Z-yarn. In other words, it is an image regarding which various kinds of information are already known. - When the image analysis processing according to this embodiment is executed on this simulated image G11, a three-dimensional image G110, an X-yarn sectional image G111, and a Y-yarn sectional image G112 can be obtained. The three-dimensional image G110 is a three-dimensional image indicating orientations of fiber bundles of the X-yarns and the Y-yarns.
- Furthermore, the X-yarn sectional image G111 is a two-dimensional image indicating the orientation of the fiber bundles of the X-yarns; and the Y-yarn sectional image G112 is a two-dimensional image indicating the orientation of the fiber bundles of the Y-yarns.
- As a result of calculating an angle formed between the directions of the fiber bundles, which were calculated when obtaining these processed images G110 to G112, and the directions of the fiber bundles which were set when creating the simulated image G11, as an error, the maximum value of the error was 89.9 degrees and an average value was 4.9 degrees.
- Incidentally, it is generally known that a mean error of the directional distance method itself is 4.3 degrees. Furthermore, of all the voxels, the error of 94.7% of voxels was 6 degrees or less. The effectiveness of the image analysis processing according to this embodiment can be confirmed on the basis of the above-described results.
-
Fig. 19 illustrates processed images obtained by executing the image analysis processing when the input image is an X-ray CT image G10. The X-ray CT image G10 is a three-dimensional image obtained by capturing an image of an actual woven fabric by using the X-ray CT scanner. Furthermore, the X-ray CT image G10 is of high definition quality as compared to an X-ray CT image G12 illustrated inFig. 20 . - When the image analysis processing according to this embodiment is executed on this X-ray CT image G10, a three-dimensional image G100 (fiber bundle orientation estimated image G100), an X-yarn sectional image G101, and a Y-yarn sectional image G102 can be obtained. The three-dimensional image G100 is a three-dimensional image indicating orientations of fiber bundles of the X-yarns and the Y-yarns.
- Furthermore, the X-yarn sectional image G101 is a two-dimensional image indicating the orientation of the fiber bundles of the X-yarns; and the Y-yarn sectional image G102 is a two-dimensional image indicating the orientation of the fiber bundles of the Y-yarns. The orientations of the fiber bundles of the X-yarns and the Y-yarns can be easily identified by referring to these processed image G100 to G102.
- Furthermore, calculation time was approximately 243.8 seconds. Conventionally, it takes about 20 times as long as the above-mentioned calculation time in order to analyze an image of approximately the same number of voxels. Therefore, the calculation time can be reduced by executing the image analysis processing according to this embodiment.
-
Fig. 20 illustrates processed images obtained by executing the image analysis processing when the input image is the X-ray CT image G12. The difference between the X-ray CT image G12 and the X-ray CT image G10 illustrated inFig. 19 is that the X-ray CT image G12 is of low definition quality as compared to the X-ray CT image G10. - When executing the image analysis processing according to this embodiment on this X-ray CT image G12, a three-dimensional image G120, an X-yarn sectional image G121, and a Y-yarn sectional image G122 can be obtained. The orientations of most of the fiber bundles can be easily identified with reference to these processed images G120 to G122 although some parts of the fiber bundles are missing.
-
Fig. 21 illustrates processed images obtained by executing the image analysis processing when the input image is a defective simulated image G13. The difference between the defective simulated image G13 and the simulated image G11 illustrated inFig. 18 is that the defective simulated image G13 has a defect in fiber bundles of the X-yarns being bent by 10 degrees in the middle as compared to the simulated image G11. - When executing the image analysis processing according to this embodiment on this defective simulated image G13, a three-dimensional image G130 and an X-yarn sectional image G131 can be obtained. It is possible to easily identify, with reference to these processed images G130 and G131, that fiber bundles of the X-yarns are bent at a bending point although there is some error.
-
Fig. 22 illustrates processed images obtained by executing the image analysis processing when the input image is a curved surface simulated image G14. The difference between the curved surface simulated image G14 and the simulated image G11 illustrated inFig. 18 is that the curved surface simulated image G14 has a curved surface portion deformed in an arc-like shape as compared to the simulated image G11. - When executing the image analysis processing according to this embodiment on this curved surface simulated image G14, a three-dimensional image G140 and an X-yarn sectional image G141 can be obtained. It is possible to easily identify, with reference to these processed image G140 and G141, that the fiber bundles are oriented in an arc.
- The image analysis apparatus, the image analysis method, and the program according to this embodiment is designed as described above to remove the Z-yarns by applying the referenced directional distance method to the X-ray CT image of the woven fabric manufactured by the three-dimensional weaving and estimate the orientations of the fiber bundles of the X-yarns and the Y-yarns by applying the referenced directional distance method again to the image from which the Z-yarns have been removed, so that the orientations of the fiber bundles can be estimated with good accuracy and in a short amount of time by eliminating the influence of the Z-yarns. Furthermore, the orientations of the fiber bundles can be estimated also with respect to the X-ray CT image of the woven fabric having a curved surface shape. Therefore, the image analysis apparatus, the image analysis method, and the program according to this embodiment can be used for actual product examinations.
- Next, an exemplary image analysis apparatus 2 which is not an embodiment of the present invention will be explained with reference to
Fig. 23 to Fig. 46 . - Image analysis apparatus 2 includes, as illustrated in
Fig. 23 , theCPU 11, theinput unit 12, thestorage unit 13, thedisplay unit 14, and thememory 15 which are the same as those of theimage analysis apparatus 1 inFig. 1 ; and thememory 15 has thebinarization unit 151 and the overlappingarea extraction unit 152. Since these components are the same as those having the same names and reference numerals inFig. 1 and are designed to execute the same processing, any redundant explanation is omitted. Under this circumstance, the image analysis apparatus 2 according to this example includes an overlapping areamorphological analysis unit 253 in thememory 15. The overlapping areamorphological analysis unit 253 analyzes the form of the "overlapping area" - in the overlapping area extracted image G33 obtained by the processing of the overlapping
area extraction unit 152. Under this circumstance, the form of the overlapping area includes not only the form of one overlapping area, but also the form of a combination of a plurality of overlapping areas which are dotted in the image. Furthermore, the image analysis apparatus 2 has thedisplay unit 14 as illustrated - in the drawing, but may be configured to not have the
display unit 14 so that it will perform analysis without display. -
Fig. 24 illustrates a flowchart of image analysis processing P2 executed by the image analysis apparatus 2. The image analysis processing P2 is designed as illustrated in this flowchart to firstly input an X-ray CT image (SP1) and execute binarization processing (SP2) and overlapping area extraction processing (SP3). - Since these processing steps are the same as the aforementioned processing of SP1 to SP3 illustrated in
Fig. 3 , an explanation about them is omitted. Next, during overlapping area morphological analysis processing (SP14), the overlapping areamorphological analysis unit 253 executes processing of morphological analysis of an overlappingarea 21 by using the overlapping area extracted image G33 (seeFig. 7 ) obtained by the overlapping area extraction processing. Under this circumstance , individual overlappingareas 21 in the overlapping area extracted image G33 will be hereinafter referred to as "pillars 21". - The overlapping area
morphological analysis unit 253 may calculate the volume of eachpillar 21 by, for example, counting the number of voxels included in a three-dimensional image of thepillar 21.Fig. 25 illustrates pixels in apillar 21, which are indicated as black dots in the two-dimensional image; however, the number of voxels can be counted in the same manner with respect to a three-dimensional image. - In this case, whether the volume of a
certain pillar 21 is appropriate or not may be judged by, for example, using an average of the volume of a plurality ofpillars 21 as a reference value and comparing it with the volume of thecertain pillar 21. Under this circumstance, not only the average of the plurality ofpillars 21, but also other values such as a reference value in designing may be used as the reference value of the volume. Furthermore, it has been described that the volume of thepillar 21 is calculated; however, in a case of analysis by using a two-dimensional image, the area may be calculated. As a result of such processing for calculating the volume, - it is possible to provide useful information for detection of abnormal orientations of the fiber bundles, for example, information indicating that the volume of the
certain pillar 21 is different from the volume of surroundingpillars 21. Furthermore, it is possible to detect the abnormal orientation of the fiber bundles, for example, to detect insufficiency in the number of the X-yarns or the Y-yarns which should three-dimensionally interest with each other, on the basis of the provided information. - Furthermore, the overlapping area
morphological analysis unit 253 may calculate a direction in which thepillar 21 extends. The extending direction of thepillar 21 may be made visible, for example, as illustrated inFig. 26 (a shaded area in S21) by using erosion processing of the morphology image processing, and may be vectorized (S22), or the extending direction can be found by using other image processing. Furthermore, for example, the overlapping areamorphological analysis unit 253 can judge whether the extending direction of a specifiedpillar 21 is appropriate or not, by using an average of extending directions of a plurality ofpillars 21 as a reference value and comparing it with the extending direction of the specifiedpillar 21. Under this circumstance, not only the average of the extending directions of the plurality ofpillars 21, but also other values such as a reference value in designing may be used as the reference value of the extending direction. Furthermore, a neutral axial shape of thepillar 21 may be found separately from the extending direction of thepillar 21. The neutral axis can be extracted by, for example, using the erosion processing of the morphology image processing as illustrated in the shaded area inFig. 27 . In this case, it is also possible to: detect, for example, a case where thepillar 21 is bent without extending in a certain direction; and further judge whether thepillar 21 is of an appropriate shape or not by comparing it with a reference shape. As a result of such processing for calculating the extending direction or the neutral axis of thepillar 21, it is possible to provide useful information to detect, for example, a displaced portion in the accumulated layers and other problems in the orientations of the fiber bundles. Furthermore, it is possible to detect abnormal orientations of the fiber bundles on the basis of the provided information. - Furthermore, the overlapping area
morphological analysis unit 253 may calculate centroid positions of a plurality ofpillars 21. Since a line connecting centroid positions ofadjacent pillars 21 ideally constitutes extending directions of the X-yarns and the Y-yarns, whether the centroid positions are appropriate or not can be judged by finding irregular centroid positions by, for example, detecting that such centroid positions are not aligned along a smooth line on the XY-plane.Fig. 28 illustrates a state where the center of gravity G of apillar 21 indicated with diagonal lines is not aligned smoothly as compared to the centers of gravity G of surroundingpillars 21. Furthermore, whether apillar 21 which is irregularly arranged exists or not may be judged by determining a certain area and finding whether an appropriate number of centers of gravity G exist in the area or not by, for example, counting the number of the centers of gravity G in that area. As a result of such processing for calculating the centroid positions, it is possible to provide useful information to detect problems in the orientations of the fiber bundles. Furthermore, it is possible to detect abnormal orientations of the fiber bundles on the basis of the provided information. - The aforementioned example of the overlapping area morphological analysis processing has described the case including the processing for detecting the abnormal orientations of the fiber bundles; however, the processing of the overlapping area
morphological analysis unit 253 may be designed to execute only the morphological analysis of the overlapping area such as calculation of the volume of thepillars 21, calculation of the extending directions of thepillars 21, or calculation of the centroid positions of thepillars 21, and may only provide processed information by, for example, outputting the information to thedisplay unit 14 or transmitting calculated data to another apparatus. As a result of such processing, it is possible to provide useful information to detect abnormal orientations of the fiber bundles. - Specific examples of abnormal orientations of the fiber bundles detected by the morphological analysis of the
pillars 21 will be explained by usingFigs. 29 to 46 . Regarding the specific examples of detection of abnormal orientations of the fiber bundles, a case in which the overlapping area morphological analysis processing executed by the overlapping areamorphological analysis unit 253 includes detection of abnormal orientations of the fiber bundles will be also described; however, the processing of the overlapping areamorphological analysis unit 253 may not include such judgment, but may only provide information about the orientations of the fiber bundles as obtained by the morphological analysis of thepillars 21. Incidentally,Fig. 30 ,33 ,36 ,38 ,40, 41 ,43 ,44 , and46 are illustrated with reference to a report "DOT/FAA/AR-06/10" issued by FAA (Federal Aviation Administration). -
Fig. 29 illustrates an example of an ideal arrangement of fiber bundles of the X-yarns and the Y-yarns on the XY-plane; andFigs. 30 and 31 respectively schematically illustrate overlapping area extracted images on the XZ-plane (or the YZ-plane) and the XY-plane with respect to the ideal fiber bundle arrangement as inFig. 29 . Referring toFig. 30 , apillar 21 extends without any break in an accumulated direction (Z-direction) of the fiber bundles of the X-yarns and the Y-yarns in the ideal arrangement of the fiber bundles of the X-yarns and the Y-yarns; and referring toFig. 31 , pillars 21 (or the centers of gravity G of the pillars 21) are arranged regularly. -
Fig. 32 (-Y-direction) illustrates a state on the XY-plane where a portion of a fiber bundle extends in another direction, on the XY-plane, that is different from the direction to which it should extends.Fig. 33 and34 respectively schematically illustrate overlapping area extracted images on the YZ-plane and the XY-plane in the state of the fiber bundles inFig. 32 . As illustrated in these diagrams, the centroid position G of apillar 211 having a fiber bundle extending in the -Y-direction (shaded area) has moved to the -Y-direction due to the influence by that fiber bundle extending in the -Y-direction in the overlapping area extracted image inFig. 33 . Regarding the overlapping area extracted image inFig. 34 , the centroid position G of thepillar 211 does not follow the regularity of the centroid positions of thevicinal pillars 21. Therefore, the overlapping areamorphological analysis unit 253 can, for example, analyze the centroid positions G of therespective pillars 21 in the overlapping area extracted image and detects an area where a portion of the fiber bundles extends in another direction, on the XY-plane, different from the direction to which it should extend. -
Fig. 35 illustrates a state on the XY-plane where a portion of the fiber bundles extends in the Z-direction different from the direction to which it should extend.Fig. 36 schematically illustrates an overlapping area extracted image on the YZ-plane in the state of the fiber bundles inFig. 35 . As illustrated in this drawing, apillar 212 in the overlapping area extracted image inFig. 36 is divided into a plurality of portions due to the influence of the fiber bundle extending in the Z-direction (shaded area). Therefore, the overlapping areamorphological analysis unit 253 can detect the area in which a portion of the fiber bundles extends in the Z-direction different from the direction to which it should extend, by using the overlapping area extracted image. -
Fig. 37 illustrates a state on the XY-plane where a portion of the fiber bundles extends in a direction that is different from the direction, to which it should extends, and has both a directional component on the XY-plane and a Z-directional component.Fig. 38 schematically illustrates an overlapping area extracted image on the YZ-plane in the state of the fiber bundles inFig. 37 . As illustrated in this drawing, a pillar 213 in the overlapping area extracted image inFig. 38 is divided into a plurality of portions due to the influence of the fiber bundle extending in the - Z-direction and the -Y-direction (shaded area). Furthermore, the centroid position G of one of the divided pillars 213 has moved to the +Y-direction. Therefore, the overlapping areamorphological analysis unit 253 can detect the area in which a portion of the fiber bundles extends in the direction that is different from the direction, to which it should extend, and has both the directional component on the XY-plane and the Z-directional component, by using the overlapping area extracted image. -
Figs. 39 and40 respectively illustrate a state on the XY-plane where the fiber bundles generally extend in inclined directions.Fig. 41 schematically illustrates an overlapping area extracted image on the XY-plane in the state of the fiber bundles illustrated inFig. 39 or40 . As illustrated in this drawing,pillars 214 which constitute a row that is part of regularly arrangedpillars 21 are misaligned in the overlapping area extracted image inFig. 41 . Therefore, the overlapping areamorphological analysis unit 253 can detect the area in which the fiber bundles generally extend in the inclined directions, by detecting, for example, that the centroid positions G of thepillars 214 do not follow specified regularity, by using the overlapping area extracted image. -
Fig. 42 illustrates a state on the XY-plane where a portion of the fiber bundles (for example, an X-yarn) is missing.Fig. 43 illustrates a case where the thickness of a portion of the fiber bundles is thicker or narrower than that of other fiber bundles on the XY-plane.Fig. 44 schematically illustrates an overlapping area extracted image of the YZ-plane in the state of the fiber bundles inFig. 42 or Fig. 43 . Regarding the overlapping area extracted image inFig. 44 , somepillar 215 is divided into a plurality of portions and the total volume of a plurality of dividedpillars 215 becomes smaller than the volume of anormal pillar 21. Therefore, the overlapping areamorphological analysis unit 253 can detect the case where a portion of the fiber bundle is missing, and the area where the thickness of a portion of the fiber bundles is thicker or narrower than that of other fiber bundles, by using the overlapping area extracted image. -
Fig. 45 illustrates a state on the XY-plane where a portion of a fiber bundle (for example, an X-yarn) is folded back.Fig. 46 schematically illustrates an overlapping area extracted image of the XY-plane in the state of the fiber bundles inFig. 45 . Regarding the overlapping area extracted image inFig. 46 ,pillars 216 surrounding the loop are pushed aside by the loop of the portion of the fiber bundle and the centroid positions G of thepillars 216 are disordered as compared to the centroid positions G of the surrounding regularly-arrangedpillars 21. Therefore, the overlapping areamorphological analysis unit 253 can detect the area in which a portion of the fiber bundle is looped, by analyzing the disordered arrangement of the centroid positions G by using the overlapping area extracted image. - The image analysis apparatus 2 of this example is designed as described above so that: the
binarization unit 151 binarizes the three-dimensional image of the woven fabric made of the fiber bundles of the X-yarns, the Y-yarns, and the Z-yarns; the overlappingarea extraction unit 152 extracts the overlapping area, in which the X-yarns and the Y-yarns three-dimensionally intersect with each other, from the binarized image; and the overlapping areamorphological analysis unit 253 analyzes the form of the extracted overlapping area. As a result, the analysis is performed by only a combination of image processing in a short amount of processing time, so that it is possible to provide information about the orientations of the fiber bundles of the X-yarns and the Y-yarns more easily and in a shorter amount of time. - Furthermore, when the overlapping area
morphological analysis unit 253 further detects abnormal orientations of the fiber bundles, it is possible to find the abnormal orientations of the fiber bundles more easily and in a shorter amount of time. Furthermore, even when detailed analysis of the abnormal orientations of the fiber bundles is required, it is only necessary to separately perform the detailed analysis only with respect to the area including the detected abnormal orientations. So, analysis time can be shortened as a whole. - Furthermore, the morphological analysis of the overlapping area can be employed regardless of whether the general shape of the entire fiber bundles is a flat surface or a curved surface. Since the overlapping area can be extracted no matter what general shape the fiber bundles is, the overlapping area morphological analysis processing can be applied. Furthermore, since the
pillars 21 are arranged regularly over the general shape of the fiber bundles, for example, problems of the orientations of the fiber bundles can be also detected by analyzing the form of the overlapping area regardless of whether the general shape of the fiber bundles is a flat surface or a curved surface. - Furthermore, the overlapping area
morphological analysis unit 253 may calculate the volume of the overlapping area. In this case, the volume of the overlapping area can be compared with a "reference volume value" of the overlapping area; and furthermore, this "reference volume value" can be an average value of the volume of a plurality of overlapping areas. - Furthermore, the overlapping area
morphological analysis unit 253 may calculate the direction in which the overlapping area extends. In this case, the direction in which the overlapping area extends can be compared with a "reference direction value" of the overlapping area; and this "reference direction value" can be an average value of the directions of the plurality of overlapping areas. - Furthermore, the overlapping area
morphological analysis unit 253 may calculate centroid positions of the plurality of overlapping areas. In this case, the overlapping areamorphological analysis unit 253 can detect an area where the centroid positions are arranged irregularly. For example, the area where the centroid positions are arranged irregularly may be detected by, for example, finding a reference line where the centroid positions are aligned and calculating how much the relevant centroid position(s) is displaced from the reference line, or by calculating the number of centroid positions included in a certain area. - Furthermore, the overlapping area
morphological analysis unit 253 may calculate the neutral axis of the overlapping area and compare it with a reference shape. In this case, the erosion processing of the morphology can be used to calculate the neutral axis. - Furthermore, this example image analysis method is characterized in that it includes: a step of binarizing a three-dimensional image of the woven fabric made of the fiber bundles of the X-yarns, the Y-yarns, and the Z-yarns; a step of extracting an overlapping area, in which the X-yarns and the Y-yarns three-dimensionally intersect with each other, from the binarized image; and a step of analyzing the form of the extracted overlapping area.
- Furthermore, the program according to this example is a program for causing a computer to execute: a step of binarizing a three-dimensional image of the woven fabric made of the fiber bundles of the X-yarns, the Y-yarns, and the Z-yarns; a step of extracting an overlapping area, in which the X-yarns and the Y-yarns three-dimensionally intersect with each other, from the binarized image; and a step of analyzing the form of the extracted overlapping area.
- Each of the above-described arrangements have described the case where the image analysis processing (
Fig. 3 ) by theimage analysis apparatus 1 illustrated inFig. 1 and the image analysis processing P2 (Fig. 24 ) by the image analysis apparatus 2 illustrated inFig. 23 are used separately; however, they can be made to operate in association with each other.Fig. 47 illustrates the configuration of animage analysis apparatus 3 which is an arrangement for executing these processing steps by combining them. Theimage analysis apparatus 3 includes theCPU 11, theinput unit 12, thestorage unit 13, thedisplay unit 14, and thememory 15 in the same manner as the aforementionedimage analysis apparatus 1 or 2; and thememory 15 has thebinarization unit 151, the overlappingarea extraction unit 152, the referencedirection determination unit 153, the Z-yarn removal unit 154, the fiber bundleorientation estimation unit 155, and the overlapping areamorphological analysis unit 253. Each component executes the same processing as that of the aforementioned corresponding component. -
Fig. 48 illustrates a flowchart of image analysis processing P3 by thisimage analysis apparatus 3. In the same manner as the image analysis processing P2 inFig. 24 , the image analysis processing P3 firstly inputs an X-ray CT image (SP1) and executes binarization processing (SP2), overlapping area extraction processing (SP3), and overlapping area morphological analysis processing (SP14). Under this circumstance, during the overlapping area morphological analysis processing, not only the form of the overlapping area is analyzed, but also an abnormal orientation of fiber bundles is detected. Next, in the same manner as the corresponding processing of the image analysis processing P1 inFig. 3 , reference direction determination processing (SP4), Z-yarn removal processing (SP5), and fiber bundle orientation estimation processing (SP6) are executed on an area including the detected abnormal orientation of the fiber bundles. - In this way, the problem in the orientation of the fiber bundles can be analyzed more efficiently and in detail by applying the image analysis processing P2, whose processing time is short, to, for example, the X-ray CT image which is the examination target, and applying the image analysis processing P1, whose processing time is relatively long and which performs detailed analysis, on the area including the abnormal orientation of the fiber bundles which is detected by the image analysis processing P2.
-
- 1
- image analysis apparatus
- 11
- CPU
- 12
- input unit
- 13
- storage unit
- 14
- display unit
- 15
- memory
- 151
- binarization unit
- 152
- overlapping area extraction unit
- 153
- reference direction determination unit
- 154
- Z-yarn removal unit
- 155
- fiber bundle orientation estimation unit
- 2
- image analysis apparatus
- 21
- pillar
- 253
- overlapping area morphological analysis unit
- 3
- image analysis apparatus
Claims (11)
- An image analysis apparatus (1) for analyzing orientations of fiber bundles of X-yarns and Y-yarns from a three-dimensional image derived from X-ray computer tomography of a woven fabric made of fiber bundles of the X-yarns, the Y-yarns, and Z-yarns, the image analysis apparatus (1) comprising:a binarization unit (151) that binarizes the three-dimensional image; andan overlapping area extraction unit (152) that extracts an overlapping area, in which the X-yarns and the Y-yarns perpendicularly and three-dimensionally intersect with each other, from the binarized image;the image analysis apparatus (1) is characterized by comprising:a reference direction determination unit (153) that averages an overlapping direction of each voxel included in the overlapping area and determines the averaged direction as a reference direction;a Z-yarn removal unit (154) that removes the Z-yarns from the binarized image by applying a directional distance method on a reference plane perpendicular to the reference direction; anda fiber bundle orientation estimation unit (155) that applies the directional distance method again to the image, from which the Z-yarns have been removed, on the reference plane and estimates the orientations of the fiber bundles of the X-yarns andthe Y-yarns on the basis of a directional distance calculated upon the application.
- The image analysis apparatus (1) according to claim 1, wherein the binarization unit (151):binarizes the three-dimensional image on the basis of a specified threshold value; andexecutes closing processing on the image after the binarization.
- The image analysis apparatus (1) according to claim 2,
wherein the overlapping area extraction unit (152):executes opening processing on the image after the closing processing;executes dilation processing on the image after the opening processing; andextracts the overlapping area by calculating a product set of the image after the dilation processing and the image after the closing processing. - The image analysis apparatus (1) according to any one of claims 1 to 3,
wherein the reference direction determination unit (153):applies the directional distance method to the overlapping area and estimates the overlapping direction of each voxel included in the overlapping area on the basis of the directional distance of each voxel calculated upon the application;extracts a central area by executing erosion processing on the overlapping area; andaverages the overlapping direction of each voxel included in the central area anddetermines the averaged direction as the reference direction. - The image analysis apparatus (1) according to any one of claims 1 to 4,
wherein the Z-yarn removal unit (154):applies the directional distance method on the reference plane and calculates an eigenvector for a second largest eigen value of a directional tensor on the basis of the directional distance of each voxel which is calculated upon the application;separates the binarized image into an area of the X-yarns or the Y-yarns and an area of the Z-yarns on the basis of the eigenvector; andremoves the Z-yarns from the binarized image by removing voxels included in the Z-yarns area. - The image analysis apparatus (1) according to claim 5,wherein upon calculating a directional distance of a voxel of interest, the Z-yarn removal unit proceeds with voxels in a direction indicated by an eigenvector of the voxel of interest and a direction opposite to the direction indicated by the eigenvector;and when the Z-yarn removal unit (154) reaches a background or an angle formed with a direction indicated by an eigenvector of a next voxel to proceed is larger than a specified threshold value, the Z-yarn removal unit (154) stops proceeding andcalculates a distance between respective last reached voxels as a conditional directional distance; andthe Z-yarn removal unit (154) separates the binarized image into the area of the X-yarns or the Y-yarns and the area of the Z-yarns on the basis of the conditional directional distance.
- The image analysis apparatus (1) according to any one of claims 1 to 6,
wherein the Z-yarn removal unit (154):executes dilation processing after removing the Z-yarns from the binarized image;and calculates a product set of the image after the dilation processing and the image before the dilation processing. - The image analysis apparatus (1) according to any one of claims 1 to 7, wherein the fiber bundle orientation estimation unit (155):applies the directional distance method again to the image, from which the Z-yarns have been removed, on the reference plane and estimates the orientations of the fiber bundles of the X-yarns and the Y-yarns;extracts voxels in a vicinity of a central part from among the voxels for which the orientations of the fiber bundles are estimated;executes clustering processing on the voxels in the vicinity of the central part; andeliminates noise by deleting a cluster in which a minimum voxel belongs.
- The image analysis apparatus (1) according to any one of claims 1 to 8, comprising a display unit 14) that displays an image showing the orientations of the fiber bundles of the X-yarns and the Y-yarns.
- An image analysis method for analyzing orientations of fiber bundles of X-yarns and Y-yarns from a three-dimensional image derived from X-ray computer tomography of a woven fabric made of fiber bundles of the X-yarns, the Y-yarns, and Z-yarns, the image analysis method comprising the following steps executed by a computer (1):a first step of binarizing the three-dimensional image;a second step of extracting an overlapping area, in which the X-yarns and the Y-yarns perpendicularly and three-dimensionally intersect with each other, from the binarized image;a third step of averaging an overlapping direction of each voxel included in the overlapping area and determining the averaged direction as a reference direction;a fourth step of removing the Z-yarns from the binarized image by applying a directional distance method on a reference plane perpendicular to the reference direction; anda fifth step of applying the directional distance method again to the image, from which the Z-yarns have been removed, on the reference plane and estimating the orientations of the fiber bundles of the X-yarns and the Y-yarns on the basis of a directional distance calculated upon the application.
- A program for analyzing orientations of fiber bundles of X-yarns and Y-yarns from a three-dimensional image derived from X-ray computer tomography of a woven fabric made of fiber bundles of the X-yarns, the Y-yarns, and Z-yarns,
the program causing a computer to execute:a first step of binarizing the three-dimensional image;a second step of extracting an overlapping area, in which the X-yarns and the Y-yarns perpendicularly and three-dimensionally intersect with each other, from the binarized image;a third step of averaging an overlapping direction of each voxel included in the overlapping area and determining the averaged direction as a reference direction;a fourth step of removing the Z-yarns from the binarized image by applying a directional distance method on a reference plane perpendicular to the reference direction; anda fifth step of applying the directional distance method again to the image, from which the Z-yarns have been removed, on the reference plane and estimating the orientations of the fiber bundles of the X-yarns and the Y-yarns on the basis of a directional distance calculated upon the application.
Applications Claiming Priority (2)
| Application Number | Priority Date | Filing Date | Title |
|---|---|---|---|
| JP2014199406 | 2014-09-29 | ||
| PCT/JP2015/077472 WO2016052489A1 (en) | 2014-09-29 | 2015-09-29 | Image analysis device, image analysis method, and program |
Publications (3)
| Publication Number | Publication Date |
|---|---|
| EP3203218A1 EP3203218A1 (en) | 2017-08-09 |
| EP3203218A4 EP3203218A4 (en) | 2018-06-06 |
| EP3203218B1 true EP3203218B1 (en) | 2022-02-23 |
Family
ID=55630516
Family Applications (1)
| Application Number | Title | Priority Date | Filing Date |
|---|---|---|---|
| EP15846683.9A Active EP3203218B1 (en) | 2014-09-29 | 2015-09-29 | Image analysis device, image analysis method, and program |
Country Status (6)
| Country | Link |
|---|---|
| US (1) | US10068349B2 (en) |
| EP (1) | EP3203218B1 (en) |
| JP (1) | JP6152488B2 (en) |
| CN (1) | CN107148569B (en) |
| CA (1) | CA2961455C (en) |
| WO (1) | WO2016052489A1 (en) |
Families Citing this family (9)
| Publication number | Priority date | Publication date | Assignee | Title |
|---|---|---|---|---|
| JP7154535B2 (en) * | 2018-07-04 | 2022-10-18 | 国立大学法人 東京大学 | Dimensional measurement method using projection image obtained by X-ray CT device |
| JP7157322B2 (en) * | 2018-09-28 | 2022-10-20 | 澁谷工業株式会社 | Article inspection device and article inspection method |
| IT201800009746A1 (en) * | 2018-10-24 | 2020-04-24 | Vision Device Srl | METHOD OF RECOGNIZING REFERENCE POINTS IN A FABRIC |
| CN111986143B (en) * | 2020-07-06 | 2021-09-21 | 南京航空航天大学 | Mesoscopic structure characterization method of ceramic matrix composite material |
| JP7425423B2 (en) | 2020-08-18 | 2024-01-31 | 株式会社Ihi | System for evaluating fiber bundle distribution in fiber reinforced materials |
| JP7464150B2 (en) | 2020-12-28 | 2024-04-09 | 株式会社Ihi | Identification device, identification method, and identification program for identifying fiber layers in fiber-reinforced material |
| EP4276740A1 (en) * | 2021-01-06 | 2023-11-15 | Toyobo Co., Ltd. | Analysis method for images of fiber-containing products and program and analysis device therefor |
| WO2023133416A1 (en) * | 2022-01-04 | 2023-07-13 | Ohio State Innovation Foundation | Detecting 3d model clones in mobile games |
| CN114693680A (en) * | 2022-05-31 | 2022-07-01 | 季华实验室 | Method for detecting textile fibers, electronic device and computer-readable storage medium |
Family Cites Families (26)
| Publication number | Priority date | Publication date | Assignee | Title |
|---|---|---|---|---|
| US6526305B1 (en) * | 1998-11-25 | 2003-02-25 | The Johns Hopkins University | Method of fiber reconstruction employing data acquired by magnetic resonance imaging |
| CA2354301A1 (en) * | 2001-07-27 | 2003-01-27 | Djamel Yahia Meddah | Geometric hashing for model-based recognition of an object |
| JP4172941B2 (en) * | 2002-03-01 | 2008-10-29 | 日立ソフトウエアエンジニアリング株式会社 | Land parcel data creation method and apparatus |
| EP1851720B1 (en) * | 2005-02-11 | 2009-07-29 | Koninklijke Philips Electronics N.V. | Method of automatic extraction of the pulmonary artery tree from 3d medical images |
| US7983462B2 (en) * | 2005-11-22 | 2011-07-19 | Purdue Research Foundation | Methods and systems for improving quality of an image |
| US7822254B2 (en) * | 2006-04-21 | 2010-10-26 | Siemens Medical Solutions Usa, Inc. | Automatic positioning of matching multi-planar image reformatting (MPR) views of multiple 3D medical images |
| US7639253B2 (en) * | 2006-07-13 | 2009-12-29 | Inus Technology, Inc. | System and method for automatic 3D scan data alignment |
| US7949162B2 (en) * | 2006-08-14 | 2011-05-24 | Siemens Medical Solutions Usa, Inc. | System and method for solid component evaluation in mixed ground glass nodules |
| JP4972751B2 (en) * | 2006-11-27 | 2012-07-11 | 株式会社日立製作所 | Nerve fiber bundle measuring system and image processing system |
| GB0708621D0 (en) * | 2007-05-04 | 2007-06-13 | Univ Manchester | Image processing method |
| US20090034810A1 (en) * | 2007-08-03 | 2009-02-05 | Fujifilm Corporation | Abnormal tissue pattern detection apparatus, method and program |
| US8275194B2 (en) * | 2008-02-15 | 2012-09-25 | Microsoft Corporation | Site modeling using image data fusion |
| JP2011525271A (en) * | 2008-05-23 | 2011-09-15 | ザ オーストラリアン ナショナル ユニヴァーシティ | Image data processing |
| US8885926B2 (en) * | 2009-04-15 | 2014-11-11 | Massachusetts Institute Of Technology | Image and data segmentation |
| JP5538868B2 (en) * | 2009-12-22 | 2014-07-02 | キヤノン株式会社 | Image processing apparatus, image processing method and program |
| US20110304619A1 (en) * | 2010-06-10 | 2011-12-15 | Autodesk, Inc. | Primitive quadric surface extraction from unorganized point cloud data |
| JP5475561B2 (en) | 2010-06-14 | 2014-04-16 | ポリプラスチックス株式会社 | Filler orientation analysis method |
| WO2013040673A1 (en) * | 2011-09-19 | 2013-03-28 | The University Of British Columbia | Method and systems for interactive 3d image segmentation |
| CN104066876A (en) * | 2011-12-27 | 2014-09-24 | 昭和电工株式会社 | Method for producing carbon fiber |
| US20130167374A1 (en) * | 2011-12-29 | 2013-07-04 | General Electric Company | Process of producing ceramic matrix composites and ceramic matrix composites formed thereby |
| US20150254850A1 (en) * | 2012-09-07 | 2015-09-10 | Aalborg Universitet | System for detecting blood vessel structures in medical images |
| CN103903298B (en) * | 2012-12-27 | 2017-03-01 | 同方威视技术股份有限公司 | Three-dimensional data is processed and recognition methodss |
| CN103900503B (en) * | 2012-12-27 | 2016-12-28 | 清华大学 | Extract the method for shape facility, safety detection method and equipment |
| US9443297B2 (en) * | 2013-07-10 | 2016-09-13 | Cognex Corporation | System and method for selective determination of point clouds |
| JP6118698B2 (en) * | 2013-09-30 | 2017-04-19 | 株式会社Ihi | Image analysis apparatus and program |
| JP6118699B2 (en) * | 2013-09-30 | 2017-04-19 | 株式会社Ihi | Image analysis apparatus and program |
-
2015
- 2015-09-29 US US15/514,712 patent/US10068349B2/en active Active
- 2015-09-29 WO PCT/JP2015/077472 patent/WO2016052489A1/en active Application Filing
- 2015-09-29 CA CA2961455A patent/CA2961455C/en active Active
- 2015-09-29 CN CN201580051215.9A patent/CN107148569B/en active Active
- 2015-09-29 EP EP15846683.9A patent/EP3203218B1/en active Active
- 2015-09-29 JP JP2016552053A patent/JP6152488B2/en active Active
Also Published As
| Publication number | Publication date |
|---|---|
| EP3203218A4 (en) | 2018-06-06 |
| CN107148569B (en) | 2020-01-03 |
| CN107148569A (en) | 2017-09-08 |
| WO2016052489A1 (en) | 2016-04-07 |
| US20170213357A1 (en) | 2017-07-27 |
| CA2961455A1 (en) | 2016-04-07 |
| CA2961455C (en) | 2019-09-24 |
| EP3203218A1 (en) | 2017-08-09 |
| JP6152488B2 (en) | 2017-06-21 |
| JPWO2016052489A1 (en) | 2017-04-27 |
| US10068349B2 (en) | 2018-09-04 |
Similar Documents
| Publication | Publication Date | Title |
|---|---|---|
| EP3203218B1 (en) | Image analysis device, image analysis method, and program | |
| EP3054286B1 (en) | Image analysing apparatus and method | |
| Chen et al. | Image-based framework for concrete surface crack monitoring and quantification | |
| Blanc et al. | Fiber orientation measurements in composite materials | |
| US9943277B2 (en) | Detecting coronary stenosis through spatio-temporal tracking | |
| Wang et al. | Novel 4-D open-curve active contour and curve completion approach for automated tree structure extraction | |
| DE102008023283B4 (en) | Method and system for segmenting tubular structures in 3D images | |
| US7848571B2 (en) | Computer-implemented method for efficient image segmentation using automated saddle-point detection | |
| US20160117797A1 (en) | Image Processing Apparatus and Image Processing Method | |
| Mendoza et al. | Differentiating 3D textile composites: A novel field of application for Digital Volume Correlation | |
| Mendoza et al. | The correlation framework: Bridging the gap between modeling and analysis for 3D woven composites | |
| CN105980838A (en) | Method for defect indication detection | |
| JP6681221B2 (en) | Structure analysis device, structure analysis method, and three-dimensional woven fiber material manufacturing method | |
| Merveille et al. | Tubular structure filtering by ranking orientation responses of path operators | |
| Yang et al. | Fast computation of Hessian-based enhancement filters for medical images | |
| Amjad et al. | Computationally efficient method of tracking fibres in composite materials using digital image correlation | |
| EP2827298A1 (en) | Method and computer program for filtering and particularly segmenting and/or analyzing anatomic structures in a digital image | |
| Kärkkäinen et al. | A stochastic shape and orientation model for fibres with an application to carbon nanotubes | |
| Xiao et al. | A derivative of stick filter for pulmonary fissure detection in CT images | |
| WO2017010119A1 (en) | Technique for normalizing scintigraphy image | |
| CN108780587A (en) | By correcting the lossless detection method carried out | |
| JP6578375B2 (en) | Image processing apparatus and image processing method | |
| JP5352303B2 (en) | Image processing apparatus and method, and program | |
| Hadhazi et al. | Digital chest tomosynthesis: The main steps to a computer assisted lung diagnostic system | |
| Prckovska et al. | Classification of non-Gaussian diffusion profiles for HARDI data simplification |
Legal Events
| Date | Code | Title | Description |
|---|---|---|---|
| STAA | Information on the status of an ep patent application or granted ep patent |
Free format text: STATUS: THE INTERNATIONAL PUBLICATION HAS BEEN MADE |
|
| PUAI | Public reference made under article 153(3) epc to a published international application that has entered the european phase |
Free format text: ORIGINAL CODE: 0009012 |
|
| STAA | Information on the status of an ep patent application or granted ep patent |
Free format text: STATUS: REQUEST FOR EXAMINATION WAS MADE |
|
| 17P | Request for examination filed |
Effective date: 20170502 |
|
| AK | Designated contracting states |
Kind code of ref document: A1 Designated state(s): AL AT BE BG CH CY CZ DE DK EE ES FI FR GB GR HR HU IE IS IT LI LT LU LV MC MK MT NL NO PL PT RO RS SE SI SK SM TR |
|
| AX | Request for extension of the european patent |
Extension state: BA ME |
|
| DAV | Request for validation of the european patent (deleted) | ||
| DAX | Request for extension of the european patent (deleted) | ||
| A4 | Supplementary search report drawn up and despatched |
Effective date: 20180508 |
|
| RIC1 | Information provided on ipc code assigned before grant |
Ipc: G01N 23/046 20180101ALI20180502BHEP Ipc: G01N 21/84 20060101ALI20180502BHEP Ipc: G06T 7/73 20170101ALI20180502BHEP Ipc: G06T 7/60 20170101ALI20180502BHEP Ipc: D06H 3/08 20060101AFI20180502BHEP Ipc: G01N 21/88 20060101ALI20180502BHEP |
|
| REG | Reference to a national code |
Ref country code: DE Ref legal event code: R079 Ref document number: 602015077141 Country of ref document: DE Free format text: PREVIOUS MAIN CLASS: G01N0023040000 Ipc: D06H0003080000 |
|
| RIC1 | Information provided on ipc code assigned before grant |
Ipc: D06H 3/08 20060101AFI20210705BHEP Ipc: G06T 7/60 20170101ALI20210705BHEP Ipc: G01N 23/046 20180101ALI20210705BHEP Ipc: G01N 21/84 20060101ALI20210705BHEP Ipc: G01N 21/88 20060101ALI20210705BHEP Ipc: G06T 7/73 20170101ALI20210705BHEP |
|
| GRAP | Despatch of communication of intention to grant a patent |
Free format text: ORIGINAL CODE: EPIDOSNIGR1 |
|
| STAA | Information on the status of an ep patent application or granted ep patent |
Free format text: STATUS: GRANT OF PATENT IS INTENDED |
|
| INTG | Intention to grant announced |
Effective date: 20210915 |
|
| GRAS | Grant fee paid |
Free format text: ORIGINAL CODE: EPIDOSNIGR3 |
|
| GRAA | (expected) grant |
Free format text: ORIGINAL CODE: 0009210 |
|
| STAA | Information on the status of an ep patent application or granted ep patent |
Free format text: STATUS: THE PATENT HAS BEEN GRANTED |
|
| AK | Designated contracting states |
Kind code of ref document: B1 Designated state(s): AL AT BE BG CH CY CZ DE DK EE ES FI FR GB GR HR HU IE IS IT LI LT LU LV MC MK MT NL NO PL PT RO RS SE SI SK SM TR |
|
| REG | Reference to a national code |
Ref country code: GB Ref legal event code: FG4D |
|
| REG | Reference to a national code |
Ref country code: CH Ref legal event code: EP |
|
| REG | Reference to a national code |
Ref country code: DE Ref legal event code: R096 Ref document number: 602015077141 Country of ref document: DE |
|
| REG | Reference to a national code |
Ref country code: AT Ref legal event code: REF Ref document number: 1470557 Country of ref document: AT Kind code of ref document: T Effective date: 20220315 |
|
| REG | Reference to a national code |
Ref country code: IE Ref legal event code: FG4D |
|
| REG | Reference to a national code |
Ref country code: LT Ref legal event code: MG9D |
|
| REG | Reference to a national code |
Ref country code: NL Ref legal event code: MP Effective date: 20220223 |
|
| REG | Reference to a national code |
Ref country code: AT Ref legal event code: MK05 Ref document number: 1470557 Country of ref document: AT Kind code of ref document: T Effective date: 20220223 |
|
| PG25 | Lapsed in a contracting state [announced via postgrant information from national office to epo] |
Ref country code: SE Free format text: LAPSE BECAUSE OF FAILURE TO SUBMIT A TRANSLATION OF THE DESCRIPTION OR TO PAY THE FEE WITHIN THE PRESCRIBED TIME-LIMIT Effective date: 20220223 Ref country code: RS Free format text: LAPSE BECAUSE OF FAILURE TO SUBMIT A TRANSLATION OF THE DESCRIPTION OR TO PAY THE FEE WITHIN THE PRESCRIBED TIME-LIMIT Effective date: 20220223 Ref country code: PT Free format text: LAPSE BECAUSE OF FAILURE TO SUBMIT A TRANSLATION OF THE DESCRIPTION OR TO PAY THE FEE WITHIN THE PRESCRIBED TIME-LIMIT Effective date: 20220623 Ref country code: NO Free format text: LAPSE BECAUSE OF FAILURE TO SUBMIT A TRANSLATION OF THE DESCRIPTION OR TO PAY THE FEE WITHIN THE PRESCRIBED TIME-LIMIT Effective date: 20220523 Ref country code: NL Free format text: LAPSE BECAUSE OF FAILURE TO SUBMIT A TRANSLATION OF THE DESCRIPTION OR TO PAY THE FEE WITHIN THE PRESCRIBED TIME-LIMIT Effective date: 20220223 Ref country code: LT Free format text: LAPSE BECAUSE OF FAILURE TO SUBMIT A TRANSLATION OF THE DESCRIPTION OR TO PAY THE FEE WITHIN THE PRESCRIBED TIME-LIMIT Effective date: 20220223 Ref country code: HR Free format text: LAPSE BECAUSE OF FAILURE TO SUBMIT A TRANSLATION OF THE DESCRIPTION OR TO PAY THE FEE WITHIN THE PRESCRIBED TIME-LIMIT Effective date: 20220223 Ref country code: ES Free format text: LAPSE BECAUSE OF FAILURE TO SUBMIT A TRANSLATION OF THE DESCRIPTION OR TO PAY THE FEE WITHIN THE PRESCRIBED TIME-LIMIT Effective date: 20220223 Ref country code: BG Free format text: LAPSE BECAUSE OF FAILURE TO SUBMIT A TRANSLATION OF THE DESCRIPTION OR TO PAY THE FEE WITHIN THE PRESCRIBED TIME-LIMIT Effective date: 20220523 |
|
| PG25 | Lapsed in a contracting state [announced via postgrant information from national office to epo] |
Ref country code: PL Free format text: LAPSE BECAUSE OF FAILURE TO SUBMIT A TRANSLATION OF THE DESCRIPTION OR TO PAY THE FEE WITHIN THE PRESCRIBED TIME-LIMIT Effective date: 20220223 Ref country code: LV Free format text: LAPSE BECAUSE OF FAILURE TO SUBMIT A TRANSLATION OF THE DESCRIPTION OR TO PAY THE FEE WITHIN THE PRESCRIBED TIME-LIMIT Effective date: 20220223 Ref country code: GR Free format text: LAPSE BECAUSE OF FAILURE TO SUBMIT A TRANSLATION OF THE DESCRIPTION OR TO PAY THE FEE WITHIN THE PRESCRIBED TIME-LIMIT Effective date: 20220524 Ref country code: FI Free format text: LAPSE BECAUSE OF FAILURE TO SUBMIT A TRANSLATION OF THE DESCRIPTION OR TO PAY THE FEE WITHIN THE PRESCRIBED TIME-LIMIT Effective date: 20220223 Ref country code: AT Free format text: LAPSE BECAUSE OF FAILURE TO SUBMIT A TRANSLATION OF THE DESCRIPTION OR TO PAY THE FEE WITHIN THE PRESCRIBED TIME-LIMIT Effective date: 20220223 |
|
| PG25 | Lapsed in a contracting state [announced via postgrant information from national office to epo] |
Ref country code: IS Free format text: LAPSE BECAUSE OF FAILURE TO SUBMIT A TRANSLATION OF THE DESCRIPTION OR TO PAY THE FEE WITHIN THE PRESCRIBED TIME-LIMIT Effective date: 20220623 |
|
| PG25 | Lapsed in a contracting state [announced via postgrant information from national office to epo] |
Ref country code: SM Free format text: LAPSE BECAUSE OF FAILURE TO SUBMIT A TRANSLATION OF THE DESCRIPTION OR TO PAY THE FEE WITHIN THE PRESCRIBED TIME-LIMIT Effective date: 20220223 Ref country code: SK Free format text: LAPSE BECAUSE OF FAILURE TO SUBMIT A TRANSLATION OF THE DESCRIPTION OR TO PAY THE FEE WITHIN THE PRESCRIBED TIME-LIMIT Effective date: 20220223 Ref country code: RO Free format text: LAPSE BECAUSE OF FAILURE TO SUBMIT A TRANSLATION OF THE DESCRIPTION OR TO PAY THE FEE WITHIN THE PRESCRIBED TIME-LIMIT Effective date: 20220223 Ref country code: EE Free format text: LAPSE BECAUSE OF FAILURE TO SUBMIT A TRANSLATION OF THE DESCRIPTION OR TO PAY THE FEE WITHIN THE PRESCRIBED TIME-LIMIT Effective date: 20220223 Ref country code: DK Free format text: LAPSE BECAUSE OF FAILURE TO SUBMIT A TRANSLATION OF THE DESCRIPTION OR TO PAY THE FEE WITHIN THE PRESCRIBED TIME-LIMIT Effective date: 20220223 Ref country code: CZ Free format text: LAPSE BECAUSE OF FAILURE TO SUBMIT A TRANSLATION OF THE DESCRIPTION OR TO PAY THE FEE WITHIN THE PRESCRIBED TIME-LIMIT Effective date: 20220223 |
|
| REG | Reference to a national code |
Ref country code: DE Ref legal event code: R097 Ref document number: 602015077141 Country of ref document: DE |
|
| PG25 | Lapsed in a contracting state [announced via postgrant information from national office to epo] |
Ref country code: AL Free format text: LAPSE BECAUSE OF FAILURE TO SUBMIT A TRANSLATION OF THE DESCRIPTION OR TO PAY THE FEE WITHIN THE PRESCRIBED TIME-LIMIT Effective date: 20220223 |
|
| PLBE | No opposition filed within time limit |
Free format text: ORIGINAL CODE: 0009261 |
|
| STAA | Information on the status of an ep patent application or granted ep patent |
Free format text: STATUS: NO OPPOSITION FILED WITHIN TIME LIMIT |
|
| 26N | No opposition filed |
Effective date: 20221124 |
|
| PG25 | Lapsed in a contracting state [announced via postgrant information from national office to epo] |
Ref country code: SI Free format text: LAPSE BECAUSE OF FAILURE TO SUBMIT A TRANSLATION OF THE DESCRIPTION OR TO PAY THE FEE WITHIN THE PRESCRIBED TIME-LIMIT Effective date: 20220223 |
|
| REG | Reference to a national code |
Ref country code: DE Ref legal event code: R119 Ref document number: 602015077141 Country of ref document: DE |
|
| PG25 | Lapsed in a contracting state [announced via postgrant information from national office to epo] |
Ref country code: MC Free format text: LAPSE BECAUSE OF FAILURE TO SUBMIT A TRANSLATION OF THE DESCRIPTION OR TO PAY THE FEE WITHIN THE PRESCRIBED TIME-LIMIT Effective date: 20220223 |
|
| REG | Reference to a national code |
Ref country code: CH Ref legal event code: PL |
|
| REG | Reference to a national code |
Ref country code: BE Ref legal event code: MM Effective date: 20220930 |
|
| PG25 | Lapsed in a contracting state [announced via postgrant information from national office to epo] |
Ref country code: LU Free format text: LAPSE BECAUSE OF NON-PAYMENT OF DUE FEES Effective date: 20220929 |
|
| PG25 | Lapsed in a contracting state [announced via postgrant information from national office to epo] |
Ref country code: LI Free format text: LAPSE BECAUSE OF NON-PAYMENT OF DUE FEES Effective date: 20220930 Ref country code: IT Free format text: LAPSE BECAUSE OF FAILURE TO SUBMIT A TRANSLATION OF THE DESCRIPTION OR TO PAY THE FEE WITHIN THE PRESCRIBED TIME-LIMIT Effective date: 20220223 Ref country code: IE Free format text: LAPSE BECAUSE OF NON-PAYMENT OF DUE FEES Effective date: 20220929 Ref country code: FR Free format text: LAPSE BECAUSE OF NON-PAYMENT OF DUE FEES Effective date: 20220930 Ref country code: DE Free format text: LAPSE BECAUSE OF NON-PAYMENT OF DUE FEES Effective date: 20230401 Ref country code: CH Free format text: LAPSE BECAUSE OF NON-PAYMENT OF DUE FEES Effective date: 20220930 |
|
| PG25 | Lapsed in a contracting state [announced via postgrant information from national office to epo] |
Ref country code: BE Free format text: LAPSE BECAUSE OF NON-PAYMENT OF DUE FEES Effective date: 20220930 |
|
| PGFP | Annual fee paid to national office [announced via postgrant information from national office to epo] |
Ref country code: GB Payment date: 20230810 Year of fee payment: 9 |
|
| PG25 | Lapsed in a contracting state [announced via postgrant information from national office to epo] |
Ref country code: HU Free format text: LAPSE BECAUSE OF FAILURE TO SUBMIT A TRANSLATION OF THE DESCRIPTION OR TO PAY THE FEE WITHIN THE PRESCRIBED TIME-LIMIT; INVALID AB INITIO Effective date: 20150929 |