EP3066236B1 - Cell-free nucleic acids for the analysis of the human microbiome and components thereof - Google Patents
Cell-free nucleic acids for the analysis of the human microbiome and components thereof Download PDFInfo
- Publication number
- EP3066236B1 EP3066236B1 EP14860535.5A EP14860535A EP3066236B1 EP 3066236 B1 EP3066236 B1 EP 3066236B1 EP 14860535 A EP14860535 A EP 14860535A EP 3066236 B1 EP3066236 B1 EP 3066236B1
- Authority
- EP
- European Patent Office
- Prior art keywords
- nucleic acids
- cell
- microbial
- transplant
- sequences
- Prior art date
- Legal status (The legal status is an assumption and is not a legal conclusion. Google has not performed a legal analysis and makes no representation as to the accuracy of the status listed.)
- Active
Links
- 150000007523 nucleic acids Chemical class 0.000 title claims description 163
- 102000039446 nucleic acids Human genes 0.000 title claims description 160
- 108020004707 nucleic acids Proteins 0.000 title claims description 160
- 238000004458 analytical method Methods 0.000 title description 39
- 244000005702 human microbiome Species 0.000 title description 2
- 238000000034 method Methods 0.000 claims description 123
- 244000005700 microbiome Species 0.000 claims description 106
- 108020004414 DNA Proteins 0.000 claims description 77
- 230000000813 microbial effect Effects 0.000 claims description 75
- 208000015181 infectious disease Diseases 0.000 claims description 63
- 238000012163 sequencing technique Methods 0.000 claims description 57
- 238000011282 treatment Methods 0.000 claims description 38
- 210000004369 blood Anatomy 0.000 claims description 33
- 239000008280 blood Substances 0.000 claims description 33
- 210000002381 plasma Anatomy 0.000 claims description 31
- 210000004072 lung Anatomy 0.000 claims description 29
- 238000002560 therapeutic procedure Methods 0.000 claims description 26
- 108091032973 (ribonucleotides)n+m Proteins 0.000 claims description 24
- 241000894007 species Species 0.000 claims description 21
- 230000003321 amplification Effects 0.000 claims description 20
- 238000003199 nucleic acid amplification method Methods 0.000 claims description 20
- 230000036541 health Effects 0.000 claims description 18
- 241000894006 Bacteria Species 0.000 claims description 17
- 102000053602 DNA Human genes 0.000 claims description 15
- 238000012165 high-throughput sequencing Methods 0.000 claims description 14
- 230000007918 pathogenicity Effects 0.000 claims description 13
- 241000233866 Fungi Species 0.000 claims description 11
- 238000003766 bioinformatics method Methods 0.000 claims description 11
- 230000004044 response Effects 0.000 claims description 11
- 239000003153 chemical reaction reagent Substances 0.000 claims description 9
- 108020004682 Single-Stranded DNA Proteins 0.000 claims description 8
- 210000002966 serum Anatomy 0.000 claims description 8
- 230000000873 masking effect Effects 0.000 claims description 6
- 238000013507 mapping Methods 0.000 claims description 5
- 244000045947 parasite Species 0.000 claims description 5
- 210000003296 saliva Anatomy 0.000 claims description 5
- 210000001175 cerebrospinal fluid Anatomy 0.000 claims description 4
- 238000000605 extraction Methods 0.000 claims description 4
- 230000028327 secretion Effects 0.000 claims description 3
- 102000040650 (ribonucleotides)n+m Human genes 0.000 claims description 2
- 230000003362 replicative effect Effects 0.000 claims description 2
- 230000000241 respiratory effect Effects 0.000 claims description 2
- 210000001179 synovial fluid Anatomy 0.000 claims description 2
- 239000000523 sample Substances 0.000 description 87
- 241001339993 Anelloviridae Species 0.000 description 52
- 230000001506 immunosuppresive effect Effects 0.000 description 49
- 230000003612 virological effect Effects 0.000 description 49
- 239000000203 mixture Substances 0.000 description 46
- 244000000001 Virome Species 0.000 description 44
- 239000003814 drug Substances 0.000 description 44
- 241000700605 Viruses Species 0.000 description 38
- 229940079593 drug Drugs 0.000 description 38
- 206010062016 Immunosuppression Diseases 0.000 description 35
- 239000003018 immunosuppressive agent Substances 0.000 description 35
- 241000701022 Cytomegalovirus Species 0.000 description 34
- 230000001580 bacterial effect Effects 0.000 description 30
- 210000000056 organ Anatomy 0.000 description 30
- 210000002216 heart Anatomy 0.000 description 29
- QJJXYPPXXYFBGM-SHYZHZOCSA-N tacrolimus Natural products CO[C@H]1C[C@H](CC[C@@H]1O)C=C(C)[C@H]2OC(=O)[C@H]3CCCCN3C(=O)C(=O)[C@@]4(O)O[C@@H]([C@H](C[C@H]4C)OC)[C@@H](C[C@H](C)CC(=C[C@@H](CC=C)C(=O)C[C@H](O)[C@H]2C)C)OC QJJXYPPXXYFBGM-SHYZHZOCSA-N 0.000 description 29
- QJJXYPPXXYFBGM-LFZNUXCKSA-N Tacrolimus Chemical compound C1C[C@@H](O)[C@H](OC)C[C@@H]1\C=C(/C)[C@@H]1[C@H](C)[C@@H](O)CC(=O)[C@H](CC=C)/C=C(C)/C[C@H](C)C[C@H](OC)[C@H]([C@H](C[C@H]2C)OC)O[C@@]2(O)C(=O)C(=O)N2CCCC[C@H]2C(=O)O1 QJJXYPPXXYFBGM-LFZNUXCKSA-N 0.000 description 27
- 229960003444 immunosuppressant agent Drugs 0.000 description 27
- 229960001967 tacrolimus Drugs 0.000 description 27
- 238000012360 testing method Methods 0.000 description 24
- 238000002054 transplantation Methods 0.000 description 24
- 239000003443 antiviral agent Substances 0.000 description 23
- 238000001514 detection method Methods 0.000 description 22
- 125000003729 nucleotide group Chemical group 0.000 description 22
- 208000037265 diseases, disorders, signs and symptoms Diseases 0.000 description 21
- 206010052779 Transplant rejections Diseases 0.000 description 20
- 230000006870 function Effects 0.000 description 20
- 230000000840 anti-viral effect Effects 0.000 description 19
- 230000035945 sensitivity Effects 0.000 description 19
- 238000001574 biopsy Methods 0.000 description 18
- 238000011321 prophylaxis Methods 0.000 description 18
- 238000012544 monitoring process Methods 0.000 description 17
- 241000960387 Torque teno virus Species 0.000 description 15
- WPVFJKSGQUFQAP-GKAPJAKFSA-N Valcyte Chemical compound N1C(N)=NC(=O)C2=C1N(COC(CO)COC(=O)[C@@H](N)C(C)C)C=N2 WPVFJKSGQUFQAP-GKAPJAKFSA-N 0.000 description 15
- 201000010099 disease Diseases 0.000 description 15
- 239000002773 nucleotide Substances 0.000 description 15
- 244000052769 pathogen Species 0.000 description 15
- 210000001519 tissue Anatomy 0.000 description 15
- 229960002149 valganciclovir Drugs 0.000 description 15
- 230000001154 acute effect Effects 0.000 description 14
- 210000004027 cell Anatomy 0.000 description 14
- 230000001861 immunosuppressant effect Effects 0.000 description 13
- 238000005259 measurement Methods 0.000 description 13
- 238000003753 real-time PCR Methods 0.000 description 13
- 238000003556 assay Methods 0.000 description 12
- 230000001717 pathogenic effect Effects 0.000 description 12
- PMATZTZNYRCHOR-CGLBZJNRSA-N Cyclosporin A Chemical compound CC[C@@H]1NC(=O)[C@H]([C@H](O)[C@H](C)C\C=C\C)N(C)C(=O)[C@H](C(C)C)N(C)C(=O)[C@H](CC(C)C)N(C)C(=O)[C@H](CC(C)C)N(C)C(=O)[C@@H](C)NC(=O)[C@H](C)NC(=O)[C@H](CC(C)C)N(C)C(=O)[C@H](C(C)C)NC(=O)[C@H](CC(C)C)N(C)C(=O)CN(C)C1=O PMATZTZNYRCHOR-CGLBZJNRSA-N 0.000 description 11
- 108010036949 Cyclosporine Proteins 0.000 description 11
- 206010028980 Neoplasm Diseases 0.000 description 11
- 230000008901 benefit Effects 0.000 description 11
- 230000002538 fungal effect Effects 0.000 description 11
- 230000002980 postoperative effect Effects 0.000 description 11
- 210000003491 skin Anatomy 0.000 description 11
- 210000000605 viral structure Anatomy 0.000 description 11
- 229940121357 antivirals Drugs 0.000 description 10
- 229960001265 ciclosporin Drugs 0.000 description 10
- 238000003745 diagnosis Methods 0.000 description 10
- 238000009826 distribution Methods 0.000 description 10
- 230000000694 effects Effects 0.000 description 10
- 229960004618 prednisone Drugs 0.000 description 10
- XOFYZVNMUHMLCC-ZPOLXVRWSA-N prednisone Chemical compound O=C1C=C[C@]2(C)[C@H]3C(=O)C[C@](C)([C@@](CC4)(O)C(=O)CO)[C@@H]4[C@@H]3CCC2=C1 XOFYZVNMUHMLCC-ZPOLXVRWSA-N 0.000 description 10
- 230000002123 temporal effect Effects 0.000 description 10
- 241000175212 Herpesvirales Species 0.000 description 9
- 238000013459 approach Methods 0.000 description 9
- 229930182912 cyclosporin Natural products 0.000 description 9
- 210000000496 pancreas Anatomy 0.000 description 9
- 230000009467 reduction Effects 0.000 description 9
- 230000004083 survival effect Effects 0.000 description 9
- 241000282412 Homo Species 0.000 description 8
- 241000701024 Human betaherpesvirus 5 Species 0.000 description 8
- 241001505332 Polyomavirus sp. Species 0.000 description 8
- 239000012472 biological sample Substances 0.000 description 8
- 201000011510 cancer Diseases 0.000 description 8
- 230000000875 corresponding effect Effects 0.000 description 8
- 230000007423 decrease Effects 0.000 description 8
- 230000001965 increasing effect Effects 0.000 description 8
- 210000003734 kidney Anatomy 0.000 description 8
- 208000024891 symptom Diseases 0.000 description 8
- 241000701161 unidentified adenovirus Species 0.000 description 8
- 241001529453 unidentified herpesvirus Species 0.000 description 8
- 241000425347 Phyla <beetle> Species 0.000 description 7
- -1 anasmycin Chemical compound 0.000 description 7
- 239000003242 anti bacterial agent Substances 0.000 description 7
- 229940088710 antibiotic agent Drugs 0.000 description 7
- 230000001684 chronic effect Effects 0.000 description 7
- 230000006378 damage Effects 0.000 description 7
- 210000004185 liver Anatomy 0.000 description 7
- 239000007787 solid Substances 0.000 description 7
- 241000701242 Adenoviridae Species 0.000 description 6
- 206010011831 Cytomegalovirus infection Diseases 0.000 description 6
- 241000701044 Human gammaherpesvirus 4 Species 0.000 description 6
- KFZMGEQAYNKOFK-UHFFFAOYSA-N Isopropanol Chemical compound CC(C)O KFZMGEQAYNKOFK-UHFFFAOYSA-N 0.000 description 6
- 241000243190 Microsporidia Species 0.000 description 6
- 208000027418 Wounds and injury Diseases 0.000 description 6
- 108700010877 adenoviridae proteins Proteins 0.000 description 6
- 210000001124 body fluid Anatomy 0.000 description 6
- 238000004422 calculation algorithm Methods 0.000 description 6
- 238000013461 design Methods 0.000 description 6
- 208000035475 disorder Diseases 0.000 description 6
- 238000002474 experimental method Methods 0.000 description 6
- 238000002650 immunosuppressive therapy Methods 0.000 description 6
- 239000012678 infectious agent Substances 0.000 description 6
- RTGDFNSFWBGLEC-SYZQJQIISA-N mycophenolate mofetil Chemical compound COC1=C(C)C=2COC(=O)C=2C(O)=C1C\C=C(/C)CCC(=O)OCCN1CCOCC1 RTGDFNSFWBGLEC-SYZQJQIISA-N 0.000 description 6
- 229960004866 mycophenolate mofetil Drugs 0.000 description 6
- 102000040430 polynucleotide Human genes 0.000 description 6
- 108091033319 polynucleotide Proteins 0.000 description 6
- 239000002157 polynucleotide Substances 0.000 description 6
- 238000002360 preparation method Methods 0.000 description 6
- 241001147420 ssDNA viruses Species 0.000 description 6
- 230000001225 therapeutic effect Effects 0.000 description 6
- 241001137855 Caudovirales Species 0.000 description 5
- 244000000002 Human virome Species 0.000 description 5
- 238000000585 Mann–Whitney U test Methods 0.000 description 5
- 241000736262 Microbiota Species 0.000 description 5
- 230000008859 change Effects 0.000 description 5
- 239000003795 chemical substances by application Substances 0.000 description 5
- 238000002651 drug therapy Methods 0.000 description 5
- 210000000987 immune system Anatomy 0.000 description 5
- 208000014674 injury Diseases 0.000 description 5
- 230000003993 interaction Effects 0.000 description 5
- 238000005070 sampling Methods 0.000 description 5
- 229940124597 therapeutic agent Drugs 0.000 description 5
- 210000002700 urine Anatomy 0.000 description 5
- 241001156739 Actinobacteria <phylum> Species 0.000 description 4
- 108700028369 Alleles Proteins 0.000 description 4
- LFQSCWFLJHTTHZ-UHFFFAOYSA-N Ethanol Chemical compound CCO LFQSCWFLJHTTHZ-UHFFFAOYSA-N 0.000 description 4
- 241000282326 Felis catus Species 0.000 description 4
- 241001502974 Human gammaherpesvirus 8 Species 0.000 description 4
- 241001465754 Metazoa Species 0.000 description 4
- 241000192142 Proteobacteria Species 0.000 description 4
- 241000125945 Protoparvovirus Species 0.000 description 4
- 208000036142 Viral infection Diseases 0.000 description 4
- 229960004669 basiliximab Drugs 0.000 description 4
- 239000010839 body fluid Substances 0.000 description 4
- 230000000295 complement effect Effects 0.000 description 4
- 238000004590 computer program Methods 0.000 description 4
- 230000037213 diet Effects 0.000 description 4
- 235000005911 diet Nutrition 0.000 description 4
- 230000001605 fetal effect Effects 0.000 description 4
- 230000014509 gene expression Effects 0.000 description 4
- 229940125721 immunosuppressive agent Drugs 0.000 description 4
- 210000000936 intestine Anatomy 0.000 description 4
- 238000012423 maintenance Methods 0.000 description 4
- 239000003550 marker Substances 0.000 description 4
- 108020004999 messenger RNA Proteins 0.000 description 4
- 230000000379 polymerizing effect Effects 0.000 description 4
- 230000008569 process Effects 0.000 description 4
- 238000012552 review Methods 0.000 description 4
- 230000002459 sustained effect Effects 0.000 description 4
- 230000009385 viral infection Effects 0.000 description 4
- 241001339888 Alphatorquevirus Species 0.000 description 3
- 241000605059 Bacteroidetes Species 0.000 description 3
- 241000588724 Escherichia coli Species 0.000 description 3
- 241000192125 Firmicutes Species 0.000 description 3
- 102000006395 Globulins Human genes 0.000 description 3
- 108010044091 Globulins Proteins 0.000 description 3
- 241000725303 Human immunodeficiency virus Species 0.000 description 3
- FQISKWAFAHGMGT-SGJOWKDISA-M Methylprednisolone sodium succinate Chemical compound [Na+].C([C@@]12C)=CC(=O)C=C1[C@@H](C)C[C@@H]1[C@@H]2[C@@H](O)C[C@]2(C)[C@@](O)(C(=O)COC(=O)CCC([O-])=O)CC[C@H]21 FQISKWAFAHGMGT-SGJOWKDISA-M 0.000 description 3
- 201000000090 Microsporidiosis Diseases 0.000 description 3
- 108091028043 Nucleic acid sequence Proteins 0.000 description 3
- 239000004599 antimicrobial Substances 0.000 description 3
- 230000003115 biocidal effect Effects 0.000 description 3
- 239000000090 biomarker Substances 0.000 description 3
- 210000001185 bone marrow Anatomy 0.000 description 3
- 108091092240 circulating cell-free DNA Proteins 0.000 description 3
- 239000000356 contaminant Substances 0.000 description 3
- 238000007796 conventional method Methods 0.000 description 3
- 229960002806 daclizumab Drugs 0.000 description 3
- 230000009699 differential effect Effects 0.000 description 3
- 241001492478 dsDNA viruses, no RNA stage Species 0.000 description 3
- 238000005516 engineering process Methods 0.000 description 3
- 239000000835 fiber Substances 0.000 description 3
- 239000012530 fluid Substances 0.000 description 3
- 239000012634 fragment Substances 0.000 description 3
- 210000001035 gastrointestinal tract Anatomy 0.000 description 3
- 229940124589 immunosuppressive drug Drugs 0.000 description 3
- 201000002364 leukopenia Diseases 0.000 description 3
- 231100001022 leukopenia Toxicity 0.000 description 3
- 239000002609 medium Substances 0.000 description 3
- 229960004584 methylprednisolone Drugs 0.000 description 3
- 230000035772 mutation Effects 0.000 description 3
- 239000013610 patient sample Substances 0.000 description 3
- 210000003819 peripheral blood mononuclear cell Anatomy 0.000 description 3
- 238000004393 prognosis Methods 0.000 description 3
- 108090000623 proteins and genes Proteins 0.000 description 3
- 238000011002 quantification Methods 0.000 description 3
- 230000002829 reductive effect Effects 0.000 description 3
- 230000010076 replication Effects 0.000 description 3
- 150000003839 salts Chemical class 0.000 description 3
- OKQHSIGMOWQUIK-UHFFFAOYSA-N 2-[(2-aminopurin-9-yl)methoxy]ethanol Chemical compound NC1=NC=C2N=CN(COCCO)C2=N1 OKQHSIGMOWQUIK-UHFFFAOYSA-N 0.000 description 2
- WZRJTRPJURQBRM-UHFFFAOYSA-N 4-amino-n-(5-methyl-1,2-oxazol-3-yl)benzenesulfonamide;5-[(3,4,5-trimethoxyphenyl)methyl]pyrimidine-2,4-diamine Chemical compound O1C(C)=CC(NS(=O)(=O)C=2C=CC(N)=CC=2)=N1.COC1=C(OC)C(OC)=CC(CC=2C(=NC(N)=NC=2)N)=C1 WZRJTRPJURQBRM-UHFFFAOYSA-N 0.000 description 2
- 206010059313 Anogenital warts Diseases 0.000 description 2
- 208000023275 Autoimmune disease Diseases 0.000 description 2
- 208000035143 Bacterial infection Diseases 0.000 description 2
- 102000004631 Calcineurin Human genes 0.000 description 2
- 108010042955 Calcineurin Proteins 0.000 description 2
- 229940122739 Calcineurin inhibitor Drugs 0.000 description 2
- 101710192106 Calcineurin-binding protein cabin-1 Proteins 0.000 description 2
- 102100024123 Calcineurin-binding protein cabin-1 Human genes 0.000 description 2
- 208000035473 Communicable disease Diseases 0.000 description 2
- 208000000907 Condylomata Acuminata Diseases 0.000 description 2
- 108091035707 Consensus sequence Proteins 0.000 description 2
- 241000223935 Cryptosporidium Species 0.000 description 2
- 229930105110 Cyclosporin A Natural products 0.000 description 2
- 238000007400 DNA extraction Methods 0.000 description 2
- BXZVVICBKDXVGW-NKWVEPMBSA-N Didanosine Chemical compound O1[C@H](CO)CC[C@@H]1N1C(NC=NC2=O)=C2N=C1 BXZVVICBKDXVGW-NKWVEPMBSA-N 0.000 description 2
- 102000004190 Enzymes Human genes 0.000 description 2
- 108090000790 Enzymes Proteins 0.000 description 2
- ULGZDMOVFRHVEP-RWJQBGPGSA-N Erythromycin Chemical compound O([C@@H]1[C@@H](C)C(=O)O[C@@H]([C@@]([C@H](O)[C@@H](C)C(=O)[C@H](C)C[C@@](C)(O)[C@H](O[C@H]2[C@@H]([C@H](C[C@@H](C)O2)N(C)C)O)[C@H]1C)(C)O)CC)[C@H]1C[C@@](C)(OC)[C@@H](O)[C@H](C)O1 ULGZDMOVFRHVEP-RWJQBGPGSA-N 0.000 description 2
- 206010016654 Fibrosis Diseases 0.000 description 2
- 206010017533 Fungal infection Diseases 0.000 description 2
- 241000224467 Giardia intestinalis Species 0.000 description 2
- 241000701027 Human herpesvirus 6 Species 0.000 description 2
- 241000124008 Mammalia Species 0.000 description 2
- 238000007476 Maximum Likelihood Methods 0.000 description 2
- 208000031888 Mycoses Diseases 0.000 description 2
- 241000588653 Neisseria Species 0.000 description 2
- 206010029155 Nephropathy toxic Diseases 0.000 description 2
- 108091034117 Oligonucleotide Proteins 0.000 description 2
- 208000001388 Opportunistic Infections Diseases 0.000 description 2
- JGSARLDLIJGVTE-MBNYWOFBSA-N Penicillin G Chemical compound N([C@H]1[C@H]2SC([C@@H](N2C1=O)C(O)=O)(C)C)C(=O)CC1=CC=CC=C1 JGSARLDLIJGVTE-MBNYWOFBSA-N 0.000 description 2
- 206010036790 Productive cough Diseases 0.000 description 2
- 241000589516 Pseudomonas Species 0.000 description 2
- 241000589517 Pseudomonas aeruginosa Species 0.000 description 2
- 238000012300 Sequence Analysis Methods 0.000 description 2
- 241000191967 Staphylococcus aureus Species 0.000 description 2
- 239000004098 Tetracycline Substances 0.000 description 2
- 241000700647 Variola virus Species 0.000 description 2
- 241000379754 WU Polyomavirus Species 0.000 description 2
- 238000007792 addition Methods 0.000 description 2
- 239000002671 adjuvant Substances 0.000 description 2
- 208000036878 aneuploidy Diseases 0.000 description 2
- 231100001075 aneuploidy Toxicity 0.000 description 2
- 230000000843 anti-fungal effect Effects 0.000 description 2
- 230000000845 anti-microbial effect Effects 0.000 description 2
- 230000003409 anti-rejection Effects 0.000 description 2
- 230000001494 anti-thymocyte effect Effects 0.000 description 2
- 238000011230 antibody-based therapy Methods 0.000 description 2
- 229940121375 antifungal agent Drugs 0.000 description 2
- 229960002170 azathioprine Drugs 0.000 description 2
- LMEKQMALGUDUQG-UHFFFAOYSA-N azathioprine Chemical compound CN1C=NC([N+]([O-])=O)=C1SC1=NC=NC2=C1NC=N2 LMEKQMALGUDUQG-UHFFFAOYSA-N 0.000 description 2
- 208000022362 bacterial infectious disease Diseases 0.000 description 2
- 230000015572 biosynthetic process Effects 0.000 description 2
- 210000004556 brain Anatomy 0.000 description 2
- 229940046731 calcineurin inhibitors Drugs 0.000 description 2
- 238000004364 calculation method Methods 0.000 description 2
- 238000005119 centrifugation Methods 0.000 description 2
- 238000006243 chemical reaction Methods 0.000 description 2
- 238000003759 clinical diagnosis Methods 0.000 description 2
- 239000002299 complementary DNA Substances 0.000 description 2
- 239000003246 corticosteroid Substances 0.000 description 2
- JHIVVAPYMSGYDF-UHFFFAOYSA-N cyclohexanone Chemical compound O=C1CCCCC1 JHIVVAPYMSGYDF-UHFFFAOYSA-N 0.000 description 2
- 230000003247 decreasing effect Effects 0.000 description 2
- 230000003111 delayed effect Effects 0.000 description 2
- 229960002656 didanosine Drugs 0.000 description 2
- 230000002068 genetic effect Effects 0.000 description 2
- 238000003205 genotyping method Methods 0.000 description 2
- 244000005709 gut microbiome Species 0.000 description 2
- 230000008102 immune modulation Effects 0.000 description 2
- 238000009169 immunotherapy Methods 0.000 description 2
- 238000011065 in-situ storage Methods 0.000 description 2
- 230000006698 induction Effects 0.000 description 2
- 238000007834 ligase chain reaction Methods 0.000 description 2
- 230000007774 longterm Effects 0.000 description 2
- 210000002751 lymph Anatomy 0.000 description 2
- 230000008774 maternal effect Effects 0.000 description 2
- 108091070501 miRNA Proteins 0.000 description 2
- 239000002679 microRNA Substances 0.000 description 2
- 230000007694 nephrotoxicity Effects 0.000 description 2
- 231100000417 nephrotoxicity Toxicity 0.000 description 2
- NQDJXKOVJZTUJA-UHFFFAOYSA-N nevirapine Chemical compound C12=NC=CC=C2C(=O)NC=2C(C)=CC=NC=2N1C1CC1 NQDJXKOVJZTUJA-UHFFFAOYSA-N 0.000 description 2
- 230000007170 pathology Effects 0.000 description 2
- XDRYMKDFEDOLFX-UHFFFAOYSA-N pentamidine Chemical compound C1=CC(C(=N)N)=CC=C1OCCCCCOC1=CC=C(C(N)=N)C=C1 XDRYMKDFEDOLFX-UHFFFAOYSA-N 0.000 description 2
- 229960004448 pentamidine Drugs 0.000 description 2
- 230000000144 pharmacologic effect Effects 0.000 description 2
- 239000000902 placebo Substances 0.000 description 2
- 229940068196 placebo Drugs 0.000 description 2
- 238000003752 polymerase chain reaction Methods 0.000 description 2
- 230000003389 potentiating effect Effects 0.000 description 2
- 238000001556 precipitation Methods 0.000 description 2
- ZAHRKKWIAAJSAO-UHFFFAOYSA-N rapamycin Natural products COCC(O)C(=C/C(C)C(=O)CC(OC(=O)C1CCCCN1C(=O)C(=O)C2(O)OC(CC(OC)C(=CC=CC=CC(C)CC(C)C(=O)C)C)CCC2C)C(C)CC3CCC(O)C(C3)OC)C ZAHRKKWIAAJSAO-UHFFFAOYSA-N 0.000 description 2
- 230000003252 repetitive effect Effects 0.000 description 2
- 238000011160 research Methods 0.000 description 2
- 238000012216 screening Methods 0.000 description 2
- 238000013515 script Methods 0.000 description 2
- 229960002930 sirolimus Drugs 0.000 description 2
- QFJCIRLUMZQUOT-HPLJOQBZSA-N sirolimus Chemical compound C1C[C@@H](O)[C@H](OC)C[C@@H]1C[C@@H](C)[C@H]1OC(=O)[C@@H]2CCCCN2C(=O)C(=O)[C@](O)(O2)[C@H](C)CC[C@H]2C[C@H](OC)/C(C)=C/C=C/C=C/[C@@H](C)C[C@@H](C)C(=O)[C@H](OC)[C@H](O)/C(C)=C/[C@@H](C)C(=O)C1 QFJCIRLUMZQUOT-HPLJOQBZSA-N 0.000 description 2
- 238000000638 solvent extraction Methods 0.000 description 2
- 210000003802 sputum Anatomy 0.000 description 2
- 208000024794 sputum Diseases 0.000 description 2
- UCSJYZPVAKXKNQ-HZYVHMACSA-N streptomycin Chemical compound CN[C@H]1[C@H](O)[C@@H](O)[C@H](CO)O[C@H]1O[C@@H]1[C@](C=O)(O)[C@H](C)O[C@H]1O[C@@H]1[C@@H](NC(N)=N)[C@H](O)[C@@H](NC(N)=N)[C@H](O)[C@H]1O UCSJYZPVAKXKNQ-HZYVHMACSA-N 0.000 description 2
- 230000001629 suppression Effects 0.000 description 2
- 238000003786 synthesis reaction Methods 0.000 description 2
- 235000019364 tetracycline Nutrition 0.000 description 2
- 150000003522 tetracyclines Chemical class 0.000 description 2
- 238000011285 therapeutic regimen Methods 0.000 description 2
- 230000036962 time dependent Effects 0.000 description 2
- 231100000419 toxicity Toxicity 0.000 description 2
- 230000001988 toxicity Effects 0.000 description 2
- 238000000108 ultra-filtration Methods 0.000 description 2
- XLYOFNOQVPJJNP-UHFFFAOYSA-N water Substances O XLYOFNOQVPJJNP-UHFFFAOYSA-N 0.000 description 2
- XIYOPDCBBDCGOE-IWVLMIASSA-N (4s,4ar,5s,5ar,12ar)-4-(dimethylamino)-1,5,10,11,12a-pentahydroxy-6-methylidene-3,12-dioxo-4,4a,5,5a-tetrahydrotetracene-2-carboxamide Chemical compound C=C1C2=CC=CC(O)=C2C(O)=C2[C@@H]1[C@H](O)[C@H]1[C@H](N(C)C)C(=O)C(C(N)=O)=C(O)[C@@]1(O)C2=O XIYOPDCBBDCGOE-IWVLMIASSA-N 0.000 description 1
- SGKRLCUYIXIAHR-AKNGSSGZSA-N (4s,4ar,5s,5ar,6r,12ar)-4-(dimethylamino)-1,5,10,11,12a-pentahydroxy-6-methyl-3,12-dioxo-4a,5,5a,6-tetrahydro-4h-tetracene-2-carboxamide Chemical compound C1=CC=C2[C@H](C)[C@@H]([C@H](O)[C@@H]3[C@](C(O)=C(C(N)=O)C(=O)[C@H]3N(C)C)(O)C3=O)C3=C(O)C2=C1O SGKRLCUYIXIAHR-AKNGSSGZSA-N 0.000 description 1
- FFTVPQUHLQBXQZ-KVUCHLLUSA-N (4s,4as,5ar,12ar)-4,7-bis(dimethylamino)-1,10,11,12a-tetrahydroxy-3,12-dioxo-4a,5,5a,6-tetrahydro-4h-tetracene-2-carboxamide Chemical compound C1C2=C(N(C)C)C=CC(O)=C2C(O)=C2[C@@H]1C[C@H]1[C@H](N(C)C)C(=O)C(C(N)=O)=C(O)[C@@]1(O)C2=O FFTVPQUHLQBXQZ-KVUCHLLUSA-N 0.000 description 1
- GUXHBMASAHGULD-SEYHBJAFSA-N (4s,4as,5as,6s,12ar)-7-chloro-4-(dimethylamino)-1,6,10,11,12a-pentahydroxy-3,12-dioxo-4a,5,5a,6-tetrahydro-4h-tetracene-2-carboxamide Chemical compound C1([C@H]2O)=C(Cl)C=CC(O)=C1C(O)=C1[C@@H]2C[C@H]2[C@H](N(C)C)C(=O)C(C(N)=O)=C(O)[C@@]2(O)C1=O GUXHBMASAHGULD-SEYHBJAFSA-N 0.000 description 1
- IWKXBHQELWQLHF-CAPFRKAQSA-N (ne)-n-[(2-amino-3-propan-2-ylsulfonylbenzimidazol-5-yl)-phenylmethylidene]hydroxylamine Chemical compound C1=C2N(S(=O)(=O)C(C)C)C(N)=NC2=CC=C1C(=N\O)\C1=CC=CC=C1 IWKXBHQELWQLHF-CAPFRKAQSA-N 0.000 description 1
- UBCHPRBFMUDMNC-UHFFFAOYSA-N 1-(1-adamantyl)ethanamine Chemical compound C1C(C2)CC3CC2CC1(C(N)C)C3 UBCHPRBFMUDMNC-UHFFFAOYSA-N 0.000 description 1
- QITVRBREBFELAB-HCWSKCQFSA-N 1-[(2R,3R,4S,5R)-2-azido-3,4-dihydroxy-5-(hydroxymethyl)oxolan-2-yl]pyrimidine-2,4-dione Chemical compound O[C@@H]1[C@H](O)[C@@H](CO)O[C@@]1(N=[N+]=[N-])N1C(=O)NC(=O)C=C1 QITVRBREBFELAB-HCWSKCQFSA-N 0.000 description 1
- IPVFGAYTKQKGBM-BYPJNBLXSA-N 1-[(2r,3s,4r,5r)-3-fluoro-4-hydroxy-5-(hydroxymethyl)oxolan-2-yl]-5-iodopyrimidine-2,4-dione Chemical compound F[C@H]1[C@H](O)[C@@H](CO)O[C@H]1N1C(=O)NC(=O)C(I)=C1 IPVFGAYTKQKGBM-BYPJNBLXSA-N 0.000 description 1
- MKXBOPXRKXGSTI-PJKMHFRUSA-N 1-[(2s,4s,5r)-2-fluoro-4-hydroxy-5-(hydroxymethyl)oxolan-2-yl]-5-methylpyrimidine-2,4-dione Chemical compound O=C1NC(=O)C(C)=CN1[C@]1(F)O[C@H](CO)[C@@H](O)C1 MKXBOPXRKXGSTI-PJKMHFRUSA-N 0.000 description 1
- HBOMLICNUCNMMY-UHFFFAOYSA-N 1-[4-azido-5-(hydroxymethyl)oxolan-2-yl]-5-methylpyrimidine-2,4-dione Chemical compound O=C1NC(=O)C(C)=CN1C1OC(CO)C(N=[N+]=[N-])C1 HBOMLICNUCNMMY-UHFFFAOYSA-N 0.000 description 1
- VHVPQPYKVGDNFY-DFMJLFEVSA-N 2-[(2r)-butan-2-yl]-4-[4-[4-[4-[[(2r,4s)-2-(2,4-dichlorophenyl)-2-(1,2,4-triazol-1-ylmethyl)-1,3-dioxolan-4-yl]methoxy]phenyl]piperazin-1-yl]phenyl]-1,2,4-triazol-3-one Chemical compound O=C1N([C@H](C)CC)N=CN1C1=CC=C(N2CCN(CC2)C=2C=CC(OC[C@@H]3O[C@](CN4N=CN=C4)(OC3)C=3C(=CC(Cl)=CC=3)Cl)=CC=2)C=C1 VHVPQPYKVGDNFY-DFMJLFEVSA-N 0.000 description 1
- GIMSJJHKKXRFGV-BYPJNBLXSA-N 4-amino-1-[(2r,3s,4r,5r)-3-fluoro-4-hydroxy-5-(hydroxymethyl)oxolan-2-yl]-5-iodopyrimidin-2-one Chemical compound C1=C(I)C(N)=NC(=O)N1[C@H]1[C@@H](F)[C@H](O)[C@@H](CO)O1 GIMSJJHKKXRFGV-BYPJNBLXSA-N 0.000 description 1
- 208000030507 AIDS Diseases 0.000 description 1
- 208000010370 Adenoviridae Infections Diseases 0.000 description 1
- 206010060931 Adenovirus infection Diseases 0.000 description 1
- 241001036151 Aichi virus 1 Species 0.000 description 1
- 241000099223 Alistipes sp. Species 0.000 description 1
- 241000388165 Alphapapillomavirus 4 Species 0.000 description 1
- 241000269627 Amphiuma means Species 0.000 description 1
- 108091093088 Amplicon Proteins 0.000 description 1
- 244000144725 Amygdalus communis Species 0.000 description 1
- 206010003445 Ascites Diseases 0.000 description 1
- 201000001320 Atherosclerosis Diseases 0.000 description 1
- 241000295638 Australian bat lyssavirus Species 0.000 description 1
- 241000193738 Bacillus anthracis Species 0.000 description 1
- 241000194110 Bacillus sp. (in: Bacteria) Species 0.000 description 1
- 244000063299 Bacillus subtilis Species 0.000 description 1
- 108010001478 Bacitracin Proteins 0.000 description 1
- 241000217846 Bacteroides caccae Species 0.000 description 1
- 241000606124 Bacteroides fragilis Species 0.000 description 1
- 241000606123 Bacteroides thetaiotaomicron Species 0.000 description 1
- 241000606219 Bacteroides uniformis Species 0.000 description 1
- 241001302512 Banna virus Species 0.000 description 1
- 241000710946 Barmah Forest virus Species 0.000 description 1
- 241001339887 Betatorquevirus Species 0.000 description 1
- 241000186000 Bifidobacterium Species 0.000 description 1
- 241000186016 Bifidobacterium bifidum Species 0.000 description 1
- 241000283690 Bos taurus Species 0.000 description 1
- BWNWKKNJDBZGSM-RRKCRQDMSA-N BrC(C=1C(NC(N([C@H]2C[C@H](O)[C@@H](CO)O2)C=1)=O)=O)(Br)Br Chemical compound BrC(C=1C(NC(N([C@H]2C[C@H](O)[C@@H](CO)O2)C=1)=O)=O)(Br)Br BWNWKKNJDBZGSM-RRKCRQDMSA-N 0.000 description 1
- 241000186146 Brevibacterium Species 0.000 description 1
- 241000508772 Brucella sp. Species 0.000 description 1
- 241001493154 Bunyamwera virus Species 0.000 description 1
- 241000283707 Capra Species 0.000 description 1
- 102000012406 Carcinoembryonic Antigen Human genes 0.000 description 1
- 108010022366 Carcinoembryonic Antigen Proteins 0.000 description 1
- 208000005623 Carcinogenesis Diseases 0.000 description 1
- UQLLWWBDSUHNEB-CZUORRHYSA-N Cefaprin Chemical compound N([C@H]1[C@@H]2N(C1=O)C(=C(CS2)COC(=O)C)C(O)=O)C(=O)CSC1=CC=NC=C1 UQLLWWBDSUHNEB-CZUORRHYSA-N 0.000 description 1
- 229930186147 Cephalosporin Natural products 0.000 description 1
- 241000711969 Chandipura virus Species 0.000 description 1
- 201000006082 Chickenpox Diseases 0.000 description 1
- 241001502567 Chikungunya virus Species 0.000 description 1
- 206010068051 Chimerism Diseases 0.000 description 1
- 239000004099 Chlortetracycline Substances 0.000 description 1
- BHIHHJWSQVIVOR-RRKCRQDMSA-N ClC(C=1C(NC(N([C@H]2C[C@H](O)[C@@H](CO)O2)C=1)=O)=O)(Cl)Cl Chemical compound ClC(C=1C(NC(N([C@H]2C[C@H](O)[C@@H](CO)O2)C=1)=O)=O)(Cl)Cl BHIHHJWSQVIVOR-RRKCRQDMSA-N 0.000 description 1
- 241000193403 Clostridium Species 0.000 description 1
- 241000193155 Clostridium botulinum Species 0.000 description 1
- 241000186581 Clostridium novyi Species 0.000 description 1
- 241000193468 Clostridium perfringens Species 0.000 description 1
- 241000193466 Clostridium septicum Species 0.000 description 1
- 241000193449 Clostridium tetani Species 0.000 description 1
- 108010078777 Colistin Proteins 0.000 description 1
- 206010009944 Colon cancer Diseases 0.000 description 1
- 208000001333 Colorectal Neoplasms Diseases 0.000 description 1
- 241000186216 Corynebacterium Species 0.000 description 1
- 241000033566 Cosavirus A Species 0.000 description 1
- 241000700626 Cowpox virus Species 0.000 description 1
- 241000709687 Coxsackievirus Species 0.000 description 1
- 241000150230 Crimean-Congo hemorrhagic fever orthonairovirus Species 0.000 description 1
- 241001337994 Cryptococcus <scale insect> Species 0.000 description 1
- 241000724252 Cucumber mosaic virus Species 0.000 description 1
- 241000186427 Cutibacterium acnes Species 0.000 description 1
- 206010058854 Cytomegalovirus viraemia Diseases 0.000 description 1
- DYDCUQKUCUHJBH-UWTATZPHSA-N D-Cycloserine Chemical compound N[C@@H]1CONC1=O DYDCUQKUCUHJBH-UWTATZPHSA-N 0.000 description 1
- DYDCUQKUCUHJBH-UHFFFAOYSA-N D-Cycloserine Natural products NC1CONC1=O DYDCUQKUCUHJBH-UHFFFAOYSA-N 0.000 description 1
- 238000001712 DNA sequencing Methods 0.000 description 1
- 241000450599 DNA viruses Species 0.000 description 1
- MQJKPEGWNLWLTK-UHFFFAOYSA-N Dapsone Chemical compound C1=CC(N)=CC=C1S(=O)(=O)C1=CC=C(N)C=C1 MQJKPEGWNLWLTK-UHFFFAOYSA-N 0.000 description 1
- 241000235035 Debaryomyces Species 0.000 description 1
- FMTDIUIBLCQGJB-UHFFFAOYSA-N Demethylchlortetracyclin Natural products C1C2C(O)C3=C(Cl)C=CC(O)=C3C(=O)C2=C(O)C2(O)C1C(N(C)C)C(O)=C(C(N)=O)C2=O FMTDIUIBLCQGJB-UHFFFAOYSA-N 0.000 description 1
- 241001128004 Demodex Species 0.000 description 1
- 241001218273 Demodex brevis Species 0.000 description 1
- 241000193880 Demodex folliculorum Species 0.000 description 1
- 208000001490 Dengue Diseases 0.000 description 1
- 206010012310 Dengue fever Diseases 0.000 description 1
- 241000725619 Dengue virus Species 0.000 description 1
- LXBIFEVIBLOUGU-UHFFFAOYSA-N Deoxymannojirimycin Natural products OCC1NCC(O)C(O)C1O LXBIFEVIBLOUGU-UHFFFAOYSA-N 0.000 description 1
- 241000702421 Dependoparvovirus Species 0.000 description 1
- 241000712471 Dhori virus Species 0.000 description 1
- 241000609468 Dorea sp. Species 0.000 description 1
- 206010013710 Drug interaction Diseases 0.000 description 1
- 206010061822 Drug intolerance Diseases 0.000 description 1
- 241000149824 Dugbe orthonairovirus Species 0.000 description 1
- 241001520695 Duvenhage lyssavirus Species 0.000 description 1
- 102000001301 EGF receptor Human genes 0.000 description 1
- 108060006698 EGF receptor Proteins 0.000 description 1
- 241000710945 Eastern equine encephalitis virus Species 0.000 description 1
- 241001115402 Ebolavirus Species 0.000 description 1
- 241001466953 Echovirus Species 0.000 description 1
- 241000710188 Encephalomyocarditis virus Species 0.000 description 1
- 241000224431 Entamoeba Species 0.000 description 1
- 241000224432 Entamoeba histolytica Species 0.000 description 1
- 241000147019 Enterobacter sp. Species 0.000 description 1
- 241000305071 Enterobacterales Species 0.000 description 1
- 241000588921 Enterobacteriaceae Species 0.000 description 1
- 241000194033 Enterococcus Species 0.000 description 1
- 241000194032 Enterococcus faecalis Species 0.000 description 1
- 241000991587 Enterovirus C Species 0.000 description 1
- 241000146324 Enterovirus D68 Species 0.000 description 1
- 206010066919 Epidemic polyarthritis Diseases 0.000 description 1
- 241000283073 Equus caballus Species 0.000 description 1
- 208000007985 Erythema Infectiosum Diseases 0.000 description 1
- 241001520680 European bat lyssavirus Species 0.000 description 1
- 201000005866 Exanthema Subitum Diseases 0.000 description 1
- 241001608234 Faecalibacterium Species 0.000 description 1
- 241000242711 Fasciola hepatica Species 0.000 description 1
- 241000531123 GB virus C Species 0.000 description 1
- 108091092584 GDNA Proteins 0.000 description 1
- 241000287828 Gallus gallus Species 0.000 description 1
- 241001339886 Gammatorquevirus Species 0.000 description 1
- 229930182566 Gentamicin Natural products 0.000 description 1
- CEAZRRDELHUEMR-URQXQFDESA-N Gentamicin Chemical compound O1[C@H](C(C)NC)CC[C@@H](N)[C@H]1O[C@H]1[C@H](O)[C@@H](O[C@@H]2[C@@H]([C@@H](NC)[C@@](C)(O)CO2)O)[C@H](N)C[C@@H]1N CEAZRRDELHUEMR-URQXQFDESA-N 0.000 description 1
- 241000224466 Giardia Species 0.000 description 1
- 241001197893 Glyptemys herpesvirus Species 0.000 description 1
- 206010048748 Graft loss Diseases 0.000 description 1
- 208000031886 HIV Infections Diseases 0.000 description 1
- 229940121710 HMGCoA reductase inhibitor Drugs 0.000 description 1
- 208000020061 Hand, Foot and Mouth Disease Diseases 0.000 description 1
- 208000025713 Hand-foot-and-mouth disease Diseases 0.000 description 1
- 241000150562 Hantaan orthohantavirus Species 0.000 description 1
- 206010019315 Heart transplant rejection Diseases 0.000 description 1
- 241000589989 Helicobacter Species 0.000 description 1
- 241000590002 Helicobacter pylori Species 0.000 description 1
- 102100021519 Hemoglobin subunit beta Human genes 0.000 description 1
- 108091005904 Hemoglobin subunit beta Proteins 0.000 description 1
- 241000893570 Hendra henipavirus Species 0.000 description 1
- 241000711549 Hepacivirus C Species 0.000 description 1
- 241000700721 Hepatitis B virus Species 0.000 description 1
- 208000005176 Hepatitis C Diseases 0.000 description 1
- 241000724675 Hepatitis E virus Species 0.000 description 1
- 241000724709 Hepatitis delta virus Species 0.000 description 1
- 241000709721 Hepatovirus A Species 0.000 description 1
- 208000009889 Herpes Simplex Diseases 0.000 description 1
- 208000007514 Herpes zoster Diseases 0.000 description 1
- 208000029433 Herpesviridae infectious disease Diseases 0.000 description 1
- 101100151951 Homo sapiens SARS1 gene Proteins 0.000 description 1
- 241000928771 Horsepox virus Species 0.000 description 1
- 244000309467 Human Coronavirus Species 0.000 description 1
- 241000598436 Human T-cell lymphotropic virus Species 0.000 description 1
- 241000598171 Human adenovirus sp. Species 0.000 description 1
- 241000700588 Human alphaherpesvirus 1 Species 0.000 description 1
- 241000701074 Human alphaherpesvirus 2 Species 0.000 description 1
- 241000701085 Human alphaherpesvirus 3 Species 0.000 description 1
- 241001479210 Human astrovirus Species 0.000 description 1
- 241000701041 Human betaherpesvirus 7 Species 0.000 description 1
- 241000711920 Human orthopneumovirus Species 0.000 description 1
- 241000701806 Human papillomavirus Species 0.000 description 1
- 241000702617 Human parvovirus B19 Species 0.000 description 1
- 241000829111 Human polyomavirus 1 Species 0.000 description 1
- 241000829106 Human polyomavirus 3 Species 0.000 description 1
- 241000430519 Human rhinovirus sp. Species 0.000 description 1
- 241000714192 Human spumaretrovirus Species 0.000 description 1
- 241000947839 Human torovirus Species 0.000 description 1
- 208000031226 Hyperlipidaemia Diseases 0.000 description 1
- 206010020772 Hypertension Diseases 0.000 description 1
- 101150004367 Il4i1 gene Proteins 0.000 description 1
- 206010061598 Immunodeficiency Diseases 0.000 description 1
- 241000712431 Influenza A virus Species 0.000 description 1
- 241000713196 Influenza B virus Species 0.000 description 1
- 241000713297 Influenza C virus Species 0.000 description 1
- 102100034343 Integrase Human genes 0.000 description 1
- 102000014150 Interferons Human genes 0.000 description 1
- 108010050904 Interferons Proteins 0.000 description 1
- 102000015696 Interleukins Human genes 0.000 description 1
- 108010063738 Interleukins Proteins 0.000 description 1
- 206010022678 Intestinal infections Diseases 0.000 description 1
- 241001109688 Isfahan virus Species 0.000 description 1
- 241000701460 JC polyomavirus Species 0.000 description 1
- 241000710842 Japanese encephalitis virus Species 0.000 description 1
- 241000712890 Junin mammarenavirus Species 0.000 description 1
- 208000007993 Kaposi Varicelliform Eruption Diseases 0.000 description 1
- 201000008225 Klebsiella pneumonia Diseases 0.000 description 1
- 241000588747 Klebsiella pneumoniae Species 0.000 description 1
- 241000588754 Klebsiella sp. Species 0.000 description 1
- 241000710912 Kunjin virus Species 0.000 description 1
- 241000713102 La Crosse virus Species 0.000 description 1
- 241000186660 Lactobacillus Species 0.000 description 1
- 241001520693 Lagos bat lyssavirus Species 0.000 description 1
- 241000710770 Langat virus Species 0.000 description 1
- 241000712902 Lassa mammarenavirus Species 0.000 description 1
- 208000032420 Latent Infection Diseases 0.000 description 1
- 241000589242 Legionella pneumophila Species 0.000 description 1
- 241000589268 Legionella sp. Species 0.000 description 1
- 241000222722 Leishmania <genus> Species 0.000 description 1
- OJMMVQQUTAEWLP-UHFFFAOYSA-N Lincomycin Natural products CN1CC(CCC)CC1C(=O)NC(C(C)O)C1C(O)C(O)C(O)C(SC)O1 OJMMVQQUTAEWLP-UHFFFAOYSA-N 0.000 description 1
- 241000186779 Listeria monocytogenes Species 0.000 description 1
- 241001084338 Listeria sp. Species 0.000 description 1
- 241001635205 Lordsdale virus Species 0.000 description 1
- 241000710769 Louping ill virus Species 0.000 description 1
- 206010058467 Lung neoplasm malignant Diseases 0.000 description 1
- 241000712899 Lymphocytic choriomeningitis mammarenavirus Species 0.000 description 1
- 241000712898 Machupo mammarenavirus Species 0.000 description 1
- 241000555676 Malassezia Species 0.000 description 1
- 241001559185 Mammalian rubulavirus 5 Species 0.000 description 1
- 241000711937 Marburg marburgvirus Species 0.000 description 1
- 241000608292 Mayaro virus Species 0.000 description 1
- 201000005505 Measles Diseases 0.000 description 1
- 241000712079 Measles morbillivirus Species 0.000 description 1
- 241000710185 Mengo virus Species 0.000 description 1
- 201000009906 Meningitis Diseases 0.000 description 1
- 241000579048 Merkel cell polyomavirus Species 0.000 description 1
- RJQXTJLFIWVMTO-TYNCELHUSA-N Methicillin Chemical compound COC1=CC=CC(OC)=C1C(=O)N[C@@H]1C(=O)N2[C@@H](C(O)=O)C(C)(C)S[C@@H]21 RJQXTJLFIWVMTO-TYNCELHUSA-N 0.000 description 1
- 241000192041 Micrococcus Species 0.000 description 1
- 108091092878 Microsatellite Proteins 0.000 description 1
- 241000127282 Middle East respiratory syndrome-related coronavirus Species 0.000 description 1
- 241000725171 Mokola lyssavirus Species 0.000 description 1
- 241000700560 Molluscum contagiosum virus Species 0.000 description 1
- 241000700627 Monkeypox virus Species 0.000 description 1
- 241000711386 Mumps virus Species 0.000 description 1
- 241000358374 Mupapillomavirus 1 Species 0.000 description 1
- 241000710908 Murray Valley encephalitis virus Species 0.000 description 1
- 241000186362 Mycobacterium leprae Species 0.000 description 1
- 241000187488 Mycobacterium sp. Species 0.000 description 1
- 241000187479 Mycobacterium tuberculosis Species 0.000 description 1
- 229930193140 Neomycin Natural products 0.000 description 1
- 241000168432 New York hantavirus Species 0.000 description 1
- 241000526636 Nipah henipavirus Species 0.000 description 1
- 241000714209 Norwalk virus Species 0.000 description 1
- 206010029803 Nosocomial infection Diseases 0.000 description 1
- 241000710944 O'nyong-nyong virus Species 0.000 description 1
- 206010029888 Obliterative bronchiolitis Diseases 0.000 description 1
- 102000043276 Oncogene Human genes 0.000 description 1
- 108700020796 Oncogene Proteins 0.000 description 1
- 241000700635 Orf virus Species 0.000 description 1
- 241000250439 Oropouche virus Species 0.000 description 1
- 241000283973 Oryctolagus cuniculus Species 0.000 description 1
- 239000004100 Oxytetracycline Substances 0.000 description 1
- 239000012807 PCR reagent Substances 0.000 description 1
- 208000002606 Paramyxoviridae Infections Diseases 0.000 description 1
- 229930182555 Penicillin Natural products 0.000 description 1
- 241000711850 Peptococcus sp. Species 0.000 description 1
- 241000192033 Peptostreptococcus sp. Species 0.000 description 1
- 241000009328 Perro Species 0.000 description 1
- 241000712910 Pichinde mammarenavirus Species 0.000 description 1
- 241000224016 Plasmodium Species 0.000 description 1
- 241000223960 Plasmodium falciparum Species 0.000 description 1
- 206010073756 Pneumocystis jirovecii infection Diseases 0.000 description 1
- 206010035717 Pneumonia klebsiella Diseases 0.000 description 1
- 108010093965 Polymyxin B Proteins 0.000 description 1
- 241001631648 Polyomaviridae Species 0.000 description 1
- 208000001676 Polyomavirus Infections Diseases 0.000 description 1
- 241000710884 Powassan virus Species 0.000 description 1
- 241001135223 Prevotella melaninogenica Species 0.000 description 1
- 241001135261 Prevotella oralis Species 0.000 description 1
- 241000186429 Propionibacterium Species 0.000 description 1
- 241000588770 Proteus mirabilis Species 0.000 description 1
- 241000014360 Punta Toro phlebovirus Species 0.000 description 1
- 241000150264 Puumala orthohantavirus Species 0.000 description 1
- 206010037660 Pyrexia Diseases 0.000 description 1
- 108010092799 RNA-directed DNA polymerase Proteins 0.000 description 1
- 241000711798 Rabies lyssavirus Species 0.000 description 1
- 108020004511 Recombinant DNA Proteins 0.000 description 1
- 208000001647 Renal Insufficiency Diseases 0.000 description 1
- 206010057190 Respiratory tract infections Diseases 0.000 description 1
- IWUCXVSUMQZMFG-AFCXAGJDSA-N Ribavirin Chemical compound N1=C(C(=O)N)N=CN1[C@H]1[C@H](O)[C@H](O)[C@@H](CO)O1 IWUCXVSUMQZMFG-AFCXAGJDSA-N 0.000 description 1
- 241000713124 Rift Valley fever virus Species 0.000 description 1
- 241000405729 Rosavirus A Species 0.000 description 1
- 241000711837 Roseburia sp. Species 0.000 description 1
- 241000710942 Ross River virus Species 0.000 description 1
- 241001137860 Rotavirus A Species 0.000 description 1
- 241001137861 Rotavirus B Species 0.000 description 1
- 241001506005 Rotavirus C Species 0.000 description 1
- 241000710799 Rubella virus Species 0.000 description 1
- 241000134861 Ruminococcus sp. Species 0.000 description 1
- 241000315672 SARS coronavirus Species 0.000 description 1
- 241000608282 Sagiyama virus Species 0.000 description 1
- 241000033084 Salivirus A Species 0.000 description 1
- 241001354013 Salmonella enterica subsp. enterica serovar Enteritidis Species 0.000 description 1
- 241001135555 Sandfly fever Sicilian virus Species 0.000 description 1
- 241000369753 Sapporo virus Species 0.000 description 1
- 241000242678 Schistosoma Species 0.000 description 1
- 241000710961 Semliki Forest virus Species 0.000 description 1
- 241000150278 Seoul orthohantavirus Species 0.000 description 1
- 241000713656 Simian foamy virus Species 0.000 description 1
- 241000710960 Sindbis virus Species 0.000 description 1
- 241000713134 Snowshoe hare virus Species 0.000 description 1
- 241000714208 Southampton virus Species 0.000 description 1
- 241000710888 St. Louis encephalitis virus Species 0.000 description 1
- 241000191940 Staphylococcus Species 0.000 description 1
- 241000191963 Staphylococcus epidermidis Species 0.000 description 1
- 241001147693 Staphylococcus sp. Species 0.000 description 1
- 241000194017 Streptococcus Species 0.000 description 1
- 241000193998 Streptococcus pneumoniae Species 0.000 description 1
- 241000193996 Streptococcus pyogenes Species 0.000 description 1
- 241000282898 Sus scrofa Species 0.000 description 1
- 241001340158 Torque teno midi virus 1 Species 0.000 description 1
- 241001340126 Torque teno midi virus 2 Species 0.000 description 1
- 241001339910 Torque teno mini virus 1 Species 0.000 description 1
- 241001340146 Torque teno mini virus 6 Species 0.000 description 1
- 241001340152 Torque teno mini virus 8 Species 0.000 description 1
- 241001339930 Torque teno virus 19 Species 0.000 description 1
- 241001339874 Torque teno virus 3 Species 0.000 description 1
- 241000713154 Toscana virus Species 0.000 description 1
- 241000223996 Toxoplasma Species 0.000 description 1
- 241000223997 Toxoplasma gondii Species 0.000 description 1
- 206010060872 Transplant failure Diseases 0.000 description 1
- 206010066901 Treatment failure Diseases 0.000 description 1
- 241000242541 Trematoda Species 0.000 description 1
- 241000589884 Treponema pallidum Species 0.000 description 1
- 241000589906 Treponema sp. Species 0.000 description 1
- 241000224526 Trichomonas Species 0.000 description 1
- 241000224527 Trichomonas vaginalis Species 0.000 description 1
- 108010021119 Trichosanthin Proteins 0.000 description 1
- 239000007983 Tris buffer Substances 0.000 description 1
- 241000223104 Trypanosoma Species 0.000 description 1
- 241000223109 Trypanosoma cruzi Species 0.000 description 1
- 241000713152 Uukuniemi virus Species 0.000 description 1
- 241000700618 Vaccinia virus Species 0.000 description 1
- 108010059993 Vancomycin Proteins 0.000 description 1
- 206010046980 Varicella Diseases 0.000 description 1
- 241000710959 Venezuelan equine encephalitis virus Species 0.000 description 1
- 241000711975 Vesicular stomatitis virus Species 0.000 description 1
- OIRDTQYFTABQOQ-UHTZMRCNSA-N Vidarabine Chemical compound C1=NC=2C(N)=NC=NC=2N1[C@@H]1O[C@H](CO)[C@@H](O)[C@@H]1O OIRDTQYFTABQOQ-UHTZMRCNSA-N 0.000 description 1
- 108010015940 Viomycin Proteins 0.000 description 1
- OZKXLOZHHUHGNV-UHFFFAOYSA-N Viomycin Natural products NCCCC(N)CC(=O)NC1CNC(=O)C(=CNC(=O)N)NC(=O)C(CO)NC(=O)C(CO)NC(=O)C(NC1=O)C2CC(O)NC(=N)N2 OZKXLOZHHUHGNV-UHFFFAOYSA-N 0.000 description 1
- 208000028227 Viral hemorrhagic fever Diseases 0.000 description 1
- 208000000260 Warts Diseases 0.000 description 1
- 241000710886 West Nile virus Species 0.000 description 1
- 241000710951 Western equine encephalitis virus Species 0.000 description 1
- 206010052428 Wound Diseases 0.000 description 1
- 241001536558 Yaba monkey tumor virus Species 0.000 description 1
- 241000913725 Yaba-like disease virus Species 0.000 description 1
- 241000710772 Yellow fever virus Species 0.000 description 1
- WREGKURFCTUGRC-POYBYMJQSA-N Zalcitabine Chemical compound O=C1N=C(N)C=CN1[C@@H]1O[C@H](CO)CC1 WREGKURFCTUGRC-POYBYMJQSA-N 0.000 description 1
- 241000907316 Zika virus Species 0.000 description 1
- RRDRHWJDBOGQHN-JWCTVYNTSA-N [2-[(2s,5r,8s,11s,14r,17s,22s)-17-[(1r)-1-hydroxyethyl]-22-[[(2s)-2-[[(2s,3r)-3-hydroxy-2-[[(2s)-2-[6-methyloctanoyl(sulfomethyl)amino]-4-(sulfomethylamino)butanoyl]amino]butyl]amino]-4-(sulfomethylamino)butanoyl]amino]-5,8-bis(2-methylpropyl)-3,6,9,12,15 Chemical compound CCC(C)CCCCC(=O)N(CS(O)(=O)=O)[C@@H](CCNCS(O)(=O)=O)C(=O)N[C@H]([C@@H](C)O)CN[C@@H](CCNCS(O)(=O)=O)C(=O)N[C@H]1CCNC(=O)[C@H]([C@@H](C)O)NC(=O)[C@@H](CCNCS(O)(=O)=O)NC(=O)[C@H](CCNCS(O)(=O)=O)NC(=O)[C@H](CC(C)C)NC(=O)[C@@H](CC(C)C)NC(=O)[C@H](CCNCS(O)(=O)=O)NC1=O RRDRHWJDBOGQHN-JWCTVYNTSA-N 0.000 description 1
- 238000010521 absorption reaction Methods 0.000 description 1
- 239000002253 acid Substances 0.000 description 1
- 150000007513 acids Chemical class 0.000 description 1
- 230000003213 activating effect Effects 0.000 description 1
- 229940086176 acyclovir 400 mg Drugs 0.000 description 1
- 208000011589 adenoviridae infectious disease Diseases 0.000 description 1
- 230000002411 adverse Effects 0.000 description 1
- 238000003314 affinity selection Methods 0.000 description 1
- 230000000735 allogeneic effect Effects 0.000 description 1
- 230000004075 alteration Effects 0.000 description 1
- DKNWSYNQZKUICI-UHFFFAOYSA-N amantadine Chemical compound C1C(C2)CC3CC2CC1(N)C3 DKNWSYNQZKUICI-UHFFFAOYSA-N 0.000 description 1
- 229960003805 amantadine Drugs 0.000 description 1
- 229960004821 amikacin Drugs 0.000 description 1
- LKCWBDHBTVXHDL-RMDFUYIESA-N amikacin Chemical compound O([C@@H]1[C@@H](N)C[C@H]([C@@H]([C@H]1O)O[C@@H]1[C@@H]([C@@H](N)[C@H](O)[C@@H](CO)O1)O)NC(=O)[C@@H](O)CCN)[C@H]1O[C@H](CN)[C@@H](O)[C@H](O)[C@H]1O LKCWBDHBTVXHDL-RMDFUYIESA-N 0.000 description 1
- 229940126575 aminoglycoside Drugs 0.000 description 1
- 238000002669 amniocentesis Methods 0.000 description 1
- 229960003022 amoxicillin Drugs 0.000 description 1
- LSQZJLSUYDQPKJ-NJBDSQKTSA-N amoxicillin Chemical compound C1([C@@H](N)C(=O)N[C@H]2[C@H]3SC([C@@H](N3C2=O)C(O)=O)(C)C)=CC=C(O)C=C1 LSQZJLSUYDQPKJ-NJBDSQKTSA-N 0.000 description 1
- 229960000723 ampicillin Drugs 0.000 description 1
- AVKUERGKIZMTKX-NJBDSQKTSA-N ampicillin Chemical compound C1([C@@H](N)C(=O)N[C@H]2[C@H]3SC([C@@H](N3C2=O)C(O)=O)(C)C)=CC=CC=C1 AVKUERGKIZMTKX-NJBDSQKTSA-N 0.000 description 1
- 210000004102 animal cell Anatomy 0.000 description 1
- 238000010171 animal model Methods 0.000 description 1
- 208000025009 anogenital human papillomavirus infection Diseases 0.000 description 1
- 201000004201 anogenital venereal wart Diseases 0.000 description 1
- 230000000844 anti-bacterial effect Effects 0.000 description 1
- 238000011203 antimicrobial therapy Methods 0.000 description 1
- 238000002617 apheresis Methods 0.000 description 1
- 230000001640 apoptogenic effect Effects 0.000 description 1
- 230000006907 apoptotic process Effects 0.000 description 1
- KUCQYCKVKVOKAY-CTYIDZIISA-N atovaquone Chemical compound C1([C@H]2CC[C@@H](CC2)C2=C(C(C3=CC=CC=C3C2=O)=O)O)=CC=C(Cl)C=C1 KUCQYCKVKVOKAY-CTYIDZIISA-N 0.000 description 1
- 229960003159 atovaquone Drugs 0.000 description 1
- 229940065181 bacillus anthracis Drugs 0.000 description 1
- 229960003071 bacitracin Drugs 0.000 description 1
- 229930184125 bacitracin Natural products 0.000 description 1
- CLKOFPXJLQSYAH-ABRJDSQDSA-N bacitracin A Chemical compound C1SC([C@@H](N)[C@@H](C)CC)=N[C@@H]1C(=O)N[C@@H](CC(C)C)C(=O)N[C@H](CCC(O)=O)C(=O)N[C@@H]([C@@H](C)CC)C(=O)N[C@@H]1C(=O)N[C@H](CCCN)C(=O)N[C@@H]([C@@H](C)CC)C(=O)N[C@H](CC=2C=CC=CC=2)C(=O)N[C@@H](CC=2N=CNC=2)C(=O)N[C@H](CC(O)=O)C(=O)N[C@@H](CC(N)=O)C(=O)NCCCC1 CLKOFPXJLQSYAH-ABRJDSQDSA-N 0.000 description 1
- 230000003385 bacteriostatic effect Effects 0.000 description 1
- 230000037429 base substitution Effects 0.000 description 1
- 239000011324 bead Substances 0.000 description 1
- 229940002008 bifidobacterium bifidum Drugs 0.000 description 1
- 210000000941 bile Anatomy 0.000 description 1
- 210000000013 bile duct Anatomy 0.000 description 1
- 102000023732 binding proteins Human genes 0.000 description 1
- 108091008324 binding proteins Proteins 0.000 description 1
- 238000000876 binomial test Methods 0.000 description 1
- 230000031018 biological processes and functions Effects 0.000 description 1
- 230000005540 biological transmission Effects 0.000 description 1
- 238000010241 blood sampling Methods 0.000 description 1
- 210000002798 bone marrow cell Anatomy 0.000 description 1
- 206010006060 bowenoid papulosis Diseases 0.000 description 1
- 230000005978 brain dysfunction Effects 0.000 description 1
- 210000000481 breast Anatomy 0.000 description 1
- 201000003848 bronchiolitis obliterans Diseases 0.000 description 1
- 208000023367 bronchiolitis obliterans with obstructive pulmonary disease Diseases 0.000 description 1
- 239000000872 buffer Substances 0.000 description 1
- 230000036952 cancer formation Effects 0.000 description 1
- 229960003669 carbenicillin Drugs 0.000 description 1
- FPPNZSSZRUTDAP-UWFZAAFLSA-N carbenicillin Chemical compound N([C@H]1[C@H]2SC([C@@H](N2C1=O)C(O)=O)(C)C)C(=O)C(C(O)=O)C1=CC=CC=C1 FPPNZSSZRUTDAP-UWFZAAFLSA-N 0.000 description 1
- 231100000504 carcinogenesis Toxicity 0.000 description 1
- 230000015556 catabolic process Effects 0.000 description 1
- 230000003197 catalytic effect Effects 0.000 description 1
- 229950004030 cefaloglycin Drugs 0.000 description 1
- FUBBGQLTSCSAON-PBFPGSCMSA-N cefaloglycin Chemical compound C1([C@@H](N)C(=O)N[C@H]2[C@@H]3N(C2=O)C(=C(CS3)COC(=O)C)C(O)=O)=CC=CC=C1 FUBBGQLTSCSAON-PBFPGSCMSA-N 0.000 description 1
- 229960003866 cefaloridine Drugs 0.000 description 1
- CZTQZXZIADLWOZ-CRAIPNDOSA-N cefaloridine Chemical compound O=C([C@@H](NC(=O)CC=1SC=CC=1)[C@H]1SC2)N1C(C(=O)[O-])=C2C[N+]1=CC=CC=C1 CZTQZXZIADLWOZ-CRAIPNDOSA-N 0.000 description 1
- 229960000603 cefalotin Drugs 0.000 description 1
- 229960003012 cefamandole Drugs 0.000 description 1
- OLVCFLKTBJRLHI-AXAPSJFSSA-N cefamandole Chemical compound CN1N=NN=C1SCC1=C(C(O)=O)N2C(=O)[C@@H](NC(=O)[C@H](O)C=3C=CC=CC=3)[C@H]2SC1 OLVCFLKTBJRLHI-AXAPSJFSSA-N 0.000 description 1
- 229960004350 cefapirin Drugs 0.000 description 1
- 229960001139 cefazolin Drugs 0.000 description 1
- MLYYVTUWGNIJIB-BXKDBHETSA-N cefazolin Chemical compound S1C(C)=NN=C1SCC1=C(C(O)=O)N2C(=O)[C@@H](NC(=O)CN3N=NN=C3)[C@H]2SC1 MLYYVTUWGNIJIB-BXKDBHETSA-N 0.000 description 1
- 229960002588 cefradine Drugs 0.000 description 1
- 238000004113 cell culture Methods 0.000 description 1
- 108091092259 cell-free RNA Proteins 0.000 description 1
- 230000001413 cellular effect Effects 0.000 description 1
- 229940106164 cephalexin Drugs 0.000 description 1
- ZAIPMKNFIOOWCQ-UEKVPHQBSA-N cephalexin Chemical compound C1([C@@H](N)C(=O)N[C@H]2[C@@H]3N(C2=O)C(=C(CS3)C)C(O)=O)=CC=CC=C1 ZAIPMKNFIOOWCQ-UEKVPHQBSA-N 0.000 description 1
- 229940124587 cephalosporin Drugs 0.000 description 1
- 150000001780 cephalosporins Chemical class 0.000 description 1
- VUFGUVLLDPOSBC-XRZFDKQNSA-M cephalothin sodium Chemical compound [Na+].N([C@H]1[C@@H]2N(C1=O)C(=C(CS2)COC(=O)C)C([O-])=O)C(=O)CC1=CC=CS1 VUFGUVLLDPOSBC-XRZFDKQNSA-M 0.000 description 1
- RDLPVSKMFDYCOR-UEKVPHQBSA-N cephradine Chemical compound C1([C@@H](N)C(=O)N[C@H]2[C@@H]3N(C2=O)C(=C(CS3)C)C(O)=O)=CCC=CC1 RDLPVSKMFDYCOR-UEKVPHQBSA-N 0.000 description 1
- 210000003679 cervix uteri Anatomy 0.000 description 1
- 238000002512 chemotherapy Methods 0.000 description 1
- 229960005091 chloramphenicol Drugs 0.000 description 1
- WIIZWVCIJKGZOK-RKDXNWHRSA-N chloramphenicol Chemical compound ClC(Cl)C(=O)N[C@H](CO)[C@H](O)C1=CC=C([N+]([O-])=O)C=C1 WIIZWVCIJKGZOK-RKDXNWHRSA-N 0.000 description 1
- YTRQFSDWAXHJCC-UHFFFAOYSA-N chloroform;phenol Chemical compound ClC(Cl)Cl.OC1=CC=CC=C1 YTRQFSDWAXHJCC-UHFFFAOYSA-N 0.000 description 1
- CYDMQBQPVICBEU-UHFFFAOYSA-N chlorotetracycline Natural products C1=CC(Cl)=C2C(O)(C)C3CC4C(N(C)C)C(O)=C(C(N)=O)C(=O)C4(O)C(O)=C3C(=O)C2=C1O CYDMQBQPVICBEU-UHFFFAOYSA-N 0.000 description 1
- 229960004475 chlortetracycline Drugs 0.000 description 1
- CYDMQBQPVICBEU-XRNKAMNCSA-N chlortetracycline Chemical compound C1=CC(Cl)=C2[C@](O)(C)[C@H]3C[C@H]4[C@H](N(C)C)C(O)=C(C(N)=O)C(=O)[C@@]4(O)C(O)=C3C(=O)C2=C1O CYDMQBQPVICBEU-XRNKAMNCSA-N 0.000 description 1
- 235000019365 chlortetracycline Nutrition 0.000 description 1
- 210000004252 chorionic villi Anatomy 0.000 description 1
- 210000003040 circulating cell Anatomy 0.000 description 1
- 230000007882 cirrhosis Effects 0.000 description 1
- 208000019425 cirrhosis of liver Diseases 0.000 description 1
- 229960002227 clindamycin Drugs 0.000 description 1
- KDLRVYVGXIQJDK-AWPVFWJPSA-N clindamycin Chemical compound CN1C[C@H](CCC)C[C@H]1C(=O)N[C@H]([C@H](C)Cl)[C@@H]1[C@H](O)[C@H](O)[C@@H](O)[C@@H](SC)O1 KDLRVYVGXIQJDK-AWPVFWJPSA-N 0.000 description 1
- 229960003326 cloxacillin Drugs 0.000 description 1
- LQOLIRLGBULYKD-JKIFEVAISA-N cloxacillin Chemical compound N([C@@H]1C(N2[C@H](C(C)(C)S[C@@H]21)C(O)=O)=O)C(=O)C1=C(C)ON=C1C1=CC=CC=C1Cl LQOLIRLGBULYKD-JKIFEVAISA-N 0.000 description 1
- 229940047766 co-trimoxazole Drugs 0.000 description 1
- 229940108538 colistimethate Drugs 0.000 description 1
- 229960003346 colistin Drugs 0.000 description 1
- 108700028201 colistinmethanesulfonic acid Proteins 0.000 description 1
- 230000002301 combined effect Effects 0.000 description 1
- 238000011109 contamination Methods 0.000 description 1
- 230000001276 controlling effect Effects 0.000 description 1
- 230000002596 correlated effect Effects 0.000 description 1
- 229960001334 corticosteroids Drugs 0.000 description 1
- 230000008878 coupling Effects 0.000 description 1
- 238000010168 coupling process Methods 0.000 description 1
- 238000005859 coupling reaction Methods 0.000 description 1
- 201000003740 cowpox Diseases 0.000 description 1
- 229960003077 cycloserine Drugs 0.000 description 1
- 229960000860 dapsone Drugs 0.000 description 1
- 238000007405 data analysis Methods 0.000 description 1
- 230000034994 death Effects 0.000 description 1
- 229960002398 demeclocycline Drugs 0.000 description 1
- 230000002638 denervation Effects 0.000 description 1
- 208000025729 dengue disease Diseases 0.000 description 1
- 229950000330 desciclovir Drugs 0.000 description 1
- 238000011161 development Methods 0.000 description 1
- 238000002405 diagnostic procedure Methods 0.000 description 1
- 229960001585 dicloxacillin Drugs 0.000 description 1
- YFAGHNZHGGCZAX-JKIFEVAISA-N dicloxacillin Chemical compound N([C@@H]1C(N2[C@H](C(C)(C)S[C@@H]21)C(O)=O)=O)C(=O)C1=C(C)ON=C1C1=C(Cl)C=CC=C1Cl YFAGHNZHGGCZAX-JKIFEVAISA-N 0.000 description 1
- 230000003292 diminished effect Effects 0.000 description 1
- 208000037771 disease arising from reactivation of latent virus Diseases 0.000 description 1
- 229960003722 doxycycline Drugs 0.000 description 1
- LXBIFEVIBLOUGU-JGWLITMVSA-N duvoglustat Chemical compound OC[C@H]1NC[C@H](O)[C@@H](O)[C@@H]1O LXBIFEVIBLOUGU-JGWLITMVSA-N 0.000 description 1
- 239000012636 effector Substances 0.000 description 1
- 239000000839 emulsion Substances 0.000 description 1
- 238000001839 endoscopy Methods 0.000 description 1
- 229940007078 entamoeba histolytica Drugs 0.000 description 1
- 229940032049 enterococcus faecalis Drugs 0.000 description 1
- 230000007613 environmental effect Effects 0.000 description 1
- 229950008161 enviroxime Drugs 0.000 description 1
- 201000004306 epidermodysplasia verruciformis Diseases 0.000 description 1
- 229960003276 erythromycin Drugs 0.000 description 1
- 150000002148 esters Chemical class 0.000 description 1
- 230000005567 fecaloral disease transmission Effects 0.000 description 1
- 210000003608 fece Anatomy 0.000 description 1
- 210000004700 fetal blood Anatomy 0.000 description 1
- 229950003564 fiacitabine Drugs 0.000 description 1
- 229950008802 fialuridine Drugs 0.000 description 1
- 230000000893 fibroproliferative effect Effects 0.000 description 1
- 230000004761 fibrosis Effects 0.000 description 1
- 230000003176 fibrotic effect Effects 0.000 description 1
- 238000001914 filtration Methods 0.000 description 1
- 238000009093 first-line therapy Methods 0.000 description 1
- 229960000961 floxuridine Drugs 0.000 description 1
- ODKNJVUHOIMIIZ-RRKCRQDMSA-N floxuridine Chemical compound C1[C@H](O)[C@@H](CO)O[C@H]1N1C(=O)NC(=O)C(F)=C1 ODKNJVUHOIMIIZ-RRKCRQDMSA-N 0.000 description 1
- 238000001943 fluorescence-activated cell sorting Methods 0.000 description 1
- 235000013305 food Nutrition 0.000 description 1
- 238000013467 fragmentation Methods 0.000 description 1
- 238000006062 fragmentation reaction Methods 0.000 description 1
- 229960002963 ganciclovir Drugs 0.000 description 1
- IRSCQMHQWWYFCW-UHFFFAOYSA-N ganciclovir Chemical compound O=C1NC(N)=NC2=C1N=CN2COC(CO)CO IRSCQMHQWWYFCW-UHFFFAOYSA-N 0.000 description 1
- 238000012268 genome sequencing Methods 0.000 description 1
- 229960002518 gentamicin Drugs 0.000 description 1
- 229940085435 giardia lamblia Drugs 0.000 description 1
- 238000009499 grossing Methods 0.000 description 1
- 239000001963 growth medium Substances 0.000 description 1
- 210000005003 heart tissue Anatomy 0.000 description 1
- 210000003709 heart valve Anatomy 0.000 description 1
- 229940037467 helicobacter pylori Drugs 0.000 description 1
- 208000006454 hepatitis Diseases 0.000 description 1
- 231100000283 hepatitis Toxicity 0.000 description 1
- 210000003494 hepatocyte Anatomy 0.000 description 1
- 238000007849 hot-start PCR Methods 0.000 description 1
- 210000004251 human milk Anatomy 0.000 description 1
- 235000020256 human milk Nutrition 0.000 description 1
- 239000002471 hydroxymethylglutaryl coenzyme A reductase inhibitor Substances 0.000 description 1
- 229940005608 hypericin Drugs 0.000 description 1
- BTXNYTINYBABQR-UHFFFAOYSA-N hypericin Chemical compound C12=C(O)C=C(O)C(C(C=3C(O)=CC(C)=C4C=33)=O)=C2C3=C2C3=C4C(C)=CC(O)=C3C(=O)C3=C(O)C=C(O)C1=C32 BTXNYTINYBABQR-UHFFFAOYSA-N 0.000 description 1
- PHOKTTKFQUYZPI-UHFFFAOYSA-N hypericin Natural products Cc1cc(O)c2c3C(=O)C(=Cc4c(O)c5c(O)cc(O)c6c7C(=O)C(=Cc8c(C)c1c2c(c78)c(c34)c56)O)O PHOKTTKFQUYZPI-UHFFFAOYSA-N 0.000 description 1
- 230000000521 hyperimmunizing effect Effects 0.000 description 1
- 210000002865 immune cell Anatomy 0.000 description 1
- 230000036737 immune function Effects 0.000 description 1
- 230000028993 immune response Effects 0.000 description 1
- 238000002649 immunization Methods 0.000 description 1
- 230000003053 immunization Effects 0.000 description 1
- 230000001976 improved effect Effects 0.000 description 1
- 238000001727 in vivo Methods 0.000 description 1
- 238000010348 incorporation Methods 0.000 description 1
- 230000001939 inductive effect Effects 0.000 description 1
- 230000008595 infiltration Effects 0.000 description 1
- 238000001764 infiltration Methods 0.000 description 1
- 230000005764 inhibitory process Effects 0.000 description 1
- 230000000977 initiatory effect Effects 0.000 description 1
- 230000010354 integration Effects 0.000 description 1
- 229940079322 interferon Drugs 0.000 description 1
- 230000000968 intestinal effect Effects 0.000 description 1
- 230000007413 intestinal health Effects 0.000 description 1
- 238000011835 investigation Methods 0.000 description 1
- 230000001788 irregular Effects 0.000 description 1
- 230000000302 ischemic effect Effects 0.000 description 1
- SUMDYPCJJOFFON-UHFFFAOYSA-N isethionic acid Chemical compound OCCS(O)(=O)=O SUMDYPCJJOFFON-UHFFFAOYSA-N 0.000 description 1
- 238000002955 isolation Methods 0.000 description 1
- 229960004130 itraconazole Drugs 0.000 description 1
- 229960000318 kanamycin Drugs 0.000 description 1
- 229930027917 kanamycin Natural products 0.000 description 1
- SBUJHOSQTJFQJX-NOAMYHISSA-N kanamycin Chemical compound O[C@@H]1[C@@H](O)[C@H](O)[C@@H](CN)O[C@@H]1O[C@H]1[C@H](O)[C@@H](O[C@@H]2[C@@H]([C@@H](N)[C@H](O)[C@@H](CO)O2)O)[C@H](N)C[C@@H]1N SBUJHOSQTJFQJX-NOAMYHISSA-N 0.000 description 1
- 229930182823 kanamycin A Natural products 0.000 description 1
- 208000017169 kidney disease Diseases 0.000 description 1
- 201000006370 kidney failure Diseases 0.000 description 1
- 230000003907 kidney function Effects 0.000 description 1
- 229940039696 lactobacillus Drugs 0.000 description 1
- 229940115932 legionella pneumophila Drugs 0.000 description 1
- 230000000670 limiting effect Effects 0.000 description 1
- 229960005287 lincomycin Drugs 0.000 description 1
- OJMMVQQUTAEWLP-KIDUDLJLSA-N lincomycin Chemical compound CN1C[C@H](CCC)C[C@H]1C(=O)N[C@H]([C@@H](C)O)[C@@H]1[C@H](O)[C@H](O)[C@@H](O)[C@@H](SC)O1 OJMMVQQUTAEWLP-KIDUDLJLSA-N 0.000 description 1
- 229940115931 listeria monocytogenes Drugs 0.000 description 1
- 201000005202 lung cancer Diseases 0.000 description 1
- 208000020816 lung neoplasm Diseases 0.000 description 1
- 210000004880 lymph fluid Anatomy 0.000 description 1
- 210000001165 lymph node Anatomy 0.000 description 1
- 239000003120 macrolide antibiotic agent Substances 0.000 description 1
- 229940041033 macrolides Drugs 0.000 description 1
- 238000004519 manufacturing process Methods 0.000 description 1
- 239000000463 material Substances 0.000 description 1
- MIKKOBKEXMRYFQ-WZTVWXICSA-N meglumine amidotrizoate Chemical compound C[NH2+]C[C@H](O)[C@@H](O)[C@H](O)[C@H](O)CO.CC(=O)NC1=C(I)C(NC(C)=O)=C(I)C(C([O-])=O)=C1I MIKKOBKEXMRYFQ-WZTVWXICSA-N 0.000 description 1
- 239000012528 membrane Substances 0.000 description 1
- 229940042016 methacycline Drugs 0.000 description 1
- 229940005028 methylprednisolone 500 mg Drugs 0.000 description 1
- 229960003085 meticillin Drugs 0.000 description 1
- 235000013336 milk Nutrition 0.000 description 1
- 239000008267 milk Substances 0.000 description 1
- 210000004080 milk Anatomy 0.000 description 1
- 208000020298 milker nodule Diseases 0.000 description 1
- 229960004023 minocycline Drugs 0.000 description 1
- 238000010369 molecular cloning Methods 0.000 description 1
- 208000008588 molluscum contagiosum Diseases 0.000 description 1
- 208000005871 monkeypox Diseases 0.000 description 1
- 210000000214 mouth Anatomy 0.000 description 1
- 210000004400 mucous membrane Anatomy 0.000 description 1
- 229960003816 muromonab-cd3 Drugs 0.000 description 1
- 210000003205 muscle Anatomy 0.000 description 1
- JORAUNFTUVJTNG-BSTBCYLQSA-N n-[(2s)-4-amino-1-[[(2s,3r)-1-[[(2s)-4-amino-1-oxo-1-[[(3s,6s,9s,12s,15r,18s,21s)-6,9,18-tris(2-aminoethyl)-3-[(1r)-1-hydroxyethyl]-12,15-bis(2-methylpropyl)-2,5,8,11,14,17,20-heptaoxo-1,4,7,10,13,16,19-heptazacyclotricos-21-yl]amino]butan-2-yl]amino]-3-h Chemical compound CC(C)CCCCC(=O)N[C@@H](CCN)C(=O)N[C@H]([C@@H](C)O)CN[C@@H](CCN)C(=O)N[C@H]1CCNC(=O)[C@H]([C@@H](C)O)NC(=O)[C@H](CCN)NC(=O)[C@H](CCN)NC(=O)[C@H](CC(C)C)NC(=O)[C@@H](CC(C)C)NC(=O)[C@H](CCN)NC1=O.CCC(C)CCCCC(=O)N[C@@H](CCN)C(=O)N[C@H]([C@@H](C)O)CN[C@@H](CCN)C(=O)N[C@H]1CCNC(=O)[C@H]([C@@H](C)O)NC(=O)[C@H](CCN)NC(=O)[C@H](CCN)NC(=O)[C@H](CC(C)C)NC(=O)[C@@H](CC(C)C)NC(=O)[C@H](CCN)NC1=O JORAUNFTUVJTNG-BSTBCYLQSA-N 0.000 description 1
- 229960000515 nafcillin Drugs 0.000 description 1
- GPXLMGHLHQJAGZ-JTDSTZFVSA-N nafcillin Chemical compound C1=CC=CC2=C(C(=O)N[C@@H]3C(N4[C@H](C(C)(C)S[C@@H]43)C(O)=O)=O)C(OCC)=CC=C21 GPXLMGHLHQJAGZ-JTDSTZFVSA-N 0.000 description 1
- 230000001338 necrotic effect Effects 0.000 description 1
- 229960004927 neomycin Drugs 0.000 description 1
- 238000007857 nested PCR Methods 0.000 description 1
- 229960000689 nevirapine Drugs 0.000 description 1
- 238000003499 nucleic acid array Methods 0.000 description 1
- 201000002674 obstructive nephropathy Diseases 0.000 description 1
- 238000005457 optimization Methods 0.000 description 1
- 229940126701 oral medication Drugs 0.000 description 1
- 230000008520 organization Effects 0.000 description 1
- 229960001019 oxacillin Drugs 0.000 description 1
- UWYHMGVUTGAWSP-JKIFEVAISA-N oxacillin Chemical compound N([C@@H]1C(N2[C@H](C(C)(C)S[C@@H]21)C(O)=O)=O)C(=O)C1=C(C)ON=C1C1=CC=CC=C1 UWYHMGVUTGAWSP-JKIFEVAISA-N 0.000 description 1
- 229960000625 oxytetracycline Drugs 0.000 description 1
- IWVCMVBTMGNXQD-PXOLEDIWSA-N oxytetracycline Chemical compound C1=CC=C2[C@](O)(C)[C@H]3[C@H](O)[C@H]4[C@H](N(C)C)C(O)=C(C(N)=O)C(=O)[C@@]4(O)C(O)=C3C(=O)C2=C1O IWVCMVBTMGNXQD-PXOLEDIWSA-N 0.000 description 1
- 235000019366 oxytetracycline Nutrition 0.000 description 1
- LSQZJLSUYDQPKJ-UHFFFAOYSA-N p-Hydroxyampicillin Natural products O=C1N2C(C(O)=O)C(C)(C)SC2C1NC(=O)C(N)C1=CC=C(O)C=C1 LSQZJLSUYDQPKJ-UHFFFAOYSA-N 0.000 description 1
- 238000004091 panning Methods 0.000 description 1
- 230000003071 parasitic effect Effects 0.000 description 1
- 239000002245 particle Substances 0.000 description 1
- 229940056360 penicillin g Drugs 0.000 description 1
- 150000002960 penicillins Chemical class 0.000 description 1
- 230000002085 persistent effect Effects 0.000 description 1
- 238000011458 pharmacological treatment Methods 0.000 description 1
- NONJJLVGHLVQQM-JHXYUMNGSA-N phenethicillin Chemical compound N([C@@H]1C(N2[C@H](C(C)(C)S[C@@H]21)C(O)=O)=O)C(=O)C(C)OC1=CC=CC=C1 NONJJLVGHLVQQM-JHXYUMNGSA-N 0.000 description 1
- 229960004894 pheneticillin Drugs 0.000 description 1
- 230000035479 physiological effects, processes and functions Effects 0.000 description 1
- 239000013612 plasmid Substances 0.000 description 1
- 238000006116 polymerization reaction Methods 0.000 description 1
- 229920000024 polymyxin B Polymers 0.000 description 1
- XDJYMJULXQKGMM-UHFFFAOYSA-N polymyxin E1 Natural products CCC(C)CCCCC(=O)NC(CCN)C(=O)NC(C(C)O)C(=O)NC(CCN)C(=O)NC1CCNC(=O)C(C(C)O)NC(=O)C(CCN)NC(=O)C(CCN)NC(=O)C(CC(C)C)NC(=O)C(CC(C)C)NC(=O)C(CCN)NC1=O XDJYMJULXQKGMM-UHFFFAOYSA-N 0.000 description 1
- KNIWPHSUTGNZST-UHFFFAOYSA-N polymyxin E2 Natural products CC(C)CCCCC(=O)NC(CCN)C(=O)NC(C(C)O)C(=O)NC(CCN)C(=O)NC1CCNC(=O)C(C(C)O)NC(=O)C(CCN)NC(=O)C(CCN)NC(=O)C(CC(C)C)NC(=O)C(CC(C)C)NC(=O)C(CCN)NC1=O KNIWPHSUTGNZST-UHFFFAOYSA-N 0.000 description 1
- 229960005266 polymyxin b Drugs 0.000 description 1
- 239000003910 polypeptide antibiotic agent Substances 0.000 description 1
- 229940102535 prednisone 20 mg Drugs 0.000 description 1
- 238000003793 prenatal diagnosis Methods 0.000 description 1
- 238000009117 preventive therapy Methods 0.000 description 1
- 238000012545 processing Methods 0.000 description 1
- 229940002612 prodrug Drugs 0.000 description 1
- 239000000651 prodrug Substances 0.000 description 1
- 230000002250 progressing effect Effects 0.000 description 1
- 230000000069 prophylactic effect Effects 0.000 description 1
- 229940055019 propionibacterium acne Drugs 0.000 description 1
- 210000002307 prostate Anatomy 0.000 description 1
- 244000000040 protozoan parasite Species 0.000 description 1
- SSKVDVBQSWQEGJ-UHFFFAOYSA-N pseudohypericin Natural products C12=C(O)C=C(O)C(C(C=3C(O)=CC(O)=C4C=33)=O)=C2C3=C2C3=C4C(C)=CC(O)=C3C(=O)C3=C(O)C=C(O)C1=C32 SSKVDVBQSWQEGJ-UHFFFAOYSA-N 0.000 description 1
- 238000009613 pulmonary function test Methods 0.000 description 1
- 238000004445 quantitative analysis Methods 0.000 description 1
- 238000012207 quantitative assay Methods 0.000 description 1
- 238000001959 radiotherapy Methods 0.000 description 1
- 230000007420 reactivation Effects 0.000 description 1
- 230000007115 recruitment Effects 0.000 description 1
- 239000013074 reference sample Substances 0.000 description 1
- 210000002345 respiratory system Anatomy 0.000 description 1
- 230000002441 reversible effect Effects 0.000 description 1
- 229960000329 ribavirin Drugs 0.000 description 1
- HZCAHMRRMINHDJ-DBRKOABJSA-N ribavirin Natural products O[C@@H]1[C@H](O)[C@@H](CO)O[C@H]1N1N=CN=C1 HZCAHMRRMINHDJ-DBRKOABJSA-N 0.000 description 1
- 229960001225 rifampicin Drugs 0.000 description 1
- JQXXHWHPUNPDRT-WLSIYKJHSA-N rifampicin Chemical compound O([C@](C1=O)(C)O/C=C/[C@@H]([C@H]([C@@H](OC(C)=O)[C@H](C)[C@H](O)[C@H](C)[C@@H](O)[C@@H](C)\C=C\C=C(C)/C(=O)NC=2C(O)=C3C([O-])=C4C)C)OC)C4=C1C3=C(O)C=2\C=N\N1CC[NH+](C)CC1 JQXXHWHPUNPDRT-WLSIYKJHSA-N 0.000 description 1
- 229960000888 rimantadine Drugs 0.000 description 1
- 238000005096 rolling process Methods 0.000 description 1
- 201000005404 rubella Diseases 0.000 description 1
- 210000000582 semen Anatomy 0.000 description 1
- 238000000926 separation method Methods 0.000 description 1
- 238000002579 sigmoidoscopy Methods 0.000 description 1
- 244000005714 skin microbiome Species 0.000 description 1
- 239000007790 solid phase Substances 0.000 description 1
- 229960000268 spectinomycin Drugs 0.000 description 1
- UNFWWIHTNXNPBV-WXKVUWSESA-N spectinomycin Chemical compound O([C@@H]1[C@@H](NC)[C@@H](O)[C@H]([C@@H]([C@H]1O1)O)NC)[C@]2(O)[C@H]1O[C@H](C)CC2=O UNFWWIHTNXNPBV-WXKVUWSESA-N 0.000 description 1
- 210000000952 spleen Anatomy 0.000 description 1
- 150000003431 steroids Chemical class 0.000 description 1
- 210000002784 stomach Anatomy 0.000 description 1
- 238000013517 stratification Methods 0.000 description 1
- 229940031000 streptococcus pneumoniae Drugs 0.000 description 1
- 229960005322 streptomycin Drugs 0.000 description 1
- 238000006467 substitution reaction Methods 0.000 description 1
- 238000011410 subtraction method Methods 0.000 description 1
- FIAFUQMPZJWCLV-UHFFFAOYSA-N suramin Chemical compound OS(=O)(=O)C1=CC(S(O)(=O)=O)=C2C(NC(=O)C3=CC=C(C(=C3)NC(=O)C=3C=C(NC(=O)NC=4C=C(C=CC=4)C(=O)NC=4C(=CC=C(C=4)C(=O)NC=4C5=C(C=C(C=C5C(=CC=4)S(O)(=O)=O)S(O)(=O)=O)S(O)(=O)=O)C)C=CC=3)C)=CC=C(S(O)(=O)=O)C2=C1 FIAFUQMPZJWCLV-UHFFFAOYSA-N 0.000 description 1
- 229960005314 suramin Drugs 0.000 description 1
- 238000001356 surgical procedure Methods 0.000 description 1
- 239000000725 suspension Substances 0.000 description 1
- 210000004243 sweat Anatomy 0.000 description 1
- 208000011580 syndromic disease Diseases 0.000 description 1
- 230000002195 synergetic effect Effects 0.000 description 1
- 230000008685 targeting Effects 0.000 description 1
- 210000001138 tear Anatomy 0.000 description 1
- IWVCMVBTMGNXQD-UHFFFAOYSA-N terramycin dehydrate Natural products C1=CC=C2C(O)(C)C3C(O)C4C(N(C)C)C(O)=C(C(N)=O)C(=O)C4(O)C(O)=C3C(=O)C2=C1O IWVCMVBTMGNXQD-UHFFFAOYSA-N 0.000 description 1
- 229960002180 tetracycline Drugs 0.000 description 1
- 229930101283 tetracycline Natural products 0.000 description 1
- 229940040944 tetracyclines Drugs 0.000 description 1
- 229940126585 therapeutic drug Drugs 0.000 description 1
- 230000004797 therapeutic response Effects 0.000 description 1
- 210000000115 thoracic cavity Anatomy 0.000 description 1
- 210000001685 thyroid gland Anatomy 0.000 description 1
- 229960004659 ticarcillin Drugs 0.000 description 1
- OHKOGUYZJXTSFX-KZFFXBSXSA-N ticarcillin Chemical compound C=1([C@@H](C(O)=O)C(=O)N[C@H]2[C@H]3SC([C@@H](N3C2=O)C(O)=O)(C)C)C=CSC=1 OHKOGUYZJXTSFX-KZFFXBSXSA-N 0.000 description 1
- 229960000707 tobramycin Drugs 0.000 description 1
- NLVFBUXFDBBNBW-PBSUHMDJSA-N tobramycin Chemical compound N[C@@H]1C[C@H](O)[C@@H](CN)O[C@@H]1O[C@H]1[C@H](O)[C@@H](O[C@@H]2[C@@H]([C@@H](N)[C@H](O)[C@@H](CO)O2)O)[C@H](N)C[C@@H]1N NLVFBUXFDBBNBW-PBSUHMDJSA-N 0.000 description 1
- 238000013518 transcription Methods 0.000 description 1
- 230000035897 transcription Effects 0.000 description 1
- 230000002103 transcriptional effect Effects 0.000 description 1
- 230000001052 transient effect Effects 0.000 description 1
- LENZDBCJOHFCAS-UHFFFAOYSA-N tris Chemical compound OCC(N)(CO)CO LENZDBCJOHFCAS-UHFFFAOYSA-N 0.000 description 1
- 229960005041 troleandomycin Drugs 0.000 description 1
- LQCLVBQBTUVCEQ-QTFUVMRISA-N troleandomycin Chemical compound O1[C@@H](C)[C@H](OC(C)=O)[C@@H](OC)C[C@@H]1O[C@@H]1[C@@H](C)C(=O)O[C@H](C)[C@H](C)[C@H](OC(C)=O)[C@@H](C)C(=O)[C@@]2(OC2)C[C@H](C)[C@H](O[C@H]2[C@@H]([C@H](C[C@@H](C)O2)N(C)C)OC(C)=O)[C@H]1C LQCLVBQBTUVCEQ-QTFUVMRISA-N 0.000 description 1
- 229960005486 vaccine Drugs 0.000 description 1
- 238000010200 validation analysis Methods 0.000 description 1
- 229960003165 vancomycin Drugs 0.000 description 1
- MYPYJXKWCTUITO-UHFFFAOYSA-N vancomycin Natural products O1C(C(=C2)Cl)=CC=C2C(O)C(C(NC(C2=CC(O)=CC(O)=C2C=2C(O)=CC=C3C=2)C(O)=O)=O)NC(=O)C3NC(=O)C2NC(=O)C(CC(N)=O)NC(=O)C(NC(=O)C(CC(C)C)NC)C(O)C(C=C3Cl)=CC=C3OC3=CC2=CC1=C3OC1OC(CO)C(O)C(O)C1OC1CC(C)(N)C(O)C(C)O1 MYPYJXKWCTUITO-UHFFFAOYSA-N 0.000 description 1
- MYPYJXKWCTUITO-LYRMYLQWSA-O vancomycin(1+) Chemical compound O([C@@H]1[C@@H](O)[C@H](O)[C@@H](CO)O[C@H]1OC1=C2C=C3C=C1OC1=CC=C(C=C1Cl)[C@@H](O)[C@H](C(N[C@@H](CC(N)=O)C(=O)N[C@H]3C(=O)N[C@H]1C(=O)N[C@H](C(N[C@@H](C3=CC(O)=CC(O)=C3C=3C(O)=CC=C1C=3)C([O-])=O)=O)[C@H](O)C1=CC=C(C(=C1)Cl)O2)=O)NC(=O)[C@@H](CC(C)C)[NH2+]C)[C@H]1C[C@](C)([NH3+])[C@H](O)[C@H](C)O1 MYPYJXKWCTUITO-LYRMYLQWSA-O 0.000 description 1
- 229960003636 vidarabine Drugs 0.000 description 1
- 229950001272 viomycin Drugs 0.000 description 1
- GXFAIFRPOKBQRV-GHXCTMGLSA-N viomycin Chemical compound N1C(=O)\C(=C\NC(N)=O)NC(=O)[C@H](CO)NC(=O)[C@H](CO)NC(=O)[C@@H](NC(=O)C[C@@H](N)CCCN)CNC(=O)[C@@H]1[C@@H]1NC(=N)N[C@@H](O)C1 GXFAIFRPOKBQRV-GHXCTMGLSA-N 0.000 description 1
- 230000029812 viral genome replication Effects 0.000 description 1
- 244000052613 viral pathogen Species 0.000 description 1
- 210000002845 virion Anatomy 0.000 description 1
- 238000012800 visualization Methods 0.000 description 1
- 230000003442 weekly effect Effects 0.000 description 1
- 229940051021 yellow-fever virus Drugs 0.000 description 1
- 229960000523 zalcitabine Drugs 0.000 description 1
Images


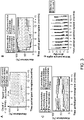


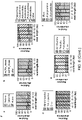

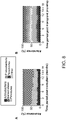


Classifications
-
- C—CHEMISTRY; METALLURGY
- C12—BIOCHEMISTRY; BEER; SPIRITS; WINE; VINEGAR; MICROBIOLOGY; ENZYMOLOGY; MUTATION OR GENETIC ENGINEERING
- C12Q—MEASURING OR TESTING PROCESSES INVOLVING ENZYMES, NUCLEIC ACIDS OR MICROORGANISMS; COMPOSITIONS OR TEST PAPERS THEREFOR; PROCESSES OF PREPARING SUCH COMPOSITIONS; CONDITION-RESPONSIVE CONTROL IN MICROBIOLOGICAL OR ENZYMOLOGICAL PROCESSES
- C12Q1/00—Measuring or testing processes involving enzymes, nucleic acids or microorganisms; Compositions therefor; Processes of preparing such compositions
- C12Q1/70—Measuring or testing processes involving enzymes, nucleic acids or microorganisms; Compositions therefor; Processes of preparing such compositions involving virus or bacteriophage
- C12Q1/701—Specific hybridization probes
- C12Q1/705—Specific hybridization probes for herpetoviridae, e.g. herpes simplex, varicella zoster
-
- C—CHEMISTRY; METALLURGY
- C12—BIOCHEMISTRY; BEER; SPIRITS; WINE; VINEGAR; MICROBIOLOGY; ENZYMOLOGY; MUTATION OR GENETIC ENGINEERING
- C12Q—MEASURING OR TESTING PROCESSES INVOLVING ENZYMES, NUCLEIC ACIDS OR MICROORGANISMS; COMPOSITIONS OR TEST PAPERS THEREFOR; PROCESSES OF PREPARING SUCH COMPOSITIONS; CONDITION-RESPONSIVE CONTROL IN MICROBIOLOGICAL OR ENZYMOLOGICAL PROCESSES
- C12Q1/00—Measuring or testing processes involving enzymes, nucleic acids or microorganisms; Compositions therefor; Processes of preparing such compositions
- C12Q1/68—Measuring or testing processes involving enzymes, nucleic acids or microorganisms; Compositions therefor; Processes of preparing such compositions involving nucleic acids
- C12Q1/6876—Nucleic acid products used in the analysis of nucleic acids, e.g. primers or probes
- C12Q1/6883—Nucleic acid products used in the analysis of nucleic acids, e.g. primers or probes for diseases caused by alterations of genetic material
-
- C—CHEMISTRY; METALLURGY
- C12—BIOCHEMISTRY; BEER; SPIRITS; WINE; VINEGAR; MICROBIOLOGY; ENZYMOLOGY; MUTATION OR GENETIC ENGINEERING
- C12Q—MEASURING OR TESTING PROCESSES INVOLVING ENZYMES, NUCLEIC ACIDS OR MICROORGANISMS; COMPOSITIONS OR TEST PAPERS THEREFOR; PROCESSES OF PREPARING SUCH COMPOSITIONS; CONDITION-RESPONSIVE CONTROL IN MICROBIOLOGICAL OR ENZYMOLOGICAL PROCESSES
- C12Q1/00—Measuring or testing processes involving enzymes, nucleic acids or microorganisms; Compositions therefor; Processes of preparing such compositions
- C12Q1/68—Measuring or testing processes involving enzymes, nucleic acids or microorganisms; Compositions therefor; Processes of preparing such compositions involving nucleic acids
- C12Q1/6876—Nucleic acid products used in the analysis of nucleic acids, e.g. primers or probes
- C12Q1/6888—Nucleic acid products used in the analysis of nucleic acids, e.g. primers or probes for detection or identification of organisms
- C12Q1/689—Nucleic acid products used in the analysis of nucleic acids, e.g. primers or probes for detection or identification of organisms for bacteria
-
- C—CHEMISTRY; METALLURGY
- C12—BIOCHEMISTRY; BEER; SPIRITS; WINE; VINEGAR; MICROBIOLOGY; ENZYMOLOGY; MUTATION OR GENETIC ENGINEERING
- C12Q—MEASURING OR TESTING PROCESSES INVOLVING ENZYMES, NUCLEIC ACIDS OR MICROORGANISMS; COMPOSITIONS OR TEST PAPERS THEREFOR; PROCESSES OF PREPARING SUCH COMPOSITIONS; CONDITION-RESPONSIVE CONTROL IN MICROBIOLOGICAL OR ENZYMOLOGICAL PROCESSES
- C12Q1/00—Measuring or testing processes involving enzymes, nucleic acids or microorganisms; Compositions therefor; Processes of preparing such compositions
- C12Q1/68—Measuring or testing processes involving enzymes, nucleic acids or microorganisms; Compositions therefor; Processes of preparing such compositions involving nucleic acids
- C12Q1/6876—Nucleic acid products used in the analysis of nucleic acids, e.g. primers or probes
- C12Q1/6888—Nucleic acid products used in the analysis of nucleic acids, e.g. primers or probes for detection or identification of organisms
- C12Q1/6895—Nucleic acid products used in the analysis of nucleic acids, e.g. primers or probes for detection or identification of organisms for plants, fungi or algae
-
- C—CHEMISTRY; METALLURGY
- C12—BIOCHEMISTRY; BEER; SPIRITS; WINE; VINEGAR; MICROBIOLOGY; ENZYMOLOGY; MUTATION OR GENETIC ENGINEERING
- C12Q—MEASURING OR TESTING PROCESSES INVOLVING ENZYMES, NUCLEIC ACIDS OR MICROORGANISMS; COMPOSITIONS OR TEST PAPERS THEREFOR; PROCESSES OF PREPARING SUCH COMPOSITIONS; CONDITION-RESPONSIVE CONTROL IN MICROBIOLOGICAL OR ENZYMOLOGICAL PROCESSES
- C12Q1/00—Measuring or testing processes involving enzymes, nucleic acids or microorganisms; Compositions therefor; Processes of preparing such compositions
- C12Q1/70—Measuring or testing processes involving enzymes, nucleic acids or microorganisms; Compositions therefor; Processes of preparing such compositions involving virus or bacteriophage
- C12Q1/701—Specific hybridization probes
-
- G—PHYSICS
- G16—INFORMATION AND COMMUNICATION TECHNOLOGY [ICT] SPECIALLY ADAPTED FOR SPECIFIC APPLICATION FIELDS
- G16B—BIOINFORMATICS, i.e. INFORMATION AND COMMUNICATION TECHNOLOGY [ICT] SPECIALLY ADAPTED FOR GENETIC OR PROTEIN-RELATED DATA PROCESSING IN COMPUTATIONAL MOLECULAR BIOLOGY
- G16B20/00—ICT specially adapted for functional genomics or proteomics, e.g. genotype-phenotype associations
- G16B20/20—Allele or variant detection, e.g. single nucleotide polymorphism [SNP] detection
-
- G—PHYSICS
- G16—INFORMATION AND COMMUNICATION TECHNOLOGY [ICT] SPECIALLY ADAPTED FOR SPECIFIC APPLICATION FIELDS
- G16B—BIOINFORMATICS, i.e. INFORMATION AND COMMUNICATION TECHNOLOGY [ICT] SPECIALLY ADAPTED FOR GENETIC OR PROTEIN-RELATED DATA PROCESSING IN COMPUTATIONAL MOLECULAR BIOLOGY
- G16B30/00—ICT specially adapted for sequence analysis involving nucleotides or amino acids
- G16B30/10—Sequence alignment; Homology search
-
- G—PHYSICS
- G16—INFORMATION AND COMMUNICATION TECHNOLOGY [ICT] SPECIALLY ADAPTED FOR SPECIFIC APPLICATION FIELDS
- G16B—BIOINFORMATICS, i.e. INFORMATION AND COMMUNICATION TECHNOLOGY [ICT] SPECIALLY ADAPTED FOR GENETIC OR PROTEIN-RELATED DATA PROCESSING IN COMPUTATIONAL MOLECULAR BIOLOGY
- G16B30/00—ICT specially adapted for sequence analysis involving nucleotides or amino acids
- G16B30/20—Sequence assembly
-
- Y—GENERAL TAGGING OF NEW TECHNOLOGICAL DEVELOPMENTS; GENERAL TAGGING OF CROSS-SECTIONAL TECHNOLOGIES SPANNING OVER SEVERAL SECTIONS OF THE IPC; TECHNICAL SUBJECTS COVERED BY FORMER USPC CROSS-REFERENCE ART COLLECTIONS [XRACs] AND DIGESTS
- Y02—TECHNOLOGIES OR APPLICATIONS FOR MITIGATION OR ADAPTATION AGAINST CLIMATE CHANGE
- Y02A—TECHNOLOGIES FOR ADAPTATION TO CLIMATE CHANGE
- Y02A90/00—Technologies having an indirect contribution to adaptation to climate change
- Y02A90/10—Information and communication technologies [ICT] supporting adaptation to climate change, e.g. for weather forecasting or climate simulation
Definitions
- the human microbiome is now recognized as an important component of human health.
- Community level analyses have shed light on factors that shape the structure of the bacterial and viral components of the microbiome, such as age, diet, geographical location, antibiotic treatment and disease.
- an individual microbiome can be altered by infection with a pathogenic organism, such that there is an increased prevalence of that organism systemically, or in an undesirable tissue.
- the microbiome can also be altered by changes in the immunocompetence of the individual.
- WO 2013/159035 purportedly concerns calculating an estimated allele frequency of a first allele at least one informative locus using a statistical distribution and determining an amount of cell-free DNA not native to the subject in the cell- free DNA based on the estimated allele frequency.
- WO 2012/168815 describes methods for assembly of nucleic acid sequence data.
- WO 2012/159023 describes gut microflora as biomarkers for the prognosis of cirrhosis and brain dysfunction.
- US 2002/015955 describes a computational subtraction method. Highlander et al., (2012) Animal Health Research Reviews 13(1): 40-53 describes high throughput sequencing methods for microbiome profiling: application to food animal systems.
- microbiome components e.g. the presence and prevalence of commensal, mutualistic, parasitic, opportunistic and pathogenic organisms in an individual microbiome; as well as an analysis of the overall microbiome structure.
- the present invention provides sensitive, rapid, non-invasive methods of monitoring the microbiome composition in clinical samples.
- the present invention is as defined in the appended claims.
- the present invention provides a method of determining a presence and prevalence of microbial sequences in a sample comprising cell-free nucleic acids from a non-microbial host, the method comprising:
- Described herein are methods, devices, compositions and kits for analysis of the microbiome or individual components thereof in an individual.
- the methods find use in a determination of infection, in analysis of the microbiome structure, in determining the immunocompetence of an individual, and the like.
- Described herein are methods of determining the presence and prevalence of microorganisms in an individual, comprising the steps of: (i) providing a sample of cell-free nucleic acids, i.e. DNA and/or RNA from an individual; (ii) performing high-throughput sequencing, for example from about 10 5 , and up to about 10 9 or more reads per sample; (iii) performing bioinformatics analysis to subtract host sequences, i.e. human, cat, dog, etc. from the analysis; and (iv) determining the presence and prevalence of microbial sequences, for example by a comparison of the coverage of sequences mapping to a microbial reference sequence to coverage of the host reference sequence.
- the subtraction of host sequences may include the step of identifying a reference host sequence, and masking microbial sequences or microbial mimicking sequences present in the reference host genome.
- determining the presence of a microbial sequence by comparison to a microbial reference sequence may include the step of identifying a reference microbial sequence, and masking host sequences or host mimicking sequences present in the reference microbial genome.
- a feature of the methods is the unbiased analysis of cell-free nucleic acids from an individual.
- the methods include an unbiased amplification step, for example by performing PCR with universal primers, or by ligation of adapters to the nucleic acid and amplifying with primers specific for the adaptors.
- the methods are typically performed in the absence of sequence specific amplification of microbial sequences.
- a benefit to this approach is that analysis then includes all available microbiome sequences, however it requires bioinformatics analysis to identify sequences of interest in a complex dataset predominated by host sequences.
- a further benefit of the methods is the ability to provide a rapid assessment of an individual microbiome, for example analysis may be completed in less than about 3 days, less than about 2 days, less than one day, e.g. less than about 24 hours, less than about 20 hours, less than about 18 hours, less than about 14 hours, less than about 12 hours, less than about 6 hours, less than about 2 hours, less than about 30 minutes, less than about 15 minutes, less than about 1 minute.
- the analysis of cell-free nucleic acids may be used to compute a pathogenicity score, where the pathogenicity score is a numeric or alphabetic value that summarizes the overall pathogenicity of the organism for ease of interpretation, e.g. by a health practitioner. Different microbes present in the microbiome may be assigned different scores.
- the analysis of the presence and prevalence of microbial sequences can be used to provide a determination on infection, of response to therapy, including anti-microbial treatment such as treatment with antibiotics, anti-viral agents, immunization, passive immunotherapy, and the like; diet; immunosuppression, and the like; of response in clinical trials, etc.
- the information obtained from the analysis may be used to diagnose a condition, to monitor treatment, to select or modify therapeutic regimens, and to optimize therapy.
- therapeutic and/or diagnostic regimens can be individualized and tailored according to the specificity data obtained at different times over the course of treatment, thereby providing a regimen that is individually appropriate.
- patient samples can be obtained at any point during the treatment process; following exposure to a pathogen; course of infection, etc. for analysis.
- the analysis of presence and prevalence of microbial sequences can be provided as a report. The report may be provided to the individual, to a health care professional, etc.
- the cell-free nucleic acid may be obtained from a biological sample selected from the group consisting of blood, serum, cerebrospinal fluid, synovial fluid, urine, and stool.
- the nucleic acid is extracted from the cell free portion of the sample, e.g. serum or plasma portion of blood may be used.
- the nucleic acid may be selected from the group consisting of double-stranded DNA, single-stranded DNA, single-stranded DNA hairpins, DNA/RNA hybrids, single-stranded RNA, double-stranded RNA and RNA hairpins.
- the nucleic acid may be selected from the group consisting of double-stranded DNA, single-stranded DNA and cDNA.
- the nucleic acid may be mRNA.
- the nucleic acid may be circulating cell-free DNA.
- the methods may comprise quantitating the one or more nucleic acids to provide a determination of prevalence of a microorganism in the sample.
- the amount of the one or more nucleic acids above a predetermined threshold value may be indicative of infection or altered prevalence.
- Temporal differences in the amount of the one or more nucleic acids may be indicative of changes in infection, altered prevalence, response to therapy, etc.
- Described herein are computer readable mediums comprising: a set of instructions recorded thereon to cause a computer to perform the steps of: (i) receiving high throughput sequencing data from one or more nucleic acids detected in a sample of cell-free nucleic acids from a subject; (ii) performing bioinformatics analysis to subtract host sequences, i.e. human, cat, dog, etc. from the analysis; and (iii) determining the presence and prevalence of microbial sequences, for example by a comparison of the coverage of sequences mapping to a microbial reference sequence to coverage of the host reference sequence.
- reagents and kits thereof for practicing one or more of the methods described herein.
- compositions and methods are described for the assessment of immunocompetence of an individual, particularly an individual human, by analysis of the microbiome, for example by analysis of the virome.
- the individual may be treated with an immunosuppressive regimen, e.g. drugs, radiation therapy, and the like.
- the individual may be a graft recipient treated with an immunosuppressive regimen.
- the individual may have an autoimmune disease treated with an immunosuppressive regimen.
- An individual may be assessed for immunocompetence in the absence of an immunosuppressive regimen.
- a measurement from an individual may be taken at two or time points, where a change in virus burden is indicative of a change in immunocompetence.
- the individual may be treated in accordance with the assessment of immunocompetence, e.g. where an indication of undesirable increased immunocompetence in a transplant patient is treated with increased levels of immunosuppressive agents; or where an undesirable decrease in immunocompetence is treated with therapeutic agents, e.g. anti-viral agents, etc.
- Nucleic acid analysis is used to identify and quantify nonhuman cell-free nucleic acids in a sample collected from a patient.
- the composition of the components of the microbiome is performed as described above.
- the structure of the viral component of the microbiome (the virome) allows a prediction of immunocompetence.
- the methods may further comprise establishing a virome profile prior to an immunosuppressive regimen, at the initiation of an immunosuppressive regimen, or during the course of an immunosuppressive regimen, which is used as a reference to changes in the individual virome.
- the circulating cell-free DNA may be annellovirus DNA.
- the load of viruses of the anelloviridae family is a predictor of immune strength, which is correlated with the probability of organ transplant rejection. While other viruses may also be predictive, it is common for patients to be treated with antivirals that affect the load of such viruses.
- Also described are methods of diagnosing or predicting transplant status or outcome comprising the steps of: (i) providing a sample from a subject who has received a transplant from a donor; (ii) determining the presence or absence of one or more virome nucleic acids; and (iii) diagnosing or predicting transplant status or outcome based on the virome load.
- the transplant status or outcome may comprise rejection, tolerance, non-rejection based allograft injury, transplant function, transplant survival, chronic transplant injury, or titer pharmacological immunosuppression.
- the amount of the one or more nucleic acids above a predetermined threshold value may be indicative of viral load and immunocompetence.
- the threshold may be a normative value for clinically stable post-transplantation patients with no evidence of transplant rejection or other pathologies. There may be different predetermined threshold values for different transplant outcomes or status. Temporal differences in the amount of the one or more nucleic acids may be indicative of immunocompetence.
- the transplant graft may be any solid organ, bone marrow or skin transplant.
- the transplant may be selected from the group consisting of kidney transplant, heart transplant, liver transplant, pancreas transplant, lung transplant, intestine transplant and skin transplant.
- Described herein are methods, devices, compositions and kits for analysis of the microbiome or individual components thereof in an individual.
- the methods find use in a determination of infection, in analysis of the microbiome structure, in determining the immunocompetence of an individual, and the like.
- Described herein are methods of determining whether a patient or subject is displaying immunocompetence.
- the term "individual”, “patient” or “subject” as used herein includes humans as well as other mammals.
- diagnosis or “diagnosis” of a status or outcome includes predicting or diagnosing the status or outcome, determining predisposition to a status or outcome, monitoring treatment of patient, diagnosing a therapeutic response of a patient, and prognosis of status or outcome, progression, and response to particular treatment.
- microbiota refers to the set of microorganisms present within an individual, usually an individual mammal and more usually a human individual.
- the microbiota may include pathogenic species; species that constitute the normal flora of one tissue, e.g. skin, oral cavity, etc., but are undesirable in other tissues, e.g. blood, lungs, etc.; commensal organisms found in the absence of disease; etc.
- a subset of the microbiome is the virome, which comprises the viral components of the microbiome.
- microbiome component refers to an individual strains or species,
- the component may be a viral component, a bacterial component, a fungal component, etc.
- the surface tissues i.e., skin and mucous membranes
- the mixture of organisms known or presumed to be found in humans at any anatomical site is referred to as the "indigenous microbiota", including various components of the indigenous microbiota.
- various transient components such as pathogenic or opportunistic infections.
- Reference sequences of organisms described below are publicly available and known in the for, example at the Genbank database.
- the intestinal microbiota of humans is dominated by species found within two bacterial phyla: members of the Bacteroidetes and Firmicutes make up >90% of the bacterial population. Actinobacteria (e.g., members of the Bifidobacterium genus) and Proteobacteria among several other phyla are less prominently represented.
- Common species of interest include prominent or less abundant members of this community, and may comprise, without limitation, Bacteroides thetaiotaomicron; Bacteroides caccae; Bacteroides fragilis; Bacteroides melaninogenicus; Bacteroides oralis; Bacteroides uniformis ; Lactobacillus; Clostridium perfringens; Clostridium septicum; Clostridium tetani; Bifidobacterium bifidum; Staphylococcus aureus; Enterococcus faecalis; Escherichia coli; Salmonella enteritidis; Klebsiella sp.; Enterobacter sp.; Proteus mirabilis; Pseudomonas aeruginosa; Peptostreptococcus sp.; Peptococcus sp., Faecalibacterium sp,; Roseburia sp.; Ruminococcus
- Microorganisms that are generally regarded as skin colonizers include coryneforms of the phylum Actinobacteria (the genera Corynebacterium, Propionibacterium, such as Propionibacterium acnes; and Brevibacterium ), the genus Micrococcus and Staphylococcus spp.
- the most commonly isolated fungal species are Malassezia spp., which are especially prevalent in sebaceous areas.
- the Demodex mites (such as Demodex folliculorum and Demodex brevis ) may also be present.
- fungi that are thought to grow on the skin, include Debaryomyces and Cryptococcus spp.
- burn wounds commonly become infected with S. pyogenes, Enterococcus spp. or Pseudomonas aeruginosa, and can also become infected with fungi and/or viruses.
- S. epidermidis is a very common skin commensal, but it is also the most frequent cause of hospital- acquired infection on in-dwelling medical devices such as catheters or heart valves. For a review, see Nat Rev Microbiol. (2011) Apr;9(4):244-53 .
- Pathogenic species may be bacteria, virus, protozoan parasites, fungal species, etc.
- Bacteria include Brucella sp. , Treponema sp. , Mycobacterium sp. , Listeria sp. , Legionella sp. , Helicobacter sp, Streptococcus sp, Neisseria sp, Clostridium sp, Staphylococcus sp.
- Bacillus sp including without limitation Treponema pallidum, Mycobacterium tuberculosis, Mycobacterium leprae, Listeria monocytogenes, Legionella pneumophila, Helicobacter pylori, Streptococcus pneumoniae, Neisseria meningitis, Clostridium novyi, Clostridium botulinum, Staphylococcus aureus, Bacillus anthracis, etc.
- Parasite pathogens include Trichomonas, Toxoplasma, Giardia, Cryptosporidium, Plasmodium, Leishmania, Trypanosoma, Entamoeba, Schistosoma, Filariae, Ascaria, Fasciola ; including without limitation Trichomonas vaginalis, Toxoplasma gondii, Giardia intestinalis, Cryptosporidium parva, Plasmodium falciparum, Trypanosoma cruzi, Entamoeba histolytica, Giardia lamblia, Fasciola hepatica, etc.
- Viruses that infect humans include, for example, Adeno-associated virus; Aichi virus; Australian bat lyssavirus; BK polyomavirus; Banna virus; Barmah forest virus; Bunyamwera virus; Bunyavirus La Crosse; Bunyavirus snowshoe hare; Cercopithecine herpesvirus; Chandipura virus; Chikungunya virus; Cosavirus A; Cowpox virus; Coxsackievirus; Crimean-Congo hemorrhagic fever virus; Dengue virus; Dhori virus; Dugbe virus; Duvenhage virus; Eastern equine encephalitis virus; Ebolavirus; Echovirus; Encephalomyocarditis virus; Epstein-Barr virus; European bat lyssavirus; GB virus C/Hepatitis G virus ; Hantaan virus; Hendra virus; Hepatitis A virus; Hepatitis B virus ; Hepatitis C virus; Hepatitis E virus; Hepati
- louis encephalitis virus Tick-borne powassan virus; Torque teno virus; Toscana virus; Uukuniemi virus; Vaccinia virus; Varicella-zoster virus; Variola virus; Venezuelan equine encephalitis virus; Vesicular stomatitis virus; Western equine encephalitis virus; WU polyomavirus; West Nile virus; Yaba monkey tumor virus; Yaba-like disease virus; Yellow fever virus; Zika virus;
- Anelloviridae The Anelloviridae family consists of non-enveloped, circular, single-stranded DNA viruses. Three genera of anellovirus are known to infect humans, named TTV, TTMDV, and TTMV.
- Torque Teno Virus is a non-enveloped, single-stranded DNA virus with a circular, negative-sense genome.
- a smaller virus which was subsequently named Torque Teno-like Mini Virus (TTMV) has also been characterized, and a third virus with a genomic size in between that of TTV and TTMV was discovered and subsequently named Torque Teno-like Midi Virus (TTMDV).
- TTV Torque Teno-like Mini Virus
- TTMDV Torque Teno-like Midi Virus
- Recent changes in nomenclature have classified the three anelloviruses able to infect humans into Alphatorquevirus (TTV), Betatorquevirus (TTMV), and Gammatorquevirus (TTMDV) Genera of the Anelloviridae family of viruses. To date anelloviruses are still considered "orphan" viruses waiting to be linked to human disease.
- the human anelloviruses differ in genome size ranging from 3.8-3.9 kb for TTV, 3.2 kb for TTMDV, and 2.8-2.9 kb for TTMV.
- a characteristic feature of anelloviruses is the extreme diversity found both within and between anellovirus species; they can exhibit as much as 33%-50% divergence at the nucleotide level.
- nucleotide sequence diversity anelloviruses share conserved genomic organization, transcriptional profiles, a non-coding GC rich region, and sequence motifs resulting in shared virion structure and gene functions.
- Anellovirus infections are highly prevalent in the general population.
- a study in Japan found that 75-100% of patients tested were infected with at least one of the three human anelloviruses, and many were infected with multiple species.
- Anelloviruses can infect young children, with the earliest documented infections occurring within the first months of life.
- These viruses have been found in nearly every body site, fluid, and tissue tested including blood plasma, serum, peripheral blood mononuclear cells (PBMCs), nasopharyngeal aspirates, bone marrow, saliva, breast milk, feces, as well as various tissues including thyroid gland, lymph node, lung, liver, spleen, pancreas, and kidney.
- PBMCs peripheral blood mononuclear cells
- the replication dynamics of anelloviruses are virtually unknown because of the inability to propagate these viruses in culture.
- Positive-strand TTV DNA indicative of local viral replication, has been described in hepatocytes, bone marrow cells, and circulating PBMCs
- Anelloviruses are spread primarily through fecal-oral transmission, although mother-child and respiratory tract transmissions have also been reported. There are conflicting reports regarding the presence of TTV in cord blood specimens.
- Reference sequences for anellovirus may be accessed at Genbank, e.g. Torque teno mini virus 1, Accession: NC_014097.1; Torque teno mini virus 6, Accession:NC_014095.1; Torque teno midi virus 2, Accession: NC_014093.1; Torque teno midi virus 1, Accession:NC_009225.1; Torque teno virus 3, Accession:NC_014081.1; Torque teno virus 19, Accession:NC_014078.1; Torque teno mini virus 8, Accession:NC_014068.1.
- antibiotic includes all commonly used bacteristatic and bactericidal antibiotics, usually those administered orally.
- Antibiotics include aminoglycosides, such as amikacin, gentamicin, kanamycin, neomycin, streptomycin, and tobramycin; cephalosporins, such as cefamandole, cefazolin, cephalexin, cephaloglycin, cephaloridine, cephalothin, cephapirin, and cephradine; macrolides, such as erythromycin and troleandomycin; penicillins, such as penicillin G, amoxicillin, ampicillin, carbenicillin, cloxacillin, dicloxacillin, methicillin, nafcillin, oxacillin, phenethicillin, and ticarcillin; polypeptide antibiotics, such as bacitracin, colistimethate, colistin, polymyxin B; tetracyclines
- Antiviral agents Individuals may receive antiviral therapy, which will alter the viral load for those viruses affected by the therapy.
- viral infections thus treated include HIV, Bowenoid Papulosis, Chickenpox, Childhood HIV Disease, Human Cowpox, Hepatitis C, Dengue, Enteroviral, Epidermodysplasia Verruciformis, Erythema Infectiosum (Fifth Disease), Giant Condylomata Acuminata of Buschke and Lowenstein, Hand-Foot-and-Mouth Disease, Herpes Simplex, Herpes Virus 6, Herpes Zoster, Kaposi Varicelliform Eruption, Rubeola Measles, Milker's Nodules, Molluscum Contagiosum, Monkeypox, Orf, Roseola Infantum, Rubella, Smallpox, Viral Hemorrhagic Fevers, Genital Warts, and Nongenital Warts.
- Antiviral agents include azidouridine, anasmycin, amantadine, bromovinyldeoxusidine, chlorovinyldeoxusidine, cytarbine, didanosine, deoxynojirimycin, dideoxycitidine, dideoxyinosine, dideoxynucleoside, desciclovir, deoxyacyclovir, edoxuidine, enviroxime, fiacitabine, foscamet, fialuridine, fluorothymidine, floxuridine, hypericin, interferon, interleukin, isethionate, nevirapine, pentamidine, ribavirin, rimantadine, stavirdine, sargramostin, suramin, trichosanthin, tribromothymidine, trichlorothymidine, vidarabine, zidoviridine, zalcitabine and 3-azido-3-deoxythymidine, and analog
- Immunosuppression or immunosuppressive regimen refers to the treatment of an individual, for example a graft recipient with agents to diminish the immune responses of the host immune system against autoantigens or graft. Exemplary immunosuppression regimens are described in more detail herein.
- Primary immunosuppressive agents include calcineurin inhibitors, which combine with binding proteins to inhibit calcineurin activity, and which include, for example, tacrolimus, cyclosporine A, etc.
- calcineurin inhibitors which combine with binding proteins to inhibit calcineurin activity
- tacrolimus cyclosporine A
- levels of both cyclosporine and tacrolimus must be carefully monitored. Initially, levels can be kept in the range of 10-20 ng/mL, but, after 3 months, levels may be kept lower (5-10 ng/mL) to reduce the risk of nephrotoxicity.
- Adjuvant agents are usually combined with a calcineurin inhibitor and include steroids, azathioprine, mycophenolate mofetil, and sirolimus. Protocols of interest include a calcineurin inhibitor with mycophenolate mofetil. The use of adjuvant agents allows clinicians to achieve adequate immunosuppression while decreasing the dose and toxicity of individual agents.
- Mycophenolate mofetil in kidney transplant recipients has assumed an important role in immunosuppression after several clinical trials have shown a markedly decreased prevalence of acute cellular rejection compared with azathioprine and a reduction in 1-year treatment failures.
- Antibody-based therapy may use monoclonal (eg, muromonab-CD3) or polyclonal antibodies or anti-CD25 antibodies (eg, basiliximab, daclizumab) and is administered in the early post-transplant period (up to 8 wk).
- Antibody-based therapy allows for avoidance or dose reduction of calcineurin inhibitors, possibly reducing the risk of nephrotoxicity.
- the adverse effect profile of the polyclonal and monoclonal antibodies limits their use in some patients.
- nucleic acid refers to a polynucleotide comprising two or more nucleotides. It may be DNA or RNA.
- a "variant" nucleic acid is a polynucleotide having a nucleotide sequence identical to that of its original nucleic acid except having at least one nucleotide modified, for example, deleted, inserted, or replaced, respectively. The variant may have a nucleotide sequence at least about 80%, 90%, 95%, or 99%, identity to the nucleotide sequence of the original nucleic acid.
- Circulating, or cell-free, DNA was first detected in human blood plasma in 1948.
- its connection to disease has been established in several areas.
- Studies reveal that much of the circulating nucleic acids in blood arise from necrotic or apoptotic cells Giacona, M.B., et al., Pancreas, 17, 89-97 (1998 )
- greatly elevated levels of nucleic acids from apoptosis is observed in diseases such as cancer.
- nucleic acid derived from refers to an origin or source, and may include naturally occurring, recombinant, unpurified or purified molecules.
- a nucleic acid derived from an original nucleic acid may comprise the original nucleic acid, in part or in whole, and may be a fragment or variant of the original nucleic acid.
- a nucleic acid derived from a biological sample may be purified from that sample.
- a “target nucleic acid” in the method is a nucleic acid, DNA or RNA, to be detected.
- a target nucleic acid derived from an organism is a polynucleotide that has a sequence derived from that of the organism and is specific to the organism.
- a target nucleic acid derived from a pathogen refers to a polynucleotide having a polynucleotide sequence derived from that specific the pathogen.
- nucleic acids may be obtained from the sample for analysis.
- nucleic acids are obtained from the sample for analysis.
- the methods described herein may be used to detect and/or quantify nucleic acid sequences that correspond to a microbe of interest, or a microbiome of organisms.
- the methods described herein can analyze at least 1; 2; 3; 4; 5; 10, 20; 50; 100; 200; 500; 1,000; 2,000; 5,000; 10,000, 20,000; 50,000; 100,000; 200,000; 300,000; 400,000; 500,000; 600,000; 700,000; 800,000; 900,000; 10 6 , 5 ⁇ 10 6 , 10 7 , 5 ⁇ 10 7 , 10 8 , 5 ⁇ 10 8 , 10 9 or more sequence reads.
- the methods described herein may be used to detect and/or quantify gene expression, e.g. by determining the presence of mRNA from a microorganism in relation to DNA from that microorganism.
- the methods described herein may provide high discriminative and quantitative analysis of multiple genes.
- the methods described herein can discriminate and quantitate the expression of at least 1, 2, 3, 4, 5, 10, 20, 50, 100, 200, 500, 1,000, 2,000, 5,000, 10,000, 20,000, 50,000, 100,000, or more different target nucleic acids.
- a sample containing cell-free nucleic acids is obtained from a subject.
- a subject can be a human, a domesticated animal such as a cow, chicken, pig, horse, rabbit, dog, cat, goat, etc.
- the cells used may be taken from a patient.
- Samples include, for example, the acellular fraction of whole blood, sweat, tears, saliva, ear flow, sputum, lymph, bone marrow suspension, lymph, urine, saliva, semen, vaginal flow, cerebrospinal fluid, brain fluid, ascites, milk, secretions of the respiratory, intestinal or genitourinary tracts fluid, a lavage of a tissue or organ (e.g.
- lung or tissue which has been removed from organs, such as breast, lung, intestine, skin, cervix, prostate, pancreas, heart, liver and stomach.
- organs such as breast, lung, intestine, skin, cervix, prostate, pancreas, heart, liver and stomach.
- samples can be separated by centrifugation, elutriation, density gradient separation, apheresis, affinity selection, panning, FACS, centrifugation with Hypaque, etc. Once a sample is obtained, it can be used directly, frozen, or maintained in appropriate culture medium for short periods of time.
- a blood sample can be optionally pre-treated or processed prior to use.
- a sample such as a blood sample, may be analyzed under any of the methods and systems herein within 4 weeks, 2 weeks, 1 week, 6 days, 5 days, 4 days, 3 days, 2 days, 1 day, 12 hrs, 6 hrs, 3 hrs, 2 hrs, or 1 hr from the time the sample is obtained, or longer if frozen.
- the amount can vary depending upon subject size and the condition being screened.
- At least 10 ml, 5 ml., 1 ml, 0.5 ml, 250, 200, 150, 100, 50, 40, 30, 20, 10, 9, 8, 7, 6, 5, 4, 3, 2, or 1 ⁇ L of a sample may be obtained.
- 1-50, 2-40, 3-30, or 4-20 ⁇ L of sample may be obtained. More than 5, 10, 15, 20, 25, 30, 35, 40, 45, 50, 55, 60, 65, 70, 75, 80, 85, 90, 95 or 100 ⁇ L of a sample may be obtained.
- the cell-free fraction is preferably blood serum or blood plasma.
- the term "cell-free fraction" of a biological sample used herein refers to a fraction of the biological sample that is substantially free of cells.
- the term “substantially free of cells” used herein refers to a preparation from the biological sample comprising fewer than about 20,000 cells per ml, preferably fewer than about 2,000 cells per ml, more preferably fewer than about 200 cells per ml, most preferably fewer than about 20 cells per ml.
- genomic DNA is not excluded from the acellular sample, and typically comprises from about 50% to about 90% of the nucleic acids that are present in the sample.
- the method may further comprise preparing a cell-free fraction from a biological sample.
- the cell-free fraction may be prepared using conventional techniques known in the art.
- a cell-free fraction of a blood sample may be obtained by centrifuging the blood sample for about 3-30 min, preferably about 3-15 min, more preferably about 3-10 min, most preferably about 3-5 min, at a low speed of about 200-20,000 g, preferably about 200-10,000 g, more preferably about 200-5,000 g, most preferably about 350-4,500 g.
- the biological sample may be obtained by ultrafiltration in order to separate the cells and their fragments from a cell-free fraction comprising soluble DNA or RNA. Conventionally, ultrafiltration is carried out using a 0.22 ⁇ m membrane filter.
- the method may further comprise concentrating (or enriching) the target nucleic acid in the cell-free fraction of the biological sample.
- the target nucleic acid may be concentrated using conventional techniques known in the art, such as solid phase absorption in the presence of a high salt concentration, organic extraction by phenol-chloroform followed by precipitation with ethanol or isopropyl alcohol, or direct precipitation in the presence of a high salt concentration or 70-80% ethanol or isopropyl alcohol.
- the concentrated target nucleic acid may be at least about 2, 5, 10, 20 or 100 times more concentrated than that in the cell-free fraction.
- the target nucleic acid, whether or not concentrated, may be used for amplification as described herein.
- transplant rejection encompasses both acute and chronic transplant rejection.
- Acute rejection or AR is the rejection by the immune system of a tissue transplant recipient when the transplanted tissue is immunologically foreign. Acute rejection is characterized by infiltration of the transplanted tissue by immune cells of the recipient, which carry out their effector function and destroy the transplanted tissue. The onset of acute rejection is rapid and generally occurs in humans within a few weeks after transplant surgery. Generally, acute rejection can be inhibited or suppressed with immunosuppressive drugs such as rapamycin, cyclosporin A, anti-CD40L monoclonal antibody and the like.
- Chronic transplant rejection or CR generally occurs in humans within several months to years after engraftment, even in the presence of successful immunosuppression of acute rejection. Fibrosis is a common factor in chronic rejection of all types of organ transplants. Chronic rejection can typically be described by a range of specific disorders that are characteristic of the particular organ.
- disorders include fibroproliferative destruction of the airway (bronchiolitis obliterans); in heart transplants or transplants of cardiac tissue, such as valve replacements, such disorders include fibrotic atherosclerosis; in kidney transplants, such disorders include, obstructive nephropathy, nephrosclerorsis, tubulointerstitial nephropathy; and in liver transplants, such disorders include disappearing bile duct syndrome.
- Chronic rejection can also be characterized by ischemic insult, denervation of the transplanted tissue, hyperlipidemia and hypertension associated with immunosuppressive drugs.
- an immunosuppressive regimen for a subject who has received a transplant, e.g., an allograft.
- Described herein are methods of predicting transplant survival in a subject that has received a transplant. Described herein are methods of diagnosing or predicting whether a transplant in a transplant patient or subject will survive or be lost. Described herein are methods of diagnosing or predicting the presence of long-term graft survival.
- long-term graft survival is meant graft survival for at least about 5 years beyond current sampling, despite the occurrence of one or more prior episodes of acute rejection. Transplant survival may be determined for patients in which at least one episode of acute rejection has occurred. As such, described herein are methods of determining or predicting transplant survival following acute rejection.
- Transplant survival may be determined or predicted in the context of transplant therapy, e.g., immunosuppressive therapy, where immunosuppressive therapies are known in the art. Methods of determining the class and/or severity of acute rejection (and not just the presence thereof) are also described.
- the transplant organ, tissue or cell(s) may be allogeneic or xenogeneic, such that the grafts may be allografts or xenografts.
- a feature of the graft tolerant phenotype detected or identified by the subject methods is that it is a phenotype which occurs without immunosuppressive therapy, i.e., it is present in a host that is not undergoing immunosuppressive therapy such that immunosuppressive agents are not being administered to the host.
- the transplant graft maybe any solid organ and skin transplant.
- organ transplants that can be analyzed by the methods described herein include but are not limited to kidney transplant, pancreas transplant, liver transplant, heart transplant, lung transplant, intestine transplant, pancreas after kidney transplant, and simultaneous pancreas-kidney transplant.
- the methods described herein involve high throughput sequencing of a cell-free nucleic acid sample from an individual, followed by bioinformatics analysis to determine the presence and prevalence of microbial sequences, which sequences may be from indigenous organisms, e.g. the normal microbiome of gut, skin, etc., or may be non-indigenous, e.g. opportunistic, pathogenic, etc. infections. Analysis may be performed for the complete microbiome, or for components there, for example the virome, bacterial microbiome, fungal microbiome, protozoan microbiome, etc.
- nucleic acids examples include, but are not limited to double-stranded DNA, single-stranded DNA, single-stranded DNA hairpins, DNA/RNA hybrids, RNA (e.g. mRNA or miRNA) and RNA hairpins.
- the nucleic acid may be DNA.
- the nucleic acid may be RNA.
- cell-free RNA and DNA are present in human plasma.
- Genotyping microbiome nucleic acids, and/or detection, identification and/or quantitation of the microbiome-specific nucleic acids generally include an initial step of amplification of the sample, although there may be instances where sufficient cell free nucleic acids are available and can be directly sequenced.
- the amplification step may be preceded by a reverse transcriptase reaction to convert the RNA into DNA.
- the amplification is unbiased, that is the primers for amplification are universal primers, or adaptors are ligated to the nucleic acids being analyzed, and amplification primers are specific for the adaptors.
- PCR techniques include, but are not limited, to hot start PCR, nested PCR, in situ polonony PCR, in situ rolling circle amplification (RCA), bridge PCR, picotiter PCR and emulsion PCR.
- Other suitable amplification methods include the ligase chain reaction (LCR), transcription amplification, self-sustained sequence replication, selective amplification of target polynucleotide sequences, consensus sequence primed polymerase chain reaction (CP-PCR), arbitrarily primed polymerase chain reaction (AP-PCR), degenerate oligonucleotide-primed PCR (DOP-PCR) and nucleic acid based sequence amplification (NABSA).
- Other amplification methods that may be used to amplify specific polymorphic loci include those described in, U.S. Pat. Nos. 5,242,794 , 5,494,810 , 4,988,617 and 6,582,938 .
- sequenced is sequenced. Sequencing can be accomplished using high-throughput systems some of which allow detection of a sequenced nucleotide immediately after or upon its incorporation into a growing strand, i.e., detection of sequence in red time or substantially real time. In some cases, high throughput sequencing generates at least 1,000, at least 5,000, at least 10,000, at least 20,000, at least 30,000, at least 40,000, at least 50,000, at least 100,000 or at least 500,000 sequence reads per hour; with each read being at least 50, at least 60, at least 70, at least 80, at least 90, at least 100, at least 120 or at least 150 bases per read. Sequencing can be performed using nucleic acids described herein such as genomic DNA, cDNA derived from RNA transcripts or RNA as a template.
- SMSS Single Molecule Sequencing by Synthesis
- High-throughput sequencing may involve the use of technology available by 454 Lifesciences, Inc. (Branford, Connecticut) such as the Pico Titer Plate device, which includes a fiber optic plate that transmits chemiluminescent signal generated by the sequencing reaction to be recorded by a CCD camera in the instrument. This use of fiber optics allows for the detection of a minimum of 20 million base pairs in 4.5 hours.
- High-throughput sequencing may be performed using Clonal Single Molecule Array (Solexa, Inc.) or sequencing-by-synthesis (SBS) utilizing reversible terminator chemistry.
- Solexa, Inc. Solexa, Inc.
- SBS sequencing-by-synthesis
- AnyDot.chips Genevoxx, Germany
- biological processes e.g., miRNA expression or allele variability (SNP detection).
- SNP detection e.g., miRNA expression or allele variability
- the AnyDot-chips allow for 10x-50x enhancement of nucleotide fluorescence signal detection.
- AnyDot.chips and methods for using them are described in part in International Publication Application Nos. WO 02088382 , WO 03020968 , WO 0303 1947 , WO 2005044836 , PCTEP 05105657 , PCMEP 05105655; and German Patent Application Nos.
- Sequence can then be deduced by identifying which base is being incorporated into the growing complementary strand of the target nucleic acid by the catalytic activity of the nucleic acid polymerizing enzyme at each step in the sequence of base additions.
- a polymerase on the target nucleic acid molecule complex is provided in a position suitable lo move along the target nucleic acid molecule and extend the oligonucleotide primer at an active site.
- a plurality of labeled types of nucleotide analogs are provided proximate to the active site, with each distinguishably type of nucleotide analog being complementary to a different nucleotide in the target nucleic acid sequence.
- the growing nucleic acid strand is extended by using the polymerase to add a nucleotide analog to the nucleic acid strand at the active site, where the nucleotide analog being added is complementary to the nucleotide of the target nucleic acid at the active site.
- the nucleotide analog added to the oligonucleotide primer as a result of the polymerizing step is identified.
- the steps of providing labeled nucleotide analogs, polymerizing the growing nucleic acid strand, and identifying the added nucleotide analog are repeated so that the nucleic acid strand is further extended and the sequence of the target nucleic acid is determined.
- Shotgun sequencing may be performed.
- DNA is broken up randomly into numerous small segments, which are sequenced using the chain termination method to obtain reads.
- Multiple overlapping reads for the target DNA are obtained by performing several rounds of this fragmentation and sequencing.
- Computer programs then use the overlapping ends of different reads to assemble them into a continuous sequence.
- depth of sequencing a frequent estimate for the variation between individuals is that about one base per thousand differs.
- sequencers such as the Illumina Genome Analyzer have read lengths exceeding 36 base pairs.
- the fraction of host DNA in the blood may be variable depending on the status of the individual, one can take 90% as a baseline estimate. At this fraction of donor DNA, approximately one in 10 molecules analyzed will be microbial.
- the sequencing error rate also affects the sensitivity of this technique. Typical sequencing error rates for base substitutions vary between platforms, but are between 0.5-1.5%. This places a potential limit on sensitivity of 0.16 to 0.50%. However, it is possible to systematically lower the sequencing error rate by resequencing the sample template multiple times, as has been demonstrated by Helicos BioSciences ( Harris, T.D., et al., Science, 320, 106-109 (2008 )). A single application of resequencing would reduce the expected error rate.
- the dataset of sequences is uploaded to a data processor for bioinformatics analysis to subtract host sequences, i.e. human, cat, dog, etc. from the analysis; and determine the presence and prevalence of microbial sequences, for example by a comparison of the coverage of sequences mapping to a microbial reference sequence to coverage of the host reference sequence.
- the subtraction of host sequences may include the step of identifying a reference host sequence, and masking microbial sequences or microbial-mimicking sequences present in the reference host genome.
- determining the presence of a microbial sequence by comparison to a microbial reference sequence may include the step of identifying a reference microbial sequence, and masking host sequences or host-mimicking sequences present in the reference microbial genome.
- the dataset is optionally cleaned to check sequence quality, remove remnants of sequencer specific nucleotides (adapter sequences), and merge paired end reads that overlap to create a higher quality consensus sequence with less read errors. Repetitive sequences are identified as those having identical start sites and length, and duplicates may be removed from the analysis.
- the subtraction process may be optimized in several ways to improve the speed and accuracy of the process, for example by performing multiple subtractions where the initial alignment is set at a coarse filter, i.e. with a fast aligner, and performing additional alignments with a fine filter, i.e. a sensitive aligner.
- the database of reads are initially aligned against a human reference genome, including without limitation Genbank hg19 reference sequences, to bioinformatically subtract the host DNA. Each sequence is aligned with the best fit sequence in the human reference sequence Sequences positively identified as human are bioinformatically removed from the analysis.
- the reference human sequence can also be optimized by adding in contigs that have a high hit rate, including without limitation highly repetitive sequence present in the genome that are not well represented in reference databases. It has been observed that of the reads that do not align to hg19, a significant amount is eventually identified as human in a later stage of the pipeline, when a database that includes a large set of human sequences is used, for example the entire NCBI NT database. Removing these reads earlier in the analysis can be performed by building an expanded human reference. This reference is created by identifying human contigs in a human sequence database other than the reference, e.g. NCBI NT database, that have high coverage after the initial human read subtraction. Those contigs are added to the human reference to create a more comprehensive reference set. Additionally novel assembled human contigs from cohorts studies can be used as a further mask for human-derived reads.
- Regions of the human genome reference sequence that contain non-human sequences may be masked, e.g. viral and bacterial sequences that are integrated into the genome of the reference sample.
- Epstein-Barr Virus has about 80% of its genome incorporated into hg19.
- Sequence reads identified as non-human are then aligned to a nucleotide database of microbial reference sequences.
- the database may be selected for those microbial sequences known to be associated with the host, e.g. the set of human commensal and pathogenic microrganisms.
- the microbial database may be optimized to mask or remove contaminating sequences. For example it has been observed that many public database entries include artifactual sequences not derived from the microorganism, e.g., primer sequences, host sequences, and other contaminants. It is desirable to perform an initial alignment or plurality of alignments on a database. Regions that show irregularities in read coverage when multiple samples are aligned can be masked or removed as an artifact. The detection of such irregular coverage can be done by various metrics, such as the ratio between coverage of a specific nucleotide and the average coverage of the entire contig within which this nucleotide is found.
- a sequence that is represented as greater than about 5X, about 10X, about 25X, about 50X, about 100X the average coverage of that reference sequence are artifactual.
- a binomial test can be applied to provide a per-base likelihood of coverage given the overall coverage of the contig. Removal of contaminant sequence from reference databases allows accurate identification of microbes. It is a benefit of the methods that the databases are improved with alignment of samples, e.g. a database may be aligned with 1, 10, 20, 50, 100 or more samples to improve the database prior to commercial or clinical use.
- Each high confidence read may align to multiple organisms in the given microbial database.
- an algorithm is used to compute the most likely organism an algorithm is selected (for example see Lindner et al. Nucl. Acids Res. (2013) 41 (1): e10 ).
- GRAMMy or GASiC algorithms can be used to compute the most likely organism that a given read came from.
- Alignments and assignment to a host sequence or to a microbial sequence may be performed in accordance with art-recognized methods. For example, a read of 50 nt. may be assigned as matching a given genome if there is not more than 1 mismatch, not more than 2 mismatches, not more than 3 mismatches, not more than 4 mismatches, not more than 5 mismatches, etc. over the length of the read.
- Commercial algorithms are generally used for alignments and identification. A non-limiting example of such an alignment algorithm is the bowtie2 program (Johns Hopkins University).
- the pre-set options in end-to-end mode may be selected based on the desired speed of alignment, very-fast Same as: -D 5 -R 1 -N 0 -L 22 -i S,0,2.50 fast Same as: -D 10 -R 2 -N 0 -L 22 -i S,0,2.50 sensitive Same as: -D 15 -R 2 -L 22 -i S,1,1.15 very-sensitive Same as: -D 20 -R 3 -N 0 -L 20 -i S,1,0.50 Comparable setting may be used in other alignment algorithms or software packages.
- the final determination provides a dataset of microbial organisms represented by sequences in the sample, and the prevalence of those microorganisms. These data are optionally aggregated and displayed for ready visualization, e.g. in the form of a report provided to the individual or health care provider; or written in a browser format with hyper-linked data.
- the coverage estimation can be aggregated with metadata from the sample, and sorted into tables and figures for each sample, or cohort of samples.
- the host sequences that are filtered out can be used for other purposes, e.g. in personalized medicine.
- certain SNPs in the human genome may allow doctors to identify drug sensitivities for a given patient.
- the human-derived sequences may reveal integration of viruses into the host's genome (e.g. EBV, HPV, poliomavirus) or be used for synergistic clinical applications (e.g., cell-free tumor DNA may be used to monitor cancer progressing in parallel with infection monitoring in patients that are highly susceptible to infection due to chemotherapy).
- the analysis of cell-free nucleic acids may be used to compute a pathogenicity score, where the pathogenicity score is a numeric or alphabetic value that summarizes the overall pathogenicity of the organism for ease of interpretation, e.g. by a health practitioner.
- the final "pathogenicity score” is a combination of many different factors, and typically provided as an arbitrary unit, for example ranging from 0-1, 0-10 or 0-100; as a percentile from all observed pathogenicity scores for a microbe of interest, etc.
- the specific parameters and weights of those parameters may be determined experimentally, e.g. by fitting the function to observed disease severity, or manually by setting the importance of different paramaters and criteria.
- Factors relevant for calculation of a pathogenicity score may include, without limitation, abundance of the microbe, e.g. as computed by number of reads relative to human reads, relative to the abundance of the microbe in a reference subject or group of subjects, e.g. a test population, a known infection, a known un-infected individual, etc.
- Specific mutations found in the microbe genome which may be made with reference to a database of toxicity, pathogenicity, antibiotic resistance etc. associated with the microbe, and including without limitation SNPs, indels, plasmids etc.
- the co-incidence of specific microbes including without limitation specific ratios and groups of organisms. Expression of certain sequences, e.g.
- mRNA can be detection of mRNA, can be relevant to the pathogenicity score, e.g. as informative of whether a microbe is actively replicating or is latent; etc. Geographic features may also be included, where the geography is indicative of exposure to microbes of interest, e.g. travel history of the host; interactions with infected individuals, and the like.
- kits thereof for practicing one or more of the above-described methods.
- the subject reagents and kits thereof may vary greatly.
- Reagents of interest include reagents specifically designed for use in production of the above-described: (i) profiling of a microbiome and an imdividual; (ii) identification of microbiome profiles; and (ii) detection and/or quantitation of one or more nucleic acids from a microbiome in a sample obtained from an individual.
- the kits may comprise reagents necessary to perform nucleic acid extraction and/or nucleic acid detection using the methods described herein such as PCR and sequencing.
- the kit may further comprise a software package for data analysis, which may include reference profiles for comparison with the test profile., and in particular may include reference databases optimized as described above.
- the kits may comprise reagents such as buffers, and H 2 0.
- kits may also include information, such as scientific literature references, package insert materials, clinical trial results, and/or summaries of these and the like, which indicate or establish the activities and/or advantages of the composition, and/or which describe dosing, administration, side effects, drug interactions, or other information useful to the health care provider.
- kits may also include instructions to access a database. Such information may be based on the results of various studies, for example, studies using experimental animals involving in vivo models and studies based on human clinical trials. Kits described herein can be provided, marketed and/or promoted to health providers, including physicians, nurses, pharmacists, formulary officials, and the like. Kits may also be marketed directly to the consumer.
- any of the methods above can be performed by a computer program product that comprises a computer executable logic that is recorded on a computer readable medium.
- the computer program can execute some or all of the following functions: (i) controlling isolation of nucleic acids from a sample, (ii) pre-amplifying nucleic acids from the sample, (iii) amplifying, sequencing or arraying specific regions in the sample, (iv) identifying and quantifying a microbial sequence in the sample, (v) comparing data on a microbe presence or prevalence detected from the sample with a predetermined threshold, (vi) determining infection, microbiome health, immunocompetence status or outcome, (vi) declaring the sample status with respect to infection, microbiome health, immunocompetence, etc.
- the computer executable logic can work in any computer that may be any of a variety of types of general-purpose computers such as a personal computer, network server, workstation, or other computer platform now or later developed.
- a computer program product is described comprising a computer usable medium having the computer executable logic (computer software program, including program code) stored therein.
- the computer executable logic can be executed by a processor, causing the processor to perform functions described herein. Some functions may be implemented primarily in hardware using, for example, a hardware state machine. Implementation of the hardware state machine so as to perform the functions described herein will be apparent to those skilled in the relevant arts.
- the program can provide a method of evaluating microbial status in an individual by accessing data that reflects the profiling of the microbiome and the individual, and/or the quantitation of one or more nucleic acids from the microbiome in the circulation of the individual.
- the computer executing the computer logic described herein may also include a digital input device such as a scanner.
- the digital input device can provide information on a nucleic acid, e.g., presence or prevalence
- Described herein is a computer readable medium comprising a set of instructions recorded thereon to cause a computer to perform the steps of (i) receiving data from one or more nucleic acids detected in a sample; and (ii) diagnosing or predicting a status based on the microbiome quantitation.
- databases of microbial reference sequences and databases of human reference sequences.
- databases of microbial reference sequences will typically comprise optimized datasets as described above.
- the methods may provide an individual's status with respect to infection.
- the microbial infection may be a pathogen, where any presence of the pathogen sequence indicates a clinically relevant infection.
- the prevalence may be indicative of microbial load, where a pre-set level is indicative of clinical relevance.
- the individual may be treated or considered for treatment with an antimicrobial therapy, e.g. antibiotics, passive or active immunotherapy, antivirals, etc.
- An individual may be tested before therapy, during therapy, and after therapy.
- a microbial infection may also be indicated by load for a commensal organism, where the level of a commensal in a blood sample is indicative of intestinal health, e.g. gut lumen breakdown.
- a comparison can be made of microbioal RNA, alone or in relation to microbiol DNA, where an excess of RNA for a microbial sequence, e.g. about 5X, 10X, 15X, 20X, 25X the coverage of the microbial DNA is indicative of an active infection.
- the microbe thus analyzed may be one capable of latent infection, e.g. herpesvirus, hepatitis virus, etc.
- An overall estimate of the microbiome may be of interest, where the relative presence of prevalence of classes of microorganisms are of interest. It is known in the art that diet and treatment with drugs, e.g. statins, antibiotics, immunosuppressive agents, etc. can affect the overall health of the microbiome, and it is therefor of interest to determine the composition of the microbiome.
- drugs e.g. statins, antibiotics, immunosuppressive agents, etc.
- Temporal differences in the amount of said one or more nucleic acids from the microbiome can be used to monitor effectiveness of anti-microbial treatment or to select an treatment. For instance, the amount of one or more nucleic acids from the microbiome can be determined before and after an treatment. A decrease in the one or more nucleic acids from the microbe after treatment may indicate that the treatment was successful. Additionally, the amount of one or more nucleic acids from the microbiome can be used to choose between treatments, for examples, treatments of different strengths.
- Described herein are methods for the diagnosis or prediction of immunocompetence, transplant status or outcome in a subject receiving an immunosuppressive regimen.
- samples as described above can be drawn from the patient and analyzed for the presence or absence of one or more microbiome, including virome nucleic acids.
- the sample may be blood, plasma, serum or urine.
- the proportion and/or amount of microbial nucleic acids can be monitored over time and an increase in this proportion can be used to determine immunocompetence.
- the quantitation of load may be determined by any suitable method known in the art including those described herein such as sequencing, nucleic acid arrays or PCR.
- the amount of one or more microbiome nucleic acids in a sample from the immunosuppressed recipient may be used to determine the transplant status or outcome.
- the methods may further comprise quantitating the one or more nucleic acids from the microbiome.
- the amount of one or more nucleic acids from the donor sample may be determined as a percentage of total the nucleic acids in the sample.
- the amount of one or more nucleic acids from the donor sample may be determined as a ratio of the total nucleic acids in the sample.
- the amount of one or more nucleic acids from the donor sample may be determined as a ratio or percentage compared to one or more reference nucleic acids in the sample.
- the amount of one or more nucleic acids from the microbiome can be determined to be 10% of the total nucleic acids in the sample.
- the amount of one or more nucleic acids from the microbiome can be at a ratio of 1:10 compared to total nucleic acids in the sample.
- the amount of one or more nucleic acids from the microbiome can be determined to be 10% or at a ratio of 1:10 of a reference gene such a ⁇ -globin.
- the amount of one or more nucleic acids from the microbiome can be determined as a concentration.
- the amount of one or more nucleic acids from the donor sample can be determined to be 1 ⁇ g/mL.
- the amount of one or more nucleic acids from the microbiome above a predetermined threshold value may be indicative of a immunocompetence status.
- the normative values for clinically stable patients with no evidence of graft rejection or other pathologies can be determined.
- An increase in the amount of one or more nucleic acids from the microbiome below the normative values for clinically stable post-transplantation patients could indicate a stable outcome.
- an amount of one or more nucleic acids from the microbiome above or at the normative values for clinically stable post-transplantation patients could indicate increased immunocompetence and risk of graft rejection.
- Different predetermined threshold values may be indicative of different transplant outcomes or status. For example, as discussed above, an increase in the amount of one or more nucleic acids from the microbiome above the normative values for clinically stable post-transplantation patients could indicate a change in transplant status or outcome such as transplant rejection or transplant injury. However, an increase in the amount of one or more nucleic acids from the microbiome above the normative values for clinically stable post-transplantation patients but below a predetermined threshold level could indicate a less serious condition such as a viral infection rather than transplant rejection. An increase in the amount of one or more nucleic acids from the microbiome above a higher threshold could indicate transplant rejection.
- Temporal differences in the amount of said one or more nucleic acids from the microbiome may be indicative of immunocompetence. For instance, a transplant patient can be monitored over time to determine the amount of one or more nucleic acids from the microbiome. A temporary decrease in the amount of one or more nucleic acids from the microbiome, which subsequently return to normal values, might indicate a less serious condition rather than transplant rejection. On the other hand, a sustained decrease in the amount one or more nucleic acids from the microbiome might indicate a serious condition such as lack of effective immunosuppression and graft rejection.
- Temporal differences in the amount of said one or more nucleic acids from the microbiome can be used to monitor effectiveness of an immunosuppressant treatment or to select an immunosuppressant treatment.
- the amount of one or more nucleic acids from the microbiome can be determined before and after an immunosuppressant treatment. A decrease in the one or more nucleic acids from the microbiome after treatment may indicate that the treatment was successful in preventing transplant rejection.
- the amount of one or more nucleic acids from the microbiome can be used to choose between immunosuppressant treatments, for examples, immunosuppressant treatments of different strengths.
- a lower amount in one or more nucleic acids from the microbiome may indicate that there is a need of a very potent immunosuppressant, whereas a higher amount in one or more nucleic acids from the microbiome may indicate that a less potent immunosuppressant may be used.
- the methods described herein for diagnosing or predicting transplant status or outcome may have at least 50%, 60%, 70%, 80%, 90%, 95% or 100% sensitivity.
- the methods described herein may have at least 50 % sensitivity.
- the methods described herein may have at least 78 % sensitivity.
- the methods described herein may have a specificity of about 70% to about 100%.
- the methods described herein may have a specificity of about 80% to about 100%.
- the methods described herein may have a specificity of about 90% to about 100%.
- the methods described herein may have a specificity of about 100%.
- non-invasive diagnostics for individuals including individuals that are being treated with immunosuppressive regimens, treated with anti-microbial agents, etc., by monitoring the sequences of cell-free DNA or RNA from non-human sources.
- individuals carry a number of virus, where the virus load is shown herein to vary with the immunocompetence of the individual.
- Preferred virus for monitoring immunocompetence are annellovirus, in which the viral burden is shown herein to correlate with immunocompetence of the individual.
- Described herein are methods, devices, compositions and kits for detection and/or quantitating circulating nucleic acids, usually free in plasma or from viral particles, for the diagnosis, prognosis, detection and/or treatment of an infection, of immunocompetence, transplant status or outcome.
- Described herein is an approach to noninvasive detection of immunocompetence in transplant patients by virome analysis, which circumvents the potential problems of microchimerism from DNA from other foreign sources and is general for all organ recipients without consideration of gender.
- a genetic fingerprint may be generated for the virome of the individual. This approach allows for a reliable identification of sequences that can be made in a manner that is independent of the genders of donor and recipient.
- bodily fluid such as blood can be drawn from the patient and analyzed for markers.
- bodily fluids include, but are not limited to, smears, sputum, biopsies, secretions, cerebrospinal fluid, bile, blood, lymph fluid, saliva, and urine.
- Detection, identification and/or quantitation of the virome sequences can be performed using real-time PCR, chips, high-throughput shotgun sequencing of circulating nucleic acids (e.g. cell-free DNA), as well as other methods known in the art including the methods described herein.
- the viral load can be monitored over time and an increase in this proportion can be used to determine immunocompetence status or outcome.
- the transplant graft can be any solid organ or skin transplant.
- organ transplants that can be analyzed by the methods described herein include but are not limited to kidney transplant, pancreas transplant, liver transplant, heart transplant, lung transplant, intestine transplant, pancreas after kidney transplant, and simultaneous pancreas-kidney transplant.
- the methods may be used in determining the efficacy of a therapy for treatment of disease, including infection, either at an individual level, or in the analysis of a group of patients, e.g. in a clinical trial format. This typically involves the comparison of two time points for a patient or group of patients. The patient status is expected to differ between the two time points as the result of a therapeutic agent, therapeutic regimen, or disease challenge to a patient undergoing treatment.
- Examples of formats for such methods may include, without limitation, analyzing the microbiome at two or more time points, where a first time point is a diagnosed but untreated patient; and a second or additional time point(s) is a patient treated with a candidate therapeutic agent or regimen.
- a first time point is a diagnosed patient in disease remission, e.g. as ascertained by current clinical criteria, as a result of a candidate therapeutic agent or regimen.
- a second or additional time point(s) is a patient treated with a candidate therapeutic agent or regimen, and challenged with a disease-inducing agent, for example in a vaccine context.
- each set of time points may correspond to a single patient, to a patient group, e.g. a cohort group, or to a mixture of individual and group data. Additional control data may also be included in such clinical trial formats, e.g. a placebo group, a disease-free group, and the like, as are known in the art. Formats of interest include crossover studies, randomized, double-blind, placebo-controlled, parallel group trial is also capable of testing drug efficacy, and the like. See, for example, Clinical Trials: A Methodologic Perspective Second Edition, S. Piantadosi, Wiley-Interscience; 2005, ISBN-13: 978-0471727811 ; and Design and Analysis of Clinical Trials: Concepts and Methodologies, S. Chow and J. Liu, Wiley-Interscience; 2003; ISBN-13: 978-0471249856 .
- Immunosuppressive therapies significantly reduce the risk of graft rejection in organ transplantation but increase the susceptibility of recipients to infections. Infections with viral pathogens, in particular the herpesvirus cytomegalovirus (CMV), occur frequently and increase the recipient's risk of graft failure. Organ transplant recipients are therefore frequently subjected to antiviral prophylactic or preemptive therapies directed against CMV.
- CMV herpesvirus cytomegalovirus
- Diagnosis of rejection mostly relies on invasive biopsies that suffer from interobserver variability, high cost and patient discomfort. Diagnosis of infections is challenging given the fact that the symptoms of infection are diminished following immunosuppression, and commonly used diagnostic methods, such as antigen-detection and PCR-based molecular tests, rely on a specific target and therefore an a priori hypothesis for the source of the infection.
- patient-to-patient variability in the sensitivity to immunosuppressive drugs can give rise to over- and under immunosuppression, increasing the risk of infection or rejection respectively.
- Organ transplant recipients are treated with a post-transplant therapy that combines immunosuppressive and antiviral drugs, offering a window into the effects of immune modulation on the human virome.
- the data provide insight into the relationship between the human virome, the state of the immune system, and the effects of pharmacological treatment, and offer a potential application of the virome state to predict immunocompetence.
- the patients in the cohort were treated with antiviral prophylaxis and immunosuppression as part of a standardized post-transplant therapy ( Fig. 1D ).
- Maintenance immunosuppression was tacrolimus-based for the adult heart and lung transplant recipients and was complemented with mycophenolate mofetil and prednisone.
- Pediatric patients were treated with a cyclosporine based anti-rejection therapy.
- CMV positive transplant recipients (prior CMV infection for recipient and/or donor), but not CMV negative recipients, were treated with antiviral prophylaxis.
- the protocol design entails high doses of immunosuppressants and antiviral drugs in the first few months post transplant, after which the doses are gradually reduced as the risks of rejection and infection diminish.
- Fig. 1D shows the mean level of tacrolimus measured in blood for the tacrolimus-treated patients and illustrates the design of the drug treatment protocol.
- Fig. 1E shows the distribution of the remaining read fraction after applying duplicate and quality filters (average of 86 %) and the distribution of the remaining fraction after subtraction of human reads (average of 2%).
- the anelloviridae fraction is mostly (97%) composed of viruses from the Alphatorquevirus genus (Fig. 1F , panel c).
- the Alphatorque genus is the genus of Torque Teno Viruses (TTVs), and sequences related to 14 different torque teno virotypes were identified ( Fig1 , panel d). Infections with polyomaviruses are widespread in the human population, and polyomavirus DNAemia is not uncommon in the first year after solid organ transplantation.
- Sensitivity of virome composition to drug dosage was used to analyze drug-microbiome interactions.
- Data on prescription antiviral drug doses (valganciclovir) and the measured levels of tacrolimus in blood were collected from individual patient records and the mean composition for samples corresponding to different drugs levels was extracted.
- the drug level and dose data were sliding window average filtered (see Fig. 1C and Fig.7A-C ; window size 45 days).
- the antiviral prophylaxis is intended to prevent CMV disease, but other herpesviruses are also susceptible to the drug so it is not surprising that a higher dose of valganciclovir gives rise to a lower fraction of viruses from the Herpesvirales order.
- the observation that anelloviridae take advantage of suppression of the host immune system is consistent with various observations from the literature: it was previously shown that the incidence of anelloviridae increases with progression towards AIDS in HIV patients, and that the total burden of the anellovirus TTV increases post liver transplantation. Furthermore, an increased prevalence of anelloviridae in pediatric patients with fevers was reported recently.
- the tacrolimus-based immunosuppressive therapy is complemented with induction therapy in the first 3 days post transplant (with anti-thymocyte globulin, daclizumab, or basiliximab) and the patients furthermore receive the corticosteroid prednisone throughout the post transplant therapy.
- the time-dosage profile for prednisone and tacrolimus are similar: high doses at the onset of the therapy followed by a gradual dose reduction ( Fig. 7A-C ).
- the data in Fig. 2A thus reflect the combined effect of prednisone and tacrolimus.
- An analysis of the differential effect of prednisone and valganciclovir on the virome composition shows the same trend observed in Fig.
- Partitioning of microbiome diversity We studied the diversity of the bacterial and viral components of the microbiome. The within-subject diversity was lower than the between-subject diversity, both for bacteria and viruses (Bray-Curtis beta diversity, bacterial composition at phylum level, family and order level viruses, Fig. 2C ). Partitioning the data for patients according to transplant type, heart or lung, or age did not reduce the diversity. Within subjects, the diversity was lower for samples collected within a one month timespan, again both for bacteria and viruses. For viruses but not for bacteria, we find that the diversity is lower when comparing samples collected at a similar drug dosage (tacrolimus level ⁇ 0.5 ng/ml, valganciclovir ⁇ 50 mg). Taken together with the sensitivity of the population averages to drug dosage in Fig. 2A , we thus find that the composition of the virome for patients that are subject to the same drug therapy converges to a similar state.
- the dsDNA fraction consists of caudovirales, adenoviridae, polyomaviridae and herpesvirales, which together occupy 95% of the virome in the first week(s) post transplant.
- ssDNA viruses only occupy 5% of the initial virome and mainly consist of members of the anelloviridae family.
- the fraction occupied by adenoviridae, caudovirales and herpesvirales decreases strongly in the first few months as these virotypes are effectively targeted by the antiviral prophylaxis.
- Figure 3D shows the within-sample alpha diversity for the bacterial and viral genera as function of time (Shannon entropy, one month time periods, 590 bacterial genera, 168 viral genera examined).
- the total viral load data reveals a net reduction of the Herpesvirales load and a net increase in anelloviridae load in the first 3 months post-transplant for patients that are simultaneously treated with antivirals and immunosuppressants.
- FIG 5A shows the anellovirus load measured for rejecting and non-rejecting patients as function of time post transplant.
- patients are classified as rejecting in case they suffer from at least one biopsy-determined moderate or severe rejection episode, biopsy grade ⁇ 2R/3A (in red; 20 patients, 177 data points).
- the rejection-free patients correspond to patients that are not diagnosed to suffer from a moderate or severe graft damage throughout their post transplant course (in blue; biopsy grades ⁇ 2R/3A, 40 patients, 285 data points).
- Figure 5A shows that the anellovirus burden is significantly lower for the rejecting individuals at almost every time point.
- the figure shows that the time-normalized loads are significantly lower for the patients at greater risk of rejection.
- anelloviruses are ubiquitous in the human population and, although no pathogenicity has been established, anelloviruses are currently under investigation as potential cofactors in carcinogenesis.
- the sensitivity of anelloviridae to immunosuppression makes organ transplantation an ideal setting for the study of the properties of anelloviridae, particularly in the light of the increased incidence of cancer seen in transplant recipients.
- the observation of a lower-than-average burden of anelloviruses in patients that suffer from a rejection episode is indicative of insufficient immunosuppression in this subgroup of patients, even though these patients were subject to the immunosuppressant levels prescribed per protocol.
- High throughput DNA sequencing finds use in the hypothesis-free diagnosis of infections. This approach is of particular relevance in the context of transplantation given the fact that infections occur frequently in transplantation and are difficult to diagnose in immunocompromised individuals, and given that sequence analysis can additionally provide information on the graft health through the quantification of donor-derived human DNA circulating in plasma. In other areas of infectious disease, it may be of value to develop subtractive methods to eliminate the human DNA and enrich for DNA of viral and microbial origin.
- Plasma processing and DNA extraction Plasma was extracted from whole blood samples within three hours of sample collection, as previously described (Fan et al., 2008), and stored at -80°C. When required for analysis, plasma samples were thawed and circulating DNA was immediately extracted from 0.5-1 ml plasma using the QIAamp Circulating Nucleic Acid Kit (Qiagen).
- Sequencing library preparation and sequencing Sequencing libraries were prepared from the purified patient plasma DNA using the NEBNext DNA Library Prep Master Mix Set for Illumina with standard Illumina indexed adapters (purchased from IDT), or using a microfluidics-based automated library preparation platform (Mondrian ST, Ovation SP Ultralow library system). Libraries were characterized using the Agilent 2100 Bioanalyzer (High sensitivity DNA kit) and quantified by qPCR. Samples were part of 26 different sequencing runs and were sequenced over the course of 22 months. On average 6 samples were sequenced per lane.
- Posttransplant immunosuppression consisted of methylprednisolone 500 mg administered immediately postoperatively followed by 125 mg every 8 hr for three doses.
- Antithymocyte globulin (rATG) 1 mg/kg was administered on postoperative days 1, 2, and 3.
- Maintenance immunosuppression consisted of prednisone 20 mg twice daily starting on postoperative day 1 and tapered to ⁇ 0.1 mg/kg/day by the 6 th postoperative month and tapered further if endomyocardial biopsies showed no evidence of cellular rejection.
- Tacrolimus was started on postoperative day 1 and dosing was further adjusted to maintain a level of 10-15 ng/ml during months 0-6, 7-10 ng/ml during months 6-12, and 5-10 ng/ml thereafter.
- Mycophenolatemofetil was started at 1,000 mg twice daily on postoperative day 1 and dose adjustments were made, if required, in response to leukopenia.
- CMV antiviral prophylaxis
- ganciclovir 5 mg/kg IV, adjusted for renal function, every 12 hr starting on postoperative day 1 unless both donor and recipient were CMV negative.
- recipients were started on valganciclovir 900 mg twice daily for 2 weeks, then 900 mg daily until 6 months posttransplant, followed by 450 mg daily until 12 months posttransplant, at which point antiviral prophylaxis was discontinued.
- Valganciclovir dose reductions were made in the setting of leukopenia.
- CMV- recipients of a CMV+ allograft also received CMV hyperimmune globulin, 150 mg/kg IV, within 72 hr of transplant, 100 mg/kg at posttransplant weeks 2, 4, 6, and 8, and 50 mg/kg at weeks 12 and 16 posttransplant.
- CMV - recipients of CMV - allografts were not treated with antiviral prophylaxis until May 2012; subsequently, these recipients were treated with acyclovir 400 mg twice daily for one year.
- Antifungal prophylaxis consisted of itraconazole 300 mg daily for the first 3 months posttransplant, and prophylaxis against pneumocystis jiroveci infection consisted of trimethoprim/sulfamethoxazole, 80 mg TMP component daily. Prophylaxis against pneumnocystis infection was continued indefinitely, and patients intolerant of TMP-SMX were treated with atovaquone, dapsone, or inhaled pentamidine.
- Heart transplant recipients were monitored for acute cellular rejection by surveillance endomyocardial biopsies performed at scheduled intervals after transplant: weekly during the first month, biweekly until the 3 rd month, monthly until the 6 th month, and then at months 9, 12, 16, 20, and 24.
- Biopsies were graded according to the ISHLT 2004 revised grading scale (0, 1R, 2R, 3R) (29). Blood samples were collected from heart transplant recipients at the following time points posttransplant: weeks 2, 4, and 6; months 2, 2.5, 3, 4, 5, 6, 8, 10, 12, 16, 20, and 24.
- a subset of heart transplant recipients also had blood samples collected on posttransplant day 1. If blood sampling and endomyocardial biopsies were performed on the same day, care was taken to ensure that blood was collected prior to the biopsy procedure.
- Calcineurin inhibition consisted primarily of cyclosporine, with goal levels of 300-350 ng/ml for months 0-3, 275-325 ng/ml for months 4-6, 250-300 ng/ml months 7-12, and 200-250 after month 12 posttransplant. Patients intolerant of cyclosporine were treated with tacrolimus. Protocols for prophylaxis against opportunistic infections and surveillance endomyocardial biopsies were similar to adult heart transplant recipients.
- Posttransplant immunosuppression consisted of methylprednisolone 500-1000 mg administered immediately postoperatively followed by 0.5 mg/kg IV twice daily. Basiliximab, 20 mg IV on days 0 and 4, was given for induction immunosuppression. Maintenance immunosuppression consisted of methylprednisolone 0.5 mg/kg IV twice daily on postoperative days 0-3, followed by prednisone 0.5 mg/kg daily until day 30, and subsequently tapered every 2-3 months to 0.1 mg/kg daily during months 6-12 posttransplant.
- Tacrolimus was started on postoperative day 0 and dosing was adjusted to maintain a level of 12-15 ng/ml during months 0-6, 10-15 ng/ml during months 6-12, and 5-10 ng/ml thereafter.
- Mycophenolatemofetil was initiated at 500 mg twice daily on postoperative day 0 and dose adjustments were made, if required, in response to leukopenia.
- Antiviral, antifungal, and PCP prophylaxis were similar to the adult heart transplant cohort.
- Figure 6A shows the distribution of the genome sizes.
- the length dependence of the composition measurement was examined. Here, reads were trimmed to 40, 50, 65, 80 and 100 bp lengths (fastx_trimmer) and analyzed using the above-described workflow.
- Genome Abundance Estimation Relative genome abundance estimation was calculated with GRAMMy. This tool utilizes the BLAST-derived nucleic acid sequence-similarity data to perform a maximum likelihood estimation of the relative abundance of species in the sample. GRAMMy filters hits by BLAST alignment metrics (E-score, alignment length and identity rate) and accounts for the target genome size and the ambiguity of read assignments in assessing the relative abundance of the candidate reference genomes.
- BLAST alignment metrics E-score, alignment length and identity rate
- Custom scripts were used to combine the strain-level abundance estimates to obtain the abundance at higher taxonomic-level abundances.
- a minimal taxonomy for the reference database was built using Taxtastic.
- FIG. 6B shows the distribution of the number of unique viral, bacterial and fungal blast hits per million unique molecules sequenced.
- Figure 6C shows the number of viral, bacterial and fungal genome copies relative to the number of human genome copies present in the sample. The coverage of the genome of the infectious agent was normalized with respect to the human genome coverage.
- No-Template Control A no-template control experiment was performed.
- a sequencing library was generated from nuclease-free water (S01001, Nugen). The library was prepared together with 7 additional sample libraries (cell-free human DNA) to test for possible sample-to-sample crosstalk during library preparation. To ensure formation of clusters with sufficient density on the Illumina flow cell, the sample was sequenced together with a sample unrelated to the study. Whereas the sample unrelated to the study recruited 16 million reads, the no-template control library generated just 15 reads that mapped to two species in the reference database, the methanocalcodoccus janaschii (9 hits) and Bacillus subtillis (5 hits) genomes. No evidence was found for human related sequences, indicating that sample-to-sample contamination was low.
- CMV CMV was most frequently screened for (335 samples), its incidence as determined by sequencing (detected in 22 samples) was similar to that of other pathogens that were not routinely screened, including adenovirus and polyomavirus (clinically tested on four occasions and one occasion, respectively, Fig 11A ).
- Adenovirus is a community-acquired respiratory infection that can cause graft loss in lung transplant recipients and poses a particularly high risk for paediatric patients.
- Samples were collected from one paediatric patient (L78, Fig 11B panel 1) that tested positive for adenovirus. This patient also had the highest adenovirus-derived DNA load across the entire cohort.
- a sustained adenovirus load was furthermore observed in several other adult transplant patients that were not screened clinically (e.g, L34, Fig 11B panel 1), as testing is typically restricted to paediatric lung transplant cases.
- Polyomavirus is the leading cause of allograft rejection after renal transplantation but is not routinely included in post-lung transplant surveillance. We detected polyomavirus in two patients that were not tested for this pathogen (L57 and L15, Fig 11B panel 2). In both cases, the clinical records indicated persistent renal insufficiency, which may have resulted from polyomavirus infection.
- commensal infections including Pseudomonas
- non-commensal infections which are solely pathogenic and have a lower background signal.
- AUC 0.66 and 0.62 for P. aeruginosa and E. coli, respectively
- microsporidia a non-commensal fungus that can cause intestinal infections in immunosuppressed patients.
- L78 Fig 11B panel 4
- An Adenovirus infection L78, Fig 11B panel 1
- endoscopy and sigmoidoscopy results were inconclusive and stool samples tested negative for C. diff as well as Adenovirus.
- the microsporidiosis is the most likely explanation for the patient's symptoms, as the microsporidia signal measured in this patient is similar to that of 16, a patient from an unrelated cohort that tested positive for microsporidia ( Fig 11B panel 4).
- lung transplant recipients with allograft infection and acute rejection may present clinically with similar symptoms, we extended the scope of GTD to infectious disease monitoring.
- hypothesis-free infection monitoring revealed numerous un-tested pathogens, including un-diagnosed cases of adenovirus, polyomavirus, HHV-8, and microsporidia in patients who had similar microbial cfDNA levels compared to patients with positive clinical test results and associated symptoms.
- These examples illustrate the benefit of broad, sequencing-based monitoring of infection as opposed to pathogen specific testing.
- the approach can be of immediate use as tool that can assist in determining the occurrence and source of an infection. This may be of particular relevance in the context of transplantation, where the incidence of infections is high, where rejection and infection can co-occur, and where the symptoms of infection and rejection are difficult to discriminate.
Description
- This invention was made with Government support under grant RC4AI092673 awarded by the National Institutes of Health. The Government has certain rights in this invention.
- The human microbiome is now recognized as an important component of human health. Community level analyses have shed light on factors that shape the structure of the bacterial and viral components of the microbiome, such as age, diet, geographical location, antibiotic treatment and disease. For example, an individual microbiome can be altered by infection with a pathogenic organism, such that there is an increased prevalence of that organism systemically, or in an undesirable tissue. The microbiome can also be altered by changes in the immunocompetence of the individual.
WO 2013/159035 purportedly concerns calculating an estimated allele frequency of a first allele at least one informative locus using a statistical distribution and determining an amount of cell-free DNA not native to the subject in the cell- free DNA based on the estimated allele frequency.WO 2012/168815 describes methods for assembly of nucleic acid sequence data.WO 2012/159023 describes gut microflora as biomarkers for the prognosis of cirrhosis and brain dysfunction.US 2002/015955 describes a computational subtraction method. Highlander et al., (2012) Animal Health Research Reviews 13(1): 40-53 describes high throughput sequencing methods for microbiome profiling: application to food animal systems. - For a variety of purposes it would be desirable to have a method for rapid identification of specific microbiome components, e.g. the presence and prevalence of commensal, mutualistic, parasitic, opportunistic and pathogenic organisms in an individual microbiome; as well as an analysis of the overall microbiome structure. The present invention provides sensitive, rapid, non-invasive methods of monitoring the microbiome composition in clinical samples.
- The present invention is as defined in the appended claims. The present invention provides a method of determining a presence and prevalence of microbial sequences in a sample comprising cell-free nucleic acids from a non-microbial host, the method comprising:
- (i) providing a sample comprising cell-free nucleic acids from said non-microbial host, wherein said cell-free nucleic acids from said non-microbial host comprises cell-free nucleic acids from bacteria, parasites, or fungi;
- (ii) amplifying nucleic acids from said sample comprising cell-free nucleic acids by a non-biased method, a non-biased method that comprises amplifying with universal primers, or a non-biased method that comprises ligating adaptors to said nucleic acids and amplifying with primers specific for said adaptors;
- (iii) performing high-throughput sequencing of said cell-free nucleic acids from said non-microbial host to generate sequence reads, wherein said high throughput sequencing is performed on amplified nucleic acids from said sample comprising cell-free nucleic acids;
- (iv) performing bioinformatics analysis of said sequence reads to subtract host sequences; and
- (v) determining a presence and prevalence of microbial cell-free sequences from said bioinformatics analysis of said sequence reads to assess a presence and prevalence of individual strains or species of bacteria, parasites or fungi within a microbiome of said non-microbial host.
- Described herein are methods, devices, compositions and kits for analysis of the microbiome or individual components thereof in an individual. The methods find use in a determination of infection, in analysis of the microbiome structure, in determining the immunocompetence of an individual, and the like. Described herein are methods of determining the presence and prevalence of microorganisms in an individual, comprising the steps of: (i) providing a sample of cell-free nucleic acids, i.e. DNA and/or RNA from an individual; (ii) performing high-throughput sequencing, for example from about 105, and up to about 109 or more reads per sample; (iii) performing bioinformatics analysis to subtract host sequences, i.e. human, cat, dog, etc. from the analysis; and (iv) determining the presence and prevalence of microbial sequences, for example by a comparison of the coverage of sequences mapping to a microbial reference sequence to coverage of the host reference sequence.
- The subtraction of host sequences may include the step of identifying a reference host sequence, and masking microbial sequences or microbial mimicking sequences present in the reference host genome. Similarly, determining the presence of a microbial sequence by comparison to a microbial reference sequence may include the step of identifying a reference microbial sequence, and masking host sequences or host mimicking sequences present in the reference microbial genome.
- A feature of the methods is the unbiased analysis of cell-free nucleic acids from an individual. The methods include an unbiased amplification step, for example by performing PCR with universal primers, or by ligation of adapters to the nucleic acid and amplifying with primers specific for the adaptors. The methods are typically performed in the absence of sequence specific amplification of microbial sequences. A benefit to this approach is that analysis then includes all available microbiome sequences, however it requires bioinformatics analysis to identify sequences of interest in a complex dataset predominated by host sequences.
- A further benefit of the methods is the ability to provide a rapid assessment of an individual microbiome, for example analysis may be completed in less than about 3 days, less than about 2 days, less than one day, e.g. less than about 24 hours, less than about 20 hours, less than about 18 hours, less than about 14 hours, less than about 12 hours, less than about 6 hours, less than about 2 hours, less than about 30 minutes, less than about 15 minutes, less than about 1 minute.
- The analysis of cell-free nucleic acids may be used to compute a pathogenicity score, where the pathogenicity score is a numeric or alphabetic value that summarizes the overall pathogenicity of the organism for ease of interpretation, e.g. by a health practitioner. Different microbes present in the microbiome may be assigned different scores.
- The analysis of the presence and prevalence of microbial sequences can be used to provide a determination on infection, of response to therapy, including anti-microbial treatment such as treatment with antibiotics, anti-viral agents, immunization, passive immunotherapy, and the like; diet; immunosuppression, and the like; of response in clinical trials, etc. The information obtained from the analysis may be used to diagnose a condition, to monitor treatment, to select or modify therapeutic regimens, and to optimize therapy. With this approach, therapeutic and/or diagnostic regimens can be individualized and tailored according to the specificity data obtained at different times over the course of treatment, thereby providing a regimen that is individually appropriate. In addition, patient samples can be obtained at any point during the treatment process; following exposure to a pathogen; course of infection, etc. for analysis. The analysis of presence and prevalence of microbial sequences can be provided as a report. The report may be provided to the individual, to a health care professional, etc.
- The cell-free nucleic acid may be obtained from a biological sample selected from the group consisting of blood, serum, cerebrospinal fluid, synovial fluid, urine, and stool. The nucleic acid is extracted from the cell free portion of the sample, e.g. serum or plasma portion of blood may be used. The nucleic acid may be selected from the group consisting of double-stranded DNA, single-stranded DNA, single-stranded DNA hairpins, DNA/RNA hybrids, single-stranded RNA, double-stranded RNA and RNA hairpins. The nucleic acid may be selected from the group consisting of double-stranded DNA, single-stranded DNA and cDNA. The nucleic acid may be mRNA. The nucleic acid may be circulating cell-free DNA.
- The methods may comprise quantitating the one or more nucleic acids to provide a determination of prevalence of a microorganism in the sample. The amount of the one or more nucleic acids above a predetermined threshold value may be indicative of infection or altered prevalence. There may be different predetermined threshold values for different microbial organisms. Temporal differences in the amount of the one or more nucleic acids may be indicative of changes in infection, altered prevalence, response to therapy, etc.
- Described herein are computer readable mediums comprising: a set of instructions recorded thereon to cause a computer to perform the steps of: (i) receiving high throughput sequencing data from one or more nucleic acids detected in a sample of cell-free nucleic acids from a subject; (ii) performing bioinformatics analysis to subtract host sequences, i.e. human, cat, dog, etc. from the analysis; and (iii) determining the presence and prevalence of microbial sequences, for example by a comparison of the coverage of sequences mapping to a microbial reference sequence to coverage of the host reference sequence.
- Also described are reagents and kits thereof for practicing one or more of the methods described herein.
- Compositions and methods are described for the assessment of immunocompetence of an individual, particularly an individual human, by analysis of the microbiome, for example by analysis of the virome. The individual may be treated with an immunosuppressive regimen, e.g. drugs, radiation therapy, and the like. The individual may be a graft recipient treated with an immunosuppressive regimen. The individual may have an autoimmune disease treated with an immunosuppressive regimen. An individual may be assessed for immunocompetence in the absence of an immunosuppressive regimen.
- A measurement from an individual may be taken at two or time points, where a change in virus burden is indicative of a change in immunocompetence. The individual may be treated in accordance with the assessment of immunocompetence, e.g. where an indication of undesirable increased immunocompetence in a transplant patient is treated with increased levels of immunosuppressive agents; or where an undesirable decrease in immunocompetence is treated with therapeutic agents, e.g. anti-viral agents, etc.
- Nucleic acid analysis is used to identify and quantify nonhuman cell-free nucleic acids in a sample collected from a patient. The composition of the components of the microbiome is performed as described above. The structure of the viral component of the microbiome (the virome) allows a prediction of immunocompetence. The methods may further comprise establishing a virome profile prior to an immunosuppressive regimen, at the initiation of an immunosuppressive regimen, or during the course of an immunosuppressive regimen, which is used as a reference to changes in the individual virome. The circulating cell-free DNA may be annellovirus DNA.
- In particular, the load of viruses of the anelloviridae family is a predictor of immune strength, which is correlated with the probability of organ transplant rejection. While other viruses may also be predictive, it is common for patients to be treated with antivirals that affect the load of such viruses.
- Also described are methods of diagnosing or predicting transplant status or outcome comprising the steps of: (i) providing a sample from a subject who has received a transplant from a donor; (ii) determining the presence or absence of one or more virome nucleic acids; and (iii) diagnosing or predicting transplant status or outcome based on the virome load. The transplant status or outcome may comprise rejection, tolerance, non-rejection based allograft injury, transplant function, transplant survival, chronic transplant injury, or titer pharmacological immunosuppression. The amount of the one or more nucleic acids above a predetermined threshold value may be indicative of viral load and immunocompetence. The threshold may be a normative value for clinically stable post-transplantation patients with no evidence of transplant rejection or other pathologies. There may be different predetermined threshold values for different transplant outcomes or status. Temporal differences in the amount of the one or more nucleic acids may be indicative of immunocompetence.
- The transplant graft may be any solid organ, bone marrow or skin transplant. The transplant may be selected from the group consisting of kidney transplant, heart transplant, liver transplant, pancreas transplant, lung transplant, intestine transplant and skin transplant.
- A better understanding of the features and advantages of the present invention as defined by the appended claims will be obtained by reference to the following detailed description that sets forth illustrative embodiments, in which the principles of the invention are utilized, and the accompanying drawings of which:
-
Fig. 1 . Study design, read statistics and phylogenetic distribution. A. Immunosuppression reduces the risk of rejection in transplantation but increases the risk of infection. B. Design of study. 656 plasma samples were collected, cell-free DNA was purified and sequenced to an average depth of 1.2 Gbp per sample. C. Number of samples collected as function of time for the different patient groups part of the study. D. Treatment protocol for patients in the study cohort, all patients are treated with maintenance immunosuppression (tacrolimus-based (TAC) for adult heart and lung transplant recipients and cyclosporine (CYC) for pediatric patients). CMV positive (donor or recipient, CMV+) transplant cases are treated with anti-CMV prophylaxis, valganciclovir (VAL). Mean level of tacrolimus measured in blood of transplant recipients treated with a TAC-based protocol (dashed line actual, solid line window average filter). E. Fraction of reads that remain after filtering of lower quality and duplicate reads (mean 86%, left) and after removal of human and low complexity reads (mean 2%, right). F. Relative genomic abundance at different levels of taxonomic classification after removal of human reads (average over all samples from all organ transplant recipients (n = 656)). -
Fig. 2 . Relative viral genomic abundance as a function of drug dose and comparison to healthy reference. A. Mean virome composition for patients treated with the immunosuppressant tacrolimus (47 patients, 380 samples) as function of antiviral drug dose (valganciclovir) and concentration tacrolimus measured in blood. To account for the delayed effect of the virome composition on drug dose, the data on drug doses were window average filtered (window size 45 days, seefig. 1C ). Herpesvirales and caudovirales dominate the virome when patients receive low doses of immunosuppressants and antiviral drugs. Conversely, anelloviridae dominate the virome when patients receive high doses of these drugs. B. Comparison of virome composition corresponding to healthy references (n = 9), post-transplant day one samples with low drug exposure, (n=13), and samples corresponding to high drug exposure (tacrolimus ≥ 9 ng/ml, valganciclovir ≥ 600 mg, n = 68). The virome structure for day one samples (1) and the virome structure measured for a set of healthy individuals (H) are distinct from the anellovirus-dominated distribution measured for samples corresponding to high drug doses (D). The piecharts show the mean fractions, p-values in boxplot based on the Mann-Whitney test. C. Bray-Curtis beta diversity for all samples, among patients with the same transplant type (heart or lung), within subjects, for patients treated with a similar drug dosage (tacrolimus level ± 0.5 ng/ml, valganciclovir ± 50 mg), and for samples collected from the same subjects within a one-month timespan. -
Figure 3 . Temporal dynamics of the microbiome composition post-transplant. A. Relative abundance of dsDNA and ssDNA viruses for different time periods (average for all samples). The relative abundance of ssDNA viruses increases rapidly after the onset of the post-transplant drug therapy. After 6 months, the opposite trend is observed. B. Viral genome abundance at the family and order level of taxonomic classification for different time periods. The fraction of anelloviridae expands rapidly in the first several months post-transplant. The fraction of herpesvirales, caudovirales and adenoviridae decreases in that same time period. After 6 months, the opposite trends are observed. C. Time-variation in the relative abundance of bacterial phyla. Compared to the viral abundance, the representation of different bacterial phyla is relatively unchanged over the observed post-transplant period. D. Shannon entropy as a measure of the within-sample alpha- diversity for bacterial and viral genera as function of time (data grouped per one month time period). -
Figure 4 . Virome composition and total viral burden in the absence and presence of antiviral prophylaxis. A. Absolute viral load as a function of time, measured as viral genome copies per human genome copies detected by sequencing. Box plots are shown for different time periods with centers of the time periods marked on the x-axis. For all patient classes, the total viral load increases in the first weeks post-transplant (black line is sigmoid fit, change in load 7.4 ± 3). B. Viral load and composition for CMV+ cases that are treated with both immunosuppressants and antiviral drugs (78 patients, 543 samples). C. Viral load and composition for CMV -/- cases, only treated with immunosuppressants (12 patients, 75 samples). -
Figure 5 . Lower anellovirus burden in patients that suffer from graft rejection. A. Time dependence of the anellovirus load in the subgroup of patients that suffer from a severe rejection episode (biopsy grade ≥ 2R/3A, red data, 20 patients, 177 time points) and in the subgroup of patients that do not suffer from a severe-rejection-free post-transplant course (blue data, 40 patients, 285 time points). Box plots are shown for different time periods with centers of the time periods marked on the x-axis. Solid lines are cubic splines (smoothing parameter 0.75). The inset shows a cartoon of the expected opposite association of the incidence of rejection and infection with immunocompetence. B. Anellovirus load relative to the average load measured for all samples at the same time point. The time-normalized load for non-rejecting patients (N = 208) is compared to the load measured for patients suffering from a mild rejection event (biopsy grade 1R, N = 102) and patients suffering from a severe rejection episode (biopsy grade ≥ 2R/3A, N = 22). The p-values reflect the probability that the median viral load is higher for the subgroups at greater risk of rejection. The p-values are calculated by random sampling of the population with a greater amount of measurement points. N-fold random sampling, p = sum(median(Arej) > median(Anon-rej))/N), where N=104 and Arej and Anon-rej are the relative viral loads for the populations at greater and lesser risk of rejection and non-rejecting respectively. C Test of the performance of the relative anellovirus load in classifying patients as non-rejecting vs. severely rejecting, receiver-operating characteristic curve, area under the curve = 0.72. -
Figure 6 . Genome Sizes and Hit Statistics, qPCR Assay and Influence of Read Length on Measured Relative Abundance of Species at Different Levels of Taxonomic Classification (A) Distribution of genome sizes in the reference database with, 1401 viral genomes, 32 fungal genomes and 1980 bacterial genomes. (B) Distribution of unique blast hits per million unique molecules sequenced (average number of hits specified in the x axis label). C. Distribution of genome equivalents (infectious agents/diploid human) for viruses, bacteria and fungi (average number of genome equivalents specified in the x axis label). (D) Comparison of sequencing hits found per million of total reads sequenced to the number of viral copies detected using qPCR. For the qPCR assays, DNA was purified from 1 ml of plasma and eluted in a 100 µl volume. (E) Measurements of CMV and parvovirus burdens for selected cases. The highest loads of CMV virus (genome equivalents, viral/human diploid, G.E.) measured for all samples corresponded to two cases of clinically diagnosed disseminated CMV infection (a and b, shaded area denotes time-window of clinical diagnosis, * denotes time of death). (c) shows a time trace of a pediatric patient that suffered from CMV viremia. Parvovirus was detected in one pediatric heart transplant patient immediately post-transplant (d).* (F) Influence of read length on measured relative abundance of species at different levels of taxonomic classification (n = 52). Spearman sample-to-sample correlation, r, and p value, p, (two-sample Mann-Whitney U test) for the abundance of the most abundant node extracted from the 50 and 100 bp data sets: r = 0.80, p = 0.8 (a), r = 0.86, p = 0.4 (b), r = 0.92, p = 0.6 (c), r = 0.84, p = 0.5 (d), r = 0.7, p = 0.28 (e), r = 0.99, p = 1 (f). -
Figure 7 . Average Drug Doses and Measured Levels for Adult Heart and Lung Transplant Patients after Transplantation and Influence of Drug Dosage on Virome composition. (A-C) Average dose of valganciclovir and prednisone (A and C) administered and measured level of tacrolimus in blood (B) for the adult heart and lung transplant patients part of this study. (D) Compared to the viral component, the composition of the bacterial component of the microbiome is relatively insensitive to antivirals and immunosuppressants. (E) Virome composition as function of dose of anti-CMV drug (valganciclovir) and immunosuppressant (prednisone). -
Figure 8 . Temporal Dynamics of the Bacterial Component of the Microbiome Posttransplant, (A) Relative abundance of bacterial phyla as function of time. (B) Relative abundance of bacterial genera as function of time. -
Figure 9 . Virome Composition and Total Viral Burden for Different Patient Classes, (A and B) Viral load and composition for CMV positive adult heart (A), adult lung (B), and pediatric heart (C) transplant recipients, treated with both immunosuppressants and antivirals. -
Figure 10 . CMV-infection induced allograft injury. A. Correlation between clinical report of CMV (Human herpes virus 5, HHV-5) infection from specific body fluids (BAL and serum) with donor organ cfdDNA signal matched to clinical test date (P-values; Mann-Whitney U test). B. P-values for the correlation between clinical diagnosis of infection and cell-free DNA level (dashed line indicates the bonferonni-corrected significance threshold) for infections with greater than one clinical positive test result. C. An ROC curve that tests the performance of CMV derived cell-free DNA level in CMV-positive and CMV-negative patients (AUC=0.91). -
Figure 11 . Monitoring the infectome. A. Clinical testing frequency compared to the incidence of viral infections detected in sequencing. B. Time-series data for patients who tested positive (red arrows) for specific infections relative to those who were un-tested. (1) Adenovirus signal in L78 with clinical positives highlighted relative to untested patient (L34). (2) Polyomavirus signal in L69 with one positive test relative to sustained signal in un-tested patient (L57). (3) Three herpesvirus infections (HHV-4, 5, and 8) in L58 with both positive (red) and negative (black) tests for CMV (HHV-5) highlighted. (4) Microsporidia signal in 16, with four positive tests shown, relative to the signal observed in L78, which had symptoms of microsporidiosis, but was un-tested. Data are logged genome equivalents relative to human where zero values were replaced with the detection limit of the assay (the number of genome equivalents consistent with a single sequence read assigned to the target genome). - Unless defined otherwise, all technical and scientific terms used herein have the same meaning as is commonly understood by one of skill in the art to which this invention belongs.
- Certain ranges are presented herein with numerical values being preceded by the term "about." The term "about" is used herein to provide literal support for the exact number that it precedes, as well as a number that is near to or approximately the number that the term precedes. In determining whether a number is near to or approximately a specifically recited number, the near or approximating unrecited number may be a number which, in the context in which it is presented, provides the substantial equivalent of the specifically recited number.
- The practice of the present disclosure employs, unless otherwise indicated, conventional techniques of immunology, biochemistry, chemistry, molecular biology, microbiology, cell biology, genomics and recombinant DNA, which are within the skill of the art. See Sambrook, Fritsch and Maniatis, MOLECULAR CLONING: A LABORATORY MANUAL, 2nd edition (1989); CURRENT PROTOCOLS IN MOLECULAR BIOLOGY (F. M. Ausubel, et al. eds., (1987)); the series METHODS IN ENZYMOLOGY (Academic Press, Inc.): PCR 2: A PRACTICAL APPROACH (M.J. MacPherson, B.D. Hames and G.R. Taylor eds. (1995)), Harlow and Lane, eds. (1988) ANTIBODIES, A LABORATORY MANUAL, and ANIMAL CELL CULTURE (R.I. Freshney, ed. (1987)).
- Described herein are methods, devices, compositions and kits for analysis of the microbiome or individual components thereof in an individual. The methods find use in a determination of infection, in analysis of the microbiome structure, in determining the immunocompetence of an individual, and the like. Described herein are methods of determining whether a patient or subject is displaying immunocompetence. The term "individual", "patient" or "subject" as used herein includes humans as well as other mammals.
- As used herein the term "diagnose" or "diagnosis" of a status or outcome includes predicting or diagnosing the status or outcome, determining predisposition to a status or outcome, monitoring treatment of patient, diagnosing a therapeutic response of a patient, and prognosis of status or outcome, progression, and response to particular treatment.
- Microbiota. As used herein, the term microbiota refers to the set of microorganisms present within an individual, usually an individual mammal and more usually a human individual. The microbiota may include pathogenic species; species that constitute the normal flora of one tissue, e.g. skin, oral cavity, etc., but are undesirable in other tissues, e.g. blood, lungs, etc.; commensal organisms found in the absence of disease; etc. A subset of the microbiome is the virome, which comprises the viral components of the microbiome.
- The term "microbiome component" as used herein refers to an individual strains or species, The component may be a viral component, a bacterial component, a fungal component, etc.
- In a healthy animal, while the internal tissues, e.g. brain, muscle, etc., are normally presumed to be relatively free of bacterial species, the surface tissues, i.e., skin and mucous membranes, are constantly in contact with environmental organisms and become readily colonized by various microbial species. The mixture of organisms known or presumed to be found in humans at any anatomical site is referred to as the "indigenous microbiota", including various components of the indigenous microbiota. In addition to the indigenous microorganisms are various transient components, such as pathogenic or opportunistic infections. Reference sequences of organisms described below are publicly available and known in the for, example at the Genbank database.
- The intestinal microbiota of humans is dominated by species found within two bacterial phyla: members of the Bacteroidetes and Firmicutes make up >90% of the bacterial population. Actinobacteria (e.g., members of the Bifidobacterium genus) and Proteobacteria among several other phyla are less prominently represented. Common species of interest include prominent or less abundant members of this community, and may comprise, without limitation, Bacteroides thetaiotaomicron; Bacteroides caccae; Bacteroides fragilis; Bacteroides melaninogenicus; Bacteroides oralis; Bacteroides uniformis; Lactobacillus; Clostridium perfringens; Clostridium septicum; Clostridium tetani; Bifidobacterium bifidum; Staphylococcus aureus; Enterococcus faecalis; Escherichia coli; Salmonella enteritidis; Klebsiella sp.; Enterobacter sp.; Proteus mirabilis; Pseudomonas aeruginosa; Peptostreptococcus sp.; Peptococcus sp., Faecalibacterium sp,; Roseburia sp.; Ruminococcus sp.; Dorea sp.; Alistipes sp.; etc.
- In the skin microbiome most bacteria fall into four different phyla: Actinobacteria, Firmicutes, Bacteroidetes and Proteobacteria. Microorganisms that are generally regarded as skin colonizers include coryneforms of the phylum Actinobacteria (the genera Corynebacterium, Propionibacterium, such as Propionibacterium acnes; and Brevibacterium), the genus Micrococcus and Staphylococcus spp. The most commonly isolated fungal species are Malassezia spp., which are especially prevalent in sebaceous areas. The Demodex mites (such as Demodex folliculorum and Demodex brevis) may also be present. Other types of fungi that are thought to grow on the skin, include Debaryomyces and Cryptococcus spp. As non-commensals, burn wounds commonly become infected with S. pyogenes, Enterococcus spp. or Pseudomonas aeruginosa, and can also become infected with fungi and/or viruses. S. epidermidis is a very common skin commensal, but it is also the most frequent cause of hospital- acquired infection on in-dwelling medical devices such as catheters or heart valves. For a review, see Nat Rev Microbiol. (2011) Apr;9(4):244-53.
- Pathogenic species may be bacteria, virus, protozoan parasites, fungal species, etc.. Bacteria include Brucella sp., Treponema sp., Mycobacterium sp., Listeria sp., Legionella sp., Helicobacter sp, Streptococcus sp, Neisseria sp, Clostridium sp, Staphylococcus sp. or Bacillus sp.; including without limitation Treponema pallidum, Mycobacterium tuberculosis, Mycobacterium leprae, Listeria monocytogenes, Legionella pneumophila, Helicobacter pylori, Streptococcus pneumoniae, Neisseria meningitis, Clostridium novyi, Clostridium botulinum, Staphylococcus aureus, Bacillus anthracis, etc.
- Parasite pathogens include Trichomonas, Toxoplasma, Giardia, Cryptosporidium, Plasmodium, Leishmania, Trypanosoma, Entamoeba, Schistosoma, Filariae, Ascaria, Fasciola; including without limitation Trichomonas vaginalis, Toxoplasma gondii, Giardia intestinalis, Cryptosporidium parva, Plasmodium falciparum, Trypanosoma cruzi, Entamoeba histolytica, Giardia lamblia, Fasciola hepatica, etc.
- Viruses that infect humans include, for example, Adeno-associated virus; Aichi virus; Australian bat lyssavirus; BK polyomavirus; Banna virus; Barmah forest virus; Bunyamwera virus; Bunyavirus La Crosse; Bunyavirus snowshoe hare; Cercopithecine herpesvirus; Chandipura virus; Chikungunya virus; Cosavirus A; Cowpox virus; Coxsackievirus; Crimean-Congo hemorrhagic fever virus; Dengue virus; Dhori virus; Dugbe virus; Duvenhage virus; Eastern equine encephalitis virus; Ebolavirus; Echovirus; Encephalomyocarditis virus; Epstein-Barr virus; European bat lyssavirus; GB virus C/Hepatitis G virus ; Hantaan virus; Hendra virus; Hepatitis A virus; Hepatitis B virus ; Hepatitis C virus; Hepatitis E virus; Hepatitis delta virus; Horsepox virus; Human adenovirus; Human astrovirus; Human coronavirus; Human cytomegalovirus; Human enterovirus 68, 70; Human herpesvirus 1; Human herpesvirus 2; Human herpesvirus 6; Human herpesvirus 7; Human herpesvirus 8; Human immunodeficiency virus; Human papillomavirus 1; Human papillomavirus 2; Human papillomavirus 16,18; Human parainfluenza; Human parvovirus B19; Human respiratory syncytial virus; Human rhinovirus; Human SARS coronavirus; Human spumaretrovirus; Human T-lymphotropic virus; Human torovirus; Influenza A virus; Influenza B virus; Influenza C virus; Isfahan virus; JC polyomavirus; Japanese encephalitis virus; Junin arenavirus; KI Polyomavirus; Kunjin virus; Lagos bat virus; Lake Victoria marburgvirus; Langat virus; Lassa virus; Lordsdale virus; Louping ill virus; Lymphocytic choriomeningitis virus; Machupo virus; Mayaro virus; MERS coronavirus; Measles virus; Mengo encephalomyocarditis virus; Merkel cell polyomavirus; Mokola virus; Molluscum contagiosum virus; Monkeypox virus; Mumps virus; Murray valley encephalitis virus; New York virus; Nipah virus; Norwalk virus; O'nyong-nyong virus; Orf virus; Oropouche virus; Pichinde virus; Poliovirus; Punta toro phlebovirus; Puumala virus; Rabies virus; Rift valley fever virus; Rosavirus A; Ross river virus; Rotavirus A; Rotavirus B; Rotavirus C; Rubella virus; Sagiyama virus; Salivirus A; Sandfly fever sicilian virus; Sapporo virus; Semliki forest virus; Seoul virus; Simian foamy virus; Simian virus 5; Sindbis virus; Southampton virus; St. louis encephalitis virus; Tick-borne powassan virus; Torque teno virus; Toscana virus; Uukuniemi virus; Vaccinia virus; Varicella-zoster virus; Variola virus; Venezuelan equine encephalitis virus; Vesicular stomatitis virus; Western equine encephalitis virus; WU polyomavirus; West Nile virus; Yaba monkey tumor virus; Yaba-like disease virus; Yellow fever virus; Zika virus;
- Anelloviridae. The Anelloviridae family consists of non-enveloped, circular, single-stranded DNA viruses. Three genera of anellovirus are known to infect humans, named TTV, TTMDV, and TTMV.
- Torque Teno Virus (TTV) is a non-enveloped, single-stranded DNA virus with a circular, negative-sense genome. A smaller virus, which was subsequently named Torque Teno-like Mini Virus (TTMV) has also been characterized, and a third virus with a genomic size in between that of TTV and TTMV was discovered and subsequently named Torque Teno-like Midi Virus (TTMDV). Recent changes in nomenclature have classified the three anelloviruses able to infect humans into Alphatorquevirus (TTV), Betatorquevirus (TTMV), and Gammatorquevirus (TTMDV) Genera of the Anelloviridae family of viruses. To date anelloviruses are still considered "orphan" viruses waiting to be linked to human disease.
- The human anelloviruses differ in genome size ranging from 3.8-3.9 kb for TTV, 3.2 kb for TTMDV, and 2.8-2.9 kb for TTMV. A characteristic feature of anelloviruses is the extreme diversity found both within and between anellovirus species; they can exhibit as much as 33%-50% divergence at the nucleotide level. Despite the nucleotide sequence diversity, anelloviruses share conserved genomic organization, transcriptional profiles, a non-coding GC rich region, and sequence motifs resulting in shared virion structure and gene functions.
- Anellovirus infections are highly prevalent in the general population. A study in Japan found that 75-100% of patients tested were infected with at least one of the three human anelloviruses, and many were infected with multiple species. Anelloviruses can infect young children, with the earliest documented infections occurring within the first months of life. These viruses have been found in nearly every body site, fluid, and tissue tested including blood plasma, serum, peripheral blood mononuclear cells (PBMCs), nasopharyngeal aspirates, bone marrow, saliva, breast milk, feces, as well as various tissues including thyroid gland, lymph node, lung, liver, spleen, pancreas, and kidney. The replication dynamics of anelloviruses are virtually unknown because of the inability to propagate these viruses in culture. Positive-strand TTV DNA, indicative of local viral replication, has been described in hepatocytes, bone marrow cells, and circulating PBMCs.
- Anelloviruses are spread primarily through fecal-oral transmission, although mother-child and respiratory tract transmissions have also been reported. There are conflicting reports regarding the presence of TTV in cord blood specimens.
- Reference sequences for anellovirus may be accessed at Genbank, e.g. Torque teno
mini virus 1, Accession: NC_014097.1; Torque tenomini virus 6, Accession:NC_014095.1; Torqueteno midi virus 2, Accession: NC_014093.1; Torqueteno midi virus 1, Accession:NC_009225.1;Torque teno virus 3, Accession:NC_014081.1; Torque teno virus 19, Accession:NC_014078.1; Torque tenomini virus 8, Accession:NC_014068.1. - The term "antibiotic" as used herein includes all commonly used bacteristatic and bactericidal antibiotics, usually those administered orally. Antibiotics include aminoglycosides, such as amikacin, gentamicin, kanamycin, neomycin, streptomycin, and tobramycin; cephalosporins, such as cefamandole, cefazolin, cephalexin, cephaloglycin, cephaloridine, cephalothin, cephapirin, and cephradine; macrolides, such as erythromycin and troleandomycin; penicillins, such as penicillin G, amoxicillin, ampicillin, carbenicillin, cloxacillin, dicloxacillin, methicillin, nafcillin, oxacillin, phenethicillin, and ticarcillin; polypeptide antibiotics, such as bacitracin, colistimethate, colistin, polymyxin B; tetracyclines, such as chlortetracycline, demeclocycline, doxycycline, methacycline, minocycline, tetracycline, and oxytetracycline; and miscellaneous antibiotics such as chloramphenicol, clindamycin, cycloserine, lincomycin, rifampin, spectinomycin, vancomycin, and viomycin. Additional antibiotics'are described in "Remington's Pharmaceutical Sciences," 16th Ed., (Mack Pub. Co., 1980), pp. 1121-1178.
- Antiviral agents. Individuals may receive antiviral therapy, which will alter the viral load for those viruses affected by the therapy. Examples of viral infections thus treated include HIV, Bowenoid Papulosis, Chickenpox, Childhood HIV Disease, Human Cowpox, Hepatitis C, Dengue, Enteroviral, Epidermodysplasia Verruciformis, Erythema Infectiosum (Fifth Disease), Giant Condylomata Acuminata of Buschke and Lowenstein, Hand-Foot-and-Mouth Disease, Herpes Simplex,
Herpes Virus 6, Herpes Zoster, Kaposi Varicelliform Eruption, Rubeola Measles, Milker's Nodules, Molluscum Contagiosum, Monkeypox, Orf, Roseola Infantum, Rubella, Smallpox, Viral Hemorrhagic Fevers, Genital Warts, and Nongenital Warts. - Antiviral agents include azidouridine, anasmycin, amantadine, bromovinyldeoxusidine, chlorovinyldeoxusidine, cytarbine, didanosine, deoxynojirimycin, dideoxycitidine, dideoxyinosine, dideoxynucleoside, desciclovir, deoxyacyclovir, edoxuidine, enviroxime, fiacitabine, foscamet, fialuridine, fluorothymidine, floxuridine, hypericin, interferon, interleukin, isethionate, nevirapine, pentamidine, ribavirin, rimantadine, stavirdine, sargramostin, suramin, trichosanthin, tribromothymidine, trichlorothymidine, vidarabine, zidoviridine, zalcitabine and 3-azido-3-deoxythymidine, and analogs, derivatives, pharmaceutically acceptable salts, esters, prodrugs, codrugs, and protected forms thereof.
- Immunosuppression or immunosuppressive regimen, as used herein, refers to the treatment of an individual, for example a graft recipient with agents to diminish the immune responses of the host immune system against autoantigens or graft. Exemplary immunosuppression regimens are described in more detail herein.
- Primary immunosuppressive agents include calcineurin inhibitors, which combine with binding proteins to inhibit calcineurin activity, and which include, for example, tacrolimus, cyclosporine A, etc. Levels of both cyclosporine and tacrolimus must be carefully monitored. Initially, levels can be kept in the range of 10-20 ng/mL, but, after 3 months, levels may be kept lower (5-10 ng/mL) to reduce the risk of nephrotoxicity.
- Adjuvant agents are usually combined with a calcineurin inhibitor and include steroids, azathioprine, mycophenolate mofetil, and sirolimus. Protocols of interest include a calcineurin inhibitor with mycophenolate mofetil. The use of adjuvant agents allows clinicians to achieve adequate immunosuppression while decreasing the dose and toxicity of individual agents. Mycophenolate mofetil in kidney transplant recipients has assumed an important role in immunosuppression after several clinical trials have shown a markedly decreased prevalence of acute cellular rejection compared with azathioprine and a reduction in 1-year treatment failures.
- Antibody-based therapy may use monoclonal (eg, muromonab-CD3) or polyclonal antibodies or anti-CD25 antibodies (eg, basiliximab, daclizumab) and is administered in the early post-transplant period (up to 8 wk). Antibody-based therapy allows for avoidance or dose reduction of calcineurin inhibitors, possibly reducing the risk of nephrotoxicity. The adverse effect profile of the polyclonal and monoclonal antibodies limits their use in some patients.
- The term "nucleic acid" used herein refers to a polynucleotide comprising two or more nucleotides. It may be DNA or RNA. A "variant" nucleic acid is a polynucleotide having a nucleotide sequence identical to that of its original nucleic acid except having at least one nucleotide modified, for example, deleted, inserted, or replaced, respectively. The variant may have a nucleotide sequence at least about 80%, 90%, 95%, or 99%, identity to the nucleotide sequence of the original nucleic acid.
- Circulating, or cell-free, DNA was first detected in human blood plasma in 1948. (Mandel, P. Metais, P., C R Acad. Sci. Paris, 142, 241-243 (1948)) Since then, its connection to disease has been established in several areas. (Tong, Y.K. Lo, Y.M., Clin Chim Acta, 363, 187-196 (2006)) Studies reveal that much of the circulating nucleic acids in blood arise from necrotic or apoptotic cells (Giacona, M.B., et al., Pancreas, 17, 89-97 (1998)) and greatly elevated levels of nucleic acids from apoptosis is observed in diseases such as cancer. (Giacona, M.B., et al., Pancreas, 17, 89-97 (1998); Fournie, G.J., et al., Cancer Lett, 91, 221-227 (1995)). Particularly for cancer, where the circulating DNA bears hallmark signs of the disease including mutations in oncogenes, microsatellite alterations, and, for certain cancers, viral genomic sequences, DNA or RNA in plasma has become increasingly studied as a potential biomarker for disease. For example, Diehl et al recently demonstrated that a quantitative assay for low levels of circulating tumor DNA in total circulating DNA could serve as a better marker for detecting the relapse of colorectal cancer compared with carcinoembryonic antigen, the standard biomarker used clinically. (Diehl, F., et al., Proc Natl Acad Sci, 102, 16368-16373 (2005); Diehl, F., et al., Nat Med, 14, 985-990 (2008)). Maheswaran et al reported the use of genotyping of circulating cells in plasma to detect activating mutations in epidermal growth factor receptors in lung cancer patients that would affect drug treatment. (Maheswaran, S., et al., N Engl J Med, 359, 366-377 (2008)) These results collectively establish circulating DNA free in plasma as a useful species in cancer detection and treatment. Circulating DNA has also been useful in healthy patients for fetal diagnostics, with fetal DNA circulating in maternal blood serving as a marker for gender, rhesus D status, fetal aneuploidy, and sex-linked disorders. Fan et al recently demonstrated a strategy for detecting fetal aneuploidy by shotgun sequencing of cell-free DNA taken from a maternal blood sample, a methodology that can replace more invasive and risky techniques such as amniocentesis or chorionic villus sampling. (Fan, H.C., Blumenfeld, Y.J., Chitkara, U., Hudgins, L., Quake, S.R., Proc Natl Acad Sci, 105, 16266-16271 (2008)).
- The term "derived from" used herein refers to an origin or source, and may include naturally occurring, recombinant, unpurified or purified molecules. A nucleic acid derived from an original nucleic acid may comprise the original nucleic acid, in part or in whole, and may be a fragment or variant of the original nucleic acid. A nucleic acid derived from a biological sample may be purified from that sample.
- A "target nucleic acid" in the method is a nucleic acid, DNA or RNA, to be detected. A target nucleic acid derived from an organism is a polynucleotide that has a sequence derived from that of the organism and is specific to the organism. A target nucleic acid derived from a pathogen refers to a polynucleotide having a polynucleotide sequence derived from that specific the pathogen.
- Less than 1 pg, 5pg, 10 pg, 20 pg, 30 pg, 40 pg, 50 pg, 100 pg, 200 pg, 500 pg, 1 ng , 5ng, 10 ng, 20 ng, 30 ng, 40 ng, 50 ng, 100 ng, 200 ng, 500 ng, 1 µg, 5 µg, 10 µg, 20 µg, 30 µg, 40 µg, 50 µg, 100 µg, 200 µg, 500 µg or 1 mg of nucleic acids may be obtained from the sample for analysis. In some cases, about 1-5 pg, 5-10 pg, 10- 100 pg, 100 pg- 1 ng, 1 -5 ng, 5 - 10 ng, 10 - 100 ng, 100 ng- 1µg of nucleic acids are obtained from the sample for analysis.
- The methods described herein may be used to detect and/or quantify nucleic acid sequences that correspond to a microbe of interest, or a microbiome of organisms. The methods described herein can analyze at least 1; 2; 3; 4; 5; 10, 20; 50; 100; 200; 500; 1,000; 2,000; 5,000; 10,000, 20,000; 50,000; 100,000; 200,000; 300,000; 400,000; 500,000; 600,000; 700,000; 800,000; 900,000; 106, 5×10⁶, 107, 5×10⁷, 108, 5×10⁸, 109 or more sequence reads.
- The methods described herein may be used to detect and/or quantify gene expression, e.g. by determining the presence of mRNA from a microorganism in relation to DNA from that microorganism. The methods described herein may provide high discriminative and quantitative analysis of multiple genes. The methods described herein can discriminate and quantitate the expression of at least 1, 2, 3, 4, 5, 10, 20, 50, 100, 200, 500, 1,000, 2,000, 5,000, 10,000, 20,000, 50,000, 100,000, or more different target nucleic acids.
- A sample containing cell-free nucleic acids is obtained from a subject. Such subject can be a human, a domesticated animal such as a cow, chicken, pig, horse, rabbit, dog, cat, goat, etc. The cells used may be taken from a patient. Samples include, for example, the acellular fraction of whole blood, sweat, tears, saliva, ear flow, sputum, lymph, bone marrow suspension, lymph, urine, saliva, semen, vaginal flow, cerebrospinal fluid, brain fluid, ascites, milk, secretions of the respiratory, intestinal or genitourinary tracts fluid, a lavage of a tissue or organ (e.g. lung) or tissue which has been removed from organs, such as breast, lung, intestine, skin, cervix, prostate, pancreas, heart, liver and stomach. Such samples can be separated by centrifugation, elutriation, density gradient separation, apheresis, affinity selection, panning, FACS, centrifugation with Hypaque, etc. Once a sample is obtained, it can be used directly, frozen, or maintained in appropriate culture medium for short periods of time.
- To obtain a blood sample, any technique known in the art may be used, e.g. a syringe or other vacuum suction device. A blood sample can be optionally pre-treated or processed prior to use. A sample, such as a blood sample, may be analyzed under any of the methods and systems herein within 4 weeks, 2 weeks, 1 week, 6 days, 5 days, 4 days, 3 days, 2 days, 1 day, 12 hrs, 6 hrs, 3 hrs, 2 hrs, or 1 hr from the time the sample is obtained, or longer if frozen. When obtaining a sample from a subject (e.g., blood sample), the amount can vary depending upon subject size and the condition being screened. At least 10 ml, 5 ml., 1 ml, 0.5 ml, 250, 200, 150, 100, 50, 40, 30, 20, 10, 9, 8, 7, 6, 5, 4, 3, 2, or 1 µL of a sample may be obtained. 1-50, 2-40, 3-30, or 4-20 µL of sample may be obtained. More than 5, 10, 15, 20, 25, 30, 35, 40, 45, 50, 55, 60, 65, 70, 75, 80, 85, 90, 95 or 100 µL of a sample may be obtained.
- The cell-free fraction is preferably blood serum or blood plasma. The term "cell-free fraction" of a biological sample used herein refers to a fraction of the biological sample that is substantially free of cells. The term "substantially free of cells" used herein refers to a preparation from the biological sample comprising fewer than about 20,000 cells per ml, preferably fewer than about 2,000 cells per ml, more preferably fewer than about 200 cells per ml, most preferably fewer than about 20 cells per ml. In contrast to certain prior art methods, genomic DNA is not excluded from the acellular sample, and typically comprises from about 50% to about 90% of the nucleic acids that are present in the sample.
- The method may further comprise preparing a cell-free fraction from a biological sample. The cell-free fraction may be prepared using conventional techniques known in the art. For example, a cell-free fraction of a blood sample may be obtained by centrifuging the blood sample for about 3-30 min, preferably about 3-15 min, more preferably about 3-10 min, most preferably about 3-5 min, at a low speed of about 200-20,000 g, preferably about 200-10,000 g, more preferably about 200-5,000 g, most preferably about 350-4,500 g. The biological sample may be obtained by ultrafiltration in order to separate the cells and their fragments from a cell-free fraction comprising soluble DNA or RNA. Conventionally, ultrafiltration is carried out using a 0.22 µm membrane filter.
- The method may further comprise concentrating (or enriching) the target nucleic acid in the cell-free fraction of the biological sample. The target nucleic acid may be concentrated using conventional techniques known in the art, such as solid phase absorption in the presence of a high salt concentration, organic extraction by phenol-chloroform followed by precipitation with ethanol or isopropyl alcohol, or direct precipitation in the presence of a high salt concentration or 70-80% ethanol or isopropyl alcohol. The concentrated target nucleic acid may be at least about 2, 5, 10, 20 or 100 times more concentrated than that in the cell-free fraction. The target nucleic acid, whether or not concentrated, may be used for amplification as described herein.
- Described herein are methods for diagnosis or prediction of transplant rejection. The term "transplant rejection" encompasses both acute and chronic transplant rejection. "Acute rejection or AR" is the rejection by the immune system of a tissue transplant recipient when the transplanted tissue is immunologically foreign. Acute rejection is characterized by infiltration of the transplanted tissue by immune cells of the recipient, which carry out their effector function and destroy the transplanted tissue. The onset of acute rejection is rapid and generally occurs in humans within a few weeks after transplant surgery. Generally, acute rejection can be inhibited or suppressed with immunosuppressive drugs such as rapamycin, cyclosporin A, anti-CD40L monoclonal antibody and the like.
- "Chronic transplant rejection or CR" generally occurs in humans within several months to years after engraftment, even in the presence of successful immunosuppression of acute rejection. Fibrosis is a common factor in chronic rejection of all types of organ transplants. Chronic rejection can typically be described by a range of specific disorders that are characteristic of the particular organ. For example, in lung transplants, such disorders include fibroproliferative destruction of the airway (bronchiolitis obliterans); in heart transplants or transplants of cardiac tissue, such as valve replacements, such disorders include fibrotic atherosclerosis; in kidney transplants, such disorders include, obstructive nephropathy, nephrosclerorsis, tubulointerstitial nephropathy; and in liver transplants, such disorders include disappearing bile duct syndrome. Chronic rejection can also be characterized by ischemic insult, denervation of the transplanted tissue, hyperlipidemia and hypertension associated with immunosuppressive drugs.
- Further described herein are methods for determining the effectiveness of an immunosuppressive regimen for a subject who has received a transplant, e.g., an allograft.
- Described herein are methods of predicting transplant survival in a subject that has received a transplant. Described herein are methods of diagnosing or predicting whether a transplant in a transplant patient or subject will survive or be lost. Described herein are methods of diagnosing or predicting the presence of long-term graft survival. By "long-term" graft survival is meant graft survival for at least about 5 years beyond current sampling, despite the occurrence of one or more prior episodes of acute rejection. Transplant survival may be determined for patients in which at least one episode of acute rejection has occurred. As such, described herein are methods of determining or predicting transplant survival following acute rejection. Transplant survival may be determined or predicted in the context of transplant therapy, e.g., immunosuppressive therapy, where immunosuppressive therapies are known in the art. Methods of determining the class and/or severity of acute rejection (and not just the presence thereof) are also described.
- As is known in the transplantation field, the transplant organ, tissue or cell(s) may be allogeneic or xenogeneic, such that the grafts may be allografts or xenografts. A feature of the graft tolerant phenotype detected or identified by the subject methods is that it is a phenotype which occurs without immunosuppressive therapy, i.e., it is present in a host that is not undergoing immunosuppressive therapy such that immunosuppressive agents are not being administered to the host. The transplant graft maybe any solid organ and skin transplant. Examples of organ transplants that can be analyzed by the methods described herein include but are not limited to kidney transplant, pancreas transplant, liver transplant, heart transplant, lung transplant, intestine transplant, pancreas after kidney transplant, and simultaneous pancreas-kidney transplant.
- The methods described herein involve high throughput sequencing of a cell-free nucleic acid sample from an individual, followed by bioinformatics analysis to determine the presence and prevalence of microbial sequences, which sequences may be from indigenous organisms, e.g. the normal microbiome of gut, skin, etc., or may be non-indigenous, e.g. opportunistic, pathogenic, etc. infections. Analysis may be performed for the complete microbiome, or for components there, for example the virome, bacterial microbiome, fungal microbiome, protozoan microbiome, etc. Examples of nucleic acids include, but are not limited to double-stranded DNA, single-stranded DNA, single-stranded DNA hairpins, DNA/RNA hybrids, RNA (e.g. mRNA or miRNA) and RNA hairpins. The nucleic acid may be DNA. The nucleic acid may be RNA. For instance, cell-free RNA and DNA are present in human plasma.
- Genotyping microbiome nucleic acids, and/or detection, identification and/or quantitation of the microbiome-specific nucleic acids generally include an initial step of amplification of the sample, although there may be instances where sufficient cell free nucleic acids are available and can be directly sequenced. When the nucleic acid is RNA, the amplification step may be preceded by a reverse transcriptase reaction to convert the RNA into DNA. Preferably the amplification is unbiased, that is the primers for amplification are universal primers, or adaptors are ligated to the nucleic acids being analyzed, and amplification primers are specific for the adaptors. Examples of PCR techniques include, but are not limited, to hot start PCR, nested PCR, in situ polonony PCR, in situ rolling circle amplification (RCA), bridge PCR, picotiter PCR and emulsion PCR. Other suitable amplification methods include the ligase chain reaction (LCR), transcription amplification, self-sustained sequence replication, selective amplification of target polynucleotide sequences, consensus sequence primed polymerase chain reaction (CP-PCR), arbitrarily primed polymerase chain reaction (AP-PCR), degenerate oligonucleotide-primed PCR (DOP-PCR) and nucleic acid based sequence amplification (NABSA). Other amplification methods that may be used to amplify specific polymorphic loci include those described in,
U.S. Pat. Nos. 5,242,794 ,5,494,810 ,4,988,617 and6,582,938 . - Following amplification, the amplified nucleic acid is sequenced. Sequencing can be accomplished using high-throughput systems some of which allow detection of a sequenced nucleotide immediately after or upon its incorporation into a growing strand, i.e., detection of sequence in red time or substantially real time. In some cases, high throughput sequencing generates at least 1,000, at least 5,000, at least 10,000, at least 20,000, at least 30,000, at least 40,000, at least 50,000, at least 100,000 or at least 500,000 sequence reads per hour; with each read being at least 50, at least 60, at least 70, at least 80, at least 90, at least 100, at least 120 or at least 150 bases per read. Sequencing can be performed using nucleic acids described herein such as genomic DNA, cDNA derived from RNA transcripts or RNA as a template.
- High-throughput sequencing may involve the use of technology available by Helicos BioSciences Corporation (Cambridge, Massachusetts) such as the Single Molecule Sequencing by Synthesis (SMSS) method. SMSS is unique because it allows for sequencing an entire genome with no pre amplification step needed. Thus, distortion and nonlinearity in the measurement of nucleic acids are reduced. SMSS is described in part in
US Publication Application Nos. 2006002471 I;20060024678 ;20060012793 ;20060012784 ; and20050100932 . - High-throughput sequencing may involve the use of technology available by 454 Lifesciences, Inc. (Branford, Connecticut) such as the Pico Titer Plate device, which includes a fiber optic plate that transmits chemiluminescent signal generated by the sequencing reaction to be recorded by a CCD camera in the instrument. This use of fiber optics allows for the detection of a minimum of 20 million base pairs in 4.5 hours.
- Methods for using bead amplification followed by fiber optics detection are described in Marguiles, M., et al. "Genome sequencing in microfabricated high-density pricolitre reactors", Nature, doi: 10.1038/nature03959; and well as in
US Publication Application Nos. 20020012930 ;20030058629 ;20030100102 ;20030148344 ;20040248161 ;20050079510 ,20050124022 ; and20060078909 . - High-throughput sequencing may be performed using Clonal Single Molecule Array (Solexa, Inc.) or sequencing-by-synthesis (SBS) utilizing reversible terminator chemistry. These technologies are described in part in
US Patent Nos. 6,969,488 ;6,897,023 ;6,833,246 ;6,787,308 ; andUS Publication Application Nos. 200401061 30 ;20030064398 ;20030022207 ; and Constans, A,, The Scientist 2003, 17(13):36. - High-throughput sequencing of RNA or DNA can take place using AnyDot.chips (Genovoxx, Germany), which allows for the monitoring of biological processes (e.g., miRNA expression or allele variability (SNP detection). In particular, the AnyDot-chips allow for 10x-50x enhancement of nucleotide fluorescence signal detection. AnyDot.chips and methods for using them are described in part in International Publication Application Nos.
WO 02088382 WO 03020968 WO 0303 1947 WO 2005044836 ,PCTEP 05105657 DE 101 49 786DE 102 14 395 ,DE 103 56 837DE 10 2004 009 704DE 10 2004 025 696DE 10 2004 025 746DE 10 2004 025 694DE 10 2004 025 695DE 10 2004 025 744DE 10 2004 025 745DE 10 2005 012 301 - Other high-throughput sequencing systems include those disclosed in Venter, J., et al. ; Adams, M. et al, ; and M. J, Levene, et al. Science 299:682-686, January 2003; as well as
US Publication Application No. 20030044781 and2006/0078937 . Overall such system involve sequencing a target nucleic acid molecule having a plurality of bases by the temporal addition of bases via a polymerization reaction that is measured on a molecule of nucleic acid, i.e., the activity of a nucleic acid polymerizing enzyme on the template nucleic acid molecule to be sequenced is followed in real time. Sequence can then be deduced by identifying which base is being incorporated into the growing complementary strand of the target nucleic acid by the catalytic activity of the nucleic acid polymerizing enzyme at each step in the sequence of base additions. A polymerase on the target nucleic acid molecule complex is provided in a position suitable lo move along the target nucleic acid molecule and extend the oligonucleotide primer at an active site. A plurality of labeled types of nucleotide analogs are provided proximate to the active site, with each distinguishably type of nucleotide analog being complementary to a different nucleotide in the target nucleic acid sequence. The growing nucleic acid strand is extended by using the polymerase to add a nucleotide analog to the nucleic acid strand at the active site, where the nucleotide analog being added is complementary to the nucleotide of the target nucleic acid at the active site. The nucleotide analog added to the oligonucleotide primer as a result of the polymerizing step is identified. The steps of providing labeled nucleotide analogs, polymerizing the growing nucleic acid strand, and identifying the added nucleotide analog are repeated so that the nucleic acid strand is further extended and the sequence of the target nucleic acid is determined. - Shotgun sequencing may be performed. In shotgun sequencing, DNA is broken up randomly into numerous small segments, which are sequenced using the chain termination method to obtain reads. Multiple overlapping reads for the target DNA are obtained by performing several rounds of this fragmentation and sequencing. Computer programs then use the overlapping ends of different reads to assemble them into a continuous sequence.
- Described herein are methods for detection and quantitation of microbial sequences using sequencing. In this case, one can estimate the sensitivity of detection. There are two components to sensitivity: (i) the number of molecules analyzed (depth of sequencing) and (ii) the error rate of the sequencing process. Regarding the depth of sequencing, a frequent estimate for the variation between individuals is that about one base per thousand differs. Currently, sequencers such as the Illumina Genome Analyzer have read lengths exceeding 36 base pairs. While the fraction of host DNA in the blood may be variable depending on the status of the individual, one can take 90% as a baseline estimate. At this fraction of donor DNA, approximately one in 10 molecules analyzed will be microbial. On the Genome Analyzer one can obtain about 10 million molecules per analysis channel and there are 8 analysis channels per instrument run. Therefore, if one sample is loaded per channel, one should be able to detect about 106 molecules that can be identified as microbial and informative as to the status of the microbiome. Higher sensitivity can be achieved simply by sequencing more molecules, i.e. using more channels.
- The sequencing error rate also affects the sensitivity of this technique. Typical sequencing error rates for base substitutions vary between platforms, but are between 0.5-1.5%. This places a potential limit on sensitivity of 0.16 to 0.50%. However, it is possible to systematically lower the sequencing error rate by resequencing the sample template multiple times, as has been demonstrated by Helicos BioSciences (Harris, T.D., et al., Science, 320, 106-109 (2008)). A single application of resequencing would reduce the expected error rate.
- Following sequencing, the dataset of sequences is uploaded to a data processor for bioinformatics analysis to subtract host sequences, i.e. human, cat, dog, etc. from the analysis; and determine the presence and prevalence of microbial sequences, for example by a comparison of the coverage of sequences mapping to a microbial reference sequence to coverage of the host reference sequence. The subtraction of host sequences may include the step of identifying a reference host sequence, and masking microbial sequences or microbial-mimicking sequences present in the reference host genome. Similarly, determining the presence of a microbial sequence by comparison to a microbial reference sequence may include the step of identifying a reference microbial sequence, and masking host sequences or host-mimicking sequences present in the reference microbial genome.
- The dataset is optionally cleaned to check sequence quality, remove remnants of sequencer specific nucleotides (adapter sequences), and merge paired end reads that overlap to create a higher quality consensus sequence with less read errors. Repetitive sequences are identified as those having identical start sites and length, and duplicates may be removed from the analysis.
- An important feature of the methods is the subtraction of human sequences from the analysis. As the amplification/sequencing steps are unbiased, the preponderance of sequences in a sample will be host sequences. The subtraction process may be optimized in several ways to improve the speed and accuracy of the process, for example by performing multiple subtractions where the initial alignment is set at a coarse filter, i.e. with a fast aligner, and performing additional alignments with a fine filter, i.e. a sensitive aligner.
- The database of reads are initially aligned against a human reference genome, including without limitation Genbank hg19 reference sequences, to bioinformatically subtract the host DNA. Each sequence is aligned with the best fit sequence in the human reference sequence Sequences positively identified as human are bioinformatically removed from the analysis.
- The reference human sequence can also be optimized by adding in contigs that have a high hit rate, including without limitation highly repetitive sequence present in the genome that are not well represented in reference databases. It has been observed that of the reads that do not align to hg19, a significant amount is eventually identified as human in a later stage of the pipeline, when a database that includes a large set of human sequences is used, for example the entire NCBI NT database. Removing these reads earlier in the analysis can be performed by building an expanded human reference. This reference is created by identifying human contigs in a human sequence database other than the reference, e.g. NCBI NT database, that have high coverage after the initial human read subtraction. Those contigs are added to the human reference to create a more comprehensive reference set. Additionally novel assembled human contigs from cohorts studies can be used as a further mask for human-derived reads.
- Regions of the human genome reference sequence that contain non-human sequences may be masked, e.g. viral and bacterial sequences that are integrated into the genome of the reference sample. For example, Epstein-Barr Virus (EBV) has about 80% of its genome incorporated into hg19.
- Sequence reads identified as non-human are then aligned to a nucleotide database of microbial reference sequences. The database may be selected for those microbial sequences known to be associated with the host, e.g. the set of human commensal and pathogenic microrganisms.
- The microbial database may be optimized to mask or remove contaminating sequences. For example it has been observed that many public database entries include artifactual sequences not derived from the microorganism, e.g., primer sequences, host sequences, and other contaminants. It is desirable to perform an initial alignment or plurality of alignments on a database. Regions that show irregularities in read coverage when multiple samples are aligned can be masked or removed as an artifact. The detection of such irregular coverage can be done by various metrics, such as the ratio between coverage of a specific nucleotide and the average coverage of the entire contig within which this nucleotide is found. In general a sequence that is represented as greater than about 5X, about 10X, about 25X, about 50X, about 100X the average coverage of that reference sequence are artifactual. Alternatively a binomial test can be applied to provide a per-base likelihood of coverage given the overall coverage of the contig. Removal of contaminant sequence from reference databases allows accurate identification of microbes. It is a benefit of the methods that the databases are improved with alignment of samples, e.g. a database may be aligned with 1, 10, 20, 50, 100 or more samples to improve the database prior to commercial or clinical use.
- Each high confidence read may align to multiple organisms in the given microbial database. To correctly assign organism abundance based upon this possible mapping redundancy, an algorithm is used to compute the most likely organism an algorithm is selected (for example see Lindner et al. Nucl. Acids Res. (2013) 41 (1): e10). For example GRAMMy or GASiC algorithms can be used to compute the most likely organism that a given read came from. These data provide information regarding the presence of a microbe in the cell-free nucleic acid sample.
- Alignments and assignment to a host sequence or to a microbial sequence may be performed in accordance with art-recognized methods. For example, a read of 50 nt. may be assigned as matching a given genome if there is not more than 1 mismatch, not more than 2 mismatches, not more than 3 mismatches, not more than 4 mismatches, not more than 5 mismatches, etc. over the length of the read. Commercial algorithms are generally used for alignments and identification. A non-limiting example of such an alignment algorithm is the bowtie2 program (Johns Hopkins University). For example, the pre-set options in end-to-end mode may be selected based on the desired speed of alignment,
very-fast Same as: -D 5 -R 1 -N 0 -L 22 -i S,0,2.50 fast Same as: -D 10 -R 2 -N 0 -L 22 -i S,0,2.50 sensitive Same as: -D 15 -R 2 -L 22 -i S,1,1.15 very-sensitive Same as: -D 20 -R 3 -N 0 -L 20 -i S,1,0.50 - These assignments of reads to an organism (i.e. host or microbiome component) are then totaled and used to compute the estimated number of reads assigned to each organism in a given sample, in a determination of the prevalence of the organism in the cell-free nucleic acid sample. The analysis normalizes the counts for the size of the microbial genome to provide a calculation of coverage for the microbe. The normalized coverage for each microbe is compared to the host sequence coverage in the same sample to account for differences in sequencing depth between samples.
- The final determination provides a dataset of microbial organisms represented by sequences in the sample, and the prevalence of those microorganisms. These data are optionally aggregated and displayed for ready visualization, e.g. in the form of a report provided to the individual or health care provider; or written in a browser format with hyper-linked data. The coverage estimation can be aggregated with metadata from the sample, and sorted into tables and figures for each sample, or cohort of samples.
- Optionally the host sequences that are filtered out can be used for other purposes, e.g. in personalized medicine. For example, certain SNPs in the human genome may allow doctors to identify drug sensitivities for a given patient. The human-derived sequences may reveal integration of viruses into the host's genome (e.g. EBV, HPV, poliomavirus) or be used for synergistic clinical applications (e.g., cell-free tumor DNA may be used to monitor cancer progressing in parallel with infection monitoring in patients that are highly susceptible to infection due to chemotherapy).
- The analysis of cell-free nucleic acids may be used to compute a pathogenicity score, where the pathogenicity score is a numeric or alphabetic value that summarizes the overall pathogenicity of the organism for ease of interpretation, e.g. by a health practitioner. Different microbes present in the microbiome may be assigned different scores. The final "pathogenicity score" is a combination of many different factors, and typically provided as an arbitrary unit, for example ranging from 0-1, 0-10 or 0-100; as a percentile from all observed pathogenicity scores for a microbe of interest, etc. The specific parameters and weights of those parameters may be determined experimentally, e.g. by fitting the function to observed disease severity, or manually by setting the importance of different paramaters and criteria.
- Factors relevant for calculation of a pathogenicity score may include, without limitation, abundance of the microbe, e.g. as computed by number of reads relative to human reads, relative to the abundance of the microbe in a reference subject or group of subjects, e.g. a test population, a known infection, a known un-infected individual, etc. Specific mutations found in the microbe genome, which may be made with reference to a database of toxicity, pathogenicity, antibiotic resistance etc. associated with the microbe, and including without limitation SNPs, indels, plasmids etc. The co-incidence of specific microbes, including without limitation specific ratios and groups of organisms. Expression of certain sequences, e.g. be detection of mRNA, can be relevant to the pathogenicity score, e.g. as informative of whether a microbe is actively replicating or is latent; etc. Geographic features may also be included, where the geography is indicative of exposure to microbes of interest, e.g. travel history of the host; interactions with infected individuals, and the like.
- Also provided are reagents and kits thereof for practicing one or more of the above-described methods. The subject reagents and kits thereof may vary greatly. Reagents of interest include reagents specifically designed for use in production of the above-described: (i) profiling of a microbiome and an imdividual; (ii) identification of microbiome profiles; and (ii) detection and/or quantitation of one or more nucleic acids from a microbiome in a sample obtained from an individual. The kits may comprise reagents necessary to perform nucleic acid extraction and/or nucleic acid detection using the methods described herein such as PCR and sequencing. The kit may further comprise a software package for data analysis, which may include reference profiles for comparison with the test profile., and in particular may include reference databases optimized as described above. The kits may comprise reagents such as buffers, and
H 20. - Such kits may also include information, such as scientific literature references, package insert materials, clinical trial results, and/or summaries of these and the like, which indicate or establish the activities and/or advantages of the composition, and/or which describe dosing, administration, side effects, drug interactions, or other information useful to the health care provider. Such kits may also include instructions to access a database. Such information may be based on the results of various studies, for example, studies using experimental animals involving in vivo models and studies based on human clinical trials. Kits described herein can be provided, marketed and/or promoted to health providers, including physicians, nurses, pharmacists, formulary officials, and the like. Kits may also be marketed directly to the consumer.
- Any of the methods above can be performed by a computer program product that comprises a computer executable logic that is recorded on a computer readable medium. For example, the computer program can execute some or all of the following functions: (i) controlling isolation of nucleic acids from a sample, (ii) pre-amplifying nucleic acids from the sample, (iii) amplifying, sequencing or arraying specific regions in the sample, (iv) identifying and quantifying a microbial sequence in the sample, (v) comparing data on a microbe presence or prevalence detected from the sample with a predetermined threshold, (vi) determining infection, microbiome health, immunocompetence status or outcome, (vi) declaring the sample status with respect to infection, microbiome health, immunocompetence, etc.
- The computer executable logic can work in any computer that may be any of a variety of types of general-purpose computers such as a personal computer, network server, workstation, or other computer platform now or later developed. A computer program product is described comprising a computer usable medium having the computer executable logic (computer software program, including program code) stored therein. The computer executable logic can be executed by a processor, causing the processor to perform functions described herein. Some functions may be implemented primarily in hardware using, for example, a hardware state machine. Implementation of the hardware state machine so as to perform the functions described herein will be apparent to those skilled in the relevant arts.
- The program can provide a method of evaluating microbial status in an individual by accessing data that reflects the profiling of the microbiome and the individual, and/or the quantitation of one or more nucleic acids from the microbiome in the circulation of the individual.
- The computer executing the computer logic described herein may also include a digital input device such as a scanner. The digital input device can provide information on a nucleic acid, e.g., presence or prevalence
- Described herein is a computer readable medium comprising a set of instructions recorded thereon to cause a computer to perform the steps of (i) receiving data from one or more nucleic acids detected in a sample; and (ii) diagnosing or predicting a status based on the microbiome quantitation.
- Also provided are databases of microbial reference sequences; and databases of human reference sequences. Such databases will typically comprise optimized datasets as described above.
- The methods may provide an individual's status with respect to infection. The microbial infection may be a pathogen, where any presence of the pathogen sequence indicates a clinically relevant infection. The prevalence may be indicative of microbial load, where a pre-set level is indicative of clinical relevance. The individual may be treated or considered for treatment with an antimicrobial therapy, e.g. antibiotics, passive or active immunotherapy, antivirals, etc. An individual may be tested before therapy, during therapy, and after therapy.
- A microbial infection may also be indicated by load for a commensal organism, where the level of a commensal in a blood sample is indicative of intestinal health, e.g. gut lumen breakdown.
- A comparison can be made of microbioal RNA, alone or in relation to microbiol DNA, where an excess of RNA for a microbial sequence, e.g. about 5X, 10X, 15X, 20X, 25X the coverage of the microbial DNA is indicative of an active infection. The microbe thus analyzed may be one capable of latent infection, e.g. herpesvirus, hepatitis virus, etc.
- An overall estimate of the microbiome may be of interest, where the relative presence of prevalence of classes of microorganisms are of interest. It is known in the art that diet and treatment with drugs, e.g. statins, antibiotics, immunosuppressive agents, etc. can affect the overall health of the microbiome, and it is therefor of interest to determine the composition of the microbiome.
- Temporal differences in the amount of said one or more nucleic acids from the microbiome can be used to monitor effectiveness of anti-microbial treatment or to select an treatment. For instance, the amount of one or more nucleic acids from the microbiome can be determined before and after an treatment. A decrease in the one or more nucleic acids from the microbe after treatment may indicate that the treatment was successful. Additionally, the amount of one or more nucleic acids from the microbiome can be used to choose between treatments, for examples, treatments of different strengths.
- Described herein are methods for the diagnosis or prediction of immunocompetence, transplant status or outcome in a subject receiving an immunosuppressive regimen. Following immunosuppression, samples as described above can be drawn from the patient and analyzed for the presence or absence of one or more microbiome, including virome nucleic acids. The sample may be blood, plasma, serum or urine. The proportion and/or amount of microbial nucleic acids can be monitored over time and an increase in this proportion can be used to determine immunocompetence. The quantitation of load may be determined by any suitable method known in the art including those described herein such as sequencing, nucleic acid arrays or PCR.
- The amount of one or more microbiome nucleic acids in a sample from the immunosuppressed recipient may be used to determine the transplant status or outcome. Thus, the methods may further comprise quantitating the one or more nucleic acids from the microbiome. The amount of one or more nucleic acids from the donor sample may be determined as a percentage of total the nucleic acids in the sample. The amount of one or more nucleic acids from the donor sample may be determined as a ratio of the total nucleic acids in the sample. The amount of one or more nucleic acids from the donor sample may be determined as a ratio or percentage compared to one or more reference nucleic acids in the sample. For instance, the amount of one or more nucleic acids from the microbiome can be determined to be 10% of the total nucleic acids in the sample. Alternatively, the amount of one or more nucleic acids from the microbiome can be at a ratio of 1:10 compared to total nucleic acids in the sample. Further, the amount of one or more nucleic acids from the microbiome can be determined to be 10% or at a ratio of 1:10 of a reference gene such a β-globin. The amount of one or more nucleic acids from the microbiome can be determined as a concentration. For example, the amount of one or more nucleic acids from the donor sample can be determined to be 1 µg/mL.
- The amount of one or more nucleic acids from the microbiome above a predetermined threshold value may be indicative of a immunocompetence status. For example, the normative values for clinically stable patients with no evidence of graft rejection or other pathologies can be determined. An increase in the amount of one or more nucleic acids from the microbiome below the normative values for clinically stable post-transplantation patients could indicate a stable outcome. On the other hand, an amount of one or more nucleic acids from the microbiome above or at the normative values for clinically stable post-transplantation patients could indicate increased immunocompetence and risk of graft rejection.
- Different predetermined threshold values may be indicative of different transplant outcomes or status. For example, as discussed above, an increase in the amount of one or more nucleic acids from the microbiome above the normative values for clinically stable post-transplantation patients could indicate a change in transplant status or outcome such as transplant rejection or transplant injury. However, an increase in the amount of one or more nucleic acids from the microbiome above the normative values for clinically stable post-transplantation patients but below a predetermined threshold level could indicate a less serious condition such as a viral infection rather than transplant rejection. An increase in the amount of one or more nucleic acids from the microbiome above a higher threshold could indicate transplant rejection.
- Temporal differences in the amount of said one or more nucleic acids from the microbiome may be indicative of immunocompetence. For instance, a transplant patient can be monitored over time to determine the amount of one or more nucleic acids from the microbiome. A temporary decrease in the amount of one or more nucleic acids from the microbiome, which subsequently return to normal values, might indicate a less serious condition rather than transplant rejection. On the other hand, a sustained decrease in the amount one or more nucleic acids from the microbiome might indicate a serious condition such as lack of effective immunosuppression and graft rejection.
- Temporal differences in the amount of said one or more nucleic acids from the microbiome can be used to monitor effectiveness of an immunosuppressant treatment or to select an immunosuppressant treatment. For instance, the amount of one or more nucleic acids from the microbiome can be determined before and after an immunosuppressant treatment. A decrease in the one or more nucleic acids from the microbiome after treatment may indicate that the treatment was successful in preventing transplant rejection. Additionally, the amount of one or more nucleic acids from the microbiome can be used to choose between immunosuppressant treatments, for examples, immunosuppressant treatments of different strengths. For example, a lower amount in one or more nucleic acids from the microbiome may indicate that there is a need of a very potent immunosuppressant, whereas a higher amount in one or more nucleic acids from the microbiome may indicate that a less potent immunosuppressant may be used.
- Described herein are methods that sensitive and specific. The methods described herein for diagnosing or predicting transplant status or outcome may have at least 50%, 60%, 70%, 80%, 90%, 95% or 100% sensitivity. The methods described herein may have at least 50 % sensitivity. The methods described herein may have at least 78 % sensitivity. The methods described herein may have a specificity of about 70% to about 100%. The methods described herein may have a specificity of about 80% to about 100%. The methods described herein may have a specificity of about 90% to about 100%. The methods described herein may have a specificity of about 100%.
- Described herein are non-invasive diagnostics for individuals, including individuals that are being treated with immunosuppressive regimens, treated with anti-microbial agents, etc., by monitoring the sequences of cell-free DNA or RNA from non-human sources. For example, individuals carry a number of virus, where the virus load is shown herein to vary with the immunocompetence of the individual. Preferred virus for monitoring immunocompetence are annellovirus, in which the viral burden is shown herein to correlate with immunocompetence of the individual.
- Described herein are methods, devices, compositions and kits for detection and/or quantitating circulating nucleic acids, usually free in plasma or from viral particles, for the diagnosis, prognosis, detection and/or treatment of an infection, of immunocompetence, transplant status or outcome.
- Described herein is an approach to noninvasive detection of immunocompetence in transplant patients by virome analysis, which circumvents the potential problems of microchimerism from DNA from other foreign sources and is general for all organ recipients without consideration of gender. A genetic fingerprint may be generated for the virome of the individual. This approach allows for a reliable identification of sequences that can be made in a manner that is independent of the genders of donor and recipient.
- Following an immunosuppressive regimen, e.g. in conjunction with transplantation, treatment of autoimmune disease, etc., bodily fluid such as blood can be drawn from the patient and analyzed for markers. Examples of bodily fluids include, but are not limited to, smears, sputum, biopsies, secretions, cerebrospinal fluid, bile, blood, lymph fluid, saliva, and urine. Detection, identification and/or quantitation of the virome sequences can be performed using real-time PCR, chips, high-throughput shotgun sequencing of circulating nucleic acids (e.g. cell-free DNA), as well as other methods known in the art including the methods described herein. The viral load can be monitored over time and an increase in this proportion can be used to determine immunocompetence status or outcome.
- The transplant graft can be any solid organ or skin transplant. Examples of organ transplants that can be analyzed by the methods described herein include but are not limited to kidney transplant, pancreas transplant, liver transplant, heart transplant, lung transplant, intestine transplant, pancreas after kidney transplant, and simultaneous pancreas-kidney transplant.
- The methods may be used in determining the efficacy of a therapy for treatment of disease, including infection, either at an individual level, or in the analysis of a group of patients, e.g. in a clinical trial format. This typically involves the comparison of two time points for a patient or group of patients. The patient status is expected to differ between the two time points as the result of a therapeutic agent, therapeutic regimen, or disease challenge to a patient undergoing treatment.
- Examples of formats for such methods may include, without limitation, analyzing the microbiome at two or more time points, where a first time point is a diagnosed but untreated patient; and a second or additional time point(s) is a patient treated with a candidate therapeutic agent or regimen.
- In another format, a first time point is a diagnosed patient in disease remission, e.g. as ascertained by current clinical criteria, as a result of a candidate therapeutic agent or regimen. A second or additional time point(s) is a patient treated with a candidate therapeutic agent or regimen, and challenged with a disease-inducing agent, for example in a vaccine context.
- In such clinical trial formats, each set of time points may correspond to a single patient, to a patient group, e.g. a cohort group, or to a mixture of individual and group data. Additional control data may also be included in such clinical trial formats, e.g. a placebo group, a disease-free group, and the like, as are known in the art. Formats of interest include crossover studies, randomized, double-blind, placebo-controlled, parallel group trial is also capable of testing drug efficacy, and the like. See, for example, Clinical Trials: A Methodologic Perspective Second Edition, S. Piantadosi, Wiley-Interscience; 2005, ISBN-13: 978-0471727811; and Design and Analysis of Clinical Trials: Concepts and Methodologies, S. Chow and J. Liu, Wiley-Interscience; 2003; ISBN-13: 978-0471249856.
- The viral component of the microbiome, the human virome, remains relatively understudied (Wylie et al. (2012) Transl Res 160, 283-290) and little is known about the effects of immune modulation and antiviral therapies on virome composition. It was previously shown that the healthy gut virome remains remarkably stable over time (Reyes et al. (2010) Nature 466, 334-338), and that the predominant source of variation is due to differences between subjects, although an association between diet and the virome composition was found (Minot, et al. (2011). ).
- Immunosuppressive therapies significantly reduce the risk of graft rejection in organ transplantation but increase the susceptibility of recipients to infections. Infections with viral pathogens, in particular the herpesvirus cytomegalovirus (CMV), occur frequently and increase the recipient's risk of graft failure. Organ transplant recipients are therefore frequently subjected to antiviral prophylactic or preemptive therapies directed against CMV.
- The inverse relationship between the level of immunosuppression and the risks of infection and rejection leaves only a narrow therapeutic window available for patient treatment. Post-transplant care is further complicated by numerous limitations of the currently available methods for the diagnosis of infection and rejection. Diagnosis of rejection mostly relies on invasive biopsies that suffer from interobserver variability, high cost and patient discomfort. Diagnosis of infections is challenging given the fact that the symptoms of infection are diminished following immunosuppression, and commonly used diagnostic methods, such as antigen-detection and PCR-based molecular tests, rely on a specific target and therefore an a priori hypothesis for the source of the infection.
- As a final complication, patient-to-patient variability in the sensitivity to immunosuppressive drugs can give rise to over- and under immunosuppression, increasing the risk of infection or rejection respectively.
- There are few substantive methods to measure the health of the immune system, and the connection between immunocompetence and the viral component of the microbiome is poorly understood. Organ transplant recipients are treated with a post-transplant therapy that combines immunosuppressive and antiviral drugs, offering a window into the effects of immune modulation on the human virome. We used sequencing of cell-free DNA in plasma to investigate drug-virome interactions in a cohort of organ transplant recipients (656 samples, 96 patients), and find that antivirals and immunosuppressants strongly affect the structure of the virome in plasma. We observe marked virome compositional dynamics at the onset of the therapy and find that the total viral load increases with immunosuppression, whereas the bacterial component of the microbiome remains largely unaffected. The data provide insight into the relationship between the human virome, the state of the immune system, and the effects of pharmacological treatment, and offer a potential application of the virome state to predict immunocompetence.
- In this work, we sequenced cell-free DNA circulating in plasma to investigate drug-microbiome interactions following organ transplantation. We studied the patterns of infection in heart and lung transplant recipients subjected to a combination of immunosuppressants and antiviral prophylaxis. We find that immunosuppressants and antivirals have a strong influence on the structure of the viral component of the microbiome but not the bacterial component. Strong compositional dynamics are observed at the onset of the drug therapy as the virome composition of different individuals converge to a similar, drug-determined state. The total viral load increases markedly in response to the therapy, as viruses, in particular the anelloviruses, take advantage of a reduction of immunocompetence. Finally, we show that measurement of the anellovirus burden enables stratification of rejecting and non-rejecting recipients.
- 656 plasma samples were collected longitudinally from 96 solid organ transplant recipients (41 adult heart, 24 pediatric heart, 31 adult lung). Cell-free DNA was purified from plasma and sequenced. In total, we obtained 820 gigabases (Gbp) of sequencing data, with an average of 1.25 Gbp per sample (Illumina HiSeq, 1x50 bp reads,
Fig. 1B ). Organ transplant recipients were continuously enrolled in the study over the course of more than 2 years and samples were collected from the recipients at regular time points post transplant, with the highest frequency of sample collection in the first months post transplant.Fig. 1C shows the number of samples analyzed as a function of time post transplant for the different patient classes. - The patients in the cohort were treated with antiviral prophylaxis and immunosuppression as part of a standardized post-transplant therapy (
Fig. 1D ). Maintenance immunosuppression was tacrolimus-based for the adult heart and lung transplant recipients and was complemented with mycophenolate mofetil and prednisone. Pediatric patients were treated with a cyclosporine based anti-rejection therapy. CMV positive transplant recipients (prior CMV infection for recipient and/or donor), but not CMV negative recipients, were treated with antiviral prophylaxis. The protocol design entails high doses of immunosuppressants and antiviral drugs in the first few months post transplant, after which the doses are gradually reduced as the risks of rejection and infection diminish. Given the narrow therapeutic window available for immunosuppression and the large patient-to-patient variability in pharmacokinetics of tacrolimus, the concentration of the tacrolimus is directly measured in the blood and the dose is adjusted to maintain a target drug level.Fig. 1D shows the mean level of tacrolimus measured in blood for the tacrolimus-treated patients and illustrates the design of the drug treatment protocol. - DNA sequence analysis. Microbiome-derived sequences were identified after computational subtraction of human-derived sequences. To this end, duplicate and low quality reads were removed and the remaining reads were mapped to the human reference genome, build hg19 (BWA (Li and Durbin, 2009), see methods). Unmapped reads were then collected and low complexity reads were removed.
Fig. 1E shows the distribution of the remaining read fraction after applying duplicate and quality filters (average of 86 %) and the distribution of the remaining fraction after subtraction of human reads (average of 2%). - To identify infectious agents, the remaining, high quality, unique, non-human reads were mapped using BLAST to a reference database of viral (n=1401), bacterial (n=1980) and fungal (n=32) genomes (downloaded from NCBI,
Fig. 6A ). 0.12% of the uniquely sequenced reads aligned to at least one of the target genomes (Fig. 6B, C ). We used a quantitative PCR (qPCR) assay targeted to a subset of sequencing identified targets (herpesviruses Fig. 6D ). - We furthermore found that the sensitivity of the sequencing assay for the detection of herpesviruses is on par with qPCR measurements. The larger capture cross-section available to the sequencing assay - the complete target genome versus the PCR amplicon target region - is thus sufficient to overcome the signal loss in sequencing, caused by the finite efficiency of sequencing library preparation and library undersampling. The highest CMV loads measured using sequencing across all samples in the study corresponded to two adult heart transplant patients that suffered from a clinically diagnosed disseminated CMV infection (see
Fig. 6E ). - To test for the presence of potential contaminants in the reagents used for DNA extraction and sequencing library preparation, we performed two control experiments. In the first, we prepared 2 samples with a known template (Lambda gDNA, Pacbio Part no: 001-119-535), and purified DNA for sequencing using the above-described workflow (Illumina Miseq, 3.4 and 3.5 million reads). Lambda-derived sequences were removed and the remaining sequences (0.4%) were aligned to the BLAST reference database described above. No evidence was found for the various infectious agents discussed in this work, but we did detect sequences related to the Enterobacteriaceae bacterial family (phylum Proteobacteria), primarily E. coli (> 97%), and enterobacterial phages (<1%), which are likely a remnant of the lambda DNA culture. In a second control, we prepared a sample for sequencing from nuclease-free water. The sample was included in a sequencing run along with a sample unrelated to this work and recruited only a limited number of sequences, 15 in total, which mapped to genomes of two bacterial species. Again, no evidence was found for the infectious agents that are discussed below.
- We studied the microbiome composition in plasma at different levels of taxonomic classification using Grammy, a tool that utilizes the sequence-similarity data obtained with BLAST to perform a maximum likelihood estimation of the relative abundance of species. GRAMMy accounts for differences in target genome size and the ambiguity of read assignments. Note that this approach only allows estimating the abundance of species for which genomic data is available in the reference database.
Figure 1F shows the relative abundance of species at different levels of taxonomic classification (average over all samples). We find that viruses (73%) are more abundantly represented than bacteria (25%) and fungi (2%) (Fig. 1F panel a). Among viruses, we find that ssDNA viruses occupy a larger fraction (72%) than dsDNA viruses (28%). Seven distinct viral families are found (abundance > 0.75%), with one dominant family, the Anelloviridae, which accounted for 68% of the total population (Fig. 1F , panel b). The anelloviridae fraction is mostly (97%) composed of viruses from the Alphatorquevirus genus (Fig. 1F , panel c). The Alphatorque genus is the genus of Torque Teno Viruses (TTVs), and sequences related to 14 different torque teno virotypes were identified (Fig1 , panel d). Infections with polyomaviruses are widespread in the human population, and polyomavirus DNAemia is not uncommon in the first year after solid organ transplantation. Polyomavirus-derived sequences were found in 75 samples (11%) corresponding to 36 patients in the present cohort. Evidence for the presence of BK (41%), JC (27%), TS (4%), WU polyomavirus (6%), SV40 (6%) and the recently discovered HPyV6 (13 %) (Schowalter et al., 2010) was found (Fig. 1F , panel e). Among bacteria, Proteobacteria (36%), Firmicutes (50%), Actinobacteria (10%), Bacteroidetes (4%) are the phyla most abundantly represented in the sample (Fig. 1F , panel f). - To investigate potential incorrect assignments of the relatively short reads available to this study (50 bp), we examined the dependence of the abundance estimates on read length, based on longer, paired-end reads (2x100 bp) collected for a subset of samples (n=55). We found that the abundance estimates based on 50 bp subreads and 100 bp reads are similar for all levels of taxonomic classification reported here (
fig. 6F ). - Sensitivity of virome composition to drug dosage. The available clinical data on drug dosage was used to analyze drug-microbiome interactions. Here, we examined data for the adult heart and lung transplant patients that were treated with a tacrolimus-based anti-rejection protocol (47 patients and 380 observations), thereby excluding the pediatric patients that were treated with cyclosporine and patients that were switched from tacrolimus to cyclosporine immunosuppression due to drug-intolerance issues. Data on prescription antiviral drug doses (valganciclovir) and the measured levels of tacrolimus in blood were collected from individual patient records and the mean composition for samples corresponding to different drugs levels was extracted. To account for a delayed effect of the microbiome composition on dose changes, the drug level and dose data were sliding window average filtered (see
Fig. 1C andFig.7A-C ; window size 45 days). - We find that the structure of the viral component of the microbiome is a sensitive function of drug dosage (47 patients, 380 samples,
Figure 2A ). However, the structure of the bacterial component of the microbiome was not significantly altered by the drug therapy, as discussed further below (Fig. 7D ). Herpesvirales and caudovirales dominated the virome when patients received a low dose of valganciclovir and tacrolimus. In contrast, a high dose of immunosuppressants and antivirals gave rise to a virome structure that is dominated by anelloviridae (up to 94% occupation at high drug levels). The antiviral prophylaxis is intended to prevent CMV disease, but other herpesviruses are also susceptible to the drug so it is not surprising that a higher dose of valganciclovir gives rise to a lower fraction of viruses from the Herpesvirales order. The observation that anelloviridae take advantage of suppression of the host immune system is consistent with various observations from the literature: it was previously shown that the incidence of anelloviridae increases with progression towards AIDS in HIV patients, and that the total burden of the anellovirus TTV increases post liver transplantation. Furthermore, an increased prevalence of anelloviridae in pediatric patients with fevers was reported recently. - We next compare the virome composition measured for organ transplant recipients to the composition observed in healthy individuals, not on immunosupressants or antivirals (n = 9, sequencing data available from a previous study). Here, we compare the healthy composition to the composition measured for organ transplant recipients at the start of the drug therapy (post-operative day one, n = 13), corresponding to a minimal drug exposure, and to the composition measured for transplant recipients exposed to high drug levels (well after the transplant procedure, tacrolimus ≥ 9 ng/ml. valgancicolvir ≥ 600 mg, n = 68). We find a similar composition of the virome for the healthy reference samples and samples corresponding to minimal drug exposure (
Figure 2B ). However, the compositions of the healthy reference and minimal drug exposure samples are distinct from the anelloviridae-dominated composition measured for high drug exposure samples. - The tacrolimus-based immunosuppressive therapy is complemented with induction therapy in the first 3 days post transplant (with anti-thymocyte globulin, daclizumab, or basiliximab) and the patients furthermore receive the corticosteroid prednisone throughout the post transplant therapy. The time-dosage profile for prednisone and tacrolimus are similar: high doses at the onset of the therapy followed by a gradual dose reduction (
Fig. 7A-C ). The data inFig. 2A thus reflect the combined effect of prednisone and tacrolimus. An analysis of the differential effect of prednisone and valganciclovir on the virome composition (Fig. 7E ) shows the same trend observed inFig. 2A : higher prednisone doses lead to a larger representation of anelloviruses. Lastly, we note that a subset of patients was not treated with antiviral drugs. The data corresponding to this subset of patients allowed us to further disentangle the differential effect of the antiviral drugs and the immunosuppressants on the composition of the virome, as described below. - Partitioning of microbiome diversity. We studied the diversity of the bacterial and viral components of the microbiome. The within-subject diversity was lower than the between-subject diversity, both for bacteria and viruses (Bray-Curtis beta diversity, bacterial composition at phylum level, family and order level viruses,
Fig. 2C ). Partitioning the data for patients according to transplant type, heart or lung, or age did not reduce the diversity. Within subjects, the diversity was lower for samples collected within a one month timespan, again both for bacteria and viruses. For viruses but not for bacteria, we find that the diversity is lower when comparing samples collected at a similar drug dosage (tacrolimus level ± 0.5 ng/ml, valganciclovir ± 50 mg). Taken together with the sensitivity of the population averages to drug dosage inFig. 2A , we thus find that the composition of the virome for patients that are subject to the same drug therapy converges to a similar state. - Dynamic response of virome to drug dose changes. A strong temporal response of the virome to changes in drug dosage is observed, consistent with the sensitivity of the virome composition to drug dosage.
Figure 3A shows the time dependence of the relative genomic abundance of ssDNA and dsDNA viruses (data from all patient groups and samples, n = 656). The fraction of ssDNA viruses expands rapidly during the first months post transplant followed by the opposite trend after 6 months.Figure 3B shows the time-dependent relative composition of the most abundant viruses grouped at the family and order level and provides more detail on the virome compositional dynamics (data from all patient groups and samples, n = 656). The dsDNA fraction consists of caudovirales, adenoviridae, polyomaviridae and herpesvirales, which together occupy 95% of the virome in the first week(s) post transplant. ssDNA viruses only occupy 5% of the initial virome and mainly consist of members of the anelloviridae family. The fraction occupied by adenoviridae, caudovirales and herpesvirales decreases strongly in the first few months as these virotypes are effectively targeted by the antiviral prophylaxis. In contrast, the relative abundance of anelloviridae increases rapidly as these virotypes largely escape targeting by the antiviral drugs and take advantage of the reduced immunocompetence of the patients (maximum of 84% during months 4.5-6). Six months after the organ transplant procedure, the opposite trends are observed, consistent with the reduction in antiviral and immunosuppressant drugs prescribed by the therapeutic protocol. - Compared to the viral component, the bacterial component of the microbiome remains relatively stable over time, an observation that is made at the phylum, order and genus taxonomic levels (
Fig. 3C , n = 656, and Fig. S3).Figure 3D shows the within-sample alpha diversity for the bacterial and viral genera as function of time (Shannon entropy, one month time periods, 590 bacterial genera, 168 viral genera examined). The diversity of observed viral genera decreases at the onset of the therapy (1.05 ± 0.5 inmonth 1 to 0.31 ± 0.33 in months 4-5, p << 10-6, Mann-Whitney U test), whereas the alpha diversity of bacteria remains relatively unchanged during the course of the post transplant therapy (2.2 ± 1.14 inmonth 1 to 2.6 ± 0.85 in months 4-5, p = 0.1, Mann-Whitney U test). - Increase in total viral load at onset of post transplant therapy. To obtain insight into the effect of therapeutic drugs on total viral load, we extracted the absolute genomic abundance of all viruses relative to the number of human genome copies by normalizing the genome coverage of the viral targets to the coverage of the human genome. For all patient groups part of this study an increase in total viral load is observed at the onset of the therapy (
Fig. 4A ), regardless of transplant type (heart or lung) or age (adult or pediatric) (change in load, 7.4 ± 3, sigmoid fit, black line). Combined with relative abundance data, the total viral load data reveals a net reduction of the Herpesvirales load and a net increase in anelloviridae load in the first 3 months post-transplant for patients that are simultaneously treated with antivirals and immunosuppressants. - The data thus show a differential effect of the combination of antivirals and immunosuppressants on different virotypes. The data also show a reduction in total adenoviridae load, indicating that adenoviridae replication is suppressed by valganciclovir, in agreement with previous studies.
Figure 4B summarizes data for all transplant types, but the same trends are observed when stratifying according to different transplant types: adult heart transplant recipients (n = 268,Fig. 9A ), adult lung transplant recipients (n = 166,Fig. 8B ), and the pediatric patients that are treated with cyclosporine as opposed to tacrolimus (n = 99,Fig. 9C ). - Not all patients in the study cohort received both antiviral and immunosuppressant drugs: for transplant cases where both the donor and recipient do not show evidence of a prior CMV infection in a CMV antibody assay, it is judged that the risks of complications due to antiviral prophylaxis outweigh the potential risk of a newly acquired CMV infection, and the patients are accordingly not treated with antiviral prophylaxis. These patients are thus solely treated with immunosuppressants.
Figure 9C shows the time dependent viral load and composition of the CMV negative cases (n = 75). The net effect of immunosuppressant-only therapy is an expansion of all virotypes, including Herpesvirales and adenoviridae. Tapering of immunosuppression leads to a reduction of the total viral load. - Lower anellovirus burden in patients suffering from a graft rejection episode. Given the correlation of the anellovirus burden with the extent of immunosuppression (see
figure 2A andFigure 4 ), and given the association between immunocompetence and the risk of rejection, we asked whether the anellovirus burden can be used for the classification of rejecting and non-rejecting graft recipients.Figure 5A shows the anellovirus load measured for rejecting and non-rejecting patients as function of time post transplant. Here, patients are classified as rejecting in case they suffer from at least one biopsy-determined moderate or severe rejection episode, biopsy grade ≥ 2R/3A (in red; 20 patients, 177 data points). The rejection-free patients correspond to patients that are not diagnosed to suffer from a moderate or severe graft damage throughout their post transplant course (in blue; biopsy grades < 2R/3A, 40 patients, 285 data points). -
Figure 5A shows that the anellovirus burden is significantly lower for the rejecting individuals at almost every time point. We next directly compared the anellovirus burden for patients at rejection with the burden measured for patients in the absence of rejection. To account for the time dependence of the anellovirus load described above (Fig. 5A ), we extract the anellovirus load relative to the mean load measured for all samples at the same time point.Figure 5B shows the time-normalized load for non-rejecting patients (N = 208) compared to the load measured for patients suffering from a mild rejection event (biopsy grade 1R, N = 102) and patients suffering from a severe rejection episode (biopsy grade ≥ 2R/3A, N = 22). The figure shows that the time-normalized loads are significantly lower for the patients at greater risk of rejection. P-values were calculated by random sampling of the population with a greater amount of measurement points, p = sum(median(Arej) > median(Anon-rej))/N, where N = 104 and Arej and Anon-rej are the relative viral loads for the populations at greater and lesser risk of rejection and non-rejecting respectively (p = 0.011, p = 0.0002 and p = 0.036). - These observations are in line with a view that the risk of rejection and the incidence of infection have an opposite association with the patients' immunocompetence (see inset
Figure 5A ). The lower viral load observed for rejecting patients is thus indicative of a higher level of immunocompetence in this subgroup of patients, even though these patients are treated with the same immunosuppressive protocol. Patient-to-patient variability in the sensitivity to suppression of immune function is known to occur and the lack of predictability in immunosuppression is an important risk factor in transplantation. A presently-used commercial assay for the measurement of immunocompetence has not been found to be predictive of acute rejection or significant infections. The development of methods for the direct measurement of immunocompetence, that can replace or complement existing assays, will therefore be important. The total anellovirus load recorded in organ transplant recipients could serve as an alternative marker.Figure 5C shows a receiver-operating characteristic and tests the performance of the relative anellovirus load in classifying non-rejecting and rejecting patients (area under the curve = 0.72). - We have studied drug-microbiome interactions following solid organ transplantation by sequencing cell-free DNA in the recipients' plasma. The data reveal much about the fundamental structure of the human virome in plasma and how it responds to pharmacological perturbation; they also show the relative insensitivity to immunosuppression of the composition of the bacterial component of the microbiome. These data are useful in the design and optimization of post-transplant therapeutic protocols. For example, they show that tapering of antiviral prophylaxis from initial high doses leads to a resurgence of the herpesvirales fraction. CMV DNA load has previously been shown to predict CMV disease relapse and rejection, raising the question of whether patients would benefit from longer-term prophylactic therapy.
- The marked expansion in abundance of anelloviridae upon immunosuppression is also worth further consideration. Anelloviruses are ubiquitous in the human population and, although no pathogenicity has been established, anelloviruses are currently under investigation as potential cofactors in carcinogenesis. The sensitivity of anelloviridae to immunosuppression makes organ transplantation an ideal setting for the study of the properties of anelloviridae, particularly in the light of the increased incidence of cancer seen in transplant recipients. The observation of a lower-than-average burden of anelloviruses in patients that suffer from a rejection episode is indicative of insufficient immunosuppression in this subgroup of patients, even though these patients were subject to the immunosuppressant levels prescribed per protocol. This suggests that there would be value in designing assays that allow directly gauging the level of a patient's immunocompetence, in addition to measurements of circulating drug levels. The total burden of anelloviruses identified in a transplant recipient's blood may serve as one such marker of the overall state of immunosuppression of the individual patient.
- High throughput DNA sequencing finds use in the hypothesis-free diagnosis of infections. This approach is of particular relevance in the context of transplantation given the fact that infections occur frequently in transplantation and are difficult to diagnose in immunocompromised individuals, and given that sequence analysis can additionally provide information on the graft health through the quantification of donor-derived human DNA circulating in plasma. In other areas of infectious disease, it may be of value to develop subtractive methods to eliminate the human DNA and enrich for DNA of viral and microbial origin.
- Clinical sample collection: Patients were enrolled at Stanford University Hospital (SUH) or Lucile Packard Children's Hospital (LPCH), and were excluded if they were recipients of multi-organ transplants. This study was approved by the Stanford University Institutional Review Board (protocol # 17666) and enrollment commenced in March 2010. For details on patient recruitment and post transplant treatment of the patients see the extended experimental procedures section.
- Plasma processing and DNA extraction: Plasma was extracted from whole blood samples within three hours of sample collection, as previously described (Fan et al., 2008), and stored at -80°C. When required for analysis, plasma samples were thawed and circulating DNA was immediately extracted from 0.5-1 ml plasma using the QIAamp Circulating Nucleic Acid Kit (Qiagen).
- Sequencing library preparation and sequencing: Sequencing libraries were prepared from the purified patient plasma DNA using the NEBNext DNA Library Prep Master Mix Set for Illumina with standard Illumina indexed adapters (purchased from IDT), or using a microfluidics-based automated library preparation platform (Mondrian ST, Ovation SP Ultralow library system). Libraries were characterized using the Agilent 2100 Bioanalyzer (High sensitivity DNA kit) and quantified by qPCR. Samples were part of 26 different sequencing runs and were sequenced over the course of 22 months. On average 6 samples were sequenced per lane.
- Posttransplant Monitoring and Clinical Sample Collection. This analysis represents a substudy of a prospective cohort study funded by the National Institutes of Health (RC4 AI092673) to study the clinical utility of a donor-derived cell-free DNA assay for the diagnosis of acute and chronic rejection and allograft failure after thoracic organ transplantation. Patients were enrolled if they received a heart or lung transplant at Stanford University Hospital (SUH) or Lucile Packard Children's Hospital (LPCH), and were excluded if they were recipients of multiorgan transplants or if they were followed at centers other than SUH or LPCH posttransplant. This study was approved by the Stanford University Institutional Review Board (protocol # 17666) and enrollment commenced in March 2010.
- Details of the Posttransplant Therapeutic Protocol, Adult Heart Transplant Recipients. Posttransplant immunosuppression consisted of
methylprednisolone 500 mg administered immediately postoperatively followed by 125 mg every 8 hr for three doses. Antithymocyte globulin (rATG) 1 mg/kg was administered onpostoperative days prednisone 20 mg twice daily starting onpostoperative day 1 and tapered to < 0.1 mg/kg/day by the 6th postoperative month and tapered further if endomyocardial biopsies showed no evidence of cellular rejection. Tacrolimus was started onpostoperative day 1 and dosing was further adjusted to maintain a level of 10-15 ng/ml during months 0-6, 7-10 ng/ml during months 6-12, and 5-10 ng/ml thereafter. Mycophenolatemofetil was started at 1,000 mg twice daily onpostoperative day 1 and dose adjustments were made, if required, in response to leukopenia. - All patients received standard CMV (antiviral) prophylaxis consisting of
ganciclovir 5 mg/kg IV, adjusted for renal function, every 12 hr starting onpostoperative day 1 unless both donor and recipient were CMV negative. When able to tolerate oral medications, recipients were started on valganciclovir 900 mg twice daily for 2 weeks, then 900 mg daily until 6 months posttransplant, followed by 450 mg daily until 12 months posttransplant, at which point antiviral prophylaxis was discontinued. Valganciclovir dose reductions were made in the setting of leukopenia. CMV- recipients of a CMV+ allograft also received CMV hyperimmune globulin, 150 mg/kg IV, within 72 hr of transplant, 100 mg/kg atposttransplant weeks weeks - CMV- recipients of CMV- allografts were not treated with antiviral prophylaxis until May 2012; subsequently, these recipients were treated with
acyclovir 400 mg twice daily for one year. Antifungal prophylaxis consisted ofitraconazole 300 mg daily for the first 3 months posttransplant, and prophylaxis against pneumocystis jiroveci infection consisted of trimethoprim/sulfamethoxazole, 80 mg TMP component daily. Prophylaxis against pneumnocystis infection was continued indefinitely, and patients intolerant of TMP-SMX were treated with atovaquone, dapsone, or inhaled pentamidine. - All heart transplant recipients were monitored for acute cellular rejection by surveillance endomyocardial biopsies performed at scheduled intervals after transplant: weekly during the first month, biweekly until the 3rd month, monthly until the 6th month, and then at
months weeks months 2, 2.5, 3, 4, 5, 6, 8, 10, 12, 16, 20, and 24. A subset of heart transplant recipients also had blood samples collected onposttransplant day 1. If blood sampling and endomyocardial biopsies were performed on the same day, care was taken to ensure that blood was collected prior to the biopsy procedure. - Pediatric Heart Transplant Recipients. Induction immunosuppression initially consisted of
daclizumab 1 mg/kg IV every 2 weeks for a total of 5 doses, and was switched to basiliximab 10-20 mg IV onpostoperative days pulse methylprednisolone 10 mg/kg IV every 8 hr for 3 doses, followed by prednisone 0.5 mg/kg twice daily for the first 14 days posttransplant; corticosteroids were subsequently tapered off during the first posttransplant year, in the absence of acute rejection. - Calcineurin inhibition consisted primarily of cyclosporine, with goal levels of 300-350 ng/ml for months 0-3, 275-325 ng/ml for months 4-6, 250-300 ng/ml months 7-12, and 200-250 after
month 12 posttransplant. Patients intolerant of cyclosporine were treated with tacrolimus. Protocols for prophylaxis against opportunistic infections and surveillance endomyocardial biopsies were similar to adult heart transplant recipients. - Lung Transplant Recipients. Posttransplant immunosuppression consisted of methylprednisolone 500-1000 mg administered immediately postoperatively followed by 0.5 mg/kg IV twice daily. Basiliximab, 20 mg IV on
days day 30, and subsequently tapered every 2-3 months to 0.1 mg/kg daily during months 6-12 posttransplant. Tacrolimus was started onpostoperative day 0 and dosing was adjusted to maintain a level of 12-15 ng/ml during months 0-6, 10-15 ng/ml during months 6-12, and 5-10 ng/ml thereafter. Mycophenolatemofetil was initiated at 500 mg twice daily onpostoperative day 0 and dose adjustments were made, if required, in response to leukopenia. Antiviral, antifungal, and PCP prophylaxis were similar to the adult heart transplant cohort. - All lung transplant recipients were monitored for acute cellular rejection by protocol transbronchial biopsies performed at months 1.5, 3, 6, 12, 18, and 24 posttransplant. Biopsies were also performed if indicated for clinical reasons, based on symptoms or pulmonary function test results. Blood samples were collected from lung transplant recipients for study purposes at the following intervals: thrice on
day 1, twice onday 2, and once onday 3 posttransplant, followed byweeks - Workflow for the Identification of Pathogen-Derived Sequences. Exact duplicates were removed using the C-based utility fastq.cpp. Low-quality reads were removed using the quality filter that is part of the fastx package (fastq_quality_filter -Q33 -q21 - p50). The remaining reads were subsequently aligned using BWA to the human reference genome build hg19 (bwaaln - q25). Unmapped reads were collected using samtools (samtools view -f4) and low-complexity reads were removed using Seqclean (seqclean -I 40 -c 1). Reads were subsequently aligned to a selection of viral, baterial and fungal reference genomes and all references in ncbi_fungi downloaded.
-
Figure 6A shows the distribution of the genome sizes. The following parameters were used for the BLAST alignment: reward = 1, penalty = _3, word_size = 12, gapopen = 5, gapextend = 2, e-value = 10_4, perc_identity = 90, culling_limit = 2. Blast hits with alignment length shorter than 45 were removed. For a subset of samples longer reads were available (2 3 100 bp, n = 55). To test the robustness of the genomic abundance estimates, the length dependence of the composition measurement was examined. Here, reads were trimmed to 40, 50, 65, 80 and 100 bp lengths (fastx_trimmer) and analyzed using the above-described workflow. Here the blast hits with alignment lengths shorter than 37, 45, 59, 72, and 80 bp were removed for the 40, 50, 65, 80 and 100 bp reads respectively. Genome Abundance Estimation Relative genome abundance estimation was calculated with GRAMMy. This tool utilizes the BLAST-derived nucleic acid sequence-similarity data to perform a maximum likelihood estimation of the relative abundance of species in the sample. GRAMMy filters hits by BLAST alignment metrics (E-score, alignment length and identity rate) and accounts for the target genome size and the ambiguity of read assignments in assessing the relative abundance of the candidate reference genomes. Grammy was called using following parameters: python grammy_rdt.py; python grammy_pre.py -q "40,40,1" input set; python grammy_em.py -b 5 -t 0.0001 -n 100 input.mtx; grammy_post.py input.est setinput.btp. - Custom scripts were used to combine the strain-level abundance estimates to obtain the abundance at higher taxonomic-level abundances. Here, a minimal taxonomy for the reference database was built using Taxtastic.
- Quantification Absolute Viral Load. To quantify the load of infectious agents in the samples the blast hit results were collected and the best hits selected for each read using a custom script (Bioperl).
Figure 6B shows the distribution of the number of unique viral, bacterial and fungal blast hits per million unique molecules sequenced.Figure 6C shows the number of viral, bacterial and fungal genome copies relative to the number of human genome copies present in the sample. The coverage of the genome of the infectious agent was normalized with respect to the human genome coverage. - qPCR Validation of Sequencing Results for Selected Viral Targets. Standard qPCR kits for the quantification of
Human Herpes Virus Figure 6D compares the relative number of blast hits per million reads acquired to the concentration of viral genome copies as determined using qPCR. - No-Template Control. A no-template control experiment was performed. A sequencing library was generated from nuclease-free water (S01001, Nugen). The library was prepared together with 7 additional sample libraries (cell-free human DNA) to test for possible sample-to-sample crosstalk during library preparation. To ensure formation of clusters with sufficient density on the Illumina flow cell, the sample was sequenced together with a sample unrelated to the study. Whereas the sample unrelated to the study recruited 16 million reads, the no-template control library generated just 15 reads that mapped to two species in the reference database, the methanocalcodoccus janaschii (9 hits) and Bacillus subtillis (5 hits) genomes. No evidence was found for human related sequences, indicating that sample-to-sample contamination was low.
- Using the methods as described in Example, 1 reads that map to the CMV genome were quantified for each sample. An increased CMV abundance was observed in samples that were clinically positive for infection (p=7.10-9, Mann-Whitney U test,
Fig. 10C ); the level of CMV-derived DNA in our samples matched clinical reports of CMV with an AUC of 0.91 (Fig. 10C ). This data indicates that CMV surveillance can be performed in parallel with rejection monitoring using the same sequence data, and led us to examine whether other viral infections could be similarly monitored. - We identified well-characterized pathogenic and onco-viruses (
Fig 11A ) as well as commensal torque teno viruses (TTVs, alphatorquevirus genus), which is consistent with previous observations of a link between immunosuppression and TTV abundance. The frequency of clinical testing for these viruses varied considerably, with frequent surveillance of CMV (Human Herpes Virus 5, HHV-5, n=1082 tests in our cohort) relative to other pathogens (Fig 11A ). We evaluated the incidence of infection (number of samples in which a given virus is detected via sequencing) relative to the clinical screening frequency. Although CMV was most frequently screened for (335 samples), its incidence as determined by sequencing (detected in 22 samples) was similar to that of other pathogens that were not routinely screened, including adenovirus and polyomavirus (clinically tested on four occasions and one occasion, respectively,Fig 11A ). - Adenovirus is a community-acquired respiratory infection that can cause graft loss in lung transplant recipients and poses a particularly high risk for paediatric patients. Samples were collected from one paediatric patient (L78,
Fig 11B panel 1) that tested positive for adenovirus. This patient also had the highest adenovirus-derived DNA load across the entire cohort. A sustained adenovirus load was furthermore observed in several other adult transplant patients that were not screened clinically (e.g, L34,Fig 11B panel 1), as testing is typically restricted to paediatric lung transplant cases. - Polyomavirus is the leading cause of allograft rejection after renal transplantation but is not routinely included in post-lung transplant surveillance. We detected polyomavirus in two patients that were not tested for this pathogen (L57 and L15,
Fig 11B panel 2). In both cases, the clinical records indicated persistent renal insufficiency, which may have resulted from polyomavirus infection. - In a last example of the benefit of broad and hypothesis-free screening of infections, we examined a patient that exhibited a high load of human herpes virus (HHV) 8 (
Fig 11B panel 3), an oncovirus that can cause complications following solid-organ transplantation. This patient (L58) tested positive for two other herpesviruses (HHV-4a and HHV-5), which have the potential to stimulate HHV-8 re-activation. Though post-transplant monitoring for HHV-8 is only recommended in particular clinical circumstances, use of sequencing enables the identification of the virus in non-suspect cases that would otherwise go undetected. - Clinical monitoring of the microbiome. In addition to viruses measured in serum, we also observed correlation between cell-free measurements and fungal or bacterial infections detected in other body fluids, including Klebsiella pneumonia infections detected via urine culture (ROC = 0.98) and fungal infection detected in BAL. Performance on bacterial and fungal correlations was sensitive both to the infection type and body fluid queried. We observed better performance for body fluids that have tighter coupling to blood and also observed sensitivity to background signal. For example, the most commonly cultured bacterial infection (Pseudomonas) was detected in cell-free measurements for over 80% of our patient samples, which was in stark contrast to the most commonly detected viral pathogenic species (CMV), detected in only 6% of our patient samples.
- This highlights an important distinction between commensal infections (including Pseudomonas), which are part of the normal flora, and non-commensal infections, which are solely pathogenic and have a lower background signal. This distinction may explain differences in sensitivity and specificity measured for commonly cultured commensal infections (e.g., AUC=0.66 and 0.62 for P. aeruginosa and E. coli, respectively) relative to non-commensals (AUC=0.91 for CMV). In the case of commensal bacteria, the clinical question is not presence or absence but rather presence or absence in inappropriate body sites.
- In our cohort, we also detected cell-free DNA derived from microsporidia, a non-commensal fungus that can cause intestinal infections in immunosuppressed patients. We measured a sustained microsporidia load in L78 (
Fig 11B panel 4), a patient that exhibited canonical symptoms of microsporidiosis. An Adenovirus infection (L78,Fig 11B panel 1) was the suspected cause, though endoscopy and sigmoidoscopy results were inconclusive and stool samples tested negative for C. diff as well as Adenovirus. Based upon our sequencing data, the microsporidiosis is the most likely explanation for the patient's symptoms, as the microsporidia signal measured in this patient is similar to that of 16, a patient from an unrelated cohort that tested positive for microsporidia (Fig 11B panel 4). - With more than 10 billion fragments per ml of plasma, circulating cell-free DNA is an information-rich window into human physiology, with rapidly expanding applications in cancer diagnosis and cancer treatment monitoring, genetic prenatal diagnosis, and monitoring of heart transplant rejection via "genome transplant dynamics" (GTD). In this work, we applied the principle of GTD to lung transplantation--a particularly challenging type of solid organ transplant that is limited by poor survival rates, as well as an inaccurate and invasive test for allograft rejection.
- Because lung transplant recipients with allograft infection and acute rejection may present clinically with similar symptoms, we extended the scope of GTD to infectious disease monitoring. We first demonstrated a strong correlation between clinical test results and cfDNA derived from CMV--a leading cause of post-transplant graft injury. We further showed that hypothesis-free infection monitoring revealed numerous un-tested pathogens, including un-diagnosed cases of adenovirus, polyomavirus, HHV-8, and microsporidia in patients who had similar microbial cfDNA levels compared to patients with positive clinical test results and associated symptoms. These examples illustrate the benefit of broad, sequencing-based monitoring of infection as opposed to pathogen specific testing. The approach can be of immediate use as tool that can assist in determining the occurrence and source of an infection. This may be of particular relevance in the context of transplantation, where the incidence of infections is high, where rejection and infection can co-occur, and where the symptoms of infection and rejection are difficult to discriminate.
- While preferred embodiments of the present invention have been shown and described herein, it will be obvious to those skilled in the art that such embodiments are provided by way of example only. Numerous variations, changes, and substitutions will now occur to those skilled in the art without departing from the invention. It should be understood that various alternatives to the embodiments of the invention described herein may be employed in practicing the invention.
Claims (20)
- A method of determining a presence and prevalence of microbial sequences in a sample comprising cell-free nucleic acids from a non-microbial host, the method comprising:(i) providing a sample comprising cell-free nucleic acids from said non-microbial host, wherein said cell-free nucleic acids from said non-microbial host comprise cell-free nucleic acids from bacteria, parasites, or fungi;(ii) amplifying nucleic acids from said sample comprising cell-free nucleic acids by a non-biased method, a non-biased method that comprises amplifying with universal primers, or a non-biased method that comprises ligating adaptors to said nucleic acids and amplifying with primers specific for said adaptors;(iii) performing high-throughput sequencing of said cell-free nucleic acids from said non-microbial host to generate sequence reads, wherein said high throughput sequencing is performed on amplified nucleic acids from said sample comprising cell-free nucleic acids;(iv) performing bioinformatics analysis of said sequence reads to subtract host sequences; and(v) determining a presence and prevalence of microbial cell-free sequences from said bioinformatics analysis of said sequence reads to assess a presence and prevalence of individual strains or species of bacteria, parasites or fungi within a microbiome of said non-microbial host.
- The method of claim 1, wherein a presence and prevalence of a plurality of microbes is determined.
- The method of any one of claims 1 or 2, wherein at least 1000 sequence reads are performed.
- The method of any one of claims 1-3, wherein step (iv) comprises comparing coverage of sequences mapping to a microbial reference sequence to coverage of a host reference sequence.
- The method of any one of claims 1-4, wherein the step of performing bioinformatics analysis comprises identifying a reference host sequence, and masking microbial sequences and microbial mimicking sequences present in a reference host genome, or wherein the step of performing bioinformatics analysis comprises identifying a reference microbial sequence, and masking host sequences and host mimicking sequences present in a reference microbial genome.
- The method of any one of claims 1-5, wherein (i) the amount of said one or more microbial nucleic acids is indicative of infection status or treatment outcome; (ii) the amount of said one or more microbial nucleic acids above a predetermined threshold value is indicative of an infection status or treatment outcome; or (iii) said presence and prevalence of said microbial sequences is informative of whether a microbe is actively replicating or is latent.
- The method of any one of claims 1-6, wherein said sample is selected from the group consisting of blood, serum, plasma, lung lavage, respiratory secretions, synovial fluid, cerebrospinal fluid and saliva.
- The method of any one of claims 1-7, wherein said cell-free nucleic acids from said non-microbial host are selected from the group consisting of single-stranded RNA, double-stranded RNA, RNA hairpins, double-stranded DNA and single-stranded DNA.
- The method of any one of claims 1-8, further comprising:(i) providing an assessment of a microbiome to said non-microbial host or a health care provider;(ii) providing an assessment of a microbiome to said non-microbial host or a health care provider wherein said assessment provides a determination of response to therapy; or(iii) providing an assessment of a microbiome to said non-microbial host or a health care provider, wherein said assessment provides a pathogenicity score for microorganisms present in said non-microbial host.
- The method of any one of claims 1-9, wherein said method comprises ligating adaptors to said nucleic acids and amplifying with primers specific for said adaptors.
- The method of any one of claims 1-10, wherein said microbial sequences comprise at least five different target nucleic acids.
- The method of any one of claims 1-11, wherein said non-microbial host is human.
- The method of any one of claims 1-12, wherein said cell-free nucleic acids are free in plasma.
- Use of a kit comprising reagents for nucleic acid extraction or sequencing in the method of claim 1.
- The method of any one of claims 1-13, wherein said method comprises performing amplification with universal primers.
- The method of any one of claims 1-13 or 15, wherein said cell-free nucleic acids are circulating cell-free nucleic acids.
- The method of any one of claims 1-13 or 15-16, wherein said cell-free nucleic acids from said non-microbial host comprise cell-free nucleic acids from fungi and wherein said method comprises assessing the presence and prevalence of individual strains or species of the fungi.
- The method of any one of claims 1-13 or 15-16, wherein said cell-free nucleic acids from said non-microbial host comprise cell-free nucleic acids from bacteria and wherein said method comprises assessing the presence and prevalence of individual strains or species of the bacteria.
- The method of any one of claims 1-13 or 15-18 wherein said cell-free nucleic acids from said non-microbial host comprise cell-free DNA.
- The method of any one of claims 1-13 or 15-19 wherein said non-biased method comprises performing an initial amplification of said cell-free nucleic acids by attaching adaptors to said cell-free nucleic acids and amplifying with primers specific for said adaptors.
Priority Applications (1)
| Application Number | Priority Date | Filing Date | Title |
|---|---|---|---|
| EP22185212.2A EP4130350A1 (en) | 2013-11-07 | 2014-11-07 | Cell-free nucleic acids for the analysis of the human microbiome and components thereof |
Applications Claiming Priority (3)
| Application Number | Priority Date | Filing Date | Title |
|---|---|---|---|
| US201361901114P | 2013-11-07 | 2013-11-07 | |
| US201361901857P | 2013-11-08 | 2013-11-08 | |
| PCT/US2014/064669 WO2015070086A1 (en) | 2013-11-07 | 2014-11-07 | Cell-free nucleic acids for the analysis of the human microbiome and components thereof |
Related Child Applications (2)
| Application Number | Title | Priority Date | Filing Date |
|---|---|---|---|
| EP22185212.2A Division-Into EP4130350A1 (en) | 2013-11-07 | 2014-11-07 | Cell-free nucleic acids for the analysis of the human microbiome and components thereof |
| EP22185212.2A Division EP4130350A1 (en) | 2013-11-07 | 2014-11-07 | Cell-free nucleic acids for the analysis of the human microbiome and components thereof |
Publications (3)
| Publication Number | Publication Date |
|---|---|
| EP3066236A1 EP3066236A1 (en) | 2016-09-14 |
| EP3066236A4 EP3066236A4 (en) | 2017-05-24 |
| EP3066236B1 true EP3066236B1 (en) | 2022-08-24 |
Family
ID=53042160
Family Applications (2)
| Application Number | Title | Priority Date | Filing Date |
|---|---|---|---|
| EP14860535.5A Active EP3066236B1 (en) | 2013-11-07 | 2014-11-07 | Cell-free nucleic acids for the analysis of the human microbiome and components thereof |
| EP22185212.2A Pending EP4130350A1 (en) | 2013-11-07 | 2014-11-07 | Cell-free nucleic acids for the analysis of the human microbiome and components thereof |
Family Applications After (1)
| Application Number | Title | Priority Date | Filing Date |
|---|---|---|---|
| EP22185212.2A Pending EP4130350A1 (en) | 2013-11-07 | 2014-11-07 | Cell-free nucleic acids for the analysis of the human microbiome and components thereof |
Country Status (12)
| Country | Link |
|---|---|
| US (6) | US10450620B2 (en) |
| EP (2) | EP3066236B1 (en) |
| JP (3) | JP7451070B2 (en) |
| KR (3) | KR102649364B1 (en) |
| CN (2) | CN112877472A (en) |
| AU (1) | AU2014346562B2 (en) |
| BR (1) | BR112016010095A2 (en) |
| CA (2) | CA3207499A1 (en) |
| GB (1) | GB2535382A (en) |
| IL (4) | IL285106B (en) |
| MX (5) | MX2016005798A (en) |
| WO (1) | WO2015070086A1 (en) |
Families Citing this family (58)
| Publication number | Priority date | Publication date | Assignee | Title |
|---|---|---|---|---|
| US20190010543A1 (en) | 2010-05-18 | 2019-01-10 | Natera, Inc. | Methods for simultaneous amplification of target loci |
| US10179937B2 (en) | 2014-04-21 | 2019-01-15 | Natera, Inc. | Detecting mutations and ploidy in chromosomal segments |
| US11322224B2 (en) | 2010-05-18 | 2022-05-03 | Natera, Inc. | Methods for non-invasive prenatal ploidy calling |
| US11408031B2 (en) | 2010-05-18 | 2022-08-09 | Natera, Inc. | Methods for non-invasive prenatal paternity testing |
| US11939634B2 (en) | 2010-05-18 | 2024-03-26 | Natera, Inc. | Methods for simultaneous amplification of target loci |
| EP3066236B1 (en) | 2013-11-07 | 2022-08-24 | The Board of Trustees of the Leland Stanford Junior University | Cell-free nucleic acids for the analysis of the human microbiome and components thereof |
| US11859246B2 (en) * | 2013-12-11 | 2024-01-02 | Accuragen Holdings Limited | Methods and compositions for enrichment of amplification products |
| US10325685B2 (en) | 2014-10-21 | 2019-06-18 | uBiome, Inc. | Method and system for characterizing diet-related conditions |
| US9703929B2 (en) | 2014-10-21 | 2017-07-11 | uBiome, Inc. | Method and system for microbiome-derived diagnostics and therapeutics |
| US10410749B2 (en) | 2014-10-21 | 2019-09-10 | uBiome, Inc. | Method and system for microbiome-derived characterization, diagnostics and therapeutics for cutaneous conditions |
| EP3957745A1 (en) | 2014-12-20 | 2022-02-23 | Arc Bio, LLC | Compositions and methods for targeted depletion, enrichment, and partitioning of nucleic acids using crispr/cas system proteins |
| US9944993B2 (en) * | 2015-01-06 | 2018-04-17 | Haplox Biotechnology (Shenzhen) Co., Ltd. | Method for enrichment of circulating tumor DNA and reagent for enrichment of circulating tumor DNA |
| US10893509B2 (en) | 2015-02-11 | 2021-01-12 | Qualcomm Incorporated | Multiple tri-state HARQ processes |
| WO2016183106A1 (en) | 2015-05-11 | 2016-11-17 | Natera, Inc. | Methods and compositions for determining ploidy |
| AU2016264102A1 (en) * | 2015-05-18 | 2017-12-21 | Karius, Inc. | Compositions and methods for enriching populations of nucleic acids |
| EP3317428A4 (en) * | 2015-06-30 | 2018-12-19 | Ubiome Inc. | Method and system for diagnostic testing |
| EP3985111A1 (en) | 2015-08-19 | 2022-04-20 | Arc Bio, LLC | Capture of nucleic acids using a nucleic acid-guided nuclease-based system |
| CN108350502B (en) * | 2015-09-09 | 2022-07-22 | 普梭梅根公司 | Microbiome derived diagnostic and therapeutic methods and systems for oral health |
| EP3347495A4 (en) * | 2015-09-09 | 2019-08-21 | Ubiome, Inc. | Method and system for microbiome-derived diagnostics and therapeutics for conditions associated with gastrointestinal health |
| EP3141612A1 (en) * | 2015-09-10 | 2017-03-15 | Fraunhofer-Gesellschaft zur Förderung der angewandten Forschung e.V. | Method and device for nucleic acid based diagnostic approaches including the determination of a deviant condtion, especially a health condition and/or pathogenic condition of a sample |
| EP3146974A1 (en) * | 2015-09-25 | 2017-03-29 | Universite Claude Bernard - Lyon 1 | Biomarkers for early determination of severity of influenza related disease |
| CN114807323A (en) | 2015-10-09 | 2022-07-29 | 安可济控股有限公司 | Methods and compositions for enriching amplification products |
| CN105671150A (en) * | 2016-01-29 | 2016-06-15 | 江汉大学 | Method for qualitative and quantitative detection of microorganisms in human body |
| CN105603075A (en) * | 2016-01-29 | 2016-05-25 | 江汉大学 | Qualitative and quantitative wheat microorganism detecting method |
| CN105567831B (en) * | 2016-01-29 | 2019-07-23 | 江汉大学 | A kind of detection method of food microorganisms qualitative and quantitative |
| CN105603074B (en) * | 2016-01-29 | 2019-11-15 | 江汉大学 | A kind of detection method of non-diagnostic purpose microorganism qualitative and quantitative |
| CN105603076A (en) * | 2016-01-29 | 2016-05-25 | 江汉大学 | Qualitative and quantitative soil microorganism detecting method |
| US9976181B2 (en) | 2016-03-25 | 2018-05-22 | Karius, Inc. | Synthetic nucleic acid spike-ins |
| AU2017257785A1 (en) * | 2016-04-25 | 2018-11-08 | Psomagen, Inc. | Method and system for characterizing skin related conditions |
| CN109511265B (en) | 2016-05-16 | 2023-07-14 | 安可济控股有限公司 | Method for improving sequencing by strand identification |
| FR3051482B1 (en) * | 2016-05-19 | 2021-01-29 | Life & Soft | PROCESS FOR DETERMINING THE PRESENCE AND QUANTIFICATION OF AT LEAST ONE MICRO-ORGANISM IN A BIOLOGICAL SAMPLE |
| EP3831958B1 (en) * | 2016-06-30 | 2023-09-06 | Grail, LLC | Differential tagging of rna for preparation of a cell-free dna/rna sequencing library |
| CA3033749A1 (en) | 2016-08-15 | 2018-02-22 | Accuragen Holdings Limited | Compositions and methods for detecting rare sequence variants |
| WO2018067517A1 (en) | 2016-10-04 | 2018-04-12 | Natera, Inc. | Methods for characterizing copy number variation using proximity-litigation sequencing |
| US20180142299A1 (en) * | 2016-11-17 | 2018-05-24 | SeraCare Life Sciences,Inc | Methods for preparing dna reference materials and controls |
| US10011870B2 (en) | 2016-12-07 | 2018-07-03 | Natera, Inc. | Compositions and methods for identifying nucleic acid molecules |
| US20210115506A1 (en) * | 2017-04-04 | 2021-04-22 | The Board Of Trustees Of The Leland Stanford Junior University | Quantification of transplant-derived circulating cell-free DNA in the absence of a donor genotype |
| WO2018187521A2 (en) * | 2017-04-06 | 2018-10-11 | Cornell University | Methods of detecting cell-free dna in biological samples |
| WO2018191563A1 (en) | 2017-04-12 | 2018-10-18 | Karius, Inc. | Sample preparation methods, systems and compositions |
| EP3431610A1 (en) * | 2017-07-19 | 2019-01-23 | Noscendo GmbH | Methods and devices for nucleic acid-based real-time determination of disease states |
| US11646100B2 (en) | 2017-08-04 | 2023-05-09 | Billiontoone, Inc. | Target-associated molecules for characterization associated with biological targets |
| US11430543B2 (en) | 2017-08-04 | 2022-08-30 | Billiontoone, Inc. | Sequencing output determination and analysis with target-associated molecules in quantification associated with biological targets |
| US11519024B2 (en) | 2017-08-04 | 2022-12-06 | Billiontoone, Inc. | Homologous genomic regions for characterization associated with biological targets |
| WO2019060716A1 (en) | 2017-09-25 | 2019-03-28 | Freenome Holdings, Inc. | Methods and systems for sample extraction |
| CN112020565A (en) | 2018-01-05 | 2020-12-01 | 十亿至一公司 | Quality control template for ensuring validity of sequencing-based assays |
| EP3765631A4 (en) * | 2018-03-13 | 2021-12-08 | Guardant Health, Inc. | Methods for the non-invasive detection and monitoring of therapeutic nucleic acid constructs |
| CA3082601A1 (en) | 2018-03-16 | 2019-09-19 | Karius, Inc. | Sample series to differentiate target nucleic acids from contaminant nucleic acids |
| CN108660199A (en) * | 2018-05-20 | 2018-10-16 | 北京宏微特斯生物科技有限公司 | A method of pathogen is detected based on cfDNA high-flux sequences |
| WO2020033425A1 (en) * | 2018-08-06 | 2020-02-13 | Billiontoone, Inc. | Dilution tagging for quantification of biological targets |
| KR102114758B1 (en) * | 2018-11-19 | 2020-05-26 | 경북대학교 산학협력단 | Method for pretreating blood sample for nucleic acid extraction from blood borne infectious pathogens using membrane structures |
| CA3118990A1 (en) | 2018-11-21 | 2020-05-28 | Karius, Inc. | Direct-to-library methods, systems, and compositions |
| US11512349B2 (en) | 2018-12-18 | 2022-11-29 | Grail, Llc | Methods for detecting disease using analysis of RNA |
| WO2020198664A1 (en) * | 2019-03-28 | 2020-10-01 | The Regents Of The University Of California | Methods and systems for sequencing cell-free microbiome dna |
| KR102503766B1 (en) * | 2020-06-16 | 2023-02-23 | 씨제이바이오사이언스 주식회사 | Apparatus, method and recording medium storing command for determining gut microbiome index |
| CN113061666A (en) * | 2020-12-30 | 2021-07-02 | 中南大学湘雅二医院 | Detection method, application and system of cytomegalovirus after liver transplantation |
| JP2024511980A (en) * | 2021-03-18 | 2024-03-18 | ナテラ, インコーポレイテッド | How to determine transplant rejection |
| CA3224172A1 (en) * | 2021-08-11 | 2023-02-16 | Simon Green | Methods for determining secondary immunodeficiency |
| WO2023141347A2 (en) * | 2022-01-24 | 2023-07-27 | Gusto Global, Llc | Single-loci and multi-loci targeted single point amplicon fragment sequencing |
Family Cites Families (82)
| Publication number | Priority date | Publication date | Assignee | Title |
|---|---|---|---|---|
| US5242794A (en) | 1984-12-13 | 1993-09-07 | Applied Biosystems, Inc. | Detection of specific sequences in nucleic acids |
| US4988617A (en) | 1988-03-25 | 1991-01-29 | California Institute Of Technology | Method of detecting a nucleotide change in nucleic acids |
| US5494810A (en) | 1990-05-03 | 1996-02-27 | Cornell Research Foundation, Inc. | Thermostable ligase-mediated DNA amplifications system for the detection of genetic disease |
| US6287850B1 (en) | 1995-06-07 | 2001-09-11 | Affymetrix, Inc. | Bioarray chip reaction apparatus and its manufacture |
| GB9704444D0 (en) | 1997-03-04 | 1997-04-23 | Isis Innovation | Non-invasive prenatal diagnosis |
| US6969488B2 (en) | 1998-05-22 | 2005-11-29 | Solexa, Inc. | System and apparatus for sequential processing of analytes |
| USRE39920E1 (en) | 1997-05-30 | 2007-11-13 | Xenomics, Inc. | Methods for detection of nucleic acid sequences in urine |
| US20030022207A1 (en) | 1998-10-16 | 2003-01-30 | Solexa, Ltd. | Arrayed polynucleotides and their use in genome analysis |
| US6787308B2 (en) | 1998-07-30 | 2004-09-07 | Solexa Ltd. | Arrayed biomolecules and their use in sequencing |
| US7056661B2 (en) | 1999-05-19 | 2006-06-06 | Cornell Research Foundation, Inc. | Method for sequencing nucleic acid molecules |
| US7211390B2 (en) | 1999-09-16 | 2007-05-01 | 454 Life Sciences Corporation | Method of sequencing a nucleic acid |
| US7244559B2 (en) | 1999-09-16 | 2007-07-17 | 454 Life Sciences Corporation | Method of sequencing a nucleic acid |
| WO2001023610A2 (en) | 1999-09-29 | 2001-04-05 | Solexa Ltd. | Polynucleotide sequencing |
| US6582938B1 (en) | 2001-05-11 | 2003-06-24 | Affymetrix, Inc. | Amplification of nucleic acids |
| GB0002389D0 (en) | 2000-02-02 | 2000-03-22 | Solexa Ltd | Molecular arrays |
| US6897023B2 (en) | 2000-09-27 | 2005-05-24 | The Molecular Sciences Institute, Inc. | Method for determining relative abundance of nucleic acid sequences |
| US6753137B2 (en) | 2001-01-31 | 2004-06-22 | The Chinese University Of Hong Kong | Circulating epstein-barr virus DNA in the serum of patients with gastric carcinoma |
| US6996477B2 (en) * | 2001-04-19 | 2006-02-07 | Dana Farber Cancer Institute, Inc. | Computational subtraction method |
| DE10120797B4 (en) | 2001-04-27 | 2005-12-22 | Genovoxx Gmbh | Method for analyzing nucleic acid chains |
| DE10239504A1 (en) | 2001-08-29 | 2003-04-24 | Genovoxx Gmbh | Parallel sequencing of nucleic acid fragments, useful e.g. for detecting mutations, comprises sequential single-base extension of immobilized fragment-primer complex |
| JP2003101204A (en) | 2001-09-25 | 2003-04-04 | Nec Kansai Ltd | Wiring substrate, method of manufacturing the same, and electronic component |
| WO2003031947A2 (en) | 2001-10-04 | 2003-04-17 | Genovoxx Gmbh | Device for sequencing nucleic acid molecules |
| DE10149786B4 (en) | 2001-10-09 | 2013-04-25 | Dmitry Cherkasov | Surface for studies of populations of single molecules |
| US20050124022A1 (en) | 2001-10-30 | 2005-06-09 | Maithreyan Srinivasan | Novel sulfurylase-luciferase fusion proteins and thermostable sulfurylase |
| US6902921B2 (en) | 2001-10-30 | 2005-06-07 | 454 Corporation | Sulfurylase-luciferase fusion proteins and thermostable sulfurylase |
| US20050202414A1 (en) | 2001-11-15 | 2005-09-15 | The Regents Of The University Of California | Apparatus and methods for detecting a microbe in a sample |
| US6977162B2 (en) | 2002-03-01 | 2005-12-20 | Ravgen, Inc. | Rapid analysis of variations in a genome |
| NZ535045A (en) | 2002-03-01 | 2008-04-30 | Ravgen Inc | Rapid analysis of variations in a genome |
| DE10214395A1 (en) | 2002-03-30 | 2003-10-23 | Dmitri Tcherkassov | Parallel sequencing of nucleic acid segments, useful for detecting single-nucleotide polymorphisms, by single-base extensions with labeled nucleotide |
| US7442506B2 (en) | 2002-05-08 | 2008-10-28 | Ravgen, Inc. | Methods for detection of genetic disorders |
| US7727720B2 (en) | 2002-05-08 | 2010-06-01 | Ravgen, Inc. | Methods for detection of genetic disorders |
| JP2007525151A (en) | 2003-01-29 | 2007-09-06 | 454 コーポレーション | Method for preparing single-stranded DNA library |
| EP1606417A2 (en) | 2003-03-07 | 2005-12-21 | Rubicon Genomics Inc. | In vitro dna immortalization and whole genome amplification using libraries generated from randomly fragmented dna |
| CA2522007A1 (en) * | 2003-04-11 | 2004-10-28 | Medimmune, Inc. | Methods of preventing or treating respiratory conditions |
| DE10356837A1 (en) | 2003-12-05 | 2005-06-30 | Dmitry Cherkasov | New conjugates useful for modifying nucleic acid chains comprise nucleotide or nucleoside molecules coupled to a label through water-soluble polymer linkers |
| US8637650B2 (en) | 2003-11-05 | 2014-01-28 | Genovoxx Gmbh | Macromolecular nucleotide compounds and methods for using the same |
| US7169560B2 (en) | 2003-11-12 | 2007-01-30 | Helicos Biosciences Corporation | Short cycle methods for sequencing polynucleotides |
| JP2007515414A (en) * | 2003-12-16 | 2007-06-14 | パレンテラル アー エス | Plasma replacement agent and method for producing the same |
| DE102004009704A1 (en) | 2004-02-27 | 2005-09-15 | Dmitry Cherkasov | New conjugates useful for labeling nucleic acids comprise a label coupled to nucleotide or nucleoside molecules through polymer linkers |
| DE102004025746A1 (en) | 2004-05-26 | 2005-12-15 | Dmitry Cherkasov | Parallel sequencing of nucleic acids by optical methods, by cyclic primer-matrix extension, using a solid phase with reduced non-specific binding of labeled components |
| DE102004025744A1 (en) | 2004-05-26 | 2005-12-29 | Dmitry Cherkasov | Surface of a solid support, useful for multiple parallel analysis of nucleic acids by optical methods, having low non-specific binding of labeled components |
| DE102004025745A1 (en) | 2004-05-26 | 2005-12-15 | Cherkasov, Dmitry | Surface of solid phase, useful for parallel, optical analysis of many nucleic acids, has reduced non-specific binding of labeled components |
| DE102004025695A1 (en) | 2004-05-26 | 2006-02-23 | Dmitry Cherkasov | Optical fluorescent parallel process to analyse nucleic acid chains in which a sample solid is bound with a primer-matrix complex |
| DE102004025696A1 (en) | 2004-05-26 | 2006-02-23 | Dmitry Cherkasov | Ultra-high parallel analysis process to analyse nucleic acid chains in which a sample solid is bound and substrate material |
| DE102004025694A1 (en) | 2004-05-26 | 2006-02-23 | Dmitry Cherkasov | Optical fluorescent ultra-high parallel process to analyse nucleic acid chains in which a sample solid is bound with a primer-matrix complex |
| US20060002471A1 (en) | 2004-06-30 | 2006-01-05 | Lippincott Louis A | Motion estimation unit |
| US7276720B2 (en) | 2004-07-19 | 2007-10-02 | Helicos Biosciences Corporation | Apparatus and methods for analyzing samples |
| US20060012793A1 (en) | 2004-07-19 | 2006-01-19 | Helicos Biosciences Corporation | Apparatus and methods for analyzing samples |
| US20060024678A1 (en) | 2004-07-28 | 2006-02-02 | Helicos Biosciences Corporation | Use of single-stranded nucleic acid binding proteins in sequencing |
| ITRM20050067A1 (en) | 2005-02-17 | 2006-08-18 | Istituto Naz Per Le Malattie I | METHOD FOR THE DETECTION OF VIRAL OR VIRAL NUCLEIC ACIDS IN URINE. |
| AU2006214096B2 (en) | 2005-02-17 | 2011-06-16 | Trovagene, Inc. | Compositions and methods for detecting viral specific nucleic acids in urine |
| ITRM20050068A1 (en) | 2005-02-17 | 2006-08-18 | Istituto Naz Per Le Malattie I | METHOD FOR THE DETECTION OF NUCLEIC ACIDS OF BACTERIAL OR PATENT PATOGEN AGENTS IN URINE. |
| EP1885877A2 (en) | 2005-02-17 | 2008-02-13 | Istituto Nazionale per le Malattie Infettive "Lazzaro Spallanzani" IRCCS | Compositions and methods for detecting pathogen specific nucleic acids in urine |
| US7914982B2 (en) | 2005-02-17 | 2011-03-29 | Trovagene, Inc. | Methods for detecting pathogen specific nucleic acids in urine |
| US8532930B2 (en) | 2005-11-26 | 2013-09-10 | Natera, Inc. | Method for determining the number of copies of a chromosome in the genome of a target individual using genetic data from genetically related individuals |
| EP2315850B1 (en) | 2008-07-18 | 2015-02-25 | TrovaGene, Inc. | Methods for pcr-based detection of "ultra short" nucleic acid sequences |
| US20120190663A1 (en) | 2009-08-06 | 2012-07-26 | Cedars-Sinai Medical Center | Use of free dna as an early predictor of severity in acute pancreatitis |
| DK2496720T3 (en) | 2009-11-06 | 2020-09-28 | Univ Leland Stanford Junior | NON-INVASIVE DIAGNOSIS OF TRANSPLANT REJECTION IN ORGAN-TRANSPLANTED PATIENTS |
| EP2325312A1 (en) | 2009-11-19 | 2011-05-25 | Qiagen GmbH | Method for selective enrichment and isolation of microbial and optional additionally of viral nucleic acids |
| CA2849668A1 (en) * | 2010-03-08 | 2011-09-15 | Celltrion, Inc. | Human monoclonal antibodies derived from human b cells and having neutralizing activity against influenza a viruses |
| US20120077185A1 (en) | 2010-08-06 | 2012-03-29 | Tandem Diagnostics, Inc. | Detection of genetic abnormalities and infectious disease |
| EP2694680A4 (en) | 2011-04-01 | 2014-09-10 | Occam Biolabs Inc | Methods and kits for detecting cell-free pathogen-specific nucleic acids |
| US20140179726A1 (en) * | 2011-05-19 | 2014-06-26 | Virginia Commonwealth University | Gut microflora as biomarkers for the prognosis of cirrhosis and brain dysfunction |
| CN103797486A (en) | 2011-06-06 | 2014-05-14 | 皇家飞利浦有限公司 | Method for assembly of nucleic acid sequence data |
| US20130024127A1 (en) | 2011-07-19 | 2013-01-24 | John Stuelpnagel | Determination of source contributions using binomial probability calculations |
| US20140242588A1 (en) | 2011-10-06 | 2014-08-28 | Sequenom, Inc | Methods and processes for non-invasive assessment of genetic variations |
| SG10201906331TA (en) | 2012-01-27 | 2019-08-27 | Univ Leland Stanford Junior | Methods for profiling and quantitating cell-free rna |
| US9892230B2 (en) | 2012-03-08 | 2018-02-13 | The Chinese University Of Hong Kong | Size-based analysis of fetal or tumor DNA fraction in plasma |
| WO2013138527A1 (en) | 2012-03-13 | 2013-09-19 | The Chinese University Of Hong Kong | Methods for analyzing massively parallel sequencing data for noninvasive prenatal diagnosis |
| CA2870969C (en) * | 2012-04-19 | 2023-10-03 | Aoy Tomita Mitchell | Highly sensitive surveillance using detection of cell free dna |
| EP2653562A1 (en) * | 2012-04-20 | 2013-10-23 | Institut Pasteur | Anellovirus genome quantification as a biomarker of immune suppression |
| EA201590027A1 (en) | 2012-06-15 | 2015-05-29 | Гарри Стилли | DETECTION METHODS OF DISEASES OR CONDITIONS |
| US20140066317A1 (en) | 2012-09-04 | 2014-03-06 | Guardant Health, Inc. | Systems and methods to detect rare mutations and copy number variation |
| DE202013012824U1 (en) | 2012-09-04 | 2020-03-10 | Guardant Health, Inc. | Systems for the detection of rare mutations and a copy number variation |
| DK2728014T3 (en) | 2012-10-31 | 2016-01-25 | Genesupport Sa | A non-invasive method for the detection of fetal chromosomal aneuploidy |
| US20140242582A1 (en) | 2013-02-28 | 2014-08-28 | Ariosa Diagnostics, Inc. | Detection of genetic abnormalities using ligation-based detection and digital pcr |
| WO2014145078A1 (en) | 2013-03-15 | 2014-09-18 | Verinata Health, Inc. | Generating cell-free dna libraries directly from blood |
| GB2528205B (en) | 2013-03-15 | 2020-06-03 | Guardant Health Inc | Systems and methods to detect rare mutations and copy number variation |
| EP3066236B1 (en) | 2013-11-07 | 2022-08-24 | The Board of Trustees of the Leland Stanford Junior University | Cell-free nucleic acids for the analysis of the human microbiome and components thereof |
| WO2015085105A1 (en) | 2013-12-04 | 2015-06-11 | University Of Alaska Fairbanks | Methods and compositions for enriching non-host sequences in host samples |
| US10450650B2 (en) | 2015-09-24 | 2019-10-22 | The United States of America as represented by the Admininstrator of the National Aeronautics and Space Administration | Method of manufacturing large area graphene and graphene-based photonics devices |
| JP2021002031A (en) | 2019-06-19 | 2021-01-07 | 株式会社リコー | Toner and developer |
-
2014
- 2014-11-07 EP EP14860535.5A patent/EP3066236B1/en active Active
- 2014-11-07 JP JP2016528200A patent/JP7451070B2/en active Active
- 2014-11-07 KR KR1020217001442A patent/KR102649364B1/en active Application Filing
- 2014-11-07 MX MX2016005798A patent/MX2016005798A/en unknown
- 2014-11-07 WO PCT/US2014/064669 patent/WO2015070086A1/en active Application Filing
- 2014-11-07 AU AU2014346562A patent/AU2014346562B2/en active Active
- 2014-11-07 KR KR1020167013334A patent/KR102205950B1/en active Application Filing
- 2014-11-07 CN CN202110128389.8A patent/CN112877472A/en active Pending
- 2014-11-07 US US14/536,300 patent/US10450620B2/en active Active
- 2014-11-07 CA CA3207499A patent/CA3207499A1/en active Pending
- 2014-11-07 CN CN201480068555.8A patent/CN105829589B/en active Active
- 2014-11-07 KR KR1020247008723A patent/KR20240038168A/en active Search and Examination
- 2014-11-07 GB GB1608448.5A patent/GB2535382A/en not_active Withdrawn
- 2014-11-07 EP EP22185212.2A patent/EP4130350A1/en active Pending
- 2014-11-07 CA CA2929557A patent/CA2929557C/en active Active
- 2014-11-07 BR BR112016010095A patent/BR112016010095A2/en not_active Application Discontinuation
- 2014-11-07 IL IL285106A patent/IL285106B/en unknown
-
2016
- 2016-05-03 IL IL245446A patent/IL245446B/en active IP Right Grant
- 2016-05-04 MX MX2021006897A patent/MX2021006897A/en unknown
- 2016-05-04 MX MX2020004247A patent/MX2020004247A/en unknown
- 2016-05-04 MX MX2021006893A patent/MX2021006893A/en unknown
- 2016-05-04 MX MX2021006895A patent/MX2021006895A/en unknown
-
2019
- 2019-08-28 US US16/554,286 patent/US20200017926A1/en active Pending
-
2020
- 2020-02-17 IL IL272714A patent/IL272714B/en active IP Right Grant
- 2020-10-28 IL IL278349A patent/IL278349B/en unknown
- 2020-12-03 JP JP2020200921A patent/JP2021072777A/en active Pending
-
2021
- 2021-06-14 US US17/347,247 patent/US11427876B2/en active Active
- 2021-06-14 US US17/347,180 patent/US11401562B2/en active Active
- 2021-06-14 US US17/347,138 patent/US11365453B2/en active Active
-
2023
- 2023-03-08 JP JP2023035735A patent/JP2023071944A/en active Pending
- 2023-04-20 US US18/137,350 patent/US20230349011A1/en active Pending
Also Published As
Similar Documents
| Publication | Publication Date | Title |
|---|---|---|
| US11401562B2 (en) | Cell-free nucleic acids for the analysis of the human microbiome and components thereof | |
| AU2021204489B2 (en) | Methods of monitoring immunosuppressive therapies in a transplant recipient | |
| De Vlaminck et al. | Temporal response of the human virome to immunosuppression and antiviral therapy | |
| JP2023528777A (en) | Method for detecting donor-derived cell-free DNA | |
| US20210062264A1 (en) | Use of cfdna fragments as biomarkers in patients after organ transplantation |
Legal Events
| Date | Code | Title | Description |
|---|---|---|---|
| PUAI | Public reference made under article 153(3) epc to a published international application that has entered the european phase |
Free format text: ORIGINAL CODE: 0009012 |
|
| 17P | Request for examination filed |
Effective date: 20160513 |
|
| AK | Designated contracting states |
Kind code of ref document: A1 Designated state(s): AL AT BE BG CH CY CZ DE DK EE ES FI FR GB GR HR HU IE IS IT LI LT LU LV MC MK MT NL NO PL PT RO RS SE SI SK SM TR |
|
| AX | Request for extension of the european patent |
Extension state: BA ME |
|
| DAX | Request for extension of the european patent (deleted) | ||
| A4 | Supplementary search report drawn up and despatched |
Effective date: 20170425 |
|
| RIC1 | Information provided on ipc code assigned before grant |
Ipc: C12Q 1/70 20060101ALI20170419BHEP Ipc: C40B 30/04 20060101AFI20170419BHEP Ipc: C12Q 1/68 20060101ALI20170419BHEP |
|
| STAA | Information on the status of an ep patent application or granted ep patent |
Free format text: STATUS: EXAMINATION IS IN PROGRESS |
|
| 17Q | First examination report despatched |
Effective date: 20190510 |
|
| RAP1 | Party data changed (applicant data changed or rights of an application transferred) |
Owner name: THE BOARD OF TRUSTEES OF THE LELAND STANFORD JUNIO |
|
| STAA | Information on the status of an ep patent application or granted ep patent |
Free format text: STATUS: EXAMINATION IS IN PROGRESS |
|
| STAA | Information on the status of an ep patent application or granted ep patent |
Free format text: STATUS: EXAMINATION IS IN PROGRESS |
|
| REG | Reference to a national code |
Ref country code: DE Ref legal event code: R079 Ref document number: 602014084747 Country of ref document: DE Free format text: PREVIOUS MAIN CLASS: C40B0030040000 Ipc: C12Q0001688300 |
|
| GRAP | Despatch of communication of intention to grant a patent |
Free format text: ORIGINAL CODE: EPIDOSNIGR1 |
|
| STAA | Information on the status of an ep patent application or granted ep patent |
Free format text: STATUS: GRANT OF PATENT IS INTENDED |
|
| RIC1 | Information provided on ipc code assigned before grant |
Ipc: C12Q 1/70 20060101ALI20220325BHEP Ipc: G16B 30/10 20190101ALI20220325BHEP Ipc: G16B 30/00 20190101ALI20220325BHEP Ipc: G16B 20/20 20190101ALI20220325BHEP Ipc: G16B 20/00 20190101ALI20220325BHEP Ipc: C12Q 1/689 20180101ALI20220325BHEP Ipc: C12Q 1/6883 20180101AFI20220325BHEP |
|
| INTG | Intention to grant announced |
Effective date: 20220414 |
|
| GRAS | Grant fee paid |
Free format text: ORIGINAL CODE: EPIDOSNIGR3 |
|
| GRAA | (expected) grant |
Free format text: ORIGINAL CODE: 0009210 |
|
| STAA | Information on the status of an ep patent application or granted ep patent |
Free format text: STATUS: THE PATENT HAS BEEN GRANTED |
|
| AK | Designated contracting states |
Kind code of ref document: B1 Designated state(s): AL AT BE BG CH CY CZ DE DK EE ES FI FR GB GR HR HU IE IS IT LI LT LU LV MC MK MT NL NO PL PT RO RS SE SI SK SM TR |
|
| REG | Reference to a national code |
Ref country code: CH Ref legal event code: EP |
|
| REG | Reference to a national code |
Ref country code: DE Ref legal event code: R096 Ref document number: 602014084747 Country of ref document: DE |
|
| REG | Reference to a national code |
Ref country code: IE Ref legal event code: FG4D |
|
| REG | Reference to a national code |
Ref country code: AT Ref legal event code: REF Ref document number: 1513682 Country of ref document: AT Kind code of ref document: T Effective date: 20220915 |
|
| REG | Reference to a national code |
Ref country code: LT Ref legal event code: MG9D |
|
| PG25 | Lapsed in a contracting state [announced via postgrant information from national office to epo] |
Ref country code: SE Free format text: LAPSE BECAUSE OF FAILURE TO SUBMIT A TRANSLATION OF THE DESCRIPTION OR TO PAY THE FEE WITHIN THE PRESCRIBED TIME-LIMIT Effective date: 20220824 Ref country code: RS Free format text: LAPSE BECAUSE OF FAILURE TO SUBMIT A TRANSLATION OF THE DESCRIPTION OR TO PAY THE FEE WITHIN THE PRESCRIBED TIME-LIMIT Effective date: 20220824 Ref country code: PT Free format text: LAPSE BECAUSE OF FAILURE TO SUBMIT A TRANSLATION OF THE DESCRIPTION OR TO PAY THE FEE WITHIN THE PRESCRIBED TIME-LIMIT Effective date: 20221226 Ref country code: NO Free format text: LAPSE BECAUSE OF FAILURE TO SUBMIT A TRANSLATION OF THE DESCRIPTION OR TO PAY THE FEE WITHIN THE PRESCRIBED TIME-LIMIT Effective date: 20221124 Ref country code: NL Free format text: LAPSE BECAUSE OF FAILURE TO SUBMIT A TRANSLATION OF THE DESCRIPTION OR TO PAY THE FEE WITHIN THE PRESCRIBED TIME-LIMIT Effective date: 20220824 Ref country code: LV Free format text: LAPSE BECAUSE OF FAILURE TO SUBMIT A TRANSLATION OF THE DESCRIPTION OR TO PAY THE FEE WITHIN THE PRESCRIBED TIME-LIMIT Effective date: 20220824 Ref country code: LT Free format text: LAPSE BECAUSE OF FAILURE TO SUBMIT A TRANSLATION OF THE DESCRIPTION OR TO PAY THE FEE WITHIN THE PRESCRIBED TIME-LIMIT Effective date: 20220824 Ref country code: FI Free format text: LAPSE BECAUSE OF FAILURE TO SUBMIT A TRANSLATION OF THE DESCRIPTION OR TO PAY THE FEE WITHIN THE PRESCRIBED TIME-LIMIT Effective date: 20220824 Ref country code: ES Free format text: LAPSE BECAUSE OF FAILURE TO SUBMIT A TRANSLATION OF THE DESCRIPTION OR TO PAY THE FEE WITHIN THE PRESCRIBED TIME-LIMIT Effective date: 20220824 |
|
| REG | Reference to a national code |
Ref country code: AT Ref legal event code: MK05 Ref document number: 1513682 Country of ref document: AT Kind code of ref document: T Effective date: 20220824 |
|
| PG25 | Lapsed in a contracting state [announced via postgrant information from national office to epo] |
Ref country code: PL Free format text: LAPSE BECAUSE OF FAILURE TO SUBMIT A TRANSLATION OF THE DESCRIPTION OR TO PAY THE FEE WITHIN THE PRESCRIBED TIME-LIMIT Effective date: 20220824 Ref country code: IS Free format text: LAPSE BECAUSE OF FAILURE TO SUBMIT A TRANSLATION OF THE DESCRIPTION OR TO PAY THE FEE WITHIN THE PRESCRIBED TIME-LIMIT Effective date: 20221224 Ref country code: HR Free format text: LAPSE BECAUSE OF FAILURE TO SUBMIT A TRANSLATION OF THE DESCRIPTION OR TO PAY THE FEE WITHIN THE PRESCRIBED TIME-LIMIT Effective date: 20220824 Ref country code: GR Free format text: LAPSE BECAUSE OF FAILURE TO SUBMIT A TRANSLATION OF THE DESCRIPTION OR TO PAY THE FEE WITHIN THE PRESCRIBED TIME-LIMIT Effective date: 20221125 |
|
| PG25 | Lapsed in a contracting state [announced via postgrant information from national office to epo] |
Ref country code: SM Free format text: LAPSE BECAUSE OF FAILURE TO SUBMIT A TRANSLATION OF THE DESCRIPTION OR TO PAY THE FEE WITHIN THE PRESCRIBED TIME-LIMIT Effective date: 20220824 Ref country code: RO Free format text: LAPSE BECAUSE OF FAILURE TO SUBMIT A TRANSLATION OF THE DESCRIPTION OR TO PAY THE FEE WITHIN THE PRESCRIBED TIME-LIMIT Effective date: 20220824 Ref country code: DK Free format text: LAPSE BECAUSE OF FAILURE TO SUBMIT A TRANSLATION OF THE DESCRIPTION OR TO PAY THE FEE WITHIN THE PRESCRIBED TIME-LIMIT Effective date: 20220824 Ref country code: CZ Free format text: LAPSE BECAUSE OF FAILURE TO SUBMIT A TRANSLATION OF THE DESCRIPTION OR TO PAY THE FEE WITHIN THE PRESCRIBED TIME-LIMIT Effective date: 20220824 Ref country code: AT Free format text: LAPSE BECAUSE OF FAILURE TO SUBMIT A TRANSLATION OF THE DESCRIPTION OR TO PAY THE FEE WITHIN THE PRESCRIBED TIME-LIMIT Effective date: 20220824 |
|
| REG | Reference to a national code |
Ref country code: DE Ref legal event code: R097 Ref document number: 602014084747 Country of ref document: DE |
|
| PG25 | Lapsed in a contracting state [announced via postgrant information from national office to epo] |
Ref country code: SK Free format text: LAPSE BECAUSE OF FAILURE TO SUBMIT A TRANSLATION OF THE DESCRIPTION OR TO PAY THE FEE WITHIN THE PRESCRIBED TIME-LIMIT Effective date: 20220824 Ref country code: EE Free format text: LAPSE BECAUSE OF FAILURE TO SUBMIT A TRANSLATION OF THE DESCRIPTION OR TO PAY THE FEE WITHIN THE PRESCRIBED TIME-LIMIT Effective date: 20220824 |
|
| P01 | Opt-out of the competence of the unified patent court (upc) registered |
Effective date: 20230516 |
|
| PG25 | Lapsed in a contracting state [announced via postgrant information from national office to epo] |
Ref country code: MC Free format text: LAPSE BECAUSE OF FAILURE TO SUBMIT A TRANSLATION OF THE DESCRIPTION OR TO PAY THE FEE WITHIN THE PRESCRIBED TIME-LIMIT Effective date: 20220824 Ref country code: AL Free format text: LAPSE BECAUSE OF FAILURE TO SUBMIT A TRANSLATION OF THE DESCRIPTION OR TO PAY THE FEE WITHIN THE PRESCRIBED TIME-LIMIT Effective date: 20220824 |
|
| PLBE | No opposition filed within time limit |
Free format text: ORIGINAL CODE: 0009261 |
|
| REG | Reference to a national code |
Ref country code: CH Ref legal event code: PL |
|
| STAA | Information on the status of an ep patent application or granted ep patent |
Free format text: STATUS: NO OPPOSITION FILED WITHIN TIME LIMIT |
|
| REG | Reference to a national code |
Ref country code: BE Ref legal event code: MM Effective date: 20221130 |
|
| PG25 | Lapsed in a contracting state [announced via postgrant information from national office to epo] |
Ref country code: LI Free format text: LAPSE BECAUSE OF NON-PAYMENT OF DUE FEES Effective date: 20221130 Ref country code: CH Free format text: LAPSE BECAUSE OF NON-PAYMENT OF DUE FEES Effective date: 20221130 |
|
| 26N | No opposition filed |
Effective date: 20230525 |
|
| PG25 | Lapsed in a contracting state [announced via postgrant information from national office to epo] |
Ref country code: SI Free format text: LAPSE BECAUSE OF FAILURE TO SUBMIT A TRANSLATION OF THE DESCRIPTION OR TO PAY THE FEE WITHIN THE PRESCRIBED TIME-LIMIT Effective date: 20220824 Ref country code: LU Free format text: LAPSE BECAUSE OF NON-PAYMENT OF DUE FEES Effective date: 20221107 |
|
| PG25 | Lapsed in a contracting state [announced via postgrant information from national office to epo] |
Ref country code: IE Free format text: LAPSE BECAUSE OF NON-PAYMENT OF DUE FEES Effective date: 20221107 |
|
| PG25 | Lapsed in a contracting state [announced via postgrant information from national office to epo] |
Ref country code: BE Free format text: LAPSE BECAUSE OF NON-PAYMENT OF DUE FEES Effective date: 20221130 |
|
| PGFP | Annual fee paid to national office [announced via postgrant information from national office to epo] |
Ref country code: GB Payment date: 20231019 Year of fee payment: 10 |
|
| PGFP | Annual fee paid to national office [announced via postgrant information from national office to epo] |
Ref country code: FR Payment date: 20231024 Year of fee payment: 10 Ref country code: DE Payment date: 20231017 Year of fee payment: 10 |
|
| PG25 | Lapsed in a contracting state [announced via postgrant information from national office to epo] |
Ref country code: HU Free format text: LAPSE BECAUSE OF FAILURE TO SUBMIT A TRANSLATION OF THE DESCRIPTION OR TO PAY THE FEE WITHIN THE PRESCRIBED TIME-LIMIT; INVALID AB INITIO Effective date: 20141107 |