EP3049535B1 - Verfahren zur schätzung des alters von geweben und zelltypen auf basis epigenetischer marker - Google Patents
Verfahren zur schätzung des alters von geweben und zelltypen auf basis epigenetischer marker Download PDFInfo
- Publication number
- EP3049535B1 EP3049535B1 EP14789914.0A EP14789914A EP3049535B1 EP 3049535 B1 EP3049535 B1 EP 3049535B1 EP 14789914 A EP14789914 A EP 14789914A EP 3049535 B1 EP3049535 B1 EP 3049535B1
- Authority
- EP
- European Patent Office
- Prior art keywords
- age
- methylation
- tissue
- markers
- data
- Prior art date
- Legal status (The legal status is an assumption and is not a legal conclusion. Google has not performed a legal analysis and makes no representation as to the accuracy of the status listed.)
- Active
Links
Images


Classifications
-
- C—CHEMISTRY; METALLURGY
- C12—BIOCHEMISTRY; BEER; SPIRITS; WINE; VINEGAR; MICROBIOLOGY; ENZYMOLOGY; MUTATION OR GENETIC ENGINEERING
- C12Q—MEASURING OR TESTING PROCESSES INVOLVING ENZYMES, NUCLEIC ACIDS OR MICROORGANISMS; COMPOSITIONS OR TEST PAPERS THEREFOR; PROCESSES OF PREPARING SUCH COMPOSITIONS; CONDITION-RESPONSIVE CONTROL IN MICROBIOLOGICAL OR ENZYMOLOGICAL PROCESSES
- C12Q1/00—Measuring or testing processes involving enzymes, nucleic acids or microorganisms; Compositions therefor; Processes of preparing such compositions
- C12Q1/68—Measuring or testing processes involving enzymes, nucleic acids or microorganisms; Compositions therefor; Processes of preparing such compositions involving nucleic acids
- C12Q1/6876—Nucleic acid products used in the analysis of nucleic acids, e.g. primers or probes
-
- C—CHEMISTRY; METALLURGY
- C12—BIOCHEMISTRY; BEER; SPIRITS; WINE; VINEGAR; MICROBIOLOGY; ENZYMOLOGY; MUTATION OR GENETIC ENGINEERING
- C12Q—MEASURING OR TESTING PROCESSES INVOLVING ENZYMES, NUCLEIC ACIDS OR MICROORGANISMS; COMPOSITIONS OR TEST PAPERS THEREFOR; PROCESSES OF PREPARING SUCH COMPOSITIONS; CONDITION-RESPONSIVE CONTROL IN MICROBIOLOGICAL OR ENZYMOLOGICAL PROCESSES
- C12Q2600/00—Oligonucleotides characterized by their use
- C12Q2600/154—Methylation markers
-
- G—PHYSICS
- G01—MEASURING; TESTING
- G01N—INVESTIGATING OR ANALYSING MATERIALS BY DETERMINING THEIR CHEMICAL OR PHYSICAL PROPERTIES
- G01N2440/00—Post-translational modifications [PTMs] in chemical analysis of biological material
- G01N2440/12—Post-translational modifications [PTMs] in chemical analysis of biological material alkylation, e.g. methylation, (iso-)prenylation, farnesylation
-
- G—PHYSICS
- G01—MEASURING; TESTING
- G01N—INVESTIGATING OR ANALYSING MATERIALS BY DETERMINING THEIR CHEMICAL OR PHYSICAL PROPERTIES
- G01N2800/00—Detection or diagnosis of diseases
- G01N2800/10—Musculoskeletal or connective tissue disorders
- G01N2800/105—Osteoarthritis, e.g. cartilage alteration, hypertrophy of bone
Definitions
- DNA methylation patterns have been found to change with increasing age and contribute to age-related diseases. Methylation in promoter regions is generally accompanied by gene silencing and loss of methylation or loss of the proteins that bind to certain methylated cytosine DNA nucleotides. This can lead to diseases in humans, for example, Immunodeficiency Craniofacial Syndrome and Rett Syndrome (see, e.g. Bestor (2000) Hum. Mol. Genet. 9:2395-2402 ). DNA methylation may be gene-specific or occur genome-wide.
- CpG Cytosine-phosphate-Guanine
- DNAm DNA methylation
- Age-related DNA hypomethylation has long been observed in a variety of species including salmon [3], rats [4], and mice [5]. More recent studies have shown that many CpGs are subject to age-related hypermethylation or hypomethylation [6-14]. Previous studies have shown that age-related hypermethylation occurs preferentially at CpG islands [8], at bivalent chromatin domain promoters that are associated with key developmental genes [15], and at Polycomb-group protein targets [10].
- the epigenomic landscape varies markedly across tissue types [16-18] and many age-related changes depend on tissue type [8, 19]. Some studies have suggested that age-dependent CpG signatures may be defined independently of sex, tissue type, disease state, and array platform [10, 13-15, 20-22].
- a method for estimating the chronological and/or biological age of an individual's tissue or cell sample by measuring the methylation of specific DNA Cytosine-phosphate-Guanine (CpG) methylation markers attached to the individual's DNA is provided.
- the present invention provides a method for determining an age of a biological sample, the method comprising: selectively measuring the methylation levels of a set of methylation markers in genomic DNA of the biological sample, said set of methylation markers comprising the 6 CpG methylation markers in Table 7; and comparing the measured methylation marker levels to reference levels for the methylation markers to determine the age of the sample based on said methylation levels.
- the measured methylation levels are transformed.
- the method comprises forming a linear combination of a predetermined set of CpG methylation markers (or optionally, forming a linear combination of the transformed methylation levels), which is then transformed to an age estimate using a calibration function.
- the linear combination of the CpGs referred to as “clock CpGs” (or of the transformed methylation levels), can be interpreted as an epigenetic clock.
- the resulting predicted age is referred to as the "DNA methylation (DNAm) age”.
- the age is estimated based on a set of 354 CpG methylation markers (see Table 3 below).
- the age is estimated based on a set of 110, 38, 17 or 6 CpG methylation markers (see Tables 4, 5, 6, and 7, respectively).
- the sets of 110, 38, 17, and 6 CpGs are subsets of methylation markers taken from the set of 354 CpG methylation markers shown in Table 3.
- a multi-tissue age predictor is also provided that uses a set of CpG methylation markers for estimating age.
- An advantage of the multi-tissue age predictor lies in its wide applicability: for most tissues it does not require any adjustments or offsets.
- the invention allows for the comparison of the ages of different parts of the human body.
- the multi-tissue age predictor and CpG methylation markers allow for easily accessible tissues (e.g. blood, saliva, buccal cells, epidermis) to be used to measure age in inaccessible tissues (e.g. brain, kidney, liver).
- the methods disclosed herein can be used to estimate the age of inaccessible human brain tissue by measuring the age of more accessible tissues such as blood, saliva, skin or adipose tissue.
- the sample comprises tissue culture cells or pluripotent stem cells (e.g. induced pluripotent stem (iPS) cells).
- pluripotent stem cells e.g. induced pluripotent stem (iPS) cells.
- a method of the embodiments can be used to determine the passage number or amount of time in culture for a population of tissue culture cells.
- a method of the disclosure can be used to assess the differentiation status (or the pluripotency) of a population of cells comprising pluripotent stem cells (e.g. iPS cells).
- a method comprising a first step of extracting genomic DNA from a sample.
- the DNAm levels at multiple loci in the genome are measured. In specific instances, this results in thousands of quantitative measurements per sample. Each measurement measures the extent of methylation at a particular genomic location (CpG). The more CpGs measured allows for normalization of the data, though in certain embodiments, the DNAm levels of only 354, 110, 38, 17 or 6 CpG methylation markers are measured (see, Table 3-7 respectively).
- a third step comprises calculating the (weighted) average of the (optionally, transformed) DNAm levels across the measured CpGs. In certain instances, the result is a real number that lies between -4 and 4.
- each CpG is multiplied by a coefficient value (of a regression model) and the individual products are summed up.
- the weighted average is transformed to a new scale, such as a number that measures DNAm age in years. In this instance, age zero corresponds to age at birth and a prenatal sample results in a negative age. A monotonic, non-linear transformation is used.
- the method may further comprise an additional step after the second step, wherein the measurements are normalized/transformed such that the two peaks of their frequency distribution are located at the same two locations as that of a gold standard measurement.
- the result is the same as that of the second step but the values are slightly changed.
- the peaks of the frequency distribution correspond to values for completely methylated or un-methylated CpGs, respectively.
- This normalization step is possible because most CpGs are either perfectly methylated or un-methylated.
- the gold standard is based on the average DNAm value across 715 blood samples.
- the present invention can be used to study the effects of medication, food compounds and/or special diets on the biological age of humans or chimpanzees (which may serve as model organisms since DNAm age is also applicable to chimpanzee tissues). Since DNA methylation patterns change with increasing age and contribute to age-related diseases, the CpGs can be used as biomarkers of chronological age (e.g. for forensic applications).
- the invention can also be used for determining and/or increasing an individual's likelihood of longevity, in particular, by determining and decreasing an individual's likelihood of developing an age-related disease (e.g. cancer). This is accomplished, for example, by diagnosing and determining the existence or likelihood of disease (e.g. cancer) or providing an assay for identifying a compound which counters the age-related increase or decrease of methylation in the CpG markers disclosed herein.
- a method for determining age of a biological sample comprising selectively measuring the methylation levels of a set of methylation markers in genomic DNA of the biological sample, said set of methylation markers comprising markers in least 6 of the genes listed in Table 3 (SEQ ID NO: 1-354) and determining the age of the sample based on said methylation levels.
- the set of methylation markers may comprise markers in at least or at most 6, 7, 8, 9, 10, 15, 20, 25, 30, 35, 40, 45, 50, 55, 60, 65, 70, 75, 80, 85, 90, 95, 100, 105, 110, 115, 120, 125, 130, 135, 140, 145, 150, 155, 160, 165, 170, 175, 180, 185, 190, 195, 200, 205, 210, 215, 220, 225, 230, 235, 240, 245, 250, 255, 260, 265, 270, 275, 280, 285, 290, 295, 300, 305, 310, 315, 320, 325, 330, 335, 340, 345, 350, or 354 of the genes listed in Table 3.
- the set of methylation markers may comprise markers in at least or at most 6, 7, 8, 9, 10, 15, 20, 25, 30, 35, 40, 45, 50, 55, 60, 65, 70, 75, 80, 85, 90, 95, 100, 105, 110, 115, 120, 125, 130, 135, 140, 145, 150, 155, 160, 165, 170, 175, 180, 185, 190, 195, 200, 205, 210, 215, 220, 225, 230, 235, 240, 245, 250, 255, 260, 265, 270, 275, 280, 285, 290, 295, 300, 305, 310, 315, 320, 325, 330, 335, 340, 345, 350, or 354 of the CpG positions listed in Table 3.
- a method of the disclosure comprises selectively measuring the methylation levels of a set of methylation markers in genomic DNA of the biological sample, said set of methylation markers comprising markers in least 6 of the genes listed in Table 4 and determining the age of the sample based on said methylation levels.
- the set of methylation markers may comprise markers in at least or at most 6, 7, 8, 9, 10, 15, 20, 25, 30, 35, 40, 45, 50, 55, 60, 65, 70, 75, 80, 85, 90, 95, 100, 105 or 110 of the genes listed in Table 4.
- the set of methylation markers may comprise markers in at least or at most 6, 7, 8, 9, 10, 15, 20, 25, 30, 35, 40, 45, 50, 55, 60, 65, 70, 75, 80, 85, 90, 95, 100, 105 or 110 of the CpG positions listed in Table 4.
- a method of the disclosure comprises selectively measuring the methylation levels of a set of methylation markers in genomic DNA of the biological sample, said set of methylation markers comprising markers in least 3 of the genes listed in Table 5 and determining the age of the sample based on said methylation levels.
- the set of methylation markers may comprise markers in at least or at most 3, 4, 5, 6, 7, 8, 9, 10, 11, 12, 13, 14, 15, 16, 17, 18, 19, 20, 21, 22, 23, 24, 25, 26, 27, 28, 29, 30, 31, 32, 33, 34, 35, 36, 37 or 38 of the genes listed in Table 5.
- the set of methylation markers may comprise markers in at least or at most 3, 4, 5, 6, 7, 8, 9, 10, 11, 12, 13, 14, 15, 16, 17, 18, 19, 20, 21, 22, 23, 24, 25, 26, 27, 28, 29, 30, 31, 32, 33, 34, 35, 36, 37 or 38 of the CpG positions listed in Table 5.
- a method of the disclosure comprises selectively measuring the methylation levels of a set of methylation markers in genomic DNA of the biological sample, said set of methylation markers comprising markers in least 3 of the genes listed in Table 6 and determining the age of the sample based on said methylation levels.
- the set of methylation markers may comprise markers in at least or at most 3, 4, 5, 6, 7, 8, 9, 10, 11, 12, 13, 14, 15, 16 or 17 of the genes listed in Table 6.
- the set of methylation markers may comprise markers in at least or at most 3, 4, 5, 6, 7, 8, 9, 10, 11, 12, 13, 14, 15, 16 or 17 of the CpG positions listed in Table 6.
- a method of the disclosure comprises selectively measuring the methylation levels of a set of methylation markers in genomic DNA of the biological sample, said set of methylation markers comprising markers in least 2 of the genes listed in Table 7 and determining the age of the sample based on said methylation levels.
- the set of methylation markers may comprise markers in at least or at most 2, 3, 4, 5 or 6 of the genes listed in Table 7.
- the set of methylation markers may comprise markers in at least or at most 2, 3, 4, 5 or 6 of the CpG positions listed in Table 7.
- the biological sample is a solid tissue, blood, urine, fecal or saliva sample that comprises genomic DNA.
- the biological sample is a blood sample.
- selectively measuring the methylation levels of a set of methylation markers in genomic DNA further comprises transforming the measured methylation marker levels.
- determining the age of the biological sample comprises applying a statistical prediction algorithm to the measured methylation marker levels (or the transformed methylation marker levels).
- applying a statistical prediction algorithm comprises (a) obtaining a linear combination of the methylation marker levels (or the transformed methylation marker levels), and (b) applying a transformation to the linear combination to determine the age of the biological sample.
- obtaining a linear combination of the methylation marker levels can comprise obtaining weighted average of the methylation marker levels (or a weighted average of the transformed methylation marker levels).
- applying a transformation to the linear combination comprises applying a logarithmic and/or linear transformation to the linear combination.
- determining the age of the biological sample comprises applying a linear regression model to predict sample age based on a weighted average of the methylation marker levels plus an offset.
- the set of methylation markers for use accordingly to the embodiments may comprise methylation markers in all of the gene or at all of the CpG positions of Table 3, Table 4, Table 5, Table 6 or Table 7.
- the set of methylation markers may comprise markers in or near the NHLRC1 (SEQ ID NO: 357), GREM1 (SEQ ID NO: 356), SCGN (SEQ ID NO: 358) or EDARADD (SEQ ID NO: 355) genes.
- probes cg22736354 (SEQ ID NO: 158) near gene NHLRC1, cg21296230 near gene GREM1 (SEQ ID NO: 354), cg06493994 (SEQ ID NO: 46) near gene SCGN, and/or cg09809672 (SEQ ID NO: 252) near gene EDARADD are used.
- the age of an individual is determined based on the age of the biological sample.
- the age of individual can be determined by determining the age of biological sample from a peripheral tissue sample (e.g., a blood or saliva sample) from the individual.
- a method may further comprise, for instance, reporting the age of the sample or of the individual, e.g., by preparing a written, oral or electronic report.
- a tangible computer-readable medium comprising computer-readable code that, when executed by a computer, causes the computer to perform operations comprising receiving information corresponding to methylation levels of a set of methylation markers in a biological sample, said markers comprising markers in at least 2 of the genes listed in Table 3, Table 4, Table 5, Table 6 or Table 7 and determining the age of the biological sample by applying a statistical prediction algorithm to the measured methylation marker levels.
- the set of methylation markers may comprise markers in at least, or at most, 3, 4, 5, 6, 7, 8, 9, 10, 11, 12, 13, 14, 15, 16, 17, 18, 19, 20, 21, 22, 23, 24, 25, 26, 27, 28, 29, 30, 31, 32, 33, 34, 35, 36, 37, 38, 39, 40, 45, 50, 55, 60, 65, 70, 75, 80, 85, 90, 95, 100, 105, 110, 115, 120, 125, 130, 135, 140, 145, 150, 155, 160, 165, 170, 175, 180, 185, 190, 195, 200, 205, 210, 215, 220, 225, 230, 235, 240, 245, 250, 255, 260, 265, 270, 275, 280, 285, 290, 295, 300, 305, 310, 315, 320, 325, 330, 335, 340, 345, 350, or 354 of the genes listed in Table 3, Table 4, Table 5, Table 6 or Table 7.
- the set of methylation markers may comprise markers at least, or at most, 3, 4, 5, 6, 7, 8, 9, 10, 11, 12, 13, 14, 15, 16, 17, 18, 19, 20, 21, 22, 23, 24, 25, 26, 27, 28, 29, 30, 31, 32, 33, 34, 35, 36, 37, 38, 39, 40, 45, 50, 55, 60, 65, 70, 75, 80, 85, 90, 95, 100, 105, 110, 115, 120, 125, 130, 135, 140, 145, 150, 155, 160, 165, 170, 175, 180, 185, 190, 195, 200, 205, 210, 215, 220, 225, 230, 235, 240, 245, 250, 255, 260, 265, 270, 275, 280, 285, 290, 295, 300, 305, 310, 315, 320, 325, 330, 335, 340, 345, 350, or 354 of the CpG positions listed in Table 3, Table 4, Table 5, Table 6 or Table 7.
- the invention provides a tangible computer-readable medium comprising computer-readable code that, when executed by a computer, causes the computer to perform operations comprising: a) receiving information corresponding to methylation levels of a set of methylation markers in a biological sample, said markers comprising the 6 CpG methylation markers in Table 7; and b) determining the age of the biological sample by comparing the measured methylation marker levels to reference marker levels and by applying a statistical prediction algorithm to the measured methylation marker levels.
- determining the age of the biological sample further comprises comparing the measured methylation marker levels to reference marker levels.
- the reference levels may, optionally, be stored in said tangible computer-readable medium.
- determining the age of the biological sample may comprise applying a linear regression model to predict sample age based on a weighted average of the methylation marker levels plus an offset.
- the receiving information may comprise receiving from a tangible data storage device information corresponding to the methylation levels of the set of methylation markers in the biological sample.
- the receiving information may further comprise receiving information corresponding to methylation levels of a set of methylation markers in a biological sample, said markers comprising markers in at least, or at most, 3, 4, 5, 6, 7, 8, 9, 10, 11, 12, 13, 14, 15, 16, 17, 18, 19, 20, 21, 22, 23, 24, 25, 26, 27, 28, 29, 30, 31, 32, 33, 34, 35, 36, 37, 38, 39, 40, 45, 50, 55, 60, 65, 70, 75, 80, 85, 90, 95, 100, 105, 110, 115, 120, 125, 130, 135, 140, 145, 150, 155, 160, 165, 170, 175, 180, 185, 190, 195, 200, 205, 210, 215, 220, 225, 230, 235, 240, 245, 250, 255, 260, 265, 270, 275, 280, 285,
- tangible computer-readable medium may comprise computer-readable code that, when executed by a computer, causes the computer to perform one or more additional operations comprising: sending information corresponding to the methylation levels of the set of methylation markers in the biological sample to a tangible data storage device.
- measuring methylation marker comprises, performing methylation specific PCR (MSP), real-time methylation specific PCR, methylation-sensitive single-strand conformation analysis (MS-SSCA), quantitative methylation specific PCR (QMSP), PCR using a methylated DNA-specific binding protein, high resolution melting analysis (HRM), methylation-sensitive single-nucleotide primer extension (MS-SnuPE), base-specific cleavage/MALDI-TOF, PCR, real-time PCR, Combined Bisulfite Restriction Analysis (COBRA), methylated DNA immunoprecipitation (MeDIP), a microarray-based method, pyrosequencing, or bisulfite sequencing.
- MSP methylation specific PCR
- MS-SSCA methylation-sensitive single-strand conformation analysis
- QMSP quantitative methylation specific PCR
- PCR using a methylated DNA-specific binding protein
- HRM high resolution melting analysis
- MS-SnuPE methylation-sensitive single
- measuring a methylation marker can comprise performing array-based PCR (e.g., digital PCR), targeted multiplex PCR, or direct sequencing without bisulfite treatment (e.g., via a nanopore technology).
- determining methylation status comprises methylation specific PCR, real-time methylation specific PCR, quantitative methylation specific PCR (QMSP), or bisulfite sequencing.
- a method according to the embodiments comprises treating DNA in or from a sample with bisulfite (e.g., sodium bisulfite) to convert unmethylated cytosines of CpG dinucleotides to uracil.
- bisulfite e.g., sodium bisulfite
- epigenetic means relating to, being, or involving a modification in gene expression that is independent of DNA sequence.
- Epigenetic factors include modifications in gene expression that are controlled by changes in DNA methylation and chromatin structure. For example, methylation patterns are known to correlate with gene expression.
- nucleic acids may include any polymer or oligomer of pyrimidine and purine bases, preferably cytosine, thymine, and uracil, and adenine and guanine, respectively.
- the present invention contemplates any deoxyribonucleotide, ribonucleotide or peptide nucleic acid component, and any chemical variants thereof, such as methylated, hydroxymethylated or glucosylated forms of these bases, and the like.
- the polymers or oligomers may be heterogeneous or homogeneous in composition, and may be isolated from naturally-occurring sources or may be artificially or synthetically produced.
- the nucleic acids may be DNA or RNA, or a mixture thereof, and may exist permanently or transitionally in single-stranded or double-stranded form, including homoduplex, heteroduplex, and hybrid states.
- oligonucleotide and “polynucleotide” as used herein refers to a nucleic acid ranging from at least 2, preferable at least 8, and more preferably at least 20 nucleotides in length or a compound that specifically hybridizes to a polynucleotide.
- Polynucleotides of the present invention include sequences of deoxyribonucleic acid (DNA) or ribonucleic acid (RNA) which may be isolated from natural sources, recombinantly produced or artificially synthesized and mimetics thereof.
- methylation marker refers to a CpG position that is potentially methylated. Methylation typically occurs in a CpG containing nucleic acid.
- the CpG containing nucleic acid may be present in, e.g., in a CpG island, a CpG doublet, a promoter, an intron, or an exon of gene.
- the potential methylation sites encompass the promoter/enhancer regions of the indicated genes. Thus, the regions can begin upstream of a gene promoter and extend downstream into the transcribed region.
- genomic or “genomic” as used herein is all the genetic material in the chromosomes of an organism. DNA derived from the genetic material in the chromosomes of a particular organism is genomic DNA.
- gene refers to a region of genomic DNA associated with a given gene.
- the region can be defined by a particular gene (such as protein coding sequence exons, intervening introns and associated expression control sequences) and its flanking sequence. It is, however, recognized in the art that methylation in a particular region is generally indicative of the methylation status at proximal genomic sites.
- determining a methylation status of a gene region can comprise determining a methylation status of a methylation marker within or flanking about 10 bp to 50 bp, about 50 to 100 bp, about 100 bp to 200 bp, about 200 bp to 300 bp, about 300 to 400 bp, about 400 bp to 500 bp, about 500 bp to 600 bp, about 600 to 700 bp, about 700 bp to 800 bp, about 800 to 900 bp, 900 bp to 1kb, about 1 kb to 2 kb, about 2 kb to 5 kb, or more of a named gene, or CpG position.
- methylation markers or genes comprising such markers can refer to measuring no more than 1,000, 900, 800, 700, 600, 500, 400 or 354 different methylation markers or genes comprising methylation markers.
- probes are oligonucleotides capable of binding in a base-specific manner to a complementary strand of nucleic acid.
- probe refers to a surface-immobilized molecule that can be recognized by a particular target as well as molecules that are not immobilized and are coupled to a detectable label.
- label refers, for example, to colorimetric (e.g. luminescent) labels, light scattering labels or radioactive labels.
- Fluorescent labels include, inter alia, the commercially available fluorescein phosphoramidites such as Fluoreprime TM (Pharmacia TM ), Fluoredite TM (Millipore TM ) and FAM TM (ABI TM ) (see, e.g. U.S. Patent Nos. 6,287,778 and 6,582,908 ).
- primer refers to a single-stranded oligonucleotide capable of acting as a point of initiation for template-directed DNA synthesis under suitable conditions for example, buffer and temperature, in the presence of four different nucleoside triphosphates and an agent for polymerization, such as, for example, DNA or RNA polymerase or reverse transcriptase.
- the length of the primer in any given case, depends on, for example, the intended use of the primer, and generally ranges from 15 to 30 nucleotides.
- a primer need not reflect the exact sequence of the template but must be sufficiently complementary to hybridize with such template.
- the primer site is the area of the template to which a primer hybridizes.
- the primer pair is a set of primers including a 5' upstream primer that hybridizes with the 5' end of the sequence to be amplified and a 3' downstream primer that hybridizes with the complement of the 3' end of the sequence to be amplified.
- complementary refers to the hybridization or base pairing between nucleotides or nucleic acids, such as, for instance, between the two strands of a double stranded DNA molecule or between an oligonucleotide primer and a primer binding site on a single stranded nucleic acid to be sequenced or amplified.
- Complementary nucleotides are, generally, A and T (or A and U), or C and G.
- Two single stranded RNA or DNA molecules are said to be complementary when the nucleotides of one strand, optimally aligned and compared and with appropriate nucleotide insertions or deletions, pair with at least about 80% of the nucleotides of the other strand, usually at least about 90% to 95%, and more preferably from about 98 to 100%.
- complementarity exists when an RNA or DNA strand will hybridize under selective hybridization conditions to its complement.
- selective hybridization will occur when there is at least about 65% complementary over a stretch of at least 14 to 25 nucleotides, preferably at least about 75%, more preferably at least about 90% complementary. See, M. Kanehisa, Nucleic Acids Res. 12:203 (1984).
- hybridization refers to the process in which two single-stranded polynucleotides bind non-covalently to form a stable double-stranded polynucleotide; triple-stranded hybridization is also theoretically possible.
- Factors that can affect the stringency of hybridization including base composition and length of the complementary strands, presence of organic solvents and extent of base mismatching, the combination of parameters is more important than the absolute measure of any one alone.
- Hybridization conditions suitable for microarrays are described in the Gene Expression Technical Manual, 2004 and the GeneChip Mapping Assay Manual, 2004 , available at Affymetrix.com.
- array refers to an intentionally created collection of molecules which can be prepared either synthetically or biosynthetically (e.g. Illumina TM HumanMethylation27 microarrays).
- the molecules in the array can be identical or different from each other.
- the array can assume a variety of formats, for example, libraries of soluble molecules; libraries of compounds tethered to resin beads, silica chips, or other solid supports.
- solid support refers to a material or group of materials having a rigid or semi-rigid surface or surfaces.
- at least one surface of the solid support will be substantially flat, although in some embodiments it may be desirable to physically separate synthesis regions for different compounds with, for example, wells, raised regions, pins, etched trenches, or the like.
- the solid support(s) will take the form of beads, resins, gels, microspheres, or other geometric configurations. See U.S. Pat. No. 5,744,305 for exemplary substrates.
- the present invention allows for accurate estimations of the individual's chronological age. While previous studies have shown that DNA methylation in certain parts of the genome changes with age, the present invention identifies loci where methylation is continuously correlated with age, over a range of at least 5 decades. This allows for a highly accurate prediction of an individual's age.
- the link between age and this chemical change in the DNA is so strong that it is possible to estimate the age of an individual by examining, for example, just two spots in the genome of the individual (see Bockland et al., et al. (2011) PLoS ONE 6(6): e14821. doi:10.1371/journal.pone.0014821 ).
- certain aspects of this invention have been confirmed by other studies (see, e.g. Koch et al., (2011) AGING, Vol. 3, No 10, pp 1,018-1,027 ).
- a related publication is United States Application Publication No. 2014/0228231, filed by Eric Vilain et al.
- the present invention relates to methods for estimating the chronological and/or biological age of an individual human tissue or cell type sample based on measuring DNA Cytosine-phosphate-Guanine (CpG) methylation markers that are attached to our DNA.
- a method comprising a first step of choosing a biological cell or tissue sample (e.g. whole blood, individual blood cells, saliva, brain).
- genomic DNA is extracted from the collected tissue of the individual for whom an age prediction is desired.
- the methylation levels of the methylation markers near the specific clock CpGs are measured.
- a statistical prediction algorithm is applied to the methylation levels to predict the biological or chronological age.
- One basic approach is to form a weighted average of the clock CpGs, which is then transformed to DNAm age using a calibration function.
- One embodiment focuses on forming a linear combination of 354 CpGs (Table 3, SEQ ID NO: 1-354), which is then transformed to an age estimate using a calibration function.
- the weighted average of the degree of cytosine methylation at these 354 locations is significantly correlated with age, including but not limited to, human brain tissue (frontal cortex, temporal cortex, PONS), blood tissue (whole blood, cord blood and blood cells), liver, adipose, skin, kidney, prostate, muscle, and saliva tissue.
- the linear combination of the 354 CpGs (which are referred to as clock CpGs) can be interpreted as an epigenetic clock.
- the resulting predicted age is referred to as DNA methylation (DNAm) age.
- a linear combination of 110, 38, 15 or 6 CpGs are used (Tables 4-7 respectively), which are subsets of the 354 CpGs. In specific instances, these subsets or sub-clocks were determined by increasing the threshold of the penalty term in a penalized regression model.
- these sequences can include either translated or untranslated 5' regulatory regions; and optionally are within 1 kilobase (5' or 3') of the specific GC loci that are identified herein.
- a method for determining age of a biological sample comprising selectively measuring the methylation levels of a set of methylation markers in genomic DNA of the biological sample, said set of methylation markers comprising markers in least 6 of the genes listed in Table 3 and determining the age of the sample based on said methylation levels.
- the set of methylation markers may comprise markers in at least or at most 6, 7, 8, 9, 10, 15, 20, 25, 30, 35, 40, 45, 50, 55, 60, 65, 70, 75, 80, 85, 90, 95, 100, 105, 110, 115, 120, 125, 130, 135, 140, 145, 150, 155, 160, 165, 170, 175, 180, 185, 190, 195, 200, 205, 210, 215, 220, 225, 230, 235, 240, 245, 250, 255, 260, 265, 270, 275, 280, 285, 290, 295, 300, 305, 310, 315, 320, 325, 330, 335, 340, 345, 350, or 354 of the genes listed in Table 3.
- the set of methylation markers may comprise markers in at least or at most 6, 7, 8, 9, 10, 15, 20, 25, 30, 35, 40, 45, 50, 55, 60, 65, 70, 75, 80, 85, 90, 95, 100, 105, 110, 115, 120, 125, 130, 135, 140, 145, 150, 155, 160, 165, 170, 175, 180, 185, 190, 195, 200, 205, 210, 215, 220, 225, 230, 235, 240, 245, 250, 255, 260, 265, 270, 275, 280, 285, 290, 295, 300, 305, 310, 315, 320, 325, 330, 335, 340, 345, 350, or 354 of the CpG positions listed in Table 3.
- a method comprises selectively measuring the methylation levels of a set of methylation markers in genomic DNA of the biological sample, said set of methylation markers comprising markers in least 6 of the genes listed in Table 4 and determining the age of the sample based on said methylation levels.
- the set of methylation markers may comprise markers in at least or at most 6, 7, 8, 9, 10, 15, 20, 25, 30, 35, 40, 45, 50, 55, 60, 65, 70, 75, 80, 85, 90, 95, 100, 105 or 110 of the genes listed in Table 4.
- the set of methylation markers may comprise markers in at least or at most 6, 7, 8, 9, 10, 15, 20, 25, 30, 35, 40, 45, 50, 55, 60, 65, 70, 75, 80, 85, 90, 95, 100, 105 or 110 of the CpG positions listed in Table 4.
- a method of the disclosure comprises selectively measuring the methylation levels of a set of methylation markers in genomic DNA of the biological sample, said set of methylation markers comprising markers in least 3 of the genes listed in Table 5 and determining the age of the sample based on said methylation levels.
- the set of methylation markers may comprise markers in at least or at most 3, 4, 5, 6, 7, 8, 9, 10, 11, 12, 13, 14, 15, 16, 17, 18, 19, 20, 21, 22, 23, 24, 25, 26, 27, 28, 29, 30, 31, 32, 33, 34, 35, 36, 37 or 38 of the genes listed in Table 5.
- the set of methylation markers may comprise markers in at least or at most 3, 4, 5, 6, 7, 8, 9, 10, 11, 12, 13, 14, 15, 16, 17, 18, 19, 20, 21, 22, 23, 24, 25, 26, 27, 28, 29, 30, 31, 32, 33, 34, 35, 36, 37 or 38 of the CpG positions listed in Table 5.
- a method of the disclosure comprises selectively measuring the methylation levels of a set of methylation markers in genomic DNA of the biological sample, said set of methylation markers comprising markers in least 3 of the genes listed in Table 6 and determining the age of the sample based on said methylation levels.
- the set of methylation markers may comprise markers in at least or at most 3, 4, 5, 6, 7, 8, 9, 10, 11, 12, 13, 14, 15, 16 or 17 of the genes listed in Table 6.
- the set of methylation markers may comprise markers in at least or at most 3, 4, 5, 6, 7, 8, 9, 10, 11, 12, 13, 14, 15, 16 or 17 of the CpG positions listed in Table 6.
- a method of the disclosure comprises selectively measuring the methylation levels of a set of methylation markers in genomic DNA of the biological sample, said set of methylation markers comprising markers in least 2 of the genes listed in Table 7 and determining the age of the sample based on said methylation levels.
- the set of methylation markers may comprise markers in at least or at most 2, 3, 4, 5 or 6 of the genes listed in Table 7.
- the set of methylation markers may comprise markers in at least or at most 2, 3, 4, 5 or 6 of the CpG positions listed in Table 7.
- a set of four methylation markers are disclosed that continuously relate to age in human blood, brain tissue, and saliva.
- DNA methylation markers near the following genes: NHLRC1, GREM1, SCGN have highly significant positive correlations with age in multiple human tissues.
- Methylation markers near gene EDARADD have a highly significant negative correlation with age in multiple tissues.
- the methylation markers comprise of probes cg22736354 (SEQ ID NO: 158) near gene NHLRC1, cg21296230 near gene GREM1 (SEQ ID NO: 354), cg06493994 (SEQ ID NO: 46) near gene SCGN, and cg09809672 (SEQ ID NO: 252) near gene EDARADD.
- Methods for estimating age involve one to four of these markers.
- biological cell or tissue sample is collected from an individual.
- Genomic DNA is extracted from the collected tissue and the methylation level of the methylation markers near at least one of the NHLRC1 (SEQ ID NO: 357), GREM1 (SEQ ID NO: 356), SCGN (SEQ ID NO: 358), and EDARADD (SEQ ID NO: 355) genes are measured.
- a statistical prediction algorithm is applied to the measured methylation levels to determine the biological or chronological age of the individual.
- Embodiments of the invention include methods where observations of cytosine methylation in genomic DNA from a biological sample are used to predict the chronological age of the individual from which a sample is derived. Other embodiments of these methods comprise calculating a theoretical biological age (bio-age) of the individual based on the degree/amount of cytosine methylation observed in the sequence and then comparing the theoretical bio-age of the individual to an actual chronological age of the individual. In this way, information useful to determine a level of risk of an age-related disease in the individual is obtained.
- the theoretical bio-age of the individual is compared to an actual chronological age to determine if the theoretical bio-age is greater than the actual chronological age; and the method further includes providing an individualized treatment to the individual to bring the theoretical bio-age closer to the actual chronological age of the individual.
- DNAm age is a valuable biomarker for studying human development, aging, and cancer and can be used as a surrogate marker for evaluating rejuvenation therapies.
- the most salient feature of DNAm age is its applicability to a broad spectrum of tissues and cell types.
- DNAm age has been found to accurately predict age in various sources of DNA, including: adipose tissue/fat, blood (whole blood, cord blood, blood cells, peripheral blood mononuclear cells, B cells, T cells, monocytes), brain tissue (frontal cortex, temporal cortex, PONS), breast, buccal cells/epithelium, cartilage, cerebellum, colon, cortex (pre-frontal-, frontal-, occipital-, temporal cortex), epidermis, fibroblasts (e.g.
- DNAm age of easily accessible fluids/tissues can serve as a surrogate marker for inaccessible tissues (e.g. brain, kidney, liver). Further, DNAm age can be used to compare the ages of different parts of the human body, e.g. to find diseased organs or tissues.
- a method for estimating age in multiple tissues (e.g. whole blood, individual blood cells, saliva or brain tissue).
- easily accessible tissues e.g. blood, saliva, buccal cells, epidermis
- inaccessible tissues e.g. brain
- a method is provided for estimating of the chronological and/or biological age of an individual's human brain based on measuring DNA CpG methylation markers that are attached to the individual's DNA.
- human brain tissue from living individuals is not accessible and available for such measurements.
- a small set of DNA methylation markers can be measured in more accessible tissues, such as blood or saliva samples, to estimate the age-related methylation changes in the brain and other tissues.
- one is able to accurately predict an individual's age in the brain tissue based on blood or saliva measurements.
- Illustrative instances of this aspect of the disclosure include, for example, a method of predicting the age of a human by observing the methylation status of a plurality of markers such as at least 6, 17, 38, 100 markers (see, e.g. Tables 3-6) in biological sample from a human, comparing the methylation status observed in to methylation patterns observed in a population of individuals of differing ages (e.g. using a statistical prediction algorithm), and then predicting age of human from whom sample was obtained based upon the information obtained in this comparison step.
- CpGs/genes overlapping with the subclocks (110, 38, 17, and 6 CpGs shown in Tables 4, 5, 6, and 7 respectively) for Hannum/Bell include: 110/38/17/6 - IPO8 (alias: RANBP8) and NHLRC1; 110/38/17 - KLF4, SCGN, RHBDD1, and C16orf65; 110/38 - MGC16703 (alias: P2RX6) and FZD9; 38 - BRUNOL6; 110 - ABCA17P (alias: ABCA3), PIPOX, ABHD14B, EDARADD, GRP25, FLJ32110 (alias: ZNF8048) and LAG3.
- kits for estimating DNAm age based on the clock CpGs.
- the kit comprises a methylation microarray (see, e.g. U.S. Patent Application Publication No. 2006/0292585 .
- the kit is used to estimate the chronological and biological age of brain tissue or blood tissue utilizing measurements in blood or saliva.
- Microfluidics devices can be applied to easily accessible tissues/fluids such as blood, buccal cells, or saliva.
- the kit comprises probes for detecting methylation markers consisting of each of the CpG positions of Table 3.
- the kit comprises a plurality of primer sets for amplifying at least two genomic DNA sequences.
- kits of the invention further comprises a probe or primer used to perform a DNA fingerprinting analysis.
- kits of the invention can further include a reagent used in a genomic DNA polymerization process, a genomic DNA hybridization process, and/or a genomic DNA bisulfite conversion process.
- a kit is provided for obtaining information useful to determine the age of an individual, the kit comprising a plurality of primers or probes specific for at least one genomic DNA sequence in a biological sample, wherein the genomic DNA sequences comprises a CG loci identified in Figure 4 .
- the invention is may also be provided in a fully developed software package or web-based program. For example, a user may access a webpage and upload their DNA methylation data. The program then emails the results, including the predicted age (DNAm age), to the user.
- DNA methylation of the methylation markers can be measured using various approaches, which range from commercial array platforms (e.g. from Illumina TM ) to sequencing approaches of individual genes. This includes standard lab techniques or array platforms.
- array platforms e.g. from Illumina TM
- a variety of methods for detecting methylation status or patterns have been described in, for example U.S. Pat. Nos. 6,214,556 , 5,786,146 , 6,017,704 , 6,265,171 , 6,200,756 , 6,251,594 , 5,912,147 , 6,331,393 , 6,605,432 , and 6,300,071 and US Patent Application publication Nos.
- Available methods include, but are not limited to: reverse-phase HPLC, thin-layer chromatography, SssI methyltransferases with incorporation of labeled methyl groups, the chloracetaldehyde reaction, differentially sensitive restriction enzymes, hydrazine or permanganate treatment (m5C is cleaved by permanganate treatment but not by hydrazine treatment), sodium bisulfite, combined bisulphate-restriction analysis, and methylation sensitive single nucleotide primer extension.
- the methylation levels of a subset of the DNA methylation markers disclosed herein are assayed (e.g. using an Illumina TM DNA methylation array, or using a PCR protocol involving relevant primers).
- Illumina TM DNA methylation array
- beta value of methylation which equals the fraction of methylated cytosines in that location.
- the invention can also be applied to any other approach for quantifying DNA methylation at locations near the genes of the claims.
- DNA methylation can be quantified using many currently available assays which include, for example:
- the genomic DNA is hybridized to a complimentary sequence (e.g. a synthetic polynucleotide sequence) that is coupled to a matrix (e.g. one disposed within a microarray).
- a complimentary sequence e.g. a synthetic polynucleotide sequence
- a matrix e.g. one disposed within a microarray
- the genomic DNA is transformed from its natural state via amplification by a polymerase chain reaction process.
- the sample may be amplified by a variety of mechanisms, some of which may employ PCR. See, for example, PCR Technology: Principles and Applications for DNA Amplification (Ed. H. A. Erlich, Freeman Press, NY, N.Y., 1992 ); PCR Protocols: A Guide to Methods and Applications (Eds.
- any statistical approach can be used to relate the methylation levels to age, e.g. a transformed version of chronological age can be regressed on the CpG markers using a (penalized) linear regression model (such as elastic net regression) as described herein.
- a linear regression model such as elastic net regression
- a number of age prediction models are contemplated for use with specific genomic DNA samples and/or specific analysis techniques and/or specific individual populations (see, e.g., statistical package R version 2.11.1 in citation as discussed in R Development Core Team (2005) R: A language and environment for statistical computing. R Foundation for Statistical Computing, Vienna, Austria. ISBN 3-900051-07-0, URL www.R-project.org).
- an identity transformation may be used, wherein chronological age is simply regressed on the CpGs.
- the chronological age (the dependent variable in a penalized regression model) is transformed.
- this transformation has been found to lead to an age predictor that is substantially more accurate (in relation to error) and that requires substantially fewer CpGs than one without the transformation. Additionally, one can form a weighted average of the CpGs.
- a linear regression model may predict age based on a weighted average of the methylation levels plus an offset. To identify the weights for the weighted average, one can use the regression coefficients of a regression model. In another embodiment, one can standardize each methylation marker so that it has a mean zero and variance. A weighted average of the standardized methylation levels is then formed where the weights are chosen to equal their correlation with age in a training data set times the standard deviation of the ages that is expected in the test data set.
- the transformation of the dependent variable i.e. chronological age
- the transformation of the dependent variable is a piecewise transformation: for ages between say 0 and 20, a logarithmic transformation is used. For ages older than 20, a linear transformation is used.
- CpGs dependent variables
- a chosen gold standard e.g. the mean methylation level in the training data or the mean methylation levels in blood tissue
- Teschendorff an adaptation of the BMIQ algorithm by Teschendorff. Further details are provided in Example 8. This normalization step ensures that future test data resemble those of the training data.
- methylation markers cg22736354 SEQ ID NO: 158
- cg21296230 SEQ ID NO: 354
- cg06493994 SEQ ID NO: 46
- cg09809672 SEQ ID NO: 252
- the standard deviation of age was 24 and the mean value was 45.
- coefficient values can be weighted in data sets from different populations. For example, if a model is applied to pediatric patients only, then one set of coefficients can be used. Alternatively, if a model is applied exclusively to older people (e.g. greater than 50 years), another set of coefficients can be used. Alternatively, coefficients can be fixed, for example, when a model is broadly applied to people of ages from 10 to 100 etc. Coefficient values in various models can also reflect the specific assay that is used to measure the methylation levels (e.g.
- methylation levels may be replaced by values that adjust for the methylation levels of a background or by mean methylation levels of a set benchmark of CpGs.
- a reference data set e.g.
- embodiments of the invention can include a variety of art accepted technical processes.
- a bisulfite conversion process is performed so that cytosine residues in the genomic DNA are transformed to uracil, while 5-methylcytosine residues in the genomic DNA are not transformed to uracil.
- Kits for DNA bisulfite modification are commercially available from, for example, MethylEasy TM (Human Genetic Signatures TM ) and CpGenome TM Modification Kit (Chemicon TM ). See also, WO04096825A1 , which describes bisulfite modification methods and Olek et al. Nuc. Acids Res.
- Bisulfite treatment allows the methylation status of cytosines to be detected by a variety of methods.
- any method that may be used to detect a SNP may be used, for examples, see Syvanen, Nature Rev. Gen. 2:930-942 (2001 ).
- Methods such as single base extension (SBE) may be used or hybridization of sequence specific probes similar to allele specific hybridization methods.
- SBE single base extension
- MIP Molecular Inversion Probe
- the methods provided for estimating age may involve relatively few markers. In one or more certain aspects of the disclosure, the methods involve between 1 to 4 markers.
- DNA methylation markers near the following genes: NHLRC1 (SEQ ID NO: 357), GREM1 (SEQ ID NO: 356), SCGN (SEQ ID NO: 358) have highly significant positive correlations with age in multiple human tissues.
- Methylation markers near gene EDARADD (SEQ ID NO: 355) have a highly significant negative correlation with age in multiple tissues.
- genes and corresponding Illumina TM Methylation probe IDs are provided.
- probe identifiers from an Illumina TM methylation array platform denote suitable markers: i) probe cg22736354 (SEQ ID NO: 158) near gene NHLRC1, ii) probe cg21296230 (SEQ ID NO: 354) near gene GREM1, and iii) probe cg06493994 (SEQ ID NO: 46) near gene SCGN have positive correlations with age in multiple tissues; iv) probe cg09809672 (SEQ ID NO: 252) near gene EDARADD has a negative correlation with age in multiple tissues.
- the methods for estimating an individual's age can be used for both diagnostic and prognostic purposes.
- the biomarkers for aging can be used to study the effect of medication, food compounds and/or special diets on the wellness and biological age of humans. They can also be used as biomarkers of vitality or youthfulness. For example, the biomarkers for aging can be used to determine chronological age (e.g. for forensic applications). They can also be used for determining and increasing an individual's likelihood of longevity and of retaining cognitive function during aging.
- the methods of the invention can be used to provide valuable information in forensic investigations (e.g. where the identity of the individual from which the DNA is derived is unknown). In one embodiment, the methods of the invention can be applied to forensic applications involving the prediction of chronological age.
- the methylation levels of the epigenetic markers (clock CpGs) are measured. In certain aspects of the disclosure, the methylation levels of one or more of the four methylation markers near genes EDARADD, NHLRC1, GREM1, and SCGN in blood or saliva are measured.
- probes cg22736354 (SEQ ID NO: 158) near gene NHLRC1, cg21296230 (SEQ ID NO: 354) near gene GREM1, cg06493994 (SEQ ID NO: 46) near gene SCGN, and/or cg09809672 (SEQ ID NO: 252) near gene EDARADD are used.
- a statistical prediction method (e.g. based on linear regression) is then applied to predict the age of the individual.
- the age predictive models disclosed can be applied in a variety of contexts. For instance, the ability to predict an individual's age can be used by forensic scientists to estimate a suspect's age based on a biological sample alone.
- a practitioner could, for example, submit a biological sample to a lab.
- DNA prepared from the sample could then be analyzed to determine the percentage of methylation at one or more of the loci identified herein.
- the results could be inputed in a regression model, such as those disclosed herein, to predict the age of the suspect. In certain instances, the suspect's age can be predicted to an average accuracy of 3 to 5 years.
- DNA fingerprinting also known as DNA profiling
- STRs short tandem repeats
- the FBI and the forensic science community typically use 13 separate STR loci (the core CODIS loci) in routine forensic analysis.
- CODIS refers to the Combined DNA Index System that was established by the FBI in 1998.
- Illustrative DNA fingerprinting methodologies are disclosed, for example, in U.S. Patent Nos. 7,501,253 , 7,238,486 , 6,929,914 , 6,251,592 , and 5,576,180 ).
- the methods disclosed herein can be applied to medical applications involving the prediction of the biological age.
- the age is predicted according to the methods described. This predicted value is interpreted as the biological age (DNA methylation age).
- the prediction then is contrasted with the known chronological age of the individual. If the predicted age is higher than the chronological age, it indicates that the person appears older (or more impaired or more at risk of an age related disease) than his or her peers from the same age group, i.e. shows evidence of age acceleration.
- a measurement of relevant methylation patterns in genomic DNA from white blood cells or skin cells also provides a tool in routine medical screening to predict the risk of age-related diseases as well as to tailor interventions based on the epigenetic biological age instead of the chronological age.
- Such methods can be useful in clinical interventions that are predicated on an epigenetic biological age rather than an actual chronological age.
- a biological sample can be collected in a routine health check and sent to the lab for methylation pattern analysis (e.g.
- embodiments of the invention include methods of obtaining information useful to determine a level of risk of an age-related disease in an individual (e.g. Alzheimer's disease or Parkinson's disease).
- DNAm age allows one to contrast the ages of various tissues/cell types from the same individual, it can be used to identify diseased tissue (e.g. cancer tissue often shows evidence of severe positive or negative age acceleration).
- the biomarkers for aging can also be used for determining and decreasing an individual's likelihood of developing an age-related disease, e.g. cancer, dementia.
- Methods are provided for diagnosing and determining the existence or likelihood of cognitive deficits in the elderly resulting from senescence or age-related disease. Accordingly, such methods allow for the determination of patients who are most likely to be at risk of age-related cognitive decline and allow these patients to be targeted for more intensive study or prophylaxis.
- the methods disclosed herein can be applied to assess the efficacy of a treatment or compound (e.g. rejuvenation or curing an age-related impairment, enhancing memory function or cognition).
- a treatment or compound e.g. rejuvenation or curing an age-related impairment, enhancing memory function or cognition.
- the biomarkers for aging can be used in studying patients who, although not elderly, are afflicted by a brain disease that typically occurs in the elderly (e.g. early onset dementia). A determination is made regarding whether administration of the treatment or compound affects the predicted age. An effective treatment would lower the predicted age since the individual appears rejuvenated and younger.
- An assay for identifying a compound that increases memory function and/or decreases a subject's likelihood of developing an age-related cognitive decline.
- the assay comprises identifying a compound which counters the age-related increase or decrease of methylation in the identified markers.
- Age prediction methodologies are also relevant to healthcare applications. For example, significant DNA methylation differences are known to be associated with specific age-related disorders, for example in comparisons between the brains of people diagnosed with late-onset Alzheimer's disease and brains from controls. In this context, the identification of specific loci highly correlated with age can be used to enhance the understanding of aging in health and disease.
- age prediction methodologies can be used as part of clinical interventions tailored for patients based on their "bio-age”—a result of the interaction of genes, environment, and time—rather than their chronological age. For example, if a person's predicted age is higher than their real age, specific interventions could be designed to return the genome to a "younger" state. Age prediction methodologies can also pave the way for interventions based on specific epigenetic marks associated with disease, as occurs in certain cancer treatments.
- Brain methylation data came from Gibbs JR et al. (2010) ( Gibbs JR, van der Brug MP, Hernandez DG, Traynor BJ, Nalls MA, et al. (2010) Abundant Quantitative Trait Loci Exist for DNA Methylation and Gene Expression in Human Brain.
- FCTX frontal cortex
- PONS pons
- TCTX temporal cortex
- Illumina TM 27k methylation array Using the Illumina TM 27k methylation array they assayed 27,578 CpG methylation sites in each of the brain regions. However, the authors did not study age effects. Further, they did not relate the brain methylation data to blood methylation data.
- the publicly available blood and saliva methylation used the same Illumina TM methylation array and are described in the following Table 1.
- Stouffer's meta-analysis Z statistic (implemented in the metaAnalysis R function in the Weighted correlation network analysis (WGCNA) R package) was used to identify methylation markers that consistently relate to age across all data sets (see Table 2).
- Example 1 Linear regression predictor involving only 1 methylation marker accurately predicts age in blood, brain and saliva
- a univariate linear regression predictor based on a single methylation probe was examined.
- a single methylation probe corresponding to Illumina TM probe ID cg22736354 (SEQ ID NO: 158) (close to gene NHLRC1) was used in the univariate linear regression model.
- Probe ID: cg22736354 SEQ ID NO: 158
- located near the gene with gene symbol NHLRC1 had a highly significant positive correlation with age in the considered brain regions and in blood.
- Example 2 A multivariate regression predictor involving 2 methylation markers accurately predicts age in blood, brain and saliva
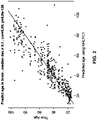
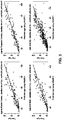
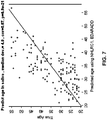
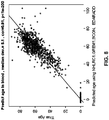
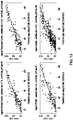
- a multivariate regression predictor based on two methylation probes was examined. Methylation probes corresponding to Illumina TM probe IDs cg09809672 (SEQ ID NO: 252, close to gene EDARADD) and cg22736354 (SEQ ID NO: 158, close to gene NHLRC1) were used in the multivariate linear regression model. As shown in Figures 4-7 , using just the two cytosines near genes NHLRC1 and EDARADD, the multivariate linear regression model based prediction of age had a correlation larger than 0.90 with age in blood and brain tissue and it also correlated highly with age in saliva tissue. The median absolute difference (deviation) between predicted age and true age was 5.1 years.
- Probe ID: cg09809672 (SEQ ID NO: 252), located near the gene with gene symbol EDARADD, had a negative correlation with age and Probe ID: cg22736354 (SEQ ID NO: 158), located near the gene with gene symbol NHLRC1, had a positive correlation with age.
- Example 3 A multivariate regression predictor involving 4 methylation markers accurately predicts age in blood, brain and saliva
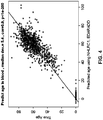
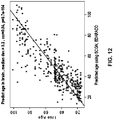
- Methylation probes corresponding to Illumina TM probe IDs cg09809672 (SEQ ID NO: 252, close to gene EDARADD), cg22736354 (SEQ ID NO: 158, close to gene NHLRC1), cg21296230 (SEQ ID NO: 354, close to gene GREM1), and cg06493994 (SEQ ID NO: 46, close to gene SCGN) were used in the multivariate linear regression model.
- the multivariate linear regression model based prediction of age had a correlation larger than 0.90 with age in blood and brain tissue and that correlate with age in saliva tissue.
- the median absolute difference (deviation) between predicted age and true age was around 5.1 years.
- probe ID: cg09809672 (SEQ ID NO: 252), located near the gene with gene symbol EDARADD, had a negative correlation with age and Probe IDs: cg22736354 (SEQ ID NO: 158), cg21296230 (SEQ ID NO: 354), and cg06493994 (SEQ ID NO: 46), located near the genes with gene symbols NHLRC1, GREM1, and SCGN, respectively, had a positive correlation with age.
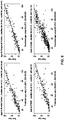
- Example 4 Two saliva based methylation markers can be used to predict the age of brain tissue
- Methylation markers near the gene EDARADD e.g. methylation probe cg09809672, SEQ ID NO: 252
- gene SCGN e.g. probe cg06493994, SEQ ID NO: 46
- the correlation was 0.72 and median deviation was only 4.2 years.
- the correlation was 0.88 and median deviation was 6.1 years.
- the predictor is particularly well suited for predicting brain age based on saliva samples.
- Probe ID: cg09809672 (SEQ ID NO: 252), located near the gene with gene symbol EDARADD, had a negative correlation with age and Probe ID: cg06493994 (SEQ ID NO: 46), located near the gene with gene symbol SCGN (also known as SEGN; SECRET; setagin; DJ501N12.8) had a positive correlation with age.
- Example 5 DNA methylation age of human tissues and cell types
- DNAm age A collection of publicly available DNA methylation data sets is used for defining and evaluating an age predictor. The demonstrated accuracy across most tissues and cell types justifies its designation as a multi-tissue age predictor. Its age prediction, referred to as DNAm age, can be used as biomarker for addressing a host of questions arising in aging research and related fields. For example, interventions used for creating induced pluripotent stem cells are shown to reset the epigenetic clock to zero.
- DNAm age has the following properties: a) it is close to zero for embryonic and induced pluripotent stem (iPS) cells, b) it correlates with cell passage number, c) it gives rise to a highly heritable measure of age acceleration, and d) it is applicable to chimpanzee tissues.
- iPS embryonic and induced pluripotent stem
- 354 clock CpGs were characterized in terms of chromatin states and tissue variance (Table 3).
- the multi-tissue predictor of age has been applied to colorectal cancer, glioblastoma multiforme, AML, and cancer cell lines.
- TCGA Cancer Genome Atlas
- Example 7 Details on the individual data sets and data pre-processing steps are provided in Example 7 (Materials and methods) and Example 8.
- the first 39 data sets were used to construct ("train") the age predictor.
- Data sets 40-71 were used to test (validate) the age predictor.
- Data sets 72-82 served other purposes e.g. to estimate the DNAm age of embryonic stem and iPS cells.
- the criteria used for selecting the training sets are described in Example 8.
- the training data were chosen i) to represent a wide spectrum of tissues/cell types, ii) to involve samples whose mean age (43 years) is similar to that in the test data, and iii) to involve a high proportion of samples (37%) measured on the Illumina TM 450K platform since many on-going studies use this recent Illumina TM platform.
- 21369 CpGs (measured with the Infinium type II assay), which were present on both Illumina TM platforms (Infinium 450K and 27K), were studied. There were fewer than 10 missing values across the data sets.
- Example 7 (Materials and methods) and Example 8
- a transformed version of chronological age was regressed on the CpGs using a penalized regression model (elastic net).
- the elastic net regression model automatically selected 354 CpGs (Table 3, Example 9). Since their weighted average (formed by the regression coefficients) amounts to an epigenetic molecular clock, the 354 CpGs are referred to as clock CpGs.
- the first referred to as “age correlation” is the Pearson correlation coefficient between DNAm age (predicted age) and chronological age. It has the following limitations: it cannot be used for studying whether DNAm is well calibrated, it cannot be calculated in data sets whose subjects have the same chronological age (e.g. cord blood samples from newborns), and it strongly depends on the standard deviation of age (as described below).
- the second accuracy measure referred to as (median) “error”, is the median absolute difference between DNAm age and chronological age. Thus, a test set error of 3.6 years indicates that DNAm age differs by less than 3.6 years in 50% of subjects. The error is well suited for studying whether DNAm age is poorly calibrated. Average age acceleration, defined by the average difference between DNAm age and chronological age, can be used to determine whether the DNAm age of a given tissue is consistently higher (or lower) than expected.
- the multi-tissue age predictor has been found to perform remarkably well in most tissues and cell types.
- the age predictor performs well in heterogeneous tissues (e.g. whole blood, blood peripheral blood mononuclear cells, cerebellar samples, occipital cortex, buccal epithelium, colon, adipose, liver, lung, saliva, uterine cervix) as well as in individual cell types such as CD4 T cells and CD14 monocytes (Figure 17C) and immortalized B cells (Figure 17T).
- heterogeneous tissues e.g. whole blood, blood peripheral blood mononuclear cells, cerebellar samples, occipital cortex, buccal epithelium, colon, adipose, liver, lung, saliva, uterine cervix
- the age predictor is particularly accurate in data sets comprised of adolescents and children, e.g. blood (Figure 17B), brain data (Figure 17F,G), and buccal epithelium (Figure 17I).
- DNAm age can be used to study whether cells from patients with accelerated aging diseases such as progeria (including Werner progeroid syndrome, Hutchinson-Gilford progeria, HGP) truly look old at an epigenetic level.
- progeria disease status is not related to DNAm based age acceleration in Epstein-Barr-Virus transformed B cells (Figure 17T). But the study of accelerated aging effects in HGP should be repeated for vascular smooth muscle, the tissue that is most compromised in HGP.
- DNAm age was found to be less accurately calibrated (i.e. leads to a higher error) in breast tissue (Figure 17H), uterine endometrium (Figure 17S), dermal fibroblasts, skeletal muscle tissue (Figure 17P), and heart tissue (Figure 17L).
- Figure 17H breast tissue
- Figure 17S uterine endometrium
- Figure 17P dermal fibroblasts
- skeletal muscle tissue Figure 17P
- Figure 17L heart tissue
- Myosatellite cells may effectively rejuvenate the DNAm age of skeletal muscle tissue. Similarly, the recruitment of stem cells into cardiomyocytes for new cardiac muscle formation could explain why human heart tissue tends to have a low DNAm age. Carefully designed studies will be needed to test these hypotheses.
- the age correlation in a data set is determined by the standard deviation of age
- LOCV leave-one-data-set-out cross validation
- SD standard deviation
- a host of technical artefacts could explain differences in predictive accuracy (e.g. variations in sample processing, DNA extraction, DNA storage effects, batch effects, and chip effects.
- the mean DNAm age per tissue is compared with the corresponding mean chronological age.
- DNAm age does not change significantly across different brain regions (temporal cortex, pons, frontal cortex, cerebellum) from the same subjects.
- the limited sample sizes per tissue mostly one sample per tissue per subject
- these data can be used to estimate the coefficient of variation of DNAm age (i.e. the standard deviation divided by the mean). Note that the coefficient of variations for the first and second adult male are relatively low (0.12 and 0.15) even though the analysis involved several tissues that were not part of the training data, e.g.
- the coefficient of variation in the adult female is relatively high (0.21) which reflects the fact that her breast tissue shows signs of substantial age acceleration.
- DNAm age performs in tissues and DNA sources that were not represented in the training data set. It is anticipated that it also performs well in several other human tissues. As expected, no significant age correlation was found in sperm. The DNAm age of sperm is significantly lower than the chronological age of the donor.
- DNAm age is applicable to chimpanzees
- iPS induced pluripotent stem
- iPS Induced pluripotent stem
- ES embryonic stem
- iPS cells are a type of pluripotent stem cell artificially derived from a non-pluripotent cell (typically an adult somatic cell) by inducing a set of specific genes. Since iPS cells are similar to ES cells, it is hypothesized that the DNAm age of iPS cells should be significantly younger than that of corresponding primary cells. This hypothesis is confirmed in three independent data sets. No significant difference in DNAm age could be detected between embryonic stem (ES) cells and iPS cells.
- the multi-tissue predictor disclosed greatly outperforms existing predictors described in other articles [21, 23]. See Example 8 for a comparison of the multi-tissue predictor versus existing predictors. While further gains in accuracy can perhaps be achieved by focusing on a single tissue and considering more CpGs, the major strength of the multi-tissue age predictor lies in its wide applicability: for most tissues it will not require any adjustments or offsets.
- the 354 clock CpGs can be divided into two sets according to their correlation with age.
- the 193 positively and 160 negatively correlated CpGs get hypermethylated and hypomethylated with age, respectively.
- DNA methylation data measured across many different adult and fetal tissues is used to study the relationship between tissue variance and age effects. While the DNA methylation levels of the 193 positively related CpGs vary less across different tissues, those of the 160 negatively related CpGs vary more across tissues than the remaining CpGs on the Illumina TM 27K array.
- a meta-analysis method was used that implicitly conditions on data set, i.e. it removes the confounding effects due to data set and tissue type.
- Chromatin state profiling has emerged as a powerful means of genome annotation and detection of regulatory activity. It provides a systematic means of detecting cis-regulatory elements (given the central role of chromatin in mediating regulatory signals and controlling DNA access) and can be used for characterizing non-coding portions of the genome, which contribute to cellular phenotypes [29]. While individual histone modifications are associated with regulator binding, transcriptional initiation, enhancer activity, combinations of chromatin modifications can provide even more precise insight into chromatin state [29]. Ernst et al (2011) distinguish six broad classes of chromatin states, referred to as promoter, enhancer, insulator, transcribed, repressed, and inactive states.
- active, weak and poised promoters differ in expression levels, while strong and weak enhancers (states 4-7) differ in expression of proximal genes.
- the 193 positively related CpGs are more likely to be in poised promoters (chromatin state 3 regions) while the 160 negatively related CpGs are more likely to be either in weak promoters (chromatin state 2) or strong enhancers (chromatin state 4).
- DNA methylation is an important epigenetic mechanism for regulating gene expression levels (messenger RNA abundance), it is natural to wonder how age-related DNAm changes relate to those observed in gene expression levels. It has been found that there is very little overlap. Further, age effects on DNAm levels have not been found to affect genes known to be differentially expressed between naive CD8 T cells and CD8 memory cells. These non-significant results reflect the fact that the relationship between DNAm levels and expression levels is complex [33, 34].
- the median DNAm level in subjects younger than 35 and in subjects older than 55 is examined (Example 9).
- the age-related change in beta values is typically small (the average absolute difference across the 354 CpGs is only 0.032).
- the weak age effect on individual clock CpGs can also be observed in a heat map that visualizes how the DNAm levels change across subjects. Few vertical bands in the heat map suggest that the clock CpGs are relatively robust against tissue and data set effects.
- DNAm age does not measure mitotic age or cellular senescence
- DNAm age measures the number of somatic cell replications. In other words, that it measures mitotic age (which assigns a cell copy number to every cell) [35, 37]. While DNAm age is correlated with cell passage number and the clock ticking rate is highest during organismal growth, it is clearly different from mitotic age since it tracks chronological age in non-proliferative tissue (e.g. brain tissue) and assigns similar ages to both short and long lived blood cells.
- non-proliferative tissue e.g. brain tissue
- DNAm age is a marker of cellular senescence. This turns out to be wrong as can be seen from the fact that DNAm age is highly related to chronological age in immortal, non-senescent cells, e.g. immortalized B cells ( Figure 17T). Further, DNAm age and cell passage number are highly correlated in ES cells which are also immortal [38].
- Example 6 DNAm age measures the work done by an epigenetic maintenance system
- DNAm age measures the cumulative work done by a particular kind of epigenetic maintenance system (EMS), which helps maintain epigenetic stability. While epigenetic stability is related to genomic stability, it is useful to distinguish these two concepts. If the EMS model of DNAm age is correct then this particular kind of EMS appears to be inactive in the perfectly young ES cells. Maintenance methyltransferases are likely to play an important role. In physics, "work" is defined by the integral of power over time. Using this terminology, it is hypothesized that the power (defined as rate of change of the energy spent by this EMS) corresponds to the tick rate of the epigenetic clock. This model would explain the high tick rate during organismal development since a high power is required to maintain epigenetic stability during this stressful time. At the end of development, a constant amount of power is sufficient to maintain stability leading to a constant tick rate.
- EMS epigenetic maintenance system
- DNAm age should be accelerated by many perturbations that affect epigenetic stability. Further, age acceleration should have some beneficial effects given the protective role of the EMS.
- the EMS model of DNAm age entails the following testable predictions.
- cancer tissue should show signs of positive or negative accelerated age, reflecting the actions of the EMS.
- many mitogens, genomic aberrations, and oncogenes, which trigger the response of the EMS should be associated with accelerated DNAm age.
- high age acceleration of cancer tissue should be associated with fewer somatic mutations given the protective role of the EMS.
- mutations in TP53 should be associated with a lower age acceleration of cancer tissue if one further assumes that p53 signaling helps trigger the EMS. All of these model predictions turn out to be true as will be shown in the following cancer applications.
- the number of mutations per cancer sample tends to be inversely correlated with age acceleration, which may reflect that DNAm age acceleration results from processes that promote genome stability.
- age acceleration results from processes that promote genome stability.
- a significant negative relationship between age acceleration and the number of somatic mutations can be observed in the following seven affected tissues/cancers: bone marrow (AML data from TCGA), breast carcinoma (BRCA data), kidney renal cell carcinoma (KIRC), kidney renal papillary cell carcinoma (KIRP), ovarian cancer (OVAR), prostate (PRAD), and thyroid (THCA). Similar results can also be observed in several breast cancer types.
- TP53 mutations are associated with lower age acceleration
- TP53 was among the top 2 most significant genes in 4 out of the 13 cancer data sets whose mutation has the strongest effect on age acceleration. Further, TP53 mutation is associated with significantly lower age acceleration in five different cancer types including AML, breast cancer, ovarian cancer, and uterine corpus endometrioid. Further, marginally significant result can be observed in lung squamous cell carcinoma and colorectal cancer (below). Only one cancer type (GBM) was found where mutations in TP53 are associated with a nominally significant increased age acceleration. Overall, these results suggest that p53 signaling can trigger processes that accelerate DNAm age.
- GBM cancer type
- the CpG island methylator phenotype and age acceleration measure different properties as can be seen in glioblastoma multiforme.
- H3F3A which encodes the replication-independent histone variant H3.3.
- These mutations are single-nucleotide variants (SNV) changing lysine 27 to methionine (K27M) or changing glycine 34 to arginine (G34R) [40].
- SNV single-nucleotide variants
- K27M methionine
- G34R glycine 34 to arginine
- Lysine 27 is a critical residue of histone 3 variants, and methylation at this position (H3K27me), which may be mimicked by the terminal CH3 of methionine substituted at this residue [40], is commonly associated with transcriptional repression [41] while H3K36 methylation or acetylation typically promotes gene transcription [42].
- G34-mutant cells exhibit increased RNA polymerase II binding, increased gene expression, most notably that of the oncogene MYCN [43]. Both H3F3A mutations are mutually exclusive with IDH1 mutations, which characterize a third mutation-defined subgroup [44].
- Age acceleration in GBM samples is also associated with the following genomic aberrations: TP53 mutation, ATRX mutation, chromosome 7 gain, chromosome 10 loss, CDKN2A del, and EGFR amplification. Reflecting these results for individual markers, age acceleration varies significantly across the GBM subtypes defined in [44].
- DNAm age acceleration varies greatly across the cancer lines (Example 11): the highest values can be observed for AML cell lines (KG1A: 182 years, HL-60: 177 years); the lowest values for head/neck squamous cell carcinoma cell line (UPCI SCC47: 6 years) and two breast cancer cell lines (SK-BR-3: 8 years, MDA-MB-468: 11 years).
- Example 8 The healthy tissue data allowed for the development of a multi-tissue predictor of age (mathematical details are provided in Example 8). Relevant software can be accessed from [45]. A brief software tutorial is also presented in Example 8.
- the basic approach of the multi-tissue predictor of age is to form a weighted average of 354 clock CpGs (Table 3), which is then transformed to DNAm age using a calibration function.
- the calibration function reveals that the epigenetic clock has a high tick rate until adulthood after which it slows to a constant tick rate.
- DNAm age measures the cumulative work done by an epigenetic maintenance system.
- This novel epigenetic clock can be used to address a host of questions in developmental biology, cancer-, and aging research.
- This EMS model of DNAm age leads to several testable model predictions which have been validated using cancer data. But irrespective of the validity of the EMS model, the findings in cancer are interesting in their own right. Overall, high age acceleration is associated with fewer somatic mutations in cancer tissue. Mutations in TP53 are associated with lower DNAm age. To provide a glimpse of how DNAm age can inform cancer research, DNAm age has been related to several widely used genomic aberrations in breast cancer, colorectal cancer, glioblastoma multiforme, and acute myeloid leukemia.
- DNAm age is a promising marker for studying human development, aging, and cancer. It may become a useful surrogate marker for evaluating rejuvenation therapies.
- the most salient feature of DNAm age is its applicability to a broad spectrum of tissues and cell types. Since it allows one to contrast the ages of different tissues from the same subject, it can be used to identify tissues that show evidence of accelerated age due to disease (e.g. cancer). It is likely that the DNAm age of easily accessible fluids/tissues (e.g. saliva, buccal cells, blood, skin) can serve as surrogate marker for inaccessible tissues (e.g. brain, kidney, liver). It is noteworthy that DNAm age is applicable to chimpanzee tissues.
- a penalized regression model (implemented in the R package glmnet [46]) is used to regress a log transformed version of chronological age on 21369 CpG probes which a) were present both on the Illumina TM 450K and 27K platform and b) had fewer than 10 missing values.
- DNAm age was defined as predicted age. Mathematical details are provided in Example 8.
- Data sets 1 and 2 were generated by Roel Ophoff [14].
- Data set 3 (whole blood) consists of whole blood samples from a recent large scale study of healthy individuals [24]. The authors used these and other data to estimate human aging rates and developed a highly accurate predictor of age based on blood data.
- Data set 4 leukocyte samples from healthy male children from Children's Hospital Boston [47].
- Data set 5 peripheral blood leukocytes samples [48].
- Data set 7 cerebellum samples were provided by C. Liu and C.
- Data set 19 normal adjacent colon tissue from TCGA.
- Data set 20 colon mucosa samples from [55].
- Data set 21 dermal fibroblast samples from [21].
- Data set 22 epidermis samples from [56].
- Data set 23 gastric tissue samples from [57].
- Data set 24 head/neck normal adjacent tissue samples from the TCGA data base (HNSC data).
- Data set 25 heart tissue samples from [58].
- Data set 26 normal adjacent renal papillary tissue from TCGA (KIRP data).
- Data sets 27 normal adjacent tissue from TCGA (KIRC data).
- Data set 28 normal adjacent liver samples from [59].
- Data set 29 normal adjacent lung tissue from TCGA data base (LUSC data).
- Data set 30 normal adjacent lung tissue samples from TCGA (LUAD data).
- Data set 32 mesenchymal stromal cells isolated from bone marrow [60].
- Data set 33 placenta samples from mothers of monozygotic and dizygotic twins [61].
- Data set 34 prostate samples from [62].
- Data set 35 normal adjacent prostate tissue from TCGA (PRAD data).
- Data set 36 male saliva samples from [63].
- Data set 37 male saliva samples from [23].
- Data set 40 WB from type 1 diabetics from [10, 64].
- Data set 41 WB from [15].
- Data sets 42 and 43 involve whole blood samples from women with ovarian cancer and healthy controls, respectively. These are the samples from the United Kingdom Ovarian Cancer Population Study [10, 64].
- Data set 51 CD4 T cells from infants [69].
- Data set 54 and 55 are brain samples from [71].
- Data set 56 and 57 breast tissue from TCGA (27K and 450K platform, respectively).
- Data set 58 buccal cells from [72].
- Data set 64 lung from TCGA Data set 65 muscle tissue from [73].
- Data set 71 various human tissues from the ENCODE/HAIB Project (GEO GSE40700).
- Data set 72 chimpanzees and human tissues from [27].
- Data set 73 great ape blood samples from [28].
- Data set 74 sperm samples from [77].
- Data set 75 sperm samples from [78].
- Data sets 77 and 78 (special cell types) involved human embryonic stem cells, iPS cells, and somatic cell samples measured on the Illumina TM 27K array and Illumina TM 450K array, respectively [79].
- Data set 79 reprogrammed mesenchymal stromal cells from human bone marrow (iP-MSC), initial MSC, and embryonic stem cells [80].
- Data set 80 human ES cells and normal primary tissue from [81].
- Data set 81 human ES cells from [82].
- Data set 82 blood cell type data from [83].
- the metaAnalysis R function in the WGCNA R package [87] is used to measure pure age effects as detailed in Example 8.
- F.tissueTraining F.tissueTraining
- results of this article do not contradict previous studies that have noted age-related DNA methylation changes which occur in a tissue specific manner, e.g. ⁇ 14, 15 ⁇ . Instead, the results of this article demonstrate that one can use a couple of hundred CpGs for forming an age predictor that a) performs remarkably well across a broad spectrum of human tissues and b) the resulting DNAm age estimate is biologically meaningful.
- Data sets 1 and 2 are comprised of schizophrenics and healthy control subjects measured on the Illumina TM 27K and 450K array platform, respectively. These data from Dr. Roel Ophoff's lab were formerly used to find co-methylation modules related to age ⁇ 13 ⁇ . The current study has a different aim, namely the development of an age predictor based on methylation levels. Since schizophrenia status had a negligible effect on age relationships ⁇ 13 ⁇ , it was ignored in this analysis. Further, it turned out that schizophrenia status was not related to DNAm age. GEO identifier of the data is GSE41037.
- Data set 3 (whole blood) consists of whole blood samples from a recent large scale study of healthy individuals ⁇ 16 ⁇ . The authors used these data (and additional data) to estimate human aging rates and developed a highly accurate predictor of age based on blood data.
- Data set 4 (leukocytes from healthy male children from Children's Hospital Boston) consists of 72 peripheral blood leukocyte samples from healthy males (mean age 5, range 1-16) ⁇ 17 ⁇ .
- Data set 5 peripheral blood leukocytes from a DNAm study of Crohn's disease and ulcerative colitis ⁇ 18 ⁇ .
- PBL peripheral blood leukocyte
- Data set 6 (cord blood from newborns) is comprised of cord blood samples from 216 subjects (of age zero) ⁇ 19 ⁇ .
- Data set 7 (cerebellum) is comprised of postmortem cerebellum brains. The data were provided by C. Liu and C. Chen (GEO identifier GSE38873).
- Data set 8, 9, 10, 13 (cerebellum, frontal cortex, pons, temporal cortex) consist of brain tissue samples obtained from the same subjects whose mean age was 49 (range 15-101) ⁇ 20 ⁇ . These subjects, who had donated their brains for research, were of non-Hispanic, Caucasian ethnicity, and none had a clinical history of neurological or cerebrovascular disease, or a diagnosis of cognitive impairment during life. Demographics, tissue source and cause of death for each subject are reported in ⁇ 20 ⁇ . Unbiased removal of potential outliers (as described in the section on sample pre-processing) reduced the number of retained samples.
- Data set 11 (prefrontal cortex from healthy controls) consists of 108 samples (mean age 26, ranging from samples before birth up to age 84) ⁇ 21 ⁇ . These post-mortem human brains from non-psychiatric controls were collected at the Clinical Brain Disorders Branch (National Institute of Mental Health).
- the DNAm data are publicly available from the webpage of the standalone package BrainCloudMethyl, which can be downloaded from the following URL http://braincloud.jhmi.edu/Methylation32/BrainCloudMethyl.htm
- Data set 12 neuro and glial cells from ⁇ 22 ⁇ .
- the authors developed a cell epigenotype specific model for the correction of brain cellular heterogeneity bias and applied it to study age, brain region and major depression.
- FACS fluorescence activated cell sorting
- the authors characterized the extent of neuron and glia specific DNAm variation independent of disease status and identified significant cell type specific epigenetic variation at 51% of loci. I ignored disease status in the analysis. I found no evidence that disease status accelerated age in this data set.
- Data set 14 (breast) consists of normal breast tissue from 23 females (mean age 48, range 19-75) downloaded from GEO ⁇ 23 ⁇ .
- Data set 17 (buccal cells) from ⁇ 26 ⁇ .
- the authors applied the Illumina TM 450K platform to buccal swabs from 10 monozygotic (MZ) and 5 dizygotic (DZ) twin pairs from the Peri/postnatal Epigenetic Twins Study (PETS) cohort.
- MZ monozygotic
- DZ dizygotic twin pairs from the Peri/postnatal Epigenetic Twins Study
- DNAm profiles were generated at birth (age 0) and at age 1.5 years (18 months).
- Data set 18 (cartilage, chondrocytes) from ⁇ 27 ⁇ .
- the authors analyzed human articular chondrocytes from osteoarthritic patients and healthy cartilage samples. I did not find a relationship between disease status and accelerated DNAm age.
- Data sets 19 (colon, normal tissue) consists of samples downloaded from TCGA data base measured on the Illumina TM 27K array.
- Data set 21 (dermal fibroblasts) consists of 14 female fibroblast samples (mean age 32, range 6-73). The samples came from different locations on the human body (5 abdomen, 2 arm, 2 breast, 3 ear, and 2 leg samples) ⁇ 2 ⁇ . The single blepharoblast sample was removed from this data set since hierarchical clustering (based on the Euclidean distance, single linkage) indicated that it was an outlier.
- Data set 22 (epidermis) came from a study that evaluated the epigenetic effects of aging and chronic sun exposure ⁇ 29 ⁇ . I used the 10 epidermal samples collected using suction blistering.
- Data set 23 (gastric tissue) from ⁇ 30 ⁇ .
- the Illumina TM HumanMethylation27 BeadChip was used to obtain DNAm profiles across 27,578 CpGs in 203 gastric tumors and 94 matched non-malignant gastric samples. I focused on matched control samples.
- Data set 24 head/neck normal adjacent tissues measured on the Illumina TM 450K platform from the TCGA data base (HNSC data).
- Data set 25 (heart tissue) ⁇ 31 ⁇ .
- the authors generated DNAm profiles from human left ventricular myocardium DNA in order to study alterations in cardiac DNAm in human dilated cardiomyopathy (DCM).
- DCM human dilated cardiomyopathy
- n 8 controls (patients after heart transplantation)
- n 9 patients with idiopathic DCM. I ignored disease status in the analysis. I could find no significant evidence that disease status affects DNAm age in this small data set.
- Data sets 26 (renal papillary, normal tissue) consists of 44 samples (mean age 66) downloaded from TCGA data base (KIRP) measured on the Illumina TM 450K array.
- Data sets 27 (adjacent normal tissue, kidney measured on the Illumina TM 450K array) from TCGA (Kidney Clear Cell Renal Carcinoma, KIRC).
- Data set 28 (liver) consists of normal adjacent tissue samples from Taiwanese hepatocellular carcinoma subjects ⁇ 32 ⁇ . The data were downloaded from GEO (GSE37988).
- Data set 29 (lung squamous cells from normal adjacent tissue) consists of samples downloaded from TCGA data base (normal from LUSC) that were measured on the Illumina TM 27K array.
- Data set 30 lung normal adjacent lung tissue, Illumina TM 27K) from the Cancer Genome Atlas (TCGA) data base (http://tcga-data.nci.nih.gov/), LUAD
- Data sets 31 lung squamous cells from normal adjacent tissue measured on the Illumina TM 450K) from the TCGA data base (normal samples from LUSC).
- Data set 32 (mesenchymal stromal cells from bone marrow) consists of 16 female samples (mean age 53, range 21-85) ⁇ 33 ⁇ .
- the MSC from human bone marrow were either isolated from bone marrow aspirates or from the caput femoris upon hip fracture of elderly donors ⁇ 33 ⁇ . Due to sample size constraints, cell passage status (reflecting short versus long term culture) was ignored.
- placenta From mothers of monozygotic and dizygotic twins ⁇ 34 ⁇ . Since placenta only develops during pregnancy, its chronological age was set to zero.
- Data set 34 (prostate) consists of 69 normal prostate samples (mean age 61) ⁇ 35 ⁇ .
- Data set 35 (prostate, normal adjacent tissue) measured on the Illumina TM 450K platform from the TCGA data base (PRAD data).
- Data set 36 (saliva from alcoholic males) is from ⁇ 36 ⁇ as data set 68, but involves 131 male samples (again with mean age 32, range 21-55). Thus, I split the original data by gender.
- Data set 37 saliva from healthy men involved 69 healthy male samples (mean age 35, range 21-55). We used these twin pairs and triplets to develop a saliva based predictor of age ⁇ 3 ⁇ . Since all twins were monozygotic, I could not use these data to estimate heritability with Falconer's formula.
- Data sets 38 (stomach normal adjacent tissue measured on the Illumina TM 27K array) consists of 41 samples (mean age 69) downloaded from TCGA data base (STAD data).
- Data set 39 thyroid, normal adjacent tissue measured on the Illumina TM 450K platform from the TCGA data base (THCA data).
- Data set 40 (WB from type 1 diabetics) consists of samples from 191 subjects (mean age 44, range 24-74) ⁇ 12, 37 ⁇ . Since all subjects had type 1 diabetes, disease status was ignored. These data were downloaded from GEO (GSE20067).
- Data set 41 (WB from healthy females) consists of 93 whole blood samples from women whose mean age was 63 (range 49-74) ⁇ 25 ⁇ . The samples were collected from different healthy females (both twin pairs and singletons).
- Data set 42 (WB from postmenopausal women) consists of 262 whole blood samples from women with ovarian cancer (mean age 66 , range 49-91). These are the cases from the UKOPS data (see data set 43). These samples were used since ovarian cancer did not have a global effect on blood methylation levels ⁇ 12, 37 ⁇ .
- Data set 43 (WB from healthy postmenopausal women) consists of 269 whole blood samples from women with a mean of 65 (range 52-78) ⁇ 12, 37 ⁇ . While the data come from the United Kingdom Ovarian Cancer Population Study (UKOPS), it is important to emphasize that the samples come from healthy age matched controls of ovarian cancer patients. The data were downloaded from GEO (GSE19711).
- Data set 45 (leukocytes from healthy children of the Simons Simple Collection) consists of peripheral blood leukocyte samples from 386 healthy (mostly male) subjects (mean age 10, range 3-17). These are healthy siblings of subjects with autism spectrum disorder (ASD) ⁇ 17 ⁇ .
- ASSD autism spectrum disorder
- Data set 46 (peripheral blood mononuclear cells from newborns and nonagenarians) ⁇ 39 ⁇ can be downloaded from GEO GSE30870.
- Data set 47 peripheral blood mononuclear cells collected from a community-based cohort stratified for early-life socioeconomic status ⁇ 40 ⁇ .
- the data were downloaded from GEO (GSE37008).
- GEO GEO
- the authors found that psychosocial factors, such as perceived stress, and cortisol output were associated with DNAm patterns, as was early-life socioeconomic status. But none of these factors turned out to be related to DNAm age which justified that these covariates were ignored in this study.
- Data set 48 (cord blood samples from newborns) comes from a study that related DNAm data to birth weight. Incidentally, DNAm age did not appear to be correlated with birth weight. No citation appears to be available for these data that were submitted to GEO (GSE36812) by N Turan and C Sapienza.
- Data set 49 (cord blood mononuclear cells) comes from a study that investigated the effects of periconceptional maternal micronutrient supplementation on infant blood methylation patterns from offspring of Gambian women enrolled into a randomized, double blind controlled trial ⁇ 41 ⁇ . No significant relationship between DNAm age and micronutrient supplementation status could be observed.
- Data set 50 (cord blood mononuclear cells) is from monozygotic and dizygotic twins ⁇ 34 ⁇ but twin status was ignored in our analysis.
- Data set 52 (CD4+T cells and CD14+monocytes) consisted of sorted CD4+ T-cells and CD14+ monocytes from blood of an independent cohort of 25 healthy subjects ⁇ 25 ⁇ .
- HGP Hutchinson-Gilford Progeria Syndrome
- Werner Syndrome are two premature aging diseases showing features of common aging. Mutations in LMNA and WRN genes are associated to disease onset; however for a subset of patients the underlying causative mechanisms remains elusive. In this study, the authors aimed to evaluate the role of epigenetic alteration on premature aging diseases by performing genome-wide DNAm profiling of HGP and WS patients. The authors analyzed Epstein-Bar virus (EBV) immortalized B cells, naive B-cells, and peripheral blood mononuclear cells.
- EBV Epstein-Bar virus
- Data set 54 (cerebellar samples) and data set 55 (occipital cortex samples) from autism cases and controls ⁇ 44 ⁇ .
- the authors collected idiopathic autistic and control cerebellar and BA19 (occipital) brain tissues. Here we ignored autism disease status. Incidentally, we could not detect an association between autism status and DNAm age.
- Data set 56 (breast, normal adjacent tissue, Illumina TM 450K) consists of normal breast tissue samples from 90 female breast cancer cases (mean age 57, range 28-90) from TCGA, but unlike data set 57 these samples were assayed on the Illumina TM 450K platform.
- Data set 57 (breast, normal adjacent tissue, Illumina TM 27K) consists of normal breast tissue samples from 27 female breast cancer cases (mean age 55, range 35-88) from the Cancer Genome Atlas (TCGA) data base (http://tcga-data.nci.nih.gov/).
- Data set 58 (buccal cells) from ⁇ 45 ⁇ .
- the authors performed a longitudinal study of DNA methylation at birth and age 18 months in DNA from buccal swabs from 10 monozygotic (MZ) and 5 dizygotic (DZ) twin pairs from the Peri/postnatal Epigenetic Twins Study (PETS) cohort.
- MZ monozygotic
- DZ dizygotic twin pairs from the Peri/postnatal Epigenetic Twins Study
- Data sets 59 colon normal adjacent tissue measured on the Illumina TM 450K array, downloaded from TCGA (COAD data).
- Data set 60 (adipose) from monozygotic Twins Discordant for Type 2 Diabetes. ⁇ 46 ⁇ .
- Monozygotic twins discordant for type 2 diabetes constitute an ideal model to study environmental contributions to type 2 diabetic traits. The authors aimed to examine whether global DNAm differences exist in major glucose metabolic tissues from twelve 53-80 year-old monozygotic discordant twin pairs. DNAm was measured by the Illumina TM HumanMethylation27 BeadChip in 22 (11 pairs) skeletal muscle and 10 (5 pairs) subcutaneous adipose tissue biopsies. Diabetes status was ignored in my analysis. I could find no significant evidence that disease status affects DNAm age in this small data set.
- Data set 61 (heart tissue) consists of only 6 human male samples (mean age 61, range 55-71) ⁇ 47 ⁇ . Clearly, larger sample sizes will be needed to evaluate this tissue.
- Data set 62 normal adjacent tissue from clear cell renal carcinoma consists of samples downloaded from the TCGA data base (KIRC) that were measured on the Illumina TM 27K platform.
- Data set 63 liver normal adjacent tissues measured on the Illumina TM 450K platform from the TCGA data base (LIHC data).
- Data sets 64 (lung, normal adjacent tissue) measured on the Illumina TM 450K arrays.
- the data consists of samples downloaded from TCGA data base (normal from LUAD).
- Data set 65 (muscle) from monozygotic Twins Discordant for Type 2 Diabetes ⁇ 46 ⁇ .
- Monozygotic twins discordant for type 2 diabetes constitute an ideal model to study environmental contributions to type 2 diabetic traits.
- the authors aimed to examine whether global DNAm differences exist in major glucose metabolic tissues from twelve 53-80 year-old monozygotic discordant twin pairs. DNAm was measured by the Illumina TM HumanMethylation27 BeadChip in 22 (11 pairs) skeletal muscle and 10 (5 pairs) subcutaneous adipose tissue biopsies. Diabetes status was ignored in my analysis. I could find no significant evidence that disease status affects DNAm age in this small data set.
- Data set 67 (placenta) from ⁇ 49 ⁇ . DNA from 20 third trimester early onset preeclampsia placentas and 20 gestational age matched controls.
- Data sets 68 (saliva) from alcoholic females involved 52 samples (mean age 32, range 21-55) ⁇ 36 ⁇ .
- Data set 69 (uterine cervix) involved cytologically normal cells from the uterine cervix of 152 women ⁇ 23, 50 ⁇ .
- Data set 70 (uterine endometrium normal adjacent tissue) measured on the Illumina TM 450K platform from the TCGA data base (UCEC data).
- Data set 72 (chimpanzees and humans) from ⁇ 47 ⁇ The authors used the Illumina TM 27K array to compare DNAm profiles in the following human and chimpanzee tissue samples: 6 human livers, 6 human kidneys, 6 human heart, 6 chimpanzee livers, 6 chimpanzee kidneys, and 6 chimpanzee hearts.
- Data set 73 (ape blood) from ⁇ 51 ⁇ .
- the authors applied the Illumina TM 450K arrays to blood derived DNA from humans, chimpanzees, bonobos, gorillas and orangutans. Since ages were not available for humans and orangutans, I focused on chimpanzees, bonobos, gorillas for whom ages were available.
- Data set 74 (sperm) from ⁇ 52 ⁇ .
- the authors performed a genome-wide analysis of sperm DNA isolated from 21 men with a range of semen parameters presenting to a tertiary male reproductive health clinic. DNAm was measured with the Illumina TM Infinium array at 27,000 CpG loci.
- Data set 75 (sperm) from ⁇ 53 ⁇ .
- the authors applied the 450K platform to DNA derived from 26 normal sperm samples.
- Data set 76 (vascular endothelial cells from human umbilical cords) from monozygotic and dizygotic twins ⁇ 34 ⁇ .
- Data sets 77 and 78 involved human embryonic stem cells, iPS cells, and somatic cell samples measured on the Illumina TM 27K array and Illumina TM 450K array, respectively ⁇ 54 ⁇ . Although no specific age information was available, these two valuable data sets could be used a) to compare adult somatic tissues versus fetal somatic tissues, b) to compare the DNAm ages of different tissues from the same individual ( Figure 3 ), c) to assess the variance of methylation probes across adult somatic tissues and fetal somatic tissues, d) to study how the DNAm age of iPS cells compares to that of somatic primary tissue and primary cell lines ( Figure 6 ), e) to evaluate how cell passaging effects DNAm age ( Figure 6 ).
- Data set 78 contained multiple tissue samples from two adults.
- tissue samples from two adults.
- Aorta (2) Bladder (2)
- Blood (2) Brain (3)
- Breast (1) Colon (1)
- Diaphragm (2) Duodenum (1)
- human embryonic stem (ES) cells
- Data set 79 (reprogrammed mesenchymal stromal cells from human bone marrow (iP-MSC), initial MSC, and embryonic stem cells) ⁇ 55 ⁇ .
- the authors reprogrammed mesenchymal stromal cells from human bone marrow (iP-MSC) and compared their DNAm profiles with initial MSC and embryonic stem cells (ESCs) using the Illumina TM 450K array.
- the data were downloaded from GEO (GSE37066).
- Data set 80 (hESC and normal primary tissue) from ⁇ 56 ⁇ .
- the authors extracted DNA from the following well-characterized human embryonic stem cell (hESC)lines: SHEF-1, SHEF-4, SHEF-5, SHEF-7, H7, H14, H14S9, H7S14, HS181 and 13.
- the authors used DNA from human normal primary tissues provided by Biochain (Hayward, CA, USA).
- Data set 81 (hESC) from ⁇ 57 ⁇ .DNA derived from H9, H13C, SHEF2 hESC cultured in two different media. The medium was not significantly related with DNAm age estimate.
- PBMC peripheral blood mononuclear cells
- the training data should represent a wide spectrum of tissues and cell types.
- the training data involved blood (whole blood, cord blood, PBMCs), brain (cerebellum, frontal cortex, pons, prefrontal cortex, temporal cortex, neurons and glial cells), breast, buccal epithelium, cartilage, colon, dermal fibroblasts, epidermis, gastric tissue, head/neck tissue, heart, kidney, liver, lung, mesenchymal stromal cells, prostate, saliva, stomach, thyroid, etc.
- the individual training sets should have a similar age distribution.
- the training data should contain a high proportion of samples (37%) measured on the Illumina TM 450K platform since many on-going studies use this recent Illumina TM platform. Incidentally, 34% of test set samples were measured on the 450K platform.
- I only studied 21369 probes measured with the Infinium type II assay which satisfied the following criteria: a) they were present on both Illumina TM platforms (Infinium 450K and 27K) and b) had fewer than 10 missing values.
- Data set 3 (glioblastoma multiforme, GBM) measured on the Illumina TM 450K array from ⁇ 59 ⁇ (GEO identifier GSE36278).
- Data set 4 (breast cancer) measured on the Illumina TM 27K array from ⁇ 60 ⁇ (GEO identifier GSE31979).
- Data set 5 (breast cancer) measured on the Illumina TM 27K array from ⁇ 61 ⁇ (GEO identifier GSE20712).
- Data set 6 (breast cancer) measured on the Illumina TM 27K array from ⁇ 23 ⁇ (GEO identifier GSE33510).
- Data set 10 (colorectal cancer) measured on the Illumina TM 27K array from ⁇ 62 ⁇ (GEO identifier GSE25062).
- Data set 23 (prostate cancer) measured on the Illumina TM 27K array from ⁇ 35 ⁇ (GEO identifier GSE26126).
- Data set 30 (urothelial carcinoma) measured on the Illumina TM 27L array from ⁇ 63 ⁇ .
- AML acute myeloid leukemia
- BLCA bladder urothelial carcinoma
- CEC cervical squamous cell carcinoma and endocervical adenocarcinoma
- COAD colon adenocarcinoma
- HNSC liver hepatocellular carcinoma
- LIHC liver hepatocellular carcinoma
- KIRC kidney renal clear cell carcinoma
- KIRP kidney renal papillary cell carcinoma
- OVAR liver ovarian serous cystadenocarcinoma
- PRAD prostate adenocarcinoma
- READ rectum adenocarcinoma
- SARC thyroid carcinoma
- THCA skin cutaneous melanoma
- SKCM skin cutaneous melanoma
- UCEC uterine corpus endometrioid carcinoma
- Methylation analysis was performed either using the Illumina TM Infinium Human Methylation27 BeadChip ⁇ 64 ⁇ or the Illumina TM Infinium HumanMethylation450 BeadChip.
- the Illumina TM HumanMethylation27 BeadChips measures bisulfite-conversion-based, single-CpG resolution DNAm levels at 27,578 different CpG sites within 5' promoter regions of 14,475 well-annotated genes in the human genome. Data from the two platforms were merged by focusing on the roughly 26k CpG sites that are present on both platforms.
- the HumanMethylation27 BeadChip mainly represents specific CpG that are located near gene promoter regions.
- the mean inter-array correlation was used to measure how similar (correlated) a given sample is compared to the remaining samples of the data set. To ensure high quality data without technical artifacts, non-cancer samples were only used if their mean inter-array correlation was larger than 0.90 and if their maximum DNAm level (across all probes) was larger than 0.96. This filtering step was not applied to the cancer samples since it is well known that cancer greatly affects the DNAm levels. It is worth mentioning that my results would barely change if all samples had been used.
- BMIQ Beta MIxture Quantile dilation
- I created another gold standard by forming the mean DNAm value in the largest single study of this article (data set 1, i.e. whole blood samples from ⁇ 13 ⁇ ).
- data set 1 i.e. whole blood samples from ⁇ 13 ⁇ .
- I adapted the BMIQ R function from Teschendorff et al (2013) ⁇ 68 ⁇ so that it would rescale the overlapping 21k probes of each array so that their distribution matched that of the new gold standard.
- My empirical studies showed that this pre-processing step improved the accuracy of the resulting age predictor especially when it comes to the median error.
- the parameter adult.age was set to 20 for humans (different values can also be chosen) and 15 for chimpanzees. Note that F satisfies the following desirable properties: it
- the function F is visualized by a red line. As expected, the red line passes through the weighted average of the CpGs (i.e. the linear part of the regression model).
- the inverse of the function F denoted by inverse.F, is used to transform the linear part of the regression model into DNAm age.
- An elastic net regression model (implemented in the glmnet R function) was used to regress a transformed version of age on the roughly 21k beta values in the training data.
- DNAmAge inverse . F b 0 + b 1 CpG 1 + ... + b 354 CpG 354
- the regression model can be used to predict to transformed age value by simply plugging the beta values of the selected CpGs into the formula.
- the linear part, i.e. the weighted average of the selected CpGs
- the red line is visualized as a red line.
- the glmnet function requires the user to specify two parameters (alpha and beta). Since I used an elastic net predictor, alpha was set to 0.5. But the lambda value of 0.02255706 was chosen by applying a 10 fold cross validation to the training data (via the R function cv.glmnet).
- HI ES embryonic stem cells
- K562 erythrocytic leukemia cells
- GM12878 B-lymphoblastoid cells
- HepG2 hepatocellular carcinoma cells
- HAVEC umbilical vein endothelial cells
- HSMM skeletal muscle myoblasts
- NHLF normal lung fibroblasts
- NHEK normal epidermal keratinocytes
- HMEC mammary epithelial cells
- the major strength of the proposed multi-tissue age predictor lies in its wide applicability: for most tissues it will not require any adjustments or offsets.
- the proposed multi-tissue age predictor greatly outperforms the predictors by ⁇ 2, 3 ⁇ as detailed below. I could not directly evaluate the predictor by ⁇ 16 ⁇ since a) only seven out of its 71 CpGs are represented on the Illumina TM 27K platform, b) it included gender and body mass index as covariates. However, I was able to evaluate the performance of a sparse version of the published predictor by using the seven overlapping CpGs that could be found on both Illumina TM platforms.
- the aging model from ⁇ 16 ⁇ was trained on whole blood, which is a noteworthy advantage when it comes to the design of practical diagnostics and for testing blood samples collected from other studies.
- it also included clinical parameters such as gender and body mass index as covariates.
- the first measure of tissue variance used analysis of variance (ANOVA) across the training data sets.
- ANOVA analysis of variance
- the regression model included age as covariate since the analysis needed to adjust for the fact that different data sets had different age distributions.
- ANOVA allowed me to calculate an F statistic for tissue effect which takes on a large value for CpGs that vary greatly across the different training set tissues.
- the second and third measure of tissue variance were defined using the adult somatic tissues and the fetal somatic tissues, respectively, from ⁇ 54 ⁇ (data set 77).
- the mean DNAm age (predicted age) of fetal somatic tissues is close to zero, i.e. it is much lower than that of adult somatic tissues in this data set, which again validates the age predictor.
- the publicly available microarray data sets involved mainly healthy individuals (in particular no cancer samples were considered).
- the data from a study of post-menopausal women (the NOWAC data).
- SAFHS San Antonio Family Heart Study
- individuals were ascertained from probands meeting two criteria: 1) having a living spouse and 2) having six first-degree relatives 16 years or older in the San Antonio area - excluding parents. While this data set was used to study cardiovascular phenotypes, the data was obtained without selection bias towards these traits, and therefore can be considered a random sampling.
- the Chaussabel data set was originally published by Pankla, et al. ⁇ 72 ⁇ and was used to study melioidosis. 67 whole blood samples were hybridized to Illumina TM Sentrix Human-6 V2 BeadChip arrays with 12,483 genes. Background subtraction and average normalization was performed using Illumina TM BeadStudio version 2 software, and standard normalization for one-color array data was performed using Gene-Spring GX7.3 software (Agilent Technologies) by the original authors. This data set consisted of 35 men and 32 women between the ages of 18 and 74. I also used healthy postmenopausal women from the Norwegian Women and Cancer (NOWAC)study ⁇ 73 ⁇ .
- the whole blood data were measured using AB Human Genome Survey Microarray V2.0 with 16,753 genes. For sets of technical replicates, arrays with the least number of probes with a S/N > 3 were excluded. Arrays with less than 40% of probes with a S/N ⁇ 3 were removed. Probes with an S/N > 3 in less than 50% of samples were excluded. Log (base 2) transformation, quantile normalization and imputation was performed. I furthermore excluded samples using an iterative process of removing samples with average interarray correlation ⁇ 2 SD ultimately resulting in 245 samples. Age ranges of ⁇ 48,53), ⁇ 53,58) and ⁇ 58,63 ⁇ were given, and I used for the analysis corresponding ages of 50, 55 and 60.
- CD8+ T cell data set from Cao, et al. ⁇ 74 ⁇ Affymetrix HG-U133A_2 Gene Arrays were used to explore the expression profiles of three male and six female donors whose ages ranged from 23 to 81.
- Microarray Suite Version 5.0 (MAS 5.0; Affymetrix) was used to quantify the expression levels of 12,483 genes.
- Affymetrix HG-U133 plus 2.0 arrays (log transformed MAS5 data) were used to explore the expression profiles of human CD8+ naive T cells (TN), central memory (TCM), effector memory (TEM), and effector memory RA (TEMRA) CD8+ T cells.
- TN can be regarded as peripheral stem cells, while TEM and TEMRA are differentiated cells with effector function.
- the original data set contained 4 replicates (i.e. there were 16 arrays). Since one of the central memory samples had very low interarray correlation with the other samples, I removed this potential outlier from the analysis.
- a Student t-test of differential expression was used to compare expression levels in naive CD8+ cells versus the memory T cells.
- the first brain data set was previously analyzed by Lu, et al. ⁇ 78 ⁇ . 30 frontal lobe samples were hybridized to Affymetrix HG-U95Av2 oligonucleotide arrays with 8,760 genes. Arrays were normalized by Lu, et al. using dChip V1.3 software, and after using the aforementioned iterative process of removing samples with average interarray correlation ⁇ 2 SD below the mean I obtained 25 samples. This data set consisted of 16 men and 9 women between ages 26 and 91.
- the second cortical brain data set was previously analyzed by Myers, et al. ⁇ 79 ⁇ .
- the Illumina TM HumanRef-8 Expression BeadChip was utilized, and expression profiles were rank-invariant normalized using Illumina TM BeadStudio software. I utilized a iterative normalization process and removed 25 samples for a total of 168 samples and 19,880 genes. This data set consisted of 92 men and 76 women between ages 65 and 100.
- the third cortical brain data set was previously analyzed by Oldham, et al. ⁇ 80 ⁇ .Affymetrix HG-U95Av2 microarrays were used. Quantile normalization was utilized. Ultimately I identified 7763 genes in 67 individuals.
- This data set consisted of 48 men and 19 women between ages 22 and 81.
- the kidney data sets were previously analyzed by Rodwell, et al. ⁇ 81 ⁇ . I utilized data from HG-U133A high-density oligonucleotide arrays; Rodwell, et al. normalized data using the dChip program according to the stable invariant set, and I further processed using the normalization and iterative outlier removal process. These normalization and outlier detection procedures resulted in 63 kidney cortex samples and 52 kidney medulla samples. There were 12,606 genes in both data sets. The kidney cortex data set consisted of 35 men and 26 women between ages 27 and 87, and the kidney medulla data set consisted of 29 men and 23 women between ages 29 and 92.
- the muscle data set was previously analyzed by Zahn, et al. ⁇ 82 ⁇ . 81 samples were hybridized to Affymetrix HG-U133 2.0 Plus high-density oligonucleotide arrays. The authors used the DChip program to normalize the data. I omitted 10 samples using the iterative normalization and outlier removal process, resulting in 71 samples and 19,621 genes. This data set consisted of 39 men and 32 women between ages 16 and 89.
- I describe how I obtained the Pearson correlation coefficient, the corresponding t-test statistic Z in each data set, the metaZ statistics summarizing correlation test statistics across multiple data, a corresponding empirical p-value (pMetaZ).
- r s the Pearson correlation coefficient (e.g. between age and the gene expression profile) in the s-th data set.
- metaZ follows approximately a standard normal distribution if each individual Z s follows approximately a standard normal distribution since the data sets are independent. Second, even if individual Z statistics do not follow a normal distribution, one can invoke the central limit theorem if many independent data sets are being considered.
- DNAm age probably meets criterion 4 if chimpanzees are acceptable as lab animals (given my results in Figure 4 ). There is a good chance that it meets criterion 3 (given my results in blood, saliva, buccal cells, skin) and criterion 2 (see my EMS model of DNAm age and the vast literature on aging effects on DNA methylation levels). Large cohort studies will be very valuable for addressing criterion 1. These studies need to test whether a measure of DNAm based age acceleration will, in the absence of disease, better predict functional capability than chronological age ⁇ 86 ⁇ .
- This example provides information on the multi-tissue age predictor defined using the training set data.
- the multi-tissue age predictor uses 354 CpGs of which 193 and 160 have positive and negative correlations with age, respectively.
- the table also represents the coefficient values for the shrunken new predictor that is based on a subset of 110 CpGs (a subset of the 354 CpGs). Although this information is sufficient for predicting age, the software posted on [45] is recommended.
- the table reports a host of additional information for each CpG including its variance, minimum value, maximum value, and median value across all training and test data. Further, it reports the median beta value in subjects younger than 35 and in subjects older than 55.
- This example describes 32 publicly available cancer tissue data sets and 7 cancer cell line data sets.
- Column 1 reports the data number and corresponding color code.
- Other columns report the affected tissue, Illumina TM platform, sample size n, proportion of females, median age, age range (minimum and maximum age), relevant citation (TCGA or first author with publication year), and public availability. None of these data sets were used in the construction of estimator of DNAm age.
- the table also reports the age correlation, cor(Age,DNAmage), median error, and median age acceleration.
- the epigenetic clock was applied to many different cancer types and cancer data sets.
- the last columns of Example 10 show that DNAm age has only a weak relationship with chronological age in cancer tissue.
- This example reports the DNAm age and age acceleration for 59 cancer cell lines.
- the epigenetic clock was applied to many different cancer cell lines. It turns out that the DNAm age changes greatly across cell lines.
Landscapes
- Chemical & Material Sciences (AREA)
- Life Sciences & Earth Sciences (AREA)
- Proteomics, Peptides & Aminoacids (AREA)
- Organic Chemistry (AREA)
- Analytical Chemistry (AREA)
- Zoology (AREA)
- Wood Science & Technology (AREA)
- Health & Medical Sciences (AREA)
- Engineering & Computer Science (AREA)
- Microbiology (AREA)
- Immunology (AREA)
- Molecular Biology (AREA)
- Biotechnology (AREA)
- Biophysics (AREA)
- Physics & Mathematics (AREA)
- Biochemistry (AREA)
- Bioinformatics & Cheminformatics (AREA)
- General Engineering & Computer Science (AREA)
- General Health & Medical Sciences (AREA)
- Genetics & Genomics (AREA)
- Measuring Or Testing Involving Enzymes Or Micro-Organisms (AREA)
- Investigating Or Analysing Biological Materials (AREA)
Claims (8)
- Verfahren zum Bestimmen eines Alters einer biologischen Probe, wobei das Verfahren Folgendes umfasst:selektives Messen der Methylierungsniveaus einer Reihe von Methylierungsmarkern in genomischer DNA der biologischen Probe, wobei die Reihe von Methylierungsmarkern die 6 CpG-Methylierungsmarker in Tabelle 7 umfasst; undVergleichen der gemessenen Methylierungsmarker-Niveaus mit Referenz-Niveaus für die Methylierungsmarker, um das Alter der Probe basierend auf den Methylierungsniveaus zu bestimmen.
- Verfahren nach Anspruch 1, wobei:(a) die biologische Probe eine Festgewebe-, Blut-, Urin-, Stuhl-, Speichel-, Epidermis-, Hirn-, Nieren- oder Leberprobe ist, die genomische DNA umfasst;(b) die biologische Probe eine Probe ist, die Gewebekulturzellen oder pluripotente Stammzellen umfasst;(c) Bestimmen des Alters der biologischen Probe das Anwenden eines Algorithmus zur statistischen Vorhersage auf die gemessenen Methylierungsmarker-Niveaus umfasst; wobei optional das Bestimmen des Alters der biologischen Probe Folgendes umfasst(a) Erhalten einer Linearkombination der Methylierungsmarker-Niveaus und(b) Anwenden einer Transformation auf die Linearkombination, um das Alter der biologischen Probe zu bestimmen;(d) die Reihe von Methylierungsmarkern Marker in jedem der Gene aus Tabelle 3 umfasst; optional an den CpG-Positionen aus Tabelle 3;(e) Messen eines Methylierungsniveaus einer Reihe von Methylierungsmarkern die Behandlung von genomischer DNA aus der Probe mit Bisulfit umfasst, um unmethylierte Cytosine von CpG-Dinukleotiden zu Uracil umzuwandeln; oder(f) das Alter eines Individuums basierend auf dem Alter der biologischen Probe bestimmt wird.
- Kit, umfassend Sonden zum Erfassen von Methylierungsmarkern, die jeweils aus den CpG-Positionen aus Tabelle 3 bestehen.
- Verfahren nach Anspruch 1, ferner umfassen das Berichten des Alters der Probe.
- Verfahren nach Anspruch 4, wobei das Berichten das Herstellen eines geschriebenen oder elektronischen Berichts umfasst.
- Materieller, computerlesbarer Datenträger, umfassend einen computerlesbaren Code, der, wenn er durch einen Computer ausgeführt wird, verursacht, dass der Computer Vorgänge durchführt, die Folgendes umfassen:a) Empfangen von Informationen, die den Methylierungsniveaus einer Reihe von Methylierungsmarkern in einer biologischen Probe entsprechen, wobei die Marker die 6 CpG-Methylierungsmarker in Tabelle 7 umfassen; undb) Bestimmen des Alters der biologischen Probe durch Vergleichen der gemessenen Methylierungsmarker-Niveaus mit Referenz-Markerniveaus und durch Anwenden eines Algorithmus zur statistischen Vorhersage auf die gemessenen Methylierungsmarker-Niveaus.
- Materieller, computerlesbarer Datenträger nach Anspruch 6, wobei:(a) die Referenz-Niveaus auf dem materiellen, computerlesbaren Datenträger gespeichert werden;(b) das Empfangen der Informationen das Empfangen von Informationen von einer materiellen Datenspeichervorrichtung umfasst, die den Methylierungsniveaus der Reihe von Methylierungsmarkern in der biologischen Probe entsprechen;(c) der materielle, computerlesbare Datenträger ferner computerlesbaren Code umfasst, der, wenn er durch einen Computer ausgeführt wird, verursacht, dass der Computer einen oder mehrere zusätzliche Vorgänge durchführt, umfassend: Senden von Informationen, die den Methylierungsniveaus der Reihe von Metyhlierungsmarkern in der biologischen Probe entsprechen, an eine materielle Datenspeichervorrichtung; oder(d) Bestimmen des Alters der biologischen Probe das Anwenden eines linearen Regressionsmodells umfasst, um das Probenalter basierend auf einem gewichteten Durchschnitt der Methylierungsmarker-Niveaus zuzüglich eines Versatzes vorherzusagen.
- Verfahren nach Anspruch 1 oder materieller, computerlesbarer Datenträger nach Anspruch 6, wobei die Reihe von Methylierungsmarkern aus den 354 CpG-Methylierungsmarkern aus Tabelle 3 besteht.
Applications Claiming Priority (2)
| Application Number | Priority Date | Filing Date | Title |
|---|---|---|---|
| US201361883875P | 2013-09-27 | 2013-09-27 | |
| PCT/US2014/058089 WO2015048665A2 (en) | 2013-09-27 | 2014-09-29 | Method to estimate the age of tissues and cell types based on epigenetic markers |
Publications (2)
| Publication Number | Publication Date |
|---|---|
| EP3049535A2 EP3049535A2 (de) | 2016-08-03 |
| EP3049535B1 true EP3049535B1 (de) | 2021-12-01 |
Family
ID=51799299
Family Applications (1)
| Application Number | Title | Priority Date | Filing Date |
|---|---|---|---|
| EP14789914.0A Active EP3049535B1 (de) | 2013-09-27 | 2014-09-29 | Verfahren zur schätzung des alters von geweben und zelltypen auf basis epigenetischer marker |
Country Status (4)
| Country | Link |
|---|---|
| US (1) | US20160222448A1 (de) |
| EP (1) | EP3049535B1 (de) |
| CN (1) | CN105765083B (de) |
| WO (1) | WO2015048665A2 (de) |
Families Citing this family (57)
| Publication number | Priority date | Publication date | Assignee | Title |
|---|---|---|---|---|
| WO2010037001A2 (en) | 2008-09-26 | 2010-04-01 | Immune Disease Institute, Inc. | Selective oxidation of 5-methylcytosine by tet-family proteins |
| AU2012291873B2 (en) | 2011-07-29 | 2016-03-10 | Cambridge Epigenetix Limited | Methods for detection of nucleotide modification |
| US10563248B2 (en) | 2012-11-30 | 2020-02-18 | Cambridge Epigenetix Limited | Oxidizing agent for modified nucleotides |
| GB201403216D0 (en) | 2014-02-24 | 2014-04-09 | Cambridge Epigenetix Ltd | Nucleic acid sample preparation |
| WO2017120443A1 (en) * | 2016-01-07 | 2017-07-13 | Cedars-Sinai Medical Center | Method to identify key markers of human pluripotent cell-derived somatic cells that predict molecular similarity to in vivo target cells |
| WO2017136482A1 (en) | 2016-02-01 | 2017-08-10 | The Board Of Regents Of The University Of Nebraska | Method of identifying important methylome features and use thereof |
| WO2018027228A1 (en) * | 2016-08-05 | 2018-02-08 | The Regents Of The University Of California | Dna methylation based predictor of mortality |
| KR101873303B1 (ko) * | 2017-01-24 | 2018-07-02 | 연세대학교 산학협력단 | 타액 내 dna 메틸화를 이용한 연령 예측 방법 |
| CN110392740A (zh) * | 2017-01-25 | 2019-10-29 | 深圳华大生命科学研究院 | 确定人群样本生物指标集、预测生物学年龄的方法及其应用 |
| ES2893103T3 (es) * | 2017-06-12 | 2022-02-08 | Beiersdorf Ag | Determinación de la edad de un individuo humano |
| JP7015510B2 (ja) * | 2017-06-21 | 2022-02-03 | 日本メナード化粧品株式会社 | 老化度を評価する方法及び老化度の評価用キット |
| US11999995B2 (en) | 2017-08-31 | 2024-06-04 | The Regents Of The University Of California | Methylome profiling in animals and uses thereof |
| US20200270683A1 (en) * | 2017-09-26 | 2020-08-27 | Brown University | Methods for obtaining embryonic stem cell dna methylation signatures |
| CN109593862B (zh) * | 2017-09-28 | 2022-04-15 | 公安部物证鉴定中心 | 一种获得中国人群男性个体年龄的方法和系统 |
| US11636309B2 (en) | 2018-01-17 | 2023-04-25 | Unlearn.AI, Inc. | Systems and methods for modeling probability distributions |
| WO2019143845A1 (en) * | 2018-01-17 | 2019-07-25 | The Regents Of The University Of California | Phenotypic age and dna methylation based biomarkers for life expectancy and morbidity |
| CN108847284B (zh) * | 2018-05-02 | 2021-03-23 | 莱博生物科技股份有限公司 | 人体生物年龄测算装置及系统 |
| WO2019232320A1 (en) * | 2018-05-31 | 2019-12-05 | The Regents Of The University Of California | Dna methylation biomarker of aging for human ex vivo and in vivo studies |
| EP3775275A1 (de) * | 2018-06-15 | 2021-02-17 | Unilever PLC | Epigenetisches verfahren zur abschätzung des intrinsischen hautalters |
| US20210207214A1 (en) * | 2018-06-15 | 2021-07-08 | Conopco, Inc.., d/b/a UNILEVER | Epigenetic method to estimate the extrinsic age of skin |
| WO2020037222A1 (en) * | 2018-08-17 | 2020-02-20 | President And Fellows Of Harvard College | Methods for measuring ribosomal methylation age |
| CA3113551A1 (en) * | 2018-10-08 | 2020-04-16 | Thomas J.C. Matzen Gmbh | Method and devices for age determination |
| CN111041104B (zh) * | 2018-10-11 | 2022-09-16 | 博尔诚(北京)科技有限公司 | 用于评估目标对象衰老状况以及用于评估制品抗衰老作用的组合物及其用途 |
| CN109712712B (zh) * | 2018-12-13 | 2024-12-10 | 深圳平安医疗健康科技服务有限公司 | 一种健康评估方法、健康评估装置及计算机可读存储介质 |
| KR102170423B1 (ko) * | 2019-02-19 | 2020-10-27 | 바이오코아 주식회사 | 체액을 이용한 연령 추적 방법 |
| CN111763742A (zh) * | 2019-04-02 | 2020-10-13 | 深圳华大法医科技有限公司 | 甲基化标志物及确定个体年龄的方法和应用 |
| CN110387414B (zh) * | 2019-07-19 | 2022-09-30 | 广州市达瑞生物技术股份有限公司 | 一种利用外周血游离dna预测妊娠期糖尿病的模型 |
| TWI862641B (zh) | 2019-07-22 | 2024-11-21 | 美商第一美膚公司 | 具有抗老化功效之多肽及其用途 |
| US12051487B2 (en) | 2019-08-23 | 2024-07-30 | Unlearn.Al, Inc. | Systems and methods for supplementing data with generative models |
| US12008478B2 (en) | 2019-10-18 | 2024-06-11 | Unlearn.AI, Inc. | Systems and methods for training generative models using summary statistics and other constraints |
| WO2021115612A1 (en) * | 2019-12-13 | 2021-06-17 | Evonik Operations Gmbh | A chicken methylation clock |
| EP4165203A4 (de) * | 2020-06-12 | 2024-07-17 | President and Fellows of Harvard College | Zusammensetzungen und verfahren zur analyse der dna-methylierung |
| CN114067913B (zh) * | 2020-07-31 | 2022-09-16 | 中国农业科学院深圳农业基因组研究所 | 预测猪日龄的生物标志物及预测方法 |
| WO2022058980A1 (en) | 2020-09-21 | 2022-03-24 | Insilico Medicine Ip Limited | Methylation data signatures of aging and methods of determining a methylation aging clock |
| GB202018286D0 (en) | 2020-11-20 | 2021-01-06 | Randox Laboratories Ltd | Methods for use in preventative healthcare |
| EP4256516A4 (de) * | 2020-12-04 | 2024-10-30 | Sanford Burnham Prebys Medical Discovery Institute | Mikroskopische bildgebung und analysen einer epigenetischen landschaft |
| WO2022169394A1 (en) | 2021-02-02 | 2022-08-11 | Lerm Maria | Biomarker for detection of mycobacterial exposure and infection |
| CN113373236B (zh) * | 2021-02-19 | 2021-12-31 | 中国科学院北京基因组研究所(国家生物信息中心) | 一种获得中国人群个体年龄的方法 |
| CN112813159B (zh) * | 2021-03-23 | 2023-05-30 | 广州金域医学检验中心有限公司 | 帕金森病的生物标志物及其应用 |
| WO2022272120A1 (en) * | 2021-06-25 | 2022-12-29 | The Regents Of The University Of California | Epigenetic clocks |
| EP4120278A1 (de) | 2021-07-16 | 2023-01-18 | Shift Bioscience Ltd. | Prädiktor von temporären eigenschaften |
| WO2023148198A1 (en) | 2022-02-07 | 2023-08-10 | Evonik Operations Gmbh | An epigentic clock for the galliformes family |
| CN114395621B (zh) * | 2022-02-28 | 2023-05-02 | 上海市第一人民医院 | Adad2基因在制备检测非梗阻性无精子症诊断试剂盒中的应用 |
| CN114774557B (zh) * | 2022-03-02 | 2024-11-26 | 华中科技大学 | 用于推断中国汉族人群个体年龄的组合标志物及其应用 |
| CN115240761A (zh) * | 2022-04-02 | 2022-10-25 | 浙江大学 | 一种基于dna甲基化的生物学年龄预测模型的构建方法 |
| GB2622371B (en) * | 2022-09-13 | 2025-07-23 | Agecurve Ltd | Cell tree rings: Method and cell lineage tree based aging timer for calculating biological age of biological sample |
| WO2024081421A1 (en) * | 2022-10-13 | 2024-04-18 | Buck Institute For Research On Aging | Epigenetic clock |
| WO2024112741A1 (en) * | 2022-11-23 | 2024-05-30 | Salk Institute For Biological Studies | Dna methylation barcodes for identifying brain cells |
| WO2024121349A1 (en) | 2022-12-08 | 2024-06-13 | Oncopeptides Ab | Therapeutic treatment for haematological cancer based on the level of t-cell function |
| WO2024151981A1 (en) * | 2023-01-12 | 2024-07-18 | Loma Linda University | Systems and methods for biological age prediction |
| US12020789B1 (en) | 2023-02-17 | 2024-06-25 | Unlearn.AI, Inc. | Systems and methods enabling baseline prediction correction |
| US11966850B1 (en) | 2023-02-22 | 2024-04-23 | Unlearn.AI, Inc. | Systems and methods for training predictive models that ignore missing features |
| WO2024182756A2 (en) * | 2023-03-02 | 2024-09-06 | The Broad Institute, Inc. | Cell-specific cis-regulatory elements, uses thereof, and methods of generating the same |
| CN116941569B (zh) * | 2023-07-03 | 2025-09-16 | 中国农业大学 | 利用精子表观遗传时钟预测公牛年龄的装置、方法及计算机可读存储介质与应用 |
| WO2025114892A1 (en) * | 2023-11-30 | 2025-06-05 | Société des Produits Nestlé S.A. | Method for generating a biological clock comprising a dna methylation profile |
| CN118553311A (zh) * | 2024-04-01 | 2024-08-27 | 普迪特(泰州)生物科技有限公司 | 一种利用精子表观遗传时钟预测提供者年龄的方法 |
| CN119464501B (zh) * | 2025-01-14 | 2025-08-08 | 杭州联川生物技术股份有限公司 | 基于甲基化标志物组合诊断或预测乳腺癌的系统、设备或介质 |
Family Cites Families (3)
| Publication number | Priority date | Publication date | Assignee | Title |
|---|---|---|---|---|
| US7001769B2 (en) * | 2000-09-08 | 2006-02-21 | Seoul National University Industry Foundation | Nucleic acid sequences and proteins involved in cellular senescence |
| EP2813580A1 (de) * | 2006-10-13 | 2014-12-17 | Metabolon, Inc. | Mit metabolischem Alter verbundene Biomarker und Verfahren zur Verwendung davon |
| WO2010086663A2 (en) * | 2009-01-30 | 2010-08-05 | University Of Southampton | Predictive use of cpg methylation |
-
2014
- 2014-09-29 EP EP14789914.0A patent/EP3049535B1/de active Active
- 2014-09-29 US US15/025,185 patent/US20160222448A1/en not_active Abandoned
- 2014-09-29 WO PCT/US2014/058089 patent/WO2015048665A2/en not_active Ceased
- 2014-09-29 CN CN201480065105.3A patent/CN105765083B/zh active Active
Non-Patent Citations (1)
| Title |
|---|
| None * |
Also Published As
| Publication number | Publication date |
|---|---|
| CN105765083A (zh) | 2016-07-13 |
| WO2015048665A3 (en) | 2015-06-04 |
| EP3049535A2 (de) | 2016-08-03 |
| WO2015048665A2 (en) | 2015-04-02 |
| US20160222448A1 (en) | 2016-08-04 |
| CN105765083B (zh) | 2021-05-04 |
Similar Documents
| Publication | Publication Date | Title |
|---|---|---|
| EP3049535B1 (de) | Verfahren zur schätzung des alters von geweben und zelltypen auf basis epigenetischer marker | |
| Zhou et al. | DNA methylation dynamics and dysregulation delineated by high-throughput profiling in the mouse | |
| Fernández et al. | H3K4me1 marks DNA regions hypomethylated during aging in human stem and differentiated cells | |
| Tajuddin et al. | Novel age-associated DNA methylation changes and epigenetic age acceleration in middle-aged African Americans and whites | |
| US10718025B2 (en) | Methods for predicting age and identifying agents that induce or inhibit premature aging | |
| US10435743B2 (en) | Method to estimate age of individual based on epigenetic markers in biological sample | |
| Pérez et al. | Longitudinal genome-wide DNA methylation analysis uncovers persistent early-life DNA methylation changes | |
| Horvath | DNA methylation age of human tissues and cell types | |
| Turan et al. | DNA methylation differences at growth related genes correlate with birth weight: a molecular signature linked to developmental origins of adult disease? | |
| CN102165456B (zh) | 表征来自于遗传物质样品的序列的方法 | |
| Martino et al. | Longitudinal, genome-scale analysis of DNA methylation in twins from birth to 18 months of age reveals rapid epigenetic change in early life and pair-specific effects of discordance | |
| Cao et al. | High-resolution analyses of human sperm dynamic methylome reveal thousands of novel age-related epigenetic alterations | |
| EP3169813B1 (de) | Methylierungsmusteranalyse von gewebe in einem dna-gemisch | |
| Qin et al. | Ultra deep sequencing detects a low rate of mosaic mutations in tuberous sclerosis complex | |
| Jin et al. | Genome-wide DNA methylation changes in skeletal muscle between young and middle-aged pigs | |
| EP2764122B1 (de) | Verfahren und vorrichtungen zur bewertung des risikos einer angenommenen auswirkung der entwicklung eines zustands | |
| Souren et al. | Adult monozygotic twins discordant for intra-uterine growth have indistinguishable genome-wide DNA methylation profiles | |
| Urdinguio et al. | Longitudinal study of DNA methylation during the first 5 years of life | |
| Rochtus et al. | DNA methylation analysis of Homeobox genes implicates HOXB7 hypomethylation as risk factor for neural tube defects | |
| Kim et al. | Recent omics technologies and their emerging applications for personalised medicine | |
| WO2015081110A2 (en) | Method for predicting congenital heart defect | |
| Gordevičius et al. | Identification of fetal unmodified and 5-hydroxymethylated CG sites in maternal cell-free DNA for non-invasive prenatal testing | |
| Herzog et al. | Tissue-specific DNA methylation profiles in newborns | |
| Frost et al. | Evaluation of allelic expression of imprinted genes in adult human blood | |
| Cheng et al. | Investigation into the promoter DNA methylation of three genes (CAMK1D, CRY2 and CALM2) in the peripheral blood of patients with type 2 diabetes |
Legal Events
| Date | Code | Title | Description |
|---|---|---|---|
| PUAI | Public reference made under article 153(3) epc to a published international application that has entered the european phase |
Free format text: ORIGINAL CODE: 0009012 |
|
| 17P | Request for examination filed |
Effective date: 20160419 |
|
| AK | Designated contracting states |
Kind code of ref document: A2 Designated state(s): AL AT BE BG CH CY CZ DE DK EE ES FI FR GB GR HR HU IE IS IT LI LT LU LV MC MK MT NL NO PL PT RO RS SE SI SK SM TR |
|
| AX | Request for extension of the european patent |
Extension state: BA ME |
|
| DAX | Request for extension of the european patent (deleted) | ||
| STAA | Information on the status of an ep patent application or granted ep patent |
Free format text: STATUS: EXAMINATION IS IN PROGRESS |
|
| 17Q | First examination report despatched |
Effective date: 20171023 |
|
| REG | Reference to a national code |
Ref country code: DE Ref legal event code: R079 Ref document number: 602014081532 Country of ref document: DE Free format text: PREVIOUS MAIN CLASS: C12Q0001680000 Ipc: C12Q0001687600 |
|
| RIC1 | Information provided on ipc code assigned before grant |
Ipc: C12Q 1/6876 20180101AFI20210303BHEP |
|
| GRAP | Despatch of communication of intention to grant a patent |
Free format text: ORIGINAL CODE: EPIDOSNIGR1 |
|
| STAA | Information on the status of an ep patent application or granted ep patent |
Free format text: STATUS: GRANT OF PATENT IS INTENDED |
|
| INTG | Intention to grant announced |
Effective date: 20210625 |
|
| GRAS | Grant fee paid |
Free format text: ORIGINAL CODE: EPIDOSNIGR3 |
|
| GRAA | (expected) grant |
Free format text: ORIGINAL CODE: 0009210 |
|
| STAA | Information on the status of an ep patent application or granted ep patent |
Free format text: STATUS: THE PATENT HAS BEEN GRANTED |
|
| AK | Designated contracting states |
Kind code of ref document: B1 Designated state(s): AL AT BE BG CH CY CZ DE DK EE ES FI FR GB GR HR HU IE IS IT LI LT LU LV MC MK MT NL NO PL PT RO RS SE SI SK SM TR |
|
| REG | Reference to a national code |
Ref country code: GB Ref legal event code: FG4D |
|
| REG | Reference to a national code |
Ref country code: AT Ref legal event code: REF Ref document number: 1451805 Country of ref document: AT Kind code of ref document: T Effective date: 20211215 Ref country code: CH Ref legal event code: EP |
|
| REG | Reference to a national code |
Ref country code: IE Ref legal event code: FG4D |
|
| REG | Reference to a national code |
Ref country code: DE Ref legal event code: R096 Ref document number: 602014081532 Country of ref document: DE |
|
| REG | Reference to a national code |
Ref country code: LT Ref legal event code: MG9D |
|
| REG | Reference to a national code |
Ref country code: NL Ref legal event code: MP Effective date: 20211201 |
|
| REG | Reference to a national code |
Ref country code: AT Ref legal event code: MK05 Ref document number: 1451805 Country of ref document: AT Kind code of ref document: T Effective date: 20211201 |
|
| PG25 | Lapsed in a contracting state [announced via postgrant information from national office to epo] |
Ref country code: RS Free format text: LAPSE BECAUSE OF FAILURE TO SUBMIT A TRANSLATION OF THE DESCRIPTION OR TO PAY THE FEE WITHIN THE PRESCRIBED TIME-LIMIT Effective date: 20211201 Ref country code: LT Free format text: LAPSE BECAUSE OF FAILURE TO SUBMIT A TRANSLATION OF THE DESCRIPTION OR TO PAY THE FEE WITHIN THE PRESCRIBED TIME-LIMIT Effective date: 20211201 Ref country code: FI Free format text: LAPSE BECAUSE OF FAILURE TO SUBMIT A TRANSLATION OF THE DESCRIPTION OR TO PAY THE FEE WITHIN THE PRESCRIBED TIME-LIMIT Effective date: 20211201 Ref country code: BG Free format text: LAPSE BECAUSE OF FAILURE TO SUBMIT A TRANSLATION OF THE DESCRIPTION OR TO PAY THE FEE WITHIN THE PRESCRIBED TIME-LIMIT Effective date: 20220301 Ref country code: AT Free format text: LAPSE BECAUSE OF FAILURE TO SUBMIT A TRANSLATION OF THE DESCRIPTION OR TO PAY THE FEE WITHIN THE PRESCRIBED TIME-LIMIT Effective date: 20211201 |
|
| PG25 | Lapsed in a contracting state [announced via postgrant information from national office to epo] |
Ref country code: SE Free format text: LAPSE BECAUSE OF FAILURE TO SUBMIT A TRANSLATION OF THE DESCRIPTION OR TO PAY THE FEE WITHIN THE PRESCRIBED TIME-LIMIT Effective date: 20211201 Ref country code: PL Free format text: LAPSE BECAUSE OF FAILURE TO SUBMIT A TRANSLATION OF THE DESCRIPTION OR TO PAY THE FEE WITHIN THE PRESCRIBED TIME-LIMIT Effective date: 20211201 Ref country code: NO Free format text: LAPSE BECAUSE OF FAILURE TO SUBMIT A TRANSLATION OF THE DESCRIPTION OR TO PAY THE FEE WITHIN THE PRESCRIBED TIME-LIMIT Effective date: 20220301 Ref country code: LV Free format text: LAPSE BECAUSE OF FAILURE TO SUBMIT A TRANSLATION OF THE DESCRIPTION OR TO PAY THE FEE WITHIN THE PRESCRIBED TIME-LIMIT Effective date: 20211201 Ref country code: HR Free format text: LAPSE BECAUSE OF FAILURE TO SUBMIT A TRANSLATION OF THE DESCRIPTION OR TO PAY THE FEE WITHIN THE PRESCRIBED TIME-LIMIT Effective date: 20211201 Ref country code: GR Free format text: LAPSE BECAUSE OF FAILURE TO SUBMIT A TRANSLATION OF THE DESCRIPTION OR TO PAY THE FEE WITHIN THE PRESCRIBED TIME-LIMIT Effective date: 20220302 Ref country code: ES Free format text: LAPSE BECAUSE OF FAILURE TO SUBMIT A TRANSLATION OF THE DESCRIPTION OR TO PAY THE FEE WITHIN THE PRESCRIBED TIME-LIMIT Effective date: 20211201 |
|
| PG25 | Lapsed in a contracting state [announced via postgrant information from national office to epo] |
Ref country code: NL Free format text: LAPSE BECAUSE OF FAILURE TO SUBMIT A TRANSLATION OF THE DESCRIPTION OR TO PAY THE FEE WITHIN THE PRESCRIBED TIME-LIMIT Effective date: 20211201 |
|
| PG25 | Lapsed in a contracting state [announced via postgrant information from national office to epo] |
Ref country code: SM Free format text: LAPSE BECAUSE OF FAILURE TO SUBMIT A TRANSLATION OF THE DESCRIPTION OR TO PAY THE FEE WITHIN THE PRESCRIBED TIME-LIMIT Effective date: 20211201 Ref country code: SK Free format text: LAPSE BECAUSE OF FAILURE TO SUBMIT A TRANSLATION OF THE DESCRIPTION OR TO PAY THE FEE WITHIN THE PRESCRIBED TIME-LIMIT Effective date: 20211201 Ref country code: RO Free format text: LAPSE BECAUSE OF FAILURE TO SUBMIT A TRANSLATION OF THE DESCRIPTION OR TO PAY THE FEE WITHIN THE PRESCRIBED TIME-LIMIT Effective date: 20211201 Ref country code: PT Free format text: LAPSE BECAUSE OF FAILURE TO SUBMIT A TRANSLATION OF THE DESCRIPTION OR TO PAY THE FEE WITHIN THE PRESCRIBED TIME-LIMIT Effective date: 20220401 Ref country code: EE Free format text: LAPSE BECAUSE OF FAILURE TO SUBMIT A TRANSLATION OF THE DESCRIPTION OR TO PAY THE FEE WITHIN THE PRESCRIBED TIME-LIMIT Effective date: 20211201 Ref country code: CZ Free format text: LAPSE BECAUSE OF FAILURE TO SUBMIT A TRANSLATION OF THE DESCRIPTION OR TO PAY THE FEE WITHIN THE PRESCRIBED TIME-LIMIT Effective date: 20211201 |
|
| REG | Reference to a national code |
Ref country code: DE Ref legal event code: R097 Ref document number: 602014081532 Country of ref document: DE |
|
| PG25 | Lapsed in a contracting state [announced via postgrant information from national office to epo] |
Ref country code: IS Free format text: LAPSE BECAUSE OF FAILURE TO SUBMIT A TRANSLATION OF THE DESCRIPTION OR TO PAY THE FEE WITHIN THE PRESCRIBED TIME-LIMIT Effective date: 20220401 |
|
| PLBE | No opposition filed within time limit |
Free format text: ORIGINAL CODE: 0009261 |
|
| STAA | Information on the status of an ep patent application or granted ep patent |
Free format text: STATUS: NO OPPOSITION FILED WITHIN TIME LIMIT |
|
| PG25 | Lapsed in a contracting state [announced via postgrant information from national office to epo] |
Ref country code: DK Free format text: LAPSE BECAUSE OF FAILURE TO SUBMIT A TRANSLATION OF THE DESCRIPTION OR TO PAY THE FEE WITHIN THE PRESCRIBED TIME-LIMIT Effective date: 20211201 Ref country code: AL Free format text: LAPSE BECAUSE OF FAILURE TO SUBMIT A TRANSLATION OF THE DESCRIPTION OR TO PAY THE FEE WITHIN THE PRESCRIBED TIME-LIMIT Effective date: 20211201 |
|
| 26N | No opposition filed |
Effective date: 20220902 |
|
| PG25 | Lapsed in a contracting state [announced via postgrant information from national office to epo] |
Ref country code: SI Free format text: LAPSE BECAUSE OF FAILURE TO SUBMIT A TRANSLATION OF THE DESCRIPTION OR TO PAY THE FEE WITHIN THE PRESCRIBED TIME-LIMIT Effective date: 20211201 |
|
| PG25 | Lapsed in a contracting state [announced via postgrant information from national office to epo] |
Ref country code: MC Free format text: LAPSE BECAUSE OF FAILURE TO SUBMIT A TRANSLATION OF THE DESCRIPTION OR TO PAY THE FEE WITHIN THE PRESCRIBED TIME-LIMIT Effective date: 20211201 |
|
| REG | Reference to a national code |
Ref country code: CH Ref legal event code: PL |
|
| REG | Reference to a national code |
Ref country code: BE Ref legal event code: MM Effective date: 20220930 |
|
| PG25 | Lapsed in a contracting state [announced via postgrant information from national office to epo] |
Ref country code: IT Free format text: LAPSE BECAUSE OF FAILURE TO SUBMIT A TRANSLATION OF THE DESCRIPTION OR TO PAY THE FEE WITHIN THE PRESCRIBED TIME-LIMIT Effective date: 20211201 |
|
| PG25 | Lapsed in a contracting state [announced via postgrant information from national office to epo] |
Ref country code: LU Free format text: LAPSE BECAUSE OF NON-PAYMENT OF DUE FEES Effective date: 20220929 |
|
| PG25 | Lapsed in a contracting state [announced via postgrant information from national office to epo] |
Ref country code: LI Free format text: LAPSE BECAUSE OF NON-PAYMENT OF DUE FEES Effective date: 20220930 Ref country code: IE Free format text: LAPSE BECAUSE OF NON-PAYMENT OF DUE FEES Effective date: 20220929 Ref country code: CH Free format text: LAPSE BECAUSE OF NON-PAYMENT OF DUE FEES Effective date: 20220930 |
|
| PG25 | Lapsed in a contracting state [announced via postgrant information from national office to epo] |
Ref country code: BE Free format text: LAPSE BECAUSE OF NON-PAYMENT OF DUE FEES Effective date: 20220930 |
|
| PG25 | Lapsed in a contracting state [announced via postgrant information from national office to epo] |
Ref country code: HU Free format text: LAPSE BECAUSE OF FAILURE TO SUBMIT A TRANSLATION OF THE DESCRIPTION OR TO PAY THE FEE WITHIN THE PRESCRIBED TIME-LIMIT; INVALID AB INITIO Effective date: 20140929 |
|
| PG25 | Lapsed in a contracting state [announced via postgrant information from national office to epo] |
Ref country code: CY Free format text: LAPSE BECAUSE OF FAILURE TO SUBMIT A TRANSLATION OF THE DESCRIPTION OR TO PAY THE FEE WITHIN THE PRESCRIBED TIME-LIMIT Effective date: 20211201 |
|
| PG25 | Lapsed in a contracting state [announced via postgrant information from national office to epo] |
Ref country code: MK Free format text: LAPSE BECAUSE OF FAILURE TO SUBMIT A TRANSLATION OF THE DESCRIPTION OR TO PAY THE FEE WITHIN THE PRESCRIBED TIME-LIMIT Effective date: 20211201 |
|
| PG25 | Lapsed in a contracting state [announced via postgrant information from national office to epo] |
Ref country code: MT Free format text: LAPSE BECAUSE OF FAILURE TO SUBMIT A TRANSLATION OF THE DESCRIPTION OR TO PAY THE FEE WITHIN THE PRESCRIBED TIME-LIMIT Effective date: 20211201 |
|
| P01 | Opt-out of the competence of the unified patent court (upc) registered |
Free format text: CASE NUMBER: UPC_APP_118468/2023 Effective date: 20230510 |
|
| PGFP | Annual fee paid to national office [announced via postgrant information from national office to epo] |
Ref country code: DE Payment date: 20250929 Year of fee payment: 12 |
|
| PGFP | Annual fee paid to national office [announced via postgrant information from national office to epo] |
Ref country code: GB Payment date: 20250929 Year of fee payment: 12 |
|
| PGFP | Annual fee paid to national office [announced via postgrant information from national office to epo] |
Ref country code: FR Payment date: 20250925 Year of fee payment: 12 |