EP3038048A1 - System and method for determining vehicle component conditions - Google Patents
System and method for determining vehicle component conditions Download PDFInfo
- Publication number
- EP3038048A1 EP3038048A1 EP15199966.1A EP15199966A EP3038048A1 EP 3038048 A1 EP3038048 A1 EP 3038048A1 EP 15199966 A EP15199966 A EP 15199966A EP 3038048 A1 EP3038048 A1 EP 3038048A1
- Authority
- EP
- European Patent Office
- Prior art keywords
- door
- doors
- maintenance
- features
- measurements
- Prior art date
- Legal status (The legal status is an assumption and is not a legal conclusion. Google has not performed a legal analysis and makes no representation as to the accuracy of the status listed.)
- Ceased
Links
Images


Classifications
-
- G—PHYSICS
- G07—CHECKING-DEVICES
- G07C—TIME OR ATTENDANCE REGISTERS; REGISTERING OR INDICATING THE WORKING OF MACHINES; GENERATING RANDOM NUMBERS; VOTING OR LOTTERY APPARATUS; ARRANGEMENTS, SYSTEMS OR APPARATUS FOR CHECKING NOT PROVIDED FOR ELSEWHERE
- G07C5/00—Registering or indicating the working of vehicles
- G07C5/08—Registering or indicating performance data other than driving, working, idle, or waiting time, with or without registering driving, working, idle or waiting time
- G07C5/0808—Diagnosing performance data
-
- G—PHYSICS
- G06—COMPUTING OR CALCULATING; COUNTING
- G06Q—INFORMATION AND COMMUNICATION TECHNOLOGY [ICT] SPECIALLY ADAPTED FOR ADMINISTRATIVE, COMMERCIAL, FINANCIAL, MANAGERIAL OR SUPERVISORY PURPOSES; SYSTEMS OR METHODS SPECIALLY ADAPTED FOR ADMINISTRATIVE, COMMERCIAL, FINANCIAL, MANAGERIAL OR SUPERVISORY PURPOSES, NOT OTHERWISE PROVIDED FOR
- G06Q10/00—Administration; Management
- G06Q10/20—Administration of product repair or maintenance
-
- G—PHYSICS
- G06—COMPUTING OR CALCULATING; COUNTING
- G06Q—INFORMATION AND COMMUNICATION TECHNOLOGY [ICT] SPECIALLY ADAPTED FOR ADMINISTRATIVE, COMMERCIAL, FINANCIAL, MANAGERIAL OR SUPERVISORY PURPOSES; SYSTEMS OR METHODS SPECIALLY ADAPTED FOR ADMINISTRATIVE, COMMERCIAL, FINANCIAL, MANAGERIAL OR SUPERVISORY PURPOSES, NOT OTHERWISE PROVIDED FOR
- G06Q30/00—Commerce
- G06Q30/01—Customer relationship services
- G06Q30/014—Providing recall services for goods or products
-
- G—PHYSICS
- G06—COMPUTING OR CALCULATING; COUNTING
- G06Q—INFORMATION AND COMMUNICATION TECHNOLOGY [ICT] SPECIALLY ADAPTED FOR ADMINISTRATIVE, COMMERCIAL, FINANCIAL, MANAGERIAL OR SUPERVISORY PURPOSES; SYSTEMS OR METHODS SPECIALLY ADAPTED FOR ADMINISTRATIVE, COMMERCIAL, FINANCIAL, MANAGERIAL OR SUPERVISORY PURPOSES, NOT OTHERWISE PROVIDED FOR
- G06Q30/00—Commerce
- G06Q30/018—Certifying business or products
-
- G—PHYSICS
- G07—CHECKING-DEVICES
- G07C—TIME OR ATTENDANCE REGISTERS; REGISTERING OR INDICATING THE WORKING OF MACHINES; GENERATING RANDOM NUMBERS; VOTING OR LOTTERY APPARATUS; ARRANGEMENTS, SYSTEMS OR APPARATUS FOR CHECKING NOT PROVIDED FOR ELSEWHERE
- G07C5/00—Registering or indicating the working of vehicles
- G07C5/006—Indicating maintenance
-
- G—PHYSICS
- G06—COMPUTING OR CALCULATING; COUNTING
- G06Q—INFORMATION AND COMMUNICATION TECHNOLOGY [ICT] SPECIALLY ADAPTED FOR ADMINISTRATIVE, COMMERCIAL, FINANCIAL, MANAGERIAL OR SUPERVISORY PURPOSES; SYSTEMS OR METHODS SPECIALLY ADAPTED FOR ADMINISTRATIVE, COMMERCIAL, FINANCIAL, MANAGERIAL OR SUPERVISORY PURPOSES, NOT OTHERWISE PROVIDED FOR
- G06Q50/00—Information and communication technology [ICT] specially adapted for implementation of business processes of specific business sectors, e.g. utilities or tourism
- G06Q50/40—Business processes related to the transportation industry
Definitions
- This application relates in general to vehicle maintenance, and in particular, to a system and method for determining vehicle component conditions.
- public transportation provides a popular option for reducing traffic
- the vehicles can be expensive to maintain, including labor and parts replacement.
- most public transportation vehicles such as trains and busses, include doors that open and shut to allow passengers to enter or exit the vehicle.
- the doors must be regularly maintained to prevent unexpected malfunctioning, which may result in unscheduled downtime of the vehicle for repair, disruption of passenger pick-up schedules for the vehicle, and customer dissatisfaction.
- the recommendations can help prevent unexpected maintenance failure; however, the recommendations can be overly cautious and require an owner of the vehicle to unnecessarily perform maintenance.
- An embodiment provides a computer-implemented system and method for determining door conditions.
- a function that maps features to door conditions is stored. Motor current measurements are obtained for a door over a predetermined time period. The features of the motor current measurements are determined based on the stored function. The features are then analyzed by mapping the features to one or more door conditions via a predetermined function. At least one condition of the door is determined based on the analyzed features.
- public transportation As cities experience high levels of traffic congestion, many individual commuters are turning to public transportation, or mass transit, for commuting to and from work or school.
- public transportation vehicles include vehicle components that are frequently used and require maintenance to prevent unexpected failure.
- each type of transportation vehicle includes at least one set of doors, which open and close numerous times a day to allow passengers to enter and exit the vehicle.
- maintenance appointments are usually scheduled based on recommendations by the vehicle manufacturer or mechanic. Most recommendations are overly cautious and may require unnecessary inspection, which can be a large expense to an owner of the transportation vehicles for both time and money.
- FIGURE 1 is a block diagram showing a system 10 for determining door conditions, in accordance with one embodiment.
- Measurements for a component 12 on a transportation vehicle 11, such as a public transportation vehicle or individual vehicle can be obtained.
- the component can be the doors 12 of the vehicle 11 and the measurements can include a sequence of data points for motor current values of the door and door positions, which are collected at successive time instants as time series data.
- the measurements can be associated with open and close commands for the door, and an operating state. Other components and measurements are possible.
- the measurements can be stored as operational data 18, in a database 14 interconnected to a server 13.
- the server 13 and database 14 can be maintained by an owner of the transportation vehicle or a company that manages the transportation vehicle.
- the server 13 can transmit the data to a condition server 19 via an internetwork, such as the Internet, for analysis, including determining a particular condition of each door, predicting condition based maintenance, and identifying door similarities for maintenance purposes.
- a further set of measurements can also be obtained from the transportation vehicle and stored in the database 14 with determined conditions of the vehicle doors, as laboratory data.
- the conditions can be assigned by a mechanic who has inspected the door, obtained measurements, and then diagnosed the condition. Alternatively, the condition can be automatically assigned.
- the laboratory data can also be transmitted to the conditions server 19 for use in helping identifying a condition for the operational data.
- the laboratory data 27 and the operational data 22 can be stored in a database 20 interconnected to the condition server 19.
- the condition server 19 can include a feature module 23, training module 24, classifier 25, predictor module 26, and correlation module 27.
- the feature module 23 can analyze both the laboratory data 21 and operational data 22 to determine features from the data, such as a mean, maximum value, minimum value, standard deviation, duration, second highest peak, and second lowest minimum. Other types of features are possible.
- the training module 24 utilizes the features for the laboratory data 21 to train the classifier 25 along with the known door conditions associated with those features, as further described below with reference to FIGURE 3 .
- the training module 24 also uses the laboratory data 21 to test the classifier 25 and ensure that the classifier accurately classifies the operational data 22, as further described below with reference to FIGURES 4 and 5 .
- the features of the operational data 22 are provided to the classifier 25 and a condition of the door can be diagnosed.
- the prediction module 26 identifies long term trends of a transportation vehicle component and determines features that are predictive of certain kinds of faults, as further described below with reference to FIGURE 14 .
- the ability to accurately predict maintenance needs focuses on condition based maintenance, which can prevent unnecessary maintenance based on manufacturer recommendations.
- the features of a component can also be used to increase efficiency of maintenance inspections by identifying similarities between doors, identifying doors that are dissimilar from other doors, and determining correlations among different measurements for the component. Determining similarities between doors of a transportation vehicle and determining which doors are outliers can increase maintenance efficiency by identifying those doors that require maintenance and those doors that do not without the need for a manual inspection of each door.
- the client and servers can each include one or more modules for carrying out the embodiments disclosed herein.
- the modules can be implemented as a computer program or procedure written as source code in a conventional programming language and is presented for execution by the central processing unit as object or byte code.
- the modules could also be implemented in hardware, either as integrated circuitry or burned into read-only memory components, and each of the client and server can act as a specialized computer. For instance, when the modules are implemented as hardware, that particular hardware is specialized to perform the data quality assessment and other computers cannot be used. Additionally, when the modules are burned into read-only memory components, the computer storing the read-only memory becomes specialized to perform the data quality assessment that other computers cannot.
- the various implementations of the source code and object and byte codes can be held on a computer-readable storage medium, such as a floppy disk, hard drive, digital video disk (DVD), random access memory (RAM), read-only memory (ROM) and similar storage mediums.
- a computer-readable storage medium such as a floppy disk, hard drive, digital video disk (DVD), random access memory (RAM), read-only memory (ROM) and similar storage mediums.
- a computer-readable storage medium such as a floppy disk, hard drive, digital video disk (DVD), random access memory (RAM), read-only memory (ROM) and similar storage mediums.
- RAM random access memory
- ROM read-only memory
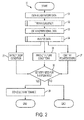
- FIGURE 2 is a flow diagram showing a method 30 for determining door conditions, in accordance with one embodiment.
- Laboratory data can be optionally obtained (block 31) for a component of a transportation vehicle and used to train (block 32) a classifier that can map operational data to a known condition of the component.
- the component includes vehicle doors, which will be used in the discussion below, as an example. However, other components are possible, including switch machines, for moving railway tracks.
- the laboratory data includes measurements of the motor current for one or more of the doors on the vehicle over time and door position, and an underlying door condition associated with the motor current values.
- a sample rate of time for the measurements can be 1/10 seconds; however, other durations are possible.
- the door conditions can include two classifications, normal or abnormal.
- An abnormal condition can further include specific types of faults, such as an object stuck in the doors, an obstacle in a bottom rail of the door, bending or deformity of the bottom rail, loose bolts, the presence of dirt, and a lack of grease.
- a determination of loose bolts can further provide an indication of the particular bolt that is loose.
- the operational data is obtained for the component of the transportation vehicle (block 33) and includes only motor current and door position measurements for the component over time, and not the underlying door conditions, like the laboratory data. Subsequently, the operational data is analyzed (block 34) to detect a current condition of the door (block 35), to predict future conditions of the door (block 36), and identify related doors (block 37).
- the analysis of the operational data can include use of laboratory data models from the trained classifier. For example, the operational data can be provided to the classifier for identifying one or more conditions for the door.
- alternate analyses can be performed to detect a current door condition or predict future conditions, such as by identifying a correlation between two or more doors, performing a feature trend analysis, and outlier detection, which are described further below with reference to FIGURES 7 , 10 , and 13 . If a need for maintenance is identified (block 38) based on the assigned or future conditions, a maintenance appointment can be scheduled. However, if no maintenance is required, an inspection of the door need not be performed.
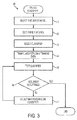
- FIGURE 3 is a flow diagram showing, by way of example, a process 40 for training a classifier.
- Laboratory data is analyzed to generate a time series model for the measurements of the door via time series segmentation or functional data analysis.
- the laboratory data includes measurements of the motor current for the door and door position, which are collected at successive time instants that are correlated in time, and a condition of the door.
- the time series segmentation includes plotting the motor current measurements against time and dividing the data into multiple segments, which are representative of different stages of a single open and close cycle for the door.
- the functional data analysis includes plotting the motor current measurements against time for a single open and close cycle and fitting a curve to the plotted data points for motor current measurements.
- An individual associated with the transportation vehicle on which the doors are located can select (block 41) one of the time series segmentation or functional data analysis for generating a time series representation of the laboratory data, or alternatively, one of the methods can be selected automatically or as a default.
- Each segment includes a set of features for a signal of interest, such as the motor current.
- a graph of segments for an open and close cycle of a door can be generated with time located along an x-axis and door position located along a y-axis.
- Door position values for a single open and close cycle which can be identified by open and close commands that are used to provide instructions to the door to open or close, can be plotted along a curve.
- the curve can represent a curve with a flattened top or a modified bell curve.
- the open and close cycle can be segmented into different states using a segmentation algorithm that considers the motor current, open and close commands, and an operating state as input.
- the different states are plotted along the curve to identify states where the behavior of the door is qualitatively different from the other states.
- each of the open and close commands, and the operating state can associated with a binary value. For example, a value of 1 for the open command can represent an open state of the doors, while a value of 0 represents a closed state. Additionally, a value of 1 for the closed command represents a closed state, while a value of 0 represents an open state.
- the operating state can be another discrete signal that signifies whether the door is open or closed.
- This state can be generated, for example, using a switch that turns on/off based on presence or lack of physical contact.
- six segments of the cycle are identified, including state 1 for a closed position, state 2 for acceleration, state 3 for constant speed, state 4 for open position, state 5 for acceleration, state 6 for the rest of the cycle till the door is closed again. Segmentation that results in fewer or greater number of states is also possible by altering the segmentation rules.
- the different states are identified using a set of predetermined rules that utilize the motor current, the derivative and sign of the motor current, the operating state, and the open and close commands. For example, when an open command is given, the default state 1, signifying a closed door, transitions to the next state 2. If the current state is 2, and the rate of change of current goes from positive to negative, then the state transitions from 2 to 3. Additionally, when an operating state indicates the door is closed, the current state can transition back to the default state 1. Other rules are possible.
- rules for doors associated with measurements for motor current and stroke can include if an open command is given, a default state transitions to state 1. If the value of the stroke does not change, a current state of the door can transition to a state indicating an open door. Also, if the value of the stroke does not change over a predetermined number of successive measurements, and a change in the current value for the last n measurements are each less than a predetermined threshold, then the current state can transition back to the default state.
- the output of the segmentation includes identification of the different states for an open and close cycle for a single door, which can be plotted on a graph with the motor current values.
- time can be located along an x-axis and motor current, which can be measured in Amperes, can be located along a y-axis.
- Data points for motor current values of the door versus time and data points for the segmented states that correspond with the motor current data points are plotted on the graph as output for the segmentation.
- functional data analysis can be applied to the laboratory data collected from the doors to generate a time series representation of the data for a single open and close cycle for the door.
- the motor current measurements and door position can be plotted against time samples to generate a profile representative of the measurements.
- a curve is then fit to the profile using a Fourier or spline basis function. Smoothness constraints can be applied to the basis to minimize an impact of noise from the laboratory data. The basis helps identify landmarks for door measurements that can be aligned across different curves.
- features can be determined (block 42) for each state of an open and close cycle from the segmentation output or for the basis of the open and close cycle.
- the features for each segmented state can include a mean, maximum, minimum, standard deviation, and duration, as well as other types of features.
- the mean measures a mean value of the motor current for a state, while the maximum measures a highest value of the motor current in that state and the minimum measures a lowest value of the motor current for that state.
- the standard deviation measures an amount of variation of the motor current from the mean and the duration measures a time span for the state.
- the features for the basis can include mean, duration, and a particular extremum.
- the features can be used to train (block 44) a classifier with the known conditions for the laboratory data. Specifically, a function is created for each condition that maps the features to that particular door condition.
- the classifier can be selected (block 43) from support vector machines, neural networks, and ensemble classifiers, such as Random Forest classifier.
- the features Prior to training, the features can split into a training data set for training the classifier and a testing data set for determining an accuracy of the trained classifier. In one embodiment, 60% of the available features can be used for training, while the remaining 40% can be used for testing. However, other percentage splits are possible.
- k- fold cross validation can be used to determine an amount of the feature data to be used for training and testing. Specifically, the features are split into k groups.
- One of the k groups is used as a testing set, while the remaining k -1 groups are used as the training set. The process is repeated until each of the k groups has been used as the testing set. The results of the testing based on each of the k-groups can then be averaged to determine an accuracy of the classifier.
- X i represents a vector of features within each of the current states for the segmented states or for the basis
- Y i ⁇ ⁇ Normal , Fault 1 ,..., Fault m ⁇ represents the normal or faulty condition of the door.
- the training set is then used to learn a model that maps features to a door condition.
- a feature vector X test can be mapped to a class Y test ⁇ ⁇ Normal , Fault 1 ,..., Fault m ⁇ .
- the different faults can include an object stuck in the doors, an obstacle in a bottom rail of the door, bending or deformity of the bottom rail, loose bolts, the presence of dirt, and a lack of grease.
- a determination of which bolt is loose within the door can be determined.
- a two-class classification can be used where Y test ⁇ ⁇ Normal , Abnormal ⁇ .
- the classifier can also learn a posterior probability distribution via k nearest neighbors or generalized linear models that indicates a probability of a condition for new observations of the door, such as from the operational data.
- the testing set is input (block 45) into the classifier to determine an accuracy of the testing set classification.
- the classification accuracy can be defined as a percentage of a total number of feature data for an open and close cycle correctly classified across all classes.
- the results of the testing can be represented by a confusion matrix.
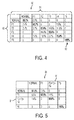
- FIGURE 4 is a block diagram showing, by way of example, a confusion matrix for a multi-class fault classification.
- a list of the classifications are listed horizontally 81 along a top of the matrix, as well as vertically 82 on a left side of the matrix.
- the classifications include normal, F 1 for an loose bolt, F2 for an obstacle in a bottom rail of the door on an outside, F3 for an obstacle stuck in a bottom rail of the door on the top, F4 for an object in a bottom rail of the door on an inside, and F5 for a lack of grease.
- Other classifications can be considered such as a bent or deformed rail of the door, and object stuck in the door, and a presence of dirt.
- the values of the matrix 83 represent a percentage that a classification on the left side of the matrix was correctly or incorrectly identified as a classification listed along the top of the matrix. For example, in the first row, the normal classification was correctly identified as normal 95.1 % of the time, while the normal classification was incorrectly identified as F1 0.5% of the time.
- the classifications for normal, F1 and F5 appear highly accurate, as indicated by the percentages of 91.4% and above. However, despite the high accuracy, some misclassification occurred. For example, there is some confusion between the normal classification and F1, or fault 1. In particular, some fault 1 data is misclassified as normal data. Fault 1 corresponds to a loose bolt. In this case, the cause of confusion may be due to a looseness of the bolt. For example, a bolt that is only a little loose, may be confused with a tightened bolt; however, those bolts that are very loose will not be confused. Detecting confusion for other conditions are possible.
- confusion between a normal state and when an object is stuck in the door may be due to objects that are not stiff and the door may not experience a lot of resistance during opening and closing since the object was not stiff, and was thus, classified as normal.
- Another reason for the confusion is that the classifier may assign almost equal probabilities to both conditions of normal and fault. To prevent confusion when equal probabilities are assigned, the classifier can also be instructed to output an "uncertain" notification.
- FIGURE 5 is a block diagram showing, by way of example, a revised confusion matrix 90 for the multi-class fault classification of FIGURE 4 .
- the door conditions are located both horizontally and vertically along the graph.
- the classifications for F2, F3, and F4 are combined into a single condition. As shown by the value for a comparison of the combined condition, the accuracy rate for correctly identifying an obstacle in a bottom rail of the door is now 98.6%.
- a confusion matrix can be generated for identifying a specific bolt that is loose when a loose bolt has been identified for the door. Based on the classification testing results, some features may be identified as more predictive of classifying a door for a particular condition.
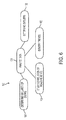
- FIGURE 6 is a flow diagram showing, by way of example, methods 100 for analyzing 101 operational data.
- the operational data can be processed to determine a similarity 105 or dissimilarity between doors, a correlation 104 of different measurements for a single door, long term trends 103 exhibited by the door, and outliers 102. Identifying a correlation among different measurements 104 can help identify whether any new information can be gained and whether seasonal dependencies exist based on correlations with external temperature.
- FIGURE 7 is a flow diagram showing, by way of example, a process 110 for correlating different measurements for a door.
- Two different measurements can be identified (block 111) for comparison.
- a correlation coefficient of the measurements is determined (block 112) for each door on the transportation vehicle.
- the correlation coefficients can be determined via Euclidean distance or maximum distance of the measurement values. Other methods for determining similarity are possible.
- FIGURE 8 is a block diagram showing, by way of example, a graph 120 correlating different measurements for different doors.
- the doors of a transportation vehicle are listed along an x-axis 121, while a correlation coefficient of two different measurements for the doors are listed along a y-axis 122.
- the measurements are motor temperature and outside temperature.
- a correlation coefficient is determined between the motor temperature and outside temperature measurements for each door.
- values 123 for the correlated coefficients are plotted on a graph for each door.
- doors that are correlation exceptions can be identified (block 114).
- the correlation exceptions include doors that do not show a strong correlation between the measurements when the remaining doors show a strong correlation of the measurements.
- the measurements appear to be highly correlated for doors 1, 2, 3, 5, 6, 7, and 8, with the exception of door 4.
- the door exceptions can be identified based on a threshold, including a standard deviation value. For example, if the correlation coefficient for one door is a predetermined number of standard deviations away from the other doors, then that door is an exception. Alternatively, if the door satisfies a threshold for a measure of dissimilarity from the other doors, then that door is an exception. Other means for determining door exceptions are possible.
- the lack of correlation identified for door 4 may be due to abnormal outside temperature readings, abnormal motor temperature readings, or a fault of the door. Further analysis of the measurements can be performed to determine (block 115) whether at least one of the measurements for the excepted door 4 is anomalous and if anomalous, inspection or maintenance can be scheduled for the door.
- FIGURE 9 is a block diagram showing, by way of example, a graph 130 of one of the measurements from the graph of FIGURE 8 for two of the doors. Dates are listed along an x-axis 131 of the graph 130, while motor temperature is listed along a y-axis 132. Data points for the separate motor temperature measurements for door 1 135 and door 4 134 are plotted on the graph according to the legend 133. On the graph, most of the data points 135 for door 1 appear to have lower motor temperature readings than the data points 134 for door 4.
- An anomaly can be determined for the data using, for example, Robust Principal Component Analysis.
- the motor temperature readings for door 4 are anomalous.
- Reasons for the anomaly can include a problem with the temperature sensor or a problem with the motor itself.
- an inspection can be scheduled to determine whether the motor is not working correctly or the temperature readings are inaccurate.
- no further inspection of those doors may be necessary.
- Other measurements can be analyzed for identifying a correlation, such as outside temperature with other measurements, including a sum of the motor current during opening of the doors, a maximum current during opening, a minimum current during opening, a mean current during opening, and a standard deviation of current during opening.
- a strong negative correlation is identified, which indicates that more effort is required to open the door during cold weather.
- the outside temperature can also be analyzed with measurements associated with closing of the doors to determine whether cold weather also affects closing. In one example, strong correlations for outside temperature and door closing did not exist. The correlations are helpful in predicting future maintenance.
- FIGURE 10 is a flow diagram showing, by way of example, a process 140 for determining whether a correlation exists between doors on a shared transportation vehicle.
- One open and close cycle is selected (block 141) from the operational data for each door to be analyzed, for each hour and each day over a predetermined time period.
- a feature vector is then generated (block 142) for each selected open and close cycle using the features described above with respect to FIGURE 3 that are associated with that open and close cycle.
- the subscript i represents an identification of the door for which the feature vector applies.
- each element, or feature, within the feature vectors can be normalized (block 143).
- each element of the vector is normalized by a maximum value for that element across all open and close cycles.
- Two doors, s and t are selected (block 144) for comparison.
- f s i and f t i are the means of the feature vectors f s i and f t i over the time period, respectively.
- Other methods for determining similarity are possible, including standard Euclidean distance and a maximum difference of the individual features.
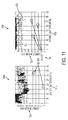
- FIGURE 11 is a block diagram showing, by way of example, two separate graphs 150a, 150b each representative of correlation data for a pair of doors.
- a first graph 150a represents correlation data for doors 1 and 4, while a second graph 150b represents correlation data for doors 1 and 7.
- Each graph lists time, such as days, along an x-axis 151a, 151b and correlation values along a y-axis 152a, 152b.
- the correlation values for each door pair are plotted as data points 153 in their respective graphs 150a, 150b.
- a comparison of the graphs provides important information regarding a similarity of the doors compared, trends in the correlation data, and outliers.
- doors 1 and 4 are less similar to each other as compared to doors 1 and 7, as indicated by the lower correlation values for doors 1 and 4.
- the lower correlation values for doors 1 and 4 are likely to the anomalous motor temperature readings of door 4, as described above with respect to FIGURES 8 and 9 .
- the correlation values appear to be lower towards the middle of the graph, around 150 days to 250 days, which indicates a seasonal effect since the days in the middle of the graph represent colder weather months and the correlation values begin to increase during the warmer weather months.
- opening of the doors may function differently in cold weather and require more work to open, which is indicated by the graphs 151a, 151b. Additionally, outliers 154 can be observed in the graphs 150a, 150b. The outliers are values that deviate from the other values of the graph enough to indicate that a door may be experiencing a problem or fault. Further inspection of the doors may be necessary when outliers are detected, as further described below with reference to FIGURE 13 .
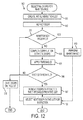
- FIGURE 12 is a flow diagram showing, by way of example, a process 160 for efficiently scheduling maintenance appointments. To identify doors that do and do not require maintenance, all doors are input (block 161) on an initial inspection list. A door on the initial inspection list is inspected (block 162) and a determination (block 163) is made as to whether maintenance is required for the door.
- the maintenance can be performed (block 169) and a next door on the list is selected (block 168) for inspection. However, if no maintenance is required, then a similarity is determined (block 164) between the inspected door and all the other doors on the initial inspection list as a correlation value, as described above in detail with respect to FIGURE 10 .
- a predetermined threshold is then applied (165) to the correlation values.
- the threshold can be computed based on past historical evidence and measurements, which can be collected, for example, whenever a door panel is opened and a conclusion is made that no maintenance is required. Other thresholds are possible. For example, data for the door for which no maintenance is needed should be recorded as historical evidence. In one example, if the history includes N doors, then the correlation value can be computed between all N(N-1)/2 pairs of doors. An average of the correlation values can then be calculated as the threshold.
- the doors with correlation values that exceed are removed (167) from the initial inspection list, as needing no inspection.
- the next door on the initial inspection list is then selected (block 168) for inspection.
- the correlation values for the doors do not exceed the threshold, then the doors remain (block 170) on the initial inspection list.
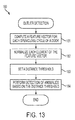
- FIGURE 13 is a flow diagram showing, by way of example, a process 180 for detecting outliers.
- a feature vector is generated (block 181) for each open and close cycle of a door within a dataset and each element of the feature vectors can be normalized (block 182), both of which are described above with respect to FIGURE 10 .
- a distance threshold is set (block 183) to define outliers and a selected outlier detection algorithm identifies (block 184) the outliers based on the distance threshold.
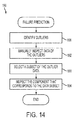
- FIGURE 14 is a flow diagram showing, by way of example, a process 190 for predicting failure of a door. Outliers that are different enough from known normal and faulty data to warrant further inspection are selected (block 191). The outliers can be determined using the process described above with respect to FIGURE 13 .
- outlier detection a tradeoff exists between an inspection effort of the doors and a risk of unscheduled failure. The tradeoff is implemented by setting a predetermined threshold on the outlier scores. Specifically, the threshold used to identify the outliers can originally be set high, such that less than one percent of events are classified as outliers. Then, the threshold can be optimized based on field data similar to setting the threshold for determining similar doors.
- the data associated with the outliers is manually inspected (block 192) using, for example, a dashboard application that runs on a computer to allow a maintenance technician to visually analyze the data. Based on the manual inspection, a subset of the outlier data can be selected (block 193) for further inspection. The doors corresponding to the selected subset of outlier data can be inspected (block 194) for defects.
- outlier detection can also be used to identify doors most in need of maintenance or inspection. For example, a maintenance budget allows inspection of only five doors per transportation vehicle. The five doors that are in the worst conditions should be selected for inspection and any necessary maintenance. The five doors can be identified via outlier detection.
- the operational data for a door can also be used to identify long term trends of a door component.
- the trends are linked to usage and can help predict future faults of a door.
- some features are more predictive of particular faults than other features.
- a model for such predictive feature can be fit as linear in a number of the door openings and in the motor temperature, as provided below:
- Predictive feature B 0 + B 1 door open cycle number + B 2 average outside temp . over open / close cycle
- Coefficients B1 and B2 represent relative sensitivities of the predictive feature to the number of door openings and average outside temperature, respectively.
- the coefficient B0 is a static term and represents the value of the predictive feature for a new unused door at 0 degrees Celsius.
- Each of the coefficients can be determined for all the doors using a robust linear regression, as well as other methods. Determination of long terms trends, as described above, shows that usage has an effect on a condition of a door.
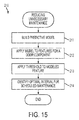
- FIGURE 15 is a flow diagram showing, by way of example, a process 210 for reducing unnecessary maintenance based on predictive faults.
- a model with predictive trends is built (block 211) to predict component failures.
- the model is applied (block 212) to one or more features of the component and can be mapped on a graph.
- a threshold is applied to the modeled feature (block 213) and an optimal interval for scheduled maintenance is determined (block 213).
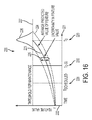
- FIGURE 16 is a block diagram showing, by way of example, a graph 220 of average predicted values for a component feature over time. Time is located along an x-axis 221 of the graph 220, while values for the feature are located along a y-axis 222. Values for the component predicted over time are averaged and plotted along a curve 213 on the graph 220.
- T scheduled 228 is identified as the optimal interval for scheduled maintenance based on factors other than the actual condition of the component, such as recommendations from a manufacturer or mechanic. However, the recommendations are often overly cautious resulting in maintenance when none is required. Thus, to prevent unnecessary maintenance, future maintenance, which is based on actual conditioning of the door and future trends, is used to extend the scheduled maintenance interval for time beyond T scheduled without a high risk of component failure.
- a probability distribution of time when the feature value will cross the threshold is determined.
- a maintenance action may be necessary.
- a time at which the feature curve will cross the threshold can be determined.
- the curve 226 above the threshold identifies a probability distribution of the time when the feature's value is expected to cross the threshold.
- a mean of the probability distance is at To 229 and has a standard distribution of ⁇ .
- T 0 is selected.
- the extended maintenance schedule can then be set automatically, or by an individual associated with the transportation vehicle. In one example, the extended time period can be set at T 0 -3 ⁇ 230. Other time periods for scheduling the extended maintenance are possible between T scheduled and To. At a minimum, the extended scheduled time should be prior to To to ensure that maintenance is provided prior to the estimated failure.
- each feature such as a loose bolt or low grease
- a component is analyzed for a component to determine when maintenance is needed for the particular feature. For example, based on current usage patterns, a loose bolt may be predicted to occur in two years, while the level of grease may become too low within the next six months.
- An overall system model can be generated for all the models generated for each feature associated with one or more components in the transportation vehicle to impose an overall maintenance strategy.
- Commercial tools such as BlockSim, can be used to generate the overall system model.
- diagnostic and prediction of conditions has been identified with respect to transportation vehicle doors, other components are possible, including a switch machine for railway tracks. Additionally, the diagnostic and prediction analyses can be applied to automatic doors in a building, or elevators and escalators. At a minimum, measurements of motor current across time must be available.
Landscapes
- Business, Economics & Management (AREA)
- General Physics & Mathematics (AREA)
- Physics & Mathematics (AREA)
- Engineering & Computer Science (AREA)
- Marketing (AREA)
- Theoretical Computer Science (AREA)
- Strategic Management (AREA)
- Economics (AREA)
- General Business, Economics & Management (AREA)
- Entrepreneurship & Innovation (AREA)
- Accounting & Taxation (AREA)
- Development Economics (AREA)
- Human Resources & Organizations (AREA)
- Finance (AREA)
- Operations Research (AREA)
- Quality & Reliability (AREA)
- Tourism & Hospitality (AREA)
- Testing Of Devices, Machine Parts, Or Other Structures Thereof (AREA)
- Power-Operated Mechanisms For Wings (AREA)
- Automobile Manufacture Line, Endless Track Vehicle, Trailer (AREA)
- Management, Administration, Business Operations System, And Electronic Commerce (AREA)
Applications Claiming Priority (1)
| Application Number | Priority Date | Filing Date | Title |
|---|---|---|---|
| US14/582,118 US9984513B2 (en) | 2014-12-23 | 2014-12-23 | System and method for determining vehicle component conditions |
Publications (1)
| Publication Number | Publication Date |
|---|---|
| EP3038048A1 true EP3038048A1 (en) | 2016-06-29 |
Family
ID=55024784
Family Applications (1)
| Application Number | Title | Priority Date | Filing Date |
|---|---|---|---|
| EP15199966.1A Ceased EP3038048A1 (en) | 2014-12-23 | 2015-12-14 | System and method for determining vehicle component conditions |
Country Status (3)
| Country | Link |
|---|---|
| US (4) | US9984513B2 (enExample) |
| EP (1) | EP3038048A1 (enExample) |
| JP (1) | JP6653165B2 (enExample) |
Cited By (9)
| Publication number | Priority date | Publication date | Assignee | Title |
|---|---|---|---|---|
| CN107153841A (zh) * | 2017-04-24 | 2017-09-12 | 南京康尼机电股份有限公司 | 一种城市轨道交通车辆门系统的亚健康预测方法 |
| CN107328589A (zh) * | 2017-06-28 | 2017-11-07 | 南京工程学院 | 一种轨道车辆门系统远程监测系统及其监测方法 |
| EP3319050A1 (en) * | 2016-11-04 | 2018-05-09 | Hitachi, Ltd. | Vehicle operation data collection apparatus, vehicle operation data collection system, and vehicle operation data collection method |
| FR3072408A1 (fr) * | 2017-10-18 | 2019-04-19 | Alstom Transport Technologies | Procede et systeme de diagnostic de fonctionnement d'un dispositif automatique ou semi-automatique d'acces a un vehicule de transport |
| EP3525177A1 (en) * | 2018-02-08 | 2019-08-14 | GEOTAB Inc. | Telematically monitoring a condition of an operational vehicle component |
| US11176762B2 (en) | 2018-02-08 | 2021-11-16 | Geotab Inc. | Method for telematically providing vehicle component rating |
| US11182987B2 (en) | 2018-02-08 | 2021-11-23 | Geotab Inc. | Telematically providing remaining effective life indications for operational vehicle components |
| US11182988B2 (en) | 2018-02-08 | 2021-11-23 | Geotab Inc. | System for telematically providing vehicle component rating |
| EP4044133A1 (de) * | 2021-02-10 | 2022-08-17 | Bode - Die Tür GmbH | Verfahren zur übertragung von zustandsdaten einer zugangsvorrichtung eines fahrzeugs |
Families Citing this family (23)
| Publication number | Priority date | Publication date | Assignee | Title |
|---|---|---|---|---|
| US10824145B1 (en) | 2016-01-22 | 2020-11-03 | State Farm Mutual Automobile Insurance Company | Autonomous vehicle component maintenance and repair |
| US11242051B1 (en) | 2016-01-22 | 2022-02-08 | State Farm Mutual Automobile Insurance Company | Autonomous vehicle action communications |
| US11719545B2 (en) | 2016-01-22 | 2023-08-08 | Hyundai Motor Company | Autonomous vehicle component damage and salvage assessment |
| US11441916B1 (en) | 2016-01-22 | 2022-09-13 | State Farm Mutual Automobile Insurance Company | Autonomous vehicle trip routing |
| WO2018005972A1 (en) * | 2016-06-30 | 2018-01-04 | Massachusetts Institute Of Technology | Applying motion sensor data to wheel imbalance detection, tire pressure monitoring, and/ or tread depth measurement |
| CN106406295B (zh) * | 2016-12-02 | 2019-02-26 | 南京康尼机电股份有限公司 | 基于多工况的轨道交通车辆门系统故障诊断及预警方法 |
| US10023010B2 (en) * | 2016-12-13 | 2018-07-17 | Ford Global Technologies, Llc | Micro-electromechanical system for use in vehicle doors to increase sound quality vehicle performance of the vehicle doors |
| ES2887380T3 (es) * | 2017-05-24 | 2021-12-22 | Siemens Mobility GmbH | Control de condición de un elemento de desgaste por uso |
| KR102616698B1 (ko) | 2017-07-07 | 2023-12-21 | 오티스 엘리베이터 컴파니 | 엘레베이터 상태 모니터링 시스템 |
| DE102017130002A1 (de) * | 2017-12-14 | 2019-06-19 | Gebr. Bode Gmbh & Co. Kg | Verfahren zur zustandsbasierten Instandhaltung einer Zugangsvorrichtung |
| US11785029B2 (en) * | 2018-03-05 | 2023-10-10 | British Telecommunications Public Limited Company | Vehicular network security |
| JP7219062B2 (ja) * | 2018-11-22 | 2023-02-07 | 東日本旅客鉄道株式会社 | 車両用戸閉装置の異常検出方法 |
| US10495544B1 (en) * | 2019-01-15 | 2019-12-03 | Caterpillar Inc. | Failure detection device for detecting an issue with a part of a machine |
| WO2020192918A1 (de) * | 2019-03-28 | 2020-10-01 | Siemens Aktiengesellschaft | Verfahren zum instandhalten einer elektrischen komponente |
| US10843566B2 (en) * | 2019-04-26 | 2020-11-24 | Waymo Llc | Audible passenger announcements for autonomous vehicle services |
| KR102235728B1 (ko) * | 2019-05-28 | 2021-04-05 | 한국철도기술연구원 | 전동차의 전기식 출입문 고장예측 장치 |
| US11853047B2 (en) * | 2019-09-03 | 2023-12-26 | Augury Systems Ltd. | Sensor-agnostic mechanical machine fault identification |
| EP3792138A1 (de) * | 2019-09-13 | 2021-03-17 | Knorr-Bremse Gesellschaft mit beschränkter Haftung | Verfahren und vorrichtung zum bereitstellen einer instandhaltungsinformation über ein türsystem für ein fahrzeug und türsystem für ein fahrzeug |
| KR102274302B1 (ko) * | 2020-04-27 | 2021-07-07 | 주식회사 글로비즈 | 철도 차량의 도어의 결함을 진단하고 남은 수명을 계산하는 방법 및 장치 |
| KR102347601B1 (ko) * | 2020-12-02 | 2022-01-07 | 한국교통대학교산학협력단 | 출입문 고장 진단 및 예지 서버, 출입문 고장 진단 및 예지 시스템 및 출입문 고장 진단 및 예지 방법 |
| JP7664707B2 (ja) * | 2021-02-04 | 2025-04-18 | ナブテスコ株式会社 | 自動ドア保守支援装置、自動ドア保守支援方法、プログラム |
| US20230245507A1 (en) * | 2022-01-31 | 2023-08-03 | The Boeing Company | Efficient Feature Reduction For Component Fault Prediction |
| CN119202699B (zh) * | 2024-11-27 | 2025-03-11 | 中国人民解放军火箭军工程大学 | 一种设备健康状态影响因素溯源方法、设备、介质及产品 |
Citations (3)
| Publication number | Priority date | Publication date | Assignee | Title |
|---|---|---|---|---|
| WO2001034446A1 (en) * | 1999-11-05 | 2001-05-17 | Bombardier Transportation Gmbh | Light rail vehicle having predictive diagnostic system for motor driven automated doors |
| US20060255757A1 (en) * | 2003-03-11 | 2006-11-16 | Sommer Antriebs-Und Frunktechnik Gmbh | Method and device for controlling a door/gate drive |
| US20070139216A1 (en) * | 2000-09-08 | 2007-06-21 | Automotive Technologies International, Inc. | Vehicular Component Control Using Wireless Switch Assemblies |
Family Cites Families (24)
| Publication number | Priority date | Publication date | Assignee | Title |
|---|---|---|---|---|
| US5239779A (en) * | 1990-03-22 | 1993-08-31 | Masco Industries, Inc. | Control apparatus for powered vehicle door systems |
| US5069000A (en) * | 1990-03-22 | 1991-12-03 | Masco Industries, Inc. | Reversing apparatus for powered vehicle door systems |
| US5140316A (en) * | 1990-03-22 | 1992-08-18 | Masco Industries, Inc. | Control apparatus for powered vehicle door systems |
| US6064165A (en) * | 1992-04-22 | 2000-05-16 | Nartron Corporation | Power window or panel controller |
| US5979114A (en) * | 1995-07-12 | 1999-11-09 | Valeo Electrical Systems, Inc. | Electronic control and method for power sliding van door with rear-center-mounted drive |
| US6904717B2 (en) * | 1995-07-12 | 2005-06-14 | Valeo Electrical Systems, Inc. | Method for controlling a power sliding van door |
| GB2311811B (en) * | 1996-04-04 | 1998-07-08 | Mitsui Mining & Smelting Co | Powered sliding device for a vehicle sliding door |
| AU2001286951A1 (en) * | 2000-09-01 | 2002-03-13 | Braun Corporation | Electronic controller for vehicular wheelchair access |
| SE520075C2 (sv) * | 2000-12-01 | 2003-05-20 | Safenet I Harads Ab | Förfarande vid klämskyddsanordningar samt anordning för genomförande av förfarandet |
| US6719356B2 (en) * | 2001-04-26 | 2004-04-13 | Litens Automotive | Powered opening mechanism and control system |
| CA2444670A1 (en) * | 2002-09-27 | 2004-03-27 | Litens Automotive | Low-mounted powered opening system and control mechanism |
| DE10331207A1 (de) * | 2003-07-10 | 2005-01-27 | Daimlerchrysler Ag | Verfahren und Vorrichtung zur Vorhersage einer Ausfall-Häufigkeit |
| US20060181108A1 (en) * | 2003-09-29 | 2006-08-17 | Cleland Terry P | Low-mounted powered opening system and control mechanism |
| JP4277656B2 (ja) * | 2003-11-14 | 2009-06-10 | 富士電機システムズ株式会社 | ドア駆動制御装置 |
| JP2005349972A (ja) * | 2004-06-11 | 2005-12-22 | Apollo Giken Kk | 車両用ドアの安全制御装置 |
| US7816878B2 (en) * | 2007-02-01 | 2010-10-19 | The Braun Corporation | Vehicle access control system |
| US8373550B2 (en) * | 2008-08-20 | 2013-02-12 | Control Solutions LLC | Door assist system controller and method |
| JP5178471B2 (ja) * | 2008-11-19 | 2013-04-10 | 株式会社東芝 | 最適部分波形データ生成装置及び方法ならびにロープ状態判定装置及び方法 |
| US8527441B2 (en) * | 2011-03-10 | 2013-09-03 | GM Global Technology Operations LLC | Developing fault model from service procedures |
| US20120283963A1 (en) * | 2011-05-05 | 2012-11-08 | Mitchell David J | Method for predicting a remaining useful life of an engine and components thereof |
| JP2013049550A (ja) * | 2011-08-31 | 2013-03-14 | Hitachi Building Systems Co Ltd | エレベータドア診断装置 |
| JP6209905B2 (ja) * | 2013-09-04 | 2017-10-11 | 富士電機株式会社 | ドア制御装置 |
| JP6204151B2 (ja) * | 2013-11-08 | 2017-09-27 | 東日本旅客鉄道株式会社 | 車両用戸閉装置のメンテナンス時期判定方法 |
| US9286735B1 (en) * | 2014-09-26 | 2016-03-15 | International Business Machines Corporation | Generating cumulative wear-based indicators for vehicular components |
-
2014
- 2014-12-23 US US14/582,118 patent/US9984513B2/en active Active
-
2015
- 2015-12-11 JP JP2015242276A patent/JP6653165B2/ja not_active Expired - Fee Related
- 2015-12-14 EP EP15199966.1A patent/EP3038048A1/en not_active Ceased
-
2018
- 2018-05-28 US US15/990,778 patent/US11244521B2/en active Active
-
2022
- 2022-02-07 US US17/666,275 patent/US12198482B2/en active Active
-
2025
- 2025-01-13 US US19/018,652 patent/US20250225826A1/en active Pending
Patent Citations (3)
| Publication number | Priority date | Publication date | Assignee | Title |
|---|---|---|---|---|
| WO2001034446A1 (en) * | 1999-11-05 | 2001-05-17 | Bombardier Transportation Gmbh | Light rail vehicle having predictive diagnostic system for motor driven automated doors |
| US20070139216A1 (en) * | 2000-09-08 | 2007-06-21 | Automotive Technologies International, Inc. | Vehicular Component Control Using Wireless Switch Assemblies |
| US20060255757A1 (en) * | 2003-03-11 | 2006-11-16 | Sommer Antriebs-Und Frunktechnik Gmbh | Method and device for controlling a door/gate drive |
Cited By (28)
| Publication number | Priority date | Publication date | Assignee | Title |
|---|---|---|---|---|
| EP3319050A1 (en) * | 2016-11-04 | 2018-05-09 | Hitachi, Ltd. | Vehicle operation data collection apparatus, vehicle operation data collection system, and vehicle operation data collection method |
| US10713866B2 (en) | 2016-11-04 | 2020-07-14 | Hitachi, Ltd. | Vehicle operation data collection apparatus, vehicle operation data collection system, and vehicle operation data collection method |
| CN107153841B (zh) * | 2017-04-24 | 2020-02-18 | 南京康尼机电股份有限公司 | 一种城市轨道交通车辆门系统的亚健康预测方法 |
| CN107153841A (zh) * | 2017-04-24 | 2017-09-12 | 南京康尼机电股份有限公司 | 一种城市轨道交通车辆门系统的亚健康预测方法 |
| CN107328589A (zh) * | 2017-06-28 | 2017-11-07 | 南京工程学院 | 一种轨道车辆门系统远程监测系统及其监测方法 |
| FR3072408A1 (fr) * | 2017-10-18 | 2019-04-19 | Alstom Transport Technologies | Procede et systeme de diagnostic de fonctionnement d'un dispositif automatique ou semi-automatique d'acces a un vehicule de transport |
| EP3473794A1 (fr) * | 2017-10-18 | 2019-04-24 | ALSTOM Transport Technologies | Procédé et système de diagnostic de fonctionnement d'un dispositif automatique ou semi-automatique d'accès à un véhicule de transport |
| US10907394B2 (en) | 2017-10-18 | 2021-02-02 | Alstom Transport Technologies | Diagnostic operation method and system for a transport vehicle automatic or semi-automatic access device |
| US11176762B2 (en) | 2018-02-08 | 2021-11-16 | Geotab Inc. | Method for telematically providing vehicle component rating |
| US11282304B2 (en) | 2018-02-08 | 2022-03-22 | Geotab Inc. | Telematically monitoring a condition of an operational vehicle component |
| US10713864B2 (en) | 2018-02-08 | 2020-07-14 | Geotab Inc. | Assessing historical telematic vehicle component maintenance records to identify predictive indicators of maintenance events |
| EP3525178A1 (en) * | 2018-02-08 | 2019-08-14 | GEOTAB Inc. | Telematically providing replacement indications for operational vehicle components |
| EP3525176A1 (en) * | 2018-02-08 | 2019-08-14 | GEOTAB Inc. | Telematics predictive vehicle component monitoring system |
| US10937257B2 (en) | 2018-02-08 | 2021-03-02 | Geotab Inc. | Telematically monitoring and predicting a vehicle battery state |
| EP3525177A1 (en) * | 2018-02-08 | 2019-08-14 | GEOTAB Inc. | Telematically monitoring a condition of an operational vehicle component |
| US11182987B2 (en) | 2018-02-08 | 2021-11-23 | Geotab Inc. | Telematically providing remaining effective life indications for operational vehicle components |
| US11182988B2 (en) | 2018-02-08 | 2021-11-23 | Geotab Inc. | System for telematically providing vehicle component rating |
| EP3525179A1 (en) * | 2018-02-08 | 2019-08-14 | GEOTAB Inc. | Assessing historical telematic vehicle component maintenance records to identify predictive indicators of maintenance events |
| US11282306B2 (en) | 2018-02-08 | 2022-03-22 | Geotab Inc. | Telematically monitoring and predicting a vehicle battery state |
| US12080113B2 (en) | 2018-02-08 | 2024-09-03 | Geotab Inc. | Telematically monitoring a condition of an operational vehicle component |
| US11544973B2 (en) | 2018-02-08 | 2023-01-03 | Geotab Inc. | Telematically monitoring and predicting a vehicle battery state |
| US11620863B2 (en) | 2018-02-08 | 2023-04-04 | Geotab Inc. | Predictive indicators for operational status of vehicle components |
| US11625958B2 (en) | 2018-02-08 | 2023-04-11 | Geotab Inc. | Assessing historical telematic vehicle component maintenance records to identify predictive indicators of maintenance events |
| US11663859B2 (en) | 2018-02-08 | 2023-05-30 | Geotab Inc. | Telematically providing replacement indications for operational vehicle components |
| US11887414B2 (en) | 2018-02-08 | 2024-01-30 | Geotab Inc. | Telematically monitoring a condition of an operational vehicle component |
| US12056966B2 (en) | 2018-02-08 | 2024-08-06 | Geotab Inc. | Telematically monitoring a condition of an operational vehicle component |
| US12067815B2 (en) | 2018-02-08 | 2024-08-20 | Geotab Inc. | Telematically monitoring a condition of an operational vehicle component |
| EP4044133A1 (de) * | 2021-02-10 | 2022-08-17 | Bode - Die Tür GmbH | Verfahren zur übertragung von zustandsdaten einer zugangsvorrichtung eines fahrzeugs |
Also Published As
| Publication number | Publication date |
|---|---|
| JP6653165B2 (ja) | 2020-02-26 |
| US20220157097A1 (en) | 2022-05-19 |
| US12198482B2 (en) | 2025-01-14 |
| US20160180610A1 (en) | 2016-06-23 |
| US11244521B2 (en) | 2022-02-08 |
| US20180276915A1 (en) | 2018-09-27 |
| US20250225826A1 (en) | 2025-07-10 |
| US9984513B2 (en) | 2018-05-29 |
| JP2016118546A (ja) | 2016-06-30 |
Similar Documents
| Publication | Publication Date | Title |
|---|---|---|
| US12198482B2 (en) | System and method for determining vehicle component conditions | |
| KR102618023B1 (ko) | 고장유형에 따른 패턴 분석을 통한 고장 예지 진단시스템 및 방법 | |
| JP5016519B2 (ja) | 予測的状態監視のための診断システムおよび方法 | |
| US10992697B2 (en) | On-board networked anomaly detection (ONAD) modules | |
| Tsui et al. | Prognostics and health management: A review on data driven approaches | |
| RU2540830C2 (ru) | Адаптивное дистанционное обслуживание подвижных составов | |
| KR101713985B1 (ko) | 예지 정비 방법 및 장치 | |
| US20210090359A1 (en) | Predictive vehicle diagnostic method | |
| Cárdenas-Gallo et al. | An ensemble classifier to predict track geometry degradation | |
| US8732112B2 (en) | Method and system for root cause analysis and quality monitoring of system-level faults | |
| Satta et al. | A dissimilarity-based approach to predictive maintenance with application to HVAC systems | |
| Ghasemi et al. | Estimating mean residual life for a case study of rail wagon bearings | |
| Davari et al. | A fault detection framework based on lstm autoencoder: A case study for volvo bus data set | |
| Azevedo et al. | Estimation of health indicators using advanced analytics for prediction of aircraft systems remaining useful lifetime | |
| Leoni et al. | A derivative, integral, and proportional features extractor for fault detection in dynamic processes | |
| Vagnoli et al. | A machine learning classifier for condition monitoring and damage detection of bridge infrastructure | |
| Shakerian et al. | Improving the prediction accuracy of data-driven fault diagnosis for HVAC systems by applying the synthetic minority oversampling technique | |
| Ing et al. | Approach for integrating condition monitoring information and forecasting methods to enhance spare parts supply chain planning | |
| Geramifard | Hidden Markov model-based methods in condition monitoring of machinery systems | |
| van de Sand | A predictive maintenance model for heterogeneous industrial refrigeration systems | |
| JP2021067667A5 (enExample) | ||
| Wang | Reliability analysis and data driven modelling of railway component failure | |
| Shi | Cost-Safety-Aware Inspection Strategy for Truck Fleets with Limited Historical Data | |
| Güneş | Unsupervised learning approach for detection and localization of structural damage using output-only measurements | |
| Hand et al. | Warranty Repairs Reimagined through Machine Learning and Statistical Pattern Recognition (Part 1) |
Legal Events
| Date | Code | Title | Description |
|---|---|---|---|
| PUAI | Public reference made under article 153(3) epc to a published international application that has entered the european phase |
Free format text: ORIGINAL CODE: 0009012 |
|
| AK | Designated contracting states |
Kind code of ref document: A1 Designated state(s): AL AT BE BG CH CY CZ DE DK EE ES FI FR GB GR HR HU IE IS IT LI LT LU LV MC MK MT NL NO PL PT RO RS SE SI SK SM TR |
|
| AX | Request for extension of the european patent |
Extension state: BA ME |
|
| STAA | Information on the status of an ep patent application or granted ep patent |
Free format text: STATUS: REQUEST FOR EXAMINATION WAS MADE |
|
| 17P | Request for examination filed |
Effective date: 20170102 |
|
| RBV | Designated contracting states (corrected) |
Designated state(s): AL AT BE BG CH CY CZ DE DK EE ES FI FR GB GR HR HU IE IS IT LI LT LU LV MC MK MT NL NO PL PT RO RS SE SI SK SM TR |
|
| STAA | Information on the status of an ep patent application or granted ep patent |
Free format text: STATUS: EXAMINATION IS IN PROGRESS |
|
| 17Q | First examination report despatched |
Effective date: 20190920 |
|
| STAA | Information on the status of an ep patent application or granted ep patent |
Free format text: STATUS: THE APPLICATION HAS BEEN REFUSED |
|
| 18R | Application refused |
Effective date: 20211018 |