EP2864760B1 - Heterogeneous fluid sample characterization - Google Patents
Heterogeneous fluid sample characterization Download PDFInfo
- Publication number
- EP2864760B1 EP2864760B1 EP13744770.2A EP13744770A EP2864760B1 EP 2864760 B1 EP2864760 B1 EP 2864760B1 EP 13744770 A EP13744770 A EP 13744770A EP 2864760 B1 EP2864760 B1 EP 2864760B1
- Authority
- EP
- European Patent Office
- Prior art keywords
- particles
- images
- dimensional array
- particle
- acquiring
- Prior art date
- Legal status (The legal status is an assumption and is not a legal conclusion. Google has not performed a legal analysis and makes no representation as to the accuracy of the status listed.)
- Active
Links
- 239000012530 fluid Substances 0.000 title claims description 70
- 238000012512 characterization method Methods 0.000 title description 4
- 239000002245 particle Substances 0.000 claims description 193
- 238000000034 method Methods 0.000 claims description 90
- 238000011192 particle characterization Methods 0.000 claims description 48
- 238000001514 detection method Methods 0.000 claims description 34
- 239000006185 dispersion Substances 0.000 claims description 34
- 238000005259 measurement Methods 0.000 claims description 32
- 230000008569 process Effects 0.000 claims description 23
- 230000006641 stabilisation Effects 0.000 claims description 6
- 238000011105 stabilization Methods 0.000 claims description 6
- 230000008859 change Effects 0.000 claims description 5
- 238000002156 mixing Methods 0.000 claims description 5
- 239000000523 sample Substances 0.000 description 85
- 230000006870 function Effects 0.000 description 24
- 238000005286 illumination Methods 0.000 description 23
- 239000007788 liquid Substances 0.000 description 17
- 238000003384 imaging method Methods 0.000 description 16
- 238000013459 approach Methods 0.000 description 10
- 238000003705 background correction Methods 0.000 description 9
- 238000004519 manufacturing process Methods 0.000 description 9
- 238000012935 Averaging Methods 0.000 description 8
- 239000000356 contaminant Substances 0.000 description 7
- 238000000527 sonication Methods 0.000 description 7
- 239000000725 suspension Substances 0.000 description 7
- 238000004364 calculation method Methods 0.000 description 6
- 102000004169 proteins and genes Human genes 0.000 description 6
- 108090000623 proteins and genes Proteins 0.000 description 6
- 230000001427 coherent effect Effects 0.000 description 5
- 150000001875 compounds Chemical class 0.000 description 5
- 238000003908 quality control method Methods 0.000 description 5
- 239000006229 carbon black Substances 0.000 description 4
- 230000000295 complement effect Effects 0.000 description 4
- 238000010586 diagram Methods 0.000 description 4
- 239000002270 dispersing agent Substances 0.000 description 4
- 238000002296 dynamic light scattering Methods 0.000 description 4
- 210000005069 ears Anatomy 0.000 description 4
- 238000002474 experimental method Methods 0.000 description 4
- 239000000463 material Substances 0.000 description 4
- 239000000203 mixture Substances 0.000 description 4
- 239000007787 solid Substances 0.000 description 4
- 238000001370 static light scattering Methods 0.000 description 4
- 238000002604 ultrasonography Methods 0.000 description 4
- 238000010947 wet-dispersion method Methods 0.000 description 4
- 238000012937 correction Methods 0.000 description 3
- 238000011156 evaluation Methods 0.000 description 3
- 230000000877 morphologic effect Effects 0.000 description 3
- 238000012545 processing Methods 0.000 description 3
- 238000010926 purge Methods 0.000 description 3
- 238000000275 quality assurance Methods 0.000 description 3
- 238000012360 testing method Methods 0.000 description 3
- -1 Mining Substances 0.000 description 2
- 238000004458 analytical method Methods 0.000 description 2
- 230000008901 benefit Effects 0.000 description 2
- 239000012620 biological material Substances 0.000 description 2
- 239000003814 drug Substances 0.000 description 2
- 229920006333 epoxy cement Polymers 0.000 description 2
- 229910052751 metal Inorganic materials 0.000 description 2
- 239000002184 metal Substances 0.000 description 2
- 238000013048 microbiological method Methods 0.000 description 2
- 239000004005 microsphere Substances 0.000 description 2
- 239000004033 plastic Substances 0.000 description 2
- 239000000843 powder Substances 0.000 description 2
- 230000003134 recirculating effect Effects 0.000 description 2
- 238000011160 research Methods 0.000 description 2
- 238000005070 sampling Methods 0.000 description 2
- 238000001228 spectrum Methods 0.000 description 2
- 229910001220 stainless steel Inorganic materials 0.000 description 2
- 239000010935 stainless steel Substances 0.000 description 2
- 238000012546 transfer Methods 0.000 description 2
- 239000002699 waste material Substances 0.000 description 2
- 230000005653 Brownian motion process Effects 0.000 description 1
- 206010035148 Plague Diseases 0.000 description 1
- 239000004793 Polystyrene Substances 0.000 description 1
- 241000220317 Rosa Species 0.000 description 1
- 229910000831 Steel Inorganic materials 0.000 description 1
- 241000700605 Viruses Species 0.000 description 1
- 241000607479 Yersinia pestis Species 0.000 description 1
- 230000001133 acceleration Effects 0.000 description 1
- 230000009471 action Effects 0.000 description 1
- 239000004480 active ingredient Substances 0.000 description 1
- 230000002776 aggregation Effects 0.000 description 1
- 238000004220 aggregation Methods 0.000 description 1
- 229910052782 aluminium Inorganic materials 0.000 description 1
- XAGFODPZIPBFFR-UHFFFAOYSA-N aluminium Chemical compound [Al] XAGFODPZIPBFFR-UHFFFAOYSA-N 0.000 description 1
- 238000000149 argon plasma sintering Methods 0.000 description 1
- 239000012472 biological sample Substances 0.000 description 1
- 238000005537 brownian motion Methods 0.000 description 1
- 230000015556 catabolic process Effects 0.000 description 1
- 238000004891 communication Methods 0.000 description 1
- 230000001276 controlling effect Effects 0.000 description 1
- 230000002596 correlated effect Effects 0.000 description 1
- 230000000875 corresponding effect Effects 0.000 description 1
- 230000007547 defect Effects 0.000 description 1
- 238000009826 distribution Methods 0.000 description 1
- 238000011143 downstream manufacturing Methods 0.000 description 1
- 230000000694 effects Effects 0.000 description 1
- 230000005284 excitation Effects 0.000 description 1
- 238000011010 flushing procedure Methods 0.000 description 1
- 238000009472 formulation Methods 0.000 description 1
- 239000007789 gas Substances 0.000 description 1
- 239000011521 glass Substances 0.000 description 1
- 230000005484 gravity Effects 0.000 description 1
- 239000005414 inactive ingredient Substances 0.000 description 1
- 229910052500 inorganic mineral Inorganic materials 0.000 description 1
- 239000000314 lubricant Substances 0.000 description 1
- 238000003754 machining Methods 0.000 description 1
- 230000007246 mechanism Effects 0.000 description 1
- 150000002739 metals Chemical class 0.000 description 1
- 239000011707 mineral Substances 0.000 description 1
- 238000005065 mining Methods 0.000 description 1
- 238000012986 modification Methods 0.000 description 1
- 230000004048 modification Effects 0.000 description 1
- 238000012544 monitoring process Methods 0.000 description 1
- 238000000465 moulding Methods 0.000 description 1
- 230000003287 optical effect Effects 0.000 description 1
- 230000036961 partial effect Effects 0.000 description 1
- 239000011236 particulate material Substances 0.000 description 1
- 239000008177 pharmaceutical agent Substances 0.000 description 1
- 239000008194 pharmaceutical composition Substances 0.000 description 1
- 239000000049 pigment Substances 0.000 description 1
- 229920001296 polysiloxane Polymers 0.000 description 1
- 229920002223 polystyrene Polymers 0.000 description 1
- 238000005086 pumping Methods 0.000 description 1
- 230000002829 reductive effect Effects 0.000 description 1
- 230000004044 response Effects 0.000 description 1
- 230000000717 retained effect Effects 0.000 description 1
- 230000002441 reversible effect Effects 0.000 description 1
- 238000005204 segregation Methods 0.000 description 1
- 230000035945 sensitivity Effects 0.000 description 1
- 238000009416 shuttering Methods 0.000 description 1
- 229920002545 silicone oil Polymers 0.000 description 1
- 238000004088 simulation Methods 0.000 description 1
- 241000894007 species Species 0.000 description 1
- 230000003595 spectral effect Effects 0.000 description 1
- 238000010972 statistical evaluation Methods 0.000 description 1
- 239000010959 steel Substances 0.000 description 1
- 230000001360 synchronised effect Effects 0.000 description 1
- 230000036962 time dependent Effects 0.000 description 1
- 238000004448 titration Methods 0.000 description 1
- 238000011144 upstream manufacturing Methods 0.000 description 1
- 238000005406 washing Methods 0.000 description 1
- XLYOFNOQVPJJNP-UHFFFAOYSA-N water Substances O XLYOFNOQVPJJNP-UHFFFAOYSA-N 0.000 description 1
Images


Classifications
-
- G—PHYSICS
- G01—MEASURING; TESTING
- G01N—INVESTIGATING OR ANALYSING MATERIALS BY DETERMINING THEIR CHEMICAL OR PHYSICAL PROPERTIES
- G01N15/00—Investigating characteristics of particles; Investigating permeability, pore-volume, or surface-area of porous materials
- G01N15/10—Investigating individual particles
- G01N15/14—Electro-optical investigation, e.g. flow cytometers
- G01N15/1434—Electro-optical investigation, e.g. flow cytometers using an analyser being characterised by its optical arrangement
- G01N15/1436—Electro-optical investigation, e.g. flow cytometers using an analyser being characterised by its optical arrangement the optical arrangement forming an integrated apparatus with the sample container, e.g. a flow cell
-
- G—PHYSICS
- G01—MEASURING; TESTING
- G01N—INVESTIGATING OR ANALYSING MATERIALS BY DETERMINING THEIR CHEMICAL OR PHYSICAL PROPERTIES
- G01N15/00—Investigating characteristics of particles; Investigating permeability, pore-volume, or surface-area of porous materials
- G01N15/10—Investigating individual particles
- G01N15/14—Electro-optical investigation, e.g. flow cytometers
- G01N15/1456—Electro-optical investigation, e.g. flow cytometers without spatial resolution of the texture or inner structure of the particle, e.g. processing of pulse signals
- G01N15/1459—Electro-optical investigation, e.g. flow cytometers without spatial resolution of the texture or inner structure of the particle, e.g. processing of pulse signals the analysis being performed on a sample stream
-
- G—PHYSICS
- G01—MEASURING; TESTING
- G01N—INVESTIGATING OR ANALYSING MATERIALS BY DETERMINING THEIR CHEMICAL OR PHYSICAL PROPERTIES
- G01N15/00—Investigating characteristics of particles; Investigating permeability, pore-volume, or surface-area of porous materials
- G01N15/10—Investigating individual particles
- G01N15/14—Electro-optical investigation, e.g. flow cytometers
- G01N15/1434—Electro-optical investigation, e.g. flow cytometers using an analyser being characterised by its optical arrangement
- G01N2015/144—Imaging characterised by its optical setup
- G01N2015/1443—Auxiliary imaging
-
- G—PHYSICS
- G01—MEASURING; TESTING
- G01N—INVESTIGATING OR ANALYSING MATERIALS BY DETERMINING THEIR CHEMICAL OR PHYSICAL PROPERTIES
- G01N15/00—Investigating characteristics of particles; Investigating permeability, pore-volume, or surface-area of porous materials
- G01N15/10—Investigating individual particles
- G01N15/14—Electro-optical investigation, e.g. flow cytometers
- G01N2015/1493—Particle size
Definitions
- This invention relates to a particle characterization method according to claim 1 and a particle characterization instrument according to claim 11.
- Lensless microfluidic detection techniques have been proposed to acquire microscopic images of samples such as biological materials and cells. They operate by acquiring images of suspended samples in close proximity to a high-resolution imaging detector. Their small size has resulted in their use being proposed in a variety of life science applications, including microscopes, smart petri dishes, and point-of-care diagnostic systems.
- JP2000146817-A discloses a method and apparatus for measuring a grain size distribution capable of determining grain properties of sample powder and controlling the dispersed state of the sample powder based on a result of this.
- the method includes causing a heterogeneous fluid sample comprising particles particles to flow past a two-dimensional array detector, and illuminating the heterogeneous fluid sample.
- the method also includes acquiring images of the particles as they flow past the two-dimensional array detector in the fluid, and applying a particle characterization function to the images for at least some of the suspended particles.
- the step of applying a particle characterization function can categorize the particles according to at least one morphological characteristic.
- the step of applying a particle characterization function can categorize the particles according to their shapes.
- the step of applying a particle characterization function can categorize the particles according to their sizes.
- the step of applying a particle characterization function can categorize the particles statistically.
- the step of illuminating can include a step of strobing a source for a plurality of short acquisition periods with the step of acquiring the images during the plurality of short acquisition periods.
- the method can further include the step of displaying the images of the particles in a sorted thumbnail view.
- the steps of suspending, causing, acquiring, and applying can be carried out as part of a molecular microbiological method.
- the steps of suspending, causing, acquiring, and applying can be part of a manufacturing process quality assurance cycle.
- the steps of suspending, causing, acquiring, and applying can be part of a manufacturing process quality control evaluation.
- the steps of suspending, causing, acquiring, and applying can be applied to evaluate a dispersion step.
- the steps of suspending, causing, acquiring, and applying can be applied to pharmaceutical composition particles.
- the step of applying a particle characterization function can apply a contaminant detection function.
- the step of applying a particle characterization function can apply a counterfeit detection function.
- the method can further include the step of performing an additional particle characterization operation while the particles are suspended in the same fluid.
- the further particle characterization operation can include a laser diffraction step.
- the further particle characterization operation can take place in parallel with the steps of causing, acquiring, and applying.
- the further particle characterization operation can take place in series with the steps of causing, acquiring, and applying.
- the method can further include the step of extracting images of individual particles from image data received in the step of acquiring and transferring these extracted images through a communication channel to a user computer.
- the step of causing the suspended particles to flow past a two-dimensional array detector can cause them to flow along a single flow path that has a profile that includes a detector flow region and a pair of bypass channels.
- the step of causing the suspended particles to flow past a two-dimensional array detector can cause them to flow along a path with substantially no zero-flow regions.
- the step of causing the suspended particles to flow past a two-dimensional array detector can cause them to flow at a flow rate of at least one liter per minute.
- the method can further include the step of applying a statistical function to image data from the two-dimensional array detector to gage heterogeneity.
- the statistical function may involve calculating a measure of entropy in the plurality of acquire images.
- the measure of entropy may be calculated from a sum of probabilities of pixel values or differences between adjacent pixel values in each acquired images being a given value.
- the fluid can be a liquid.
- the particles may be individual particles or agglomerates of particles suspended in a fluid, which may be a liquid or a gas.
- the particles may alternatively be droplets of a first liquid dispersed in a second liquid or gas, the first and second fluids being immiscible.
- the particles may be solid, porous or hollow.
- the particles may be biological particles such as cells, proteins or virus particles.
- a particle characterization instrument that includes a two-dimensional array detector, channel walls mounted to the detector for defining a channel to hold a fluid containing a sample in contact with the two-dimensional detector, a driver to move the fluid through the channel, an imaging illumination source positioned to illuminate particles in the fluid while it is in contact with the two-dimensional detector, and a coherent scattering illumination source positioned to illuminate particles in the fluid.
- the coherent scattering illumination source can be positioned to interact with the fluid while it is in contact with the two-dimensional detector with the two-dimensional detector being positioned to both detect light from particles illuminated by the imaging illumination detector and to detect light scattered by particles in the fluid illuminated by the coherent scattering illumination source.
- the instrument can further include a scattering detector positioned to receive light scattered by particles in the fluid illuminated by the coherent scattering illumination source.
- Another example not forming part of the claimed invention features a particle characterization method that includes suspending particles in a fluid, causing the suspended particles to flow in the fluid past a two-dimensional array detector, and acquiring a plurality of calibration images of the particles as they flow past the two-dimensional array detector in the fluid, illuminating the suspended particles as they flow past the two-dimensional array detector in the fluid, acquiring a plurality of sample images of the particles as they flow past the two-dimensional array detector in the fluid, and correcting the sample images of the particles using the calibration images.
- the calibration images are preferably acquired prior to acquiring the sample images, although in some cases may be acquired after the sample images are acquired.
- the step of correcting can perform a flat-field correction.
- the step of acquiring a plurality of calibration images of the particles can acquire illuminated images and dark images.
- the method can further include the step of averaging the acquired calibration images to reduce the effect of the suspended particles in a result of the step of averaging.
- the method can further include the step of discarding pixels exceeding a predetermined threshold in the calibration images before the step of averaging.
- the invention features a particle characterization instrument that includes means for causing particles suspended in a fluid to flow past a two-dimensional array detector, means for illuminating the suspended particles as they flow past the two-dimensional array detector in the fluid, means for acquiring a plurality of images of the particles as they flow past the two-dimensional array detector in the fluid, and means for applying a particle characterization function to results from the means for acquiring for at least some of the suspended particles, wherein the instrument is configured to perform the method of any of claims 1 to 10.
- a further example not forming part of the claimed invention features a particle characterization method that includes suspending particles in a fluid, causing a first subset of the suspended particles to flow past a first two-dimensional array detector, illuminating the first subset of suspended particles as they flow past the first two-dimensional array detector in the fluid, acquiring a plurality of images of the first subset of particles as they flow past the first two-dimensional array detector in the fluid, causing a second subset of the suspended particles to flow past a second two-dimensional array detector, illuminating the second subset of suspended particles as they flow past the second two-dimensional array detector in the fluid, and acquiring a plurality of images of the second subset of particles as they flow past the second two-dimensional array detector in the fluid.
- the step of causing a first subset of the suspended particles to flow past the first two-dimensional array detector and the step of causing a second subset of the suspended particles to flow past the second two-dimensional array detector can be performed in series.
- the step of causing a first subset of the suspended particles to flow past the first two-dimensional array detector and the step of causing a second subset of the suspended particles to flow past the second two-dimensional array detector can be performed in parallel.
- the method can further include the step of combining information from the images from the first and second two-dimensional array detectors.
- the step of causing a first subset of the suspended particles to flow past the first two-dimensional array detector and the step of causing a second subset of the suspended particles to flow past the second two-dimensional array detector can together cause the average size of particles that flow over the second array to be larger than the average size of particles that flow over the first array.
- the step of causing a first subset of the suspended particles to flow past the first two-dimensional array detector can cause the first subset of particles to flow through a first channel that has a first depth in front of the first detector
- the step of causing a second subset of the suspended particles to flow past the second two-dimensional array detector can cause the second subset of particles to flow through a second channel that has a second depth in front of the second detector, and wherein the first depth is deeper than the second depth.
- the step of causing a first subset of the suspended particles to flow past the first two-dimensional array detector can cause the first subset of particles to flow through a first compound channel that includes an imaging subchannel and one or more bypass subchannels that are larger than the imaging channel, with the step of causing a second subset of the suspended particles to flow past the second two-dimensional array detector causing the second subset of particles to flow through a second compound channel that includes an imaging subchannel and one or more bypass subchannels that are larger than the imaging channel.
- the step of causing a first subset of the suspended particles to flow past the first two-dimensional array detector can cause the first subset of particles to flow through a first compound channel that includes an imaging subchannel and one or more bypass subchannels that are larger than the imaging channel, with the step of causing a second subset of the suspended particles to flow past the second two-dimensional array detector causing the second subset of particles to flow through a second compound channel that includes an imaging subchannel and one or more bypass subchannels that are larger than the imaging channel.
- the method can further include the step of causing one or more further subsets of the suspended particles to flow past one or more further two-dimensional array detectors, illuminating the further subsets of suspended particles as they flow past the further two-dimensional array detectors in the fluid, and acquiring a plurality of images of the further subsets of particles as they flow past the further two-dimensional array detectors in the fluid.
- a further example not forming part of the claimed invention features a particle characterization instrument that includes a first two dimensional detector, a second two-dimensional detector, channel walls mounted to the first and second two-dimensional detectors for defining a first channel to hold a fluid containing a sample in contact with the first two-dimensional detector and defining a second channel to hold the fluid containing a sample in contact with the second two-dimensional detector, wherein the first channel and the second channel are hydraulically connected and have a different cross-section, a driver to move the fluid through the channels, and an imaging illumination source positioned to illuminate particles in the fluid while it is in contact with the two-dimensional detector.
- the channel walls can define serial channels.
- a further example not forming part of the claimed invention features a particle characterization instrument that includes means for causing a first subset of the suspended particles to flow past a first two-dimensional array detector, means for illuminating the first subset of suspended particles as they flow past the first two-dimensional array detector in the fluid, means for acquiring a plurality of images of the first subset of particles as they flow past the first two-dimensional array detector in the fluid, means for causing a second subset of the suspended particles to flow past a second two-dimensional array detector, means for illuminating the second subset of suspended particles as they flow past the second two-dimensional array detector in the fluid, and means for acquiring a plurality of images of the second subset of particles as they flow past the second two-dimensional array detector in the fluid.
- the instrument according to the invention can help to characterize a variety of different particulate materials in industrial settings, such as in the manufacture of pharmaceuticals. This can help to provide ongoing quality control and quality assurance in the manufacture of such materials.
- a further example not forming part of the claimed invention features a heterogeneous fluid sample characterization method, the method comprising:
- the method may include the step of suspending solid particles or mixing a plurality of fluids in the plurality of fluid samples to thereby introduce heterogeneity in those samples.
- the method may include a further step of drawing one or more portions of the samples to mix the samples.
- the step of drawing one or more portions of the samples to mix the samples may be carried out after the steps of acquiring.
- the method may further include further steps of acquiring images after the further step of drawing, the further step of drawing being performed with a higher flow rate than the steps of drawing.
- the method may further include the step of discarding the first portion of the first sample after the step of acquiring a first image of the first sample and before the step of drawing a first portion of the second sample.
- the method may include washing the probe after discarding the first portion of the first sample and before drawing a first portion of the second sample.
- the method may further include steps of automatically positioning the probe relative to the first and second samples.
- the steps of automatically positioning may be performed by an x-y stage or by an x-y-z stage.
- the step of illuminating may include a step of strobing a source (e.g. a light source) for a plurality of short acquisition periods and acquiring the images during the plurality of short acquisition periods.
- the acquisition periods may for example be less than one second, and are preferably less than one tenth of a second.
- the method may include the step of displaying the acquired images of the particles in a sorted thumbnail view.
- the steps of suspending, causing, acquiring, and applying may be carried out as part of a molecular microbiological method, performed for a biological sample, pharmaceutical sample, industrial sample or as part of a manufacturing process quality control evaluation.
- the steps of suspending, causing, acquiring, and applying may be applied to evaluate a dispersion step.
- the step of applying a particle characterization function may apply a contaminant detection function or a counterfeit detection function.
- the step of causing the suspended particles to flow past a two-dimensional array detector may cause the suspended particles to flow along a single flow path having a profile that includes a detector flow region and a pair of bypass channels, or to flow along a path with substantially no zero-flow regions.
- the suspended particles may be caused to flow at a flow rate of at least one liter per minute or at a flow rate of less than about two milliliters per minute.
- the method may include the step of applying a statistical function to image data from the two-dimensional array detector to gage heterogeneity.
- the statistical function may involve calculating a measure of entropy in the plurality of acquired images.
- the measure of entropy may be calculated from a sum of probabilities of pixel values or differences between adjacent pixel values in each acquired image being a given value.
- the fluid may be a liquid, and may contain solid particles or agglomerates suspended in a liquid, or alternatively droplets of a first liquid dispersed in a second liquid, the first and second liquids being immiscible.
- the invention features a particle characterization method, comprising:
- the method may include the step of dispersing the heterogeneous fluid sample.
- the step of dispersing may for example involve mixing the heterogeneous fluid sample or sonicating particles in the heterogeneous fluid sample, i.e. applying ultrasound energy to the fluid sample.
- the step of acquiring an image may take place in a flow from an in-line particle disperser, and the method may further include the step of returning the particles to the in-line particle disperser after the step of acquiring.
- the method may include the step of reporting the detection of a predetermined state of the dispersion metric.
- the method may include the step of reporting the detection of a stabilization of the dispersion metric.
- the method may include adjusting a process that is applied to the fluid based on the dispersion metric in real time.
- the method may include the step of performing a second measurement on the heterogeneous fluid sample.
- the second measurement may be a laser diffraction measurement.
- the dispersion metric may be used to trigger the second measurement in real time.
- the dispersion metric may be used to validate the second measurement.
- the method may include the step of reporting the detection of a predetermined state of the dispersion metric.
- the method may include the step of reporting the detection of a stabilization or detection of a rate of change of the dispersion metric.
- the method may include adjusting a process that is applied to the fluid based on the dispersion metric in real time.
- the method may include the step of performing a second measurement on the heterogeneous fluid sample.
- the second measurement may be a laser diffraction measurement.
- the dispersion metric may be used to trigger the second measurement in real time.
- the dispersion metric may be used to validate the second measurement.
- the step of extracting a dispersion metric from the images may apply an entropy function to the images.
- a particle characterization system 10 characterizes particles from a particle source 12, such as an industrial process.
- the process can perform a number of different types of operations on the particles, such as creating them, modifying them, and/or mixing the particles.
- the process is a dispersive process that disperses the active and inactive ingredients of a pharmaceutical agent.
- the system 10 also includes one or more illumination drivers 14 that drive one or more illumination sources 16a... 16n. These sources can be of a variety of different types and can exhibit a variety of different spectral characteristics. Some examples include visible wavelength illumination sources, narrowband coherent fluorescence excitation sources, or even simple ambient light sources.
- the illumination driver 14 includes strobing circuitry that allows short illumination pulses to be produced.
- the particle source 12 provides particles that are suspended in a liquid that is passed through a microfluidic detection cell 20.
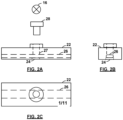
- the cell 20 includes a hydraulic channel 26 that passes above or alongside a two-dimensional array detector 24, such as a CCD or CMOS array detector.
- This cell 20 can be fabricated using a variety of different techniques, such as by machining a metal block or molding a plastic part to define a channel between a pair of walls 22a, 22b above the detector 24.
- the suspended particles can be conveyed through the microfluidic system in a variety of known ways, such as by pumping, gravity, or by capillary action.
- a cell channel block 22 can be machined in an aluminum block with a rectangular channel 26, with rounded corners, passing through its length just above its bottom.
- a recess in the bottom of the block holds a two-dimensional detector 24 below a window shaft 27.
- a window bolt 28 can then be slid into the window shaft 27 such that the bolt 28 protrudes into the channel 26 and thereby narrows it at a portion of the block 22.
- the window bolt 28 has a transparent bottom through which light from a source 16 can shine into the narrow portion of the channel.
- the height of the window bolt is adjustable.
- the bolt creates an "eared" channel 26 that includes a first ear 26a on one side of the window bolt 28 and a second ear 26c on the other side of the bolt 28.
- an imaging region 26b Between the two ears and below the bolt 28 is an imaging region 26b. This region is between the lower transparent surface of the window bolt 28 and the upper surface of the detector array 24.
- the channel 26 has a profile that includes a detector flow region 26b and a pair of bypass channels 26a, 26c on either side of the detector flow region 26b, the detector flow region being optionally defined by a space between the two-dimensional array detector 24 and an end surface of an adjustable bolt 28 extending into a microfluidic detection cell 20 of the particle characterization instrument.
- the adjustable bolt 28 is preferably configured to allow illumination of the detector flow region 26b by an illumination source (see figure 1 ) through an end surface of the bolt 28.
- This channel shape has been found to work well in the relatively high pressures that are found in some industrial processes, because it does not appear to cause aggregation or segregation, which can plague other geometries. This is believed to be at least in part because this channel shape does not appear to exhibit any zero-flow regions.
- the ears or bypass channels 26a, 26c also provide an escape area for occasional large contaminant particles that might otherwise block the channel, which is required to be narrow in order to ensure a clear image of the particles in suspension. Simulations have confirmed that, unlike with other geometries, different sizes of particles in a mixture will tend to flow evenly into the imaging area instead of becoming segregated, and that larger contaminant particles will generally make their way into the ears instead of building up in front of the window bolt.
- the cell channel block 22 may be glued to the array detector 24 with an epoxy cement, although other methods of attachment are of course possible. It is contemplated that a larger channel block could be glued to more than one detector to allow for a larger single detection area or more than one detection area. These sets of detectors can help a system to acquire more data per unit time because large array detectors tend to take a long time to read. These sets of detectors can also provide apparent flow rates, which can be correlated with full flow rates. Detectors can be oriented at 90 degrees, as well, so as to provide different views of a same field of particles.
- the suspended particles move on to downstream processing 30, which can include further operations on the particles, further characterization of the particles, or both.
- the suspended particles are provided to an off-the-shelf laser diffraction system for to further characterize them after the microfluidic detection.
- the microfluidic detection can also take place after one or more other types of detection, or even in parallel with them.
- Detection systems that can provide information that is complementary to the microfluidic cell include any type of optical detection system that can operate on suspended particles, such as laser diffraction, Dynamic Light Scattering (DLS), or Static Light Scattering (SLS).
- Laser diffraction is a well known technique for determining particle sizes.
- light from a laser is shone into a suspension of particles.
- the particles scatter the light, with smaller particles scattering the light at larger angles than bigger particles.
- the scattered light can be measured by a series of photodetectors placed at different angles. This is known as the diffraction pattern for the sample.
- the diffraction pattern can be used to measure the size of the particles using light scattering theory that was developed in the early 20th century by Mie. As the instrument measures "clouds" of particles rather than individual ones, it is known as an "ensemble" technique.
- DLS is also a well-known ensemble technique in which suspended particles scatter laser illumination.
- the time dependent fluctuation of the scattering is measured to understand Brownian motion in the sample. This provides information about the dynamic properties of particle systems, such as the hydrodynamic radius of the particles.
- SLS statically measures scattered light intensity of light at different angles to obtain the molecular weight of suspended particles.
- Some instruments such as the Zetasizer Nano, available from Malvern, Inc. of Malvern, UK, can perform both DLS and SLS measurements.
- particles or groups of particles meeting one or more predetermined criteria can first be marked as preapproved using one upstream technique. Data from the application of one or more downstream techniques then need only be retained for particles that are preapproved. The preapproval can even gate the downstream technique so as to prevent any downstream acquisitions from taking place for non-preapproved particles.
- An image acquisition subsystem acquires images from the two-dimensional array detector 24.
- This subsystem can be synchronized with the source in the case of strobed illumination, allowing for high-speed acquisition of particle images. With a suitable strobe sequence, the system can even acquire more than one image as it passes through the channel.
- a particle characterization subsystem 42 can apply one of a number of different particle characterization functions to the particles, such as by categorizing them into defined morphological and/or color categories. Particles can also be counted and their occurrences can be statistically analyzed.
- Parameter Example value Definition ID 516 Unique ID of the particle - allocated in the order that the particles are detected Magnification 2.50 Magnification used to make the measurement CE diameter ( ⁇ m) 904.14 The diameter of a circle with the same area as the particle Length ( ⁇ m) 1306.35 All possible lines from one point of the perimeter to another point on the perimeter are projected on the major axis (axis of minimum rotational energy).
- the maximum length of these projections is the length of the object. Width ( ⁇ m) 678.54 All possible lines from one point of the perimeter to another point on the perimeter are projected on the minor axis. The maximum length of these projections is the width of the object. Max. Distance ( ⁇ m) 1318.07 Largest distance between any two pixels in particle Perimeter ( ⁇ m) 3619.42 Actual perimeter of particle Major axis° 105.52 Axis of minimum rotational energy Area ( ⁇ m 2 ) 371550.78 Actual area of particle in sq.
- any of the measured characteristics and associated counts and/or statistical information can then be used in a variety of ways to evaluate the particles. For example, they can be compared with stored known-good criteria to evaluate whether the process is operating within a predetermined specification, they can be shown to the user on a workstation as images or in sortable thumbnail views, or they can be used to adjust the process.
- the system can also calculate average grey scale values for the full field (average pixel brightness and pixel standard deviation) in order to provide a measure of homogeneity.
- a relatively steady average brightness and standard deviation suggests a relatively steady flow of particles.
- a change in brightness (or standard deviation) implies a change in particle flow.
- a few large particles in an otherwise steady flow of small particles, for example, should cause a lower average brightness (and average brightness & standard deviation is easy to plot).
- This simple calculation won't provide as much information as size/morphology calculations provide, but the calculation can be done without requiring any additional hardware.
- One type of simple calculation that can be performed is to calculate a dispersion metric, as described below in connection with Figs. 11-14 .
- the system can acquire different types of information about the suspended sample particles. For example, a first strobed acquisition can acquire successive visible-wavelength images of a particle in the channel. A second narrow-band source can then be turned on to detect any particles that fluoresce or to detect scattering patterns.
- a wet dispersion unit 50 includes an optional dispersant pump 52 that feeds a top end of a sample tank 55 that is equipped with a central stirrer 54, and a centrifugal pump 56 and an in-line ultrasound probe (or "sonication system") 58 at the bottom end of the tank.
- MMM Metals, Mining, and Minerals
- the tank also includes a measurement branch line that begins at the bottom of the tank and returns back to the top of the tank as well a as a drain line at the bottom of the tank.
- the measurement loop includes a microfluidic detection cell 20 and another measurement cell, such as one for an off-the-shelf laser diffraction system.
- the dispersant pump 52 feeds dispersant into the sample chamber 55, the stirrer 54 mixes particles into the dispersant, and the in-line ultrasound probe 58 breaks up the particles.
- the centrifugal pump 56 circulates the fluid so that it can be repeatedly stirred and sonicated.
- the microfluidic detection cell 20 and the other cell can monitor the dispersed particles as they are recirculated.
- the detection cell can also be positioned in a return conduit from the complementary detection system.
- the two complementary detection processes can even take place in parallel or on separate branch lines from the process conduit.
- a channel block as shown in connection with Figs. 2-3 was glued to a 5-megapixel iPhone(R) camera chip with an epoxy cement.
- a suspension was made up of a mixture of 80 micron and 20 polystyrene microspheres with the four times as many of the smaller microspheres than the larger ones suspended in water. This suspension was pumped through the channel at a 2-liter-per-minute flow rate.
- the suspension was illuminated with a strobed, white-light LED. Instead of using the chip's built-in shuttering capabilities, its sensor was left in acquisition mode and strobe pulses were used to define the acquisition period. The image shown in Fig. 4 was acquired, and the thumbnail set shown in Fig. 5 was assembled.
- the suspension was also passed through a Mastersizer ® laser diffraction system, available from Malvern Instruments Limited of Malvern, UK. As predicted, the measurement from this system tended to favor the larger particles. But with the images from the microfluidic cell, this measurement can be corrected or put in the proper context.
- the particle images can also be sorted according to their morphological characteristics as discussed in more detail in US Pat. No. 8,111,395 .
- a local processor coupled to the detector can extract images of the particles themselves and only transfer these to a user computer for characterization. This can substantially reduce the amount of data transferred by eliminating transfers of white space.
- the particle characterization system 10 can provide a software control that allows it to perform a flat-field correction in the presence of sample particles without purging or flushing.
- This flat field correction adjusts for imaging error sources, such as uneven illumination, surface reflections, defects (e.g., surface scratches), and non-uniform pixel response of the detector. Performing this type of correction on the fly without purging the instrument can significantly speed up operation and can simplify hookups by eliminating the need for a dedicated purge or flush path.
- the on-the-fly flat-field correction can be performed in either of two ways.
- the system acquires a large number of frames and averages corresponding pixels in those frames. Since particles in each image are reasonably sparse, and will appear at random positions during each frame, the averaging will reduce the impact of any particles.
- performing the flat-field correction may involve deriving an average image from a plurality of calibration images and correcting sample images of the particles using the derived average image.
- the intensity of particle imprint is generally reduced to about 1/N, where N is the number of frames, so a higher number of frames improves the result.
- N is the number of frames
- This approach has been tested for 2% obscuration with different numbers of frames from 10 to over 100 frames. Good results appear to require at least 50 frames, and particle contribution is very difficult to see in the 100-frame average. With a system that can acquire 7.5 frames per second, reasonable results could therefore be achieved in 15 - 30 seconds.
- the number of calibration images used in deriving the average image is preferably 50 or more, and may optionally be up to 100 images.
- a threshold level is set that indicates the presence of a particle.
- the flat-field correction may be performed by acquiring a plurality of calibration images and deriving an average of the plurality of calibration images after removing portions of each of the calibration images having pixels that differ in value from a mean value by more than a predetermined factor.
- the predetermined factor may for example be a multiple of a standard deviation of each calibration image. The multiple may be one.
- the value of the pixels may for example be a brightness value.
- the outlier removal method can be performed on fewer frames (e.g., 10-20 frames), and the resulting background image is free from "traces" of particles that are visible in the averaging method. Part of the computation can be performed while acquiring data (summing pixel values and squared pixel values for the standard deviation).
- the process can also be made to be massively parallel, and thus lend itself to General-Purpose Computing On Graphics Processing Units (GPGPU) acceleration.
- GPGPU General-Purpose Computing On Graphics Processing Units
- the outlier removal method has the disadvantage of higher memory usage, because all collected frames remain in memory for the entire process, and it is computationally more expensive than the averaging method. In a general aspect therefore, the number of calibration images acquired for this flat-field correction method may be fewer than 50, and may be between 10 and 20.
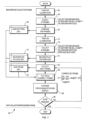
- the particle characterization system 10 begins a set of flat-field corrected acquisition operations 60 by turning off the illumination (step 62). It then acquires a number of frames, such as 100 frames (step 64), and averages them using one of the averaging approaches described above (step 66). The result is stored as a dark pattern data set (step 68).
- the particle characterization system 10 then turns on the illumination (step 72). It then acquires a number of frames, such as 100 frames (step 74), and averages them using one of the averaging approaches described above (step 76). The result is stored as a background pattern data set (step 78).
- the particle characterization system 10 can then acquire a sample image frame (step 80) and store it as raw frame data set (step 82).
- This raw frame data set (RF) is then corrected using the dark pattern data set (DP) and background pattern data set (BP).
- the corrected frame (CF) can then be stored, displayed, or otherwise processed (step 86). If further sample image frames are needed the process of acquisition and correction can be repeated (see step 88). It is possible to derive simpler flat-field correction solutions that may be more computationally efficient, although they may not behave as well as the exact solution above, particularly for non-uniform illumination.
- a three-channel serial multichannel particle characterization system 90 includes three back-to-back detectors 92a ... 92c positioned under a single illumination window 94 (although multiple illumination windows and/or multiple illumination sources may also be used). In operation, this system allows the first detector 92a to sample larger particles and subsequent detectors to sample smaller and smaller ones, with larger ones passing through the bypass channels. The results can be used separately or combined.
- a parallel multichannel particle characterization system 96 in which the flow is divided across different side-by-side channels, can also be built.
- Multichannel particle characterization systems can be built with any suitable number of detectors and it may also be possible to vary channel dimensions over the length of a single detector. These types of systems can also be built in a variety of ways. They can be built as a compound structure as illustrated in Fig. 8 , for example, or they could be built with a series of microfluidic detection cells 20 (see Figs. 1 and 2 ) connected in series with tubing.
- the systems can include one or more eared bypass channels for some or all of the detectors, depending on system requirements. Smaller-sample systems will tend to have lower bypass flows or even no bypass flow, for example, and larger re-circulating systems will have larger bypass flows.
- a high-throughput version of the particle characterization system can also be built using one or more microfluidic detection cells.
- a single-channel system 100 uses a sampling probe 102 to perform successive measurements on a number of liquid samples held in different vessels, such as wells 116 of a multi-well plate 114 or carousel.
- the system 100 uses a reversible pressure source 104 that is hydraulically connected to a sipper tube 106 via an in-line microfluidic detection cell 20. While a single-channel system is shown here, different kinds of multichannel high-throughput systems can also be designed.
- an off-the-shelf x-y-z stage is provided to successively position the samples under the probe, although other types of mechanisms can be used to position the vessels and probe relative to each other. Wash and waste vessels can also be provided, either in the plate, or separately.
- the x-y-z stage begins by positioning a first of the wells below the probe 102 to select a first sample and the pressure source 104 draws the sample into the sipper tube 106 and through the detector 20.
- the image acquisition module then acquires an image of the first sample from each of the microfluidic detection cells.
- the first sample can then be returned to the first well or it can be discarded into a waste well, and the probe can be washed in a wash well. If there are more samples to process, the x-y-z stage can select the next sample in the sequence. The process can then be repeated until there are no further samples to be tested, or some other condition is reached.
- the high-throughput system can be applied to a number of different applications, such as research or quality control/quality assurance applications.
- the material to be imaged may be well homogenized prior to aspiration by the probe.
- a dispersion step may be performed before sampling, such as with a stirrer.
- the pressure source in the probe itself could be used to mix the sample, such as by aspiring and expelling the sample repeatedly. This could allow larger contaminant particles such as flakes of plastic or stainless steel, which might otherwise sink, to be detected in quality control situations. It could also create droplets of liquid contaminants, such as silicone lubricants, that can be detected.
- the probe can perform a first low-flow-rate pass to image intact particles and/or aggregates, followed by a more vigorous mixing that may suspend higher density particles in the sample before a second set of images is taken.
- a probe moves to a sample cup and draws up a small sample (e.g., ⁇ 500 ⁇ l) at low flow rate (typically ⁇ 2 ml/min) and images that sample. The sample is then flushed back into the same sample cup at higher rate to agitate the sample. The sample is then again drawn into the imaging flow cell for analysis.
- a small sample e.g., ⁇ 500 ⁇ l
- low flow rate typically ⁇ 2 ml/min
- the first images will show any protein aggregates, but probably not show higher density materials (e.g., steel or glass particles) that may have settled in the sample cup. Later images will tend to show any higher density particles.
- Fluid density for the formulations is expected to range from 0.997 g/ml to 1.08 g/ml with dynamic viscosity of 1 to 20 centipoise.
- Protein aggregate densities should range from 1 g/ml (loose aggregate) to 1.4 g/ml (tight aggregate).
- Particulate contaminant densities are expected to range from 0.97 g/ml (silicone oil) to 8 g/ml (stainless steel).
- Systems according to the invention can be configured to handle different types of materials.
- industrial applications can provide for flow rates of 2 liters per minute or more with bypass and recirculation features.
- a system that handles delicate proteins might operate at a non-recirculating, no-bypass flow rate of 2 milliliters per minute or less.
- a lower end flow rate for the recirculating flow cell (with ears for bypass flow) is probably on the order of 100ml/minute, although more typical is greater than 1 l/minute.
- a lower end flow rate for a small volume (bio) flow cell (no bypass flow) is probably on the order of 100 ⁇ l/minute, with typical flow rate of 0.4 - 1.5ml/minute.
- systems according to the invention can apply a dispersion metric to determine in real time how well the particles are dispersed using the in-line ultrasound probe 50 in a process known as sonication. More specifically, after dispersion begins, the microfluidic detection cell 20 acquires images (step 124) and repeatedly computes a value for the dispersion metric for these images (step 126) and determines whether it has stabilized by comparing it with earlier values. Reaching a stabilized dispersion metric value indicates that the particle size in the instrument has reached a steady state, such as a state where the particles are non-aggregated (primary) particles. This indication can be used to initiate measurements using the other measurement cell or to validate measurements where they are ongoing. The stabilization signal can also be used to cause sonication to be stopped or slowed.
- the statistical function used on acquired image data to gage heterogeneity may involve calculating a measure of entropy in the plurality of acquired images.
- the measure of entropy of each acquired image may be calculated from a sum of probabilities of pixel values or differences between adjacent pixel values in the image being a given value.
- dispersion metrics can include performing image processing calculations or statistical evaluations, such as by computing means, skews, and/or standard deviations. More detailed types of analyses can also be undertaken, such as ones in which distances between nearest neighbors are calculated and/or ones in which differently sized, differently shaped, or differently shaped particles are analyzed independently.
- There are also different ways to test the dispersion metric such as by testing for rates of change, thresholds, or target ranges of one or more parameters. The test may be performed to seek an end point, like in a titration, but it can also be used in other ways, such as by being added as another field in a measurement data set or by using it as a feedback parameter in a process to keep the process within acceptable limits.
- Continuously monitoring a quick calculation for stabilization might be of more use in a real-time industrial process environment, for example, while evaluating a more complex function for a particular end condition might be more suited to analyzing mixtures of different particle species in a research setting, such as in a situation where polydispersity or complex proteins are present. It may also be desirable in some circumstances to perform a series of experiments under different conditions, such as with different flow rates or blender speeds.
- a sample of carbon black was introduced in the wet dispersion process shown in Fig. 6 and a first image 130 was acquired ( Fig. 13 ).
- This initial image shows that there were initially a number of significantly aggregated particles and this is reflected in the lower initial dispersion index (region 121 in figure 12 ).
- the dispersion index rose and finally stabilized at a higher level (region 125), as shown in Fig. 12 .
- An image taken after stabilization confirms that the aggregated particles had been broken up.
- the dispersion index is derived from a measure of entropy, as described above. An increase in the entropy of the acquired images therefore indicates an increase in dispersion of particles in the sample.
Landscapes
- Chemical & Material Sciences (AREA)
- Dispersion Chemistry (AREA)
- Physics & Mathematics (AREA)
- Health & Medical Sciences (AREA)
- Life Sciences & Earth Sciences (AREA)
- Analytical Chemistry (AREA)
- Biochemistry (AREA)
- General Health & Medical Sciences (AREA)
- General Physics & Mathematics (AREA)
- Immunology (AREA)
- Pathology (AREA)
- Investigating Or Analysing Materials By Optical Means (AREA)
- Investigating, Analyzing Materials By Fluorescence Or Luminescence (AREA)
- Investigating Or Analysing Biological Materials (AREA)
- Sampling And Sample Adjustment (AREA)
Description
- This invention relates to a particle characterization method according to
claim 1 and a particle characterization instrument according to claim 11. - Lensless microfluidic detection techniques have been proposed to acquire microscopic images of samples such as biological materials and cells. They operate by acquiring images of suspended samples in close proximity to a high-resolution imaging detector. Their small size has resulted in their use being proposed in a variety of life science applications, including microscopes, smart petri dishes, and point-of-care diagnostic systems.
JP2000146817-A - The method includes causing a heterogeneous fluid sample comprising particles particles to flow past a two-dimensional array detector, and illuminating the heterogeneous fluid sample. The method also includes acquiring images of the particles as they flow past the two-dimensional array detector in the fluid, and applying a particle characterization function to the images for at least some of the suspended particles.
- In preferred embodiments the step of applying a particle characterization function can categorize the particles according to at least one morphological characteristic. The step of applying a particle characterization function can categorize the particles according to their shapes. The step of applying a particle characterization function can categorize the particles according to their sizes. The step of applying a particle characterization function can categorize the particles statistically. The step of illuminating can include a step of strobing a source for a plurality of short acquisition periods with the step of acquiring the images during the plurality of short acquisition periods. The method can further include the step of displaying the images of the particles in a sorted thumbnail view. The steps of suspending, causing, acquiring, and applying can be carried out as part of a molecular microbiological method. The steps of suspending, causing, acquiring, and applying can be part of a manufacturing process quality assurance cycle. The steps of suspending, causing, acquiring, and applying can be part of a manufacturing process quality control evaluation. The steps of suspending, causing, acquiring, and applying can be applied to evaluate a dispersion step. The steps of suspending, causing, acquiring, and applying can be applied to pharmaceutical composition particles. The step of applying a particle characterization function can apply a contaminant detection function. The step of applying a particle characterization function can apply a counterfeit detection function. The method can further include the step of performing an additional particle characterization operation while the particles are suspended in the same fluid. The further particle characterization operation can include a laser diffraction step. The further particle characterization operation can take place in parallel with the steps of causing, acquiring, and applying. The further particle characterization operation can take place in series with the steps of causing, acquiring, and applying. The method can further include the step of extracting images of individual particles from image data received in the step of acquiring and transferring these extracted images through a communication channel to a user computer. The step of causing the suspended particles to flow past a two-dimensional array detector can cause them to flow along a single flow path that has a profile that includes a detector flow region and a pair of bypass channels. The step of causing the suspended particles to flow past a two-dimensional array detector can cause them to flow along a path with substantially no zero-flow regions. The step of causing the suspended particles to flow past a two-dimensional array detector can cause them to flow at a flow rate of at least one liter per minute.
- The method can further include the step of applying a statistical function to image data from the two-dimensional array detector to gage heterogeneity. The statistical function may involve calculating a measure of entropy in the plurality of acquire images. The measure of entropy may be calculated from a sum of probabilities of pixel values or differences between adjacent pixel values in each acquired images being a given value.
- The fluid can be a liquid. The particles may be individual particles or agglomerates of particles suspended in a fluid, which may be a liquid or a gas. The particles may alternatively be droplets of a first liquid dispersed in a second liquid or gas, the first and second fluids being immiscible. The particles may be solid, porous or hollow. The particles may be biological particles such as cells, proteins or virus particles.
- Another example not forming part of the claimed invention features a particle characterization instrument that includes a two-dimensional array detector, channel walls mounted to the detector for defining a channel to hold a fluid containing a sample in contact with the two-dimensional detector, a driver to move the fluid through the channel, an imaging illumination source positioned to illuminate particles in the fluid while it is in contact with the two-dimensional detector, and a coherent scattering illumination source positioned to illuminate particles in the fluid.
- In preferred embodiments the coherent scattering illumination source can be positioned to interact with the fluid while it is in contact with the two-dimensional detector with the two-dimensional detector being positioned to both detect light from particles illuminated by the imaging illumination detector and to detect light scattered by particles in the fluid illuminated by the coherent scattering illumination source. The instrument can further include a scattering detector positioned to receive light scattered by particles in the fluid illuminated by the coherent scattering illumination source.
- Another example not forming part of the claimed invention features a particle characterization method that includes suspending particles in a fluid, causing the suspended particles to flow in the fluid past a two-dimensional array detector, and acquiring a plurality of calibration images of the particles as they flow past the two-dimensional array detector in the fluid, illuminating the suspended particles as they flow past the two-dimensional array detector in the fluid, acquiring a plurality of sample images of the particles as they flow past the two-dimensional array detector in the fluid, and correcting the sample images of the particles using the calibration images. The calibration images are preferably acquired prior to acquiring the sample images, although in some cases may be acquired after the sample images are acquired.
- In preferred embodiments the step of correcting can perform a flat-field correction. The step of acquiring a plurality of calibration images of the particles can acquire illuminated images and dark images. The method can further include the step of averaging the acquired calibration images to reduce the effect of the suspended particles in a result of the step of averaging. The method can further include the step of discarding pixels exceeding a predetermined threshold in the calibration images before the step of averaging.
- The invention features a particle characterization instrument that includes means for causing particles suspended in a fluid to flow past a two-dimensional array detector, means for illuminating the suspended particles as they flow past the two-dimensional array detector in the fluid, means for acquiring a plurality of images of the particles as they flow past the two-dimensional array detector in the fluid, and means for applying a particle characterization function to results from the means for acquiring for at least some of the suspended particles, wherein the instrument is configured to perform the method of any of
claims 1 to 10. - A further example not forming part of the claimed invention features a particle characterization method that includes suspending particles in a fluid, causing a first subset of the suspended particles to flow past a first two-dimensional array detector, illuminating the first subset of suspended particles as they flow past the first two-dimensional array detector in the fluid, acquiring a plurality of images of the first subset of particles as they flow past the first two-dimensional array detector in the fluid, causing a second subset of the suspended particles to flow past a second two-dimensional array detector, illuminating the second subset of suspended particles as they flow past the second two-dimensional array detector in the fluid, and acquiring a plurality of images of the second subset of particles as they flow past the second two-dimensional array detector in the fluid.
- In preferred embodiments, the step of causing a first subset of the suspended particles to flow past the first two-dimensional array detector and the step of causing a second subset of the suspended particles to flow past the second two-dimensional array detector can be performed in series. The step of causing a first subset of the suspended particles to flow past the first two-dimensional array detector and the step of causing a second subset of the suspended particles to flow past the second two-dimensional array detector can be performed in parallel. The method can further include the step of combining information from the images from the first and second two-dimensional array detectors. The step of causing a first subset of the suspended particles to flow past the first two-dimensional array detector and the step of causing a second subset of the suspended particles to flow past the second two-dimensional array detector can together cause the average size of particles that flow over the second array to be larger than the average size of particles that flow over the first array. The step of causing a first subset of the suspended particles to flow past the first two-dimensional array detector can cause the first subset of particles to flow through a first channel that has a first depth in front of the first detector, and the step of causing a second subset of the suspended particles to flow past the second two-dimensional array detector can cause the second subset of particles to flow through a second channel that has a second depth in front of the second detector, and wherein the first depth is deeper than the second depth. The step of causing a first subset of the suspended particles to flow past the first two-dimensional array detector can cause the first subset of particles to flow through a first compound channel that includes an imaging subchannel and one or more bypass subchannels that are larger than the imaging channel, with the step of causing a second subset of the suspended particles to flow past the second two-dimensional array detector causing the second subset of particles to flow through a second compound channel that includes an imaging subchannel and one or more bypass subchannels that are larger than the imaging channel. The step of causing a first subset of the suspended particles to flow past the first two-dimensional array detector can cause the first subset of particles to flow through a first compound channel that includes an imaging subchannel and one or more bypass subchannels that are larger than the imaging channel, with the step of causing a second subset of the suspended particles to flow past the second two-dimensional array detector causing the second subset of particles to flow through a second compound channel that includes an imaging subchannel and one or more bypass subchannels that are larger than the imaging channel. The method can further include the step of causing one or more further subsets of the suspended particles to flow past one or more further two-dimensional array detectors, illuminating the further subsets of suspended particles as they flow past the further two-dimensional array detectors in the fluid, and acquiring a plurality of images of the further subsets of particles as they flow past the further two-dimensional array detectors in the fluid.
- A further example not forming part of the claimed invention features a particle characterization instrument that includes a first two dimensional detector, a second two-dimensional detector, channel walls mounted to the first and second two-dimensional detectors for defining a first channel to hold a fluid containing a sample in contact with the first two-dimensional detector and defining a second channel to hold the fluid containing a sample in contact with the second two-dimensional detector, wherein the first channel and the second channel are hydraulically connected and have a different cross-section, a driver to move the fluid through the channels, and an imaging illumination source positioned to illuminate particles in the fluid while it is in contact with the two-dimensional detector. In preferred embodiments the channel walls can define serial channels.
- A further example not forming part of the claimed invention features a particle characterization instrument that includes means for causing a first subset of the suspended particles to flow past a first two-dimensional array detector, means for illuminating the first subset of suspended particles as they flow past the first two-dimensional array detector in the fluid, means for acquiring a plurality of images of the first subset of particles as they flow past the first two-dimensional array detector in the fluid, means for causing a second subset of the suspended particles to flow past a second two-dimensional array detector, means for illuminating the second subset of suspended particles as they flow past the second two-dimensional array detector in the fluid, and means for acquiring a plurality of images of the second subset of particles as they flow past the second two-dimensional array detector in the fluid.
- The instrument according to the invention can help to characterize a variety of different particulate materials in industrial settings, such as in the manufacture of pharmaceuticals. This can help to provide ongoing quality control and quality assurance in the manufacture of such materials.
- A further example not forming part of the claimed invention features a heterogeneous fluid sample characterization method, the method comprising:
- inserting a probe into a first of a plurality of heterogeneous fluid samples;
- drawing at least a first portion of the first sample into the probe and past a two-dimensional array detector;
- illuminating the first portion of the first sample as it is drawn past the two-dimensional array detector;
- acquiring at least a first image of the first portion of the first sample as it is drawn past the two-dimensional array detector;
- inserting the probe into a second of the plurality of heterogeneous samples;
- drawing at least a first portion of the second sample into the probe and past a two-dimensional array detector;
- illuminating the first portion of the second sample as it is drawn past the two-dimensional array detector in the fluid; and
- acquiring at least a first image of the first portion of the second sample as it is drawn past the two-dimensional array detector in the fluid.
- The method may include the step of suspending solid particles or mixing a plurality of fluids in the plurality of fluid samples to thereby introduce heterogeneity in those samples.
- The method may include a further step of drawing one or more portions of the samples to mix the samples.
- The step of drawing one or more portions of the samples to mix the samples may be carried out after the steps of acquiring. The method may further include further steps of acquiring images after the further step of drawing, the further step of drawing being performed with a higher flow rate than the steps of drawing.
- The method may further include the step of discarding the first portion of the first sample after the step of acquiring a first image of the first sample and before the step of drawing a first portion of the second sample. The method may include washing the probe after discarding the first portion of the first sample and before drawing a first portion of the second sample.
- The method may further include steps of automatically positioning the probe relative to the first and second samples. The steps of automatically positioning may be performed by an x-y stage or by an x-y-z stage.
- The step of illuminating may include a step of strobing a source (e.g. a light source) for a plurality of short acquisition periods and acquiring the images during the plurality of short acquisition periods. The acquisition periods may for example be less than one second, and are preferably less than one tenth of a second.
- The method may include the step of displaying the acquired images of the particles in a sorted thumbnail view.
- The steps of suspending, causing, acquiring, and applying may be carried out as part of a molecular microbiological method, performed for a biological sample, pharmaceutical sample, industrial sample or as part of a manufacturing process quality control evaluation.
- The steps of suspending, causing, acquiring, and applying may be applied to evaluate a dispersion step.
- The step of applying a particle characterization function may apply a contaminant detection function or a counterfeit detection function.
- The step of causing the suspended particles to flow past a two-dimensional array detector may cause the suspended particles to flow along a single flow path having a profile that includes a detector flow region and a pair of bypass channels, or to flow along a path with substantially no zero-flow regions. The suspended particles may be caused to flow at a flow rate of at least one liter per minute or at a flow rate of less than about two milliliters per minute.
- The method may include the step of applying a statistical function to image data from the two-dimensional array detector to gage heterogeneity. The statistical function may involve calculating a measure of entropy in the plurality of acquired images. The measure of entropy may be calculated from a sum of probabilities of pixel values or differences between adjacent pixel values in each acquired image being a given value. The fluid may be a liquid, and may contain solid particles or agglomerates suspended in a liquid, or alternatively droplets of a first liquid dispersed in a second liquid, the first and second liquids being immiscible.
- The invention features a particle characterization method, comprising:
- illuminating a heterogeneous fluid sample;
- causing the heterogeneous fluid sample to flow past a two-dimensional array detector;
- acquiring at least one image of the illuminated heterogeneous fluid sample; and
- extracting a summarizing metric from the images, and the step of extracting a summarizing metric includes extracting information about particle size or flow and
- extracting a dispersion metric from the images. The summarizing metric may include information about particle numbers or particle density. The step of extracting a dispersion metric from the images applies an entropy function to the images.
- The method may include the step of dispersing the heterogeneous fluid sample. The step of dispersing may for example involve mixing the heterogeneous fluid sample or sonicating particles in the heterogeneous fluid sample, i.e. applying ultrasound energy to the fluid sample.
- The step of acquiring an image may take place in a flow from an in-line particle disperser, and the method may further include the step of returning the particles to the in-line particle disperser after the step of acquiring. The method may include the step of reporting the detection of a predetermined state of the dispersion metric. The method may include the step of reporting the detection of a stabilization of the dispersion metric. The method may include adjusting a process that is applied to the fluid based on the dispersion metric in real time. The method may include the step of performing a second measurement on the heterogeneous fluid sample. The second measurement may be a laser diffraction measurement. The dispersion metric may be used to trigger the second measurement in real time. The dispersion metric may be used to validate the second measurement. The method may include the step of reporting the detection of a predetermined state of the dispersion metric.
- The method may include the step of reporting the detection of a stabilization or detection of a rate of change of the dispersion metric. The method may include adjusting a process that is applied to the fluid based on the dispersion metric in real time. The method may include the step of performing a second measurement on the heterogeneous fluid sample. The second measurement may be a laser diffraction measurement. The dispersion metric may be used to trigger the second measurement in real time. The dispersion metric may be used to validate the second measurement. The step of extracting a dispersion metric from the images may apply an entropy function to the images.
-
-
Fig. 1 is a block diagram of a particle characterization system according to the invention. -
Fig. 2A is a diagrammatic side-view sketch of a microfluidic cell block for use with the particle characterization system ofFig. 1 . -
Fig. 2B is a diagrammatic end-view sketch of the microfluidic cell block ofFig. 2A . -
Fig. 2C is a diagrammatic top-view sketch of the microfluidic cell block ofFig. 2A . -
Fig. 3 is an enlarged, partial cross-section of the microfluidic cell block ofFig. 2 that cuts through its window bolt perpendicularly to the direction of flow. -
Fig. 4 is an image acquired using the microfluidic cell block ofFig. 2 in the particle characterization system ofFig. 1 . -
Fig. 5 is a sorted thumbnail view of particles in an image such as the one shown inFig. 4 . -
Fig. 6 is an illustrative wet dispersion unit schematic for use with the particle characterization system ofFig. 1 . -
Fig. 7 is a flowchart illustrating the acquisition and processing of flat-field corrected frames for the particle characterization system ofFig. 1 . -
Fig. 8 is a side-view block diagram of a three-channel serial multichannel particle characterization system according to the invention. -
Fig. 9 is a top-view block diagram of a two-channel parallel multichannel particle characterization system according to the invention. -
Fig. 10 is a block diagram of an embodiment of a high-throughput particle characterization system according to the invention. -
Fig. 11 is a flowchart for an illustrative sonication process according to the invention. -
Fig. 12 is a plot of entropy against time for a sonification of carbon black experiment. -
Fig. 13 is an image of a carbon black sample acquired using the microfluidic cell block ofFig. 2 in the particle characterization system ofFig. 1 at the onset of the sonication experiment. -
Fig. 14 is an image of a carbon black sample acquired using the microfluidic cell block ofFig. 2 in the particle characterization system ofFig. 1 at the end of the sonication experiment. - Referring to
Fig. 1 , aparticle characterization system 10 according to the invention characterizes particles from aparticle source 12, such as an industrial process. The process can perform a number of different types of operations on the particles, such as creating them, modifying them, and/or mixing the particles. In one example, the process is a dispersive process that disperses the active and inactive ingredients of a pharmaceutical agent. - The
system 10 also includes one ormore illumination drivers 14 that drive one ormore illumination sources 16a... 16n. These sources can be of a variety of different types and can exhibit a variety of different spectral characteristics. Some examples include visible wavelength illumination sources, narrowband coherent fluorescence excitation sources, or even simple ambient light sources. In a preferred embodiment, theillumination driver 14 includes strobing circuitry that allows short illumination pulses to be produced. - The
particle source 12 provides particles that are suspended in a liquid that is passed through amicrofluidic detection cell 20. Thecell 20 includes ahydraulic channel 26 that passes above or alongside a two-dimensional array detector 24, such as a CCD or CMOS array detector. Thiscell 20 can be fabricated using a variety of different techniques, such as by machining a metal block or molding a plastic part to define a channel between a pair ofwalls detector 24. The suspended particles can be conveyed through the microfluidic system in a variety of known ways, such as by pumping, gravity, or by capillary action. - Referring to
Fig. 2 , in one embodiment acell channel block 22 can be machined in an aluminum block with arectangular channel 26, with rounded corners, passing through its length just above its bottom. A recess in the bottom of the block holds a two-dimensional detector 24 below awindow shaft 27. Awindow bolt 28 can then be slid into thewindow shaft 27 such that thebolt 28 protrudes into thechannel 26 and thereby narrows it at a portion of theblock 22. Thewindow bolt 28 has a transparent bottom through which light from asource 16 can shine into the narrow portion of the channel. In one embodiment, the height of the window bolt is adjustable. - Referring to
Fig. 3 , the bolt creates an "eared"channel 26 that includes afirst ear 26a on one side of thewindow bolt 28 and a second ear 26c on the other side of thebolt 28. Between the two ears and below thebolt 28 is animaging region 26b. This region is between the lower transparent surface of thewindow bolt 28 and the upper surface of thedetector array 24. In a general aspect therefore, thechannel 26 has a profile that includes adetector flow region 26b and a pair ofbypass channels 26a, 26c on either side of thedetector flow region 26b, the detector flow region being optionally defined by a space between the two-dimensional array detector 24 and an end surface of anadjustable bolt 28 extending into amicrofluidic detection cell 20 of the particle characterization instrument. Theadjustable bolt 28 is preferably configured to allow illumination of thedetector flow region 26b by an illumination source (seefigure 1 ) through an end surface of thebolt 28. - This channel shape has been found to work well in the relatively high pressures that are found in some industrial processes, because it does not appear to cause aggregation or segregation, which can plague other geometries. This is believed to be at least in part because this channel shape does not appear to exhibit any zero-flow regions. The ears or
bypass channels 26a, 26c also provide an escape area for occasional large contaminant particles that might otherwise block the channel, which is required to be narrow in order to ensure a clear image of the particles in suspension. Simulations have confirmed that, unlike with other geometries, different sizes of particles in a mixture will tend to flow evenly into the imaging area instead of becoming segregated, and that larger contaminant particles will generally make their way into the ears instead of building up in front of the window bolt. - The
cell channel block 22 may be glued to thearray detector 24 with an epoxy cement, although other methods of attachment are of course possible. It is contemplated that a larger channel block could be glued to more than one detector to allow for a larger single detection area or more than one detection area. These sets of detectors can help a system to acquire more data per unit time because large array detectors tend to take a long time to read. These sets of detectors can also provide apparent flow rates, which can be correlated with full flow rates. Detectors can be oriented at 90 degrees, as well, so as to provide different views of a same field of particles. - Referring again to
Fig. 1 , after passing through themicrofluidic detection cell 20, the suspended particles move on todownstream processing 30, which can include further operations on the particles, further characterization of the particles, or both. In one embodiment, the suspended particles are provided to an off-the-shelf laser diffraction system for to further characterize them after the microfluidic detection. But the microfluidic detection can also take place after one or more other types of detection, or even in parallel with them. Detection systems that can provide information that is complementary to the microfluidic cell include any type of optical detection system that can operate on suspended particles, such as laser diffraction, Dynamic Light Scattering (DLS), or Static Light Scattering (SLS). - Laser diffraction is a well known technique for determining particle sizes. In this technique, light from a laser is shone into a suspension of particles. The particles scatter the light, with smaller particles scattering the light at larger angles than bigger particles. The scattered light can be measured by a series of photodetectors placed at different angles. This is known as the diffraction pattern for the sample. The diffraction pattern can be used to measure the size of the particles using light scattering theory that was developed in the early 20th century by Mie. As the instrument measures "clouds" of particles rather than individual ones, it is known as an "ensemble" technique.
- DLS is also a well-known ensemble technique in which suspended particles scatter laser illumination. In this kind of technique, however, the time dependent fluctuation of the scattering is measured to understand Brownian motion in the sample. This provides information about the dynamic properties of particle systems, such as the hydrodynamic radius of the particles.
- SLS statically measures scattered light intensity of light at different angles to obtain the molecular weight of suspended particles. Some instruments, such as the Zetasizer Nano, available from Malvern, Inc. of Malvern, UK, can perform both DLS and SLS measurements.
- The combined approaches presented above can provide a level of insight into a particulate system that two separate measurements could not provide. Combining microfluidic detection with laser diffraction, for example, can allow a user to see images of particles before or after they pass through the laser diffraction system. While the laser diffraction system alone can provide precise size values, it is an ensemble technique that tends to favor high mass particles over smaller ones. With images coupled to these measurements, however, one can understand better what the laser diffraction measurement means.
- In one embodiment, particles or groups of particles meeting one or more predetermined criteria can first be marked as preapproved using one upstream technique. Data from the application of one or more downstream techniques then need only be retained for particles that are preapproved. The preapproval can even gate the downstream technique so as to prevent any downstream acquisitions from taking place for non-preapproved particles.
- An image acquisition subsystem acquires images from the two-
dimensional array detector 24. This subsystem can be synchronized with the source in the case of strobed illumination, allowing for high-speed acquisition of particle images. With a suitable strobe sequence, the system can even acquire more than one image as it passes through the channel. - A
particle characterization subsystem 42 can apply one of a number of different particle characterization functions to the particles, such as by categorizing them into defined morphological and/or color categories. Particles can also be counted and their occurrences can be statistically analyzed. The table below lists various illustrative ways in which particles can be characterized.Parameter Example value Definition ID 516 Unique ID of the particle - allocated in the order that the particles are detected Magnification 2.50 Magnification used to make the measurement CE diameter (µm) 904.14 The diameter of a circle with the same area as the particle Length (µm) 1306.35 All possible lines from one point of the perimeter to another point on the perimeter are projected on the major axis (axis of minimum rotational energy). The maximum length of these projections is the length of the object. Width (µm) 678.54 All possible lines from one point of the perimeter to another point on the perimeter are projected on the minor axis. The maximum length of these projections is the width of the object. Max. Distance (µm) 1318.07 Largest distance between any two pixels in particle Perimeter (µm) 3619.42 Actual perimeter of particle Major axis° 105.52 Axis of minimum rotational energy Area (µm2) 371550.78 Actual area of particle in sq. microns Area (pixels) 215018 Number of pixels in particle Circularity 0.785 Circumference of equivalent area circle divided by the actual perimeter of the particle = 2√ (π Area)/Perimeter HS Circularity 0.616 High sensitivity circularity (circularity squared) =4 πArea/perimeter2 Convexity 0.919 Convex hull perimeter divided by actual particle perimeter Solidity 0.905 Actual particle area divided by convex hull area Aspect ratio 0.519 Width divided by length Elongation 0.461 1 - aspect ratio Intensity mean 61.310 Average of all the greyscale values of every pixel in the particle Intensity standard deviation 29.841 Standard deviation of all the greyscale values of every pixel in the particle Center x position (µm) 271.5 x co-ordinate of center of mass of particle Center y position (µm) 186.3 y coordinate of center of mass of particle - Other characteristics can also be measured, and any of the measured characteristics and associated counts and/or statistical information can then be used in a variety of ways to evaluate the particles. For example, they can be compared with stored known-good criteria to evaluate whether the process is operating within a predetermined specification, they can be shown to the user on a workstation as images or in sortable thumbnail views, or they can be used to adjust the process.
- The system can also calculate average grey scale values for the full field (average pixel brightness and pixel standard deviation) in order to provide a measure of homogeneity. A relatively steady average brightness and standard deviation suggests a relatively steady flow of particles. A change in brightness (or standard deviation) implies a change in particle flow. A few large particles in an otherwise steady flow of small particles, for example, should cause a lower average brightness (and average brightness & standard deviation is easy to plot). This simple calculation won't provide as much information as size/morphology calculations provide, but the calculation can be done without requiring any additional hardware. One type of simple calculation that can be performed is to calculate a dispersion metric, as described below in connection with
Figs. 11-14 . - Through the use of more than one source, the system can acquire different types of information about the suspended sample particles. For example, a first strobed acquisition can acquire successive visible-wavelength images of a particle in the channel. A second narrow-band source can then be turned on to detect any particles that fluoresce or to detect scattering patterns.
- Systems according to the invention can be applied to a number of different types of processes, such as Metals, Mining, and Minerals (MMM) applications or the manufacture of pharmaceuticals, personal care products, foodstuffs, pigments, and biomaterials. An example of an application to a wet dispersion process is shown in
Fig. 6 . More specifically, awet dispersion unit 50 includes anoptional dispersant pump 52 that feeds a top end of asample tank 55 that is equipped with acentral stirrer 54, and acentrifugal pump 56 and an in-line ultrasound probe (or "sonication system") 58 at the bottom end of the tank. The tank also includes a measurement branch line that begins at the bottom of the tank and returns back to the top of the tank as well a as a drain line at the bottom of the tank. The measurement loop includes amicrofluidic detection cell 20 and another measurement cell, such as one for an off-the-shelf laser diffraction system. - In operation, the
dispersant pump 52 feeds dispersant into thesample chamber 55, thestirrer 54 mixes particles into the dispersant, and the in-line ultrasound probe 58 breaks up the particles. Thecentrifugal pump 56 circulates the fluid so that it can be repeatedly stirred and sonicated. Themicrofluidic detection cell 20 and the other cell can monitor the dispersed particles as they are recirculated. - Although this figure shows the detection cell at the intake of a complementary detection system, the detection cell can also be positioned in a return conduit from the complementary detection system. In some embodiments, the two complementary detection processes can even take place in parallel or on separate branch lines from the process conduit.
- A channel block as shown in connection with
Figs. 2-3 was glued to a 5-megapixel iPhone(R) camera chip with an epoxy cement. A suspension was made up of a mixture of 80 micron and 20 polystyrene microspheres with the four times as many of the smaller microspheres than the larger ones suspended in water. This suspension was pumped through the channel at a 2-liter-per-minute flow rate. - The suspension was illuminated with a strobed, white-light LED. Instead of using the chip's built-in shuttering capabilities, its sensor was left in acquisition mode and strobe pulses were used to define the acquisition period. The image shown in
Fig. 4 was acquired, and the thumbnail set shown inFig. 5 was assembled. - The suspension was also passed through a Mastersizer® laser diffraction system, available from Malvern Instruments Limited of Malvern, UK. As predicted, the measurement from this system tended to favor the larger particles. But with the images from the microfluidic cell, this measurement can be corrected or put in the proper context.
- The particle images can also be sorted according to their morphological characteristics as discussed in more detail in
US Pat. No. 8,111,395 . - Because the detector is capable of acquiring a huge amount of data, a local processor coupled to the detector can extract images of the particles themselves and only transfer these to a user computer for characterization. This can substantially reduce the amount of data transferred by eliminating transfers of white space.
- Operations on the images as well as control operations, including control of the drivers, can be performed in connection with special-purpose software programs running on general-purpose computer platforms in which stored program instructions are executed on a processor, but they could also be implemented in whole or in part using special-purpose hardware. And while the system can be broken into the series of modules and steps shown for illustration purposes, one of ordinary skill in the art would recognize that it is also possible to combine them and/or split them differently to achieve a different breakdown.
- The
particle characterization system 10 can provide a software control that allows it to perform a flat-field correction in the presence of sample particles without purging or flushing. This flat field correction adjusts for imaging error sources, such as uneven illumination, surface reflections, defects (e.g., surface scratches), and non-uniform pixel response of the detector. Performing this type of correction on the fly without purging the instrument can significantly speed up operation and can simplify hookups by eliminating the need for a dedicated purge or flush path. - The on-the-fly flat-field correction can be performed in either of two ways. In the first approach, the system acquires a large number of frames and averages corresponding pixels in those frames. Since particles in each image are reasonably sparse, and will appear at random positions during each frame, the averaging will reduce the impact of any particles. In a general aspect therefore, performing the flat-field correction may involve deriving an average image from a plurality of calibration images and correcting sample images of the particles using the derived average image.
- More specifically, the intensity of particle imprint is generally reduced to about 1/N, where N is the number of frames, so a higher number of frames improves the result. This approach has been tested for 2% obscuration with different numbers of frames from 10 to over 100 frames. Good results appear to require at least 50 frames, and particle contribution is very difficult to see in the 100-frame average. With a system that can acquire 7.5 frames per second, reasonable results could therefore be achieved in 15 - 30 seconds. In a general aspect therefore, the number of calibration images used in deriving the average image is preferably 50 or more, and may optionally be up to 100 images.
- In the second approach, a smaller number of frames are averaged without including those parts of the image where particles are present. In this approach a threshold level is set that indicates the presence of a particle. By simply eliminating regions of a frame that are outside of that threshold on a per-frame basis, a small number of frames can be averaged to get a good background estimate. One simple way of doing this is to look at frame-to-frame differences -- the presence of a particle in any causes a large difference (in the region obscured by the particle) from the prior frame. This approach would likely benefit from the inclusion of a measurement under known conditions (e.g., factory conditions). This method is outlined below:
- Step 1: collect N consecutive frames
- Step 2: for each pixel, calculate the mean and standard deviation σ across all N frames
- Step 3: for each pixel, iterate through its values and reject values that differ from the mean by more than q*σ, where q is determined experimentally (typically, q=1)
- Step 4: for each pixel, average the values remaining after outlier rejection.
- The "frame" composed of averages represents the reconstructed background.
- In a general aspect therefore, the flat-field correction may be performed by acquiring a plurality of calibration images and deriving an average of the plurality of calibration images after removing portions of each of the calibration images having pixels that differ in value from a mean value by more than a predetermined factor. The predetermined factor may for example be a multiple of a standard deviation of each calibration image. The multiple may be one. The value of the pixels may for example be a brightness value.
- The outlier removal method can be performed on fewer frames (e.g., 10-20 frames), and the resulting background image is free from "traces" of particles that are visible in the averaging method. Part of the computation can be performed while acquiring data (summing pixel values and squared pixel values for the standard deviation). The process can also be made to be massively parallel, and thus lend itself to General-Purpose Computing On Graphics Processing Units (GPGPU) acceleration. The outlier removal method has the disadvantage of higher memory usage, because all collected frames remain in memory for the entire process, and it is computationally more expensive than the averaging method. In a general aspect therefore, the number of calibration images acquired for this flat-field correction method may be fewer than 50, and may be between 10 and 20.
- Referring to
Fig. 7 , theparticle characterization system 10 begins a set of flat-field correctedacquisition operations 60 by turning off the illumination (step 62). It then acquires a number of frames, such as 100 frames (step 64), and averages them using one of the averaging approaches described above (step 66). The result is stored as a dark pattern data set (step 68). - The
particle characterization system 10 then turns on the illumination (step 72). It then acquires a number of frames, such as 100 frames (step 74), and averages them using one of the averaging approaches described above (step 76). The result is stored as a background pattern data set (step 78). - The
particle characterization system 10 can then acquire a sample image frame (step 80) and store it as raw frame data set (step 82). This raw frame data set (RF) is then corrected using the dark pattern data set (DP) and background pattern data set (BP). The correction can be calculated using the following formula:
- The corrected frame (CF) can then be stored, displayed, or otherwise processed (step 86). If further sample image frames are needed the process of acquisition and correction can be repeated (see step 88). It is possible to derive simpler flat-field correction solutions that may be more computationally efficient, although they may not behave as well as the exact solution above, particularly for non-uniform illumination.
- Referring to
Fig. 8 , particle characterization systems according to the invention can perform more than one type of measurement in a serial or parallel fashion. For example, a three-channel serial multichannelparticle characterization system 90 includes three back-to-back detectors 92a ... 92c positioned under a single illumination window 94 (although multiple illumination windows and/or multiple illumination sources may also be used). In operation, this system allows thefirst detector 92a to sample larger particles and subsequent detectors to sample smaller and smaller ones, with larger ones passing through the bypass channels. The results can be used separately or combined. As shown inFig. 9 , although serial configurations are presently contemplated as preferable, a parallel multichannelparticle characterization system 96, in which the flow is divided across different side-by-side channels, can also be built. - Multichannel particle characterization systems can be built with any suitable number of detectors and it may also be possible to vary channel dimensions over the length of a single detector. These types of systems can also be built in a variety of ways. They can be built as a compound structure as illustrated in
Fig. 8 , for example, or they could be built with a series of microfluidic detection cells 20 (seeFigs. 1 and2 ) connected in series with tubing. The systems can include one or more eared bypass channels for some or all of the detectors, depending on system requirements. Smaller-sample systems will tend to have lower bypass flows or even no bypass flow, for example, and larger re-circulating systems will have larger bypass flows. - Referring to
Fig. 10 , a high-throughput version of the particle characterization system can also be built using one or more microfluidic detection cells. For example, a single-channel system 100 uses asampling probe 102 to perform successive measurements on a number of liquid samples held in different vessels, such aswells 116 of amulti-well plate 114 or carousel. Thesystem 100 uses areversible pressure source 104 that is hydraulically connected to asipper tube 106 via an in-linemicrofluidic detection cell 20. While a single-channel system is shown here, different kinds of multichannel high-throughput systems can also be designed. - In this example, an off-the-shelf x-y-z stage is provided to successively position the samples under the probe, although other types of mechanisms can be used to position the vessels and probe relative to each other. Wash and waste vessels can also be provided, either in the plate, or separately.
- In an illustrative operation sequence, the x-y-z stage begins by positioning a first of the wells below the
probe 102 to select a first sample and thepressure source 104 draws the sample into thesipper tube 106 and through thedetector 20. The image acquisition module then acquires an image of the first sample from each of the microfluidic detection cells. The first sample can then be returned to the first well or it can be discarded into a waste well, and the probe can be washed in a wash well. If there are more samples to process, the x-y-z stage can select the next sample in the sequence. The process can then be repeated until there are no further samples to be tested, or some other condition is reached. - The high-throughput system can be applied to a number of different applications, such as research or quality control/quality assurance applications. In some situations, the material to be imaged may be well homogenized prior to aspiration by the probe. In other situations, however, a dispersion step may be performed before sampling, such as with a stirrer. In one example, it is contemplated that the pressure source in the probe itself could be used to mix the sample, such as by aspiring and expelling the sample repeatedly. This could allow larger contaminant particles such as flakes of plastic or stainless steel, which might otherwise sink, to be detected in quality control situations. It could also create droplets of liquid contaminants, such as silicone lubricants, that can be detected.
- Where the sample is more delicate, such as in the case of complex proteins, the probe can perform a first low-flow-rate pass to image intact particles and/or aggregates, followed by a more vigorous mixing that may suspend higher density particles in the sample before a second set of images is taken. In one example, a probe moves to a sample cup and draws up a small sample (e.g., <500 µl) at low flow rate (typically <2 ml/min) and images that sample. The sample is then flushed back into the same sample cup at higher rate to agitate the sample. The sample is then again drawn into the imaging flow cell for analysis. The first images will show any protein aggregates, but probably not show higher density materials (e.g., steel or glass particles) that may have settled in the sample cup. Later images will tend to show any higher density particles. Fluid density for the formulations is expected to range from 0.997 g/ml to 1.08 g/ml with dynamic viscosity of 1 to 20 centipoise. Protein aggregate densities should range from 1 g/ml (loose aggregate) to 1.4 g/ml (tight aggregate). Particulate contaminant densities are expected to range from 0.97 g/ml (silicone oil) to 8 g/ml (stainless steel).
- Systems according to the invention can be configured to handle different types of materials. On one end of the spectrum, industrial applications can provide for flow rates of 2 liters per minute or more with bypass and recirculation features. At the low end of the spectrum, a system that handles delicate proteins might operate at a non-recirculating, no-bypass flow rate of 2 milliliters per minute or less. A lower end flow rate for the recirculating flow cell (with ears for bypass flow) is probably on the order of 100ml/minute, although more typical is greater than 1 l/minute. A lower end flow rate for a small volume (bio) flow cell (no bypass flow) is probably on the order of 100µl/minute, with typical flow rate of 0.4 - 1.5ml/minute.
- Referring to
Figs. 6 and11 , systems according to the invention can apply a dispersion metric to determine in real time how well the particles are dispersed using the in-line ultrasound probe 50 in a process known as sonication. More specifically, after dispersion begins, themicrofluidic detection cell 20 acquires images (step 124) and repeatedly computes a value for the dispersion metric for these images (step 126) and determines whether it has stabilized by comparing it with earlier values. Reaching a stabilized dispersion metric value indicates that the particle size in the instrument has reached a steady state, such as a state where the particles are non-aggregated (primary) particles. This indication can be used to initiate measurements using the other measurement cell or to validate measurements where they are ongoing. The stabilization signal can also be used to cause sonication to be stopped or slowed. - A variety of approaches to image evaluation have been tried and some of them provide at least some information, such as an indication of makeup, uniformity, complexity, or evolution thereof, about dispersion from one or more images. But an entropy function is now preferred. Entropy is a way to measure how "busy" an image is and it may be calculated according to the following function:

- There are two methods to calculate entropy according to the above equation. Pi can be a probability that the difference between two adjacent pixels is i (Cornell method). Alternatively Pi can be a probability that an individual pixel value is I (Matlab method). In a general aspect therefore, the statistical function used on acquired image data to gage heterogeneity may involve calculating a measure of entropy in the plurality of acquired images. The measure of entropy of each acquired image may be calculated from a sum of probabilities of pixel values or differences between adjacent pixel values in the image being a given value.
- Examples of other types of dispersion metrics can include performing image processing calculations or statistical evaluations, such as by computing means, skews, and/or standard deviations. More detailed types of analyses can also be undertaken, such as ones in which distances between nearest neighbors are calculated and/or ones in which differently sized, differently shaped, or differently shaped particles are analyzed independently. There are also different ways to test the dispersion metric, such as by testing for rates of change, thresholds, or target ranges of one or more parameters. The test may be performed to seek an end point, like in a titration, but it can also be used in other ways, such as by being added as another field in a measurement data set or by using it as a feedback parameter in a process to keep the process within acceptable limits.
- Different overall approaches may have different benefits for different types of processes and samples. Continuously monitoring a quick calculation for stabilization might be of more use in a real-time industrial process environment, for example, while evaluating a more complex function for a particular end condition might be more suited to analyzing mixtures of different particle species in a research setting, such as in a situation where polydispersity or complex proteins are present. It may also be desirable in some circumstances to perform a series of experiments under different conditions, such as with different flow rates or blender speeds.
- Referring also to
Figs 12-14 , a sample of carbon black was introduced in the wet dispersion process shown inFig. 6 and afirst image 130 was acquired (Fig. 13 ). This initial image shows that there were initially a number of significantly aggregated particles and this is reflected in the lower initial dispersion index (region 121 infigure 12 ). As sonication took place (region 123), the dispersion index rose and finally stabilized at a higher level (region 125), as shown inFig. 12 . An image taken after stabilization (figure 14 ) confirms that the aggregated particles had been broken up. In this example, the dispersion index is derived from a measure of entropy, as described above. An increase in the entropy of the acquired images therefore indicates an increase in dispersion of particles in the sample. - The present invention has now been described in connection with a number of specific embodiments thereof. However, numerous modifications which are contemplated as falling within the scope of the present invention should now be apparent to those skilled in the art. For example, while the particles are described as being suspended in a liquid in the embodiments shown, they can also be suspended in a gas, or may be suspensions of particles of a liquid in another liquid. More comprehensively, systems according to the invention are applicable to heterogeneous fluid samples that include a continuous liquid or gas phase and a discontinuous phase that can include either a liquid, solid, or gas. It is therefore intended that the scope of the present invention be limited only by the scope of the claims appended hereto. In addition, the order of presentation of the claims should not be construed to limit the scope of any particular term in the claims.
Claims (11)
- A particle characterization method, comprising:illuminating a heterogeneous fluid sample comprising particles;causing the heterogeneous fluid sample to flow past a two-dimensional array detector (24);acquiring at least one image of the illuminated heterogeneous fluid sample; andextracting a summarizing metric from the images;wherein extracting the summarizing metric includes extracting a dispersion metric from the images;the step of extracting a summarizing metric includes extracting information about particle size; characterised in thatthe step of extracting a dispersion metric from the images applies an entropy function to the images.
- The method of claim 1, wherein the measure of entropy is calculated from a sum of probabilities of pixel values, or wherein the measure of entropy is calculated from a sum of probabilities of differences between adjacent pixel values.
- The method of any preceding claim further including the step of reporting the detection of a predetermined state or a stabilization or a rate of change of the dispersion metric.
- The method of any preceding claim further including adjusting a process that is applied to the fluid based on the dispersion metric in real time.
- The method of any preceding claim further including the step of performing a second measurement on the heterogeneous fluid sample.
- The method of claim 5 wherein the second measurement is a laser diffraction measurement.
- The method of claim 5 or claim 6 wherein the dispersion metric is used to trigger the second measurement in real time.
- The method of claim 5 or claim 6 or claim 7 wherein the dispersion metric is used to validate the second measurement.
- The method of any preceding claim further including the step of dispersing the heterogeneous fluid sample, optionally by mixing the heterogeneous fluid sample or by sonicating particles in the fluid sample.
- The method of any preceding claim wherein the step of acquiring an image takes place in a flow from an in-line particle disperser, and wherein the method further includes the step of returning the particles to the in-line particle disperser after the step of acquiring.
- A particle characterization instrument (10) comprising:means for causing particles suspended in a fluid to flow past a two-dimensional array detector (12);means for illuminating the suspended particles (14) as they flow past the two-dimensional array detector (24) in the fluid,means for acquiring a plurality of images of the particles as they flow past the two-dimensional array detector (24) in the fluid; andmeans for applying a particle characterization function to results from the means for acquiring for at least some of the suspended particles (42);wherein the instrument (10) is configured to perform the method of any preceding claim.
Applications Claiming Priority (5)
| Application Number | Priority Date | Filing Date | Title |
|---|---|---|---|
| US201261663527P | 2012-06-22 | 2012-06-22 | |
| US201261679662P | 2012-08-03 | 2012-08-03 | |
| US13/841,721 US20140002662A1 (en) | 2012-06-22 | 2013-03-15 | Particle characterization |
| US201361835409P | 2013-06-14 | 2013-06-14 | |
| PCT/GB2013/051642 WO2013190327A2 (en) | 2012-06-22 | 2013-06-21 | Heterogeneous fluid sample characterization |
Publications (2)
| Publication Number | Publication Date |
|---|---|
| EP2864760A2 EP2864760A2 (en) | 2015-04-29 |
| EP2864760B1 true EP2864760B1 (en) | 2024-02-28 |
Family
ID=52274460
Family Applications (2)
| Application Number | Title | Priority Date | Filing Date |
|---|---|---|---|
| EP13742260.6A Withdrawn EP2864759A2 (en) | 2012-06-22 | 2013-06-21 | Particle characterization |
| EP13744770.2A Active EP2864760B1 (en) | 2012-06-22 | 2013-06-21 | Heterogeneous fluid sample characterization |
Family Applications Before (1)
| Application Number | Title | Priority Date | Filing Date |
|---|---|---|---|
| EP13742260.6A Withdrawn EP2864759A2 (en) | 2012-06-22 | 2013-06-21 | Particle characterization |
Country Status (9)
| Country | Link |
|---|---|
| EP (2) | EP2864759A2 (en) |
| JP (2) | JP2015520396A (en) |
| CN (2) | CN104662407A (en) |
| BR (2) | BR112014032324A2 (en) |
| CA (2) | CA2876358A1 (en) |
| IL (2) | IL236334A0 (en) |
| IN (2) | IN2015MN00109A (en) |
| RU (2) | RU2015101801A (en) |
| WO (2) | WO2013190327A2 (en) |
Families Citing this family (17)
| Publication number | Priority date | Publication date | Assignee | Title |
|---|---|---|---|---|
| WO2015124942A2 (en) | 2014-02-20 | 2015-08-27 | Malvern Instruments Limited | Heterogeneous fluid sample characterization |
| EP3134721B1 (en) * | 2014-04-22 | 2021-12-01 | Malvern Panalytical Limited | High-throughput fluid sample characterization |
| DK3247998T3 (en) | 2015-01-21 | 2021-12-20 | Sbt Instr A/S | MICROFLUID PARTICLE ANALYSIS DEVICE. |
| US11002655B2 (en) | 2015-09-23 | 2021-05-11 | Malvern Panalytical Limited | Cuvette carrier |
| CN108291861B (en) * | 2015-09-23 | 2021-10-12 | 马尔文帕纳科 | Particle characterization |
| CN105572020B (en) * | 2016-01-19 | 2018-05-22 | 西南交通大学 | A kind of nano-particle method of counting |
| CN105671123B (en) * | 2016-01-19 | 2018-11-20 | 西南交通大学 | The method of counting of bacterium in a kind of liquid |
| GB201604460D0 (en) | 2016-03-16 | 2016-04-27 | Malvern Instr Ltd | Dynamic light scattering |
| CN109154548B (en) * | 2016-04-29 | 2022-02-22 | 溶解度公司 | Method and apparatus for physicochemical characterization of materials |
| JP6885536B2 (en) * | 2016-10-28 | 2021-06-16 | 月島機械株式会社 | Uniformity evaluation device |
| EP3379232A1 (en) | 2017-03-23 | 2018-09-26 | Malvern Panalytical Limited | Particle characterisation |
| CN108181282B (en) | 2018-01-03 | 2019-03-15 | 宁波纳美致生物科技有限公司 | A kind of triple channel fluorescence localization super-resolution biology microscope system and method |
| JP2020003384A (en) * | 2018-06-29 | 2020-01-09 | 株式会社エンプラス | Detector, method for detection, and detection program |
| WO2020076872A1 (en) * | 2018-10-08 | 2020-04-16 | Bioelectronica Corporation | Systems and methods for optically processing samples |
| CN109269949B (en) * | 2018-10-15 | 2021-05-07 | 温州大学 | Rapid detection system and method suitable for aviation lubricating oil wear particle information |
| WO2021059489A1 (en) * | 2019-09-27 | 2021-04-01 | 株式会社ニコン | Information processing device, information processing method, information processing program, and information processing system |
| US20240102907A1 (en) * | 2019-10-15 | 2024-03-28 | Horiba, Ltd. | Particle group characteristic measurement device, particle group characteristic measurement method, storage medium recording program for particle group characteristic measurement device, particle diameter distribution measurement device, and particle diameter distribution measurement method |
Citations (2)
| Publication number | Priority date | Publication date | Assignee | Title |
|---|---|---|---|---|
| US5825477A (en) * | 1995-12-22 | 1998-10-20 | Toa Medical Electronics Co., Ltd. | Apparatus for measuring particle morphology and method thereof |
| JP2000146817A (en) * | 1998-11-12 | 2000-05-26 | Nikkiso Co Ltd | Grain size distribution measuring device |
Family Cites Families (35)
| Publication number | Priority date | Publication date | Assignee | Title |
|---|---|---|---|---|
| JPH0614006B2 (en) * | 1985-10-01 | 1994-02-23 | 株式会社日立製作所 | Flock image recognition device |
| JPS6286990A (en) * | 1985-10-11 | 1987-04-21 | Matsushita Electric Works Ltd | Abnormality supervisory equipment |
| JPS63148147A (en) * | 1986-01-06 | 1988-06-21 | Shimadzu Corp | Instrument for measuring dispersibility of granular substance |
| JP2570823B2 (en) * | 1988-07-26 | 1997-01-16 | 株式会社島津製作所 | Suspension sampling device for particle size distribution measurement |
| US6147198A (en) * | 1988-09-15 | 2000-11-14 | New York University | Methods and compositions for the manipulation and characterization of individual nucleic acid molecules |
| JPH06507496A (en) * | 1991-06-13 | 1994-08-25 | アボツト・ラボラトリーズ | Optical imaging for positioning and cell counting |
| JPH06186155A (en) * | 1992-10-21 | 1994-07-08 | Toa Medical Electronics Co Ltd | Particle analyzer |
| JPH06138015A (en) * | 1992-10-29 | 1994-05-20 | Toyota Motor Corp | Method for measuring particle size of ceramic granulated goods |
| JP3052665B2 (en) * | 1993-01-26 | 2000-06-19 | 株式会社日立製作所 | Flow cell device |
| JP3425093B2 (en) * | 1998-11-20 | 2003-07-07 | 株式会社堀場製作所 | Drainage method of sample liquid and cleaning liquid in light scattering type particle size distribution measuring device |
| US8131053B2 (en) * | 1999-01-25 | 2012-03-06 | Amnis Corporation | Detection of circulating tumor cells using imaging flow cytometry |
| NL1015640C2 (en) * | 2000-07-06 | 2002-01-08 | Univ Delft Tech | Device and method for determining the shape and / or size of small particles. |
| US6683975B2 (en) * | 2001-06-18 | 2004-01-27 | Abbott Laboratories | Apparatus and method for determining the dispersibility of a product in particulate form |
| JP2003021590A (en) * | 2001-07-06 | 2003-01-24 | Sysmex Corp | Particle imaging device |
| JP3685256B2 (en) * | 2001-09-14 | 2005-08-17 | 東京電力株式会社 | Fluid flow measurement system |
| JP2004012373A (en) * | 2002-06-10 | 2004-01-15 | Matsushita Electric Ind Co Ltd | Evaluation method of slurry and preparation method of slurry |
| US7396650B2 (en) * | 2003-06-27 | 2008-07-08 | Commissariat A L'energie Atomique | Method for dosing a biological or chemical sample |
| JP4744132B2 (en) * | 2004-12-09 | 2011-08-10 | シスメックス株式会社 | Display value creation method for standard solution for particle image analyzer |
| JP2006238802A (en) * | 2005-03-03 | 2006-09-14 | Olympus Corp | Cell observation apparatus, cell observation method, microscope system, and cell observation program |
| CN101438143B (en) * | 2005-04-29 | 2013-06-12 | 霍尼韦尔国际公司 | Cytometer cell counting and size measurement method |
| JP4781044B2 (en) * | 2005-08-22 | 2011-09-28 | 住友化学株式会社 | Image analysis apparatus, image analysis method, and program for image analysis processing |
| CN1800820A (en) * | 2005-12-20 | 2006-07-12 | 上海理工大学 | Pollutant gas concentration field measurement method in environmental wind tunnel |
| US7605919B2 (en) * | 2006-10-30 | 2009-10-20 | Brightwell Technologies Inc. | Method and apparatus for analyzing particles in a fluid |
| US8111395B2 (en) | 2007-01-05 | 2012-02-07 | Malvern Instruments Ltd | Spectrometric investigation of heterogeneity |
| CN101617535B (en) * | 2007-03-28 | 2011-07-06 | 富士通株式会社 | Image processing device and image processing method |
| US8592221B2 (en) * | 2007-04-19 | 2013-11-26 | Brandeis University | Manipulation of fluids, fluid components and reactions in microfluidic systems |
| US8642288B2 (en) * | 2007-06-07 | 2014-02-04 | Technion Research & Development Foundation Ltd. | Methods for viscoelastic focusing of particles |
| JP2009244253A (en) * | 2008-03-10 | 2009-10-22 | Sysmex Corp | Particle analyzer, method for analyzing particles, and computer program |
| JP2009236828A (en) * | 2008-03-28 | 2009-10-15 | Toray Ind Inc | Evaluation method of distribution state of inorganic material paste, and production method of inorganic material paste |
| EP2454002A1 (en) * | 2009-07-13 | 2012-05-23 | FOSS Analytical A/S | Analysis of an acoustically separated liquid |
| JP5629447B2 (en) * | 2009-10-07 | 2014-11-19 | 株式会社セイシン企業 | Particle property measuring method and apparatus, and measuring sample preparation apparatus |
| CN102713720B (en) * | 2009-10-28 | 2016-05-11 | 阿兰蒂克微科学股份有限公司 | Microscopic imaging device and micro imaging method |
| US8538120B2 (en) * | 2010-08-19 | 2013-09-17 | Aptina Imaging Corporation | System for targeting cells or other materials |
| US8842901B2 (en) * | 2010-12-14 | 2014-09-23 | The Regents Of The University Of California | Compact automated semen analysis platform using lens-free on-chip microscopy |
| CN102494869B (en) * | 2011-12-27 | 2013-11-27 | 东南大学 | Measuring device of dense two-phase flow particle speed and concentration spatial distribution |
-
2013
- 2013-06-21 WO PCT/GB2013/051642 patent/WO2013190327A2/en active Application Filing
- 2013-06-21 WO PCT/GB2013/051641 patent/WO2013190326A2/en active Application Filing
- 2013-06-21 EP EP13742260.6A patent/EP2864759A2/en not_active Withdrawn
- 2013-06-21 JP JP2015517859A patent/JP2015520396A/en active Pending
- 2013-06-21 CA CA2876358A patent/CA2876358A1/en not_active Abandoned
- 2013-06-21 BR BR112014032324A patent/BR112014032324A2/en not_active IP Right Cessation
- 2013-06-21 IN IN109MUN2015 patent/IN2015MN00109A/en unknown
- 2013-06-21 CA CA2876362A patent/CA2876362A1/en not_active Abandoned
- 2013-06-21 IN IN110MUN2015 patent/IN2015MN00110A/en unknown
- 2013-06-21 CN CN201380033125.8A patent/CN104662407A/en active Pending
- 2013-06-21 RU RU2015101801A patent/RU2015101801A/en not_active Application Discontinuation
- 2013-06-21 RU RU2015101834A patent/RU2015101834A/en not_active Application Discontinuation
- 2013-06-21 CN CN201380044016.6A patent/CN104704343B/en active Active
- 2013-06-21 JP JP2015517860A patent/JP2015520397A/en active Pending
- 2013-06-21 BR BR112014032326A patent/BR112014032326A2/en not_active IP Right Cessation
- 2013-06-21 EP EP13744770.2A patent/EP2864760B1/en active Active
-
2014
- 2014-12-17 IL IL236334A patent/IL236334A0/en unknown
- 2014-12-17 IL IL236330A patent/IL236330A0/en unknown
Patent Citations (2)
| Publication number | Priority date | Publication date | Assignee | Title |
|---|---|---|---|---|
| US5825477A (en) * | 1995-12-22 | 1998-10-20 | Toa Medical Electronics Co., Ltd. | Apparatus for measuring particle morphology and method thereof |
| JP2000146817A (en) * | 1998-11-12 | 2000-05-26 | Nikkiso Co Ltd | Grain size distribution measuring device |
Non-Patent Citations (1)
| Title |
|---|
| CHANDRASEKERA KENNY ET AL: "Entropy-based measures of in vivo cilia-driven microfluidic mixing derived from quantitative optical imaging", PHOTONIC THERAPEUTICS AND DIAGNOSTICS VIII, SPIE, 1000 20TH ST. BELLINGHAM WA 98225-6705 USA, vol. 8207, no. 1, 3 February 2012 (2012-02-03), pages 1 - 7, XP060022625, DOI: 10.1117/12.906428 * |
Also Published As
| Publication number | Publication date |
|---|---|
| WO2013190326A3 (en) | 2014-02-13 |
| IN2015MN00110A (en) | 2015-10-16 |
| IL236334A0 (en) | 2015-02-26 |
| BR112014032324A2 (en) | 2017-06-27 |
| WO2013190327A2 (en) | 2013-12-27 |
| IL236330A0 (en) | 2015-02-26 |
| EP2864759A2 (en) | 2015-04-29 |
| JP2015520397A (en) | 2015-07-16 |
| JP2015520396A (en) | 2015-07-16 |
| EP2864760A2 (en) | 2015-04-29 |
| IN2015MN00109A (en) | 2015-10-16 |
| RU2015101834A (en) | 2016-08-10 |
| CN104704343A (en) | 2015-06-10 |
| WO2013190326A2 (en) | 2013-12-27 |
| CA2876358A1 (en) | 2013-12-27 |
| CN104662407A (en) | 2015-05-27 |
| BR112014032326A2 (en) | 2017-06-27 |
| CA2876362A1 (en) | 2013-12-27 |
| RU2015101801A (en) | 2016-08-10 |
| WO2013190327A3 (en) | 2014-02-13 |
| CN104704343B (en) | 2018-08-28 |
Similar Documents
| Publication | Publication Date | Title |
|---|---|---|
| EP2864760B1 (en) | Heterogeneous fluid sample characterization | |
| US20140002662A1 (en) | Particle characterization | |
| US20150362421A1 (en) | Particle characterization | |
| CN103823051B (en) | Utilize the intrinsic pigmentation of the haemoglobin contained in red blood cell to determine the method and apparatus of the red cell index of blood sample | |
| EP3108219B1 (en) | Heterogeneous fluid sample characterization | |
| AU2003210590B2 (en) | Automatically detecting cells having nuclear and cytoplasmic densitometric features associated with disease by optical imaging | |
| US5721433A (en) | Apparatus and method for analyzing particle images including measuring at a plurality of capturing magnifications | |
| EP3244209B1 (en) | Method and apparatus for automated platelet identification within a whole blood sample from microscopy images | |
| EP2261632B1 (en) | Sample preparation device, and cell analyzing device with the same | |
| US9096885B2 (en) | Method and apparatus for determining white blood cell counts | |
| EP0983378B1 (en) | A method and a system for determination of somatic cells in milk | |
| EP2990802B1 (en) | Blood analyzer and diagnostic support method | |
| US20140154677A1 (en) | Cell analysis apparatus and cell analysis method | |
| US20110256573A1 (en) | Method and apparatus for determining at least one hemoglobin related parameter of a whole blood sample | |
| JP2015232565A (en) | Method for performing blood cell count and determining morphology of blood smear | |
| CN101943663B (en) | Measuring analytical system and measuring analytical method for distinguishing diffraction image of particles automatically | |
| CN101949819A (en) | Cell counting method based on image identification | |
| CN114813522B (en) | Blood cell analysis method and system based on microscopic amplification digital image | |
| US10509976B2 (en) | Heterogeneous fluid sample characterization | |
| CN115398200A (en) | Fluidic devices for particle analysis and related methods | |
| CN109478230A (en) | The method for checking distributed objects by segmentation general view image | |
| CN114460005A (en) | Dynamic microscopic imaging red blood cell multi-angle morphology measuring method and system | |
| Spinrad | Flow cytometric analysis of the optical characteristics of marine particulates | |
| CN115294279A (en) | Method and device for determining micro-flow field conditions | |
| Rodriguez | An engineering characterisation of shaken bioreactors: flow, mixing and suspension dynamics |
Legal Events
| Date | Code | Title | Description |
|---|---|---|---|
| PUAI | Public reference made under article 153(3) epc to a published international application that has entered the european phase |
Free format text: ORIGINAL CODE: 0009012 |
|
| 17P | Request for examination filed |
Effective date: 20150113 |
|
| AK | Designated contracting states |
Kind code of ref document: A2 Designated state(s): AL AT BE BG CH CY CZ DE DK EE ES FI FR GB GR HR HU IE IS IT LI LT LU LV MC MK MT NL NO PL PT RO RS SE SI SK SM TR |
|
| AX | Request for extension of the european patent |
Extension state: BA ME |
|
| DAX | Request for extension of the european patent (deleted) | ||
| RAP1 | Party data changed (applicant data changed or rights of an application transferred) |
Owner name: MALVERN PANALYTICAL LIMITED |
|
| STAA | Information on the status of an ep patent application or granted ep patent |
Free format text: STATUS: EXAMINATION IS IN PROGRESS |
|
| 17Q | First examination report despatched |
Effective date: 20200226 |
|
| STAA | Information on the status of an ep patent application or granted ep patent |
Free format text: STATUS: EXAMINATION IS IN PROGRESS |
|
| TPAC | Observations filed by third parties |
Free format text: ORIGINAL CODE: EPIDOSNTIPA |
|
| STAA | Information on the status of an ep patent application or granted ep patent |
Free format text: STATUS: EXAMINATION IS IN PROGRESS |
|
| P01 | Opt-out of the competence of the unified patent court (upc) registered |
Effective date: 20230727 |
|
| GRAP | Despatch of communication of intention to grant a patent |
Free format text: ORIGINAL CODE: EPIDOSNIGR1 |
|
| STAA | Information on the status of an ep patent application or granted ep patent |
Free format text: STATUS: GRANT OF PATENT IS INTENDED |
|
| INTG | Intention to grant announced |
Effective date: 20231113 |
|
| GRAS | Grant fee paid |
Free format text: ORIGINAL CODE: EPIDOSNIGR3 |
|
| GRAA | (expected) grant |
Free format text: ORIGINAL CODE: 0009210 |
|
| STAA | Information on the status of an ep patent application or granted ep patent |
Free format text: STATUS: THE PATENT HAS BEEN GRANTED |
|
| AK | Designated contracting states |
Kind code of ref document: B1 Designated state(s): AL AT BE BG CH CY CZ DE DK EE ES FI FR GB GR HR HU IE IS IT LI LT LU LV MC MK MT NL NO PL PT RO RS SE SI SK SM TR |
|
| REG | Reference to a national code |
Ref country code: GB Ref legal event code: FG4D |
|
| REG | Reference to a national code |
Ref country code: CH Ref legal event code: EP |
|
| REG | Reference to a national code |
Ref country code: DE Ref legal event code: R096 Ref document number: 602013085354 Country of ref document: DE |
|
| REG | Reference to a national code |
Ref country code: IE Ref legal event code: FG4D |