EP2662026A1 - Cardiac output monitoring system and cardiac output measurement method - Google Patents
Cardiac output monitoring system and cardiac output measurement method Download PDFInfo
- Publication number
- EP2662026A1 EP2662026A1 EP13166623.2A EP13166623A EP2662026A1 EP 2662026 A1 EP2662026 A1 EP 2662026A1 EP 13166623 A EP13166623 A EP 13166623A EP 2662026 A1 EP2662026 A1 EP 2662026A1
- Authority
- EP
- European Patent Office
- Prior art keywords
- artery
- flow velocity
- cardiac output
- cross
- section
- Prior art date
- Legal status (The legal status is an assumption and is not a legal conclusion. Google has not performed a legal analysis and makes no representation as to the accuracy of the status listed.)
- Withdrawn
Links
- 230000000747 cardiac effect Effects 0.000 title claims abstract description 177
- 238000012544 monitoring process Methods 0.000 title claims abstract description 67
- 238000000691 measurement method Methods 0.000 title claims description 18
- 210000001367 artery Anatomy 0.000 claims abstract description 195
- 230000004872 arterial blood pressure Effects 0.000 claims abstract description 110
- 238000004364 calculation method Methods 0.000 claims abstract description 97
- 239000000523 sample Substances 0.000 claims abstract description 66
- 230000008859 change Effects 0.000 claims abstract description 41
- 230000002123 temporal effect Effects 0.000 claims abstract description 35
- 230000002861 ventricular Effects 0.000 claims abstract description 29
- 238000001514 detection method Methods 0.000 claims description 26
- 210000000779 thoracic wall Anatomy 0.000 claims description 2
- 238000005259 measurement Methods 0.000 abstract description 76
- 238000000034 method Methods 0.000 abstract description 57
- 238000012545 processing Methods 0.000 abstract description 24
- 210000001715 carotid artery Anatomy 0.000 abstract description 16
- 210000000709 aorta Anatomy 0.000 abstract description 12
- 230000017531 blood circulation Effects 0.000 abstract description 10
- 238000004033 diameter control Methods 0.000 abstract 1
- 230000008569 process Effects 0.000 description 34
- 238000009530 blood pressure measurement Methods 0.000 description 22
- 230000002093 peripheral effect Effects 0.000 description 20
- 230000000630 rising effect Effects 0.000 description 13
- 238000002565 electrocardiography Methods 0.000 description 12
- 210000004204 blood vessel Anatomy 0.000 description 9
- 238000010586 diagram Methods 0.000 description 9
- 230000006870 function Effects 0.000 description 9
- 230000005540 biological transmission Effects 0.000 description 8
- 230000000694 effects Effects 0.000 description 7
- 241000282472 Canis lupus familiaris Species 0.000 description 6
- 238000012986 modification Methods 0.000 description 6
- 230000004048 modification Effects 0.000 description 6
- 210000000038 chest Anatomy 0.000 description 5
- 210000002321 radial artery Anatomy 0.000 description 5
- 239000008280 blood Substances 0.000 description 4
- 210000004369 blood Anatomy 0.000 description 4
- 230000036772 blood pressure Effects 0.000 description 4
- 238000004458 analytical method Methods 0.000 description 3
- 230000003205 diastolic effect Effects 0.000 description 3
- 238000012360 testing method Methods 0.000 description 3
- 239000010409 thin film Substances 0.000 description 3
- 238000003491 array Methods 0.000 description 2
- 238000006243 chemical reaction Methods 0.000 description 2
- 238000004891 communication Methods 0.000 description 2
- 238000001914 filtration Methods 0.000 description 2
- 230000002159 abnormal effect Effects 0.000 description 1
- 230000003177 cardiotonic effect Effects 0.000 description 1
- 238000013500 data storage Methods 0.000 description 1
- 230000001934 delay Effects 0.000 description 1
- 230000003111 delayed effect Effects 0.000 description 1
- 239000003814 drug Substances 0.000 description 1
- 229940079593 drug Drugs 0.000 description 1
- 238000002592 echocardiography Methods 0.000 description 1
- 238000005516 engineering process Methods 0.000 description 1
- 238000002474 experimental method Methods 0.000 description 1
- 230000000004 hemodynamic effect Effects 0.000 description 1
- 239000011159 matrix material Substances 0.000 description 1
- 238000005457 optimization Methods 0.000 description 1
- 230000035479 physiological effects, processes and functions Effects 0.000 description 1
- 238000005086 pumping Methods 0.000 description 1
- 238000000718 qrs complex Methods 0.000 description 1
- 230000004044 response Effects 0.000 description 1
- 238000012546 transfer Methods 0.000 description 1
- 210000000707 wrist Anatomy 0.000 description 1
Images


Classifications
-
- A—HUMAN NECESSITIES
- A61—MEDICAL OR VETERINARY SCIENCE; HYGIENE
- A61B—DIAGNOSIS; SURGERY; IDENTIFICATION
- A61B8/00—Diagnosis using ultrasonic, sonic or infrasonic waves
- A61B8/06—Measuring blood flow
- A61B8/065—Measuring blood flow to determine blood output from the heart
-
- A—HUMAN NECESSITIES
- A61—MEDICAL OR VETERINARY SCIENCE; HYGIENE
- A61B—DIAGNOSIS; SURGERY; IDENTIFICATION
- A61B5/00—Measuring for diagnostic purposes; Identification of persons
- A61B5/02—Detecting, measuring or recording for evaluating the cardiovascular system, e.g. pulse, heart rate, blood pressure or blood flow
- A61B5/026—Measuring blood flow
- A61B5/029—Measuring blood output from the heart, e.g. minute volume
-
- A—HUMAN NECESSITIES
- A61—MEDICAL OR VETERINARY SCIENCE; HYGIENE
- A61B—DIAGNOSIS; SURGERY; IDENTIFICATION
- A61B5/00—Measuring for diagnostic purposes; Identification of persons
- A61B5/103—Measuring devices for testing the shape, pattern, colour, size or movement of the body or parts thereof, for diagnostic purposes
- A61B5/107—Measuring physical dimensions, e.g. size of the entire body or parts thereof
- A61B5/1075—Measuring physical dimensions, e.g. size of the entire body or parts thereof for measuring dimensions by non-invasive methods, e.g. for determining thickness of tissue layer
-
- A—HUMAN NECESSITIES
- A61—MEDICAL OR VETERINARY SCIENCE; HYGIENE
- A61B—DIAGNOSIS; SURGERY; IDENTIFICATION
- A61B8/00—Diagnosis using ultrasonic, sonic or infrasonic waves
- A61B8/46—Ultrasonic, sonic or infrasonic diagnostic devices with special arrangements for interfacing with the operator or the patient
- A61B8/461—Displaying means of special interest
-
- A—HUMAN NECESSITIES
- A61—MEDICAL OR VETERINARY SCIENCE; HYGIENE
- A61B—DIAGNOSIS; SURGERY; IDENTIFICATION
- A61B8/00—Diagnosis using ultrasonic, sonic or infrasonic waves
- A61B8/46—Ultrasonic, sonic or infrasonic diagnostic devices with special arrangements for interfacing with the operator or the patient
- A61B8/467—Ultrasonic, sonic or infrasonic diagnostic devices with special arrangements for interfacing with the operator or the patient characterised by special input means
-
- A—HUMAN NECESSITIES
- A61—MEDICAL OR VETERINARY SCIENCE; HYGIENE
- A61B—DIAGNOSIS; SURGERY; IDENTIFICATION
- A61B8/00—Diagnosis using ultrasonic, sonic or infrasonic waves
- A61B8/52—Devices using data or image processing specially adapted for diagnosis using ultrasonic, sonic or infrasonic waves
- A61B8/5215—Devices using data or image processing specially adapted for diagnosis using ultrasonic, sonic or infrasonic waves involving processing of medical diagnostic data
- A61B8/5223—Devices using data or image processing specially adapted for diagnosis using ultrasonic, sonic or infrasonic waves involving processing of medical diagnostic data for extracting a diagnostic or physiological parameter from medical diagnostic data
-
- A—HUMAN NECESSITIES
- A61—MEDICAL OR VETERINARY SCIENCE; HYGIENE
- A61B—DIAGNOSIS; SURGERY; IDENTIFICATION
- A61B8/00—Diagnosis using ultrasonic, sonic or infrasonic waves
- A61B8/54—Control of the diagnostic device
-
- G—PHYSICS
- G16—INFORMATION AND COMMUNICATION TECHNOLOGY [ICT] SPECIALLY ADAPTED FOR SPECIFIC APPLICATION FIELDS
- G16H—HEALTHCARE INFORMATICS, i.e. INFORMATION AND COMMUNICATION TECHNOLOGY [ICT] SPECIALLY ADAPTED FOR THE HANDLING OR PROCESSING OF MEDICAL OR HEALTHCARE DATA
- G16H50/00—ICT specially adapted for medical diagnosis, medical simulation or medical data mining; ICT specially adapted for detecting, monitoring or modelling epidemics or pandemics
- G16H50/30—ICT specially adapted for medical diagnosis, medical simulation or medical data mining; ICT specially adapted for detecting, monitoring or modelling epidemics or pandemics for calculating health indices; for individual health risk assessment
Definitions
- the cardiac output (CO) that indicates the volume of blood pumped out of the heart within 1 minute has been known as an index for evaluating the pumping function of the heart.
- the cardiac output (CO) has been used in cardiac clinical practice together with biological information (e.g., electrocardiogram and blood pressure) in order to determine the state of the patient.
- JP-A-10-94528 discloses a technique that estimates the cardiac output (CO) from the radial artery pressure detected by a pressure wave sensor that is attached to the wrist of a patient, and displays the temporal change in the estimated value in graphical representation (horizontal axis: elapsed time).
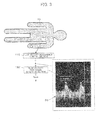
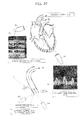
- a parasternal long-axis view 92 is obtained by M-mode echocardiography using a first transthoracic ultrasonic probe 90 to measure the cross-sectional area (CSA) of the aorta (cm 2 ), while the flow velocity (V) (cm/sec) in the left ventricular outflow tract within the systolic phase is measured from the cardiac apex in a continuous-wave Doppler mode using a second transthoracic ultrasonic probe 94.
- the velocity time integral (VTI) (cm) is then calculated, and the stroke volume (SV) (cm 3 ) is calculated by calculating a product of the cross-sectional area (CSA) and the velocity time integral (VTI).
- the cardiac output (CO) (cm 3 /min or L/min) is calculated by calculating a product of the stroke volume (SV) and the heart rate (HR) (/min) that is measured separately.
- the above manual measurement method When using the above manual measurement method, it is necessary to maintain the transthoracic ultrasonic probes 90 and 94 at a position and a posture appropriate for measuring the diameter of the artery and the flow velocity. Moreover, skill is required for the operator to find an appropriate position and posture. Therefore, the above measurement method has been mainly used to temporarily measure the cardiac output, and rarely used for continuous monitoring.
- a problem occurs when implementing the above method using a automated system.
- a problem occurs when automatically calculating the velocity time integral (VTI) from the flow velocity data about the left ventricular outflow tract.
- VTI velocity time integral
- the waveform is vague at or around the onset and end of ejection, and it is difficult to detect the ejection time (ET) from a flow velocity waveform 96 measured by the second transthoracic ultrasonic probe 94.
- a cardiac output monitoring system comprising:
- a cardiac output monitoring system comprising:
- a cardiac output monitoring system comprising:
- a cardiac output measurement method comprising:
- a cardiac output measurement method comprising:
- a cardiac output measurement method comprising:
- Several embodiments of the invention may make it possible to implement a novel technique that noninvasively and continuously measures the cardiac output.
- a cardiac output monitoring system comprising:
- a cardiac output monitoring system comprising:
- a cardiac output monitoring system comprising:
- the cardiac output can be calculated more accurately based on the velocity time integral and the cross-sectional area without being affected by a noise component contained in the flow velocity waveform. This makes it possible to noninvasively and continuously measure the cardiac output.
- the first sensor section may be a sensor that transmits and receives an ultrasonic beam
- the cardiac output monitoring system may further comprise a first ultrasonic beam control section that controls either or both of ultrasonic beam focusing and ultrasonic beam scanning performed by the first sensor section so that (a) a temporal change waveform of the flow velocity based on a detection signal of the first sensor section satisfies a given clearness condition or (b) the flow velocity peak value detected by the flow velocity peak value detection section becomes a maximum, or (c) the temporal change waveform of the flow velocity based on the detection signal of the first sensor section satisfies the given clearness condition and the flow velocity peak value detected by the flow velocity peak value detection section becomes a maximum.
- the second sensor section may be a sensor that transmits and receives an ultrasonic beam
- the cardiac output monitoring system may further comprise a second ultrasonic beam control section that controls either or both of ultrasonic beam focusing and ultrasonic beam scanning performed by the second sensor section so that (a) a major axis length and a minor axis length of a cross section of the second artery satisfy a given equality condition or (b) the cross section satisfies a given circularity condition, or (c) the major axis length and the minor axis length of the cross section of the second artery satisfy the given equality condition and the cross section satisfies the given circularity condition.
- the first sensor section may be a thin and flat ultrasonic probe that is attached to a surface of a chest wall of a subject, and configured so that a focus of an ultrasonic beam can be changed in three-dimensional directions.
- the ultrasonic probe Since the ultrasonic probe is thin and flat, the ultrasonic probe can be more easily attached to the subject, and it is possible to suppress a change in position of the ultrasonic probe due to a change in posture of the subject.
- the cardiac output monitoring system may further comprise:
- a cardiac output measurement method comprising:
- a cardiac output measurement method comprising:
- a cardiac output measurement method comprising:
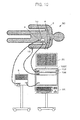
- FIG. 1 is a view illustrating a system configuration example of a cardiac output monitoring system 5 according to the first embodiment.
- the cardiac output monitoring system 5 according to the first embodiment includes (1) an electrocardiography module 8 that continuously generates and outputs an electrocardiogram waveform (ECG waveform) that is obtained through electrodes 6 attached to the surface of the chest of a subject 3, and indicates a temporal change in electrical activity of the heart, (2) a transthoracic ultrasonic probe 10 that is a first sensor section that measures the blood flow velocity in a first artery or the ventricular outflow tract from the body surface of the subject 3, (3) an arterial diameter measurement ultrasonic probe 12 that is a second sensor section that measures the diameter of a second artery from the body surface of the subject 3, (4) a processing device 100 that continuously calculates and outputs the cardiac output based on the data measured by the electrocardiography module 8, the transthoracic ultrasonic probe 10, and the arterial diameter measurement ultrasonic probe 12, (5) a video monitor 20, and (6) a keyboard 22.
- ECG waveform electro
- the transthoracic ultrasonic probe 10 is a thin and flat pad-type ultrasonic probe that can be attached to the chest or the like of the subject 3, the transthoracic ultrasonic probe 10 implementing ultrasonic measurement using a continuous-wave Doppler method, and including a thin-film piezoelectric diaphragm-type ultrasonic transducer that generates and emits measurement ultrasonic waves, and converts reflected waves (ultrasonic echo) from the subject 3 into an electrical signal.
- the transthoracic ultrasonic probe 10 is attached to the surface of the left side of the chest of the subject 3 at a position selected to be appropriate for measuring the blood flow velocity in the ascending aorta or the ventricular outflow tract, for example.
- the arterial diameter measurement ultrasonic probe 12 is a thin and flat pad-type ultrasonic probe that can be attached to the neck or the like of the subject 3, the arterial diameter measurement ultrasonic probe 12 including a thin-film piezoelectric diaphragm-type ultrasonic transducer that generates and emits measurement ultrasonic waves, and converts reflected waves (ultrasonic echo) from the subject 3 into an electrical signal.
- the arterial diameter measurement ultrasonic probe 12 is attached to the neck of the subject 3, for example.
- the arterial diameter measurement ultrasonic probe 12 may be attached at a position corresponding to an artery other than the carotid artery.
- transthoracic ultrasonic probe 10 and the arterial diameter measurement ultrasonic probe 12 are implemented by a thin and flat pad-type ultrasonic probe that can be attached to the body of the subject 3, it is unnecessary for the operator to hold the ultrasonic probe during monitoring while adjusting the position of the ultrasonic probe, differing from a related-art transthoracic ultrasonic probe. Moreover, it is unnecessary to provide an auxiliary device (e.g., arm) for preventing or correcting a shift in position, and the cardiac output can be continuously measured.
- auxiliary device e.g., arm
- the video monitor 20 is an image display device, and is implemented by a flat panel display or a touch panel display.
- the video monitor 20 may appropriately include a speaker.
- the keyboard 22 is a means that allows the operator to input an operation.
- the keyboard 22 is supported by a swing arm so that the keyboard 22 can swing, and is optionally raised forward.
- the keyboard 22 may be integrated with the processing device 100, or may be implemented by a touch panel that is used as the video monitor 20.
- An additional operation input device such as a mouse or a trackpad may also be provided.
- the processing device 100 is implemented by a microprocessor (e.g., central processing unit (CPU), graphics processing unit (GPU), or digital signal processor (DSP)), an application-specific integrated circuit (ASIC), an electronic circuit, an information storage medium such as an IC memory (e.g., VRAM, RAM, or ROM) or a hard disk, an interface IC that implements data transfer to the outside, a connection terminal, a power supply circuit, and the like.
- a microprocessor e.g., central processing unit (CPU), graphics processing unit (GPU), or digital signal processor (DSP)
- ASIC application-specific integrated circuit
- an electronic circuit e.g., an IC memory (e.g., VRAM, RAM, or ROM) or a hard disk, an interface IC that implements data transfer to the outside, a connection terminal, a power supply circuit, and the like.
- IC memory e.g., VRAM, RAM, or ROM
- hard disk e.g., a hard
- the processing device 100 implements a flow velocity measurement module 102 that controls transmission and reception of ultrasonic waves by the transthoracic ultrasonic probe 10, and calculates the blood flow velocity from the received ultrasonic echo.
- the processing device 100 also implements an arterial diameter measurement module 104 that controls transmission and reception of ultrasonic waves by the arterial diameter measurement ultrasonic probe 12, and calculates the diameter of the artery from the received ultrasonic echo.
- the processing device 100 calculates the cardiac output (CO) by performing a calculation process in accordance with a given program, and successively displays the calculation result on the video monitor 20 (i.e., successively updates the calculation result displayed on the video monitor 20).
- the processing device 100, the video monitor 20, and the keyboard 22 implement a computer that continuously monitors the cardiac output (CO).
- FIG. 1 schematically illustrates the number and the positions of the electrodes 6 (i.e., the number and the positions of the electrodes 6 do not necessarily reflect the actual situation).
- the processing device 100 may appropriately include a communication device for implementing data communication with an external computer, a device that reads/writes data from/into a removable information storage medium, and the like.
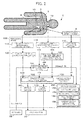
- FIG. 2 is a functional block diagram illustrating a functional configuration example according to the first embodiment.
- the processing device 100 includes a heart rate calculation section 110, a flow velocity measurement control section 112, an arterial diameter measurement control section 114, a flow velocity peak value detection section 120, an ejection time/mean arterial pressure calculation section 122, a cross-sectional area estimation section 124, a cardiac output calculation section 130, a display control section 140, an alarm control section 142, and a storage section 150.
- the heart rate calculation section 110 measures the time between the adjacent peaks of the QRS complex of the electrocardiogram waveform data output from the electrocardiography module 8 to calculate the heart rate (HR).
- the heart rate calculation section 110 may be implemented by an electronic circuit (e.g., DSP or ASIC), or may be implemented by a calculation process performed by a CPU or the like.
- the electrocardiography module 8 may include a heart rate calculation circuit, and output the heart rate together with the electrocardiogram waveform data.
- the flow velocity measurement control section 112 controls measurement of the flow velocity in the ascending aorta or the ventricular outflow tract. More specifically, the flow velocity measurement control section 112 controls transmission and reception of ultrasonic waves for implementing flow velocity measurement using the continuous-wave Doppler method, and performs a filtering process, an A/D conversion process, a frequency analysis process, and the like on the ultrasonic echo signal to calculate the flow velocity (V).
- the flow velocity measurement control section 112 may appropriately control ultrasonic beam forming, ultrasonic beam scanning, and the like.
- the flow velocity measurement module 102 illustrated in FIG. 1 corresponds to the flow velocity measurement control section 112.
- the flow velocity peak value detection section 120 detects the (blood) flow velocity peak value (Vpeak (e.g., the value at the position indicated by the white circle in the waveform illustrated in FIG. 3 )) within one cardiac cycle from flow velocity data 30 (see FIG. 3 ) measured by the continuous-wave Doppler method and output from the flow velocity measurement control section 112, and sequentially outputs the peak value to the cardiac output calculation section 130.
- Vpeak e.g., the value at the position indicated by the white circle in the waveform illustrated in FIG. 3
- the flow velocity peak value may be detected using a known technique that detects the peak value from time-series data.
- the flow velocity peak value detection section 120 may be implemented by an electronic circuit (e.g., LSI or ASIC), or may be implemented by a calculation process performed by a CPU or the like.
- the arterial diameter measurement control section 114 controls measurement of the diameter of the artery (carotid artery in the first embodiment) using ultrasonic waves, and performs a filtering process, an A/D conversion process, a frequency analysis process, and the like on the ultrasonic echo signal to calculate the diameter of the artery (DOA).
- the arterial diameter measurement control section 114 may appropriately control ultrasonic beam forming, ultrasonic beam scanning, and the like.
- the arterial diameter measurement module 104 illustrated in FIG. 1 corresponds to the arterial diameter measurement control section 114.
- the arterial diameter measurement control section 114 may be implemented by an electronic circuit (e.g., LSI or ASIC), or may be implemented by a calculation process performed by a CPU or the like.
- the ejection time/mean arterial pressure calculation section 122 calculates the ejection time (ET) and the mean arterial pressure (MAP) from the diameter of the artery (DOA) that is output from the arterial diameter measurement control section 114 in time series, outputs data about the ejection time (ET) to the cardiac output calculation section 130, and outputs data about the mean arterial pressure (MAP) to the cross-sectional area estimation section 124.
- the ejection time/mean arterial pressure calculation section 122 may be implemented by an electronic circuit (e.g., LSI or ASIC), or may be implemented by a calculation process performed by a CPU or the like.
- the ejection time/mean arterial pressure calculation section 122 detects the rising edge (Dus) and the dicrotic notch (Ddn) of a carotid artery diameter waveform 40, and calculates the ejection time (ET) from the time interval between the rising edge (Dus) and the dicrotic notch (Ddn), for example.
- the ejection time/mean arterial pressure calculation section 122 integrates and averages the arterial pressure calculated based on a known nonlinear function 46 over the calculated ejection time (ET) to calculate the mean arterial pressure (MAP).
- the ejection time/mean arterial pressure calculation section 122 outputs the calculated ejection time (ET) to the cardiac output calculation section 130, and outputs the mean arterial pressure (MAP) to the cross-sectional area estimation section 124.
- the rising edge (Dus) and the dicrotic notch (Ddn) of the carotid artery diameter waveform 40 may be detected by appropriately utilizing a known technique. For example, a technique that detects the rising edge and the dicrotic notch of an electrocardiogram may be used.
- the flow velocity data 30 (see FIG. 3 ) obtained by measuring the blood flow velocity in the ascending aorta or the ventricular outflow tract using the ultrasonic Doppler method contains noise (e.g., a flow velocity signal in the diastolic phase or a clutter sound due to opening and closing of the valve), the waveform is vague at or around the ejection time start timing and the ejection time end timing, and it is considered that it is difficult to detect the ejection time (ET) from the flow velocity data 30.
- noise e.g., a flow velocity signal in the diastolic phase or a clutter sound due to opening and closing of the valve
- the waveform obtained from the diameter of the artery (carotid artery) (DOA) contains only a small amount of noise, the rising edge (Dus) and the dicrotic notch (Ddn) of the waveform are clear, and the ejection time (ET) can be automatically detected with high accuracy.
- the cross-sectional area estimation section 124 estimates the cross-sectional area (CSA), and outputs the estimated cross-sectional area (CSA) of the aorta to the cardiac output calculation section 130.
- the cross-sectional area estimation section 124 may be implemented by an electronic circuit (e.g., LSI or ASIC), or may be implemented by a calculation process performed by a CPU or the like.
- the cross-sectional area (CSA) is calculated using the arc tangent function arctan represented by the following equation (A) (see FIG. 5 ) ( Journal of Applied Physiology, May 1, 1993, Vol. 74, No. 5, p. 2566 ).
- CSA CSAmax ⁇ 0.5 + 1 / ⁇ ⁇ arctan MAP - P ⁇ 0 / P ⁇ 1
- the parameters CSAmax, P0, and P1 in the equation (A) are estimated from the age and the sex of the subject 3.
- a CSA parameter TBL (table) 156 that links these parameters corresponding to each age/sex combination is stored in the storage section 150, and the parameters CSAmax, P0, and P1 are referred to from the table data based on the age and the sex of the subject 3 that have been input using the keyboard 22.
- the cardiac output calculation section 130 includes a stroke volume calculation section 132.
- the stroke volume calculation section 132 calculates the stroke volume (SV) from the flow velocity peak value (Vpeak) within one cardiac cycle, the ejection time (ET), and the cross-sectional area (CSA).
- the cardiac output calculation section 130 calculates the cardiac output (CO) by calculating a product of the stroke volume (SV) and the heart rate (HR).
- the cardiac output (CO) is calculated as a product of the stroke volume (SV) and the heart rate (HR) (see the following equation (B)) (see FIG. 6 ).
- CO HR ⁇ SV
- the stroke volume (SV) can be calculated as a product of the cross-sectional area (CSA) and the velocity time integral (VTI) of the flow velocity in the systolic phase (see the following equation (C)).
- SV CSA ⁇ VTI
- VTI The velocity time integral
- the cardiac output calculation section 130 can calculate the cardiac output (CO) using the following equation (E).
- CO HR ⁇ Vpeak ⁇ ET / 2 ⁇ CSA
- the display control section 140 is implemented by hardware such as a graphics board provided with a GPU and a VRAM, or an electronic circuit (e.g., ASIC), or implemented by a calculation process performed by a CPU or the like, and performs a display control process that displays the cardiac output (CO) on the video monitor 20 (i.e., updates the cardiac output (CO) displayed on the video monitor 20) each time the cardiac output (CO) has been calculated. More specifically, the display control section 140 generates image data for displaying the cardiac output (CO) as a numerical value, or displaying the cardiac output (CO) in time-series graphical representation, generates an image signal for displaying the image data on the video monitor 20, and outputs the image signal to the video monitor 20. Note that the display control section 140 may also control display of additional information such as the electrocardiographic complex, the heart rate (HR), and the blood flow velocity waveform.
- HR heart rate
- the alarm control section 142 is implemented by hardware (e.g., electronic circuit) or a calculation process performed by a CPU or the like, and displays a given alarm on the video monitor 20 when the calculated cardiac output (CO) has satisfied a given alarm condition.
- the alarm condition may be appropriately set using the threshold value or the change rate of the cardiac output (CO), for example.
- the alarm condition may be a fixed value, or may be an arbitrary value that is set using the keyboard 22 before starting the monitoring process.
- the storage section 150 is implemented by an information storage medium such as an IC memory or a hard disk.
- the storage section 150 stores a system program 152, a monitoring program 154, and the CSA parameter TBL 156.
- the system program 152 is a basic program that causes the processing device 100 to function as a computer.
- Each functional section of the processing device 100 can be implemented by a calculation process by causing the processing device 100 to execute the monitoring program 154 in a state in which the system program 152 is executed.
- the storage section 150 functions as a data storage area common to each functional section, and can appropriately store a flag that is necessary for the calculation process performed by the processing device 100, a timing counter value, measured data, a calculated value and an estimated value (e.g., heart rate (HR), flow velocity peak value (Vpeak), system time that indicates the start timing of the ejection time (ET), system time that indicates the end timing of the ejection time (ET), mean arterial pressure (MAP), and cross-sectional area (CSA)), cardiac output calculation-related data 158 that includes various cardiac output calculation-related parameter values (e.g., the sex and the age of the subject), and the like.
- HR heart rate
- Vpeak flow velocity peak value
- ET system time that indicates the start timing of the ejection time
- ET system time that indicates the end timing of the ejection time
- MAP mean arterial pressure
- CSA cross-sectional area
- cardiac output calculation-related data 158 that includes various cardiac output calculation-related parameter values (e.g., the sex and the
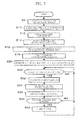
- FIG. 7 is a flowchart illustrating the flow of the process performed by the cardiac output monitoring system 5. Note that the operator attaches the electrodes 6, the transthoracic ultrasonic probe 10, and the arterial diameter measurement ultrasonic probe 12 to the subject 3, and connects the electrodes 6, the transthoracic ultrasonic probe 10, and the arterial diameter measurement ultrasonic probe 12 to the corresponding modules before starting the monitoring process.
- the cardiac output monitoring system 5 performs a process that prompts the operator to input the sex and the age of the subject (step S6). For example, the cardiac output monitoring system 5 displays a given input screen on the video monitor 20, and prompts the operator to input the sex and the age of the subject 3 using the keyboard 22.
- the data about the sex and the age of the subject 3 input by the operator is stored in the storage section 150 as the cardiac output calculation-related data 158.
- the cross-sectional area estimation section 124 can refer to the data about the sex and the age of the subject 3.
- the cardiac output monitoring system 5 then continuously measures the heart rate (HR) using the electrocardiography module 8, continuously measures the flow velocity using the flow velocity measurement module 102, and continuously measures the diameter of the artery using the arterial diameter measurement module 104 (step S10).
- the measured data may be stored in the storage section 150 in time series.
- the cardiac output monitoring system 5 calculates the heart rate (HR) based on the measured data (step S12), detects the flow velocity peak value (Vpeak) (step S14), calculates the ejection time (ET) and the mean arterial pressure (MAP) (step S16), and estimates the cross-sectional area (CSA) (step S18). These values may be linked to the measurement time, and stored in the storage section 150 in time series as the cardiac output calculation-related data 158.
- the cardiac output monitoring system 5 displays appropriate information (parameter value) (e.g., measured data and calculated value) on the video monitor 20 as a numerical value or in the form of a time-series waveform (step S20). The monitoring process starts in this manner.
- the cardiac output monitoring system 5 calculates the stroke volume (SV) (step S32), and multiplies the stroke volume (SV) by the latest heart rate (HR) to calculate the cardiac output (CO) (step S34). These values may be linked to the measurement time, and stored in the storage section 150 in time series. When a new cardiac output (CO) has been calculated, the cardiac output monitoring system 5 displays the new cardiac output (CO) on the video monitor 20 (step S36).
- the cardiac output monitoring system 5 When the cardiac output (CO) has satisfied a given alarm condition (YES in step S40), the cardiac output monitoring system 5 performs an alarm control process, and displays an alarm on the video monitor 20 (step S42).
- the cardiac output monitoring system 5 repeats the steps S30 to S42 in a given measurement cycle during a period in which the monitoring process is performed.
- the cardiac output monitoring system 5 can noninvasively and continuously monitor the cardiac output with high accuracy.
- the parameter CSAmax used to calculate the cross-sectional area (CSA) is referred to from the CSA parameter TBL 156. Note that a value "CSAmax" measured before starting the monitoring process may be input (set) together with the age and the sex of the subject.
- the cross-sectional area (CSA) and the blood pressure may be measured by a known measurement method before starting the monitoring process.
- the measured cross-sectional area (CSA) may be substituted into the left side of the equation (A)
- the measured blood pressure may be substituted for the mean arterial pressure (MAP) on the right side of the equation (A)
- the parameters P1 and P0 known from the age and the sex of the subject 3 may be substituted into the right side of the equation (A) to calculate the value "CSAmax".
- the value "CSAmax” thus calculated may be input in the step S6 in the same manner as the age and the sex of the subject.
- the input value "CSAmax” may be stored in the storage section 150 as the cardiac output calculation-related data 158.
- the cross-sectional area estimation section 124 may refer to the CSA parameter TBL 156 for the values P1 and P0 corresponding to the age and the sex of the subject 3, refer to the cardiac output calculation-related data 158 for the value "CSAmax”, and calculate the cross-sectional area (CSA) using the equation (A).
- a second embodiment to which the invention is applied is described below.
- the configuration according to the second embodiment is basically the same as the configuration according to the first embodiment, but differs from the configuration according to the first embodiment in that the cross-sectional area (CSA) is calculated directly from the measured diameter of the artery.
- CSA cross-sectional area
- FIG. 8 is a functional block diagram illustrating a functional configuration example of a cardiac output monitoring system 5B according to the second embodiment.
- a processing device 100B included in the cardiac output monitoring system 5B includes an ejection time calculation section 123 instead of the ejection time/mean arterial pressure calculation section 122 described above in connection with the first embodiment.
- the ejection time calculation section 123 calculates the ejection time (ET) from the diameter of the artery (carotid artery) (DOA) that is output from the arterial diameter measurement control section 114 in time series, and outputs data about the ejection time (ET) to the cardiac output calculation section 130.
- the ejection time calculation section 123 outputs time-series arterial diameter data calculated during a period from the rising edge (Dus) to the dicrotic notch (Ddn) of the carotid artery diameter waveform 40 to a cross-sectional area estimation section 124B.
- the cross-sectional area estimation section 124B calculates the cross-sectional area (CSA) during a period between the rising edge (Dus) and the dicrotic notch (Ddn) of the carotid artery diameter waveform 40 using the following equation (G) based on a nonlinear function 48, integrates and averages the cross-sectional area (CSA) over the ejection time (ET), and outputs the resulting value to the cardiac output calculation section 130 as the cross-sectional area (CSA) during the ejection time (ET).
- CSA A ⁇ DOA 2 + B ⁇ DOA + C
- A, B, and C are given constants.
- the constants A, B, and C may be set in advance in a program, or may be stored in the storage section 150 in advance so that the constants A, B, and C can be referred to.
- the experimental results obtained by the applicants suggest that the constant A may be 4.8, the constant B may be -41.3, and the constant C may be 89.7, for example. Note that the combination of these coefficients may be determined by experiments.
- An average integral value over the ejection time (ET) may be used as the cross-sectional area (CSA).
- the flow of the process performed by the cardiac output monitoring system 5B is basically the same as that described above in connection with the first embodiment. Note that the sex and the age of the subject 3 need not necessarily be input. The second embodiment can thus achieve the same advantageous effects as those achieved by the first embodiment. The elements may be added, changed, omitted, or replaced in the same manner as in the first embodiment.
- the configuration according to the third embodiment is basically the same as the configuration according to the first embodiment, but differs from the configuration according to the first embodiment in that the ejection time (ET) and the mean arterial pressure (MAP) are calculated from the arterial pressure of a third artery that can be detected from the body surface, and the cross-sectional area (CSA) is estimated from the arterial pressure of the third artery.
- E ejection time
- MAP mean arterial pressure
- CSA cross-sectional area
- FIG. 10 is a view illustrating a system configuration example of a cardiac output monitoring system 5C according to the third embodiment.
- the cardiac output monitoring system 5C includes (1) an electrocardiography module 8 that continuously generates and outputs an electrocardiogram waveform (ECG waveform) that is obtained through electrodes 6 attached to the surface of the chest of a subject 3, and indicates a temporal change in electrical activity of the heart, (2) a transthoracic ultrasonic probe 10 that is a first sensor section that measures the blood flow velocity in a first artery or the ventricular outflow tract connected to the first artery from the body surface of the subject 3, (3) a peripheral arterial pressure measurement probe 14 that is a third sensor section that measures the arterial pressure of a third artery that can be detected from the body surface of the subject 3, (4) a processing device 100C that continuously calculates and outputs the cardiac output based on the data measured by the electrocardiography module 8, the transthoracic ultrasonic probe 10, and the peripheral arterial pressure measurement probe 14, (5) a video monitor 20, and (6) a keyboard 22.
- the processing device 100C includes a peripheral arterial pressure measurement module 106 that measures the peripheral arterial pressure using the peripheral arterial pressure measurement probe 14 instead of the arterial diameter measurement module 104 described above in connection with the first embodiment.
- the peripheral arterial pressure measurement probe 14 is a sensor that is implemented by known strain sensor technology or the like, and is inserted into the radial artery of the subject 3 to measure the blood pressure in the radial artery.
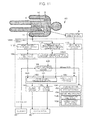
- FIG. 11 is a functional block diagram illustrating a functional configuration example according to the third embodiment.
- the processing device 100C according to the third embodiment includes an arterial pressure measurement control section 116 instead of the arterial diameter measurement control section 114 described above in connection with the first embodiment.
- the arterial pressure measurement control section 116 derives the arterial pressure (P) from an electrical signal output from a strain sensor. Specifically, the arterial pressure measurement control section 116 functions as a blood pressure-deriving section.
- the peripheral arterial pressure measurement module 106 illustrated in FIG. 10 corresponds to the arterial pressure measurement control section 116.
- An ejection time/mean arterial pressure calculation section 122C calculates the ejection time (ET) and the mean arterial pressure (MAP) from peripheral artery blood pressure data that is output from the arterial pressure measurement control section 116 in time series, outputs data about the ejection time (ET) to the cardiac output calculation section 130, and outputs data about the mean arterial pressure (MAP) to the cross-sectional area estimation section 124.
- E ejection time
- MAP mean arterial pressure
- the ejection time/mean arterial pressure calculation section 122C detects the rising edge (Pus) and the dicrotic notch (Pdn) indicated by peripheral artery blood pressure data 42 that is output from the arterial pressure measurement control section 116 in time series, and measures the time elapsed from the rising edge (Pus) to the dicrotic notch (Pdn) to determine the ejection time (ET), for example.
- the flow velocity data 30 (see FIG. 3 ) obtained by measuring the blood flow velocity in the aorta using the ultrasonic Doppler method contains noise (e.g., a flow velocity signal in the diastolic phase or a clutter sound due to opening and closing of the valve), the waveform is vague at or around the ejection time start timing and the ejection time end timing, and it is considered that it is difficult to automatically detect the ejection time (ET) from the flow velocity data 30.
- the peripheral arterial pressure waveform contains a relatively small amount of noise, the rising edge (Pus) and the dicrotic notch (Pdn) of the peripheral arterial pressure waveform can be automatically detected.
- MAP mean arterial pressure
- the flow of the process performed by the cardiac output monitoring system 5C is basically the same as that described above in connection with the first embodiment.
- the third embodiment can thus achieve the same advantageous effects as those achieved by the first embodiment.
- the elements may be added, changed, omitted, or replaced in the same manner as in the first embodiment.
- a fourth embodiment to which the invention is applied is described below.
- the configuration according to the fourth embodiment is basically the same as the configuration according to the second embodiment, but differs from the configuration according to the second embodiment in that the cross-sectional area (CSA) is estimated based on the diameter of the artery, and the ejection time (ET) is calculated from the arterial pressure of the third artery (see the third embodiment).
- CSA cross-sectional area
- ET ejection time
- FIG. 13 is a view illustrating a system configuration example of a cardiac output monitoring system 5D according to the fourth embodiment.
- the cardiac output monitoring system 5D includes (1) an electrocardiography module 8 that continuously generates and outputs an electrocardiogram waveform (ECG waveform) that is obtained through electrodes 6 attached to the surface of the chest of a subject 3, and indicates a temporal change in electrical activity of the heart, (2) a transthoracic ultrasonic probe 10 that is a first sensor section that measures the blood flow velocity in a first artery or the ventricular outflow tract connected to the first artery from the body surface of the subject 3, (3) an arterial diameter measurement ultrasonic probe 12 that is a second sensor section that measures the diameter of a second artery from the body surface of the subject 3, (4) a peripheral arterial pressure measurement probe 14 that is a third sensor section that measures the arterial pressure of a third artery, (5) a processing device 100D that continuously calculates and outputs the cardiac output based on the data measured by the electrocardiography module 8, the transthoracic ultrasonic probe
- the processing device 100D includes the flow velocity measurement module 102 described above in connection with the first embodiment, the arterial diameter measurement module 104 described above in connection with the second embodiment, and the peripheral arterial pressure measurement module 106 described above in connection with the third embodiment.
- FIG. 14 is a functional block diagram illustrating a functional configuration example according to the fourth embodiment.
- the processing device 100D according to the fourth embodiment includes a heart rate calculation section 110, a flow velocity measurement control section 112, an arterial diameter measurement control section 114, and an arterial pressure measurement control section 116.
- the arterial pressure measurement control section 116 outputs the arterial pressure (P) to an ejection time calculation section 123D.
- the ejection time calculation section 123D calculates the ejection time (ET) from a temporal change in the detection signal output from the peripheral arterial pressure measurement probe 14, and outputs the ejection time (ET) to the cardiac output calculation section 130 in the same manner as the ejection time/mean arterial pressure calculation section 122C described above in connection with the third embodiment.
- the ejection time calculation section 123D outputs the arterial pressure at the rising edge (Pus) of the carotid artery diameter waveform 40 and the arterial pressure at the dicrotic notch (Pdn) of the carotid artery diameter waveform 40 calculated when calculating the ejection time (ET), to the cross-sectional area estimation section 124B in the same manner as the ejection time/mean arterial pressure calculation section 122C described above in connection with the third embodiment.
- the cross-sectional area estimation section 124B calculates the cross-sectional area (CSA) during a period between the rising edge (Dus) and the dicrotic notch (Ddn) of the carotid artery diameter waveform 40 that respectively correspond to the arterial pressure at the rising edge (Pus) and the arterial pressure at the dicrotic notch (Pdn) based on the nonlinear function 48 (see FIG. 9 ), integrates and averages the cross-sectional area (CSA) over the ejection time (ET), and outputs the resulting value to the cardiac output calculation section 130 as the cross-sectional area (CSA) during the ejection time (ET).
- the flow of the process performed by the cardiac output monitoring system 5D is basically the same as that described above in connection with the second embodiment. That is, the flow of the process performed by the cardiac output monitoring system 5D is basically the same as that described above in connection with the first embodiment. Therefore, the fourth embodiment can achieve the same advantageous effects as those achieved by the first embodiment.
- the elements may be added, changed, omitted, or replaced in the same manner as in the first embodiment.
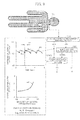
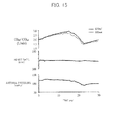
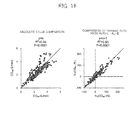
- FIGS. 15 and 16 are graphs showing the cardiac output measurement test results obtained using the cardiac output monitoring system 5C according to the third embodiment.
- the cardiac output measurement test was performed in a state in which an aortic flow velocity probe was implanted directly into the ascending aorta of each of eight dogs, the electrocardiographic electrodes 6, the transthoracic ultrasonic probe 10, and the peripheral artery pressure measurement probe 14 were attached to each dog, and the hemodynamics were changed to a large extent using a cardiotonic drug or the like.
- FIG. 15 is a graph showing the goodness of tracking of the cardiac output of one representative dog among the eight dogs. It was confirmed that the value (COest) measured by the cardiac output monitoring system 5C according to the third embodiment sufficiently followed a change in the value (COref) measured using the aortic flow velocity probe (i.e., a high-fidelity response was obtained by the cardiac output monitoring system 5C according to the third embodiment).
- FIG. 16 is a graph showing the absolute value of the value (COest) of each dog measured by the cardiac output monitoring system 5C according to the third embodiment and the absolute value of the value (COref) of each dog measured using the aortic flow velocity probe, and a relative change rate from the initial value. It was confirmed that the absolute values sufficiently coincide with each other.
- the cardiac output monitoring system can noninvasively and continuously monitor the cardiac output with high accuracy.
- the transthoracic ultrasonic probe 10 described in connection with the above embodiments may be a thin and flat ultrasonic probe for which the focus of the ultrasonic beam can be changed in three-dimensional directions, and the flow velocity measurement module 102 may include an ultrasonic beam control section 184.
- the flow velocity measurement module 102 may be configured so that a rate pulse generated by a rate pulse generation section 170 is delayed by a transmission delay circuit 172, and output to a drive control circuit 174 that generates a drive signal for each ultrasonic transducer in the same manner as in the case of measuring the flow velocity using a known continuous-wave Doppler method.
- the ultrasonic beam can be formed to achieve an in-focus state, or the scan direction or range can be controlled by controlling the amount of delay using the transmission delay circuit 172, or selectively driving the ultrasonic transducer using the drive control circuit 174.
- the ultrasonic echo is amplified by a preamplifier 176, and stored in an echo storage section 178.
- the ultrasonic echo stored in the echo storage section 178 is subjected to a delay process by a reception delay summation section 180 in order to adjust the directivity to the echo from the focus position, and transmitted to a flow velocity data calculation section 182.
- the flow velocity data calculation section 182 performs a Doppler shift frequency analysis process to calculate and output flow velocity data.
- the ultrasonic beam control section 184 is implemented by a DSP, an ASIC, or a calculation process performed by a CPU.
- the ultrasonic beam control section 184 controls either or both of ultrasonic beam focusing and ultrasonic beam scanning performed by the transthoracic ultrasonic probe 10 so that the temporal change waveform of the flow velocity satisfies a given clearness condition and/or the flow velocity peak value becomes a maximum.
- the ultrasonic beam control section 184 controls either or both of ultrasonic beam focusing and ultrasonic beam scanning so that the flow velocity can be measured more accurately.
- the ultrasonic beam control section 184 outputs a delay pattern signal for implementing the desired control to the transmission delay circuit 172 and the reception delay summation section 180, outputs appropriate rate information to the rate pulse generation section 170, and outputs a selection signal that selects the drive target ultrasonic transducer to the drive control circuit 174.
- the transmission delay circuit 172 delays the transmission signal according to the delay pattern signal.
- the reception delay summation section 180 applies a delay time to the echo signal based on the delay pattern signal.
- the drive control circuit 174 drives the selected ultrasonic transducer.
- the ultrasonic beam control section 184 may utilize a technique that controls either or both of ultrasonic beam focusing and ultrasonic beam scanning to trace the maximum flow velocity in the measurement range taking account of the intended use of the flow velocity measured by the flow velocity measurement module 102.
- the flow velocity measurement module 102 includes the ultrasonic beam control section 184, the measurement accuracy is always maintained even if the relative position or the relative posture of the transthoracic ultrasonic probe 10 is changed during continuous cardiac output measurement due to a change in posture of the subject or the like.
- a second ultrasonic beam control section 186 may be provided in the arterial diameter measurement module 104 described in connection with the above embodiments in order to achieve the above effect.
- the second ultrasonic beam control section 186 is implemented by a DSP, an ASIC, or a calculation process performed by a CPU.
- the second ultrasonic beam control section 186 controls either or both of ultrasonic beam focusing and ultrasonic beam scanning performed by the arterial diameter measurement ultrasonic probe 12 so that the major axis length and the minor axis length satisfy a given equality condition when the cross section of a given artery that intersects the direction in which the given artery extends is elliptical, and/or the cross section satisfies a given circularity condition.
- the second ultrasonic beam control section 186 adjusts and controls ultrasonic beam forming or ultrasonic beam scanning to scan the cross section that is almost circular and intersects the direction in which the artery extends so that the diameter of the artery can be accurately measured.
- the second ultrasonic beam control section 186 may utilize a technique that calculates a cross section (orthogonal cross section) orthogonal to the direction in which the blood vessel extends (blood vessel major axis), and a technique that controls beam forming or beam scanning so that the shape of the blood vessel can be measured at the desired cross section.
- the arterial diameter measurement ultrasonic probe 12 may be provided with a two-dimensional array in which a plurality of ultrasonic transducers are disposed in a matrix, and the operator may attach the arterial diameter measurement ultrasonic probe 12 at a position over the carotid artery.
- the second ultrasonic beam control section 186 scans the three-dimensional area of the carotid artery to acquire volume data, and calculates the blood vessel centerline and a cross section orthogonal to the centerline.
- the second ultrasonic beam control section 186 may utilize a known technique that controls beam forming or beam scanning so that the shape of the blood vessel can be measured at the cross section orthogonal to the centerline.
- the arterial diameter measurement ultrasonic probe 12 may be provided with a plurality of parallel line arrays in which a plurality of ultrasonic transducers are arranged linearly, and the operator may attach the arterial diameter measurement ultrasonic probe 12 so that the line arrays are orthogonal to the direction in which the carotid artery extends.
- the measurement may be performed on a line array basis, and the diameter of the blood vessel is estimated from the cross-sectional measurement results based on the tilt angle of each cross section with the blood vessel centerline.
- the control process performed by the ultrasonic beam control section 184 and the control process performed by the second ultrasonic beam control section 186 may be provided between the step S20 and the step S30, for example.
- a step S22 whether or not it is necessary to readjust the measurement parameter (readjustment necessary state) is determined.
- the term "readjustment necessary state” used herein in connection with the ultrasonic beam control section 184 refers to a state in which the temporal change waveform of the flow velocity does not satisfy a given clearness condition and/or the flow velocity peak value does not become a maximum.
- the term “readjustment necessary state” used herein in connection with the second ultrasonic beam control section 186 refers to a state in which the major axis length and the minor axis length do not satisfy a given equality condition when the cross section of the artery that intersects the direction in which the artery extends is elliptical, and/or the cross section does not satisfy a given circularity condition. Whether or not the temporal change waveform of the flow velocity satisfies the clearness condition may be determined by utilizing an image processing technique that determines whether or not a triangular shape is observed in the temporal change waveform of the flow velocity.
- an ultrasonic beam optimization control process is performed (step S24). Specifically, the ultrasonic beam control section 184 and the second ultrasonic beam control section 186 perform the control process corresponding to the measured data that requires a readjustment.
- the peripheral arterial pressure measurement probe 14 may be implemented by an ultrasonic probe.
- the peripheral arterial pressure measurement probe 14 may be a thin and flat pad-type sensor that includes a thin-film piezoelectric diaphragm-type ultrasonic transducer, and can be attached to the subject 3 at a position over the radial artery to measure the diameter of the radial artery, a functional section that corresponds to the second ultrasonic beam control section 186 may be provided in the peripheral arterial pressure measurement module 106, and the arterial pressure may be measured based on the measured diameter of the blood vessel using the relationship between the diameter of the blood vessel and the arterial pressure specified in advance.
- the measurement of the peripheral arterial pressure described in connection with the above embodiments may not be performed using a strain sensor, and may be replaced with estimation from the diameter of the artery using ultrasonic waves, or measurement of the arterial pressure using infrared rays or the like.
- the heart rate (HR) may be calculated from the time interval between the flow velocity peak values, a temporal change in diameter of the artery, or a temporal change in arterial pressure by appropriately utilizing a known technique.
- the elements required to measure an electrocardiogram can be omitted.
Landscapes
- Health & Medical Sciences (AREA)
- Life Sciences & Earth Sciences (AREA)
- Engineering & Computer Science (AREA)
- Medical Informatics (AREA)
- Public Health (AREA)
- General Health & Medical Sciences (AREA)
- Pathology (AREA)
- Biomedical Technology (AREA)
- Biophysics (AREA)
- Physics & Mathematics (AREA)
- Animal Behavior & Ethology (AREA)
- Heart & Thoracic Surgery (AREA)
- Veterinary Medicine (AREA)
- Molecular Biology (AREA)
- Surgery (AREA)
- Nuclear Medicine, Radiotherapy & Molecular Imaging (AREA)
- Radiology & Medical Imaging (AREA)
- Cardiology (AREA)
- Hematology (AREA)
- Physiology (AREA)
- Computer Vision & Pattern Recognition (AREA)
- Dentistry (AREA)
- Oral & Maxillofacial Surgery (AREA)
- Databases & Information Systems (AREA)
- Epidemiology (AREA)
- Primary Health Care (AREA)
- Data Mining & Analysis (AREA)
- Measuring Pulse, Heart Rate, Blood Pressure Or Blood Flow (AREA)
- Ultra Sonic Daignosis Equipment (AREA)
Applications Claiming Priority (2)
| Application Number | Priority Date | Filing Date | Title |
|---|---|---|---|
| JP2012106391 | 2012-05-08 | ||
| JP2013092007A JP2013252423A (ja) | 2012-05-08 | 2013-04-25 | 心拍出量モニター装置および心拍出量測定方法 |
Publications (1)
| Publication Number | Publication Date |
|---|---|
| EP2662026A1 true EP2662026A1 (en) | 2013-11-13 |
Family
ID=48428345
Family Applications (1)
| Application Number | Title | Priority Date | Filing Date |
|---|---|---|---|
| EP13166623.2A Withdrawn EP2662026A1 (en) | 2012-05-08 | 2013-05-06 | Cardiac output monitoring system and cardiac output measurement method |
Country Status (4)
| Country | Link |
|---|---|
| US (1) | US20130303916A1 (https=) |
| EP (1) | EP2662026A1 (https=) |
| JP (1) | JP2013252423A (https=) |
| CN (1) | CN103385703A (https=) |
Families Citing this family (18)
| Publication number | Priority date | Publication date | Assignee | Title |
|---|---|---|---|---|
| US9737223B2 (en) | 2015-05-13 | 2017-08-22 | Medtronic, Inc. | Determining onset of cardiac depolarization and repolarization waves for signal processing |
| US9610045B2 (en) | 2015-07-31 | 2017-04-04 | Medtronic, Inc. | Detection of valid signals versus artifacts in a multichannel mapping system |
| US9782094B2 (en) | 2015-07-31 | 2017-10-10 | Medtronic, Inc. | Identifying ambiguous cardiac signals for electrophysiologic mapping |
| JP6855465B2 (ja) * | 2015-10-09 | 2021-04-07 | コーニンクレッカ フィリップス エヌ ヴェKoninklijke Philips N.V. | 撮像及び生理学的モニタリングを組み合わせた強化型の急性ケアマネジメント |
| US9883836B2 (en) * | 2016-02-08 | 2018-02-06 | International Business Machines Corporation | Embedded device for flow monitoring |
| EP3494893A1 (en) * | 2017-12-05 | 2019-06-12 | Koninklijke Philips N.V. | Ultrasound imaging system and method |
| US11419539B2 (en) | 2017-12-22 | 2022-08-23 | Regents Of The University Of Minnesota | QRS onset and offset times and cycle selection using anterior and posterior electrode signals |
| EP3524165A1 (en) * | 2018-02-08 | 2019-08-14 | Koninklijke Philips N.V. | Monitoring blood distribution in a subject |
| WO2020041529A1 (en) * | 2018-08-21 | 2020-02-27 | California Institute Of Technology | A wireless ultrasound monitoring device |
| WO2020260397A1 (en) * | 2019-06-24 | 2020-12-30 | Foundry Innovation & Research 1, Ltd. | Vessel measurements |
| CN113558664B (zh) * | 2021-07-29 | 2023-08-25 | 苏州晟智医疗科技有限公司 | 一种供氧评分系统 |
| CN113812977B (zh) * | 2021-08-13 | 2023-08-25 | 安徽理工大学 | 超声波血压计 |
| CN115770062B (zh) * | 2021-09-07 | 2025-10-10 | 深圳迈瑞生物医疗电子股份有限公司 | 一种超声波数据的处理方法、成像装置 |
| CN116671979B (zh) * | 2022-02-23 | 2026-03-17 | 深圳市理邦精密仪器股份有限公司 | 一种心输出量的检测方法、装置、电子设备及存储介质 |
| CN114869335B (zh) * | 2022-04-07 | 2023-12-08 | 皖南医学院第一附属医院(皖南医学院弋矶山医院) | 一种局部血流指数的测定方法及设备 |
| CN114970837B (zh) * | 2022-08-01 | 2022-11-11 | 南京邮电大学 | 面向电力物联网的doa估计方法、装置和存储介质 |
| CN116725572A (zh) * | 2023-04-10 | 2023-09-12 | 苏州圣泽医疗科技有限公司 | 连续心排量获取装置、电子设备、计算设备及存储介质 |
| KR102804785B1 (ko) * | 2024-10-30 | 2025-05-12 | 주식회사 엣지케어 | 심박출량 측정장치 |
Citations (4)
| Publication number | Priority date | Publication date | Assignee | Title |
|---|---|---|---|---|
| JPH1094528A (ja) | 1996-09-24 | 1998-04-14 | Nippon Colin Co Ltd | 心拍出量推定装置 |
| WO2004002305A2 (en) * | 2002-07-01 | 2004-01-08 | Allez Physionix | Systems and methods for making noninvasive assessments of cardiac tissue and parameters |
| US20070197924A1 (en) * | 2004-03-05 | 2007-08-23 | O'rourke Michael F | Method and apparatus for determination of cardiac output from the arterial pressure pulse waveform |
| US20100185084A1 (en) * | 2009-01-22 | 2010-07-22 | Siemens Medical Solutions Usa, Inc. | Non-invasive Cardiac Characteristic Determination System |
Family Cites Families (7)
| Publication number | Priority date | Publication date | Assignee | Title |
|---|---|---|---|---|
| US5598845A (en) * | 1995-11-16 | 1997-02-04 | Stellartech Research Corporation | Ultrasound transducer device for continuous imaging of the heart and other body parts |
| US6299583B1 (en) * | 1998-03-17 | 2001-10-09 | Cardiox Corporation | Monitoring total circulating blood volume and cardiac output |
| JP2002355218A (ja) * | 2001-06-01 | 2002-12-10 | Canon Inc | 眼血流計 |
| JP3616061B2 (ja) * | 2002-03-01 | 2005-02-02 | コーリンメディカルテクノロジー株式会社 | 動脈硬化検査装置 |
| US8323202B2 (en) * | 2007-11-16 | 2012-12-04 | Pneumrx, Inc. | Method and system for measuring pulmonary artery circulation information |
| ES2385603T3 (es) * | 2007-11-23 | 2012-07-27 | Pulsion Medical Systems Ag | Conjunto de sensor venoso central para medir datos fisiológicos para la determinación del gasto cardiaco y procedimiento para determinar el gasto cardiaco |
| WO2009138881A2 (en) * | 2008-05-12 | 2009-11-19 | Cardio Art Technologies, Ltd. | Method and system for monitoring a health condition |
-
2013
- 2013-04-25 JP JP2013092007A patent/JP2013252423A/ja not_active Withdrawn
- 2013-05-01 US US13/874,686 patent/US20130303916A1/en not_active Abandoned
- 2013-05-06 EP EP13166623.2A patent/EP2662026A1/en not_active Withdrawn
- 2013-05-07 CN CN2013101633632A patent/CN103385703A/zh active Pending
Patent Citations (4)
| Publication number | Priority date | Publication date | Assignee | Title |
|---|---|---|---|---|
| JPH1094528A (ja) | 1996-09-24 | 1998-04-14 | Nippon Colin Co Ltd | 心拍出量推定装置 |
| WO2004002305A2 (en) * | 2002-07-01 | 2004-01-08 | Allez Physionix | Systems and methods for making noninvasive assessments of cardiac tissue and parameters |
| US20070197924A1 (en) * | 2004-03-05 | 2007-08-23 | O'rourke Michael F | Method and apparatus for determination of cardiac output from the arterial pressure pulse waveform |
| US20100185084A1 (en) * | 2009-01-22 | 2010-07-22 | Siemens Medical Solutions Usa, Inc. | Non-invasive Cardiac Characteristic Determination System |
Non-Patent Citations (2)
| Title |
|---|
| DONNERSTEIN ET AL.: "Simplified method for estimation of Doppler cardiac output in the great arteries", THE AMERICAN JOURNAL OF CARDIOLOGY, vol. 62, no. 1, July 1988 (1988-07-01), pages 155 - 156 |
| JOURNAL OF APPLIED PHYSIOLOGY, vol. 74, no. 5, 1 May 1993 (1993-05-01), pages 2566 |
Also Published As
| Publication number | Publication date |
|---|---|
| US20130303916A1 (en) | 2013-11-14 |
| CN103385703A (zh) | 2013-11-13 |
| JP2013252423A (ja) | 2013-12-19 |
Similar Documents
| Publication | Publication Date | Title |
|---|---|---|
| EP2662026A1 (en) | Cardiac output monitoring system and cardiac output measurement method | |
| CN101347343B (zh) | 超声波图像取得装置 | |
| JP5501999B2 (ja) | 超音波診断装置および弾性指標信頼性判定方法 | |
| EP3749209B1 (en) | Monitoring blood distribution in a subject | |
| US9179889B2 (en) | Ultrasonic diagnostic device, and method for measuring initma-media complex thickness | |
| EP1652477B1 (en) | Ultrasonograph, ultrasonic image processing device, and ultrasonic image processing method | |
| US20150245820A1 (en) | Ultrasonic measurement apparatus and ultrasonic measurement method | |
| JP5874732B2 (ja) | 超音波診断装置および超音波診断装置の制御方法 | |
| JP4667394B2 (ja) | 超音波診断装置 | |
| EP3720359B1 (en) | Patient monitoring | |
| CN100496411C (zh) | 超声波诊断装置及超声波诊断装置的控制方法 | |
| JP4655616B2 (ja) | 超音波診断装置 | |
| JP4745455B2 (ja) | 超音波診断装置、超音波画像処理装置、及び超音波信号処理プログラム | |
| JP7449773B2 (ja) | 超音波診断装置及び送信方法 | |
| JP2017070338A (ja) | 超音波測定装置、血圧測定装置、及び制御方法 | |
| JP2016174798A (ja) | 血圧計測装置および校正方法 |
Legal Events
| Date | Code | Title | Description |
|---|---|---|---|
| PUAI | Public reference made under article 153(3) epc to a published international application that has entered the european phase |
Free format text: ORIGINAL CODE: 0009012 |
|
| AK | Designated contracting states |
Kind code of ref document: A1 Designated state(s): AL AT BE BG CH CY CZ DE DK EE ES FI FR GB GR HR HU IE IS IT LI LT LU LV MC MK MT NL NO PL PT RO RS SE SI SK SM TR |
|
| AX | Request for extension of the european patent |
Extension state: BA ME |
|
| 17P | Request for examination filed |
Effective date: 20140116 |
|
| RBV | Designated contracting states (corrected) |
Designated state(s): AL AT BE BG CH CY CZ DE DK EE ES FI FR GB GR HR HU IE IS IT LI LT LU LV MC MK MT NL NO PL PT RO RS SE SI SK SM TR |
|
| 17Q | First examination report despatched |
Effective date: 20151119 |
|
| STAA | Information on the status of an ep patent application or granted ep patent |
Free format text: STATUS: THE APPLICATION IS DEEMED TO BE WITHDRAWN |
|
| 18D | Application deemed to be withdrawn |
Effective date: 20171201 |