EP2592142A1 - Organism data processing method and device, storage medium and program - Google Patents
Organism data processing method and device, storage medium and program Download PDFInfo
- Publication number
- EP2592142A1 EP2592142A1 EP11803473.5A EP11803473A EP2592142A1 EP 2592142 A1 EP2592142 A1 EP 2592142A1 EP 11803473 A EP11803473 A EP 11803473A EP 2592142 A1 EP2592142 A1 EP 2592142A1
- Authority
- EP
- European Patent Office
- Prior art keywords
- organism
- state
- information
- component
- molecules
- Prior art date
- Legal status (The legal status is an assumption and is not a legal conclusion. Google has not performed a legal analysis and makes no representation as to the accuracy of the status listed.)
- Granted
Links
- 238000003672 processing method Methods 0.000 title claims abstract description 18
- 230000007613 environmental effect Effects 0.000 claims abstract description 95
- 208000037265 diseases, disorders, signs and symptoms Diseases 0.000 claims abstract description 68
- 230000001364 causal effect Effects 0.000 claims abstract description 64
- 201000010099 disease Diseases 0.000 claims abstract description 62
- 230000000737 periodic effect Effects 0.000 claims abstract description 55
- 210000004369 blood Anatomy 0.000 claims abstract description 46
- 239000008280 blood Substances 0.000 claims abstract description 46
- 230000010365 information processing Effects 0.000 claims abstract description 36
- 230000004044 response Effects 0.000 claims abstract description 31
- 239000001963 growth medium Substances 0.000 claims abstract description 15
- 239000002609 medium Substances 0.000 claims abstract description 9
- 210000004027 cell Anatomy 0.000 claims description 125
- 238000005259 measurement Methods 0.000 claims description 54
- 108090000623 proteins and genes Proteins 0.000 claims description 47
- 210000000349 chromosome Anatomy 0.000 claims description 38
- 208000001145 Metabolic Syndrome Diseases 0.000 claims description 10
- 201000000690 abdominal obesity-metabolic syndrome Diseases 0.000 claims description 10
- 239000002773 nucleotide Substances 0.000 claims description 10
- 125000003729 nucleotide group Chemical group 0.000 claims description 10
- 230000008859 change Effects 0.000 description 128
- 239000000306 component Substances 0.000 description 105
- 238000005516 engineering process Methods 0.000 description 50
- 238000000034 method Methods 0.000 description 48
- 230000035882 stress Effects 0.000 description 36
- 230000008569 process Effects 0.000 description 34
- 230000036541 health Effects 0.000 description 33
- 210000004748 cultured cell Anatomy 0.000 description 26
- 230000002068 genetic effect Effects 0.000 description 25
- 102000040945 Transcription factor Human genes 0.000 description 24
- 108091023040 Transcription factor Proteins 0.000 description 24
- 230000004049 epigenetic modification Effects 0.000 description 23
- 230000006870 function Effects 0.000 description 23
- NOESYZHRGYRDHS-UHFFFAOYSA-N insulin Chemical compound N1C(=O)C(NC(=O)C(CCC(N)=O)NC(=O)C(CCC(O)=O)NC(=O)C(C(C)C)NC(=O)C(NC(=O)CN)C(C)CC)CSSCC(C(NC(CO)C(=O)NC(CC(C)C)C(=O)NC(CC=2C=CC(O)=CC=2)C(=O)NC(CCC(N)=O)C(=O)NC(CC(C)C)C(=O)NC(CCC(O)=O)C(=O)NC(CC(N)=O)C(=O)NC(CC=2C=CC(O)=CC=2)C(=O)NC(CSSCC(NC(=O)C(C(C)C)NC(=O)C(CC(C)C)NC(=O)C(CC=2C=CC(O)=CC=2)NC(=O)C(CC(C)C)NC(=O)C(C)NC(=O)C(CCC(O)=O)NC(=O)C(C(C)C)NC(=O)C(CC(C)C)NC(=O)C(CC=2NC=NC=2)NC(=O)C(CO)NC(=O)CNC2=O)C(=O)NCC(=O)NC(CCC(O)=O)C(=O)NC(CCCNC(N)=N)C(=O)NCC(=O)NC(CC=3C=CC=CC=3)C(=O)NC(CC=3C=CC=CC=3)C(=O)NC(CC=3C=CC(O)=CC=3)C(=O)NC(C(C)O)C(=O)N3C(CCC3)C(=O)NC(CCCCN)C(=O)NC(C)C(O)=O)C(=O)NC(CC(N)=O)C(O)=O)=O)NC(=O)C(C(C)CC)NC(=O)C(CO)NC(=O)C(C(C)O)NC(=O)C1CSSCC2NC(=O)C(CC(C)C)NC(=O)C(NC(=O)C(CCC(N)=O)NC(=O)C(CC(N)=O)NC(=O)C(NC(=O)C(N)CC=1C=CC=CC=1)C(C)C)CC1=CN=CN1 NOESYZHRGYRDHS-UHFFFAOYSA-N 0.000 description 22
- 238000010276 construction Methods 0.000 description 18
- 238000012239 gene modification Methods 0.000 description 18
- 230000005017 genetic modification Effects 0.000 description 18
- 235000013617 genetically modified food Nutrition 0.000 description 18
- 208000024891 symptom Diseases 0.000 description 15
- 210000001519 tissue Anatomy 0.000 description 15
- 102000053602 DNA Human genes 0.000 description 14
- 108020004414 DNA Proteins 0.000 description 14
- 230000001413 cellular effect Effects 0.000 description 14
- 238000010586 diagram Methods 0.000 description 13
- 230000004043 responsiveness Effects 0.000 description 13
- 239000011159 matrix material Substances 0.000 description 12
- 208000001072 type 2 diabetes mellitus Diseases 0.000 description 12
- 102000004877 Insulin Human genes 0.000 description 11
- 108090001061 Insulin Proteins 0.000 description 11
- 206010012601 diabetes mellitus Diseases 0.000 description 11
- 229940125396 insulin Drugs 0.000 description 11
- 208000024556 Mendelian disease Diseases 0.000 description 10
- 238000009826 distribution Methods 0.000 description 10
- 239000003862 glucocorticoid Substances 0.000 description 10
- 230000006698 induction Effects 0.000 description 10
- 201000010374 Down Syndrome Diseases 0.000 description 9
- 206010022489 Insulin Resistance Diseases 0.000 description 9
- 208000015181 infectious disease Diseases 0.000 description 9
- 239000003147 molecular marker Substances 0.000 description 9
- 230000037213 diet Effects 0.000 description 8
- 235000005911 diet Nutrition 0.000 description 8
- 239000003814 drug Substances 0.000 description 8
- 230000028327 secretion Effects 0.000 description 8
- 102000004219 Brain-derived neurotrophic factor Human genes 0.000 description 7
- 108090000715 Brain-derived neurotrophic factor Proteins 0.000 description 7
- 102000004889 Interleukin-6 Human genes 0.000 description 7
- 108090001005 Interleukin-6 Proteins 0.000 description 7
- 208000008589 Obesity Diseases 0.000 description 7
- 238000004458 analytical method Methods 0.000 description 7
- 229940077737 brain-derived neurotrophic factor Drugs 0.000 description 7
- 235000020824 obesity Nutrition 0.000 description 7
- 208000017667 Chronic Disease Diseases 0.000 description 6
- 102000016267 Leptin Human genes 0.000 description 6
- 108010092277 Leptin Proteins 0.000 description 6
- 235000019577 caloric intake Nutrition 0.000 description 6
- 238000006243 chemical reaction Methods 0.000 description 6
- 230000000875 corresponding effect Effects 0.000 description 6
- 230000007423 decrease Effects 0.000 description 6
- 208000035475 disorder Diseases 0.000 description 6
- 230000012010 growth Effects 0.000 description 6
- 208000036260 idiopathic disease Diseases 0.000 description 6
- 230000001965 increasing effect Effects 0.000 description 6
- 229940100601 interleukin-6 Drugs 0.000 description 6
- 229940039781 leptin Drugs 0.000 description 6
- NRYBAZVQPHGZNS-ZSOCWYAHSA-N leptin Chemical compound O=C([C@H](CO)NC(=O)[C@H](CC(C)C)NC(=O)[C@H](CC(O)=O)NC(=O)[C@H](CC(C)C)NC(=O)[C@H](CCC(N)=O)NC(=O)[C@H](CC=1C2=CC=CC=C2NC=1)NC(=O)[C@H](CC(C)C)NC(=O)[C@@H](NC(=O)[C@H](CC(O)=O)NC(=O)[C@H](CCC(N)=O)NC(=O)[C@H](CC(C)C)NC(=O)[C@H](CO)NC(=O)CNC(=O)[C@H](CCC(N)=O)NC(=O)[C@@H](N)CC(C)C)CCSC)N1CCC[C@H]1C(=O)NCC(=O)N[C@@H](CS)C(O)=O NRYBAZVQPHGZNS-ZSOCWYAHSA-N 0.000 description 6
- 238000004519 manufacturing process Methods 0.000 description 6
- 235000012054 meals Nutrition 0.000 description 6
- 210000000056 organ Anatomy 0.000 description 6
- 230000002265 prevention Effects 0.000 description 6
- 238000011160 research Methods 0.000 description 6
- 230000001932 seasonal effect Effects 0.000 description 6
- QVGXLLKOCUKJST-UHFFFAOYSA-N atomic oxygen Chemical compound [O] QVGXLLKOCUKJST-UHFFFAOYSA-N 0.000 description 5
- 230000027288 circadian rhythm Effects 0.000 description 5
- 230000001276 controlling effect Effects 0.000 description 5
- CZWCKYRVOZZJNM-USOAJAOKSA-N dehydroepiandrosterone sulfate Chemical compound C1[C@@H](OS(O)(=O)=O)CC[C@]2(C)[C@H]3CC[C@](C)(C(CC4)=O)[C@@H]4[C@@H]3CC=C21 CZWCKYRVOZZJNM-USOAJAOKSA-N 0.000 description 5
- 238000011161 development Methods 0.000 description 5
- 230000018109 developmental process Effects 0.000 description 5
- 230000000694 effects Effects 0.000 description 5
- 235000016709 nutrition Nutrition 0.000 description 5
- 229910052760 oxygen Inorganic materials 0.000 description 5
- 239000001301 oxygen Substances 0.000 description 5
- 230000035790 physiological processes and functions Effects 0.000 description 5
- 239000000047 product Substances 0.000 description 5
- 102000004169 proteins and genes Human genes 0.000 description 5
- 230000035945 sensitivity Effects 0.000 description 5
- 230000009897 systematic effect Effects 0.000 description 5
- 238000011282 treatment Methods 0.000 description 5
- 102000011690 Adiponectin Human genes 0.000 description 4
- 108010076365 Adiponectin Proteins 0.000 description 4
- 102000004127 Cytokines Human genes 0.000 description 4
- 108090000695 Cytokines Proteins 0.000 description 4
- 206010012289 Dementia Diseases 0.000 description 4
- WQZGKKKJIJFFOK-GASJEMHNSA-N Glucose Natural products OC[C@H]1OC(O)[C@H](O)[C@@H](O)[C@@H]1O WQZGKKKJIJFFOK-GASJEMHNSA-N 0.000 description 4
- 206010061218 Inflammation Diseases 0.000 description 4
- 206010028980 Neoplasm Diseases 0.000 description 4
- 108091028043 Nucleic acid sequence Proteins 0.000 description 4
- 230000032683 aging Effects 0.000 description 4
- 230000015572 biosynthetic process Effects 0.000 description 4
- 201000011510 cancer Diseases 0.000 description 4
- 230000034994 death Effects 0.000 description 4
- 235000005686 eating Nutrition 0.000 description 4
- 238000011156 evaluation Methods 0.000 description 4
- 238000009472 formulation Methods 0.000 description 4
- 239000008103 glucose Substances 0.000 description 4
- 238000009499 grossing Methods 0.000 description 4
- 239000003102 growth factor Substances 0.000 description 4
- 230000004054 inflammatory process Effects 0.000 description 4
- 230000003914 insulin secretion Effects 0.000 description 4
- 230000007774 longterm Effects 0.000 description 4
- 230000007246 mechanism Effects 0.000 description 4
- 239000000203 mixture Substances 0.000 description 4
- 210000001082 somatic cell Anatomy 0.000 description 4
- 239000000126 substance Substances 0.000 description 4
- 108010074051 C-Reactive Protein Proteins 0.000 description 3
- 102100032752 C-reactive protein Human genes 0.000 description 3
- 230000007067 DNA methylation Effects 0.000 description 3
- 208000026350 Inborn Genetic disease Diseases 0.000 description 3
- 108090000373 Tissue Plasminogen Activator Proteins 0.000 description 3
- 102000019400 Tissue-type plasminogen activator Human genes 0.000 description 3
- 206010044688 Trisomy 21 Diseases 0.000 description 3
- 230000004075 alteration Effects 0.000 description 3
- 235000019789 appetite Nutrition 0.000 description 3
- 230000036528 appetite Effects 0.000 description 3
- 238000004113 cell culture Methods 0.000 description 3
- 230000001684 chronic effect Effects 0.000 description 3
- 208000016361 genetic disease Diseases 0.000 description 3
- 231100000652 hormesis Toxicity 0.000 description 3
- 230000036039 immunity Effects 0.000 description 3
- 230000002757 inflammatory effect Effects 0.000 description 3
- 238000012423 maintenance Methods 0.000 description 3
- 230000004048 modification Effects 0.000 description 3
- 238000012986 modification Methods 0.000 description 3
- 210000002569 neuron Anatomy 0.000 description 3
- 230000000474 nursing effect Effects 0.000 description 3
- 230000035764 nutrition Effects 0.000 description 3
- 230000036961 partial effect Effects 0.000 description 3
- 238000012552 review Methods 0.000 description 3
- 210000000130 stem cell Anatomy 0.000 description 3
- 238000012731 temporal analysis Methods 0.000 description 3
- 238000000700 time series analysis Methods 0.000 description 3
- KZMAWJRXKGLWGS-UHFFFAOYSA-N 2-chloro-n-[4-(4-methoxyphenyl)-1,3-thiazol-2-yl]-n-(3-methoxypropyl)acetamide Chemical compound S1C(N(C(=O)CCl)CCCOC)=NC(C=2C=CC(OC)=CC=2)=C1 KZMAWJRXKGLWGS-UHFFFAOYSA-N 0.000 description 2
- 208000004611 Abdominal Obesity Diseases 0.000 description 2
- PQSUYGKTWSAVDQ-ZVIOFETBSA-N Aldosterone Chemical compound C([C@@]1([C@@H](C(=O)CO)CC[C@H]1[C@@H]1CC2)C=O)[C@H](O)[C@@H]1[C@]1(C)C2=CC(=O)CC1 PQSUYGKTWSAVDQ-ZVIOFETBSA-N 0.000 description 2
- PQSUYGKTWSAVDQ-UHFFFAOYSA-N Aldosterone Natural products C1CC2C3CCC(C(=O)CO)C3(C=O)CC(O)C2C2(C)C1=CC(=O)CC2 PQSUYGKTWSAVDQ-UHFFFAOYSA-N 0.000 description 2
- 208000024172 Cardiovascular disease Diseases 0.000 description 2
- 208000031404 Chromosome Aberrations Diseases 0.000 description 2
- 206010010144 Completed suicide Diseases 0.000 description 2
- 238000000018 DNA microarray Methods 0.000 description 2
- 230000009946 DNA mutation Effects 0.000 description 2
- 108090000079 Glucocorticoid Receptors Proteins 0.000 description 2
- 108010033040 Histones Proteins 0.000 description 2
- 108090000723 Insulin-Like Growth Factor I Proteins 0.000 description 2
- 102000004218 Insulin-Like Growth Factor I Human genes 0.000 description 2
- XEEYBQQBJWHFJM-UHFFFAOYSA-N Iron Chemical compound [Fe] XEEYBQQBJWHFJM-UHFFFAOYSA-N 0.000 description 2
- QAOWNCQODCNURD-UHFFFAOYSA-N Sulfuric acid Chemical compound OS(O)(=O)=O QAOWNCQODCNURD-UHFFFAOYSA-N 0.000 description 2
- 210000001744 T-lymphocyte Anatomy 0.000 description 2
- 210000001766 X chromosome Anatomy 0.000 description 2
- 230000005856 abnormality Effects 0.000 description 2
- 210000001789 adipocyte Anatomy 0.000 description 2
- UCTWMZQNUQWSLP-UHFFFAOYSA-N adrenaline Chemical compound CNCC(O)C1=CC=C(O)C(O)=C1 UCTWMZQNUQWSLP-UHFFFAOYSA-N 0.000 description 2
- 229960002478 aldosterone Drugs 0.000 description 2
- 230000003305 autocrine Effects 0.000 description 2
- 229960000182 blood factors Drugs 0.000 description 2
- 150000001720 carbohydrates Chemical class 0.000 description 2
- 230000024245 cell differentiation Effects 0.000 description 2
- 230000032823 cell division Effects 0.000 description 2
- 238000004925 denaturation Methods 0.000 description 2
- 230000036425 denaturation Effects 0.000 description 2
- 230000001419 dependent effect Effects 0.000 description 2
- 230000004069 differentiation Effects 0.000 description 2
- 229940079593 drug Drugs 0.000 description 2
- 210000000750 endocrine system Anatomy 0.000 description 2
- 235000019197 fats Nutrition 0.000 description 2
- 230000004720 fertilization Effects 0.000 description 2
- 229940088597 hormone Drugs 0.000 description 2
- 239000005556 hormone Substances 0.000 description 2
- 208000026278 immune system disease Diseases 0.000 description 2
- 230000001939 inductive effect Effects 0.000 description 2
- 239000004615 ingredient Substances 0.000 description 2
- 230000002401 inhibitory effect Effects 0.000 description 2
- 230000003993 interaction Effects 0.000 description 2
- 210000001596 intra-abdominal fat Anatomy 0.000 description 2
- 210000004185 liver Anatomy 0.000 description 2
- 239000003550 marker Substances 0.000 description 2
- 230000035772 mutation Effects 0.000 description 2
- 230000003076 paracrine Effects 0.000 description 2
- 230000035479 physiological effects, processes and functions Effects 0.000 description 2
- 235000017807 phytochemicals Nutrition 0.000 description 2
- 230000001817 pituitary effect Effects 0.000 description 2
- 229930000223 plant secondary metabolite Natural products 0.000 description 2
- 238000012545 processing Methods 0.000 description 2
- 238000000611 regression analysis Methods 0.000 description 2
- 230000004037 social stress Effects 0.000 description 2
- 201000000596 systemic lupus erythematosus Diseases 0.000 description 2
- 238000011269 treatment regimen Methods 0.000 description 2
- 239000011782 vitamin Substances 0.000 description 2
- 229940088594 vitamin Drugs 0.000 description 2
- 229930003231 vitamin Natural products 0.000 description 2
- 235000013343 vitamin Nutrition 0.000 description 2
- 150000003722 vitamin derivatives Chemical class 0.000 description 2
- SFLSHLFXELFNJZ-QMMMGPOBSA-N (-)-norepinephrine Chemical compound NC[C@H](O)C1=CC=C(O)C(O)=C1 SFLSHLFXELFNJZ-QMMMGPOBSA-N 0.000 description 1
- MZOFCQQQCNRIBI-VMXHOPILSA-N (3s)-4-[[(2s)-1-[[(2s)-1-[[(1s)-1-carboxy-2-hydroxyethyl]amino]-4-methyl-1-oxopentan-2-yl]amino]-5-(diaminomethylideneamino)-1-oxopentan-2-yl]amino]-3-[[2-[[(2s)-2,6-diaminohexanoyl]amino]acetyl]amino]-4-oxobutanoic acid Chemical compound OC[C@@H](C(O)=O)NC(=O)[C@H](CC(C)C)NC(=O)[C@H](CCCN=C(N)N)NC(=O)[C@H](CC(O)=O)NC(=O)CNC(=O)[C@@H](N)CCCCN MZOFCQQQCNRIBI-VMXHOPILSA-N 0.000 description 1
- DRCWOKJLSQUJPZ-DZGCQCFKSA-N (4ar,9as)-n-ethyl-1,4,9,9a-tetrahydrofluoren-4a-amine Chemical compound C1C2=CC=CC=C2[C@]2(NCC)[C@H]1CC=CC2 DRCWOKJLSQUJPZ-DZGCQCFKSA-N 0.000 description 1
- IIZPXYDJLKNOIY-JXPKJXOSSA-N 1-palmitoyl-2-arachidonoyl-sn-glycero-3-phosphocholine Chemical compound CCCCCCCCCCCCCCCC(=O)OC[C@H](COP([O-])(=O)OCC[N+](C)(C)C)OC(=O)CCC\C=C/C\C=C/C\C=C/C\C=C/CCCCC IIZPXYDJLKNOIY-JXPKJXOSSA-N 0.000 description 1
- 101150028074 2 gene Proteins 0.000 description 1
- 208000024827 Alzheimer disease Diseases 0.000 description 1
- 102000009091 Amyloidogenic Proteins Human genes 0.000 description 1
- 108010048112 Amyloidogenic Proteins Proteins 0.000 description 1
- 208000000575 Arteriosclerosis Obliterans Diseases 0.000 description 1
- 210000002237 B-cell of pancreatic islet Anatomy 0.000 description 1
- 241000894006 Bacteria Species 0.000 description 1
- 201000004569 Blindness Diseases 0.000 description 1
- ZOXJGFHDIHLPTG-UHFFFAOYSA-N Boron Chemical compound [B] ZOXJGFHDIHLPTG-UHFFFAOYSA-N 0.000 description 1
- 206010006187 Breast cancer Diseases 0.000 description 1
- 208000026310 Breast neoplasm Diseases 0.000 description 1
- 102100021943 C-C motif chemokine 2 Human genes 0.000 description 1
- 208000005623 Carcinogenesis Diseases 0.000 description 1
- 208000020446 Cardiac disease Diseases 0.000 description 1
- 108010012236 Chemokines Proteins 0.000 description 1
- 102000019034 Chemokines Human genes 0.000 description 1
- VYZAMTAEIAYCRO-UHFFFAOYSA-N Chromium Chemical compound [Cr] VYZAMTAEIAYCRO-UHFFFAOYSA-N 0.000 description 1
- 206010008805 Chromosomal abnormalities Diseases 0.000 description 1
- 208000035473 Communicable disease Diseases 0.000 description 1
- 206010010356 Congenital anomaly Diseases 0.000 description 1
- RYGMFSIKBFXOCR-UHFFFAOYSA-N Copper Chemical compound [Cu] RYGMFSIKBFXOCR-UHFFFAOYSA-N 0.000 description 1
- 239000000055 Corticotropin-Releasing Hormone Substances 0.000 description 1
- FMGSKLZLMKYGDP-UHFFFAOYSA-N Dehydroepiandrosterone Natural products C1C(O)CCC2(C)C3CCC(C)(C(CC4)=O)C4C3CC=C21 FMGSKLZLMKYGDP-UHFFFAOYSA-N 0.000 description 1
- 208000032928 Dyslipidaemia Diseases 0.000 description 1
- LFQSCWFLJHTTHZ-UHFFFAOYSA-N Ethanol Chemical compound CCO LFQSCWFLJHTTHZ-UHFFFAOYSA-N 0.000 description 1
- 208000004930 Fatty Liver Diseases 0.000 description 1
- 102000003974 Fibroblast growth factor 2 Human genes 0.000 description 1
- 108090000379 Fibroblast growth factor 2 Proteins 0.000 description 1
- 206010064571 Gene mutation Diseases 0.000 description 1
- 206010071602 Genetic polymorphism Diseases 0.000 description 1
- 102000051325 Glucagon Human genes 0.000 description 1
- 108060003199 Glucagon Proteins 0.000 description 1
- 102100034120 Golgin subfamily A member 6A Human genes 0.000 description 1
- 206010019280 Heart failures Diseases 0.000 description 1
- 206010019708 Hepatic steatosis Diseases 0.000 description 1
- 108091016366 Histone-lysine N-methyltransferase EHMT1 Proteins 0.000 description 1
- 241000282412 Homo Species 0.000 description 1
- 101001050473 Homo sapiens Intelectin-1 Proteins 0.000 description 1
- 101001008429 Homo sapiens Nucleobindin-2 Proteins 0.000 description 1
- 101000665882 Homo sapiens Retinol-binding protein 4 Proteins 0.000 description 1
- 206010020710 Hyperphagia Diseases 0.000 description 1
- 206010020772 Hypertension Diseases 0.000 description 1
- 206010061216 Infarction Diseases 0.000 description 1
- 102100023353 Intelectin-1 Human genes 0.000 description 1
- 108010050904 Interferons Proteins 0.000 description 1
- 102000014150 Interferons Human genes 0.000 description 1
- 102000015696 Interleukins Human genes 0.000 description 1
- 108010063738 Interleukins Proteins 0.000 description 1
- 102000036770 Islet Amyloid Polypeptide Human genes 0.000 description 1
- 108010041872 Islet Amyloid Polypeptide Proteins 0.000 description 1
- 238000006165 Knowles reaction Methods 0.000 description 1
- 208000017170 Lipid metabolism disease Diseases 0.000 description 1
- 102000004083 Lymphotoxin-alpha Human genes 0.000 description 1
- 108090000542 Lymphotoxin-alpha Proteins 0.000 description 1
- 101710091439 Major capsid protein 1 Proteins 0.000 description 1
- 108010052285 Membrane Proteins Proteins 0.000 description 1
- 102000018697 Membrane Proteins Human genes 0.000 description 1
- 208000036626 Mental retardation Diseases 0.000 description 1
- ZOKXTWBITQBERF-UHFFFAOYSA-N Molybdenum Chemical compound [Mo] ZOKXTWBITQBERF-UHFFFAOYSA-N 0.000 description 1
- 108010025020 Nerve Growth Factor Proteins 0.000 description 1
- 102000007072 Nerve Growth Factors Human genes 0.000 description 1
- 208000012902 Nervous system disease Diseases 0.000 description 1
- 206010029333 Neurosis Diseases 0.000 description 1
- 108010064862 Nicotinamide phosphoribosyltransferase Proteins 0.000 description 1
- 102000015532 Nicotinamide phosphoribosyltransferase Human genes 0.000 description 1
- 102100027441 Nucleobindin-2 Human genes 0.000 description 1
- 206010053159 Organ failure Diseases 0.000 description 1
- 208000001132 Osteoporosis Diseases 0.000 description 1
- 208000018737 Parkinson disease Diseases 0.000 description 1
- 208000030831 Peripheral arterial occlusive disease Diseases 0.000 description 1
- 108010022233 Plasminogen Activator Inhibitor 1 Proteins 0.000 description 1
- 102100039418 Plasminogen activator inhibitor 1 Human genes 0.000 description 1
- 108091000054 Prion Proteins 0.000 description 1
- 102000029797 Prion Human genes 0.000 description 1
- 208000017442 Retinal disease Diseases 0.000 description 1
- 102100038246 Retinol-binding protein 4 Human genes 0.000 description 1
- 206010038923 Retinopathy Diseases 0.000 description 1
- 102000040739 Secretory proteins Human genes 0.000 description 1
- 108091058545 Secretory proteins Proteins 0.000 description 1
- BUGBHKTXTAQXES-UHFFFAOYSA-N Selenium Chemical compound [Se] BUGBHKTXTAQXES-UHFFFAOYSA-N 0.000 description 1
- 238000012300 Sequence Analysis Methods 0.000 description 1
- 208000006011 Stroke Diseases 0.000 description 1
- 208000037280 Trisomy Diseases 0.000 description 1
- 108060008682 Tumor Necrosis Factor Proteins 0.000 description 1
- 102000000852 Tumor Necrosis Factor-alpha Human genes 0.000 description 1
- 108010062497 VLDL Lipoproteins Proteins 0.000 description 1
- 206010052428 Wound Diseases 0.000 description 1
- 208000027418 Wounds and injury Diseases 0.000 description 1
- 210000002593 Y chromosome Anatomy 0.000 description 1
- HCHKCACWOHOZIP-UHFFFAOYSA-N Zinc Chemical compound [Zn] HCHKCACWOHOZIP-UHFFFAOYSA-N 0.000 description 1
- 230000001133 acceleration Effects 0.000 description 1
- 239000004480 active ingredient Substances 0.000 description 1
- 230000001154 acute effect Effects 0.000 description 1
- 230000006978 adaptation Effects 0.000 description 1
- 210000004100 adrenal gland Anatomy 0.000 description 1
- 230000003712 anti-aging effect Effects 0.000 description 1
- 238000013459 approach Methods 0.000 description 1
- 210000003403 autonomic nervous system Anatomy 0.000 description 1
- 210000003719 b-lymphocyte Anatomy 0.000 description 1
- 230000037429 base substitution Effects 0.000 description 1
- 230000003542 behavioural effect Effects 0.000 description 1
- 239000000090 biomarker Substances 0.000 description 1
- 230000037396 body weight Effects 0.000 description 1
- 229910052796 boron Inorganic materials 0.000 description 1
- 238000004364 calculation method Methods 0.000 description 1
- 235000020934 caloric restriction Nutrition 0.000 description 1
- 230000036952 cancer formation Effects 0.000 description 1
- 230000000711 cancerogenic effect Effects 0.000 description 1
- 230000023852 carbohydrate metabolic process Effects 0.000 description 1
- 231100000357 carcinogen Toxicity 0.000 description 1
- 231100000504 carcinogenesis Toxicity 0.000 description 1
- 239000003183 carcinogenic agent Substances 0.000 description 1
- 230000000747 cardiac effect Effects 0.000 description 1
- 230000003915 cell function Effects 0.000 description 1
- 230000010261 cell growth Effects 0.000 description 1
- 238000002659 cell therapy Methods 0.000 description 1
- 208000026106 cerebrovascular disease Diseases 0.000 description 1
- 238000007385 chemical modification Methods 0.000 description 1
- 108091006090 chromatin-associated proteins Proteins 0.000 description 1
- 230000037326 chronic stress Effects 0.000 description 1
- 231100000749 chronicity Toxicity 0.000 description 1
- 230000007012 clinical effect Effects 0.000 description 1
- 239000010941 cobalt Substances 0.000 description 1
- 229910017052 cobalt Inorganic materials 0.000 description 1
- GUTLYIVDDKVIGB-UHFFFAOYSA-N cobalt atom Chemical compound [Co] GUTLYIVDDKVIGB-UHFFFAOYSA-N 0.000 description 1
- 206010009887 colitis Diseases 0.000 description 1
- 208000018631 connective tissue disease Diseases 0.000 description 1
- 238000010411 cooking Methods 0.000 description 1
- 230000010485 coping Effects 0.000 description 1
- 229910052802 copper Inorganic materials 0.000 description 1
- 239000010949 copper Substances 0.000 description 1
- 230000002596 correlated effect Effects 0.000 description 1
- IDLFZVILOHSSID-OVLDLUHVSA-N corticotropin Chemical compound C([C@@H](C(=O)N[C@@H](CO)C(=O)N[C@@H](CCSC)C(=O)N[C@@H](CCC(O)=O)C(=O)N[C@@H](CC=1NC=NC=1)C(=O)N[C@@H](CC=1C=CC=CC=1)C(=O)N[C@@H](CCCNC(N)=N)C(=O)N[C@@H](CC=1C2=CC=CC=C2NC=1)C(=O)NCC(=O)N[C@@H](CCCCN)C(=O)N1[C@@H](CCC1)C(=O)N[C@@H](C(C)C)C(=O)NCC(=O)N[C@@H](CCCCN)C(=O)N[C@@H](CCCCN)C(=O)N[C@@H](CCCNC(N)=N)C(=O)N[C@@H](CCCNC(N)=N)C(=O)N1[C@@H](CCC1)C(=O)N[C@@H](C(C)C)C(=O)N[C@@H](CCCCN)C(=O)N[C@@H](C(C)C)C(=O)N[C@@H](CC=1C=CC(O)=CC=1)C(=O)N1[C@@H](CCC1)C(=O)N[C@@H](CC(N)=O)C(=O)NCC(=O)N[C@@H](C)C(=O)N[C@@H](CCC(O)=O)C(=O)N[C@@H](CC(O)=O)C(=O)N[C@@H](CCC(O)=O)C(=O)N[C@@H](CO)C(=O)N[C@@H](C)C(=O)N[C@@H](CCC(O)=O)C(=O)N[C@@H](C)C(=O)N[C@@H](CC=1C=CC=CC=1)C(=O)N1[C@@H](CCC1)C(=O)N[C@@H](CC(C)C)C(=O)N[C@@H](CCC(O)=O)C(=O)N[C@@H](CC=1C=CC=CC=1)C(O)=O)NC(=O)[C@@H](N)CO)C1=CC=C(O)C=C1 IDLFZVILOHSSID-OVLDLUHVSA-N 0.000 description 1
- 229960000258 corticotropin Drugs 0.000 description 1
- 238000007405 data analysis Methods 0.000 description 1
- 238000000354 decomposition reaction Methods 0.000 description 1
- 230000003247 decreasing effect Effects 0.000 description 1
- 230000007547 defect Effects 0.000 description 1
- 230000003412 degenerative effect Effects 0.000 description 1
- 230000000593 degrading effect Effects 0.000 description 1
- FMGSKLZLMKYGDP-USOAJAOKSA-N dehydroepiandrosterone Chemical compound C1[C@@H](O)CC[C@]2(C)[C@H]3CC[C@](C)(C(CC4)=O)[C@@H]4[C@@H]3CC=C21 FMGSKLZLMKYGDP-USOAJAOKSA-N 0.000 description 1
- 230000001934 delay Effects 0.000 description 1
- 210000004443 dendritic cell Anatomy 0.000 description 1
- 238000000502 dialysis Methods 0.000 description 1
- 235000018823 dietary intake Nutrition 0.000 description 1
- 208000016097 disease of metabolism Diseases 0.000 description 1
- 230000009429 distress Effects 0.000 description 1
- 230000035622 drinking Effects 0.000 description 1
- 230000009977 dual effect Effects 0.000 description 1
- 230000004064 dysfunction Effects 0.000 description 1
- 235000006694 eating habits Nutrition 0.000 description 1
- 239000000598 endocrine disruptor Substances 0.000 description 1
- 231100000049 endocrine disruptor Toxicity 0.000 description 1
- 230000001973 epigenetic effect Effects 0.000 description 1
- 230000001747 exhibiting effect Effects 0.000 description 1
- 238000002474 experimental method Methods 0.000 description 1
- 208000010706 fatty liver disease Diseases 0.000 description 1
- 239000007850 fluorescent dye Substances 0.000 description 1
- 238000001215 fluorescent labelling Methods 0.000 description 1
- 235000012631 food intake Nutrition 0.000 description 1
- 230000037406 food intake Effects 0.000 description 1
- 230000007614 genetic variation Effects 0.000 description 1
- 230000008826 genomic mutation Effects 0.000 description 1
- 210000004602 germ cell Anatomy 0.000 description 1
- 208000024693 gingival disease Diseases 0.000 description 1
- MASNOZXLGMXCHN-ZLPAWPGGSA-N glucagon Chemical compound C([C@@H](C(=O)N[C@H](C(=O)N[C@@H](CCC(N)=O)C(=O)N[C@@H](CC=1C2=CC=CC=C2NC=1)C(=O)N[C@@H](CC(C)C)C(=O)N[C@@H](CCSC)C(=O)N[C@@H](CC(N)=O)C(=O)N[C@@H]([C@@H](C)O)C(O)=O)C(C)C)NC(=O)[C@H](CC(O)=O)NC(=O)[C@H](CCC(N)=O)NC(=O)[C@H](C)NC(=O)[C@H](CCCNC(N)=N)NC(=O)[C@H](CCCNC(N)=N)NC(=O)[C@H](CO)NC(=O)[C@H](CC(O)=O)NC(=O)[C@H](CC(C)C)NC(=O)[C@H](CC=1C=CC(O)=CC=1)NC(=O)[C@H](CCCCN)NC(=O)[C@H](CO)NC(=O)[C@H](CC=1C=CC(O)=CC=1)NC(=O)[C@H](CC(O)=O)NC(=O)[C@H](CO)NC(=O)[C@@H](NC(=O)[C@H](CC=1C=CC=CC=1)NC(=O)[C@@H](NC(=O)CNC(=O)[C@H](CCC(N)=O)NC(=O)[C@H](CO)NC(=O)[C@@H](N)CC=1NC=NC=1)[C@@H](C)O)[C@@H](C)O)C1=CC=CC=C1 MASNOZXLGMXCHN-ZLPAWPGGSA-N 0.000 description 1
- 229960004666 glucagon Drugs 0.000 description 1
- 210000003714 granulocyte Anatomy 0.000 description 1
- 208000019622 heart disease Diseases 0.000 description 1
- 210000002443 helper t lymphocyte Anatomy 0.000 description 1
- 210000001320 hippocampus Anatomy 0.000 description 1
- 235000003642 hunger Nutrition 0.000 description 1
- 201000001421 hyperglycemia Diseases 0.000 description 1
- 230000002267 hypothalamic effect Effects 0.000 description 1
- 238000010191 image analysis Methods 0.000 description 1
- 210000000987 immune system Anatomy 0.000 description 1
- 230000006872 improvement Effects 0.000 description 1
- 230000007574 infarction Effects 0.000 description 1
- 208000027866 inflammatory disease Diseases 0.000 description 1
- 230000000977 initiatory effect Effects 0.000 description 1
- 230000010354 integration Effects 0.000 description 1
- 102000006495 integrins Human genes 0.000 description 1
- 108010044426 integrins Proteins 0.000 description 1
- 229940079322 interferon Drugs 0.000 description 1
- 210000000936 intestine Anatomy 0.000 description 1
- 230000003834 intracellular effect Effects 0.000 description 1
- 238000011835 investigation Methods 0.000 description 1
- PNDPGZBMCMUPRI-UHFFFAOYSA-N iodine Chemical compound II PNDPGZBMCMUPRI-UHFFFAOYSA-N 0.000 description 1
- 229910052742 iron Inorganic materials 0.000 description 1
- 230000002427 irreversible effect Effects 0.000 description 1
- 230000000302 ischemic effect Effects 0.000 description 1
- 210000003734 kidney Anatomy 0.000 description 1
- 208000017169 kidney disease Diseases 0.000 description 1
- 238000002372 labelling Methods 0.000 description 1
- 229940067606 lecithin Drugs 0.000 description 1
- 235000010445 lecithin Nutrition 0.000 description 1
- 239000000787 lecithin Substances 0.000 description 1
- 208000032839 leukemia Diseases 0.000 description 1
- 238000011542 limb amputation Methods 0.000 description 1
- 150000002632 lipids Chemical class 0.000 description 1
- 210000003141 lower extremity Anatomy 0.000 description 1
- 210000002540 macrophage Anatomy 0.000 description 1
- WPBNNNQJVZRUHP-UHFFFAOYSA-L manganese(2+);methyl n-[[2-(methoxycarbonylcarbamothioylamino)phenyl]carbamothioyl]carbamate;n-[2-(sulfidocarbothioylamino)ethyl]carbamodithioate Chemical compound [Mn+2].[S-]C(=S)NCCNC([S-])=S.COC(=O)NC(=S)NC1=CC=CC=C1NC(=S)NC(=O)OC WPBNNNQJVZRUHP-UHFFFAOYSA-L 0.000 description 1
- 238000013178 mathematical model Methods 0.000 description 1
- 230000003340 mental effect Effects 0.000 description 1
- 108020004999 messenger RNA Proteins 0.000 description 1
- 208000030159 metabolic disease Diseases 0.000 description 1
- 230000009456 molecular mechanism Effects 0.000 description 1
- 229910052750 molybdenum Inorganic materials 0.000 description 1
- 239000011733 molybdenum Substances 0.000 description 1
- 238000012544 monitoring process Methods 0.000 description 1
- 210000001616 monocyte Anatomy 0.000 description 1
- 201000006417 multiple sclerosis Diseases 0.000 description 1
- 230000004719 natural immunity Effects 0.000 description 1
- 210000000822 natural killer cell Anatomy 0.000 description 1
- 208000015238 neurotic disease Diseases 0.000 description 1
- 239000003900 neurotrophic factor Substances 0.000 description 1
- 208000008338 non-alcoholic fatty liver disease Diseases 0.000 description 1
- 206010053219 non-alcoholic steatohepatitis Diseases 0.000 description 1
- 229960002748 norepinephrine Drugs 0.000 description 1
- SFLSHLFXELFNJZ-UHFFFAOYSA-N norepinephrine Natural products NCC(O)C1=CC=C(O)C(O)=C1 SFLSHLFXELFNJZ-UHFFFAOYSA-N 0.000 description 1
- 210000004940 nucleus Anatomy 0.000 description 1
- 230000000050 nutritive effect Effects 0.000 description 1
- 239000007800 oxidant agent Substances 0.000 description 1
- 230000001590 oxidative effect Effects 0.000 description 1
- 210000000496 pancreas Anatomy 0.000 description 1
- 230000008447 perception Effects 0.000 description 1
- 230000004481 post-translational protein modification Effects 0.000 description 1
- 229960002847 prasterone Drugs 0.000 description 1
- 239000002243 precursor Substances 0.000 description 1
- 238000004321 preservation Methods 0.000 description 1
- 238000011321 prophylaxis Methods 0.000 description 1
- 235000018102 proteins Nutrition 0.000 description 1
- 208000020016 psychiatric disease Diseases 0.000 description 1
- 230000010346 psychosocial stress Effects 0.000 description 1
- 102000005962 receptors Human genes 0.000 description 1
- 108020003175 receptors Proteins 0.000 description 1
- 230000009467 reduction Effects 0.000 description 1
- 230000002829 reductive effect Effects 0.000 description 1
- 230000001172 regenerating effect Effects 0.000 description 1
- 210000003289 regulatory T cell Anatomy 0.000 description 1
- 230000001850 reproductive effect Effects 0.000 description 1
- 230000003248 secreting effect Effects 0.000 description 1
- 210000002955 secretory cell Anatomy 0.000 description 1
- 239000011669 selenium Substances 0.000 description 1
- 229910052711 selenium Inorganic materials 0.000 description 1
- 238000012163 sequencing technique Methods 0.000 description 1
- 210000003765 sex chromosome Anatomy 0.000 description 1
- 230000037351 starvation Effects 0.000 description 1
- 231100000240 steatosis hepatitis Toxicity 0.000 description 1
- 239000013589 supplement Substances 0.000 description 1
- 230000001629 suppression Effects 0.000 description 1
- 230000002123 temporal effect Effects 0.000 description 1
- 238000002560 therapeutic procedure Methods 0.000 description 1
- 231100000027 toxicology Toxicity 0.000 description 1
- 229910021654 trace metal Inorganic materials 0.000 description 1
- 238000010361 transduction Methods 0.000 description 1
- 230000026683 transduction Effects 0.000 description 1
- 230000001052 transient effect Effects 0.000 description 1
- 230000017105 transposition Effects 0.000 description 1
- 229910052720 vanadium Inorganic materials 0.000 description 1
- LEONUFNNVUYDNQ-UHFFFAOYSA-N vanadium atom Chemical compound [V] LEONUFNNVUYDNQ-UHFFFAOYSA-N 0.000 description 1
- 230000029663 wound healing Effects 0.000 description 1
- 239000011701 zinc Substances 0.000 description 1
- 229910052725 zinc Inorganic materials 0.000 description 1
Images


Classifications
-
- G—PHYSICS
- G16—INFORMATION AND COMMUNICATION TECHNOLOGY [ICT] SPECIALLY ADAPTED FOR SPECIFIC APPLICATION FIELDS
- G16H—HEALTHCARE INFORMATICS, i.e. INFORMATION AND COMMUNICATION TECHNOLOGY [ICT] SPECIALLY ADAPTED FOR THE HANDLING OR PROCESSING OF MEDICAL OR HEALTHCARE DATA
- G16H50/00—ICT specially adapted for medical diagnosis, medical simulation or medical data mining; ICT specially adapted for detecting, monitoring or modelling epidemics or pandemics
- G16H50/30—ICT specially adapted for medical diagnosis, medical simulation or medical data mining; ICT specially adapted for detecting, monitoring or modelling epidemics or pandemics for calculating health indices; for individual health risk assessment
-
- G—PHYSICS
- G16—INFORMATION AND COMMUNICATION TECHNOLOGY [ICT] SPECIALLY ADAPTED FOR SPECIFIC APPLICATION FIELDS
- G16B—BIOINFORMATICS, i.e. INFORMATION AND COMMUNICATION TECHNOLOGY [ICT] SPECIALLY ADAPTED FOR GENETIC OR PROTEIN-RELATED DATA PROCESSING IN COMPUTATIONAL MOLECULAR BIOLOGY
- G16B99/00—Subject matter not provided for in other groups of this subclass
-
- A—HUMAN NECESSITIES
- A61—MEDICAL OR VETERINARY SCIENCE; HYGIENE
- A61B—DIAGNOSIS; SURGERY; IDENTIFICATION
- A61B5/00—Measuring for diagnostic purposes; Identification of persons
- A61B5/145—Measuring characteristics of blood in vivo, e.g. gas concentration, pH value; Measuring characteristics of body fluids or tissues, e.g. interstitial fluid, cerebral tissue
- A61B5/14546—Measuring characteristics of blood in vivo, e.g. gas concentration, pH value; Measuring characteristics of body fluids or tissues, e.g. interstitial fluid, cerebral tissue for measuring analytes not otherwise provided for, e.g. ions, cytochromes
-
- A—HUMAN NECESSITIES
- A61—MEDICAL OR VETERINARY SCIENCE; HYGIENE
- A61B—DIAGNOSIS; SURGERY; IDENTIFICATION
- A61B5/00—Measuring for diagnostic purposes; Identification of persons
- A61B5/72—Signal processing specially adapted for physiological signals or for diagnostic purposes
- A61B5/7271—Specific aspects of physiological measurement analysis
- A61B5/7275—Determining trends in physiological measurement data; Predicting development of a medical condition based on physiological measurements, e.g. determining a risk factor
-
- C—CHEMISTRY; METALLURGY
- C12—BIOCHEMISTRY; BEER; SPIRITS; WINE; VINEGAR; MICROBIOLOGY; ENZYMOLOGY; MUTATION OR GENETIC ENGINEERING
- C12M—APPARATUS FOR ENZYMOLOGY OR MICROBIOLOGY; APPARATUS FOR CULTURING MICROORGANISMS FOR PRODUCING BIOMASS, FOR GROWING CELLS OR FOR OBTAINING FERMENTATION OR METABOLIC PRODUCTS, i.e. BIOREACTORS OR FERMENTERS
- C12M1/00—Apparatus for enzymology or microbiology
-
- C—CHEMISTRY; METALLURGY
- C12—BIOCHEMISTRY; BEER; SPIRITS; WINE; VINEGAR; MICROBIOLOGY; ENZYMOLOGY; MUTATION OR GENETIC ENGINEERING
- C12N—MICROORGANISMS OR ENZYMES; COMPOSITIONS THEREOF; PROPAGATING, PRESERVING, OR MAINTAINING MICROORGANISMS; MUTATION OR GENETIC ENGINEERING; CULTURE MEDIA
- C12N15/00—Mutation or genetic engineering; DNA or RNA concerning genetic engineering, vectors, e.g. plasmids, or their isolation, preparation or purification; Use of hosts therefor
- C12N15/09—Recombinant DNA-technology
-
- G—PHYSICS
- G16—INFORMATION AND COMMUNICATION TECHNOLOGY [ICT] SPECIALLY ADAPTED FOR SPECIFIC APPLICATION FIELDS
- G16B—BIOINFORMATICS, i.e. INFORMATION AND COMMUNICATION TECHNOLOGY [ICT] SPECIALLY ADAPTED FOR GENETIC OR PROTEIN-RELATED DATA PROCESSING IN COMPUTATIONAL MOLECULAR BIOLOGY
- G16B20/00—ICT specially adapted for functional genomics or proteomics, e.g. genotype-phenotype associations
- G16B20/20—Allele or variant detection, e.g. single nucleotide polymorphism [SNP] detection
-
- G—PHYSICS
- G16—INFORMATION AND COMMUNICATION TECHNOLOGY [ICT] SPECIALLY ADAPTED FOR SPECIFIC APPLICATION FIELDS
- G16B—BIOINFORMATICS, i.e. INFORMATION AND COMMUNICATION TECHNOLOGY [ICT] SPECIALLY ADAPTED FOR GENETIC OR PROTEIN-RELATED DATA PROCESSING IN COMPUTATIONAL MOLECULAR BIOLOGY
- G16B40/00—ICT specially adapted for biostatistics; ICT specially adapted for bioinformatics-related machine learning or data mining, e.g. knowledge discovery or pattern finding
- G16B40/30—Unsupervised data analysis
-
- G—PHYSICS
- G16—INFORMATION AND COMMUNICATION TECHNOLOGY [ICT] SPECIALLY ADAPTED FOR SPECIFIC APPLICATION FIELDS
- G16B—BIOINFORMATICS, i.e. INFORMATION AND COMMUNICATION TECHNOLOGY [ICT] SPECIALLY ADAPTED FOR GENETIC OR PROTEIN-RELATED DATA PROCESSING IN COMPUTATIONAL MOLECULAR BIOLOGY
- G16B5/00—ICT specially adapted for modelling or simulations in systems biology, e.g. gene-regulatory networks, protein interaction networks or metabolic networks
- G16B5/20—Probabilistic models
-
- G—PHYSICS
- G16—INFORMATION AND COMMUNICATION TECHNOLOGY [ICT] SPECIALLY ADAPTED FOR SPECIFIC APPLICATION FIELDS
- G16B—BIOINFORMATICS, i.e. INFORMATION AND COMMUNICATION TECHNOLOGY [ICT] SPECIALLY ADAPTED FOR GENETIC OR PROTEIN-RELATED DATA PROCESSING IN COMPUTATIONAL MOLECULAR BIOLOGY
- G16B5/00—ICT specially adapted for modelling or simulations in systems biology, e.g. gene-regulatory networks, protein interaction networks or metabolic networks
- G16B5/30—Dynamic-time models
-
- A—HUMAN NECESSITIES
- A61—MEDICAL OR VETERINARY SCIENCE; HYGIENE
- A61B—DIAGNOSIS; SURGERY; IDENTIFICATION
- A61B5/00—Measuring for diagnostic purposes; Identification of persons
- A61B5/48—Other medical applications
-
- G—PHYSICS
- G16—INFORMATION AND COMMUNICATION TECHNOLOGY [ICT] SPECIALLY ADAPTED FOR SPECIFIC APPLICATION FIELDS
- G16B—BIOINFORMATICS, i.e. INFORMATION AND COMMUNICATION TECHNOLOGY [ICT] SPECIALLY ADAPTED FOR GENETIC OR PROTEIN-RELATED DATA PROCESSING IN COMPUTATIONAL MOLECULAR BIOLOGY
- G16B25/00—ICT specially adapted for hybridisation; ICT specially adapted for gene or protein expression
- G16B25/10—Gene or protein expression profiling; Expression-ratio estimation or normalisation
Definitions
- the present technology relates to a biological information processing method and a device, a recording medium and a program, and particularly to a biological information processing method and a device, a recording medium and a program that predict and control future changes in the state of a human organism.
- Non-Patent Document 1 A decrease in productivity of development in a new treatment scheme, diagnostic scheme, and prevention scheme has been a significant issue in resolving a social problem associated with health.
- the decrease in productivity is caused since enormous perception obtained in basic biology fails to be effectively used to resolve an issue in clinical practice (Non-Patent Document 1).
- Non-Patent Document 1 According to recent international research, the current world population having diabetes has increased to 285 million. The population having diabetes is expected to exceed 435 million, which is larger than the population of North America, by the year 2030. This indicates that prevalence of diabetes of adults in the world is close to 7%.
- a human includes 60 trillion cells, has complexity of storing DNA (Deoxyribonucleic acid) information including 6 billion base pairs in each cell, and is a dynamic system that performs cell divisions 10 16 times in the human's life. In addition to millions of base substitutions, diversity in a DNA structure such as loss, duplication, and inversion of a DNA sequence is observed between two individuals.
- DNA Deoxyribonucleic acid
- a human body is based on a "cell" including molecules such as DNA or protein, and is characterized by a subsystem, a tissue, and an organ including various cells.
- the hierarchy diversifies a time scale of a responsive reaction with respect to a stimulus from an environment. An information propagation within a cell proceeds in a unit of millisecond or second, an information propagation between cells proceeds in a scale of a minute or an hour, and a process of a cell growth or differentiation proceeds in a unit of date and hour.
- the diversity of the time scale causes a time delay in an organism.
- an experimental rule such as a relational expression and a rule between an intervention such as dosing and a clinical outcome is inferred from a biological index in a specified time.
- a significant objective in modern medicine is to provide appropriate health management or treatment to each individual.
- a treatment scheme or medication of which safety and efficacy have been statistically verified is marketed and used by a large-scale group, a side effect or no efficacy is observed in a portion of patients.
- One of the causes thereof is genetic diversity of a patient receiving treatment.
- GWAS Gene wide association study
- Non Patent Document 1 Nature 453; 840-9, 2008
- Non Patent Document 2 J. Hum. Genet . Doi: 10.1038/jhg.2010.19
- a current treatment strategy is forced to construct a disease by abstracting diversification acquired over time, and thus every treatment strategy is a symptomatic therapy.
- every treatment strategy is a symptomatic therapy.
- an original health state may not be recovered from a disease by alleviating a symptom.
- the present technology has been contrived in view of the above circumstances, and may predict and control a future change in a human biological state.
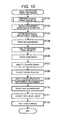
- An aspect of the technology is a biological information processing method including the steps of: measuring an expression level of molecules in an organism over a specific time interval; dividing measured time-series data into a periodic component, an environmental stimulus response component and a baseline component; identifying constant regions of the time-series data from variations in the baseline component or from the amplitude or periodic variations of the periodic component, and identifying causal relation between the identified constant regions; and inferring changes in the state of the organism from the identified causal relation between the constant regions.
- the identifying step may further identify the relation between changes in the state of the organism and the external environment, and the inferring step may further infer disease onset in the organism from the identified relation between changes in the state of the organism and the external environment.
- the measuring step may measure the molecules representing a general state, a local state, and a chromosome state.
- the molecules may be blood molecules of the organism.
- the molecules may be molecules associated with metabolic syndrome.
- the molecules may be molecules in a culture medium.
- an expression level of molecules in an organism is measured over a specific time interval, measured time-series data is divided into a periodic component, an environmental stimulus response component and a baseline component, constant regions of the time-series data are identified from variations in the baseline component or from the amplitude or periodic variations of the periodic component, and causal relation between the identified constant regions is identified. Changes in the state of the organism are inferred from the identified causal relation between the constant regions.
- a biological information processing device, a recording medium, and a program of the aspect of the technology are a biological information processing device, a recording medium, and a program corresponding to the biological information processing method of the aspect of the technology described above.
- Another aspect of the technology is a biological information processing method including the steps of: acquiring cell memory information of a biological molecule of an organism of a subject; acquiring environmental information associated with an environmental condition of the organism of the subject; acquiring gene information associated with a gene sequence included in the organism of the subject; and searching for similar information of an organism of a person other than the subject associated with the acquired cell memory information, environmental information, and gene information.
- the gene information may be a single nucleotide polymorphism and a structural polymorphism.
- the searching may be performed based on similarity in a correlation among the cell memory information, the environmental information, and the gene information.
- the step of acquiring cell memory information includes the steps of: measuring an expression level of molecules in an organism of the subject over a specific time interval; dividing measured time-series data into a periodic component, an environmental stimulus response component and a baseline component; and identifying constant regions of the time-series data from variations in the baseline component or from the amplitude or periodic variations of the periodic component, and identifying causal relation between the identified constant regions.
- cell memory information of a biological molecule of an organism of a subject is acquired, environmental information associated with an environmental condition of an organism of the subject is acquired, gene information associated with a gene sequence included in an organism of the subject is acquired, and similar information of an organism of a person other than the subject associated with the acquired cell memory information, environmental information, and gene information is searched for.
- a biological information processing device, a recording medium, and a program of the other aspect of the technology are a biological information processing device, a recording medium, and a program corresponding to the biological information processing method of the other aspect of the technology described above.
- the developers of the technology have constructed the "cell memory model undergoing a time evolution" which indicates that genetic modification and epigenetic modification change a cellular state by altering an expression level of a target gene product controlled by a bistable switch. Further, according to the "cell memory model undergoing a time evolution," the developers of the technology have constructed a concept referred to as a "chromosome state" including a transcription factor that functions in a chromosome, genetic modification, and epigenetic modification.
- the developers of the technology have linked the generate state, the local state, and the "chromosome state" which are three different levels constituting a human organism system to one another.
- the developers of the technology have constructed a macro model, a meso model, and a micro model corresponding to each level of the general state, the local state, and the "chromosome state.”
- the developers of the technology propose a method of linking and formulating the macro model, the meso model, and the micro model in units of cells.
- the developers of the technology have examined development of a method of integrating the "organism level link model” into a time-series model, and found a new integration method using a "biological state space model.” Then, the developers of the technology propose a method of extracting the "chromosome state” by dividing time-series data of a molecular marker that reflects the general state using the "biological state space model” into a periodic component, an environmental stimulus response component, and a baseline component.
- the developers of the technology have closely examined development of a control model using data of the time evolutional change of a human organism that can be represented by the technology for the first time. Then, the developers of the technology find a concept of a "constructed change” indicating that an initial input from an external environment changes responsiveness to a subsequent input from the external environment, and propose a "dynamic construction model" in which the "cell memory undergoing a time evolution" is controlled by the "constructed change.”
- the developers of the technology have conducted a close examination to apply the "dynamic construction model” to an issue in clinical practice, and proposed a method of an "organism local constant region model” for identifying a constant region of time-series data associated with an expression level of a molecule produced in an organism using the "biological state space model.” Furthermore, the developers of the technology propose a method of analyzing a causal structure and a biological state tracking using, as a node, an organism local constant region found during a time series variation of an expression level of a molecule produced in an organism.
- a time evolution of a human organism indicates a process in which a state or a function of a human organism irreversibly changes over time.
- a human dies after undergoing irreversible changes such as generation, birth, growth, and aging from a moment of fertilization.
- An onset of a disease progresses to a previous step of the onset receiving a potential change, the onset, a particular disordered physiological function, a loss of a particular physiological function, a physical disability, and a death. This indicates that an instant in a human organism and the time of another instant are not homogeneous.
- the "cell memory undergoing a time evolution" indicates that a cell memory constructed by a transcription factor is changed by genetic modification and epigenetic modification introduced as an environmental input to a cell or a result from an accident.
- a cell memory has conventionally been defined as a phenomenon in which a change in state of a cell acquired by a stimulus from an external environment is maintained even after the stimulus from the external environment disappears ( Cell 140: 13-18, 2010 ).
- a cellular state is represented by a type, an amount, and a modification property of a molecule expressed in a cell, and a maintenance and a change of the cellular state is controlled by a transcription factor.
- a conventional cell memory provides a concept that a state of a cell provides a particular equilibrium by a characteristic of a bistable switch included in a transcription factor.
- a state of a cell provides a particular equilibrium by a characteristic of a bistable switch included in a transcription factor.
- only the uniform time of ON and OFF of a switch may be provided.
- genetic modification and epigenetic modification introduced over time change a cellular state provided by a transcription factor over time, thereby further diversifying a state of a cell when compared to the cellular state assumed only by a transcription factor.
- a diversity of a cellular state may be formulated by a history that may be inherited such as genetic modification and epigenetic modification, and the "cell memory undergoing a time evolution" is essentially different from a conventional cell memory in that the non-uniform time may be managed.
- a transcription factor forms a molecular base of a conventional cell memory.
- a circuit of a transcription factor is nonlinear and indicates a bistable characteristic, a state of a molecule is in equilibrium of ON or OFF, and the memory is inherited even after a cell division.
- An affinity formed between a transcription factor and a binding site of a promoter, and cooperativeness or multimerization among a plurality of transcription factors provide a characteristic of a nonlinearity to a transcription factor.
- the nonlinearity resists a transient disturbance and causes an expression level to be inherited by providing a threshold-like characteristic to a response of a transcription factor.
- a transcription factor acquiring a sufficiently great Hill coefficient by a positive feedback or a positive or negative dual feedback acquires a characteristic of a bistable switch, and a change in state is locked even after an original input disappears. That is, a type, an amount, and a post-translational modification of a transcription factor expressed in a cell forms a skeleton of a conventional cell memory.
- Genetic modification such as a single nucleotide polymorphism observed in a human genome, a defect, a duplication, and a change in the number of copies of a portion of a DNA sequence
- epigenetic modification such as DNA methylation, histone modification, and a protein denaturation manage a molecular base of the "cell memory undergoing a time evolution" ( Nature Review Genetics 7: 85-97, 2006 , Cell 128: 655-658, 2007 ).
- Each of genetic modification and epigenetic modification directly or indirectly changes a parameter associated with a characteristic of nonlinearity or a bistable switch of a transcription factor, thereby modifying a function of a conventional cell memory.
- a relation between a single nucleotide polymorphism and a disease onset rate is analyzed by a genome-wide linkage analysis scheme. Using the analysis scheme, nineteen genes have been identified as a related gene of type 2 diabetes. However, only 1% of the total is diabetic patients having a mutant ( Nature 462: 307-314, 2009 ). Similarly, a BRCA 1/2 gene mutation is observed in only 3% of the entire breast cancer patients. In an experiment comparing a lifespan of identical twins to a lifespan of non-identical twins, an epidemiologic investigation indicates that a percentage of contribution to a lifespan by a gene sequence is about 15% to 25% ( Hum. Genet 97: 319-323, 1996 ).
- Epigenetic modification is defined as an alteration of a gene function that may be inherited without entailing a change in a DNA sequence.
- DNA methylation and chemical modification of a chromatin protein are a molecular substance of epigenetics.
- an alteration of a cell function due to denaturation of protein such as prion protein and amyloid protein is classified as epigenetics in a broad sense.
- a concept of epigenetics was proposed by Waddington to describe a mechanism in which genetic information is changed to a phenotype in a process of generation.
- epigenetics affects establishment and maintenance of a tissue or a cell-specific genetic expression.
- a stimulus due to nutritive conditions, a social stress, and chemical substances introduces epigenetic modification. It has been reported by an epidemiological research of humans that a stimulus from an environment received during the stage of an unborn baby or a newborn baby affects an onset rate of a chronic disease in adulthood through epigenetics ( Stem Cell Res. 4; 157-164, 2010 ).
- the above-described epigenetic modification is referred to as environmental epigenetics to be distinguished from development-type epigenetics associated with cell differentiation.
- the developers of the technology have found that a function of environmental epigenetics is regarded as a "function of updating DNA information based on a change in external environment information.”
- a scale of the time to be inherited is different between genetic modification and epigenetic modification affecting alteration of a function of a transcription factor.
- Genetic modification is a primary cause of a cell memory inherited from parents to a child.
- epigenetic modification performs a primary function as a cell memory acquired in a generation.
- transgenerational ⁇ epigenetics indicates that environmental epigenetics introduced in a germ line resists an initialization of generation, and is inherited from parents to a child ( Stem Cell Res.4; 157-164, 2010 ).
- new genetic modification such as a DNA mutation or transposition introduced in a somatic cell is regarded as a primary cause of carcinogenesis.
- a "model of a cell memory undergoing a time evolution” is a new concept introduced to formulate the "cell memory undergoing a time evolution” that changes over time due to genetic modification and epigenetic modification.
- An expression signature of a transcription factor, genetic modification, and epigenetic modification that change over time are integrated into a "chromosome state.”
- a chromosome state of the technology an inhibitory effect and an induction with respect to a target gene product by a transcription factor discretely change.
- a cellular state is formulated as a connection of two time series variations of the chromosome state and an external environmental state of a cell.
- the "cell memory undergoing a time evolution" is formulated as a function of a time series variation of the "chromosome state.”
- An "organism level link model” is a new model proposed for a connection of the "chromosome state” and an "individual state” requested to use the "cell memory undergoing a time evolution" for a prediction of a health or a disease of an individual level.
- a human individual is a continuum hierarchically put in order.
- a cell is formed from molecules, and a further complex entity such as a tissue and an organ is constructed on cells.
- a state of a human body may be classified into a general state, a local state, and a chromosome state based on the above-described hierarchical structure, and a model of three different scales of macro, meso, and micro may be constructed in response to each state.
- a macro model is a model regarding an entire body as a state.
- the state may be defined by an expression signature of a molecule diffusing in the entire body.
- Representative examples of the molecule diffusing in the entire body include a hormone of an endocrine system or an immune system, a growth factor, and a cytokine.
- adrenaline and noradrenaline affecting a control of an autonomic nervous system defines a state of an entire body.
- a meso model is a model that discovers a state of a homogeneous local space within an organism. Each organ or tissue forms a homogeneous state as a unity. In general, a symptom of an inflammation and the like specifically occurs in a local site. This includes multiple cells forming an inflamed site. On the other hand, a rejuvenescence of a tissue is controlled by propagation and differentiation of a few tissue stem cells. As such, the meso model includes the different number or type of cells such as one cell, an inflamed tissue, a tissue, and an organ.
- the local state is defined by systematic molecules in addition to an autocrine and paracrine molecular group expressed within a local environment.
- a micro model is a model that discovers a state of a chromosome included in each cell.
- a reason why the micro model is not in a cellular state is that a cellular state only represents an overt cell memory driven by a transcription factor, and a potential change including genetic modification or epigenetic modification is abstracted.
- a chromosome state is defined by genetic modification, an epigenetic modification characteristic, and an expression signature of a transcription factor.
- Epigenetic modification and an expression signature of a transcription factor in a state of a chromosome are controlled by a local environment and a systematic environment of a cell having the chromosome.
- a cell that produces systematic molecules is also controlled by a local state of a cell and a chromosome state in addition to a general state, and a cell that produces an autocrine and paracrine factor which is a molecule of a local environment is controlled by the general state, the local environment of the cell, and the chromosome state. That is, it is clear from an analysis that it is formulated that the "chromosome state," the local state, and the general state concurrently determine a change of one another, are concurrently directed, and concurrently undergo a time evolution.
- the formulation is referred to as an "organism level link model.”
- a human receives stimuli from various different environments depending on a social environment, a behavioral characteristic of the human, and the like.
- a stimulus from external environments is recognized by various systems of a somatic cell, and is translated into an internal environment change of a human body. Therefore, due to individual differences of a somatic cell system receiving a stimulus, a stimulus from the same environment may not necessarily induce the same change of an internal environment. This indicates that a quantitative measurement of an environmental factor alone may fail to accurately predict a change in state of a human body.
- a stimulus from an environment may be classified, according to a characteristic, into a physical stress (temperature, oxygen, ultraviolet ray, and the like), a chemical stress (endocrine disruptor, carcinogen, and the like), a psychosocial stress, an exercise stress, a nourishment stress (excessive eating and starvation), an infection stress, a wound stress, and the like.
- a stimulus from an environment is detected by a reception system, and then is translated into a change of a general state, a local state, and a "chromosome state" with different time delays.
- time needs to be regarded as a discrete distribution rather than as a continuous distribution.
- Instability of a time delay is controlled by a feedback system within an organism. Accordingly, when a change in state may be discovered in a time unit in which a change from a feedback system to a new feedback system may be discovered, a problem of a time delay may be abstracted.
- a “biological state space model” is a new model proposed to apply the "organism level link model” to a time-series model.
- Various models used for a time-series model may be generally managed in a unified manner by a state space model (Chapters 9, 11, and 12, Iwanami bookstore, Kitagawa Genshiro, Introduction to time series analysis).
- a large number of problems of a time series analysis are formulated as a problem of a state estimation of the state space model.
- the state space model includes two submodels of a system model (x) and an observation model (y), and two interpretations are possible.
- the observation model is regarded as a regression model that expresses a structure in which observed time-series data yn is observed
- a state xn of the system model (x) is a regression constant.
- the system model is a model that expresses a state of a temporal change in a regression coefficient.
- the state xn is regarded as a signal to be estimated
- the system model represents a model that indicates a generating mechanism of a signal
- the observation model represents a state in which the signal is converted and noise is added when the signal is actually observed.
- xn expresses a state of an actual human body
- yn is assumed to be a multivariate time-series vector associated with a measurable expression level of an extracellular factor group
- the state xn is regarded as a signal to be estimated.
- the "organism level link model” clarifies that the "chromosome state,” the local state, and the general state concurrently determine a change of one another, are concurrently directed, and substantially undergo a co-time evolution. This indicates that data of a time series variation of an extracellular factor that circulates in an entire body contains a change of the "chromosome state” and the local state. That is, components of the local state and the "chromosome state” are directly or indirectly reflected on yn which is multivariate time-series data including a systematic blood factor of a human body state xn. This formulation scheme is referred to as the "biological state space model.”
- Time-series data yn of an extracellular factor that circulates in an entire body may be decomposed into a periodic component using a seasonal adjustment model, an environmental stimulus response component using a multi-linear model, and a baseline component using a polynomial smoothing spline model, respectively.
- a cell memory is reflected on an amplitude and a frequency of a periodic component associated with an expression of a molecule produced in an organism, a maximum expression level of a stimulus response component, and a change of a long-term baseline. Accordingly, by combining the "organism level link model" with the "biological state space model,” it is possible to represent the "cell memory undergoing a time evolution" specifically and in chronological order.
- the "dynamic construction model” is a control theory with respect to a human organism undergoing a time evolution.
- One of functions of a time evolution of an organism is that an initial stimulus from an environment changes responsiveness to a subsequent stimulus of a similar type.
- a molecular entity of the responsiveness change is referred to as a "constructed change" in this specification.
- a human organism undergoing a time evolution may be controlled by this formulation.
- a representation "when stress that is not fatal to an organism is applied, responsiveness to a subsequent strong stress is improved” is generally referred to as a hormesis ( Toxicology and Applied Pharmacology 222: 122-128, 2007 ).
- a molecular mechanism of a hormesis is not clear.
- the "constructed change” including a hormesis clarifies that a dynamic cell memory subjected to genetic modification and epigenetic modification manages a molecular basis. In this way, it may be understood that an onset of a chronic disease is caused by a mismatch between the "cell memory undergoing a time evolution" of the technology and a subsequent stress.
- the "constructed change” is different from a conventional control model such as a dynamic equilibrium model and a dynamic nonequilibrium model assuming a fixed genetic algorithm based on a genetic determinism. That is, the "constructed change” assumes that a function of a gene changes due to an input from an environment or an accidental factor, and a genetically defined algorithm changes when a portion of the change is inherited to the future. Accordingly, a new control theory is needed for the "constructed change.”
- a time change of a phenotype is expressed by a product of a given genetic type (Gx) and an environmental factor (E(t)) that changes over time, which is as follows.
- P t Gx ⁇ E t
- a time change of a phenotype is expressed by a product of a chromosome state (C(t)) that changes over time and incorporates the "cell memory undergoing a time evolution" of the technology, and an environmental factor (E(t)) that changes over time, which is as follows.
- P t C t ⁇ E t
- An organism model represented by Equation (2) is referred to as the "dynamic construction model.”
- An "organism local constant model” is a new data processing scheme for controlling a health and a disease using the "dynamic construction model" of the technology.
- Time-series data associated with an expression level of a molecule produced in an organism is generally non-stationary. However, even non-stationary data may be assumed to be stationary data in respective short intervals by dividing a time interval into appropriate short intervals.
- Time-series model in which a time interval is divided into appropriate short intervals by a calculation independently from the above-described system function, and respective short intervals may be assumed to be stationary is generally referred to as a local constant model (Chapter 8, Iwanami bookstore, Kitagawa Genshiro, Introduction to time series analysis).
- time-series data of an expression level change of a molecule expressed in a cell within an organism or a cultured cell is first decomposed into a periodic component, an environmental stimulus response component, and a trend component of a baseline by using the "biological state space model,” and then a local constant region is identified.
- a cell memory influences a change of a baseline component, an amplitude and a frequency of a periodic component, and a maximum expression level and a minimum expression level of an environmental stimulus response component.
- three categories of a change of a baseline component, and an amplitude and a frequency of a periodic component may be identified independently from a strength of an input from an environment.
- a local constant region is identified by the three categories. In general, the local constant region is classified into three states of an original stationary state, a new stationary state, and a change from the original stationary state to the new stationary state.
- the "organism local constant model” of the technology is fundamentally different from a conventional local constant model in that a constant region is specified based on a characteristic of an organism rather than simply and mechanically decomposing a time series variation into constant regions.
- a "scheme of analyzing a causal structure and a biological state tracking using a local constant region as a node” is a scheme of predicting and controlling health maintenance and a disease onset by identifying an internal cause of inducing a change in state to a human organism undergoing a time evolution.
- a disease starts from an asymptomatic stage acquiring a potential change, and undergoes a non-stationary time evolution of acute symptoms, chronicity, a partially disordered physiological function, a partial loss of a physiological function, a physical disability, being bedridden, and a death. That is, a time evolution of a disease may be approximated to a continuous evolution of a time division regarded as a stationary state.
- a local constant state region of a disease indicating a systematically complex aspect first needs to be coded using a molecule produced from a cell as a proxy index.
- time-series data of a molecule expressed from a cell of an organ, a tissue, and a subsystem associated with a disease is divided from a viewpoint of a local constant region, and is associated with a phenotype of the disease.
- a causal structure model constructed by a biological knowledge as a prior probability data of a time series variation of an expression level of a molecule within an organism is analyzed from multiple individuals by Bayes' approach, and an optimum type of molecule effective for the association may be selected.
- a blood molecule among various molecules produced from a cell may relatively easily acquire time-series data using a blood sample, and is effective for application of the "dynamic construction model" of the technology.
- a glucose meter As a device for measuring a blood molecule, a glucose meter is regarded as a prototype device (Freestyle lite, Abbott Corporation). The glucose meter may measure an amount of blood glucose from a small amount of blood collected using a needle. This system may be applied to a measurement of a blood molecule other than glucose. On the other hand, recently, a scheme of percutaneously measuring a blood molecule is developed.
- a time division of a constant region extracted from a time series variation of an expression level of a blood molecule is not only effective for coding a state associated with various diseases, and tracing the change in state, but also may be used to analyze a causal relation which is a cause of a disease onset.
- An issue of a health management is identifying a change of a blood molecule which is a cause of moving to an asymptomatic initial disease stage from a health state, and using the change for preventing an onset of a disease.
- an issue of a disease management is identifying a change of a blood molecule which is a cause of inducing an initial disease to a complication, and using the change for preventing an onset of the complication.
- a causal relation between changes of an expression level of a molecular group within an organism is first modeled using biological knowledge. Then, it is used to construct a graph structure associated with a probability structure/causal structure between nodes identified by extracting a constant region from data of a time series variation of a molecule within an organism of a plurality of patients. Thereafter, it is upgraded to an optimal graph structure using time-series data of a change of expression of a biological molecule of a plurality of healthy individuals or patients.
- a change of a graph structure may be solved as a selection problem of a covariance in regression analysis.
- a constructed optimum graph structure may be used to predict and control a change of a biological state of the future intended for a health management or a disease management of each individual by continuing a serial measurement of a change of expression of a biological molecule.
- Fig. 1 is a block diagram illustrating a configuration of a biological information processing device 1 that predicts and controls a health state.
- the biological information processing device 1 includes a selector 11, a determining unit 12, a measurement unit 13, a creation unit 14, a dividing unit 15, an identification unit 16, and an inference and control unit 17.
- the selector 11 selects measurement molecules.
- the determining unit 12 determines a molecule measurement interval.
- the measurement unit 13 performs a measurement.
- the creation unit 14 creates a graph.
- the dividing unit 15 divides components.
- the identification unit 16 identifies a constant region and a causal relation, and identifies a causal relation of molecular markers and a relation with an external environment.
- the inference and control unit 17 infers and controls change in states.
- Fig. 2 is a flowchart illustrating a process of predicting and controlling a health state.
- a prediction and control process performed by the biological information processing device 1 of Fig. 1 will be described with reference to Fig. 2 .
- step S1 the selector 11 selects measurement molecules for prediction and control in relation to metabolic syndrome. That is, a type of blood molecule performing a measurement of an expression level is selected.
- the "dynamic construction model" of the technology may be applied to prediction and control of an onset of a series of diseases developing from metabolic syndrome to a circulatory system disease. Diabetes is positioned among the series of diseases developing from metabolic syndrome to a circulatory system disease ( Nature 444; 839-888, 2006 ).
- a metabolic disease causes obesity, visceral obesity, hyposecretion of adiponectin, insulin resistance, and the like from a problem of a lifestyle including poor eating habits and lack of exercise. Thereafter, a disease state proceeds to high blood pressure, postprandial hyperglycemia, and dyslipidemia. A state so far is referred to as metabolic syndrome.
- Metabolic syndrome induces an inflammation in visceral fat, activates a regenerating system of various organs, and increases oxidant stress. As a result, a fatty liver or nonalcoholic steatohepatitis is caused. Thereafter, pancreatic dysfunction and insulin hyposecretion occur, causing an onset of diabetes.
- Diabetes induces nephropathy, retinopathy, psychoneurosis, arteriosclerosis obliterans, cerebral vascular disturbance, and an ischemic cardiac disease, and proceeds to kidney dialysis, blindness, lower limb amputation, stroke, dementia, and cardiac insufficiency, resulting in death.
- an inflammation induced by metabolic syndrome causes cancer or a degenerative neurological disorder.
- a systematic blood factor below may be used as a molecular marker to use time-series data of an expression level ( Nature 444; 839-888, 2006 ).
- a molecular group associated with an interaction between a fat tissue and hypothalamic pituitary performs an important function for eating, glycometabolism, lipid preservation, and energy balance, and thus may be used to represent and analyze a state of poor eating and lack of exercise.
- a chronic social stress has an epigenetic influence on an interaction between a fat tissue and a hypothalamic-pituitary-adrenal system, and changes a production of glucocorticoid and aldosterone from an adrenal gland. As a result, a function of appetite or sleep is changed.
- step S2 the selector 11 selects measurement molecules for prediction and control in relation to an inflammatory disease.
- An immunity disorder including a connective tissue disease, colitis ulcerosa, and disseminated sclerosis represented by systemic lupus erythematosus (SLE) and rheumatism is also known to develop due to an infection history of the past, a characteristic of bacteria in intestines, and the like.
- SLE systemic lupus erythematosus
- cytokine include interleukin, interferon, chemokine, a growth factor, and a lymphotoxin factor.
- step S3 the determining unit 12 determines a molecule measurement interval.
- a time interval for measuring an expression level of a molecular marker be short.
- time-series data of a long interval such as day, week, and month may be used depending on a measurement environment. A lot of molecules undergo a change of an expression level on a circadian rhythm of a 24 hour interval.
- the acquired time-series data be analyzed using approximately 100 pieces of discrete data as a set regardless of a time interval at which the data is acquired. As such, to expect accuracy, a measurement is desired to be performed at least twice to three times a day, preferably 50 times to 100 times a day.
- step S4 the measurement unit 13 performs a measurement.
- an expression level of a blood molecule as a biological molecule is measured.
- a molecule representing a general state, a local state, and a chromosome state is measured. The measurement is performed at an interval determined in step S3.
- a needle may be used as a device for measuring a molecular marker in the blood.
- a small amount of blood may be collected using the needle.
- a scheme of percutaneously measuring a blood molecule may be used.
- a type or amount of molecule may be implemented by fluorescently-labeling a selective antibody with respect to a molecule to be measured.
- step S5 the creation unit 14 creates a time-series variation graph. Specifically, a graph based on Equation (5) to Equation (11) below is created.
- the dividing unit 15 divides components. That is, three components are extracted from time-series data using a biological state space model. The three components may be set to, for example, a periodic component, an environmental stimulus response component, and a baseline component.
- time-series measurement data of a molecular marker Information used for prediction and control needs to be selected from time-series measurement data of a molecular marker.
- multivariate time-series data including a plurality of blood molecules is desired to be managed in a unified manner as a "state space model.”
- the "state space model” includes two submodels of a system model and an observation model. In general, the two submodels are expressed using a conditional probability as follows.
- y n denotes an observed time series of a multivariable
- x n denotes a k-dimensional vector that may not be directly measured
- q and r denote a conditional distribution of x n given by x n-1 and of y n given by x n , respectively.
- x n expresses a state of an actual human body
- y n indicates an expression level of a blood molecule that may be measured.
- a prediction of a state of a disease is an evaluation of P(x n
- Time-series data y(t) of respective measurable blood molecules such as a molecular group that may be used to represent a process from metabolic syndrome to diabetes, and a circulatory system disease, a molecular group associated with an immune system disease, a molecular group of an endocrine system, and the like is expressed by the following Equation. That is, it is expressible using a model including three different components.
- An environmental stimulus response component x(t) may be formulated as a multilinear model as follows.
- F(t) indicates a conversion function of an output with respect to an environmental stimulus
- v x (t) indicates a change of an environmental stimulus.
- an optimum value is selected by applying a Yule-Walker scheme, a least square scheme, or PARCO scheme to an autoregression model.
- a baseline component b(t) may be defined as below as a regression model of degree m by a polynomial smoothing spline model.
- the baseline component b(t) may be expressed as follows.
- b t H ⁇ t , t - 1 ⁇ b ⁇ t - 1 + V ⁇ t , t - 1 H(t, t-1) is an m ⁇ m matrix, and V(t, t-1) is a matrix associated with m-dimensional noise.
- An optimum function for smoothing a baseline is selected using this model.
- a main component factor of the periodic component s(t) is a circadian rhythm of a 24 hour interval.
- time-series data of a blood molecule may be divided into a periodic component, an environmental stimulus response component, and a baseline component.
- step S7 the identification unit 16 identifies a constant region. That is, a constant region is identified using the "organism local constant model.”
- a local constant region may be discovered by analyzing time-series data using a model of a periodic component, an environmental stimulus response component, and a baseline component.
- dynamic construction model it is useful to emphasize a change of a stationary state caused by the "cell memory undergoing a time evolution," and an acquisition of a new stationary state.
- a cell memory influences a change of a baseline component, an amplitude and a frequency of a periodic component, and a maximum expression level and a minimum expression level of an environmental stimulus response component.
- a change of a baseline component, and changes of an amplitude and a frequency of a periodic component may be identified independently from a strength of an input from an environment. Paying attention to this point, the local constant region is identified from at least one of a change of a baseline component, a change of an amplitude of a periodic component, and a change of a frequency of a periodic component.
- a time series variation of a blood molecule group includes a pattern of a seasonal variation that repeatedly appears on a monthly basis or on a yearly basis in addition to a circadian rhythm of a 24 hour interval. When this is interpreted as a change of a baseline, there is a risk of leading to an erroneous prediction or control scheme.
- a seasonal component is extracted from a baseline component, and is divided as a periodic component in a long period of time.
- step S8 the identification unit 16 identifies a causal relation. That is, a causal relation between stationary states of respective molecules is created.
- the dynamic construction model may be used to identify a causal relation.
- a constant region of a molecular group in the blood associated with the "cell memory undergoing a time evolution" extracted by this scheme forms a direct or indirect causal relation according to chronological order.
- a causal structure is expressed by creating a graph structure associated with a probability structure/causal structure using the constant region as a node.
- Fig. 3 is a diagram illustrating a model associated with a causal relation using four constant regions y 1 through y 4 of five blood molecules A, B, C, D, and E as nodes.
- x 0 through x 4 denote states of an organism.
- the states x 0 and x 1 denote a health state
- the states x 2 and x 3 denote a symptom non-onset state
- the state x 4 denotes a symptom onset state.
- a number indicates a passage of time in a direction from a small value to a large value.
- the node Y 4 (A) and the node Y 4 (D) are causes, and markers that replace a state of a disease.
- the node Y 3 (A) and the node Y 3 (C) affect an induction of the node Y 4 (A), and the node Y 3 (E) affects an induction of the node Y 4 (D).
- the nodes Y 2 (C), Y 2 (A), and Y 2 (D) affect an induction of the nodes Y 3 (A), Y 3 (C), and Y 3 (E), respectively.
- the nodes Y 1 (A), Y 1 (B), and Y 1 (D) affect an induction of the nodes Y 2 (A), Y 2 (C), and Y 2 (D), respectively.
- An inference of the graph structure associated with a causal structure between constant regions of this biological molecule may be formulated as below.
- a value of a stationary state of a biological molecule Molecule 1 is regarded as a random variable. That is, under a circumstance, an amount of Molecule 1 is regarded as an instance of a random variable X1.
- Observation data processed by the organism local constant model of the embodiment may be regarded as data measuring an instance of a random variable of p types of blood molecules under a circumstance. Since a stationary state is observed in various time periods and circumstances, the observation data processed by the local constant model may be expressed as a data matrix. That is, observation data including n different stationary states is a pxn matrix size.
- An object of the analysis is to infer a dependency relation in matrix data.
- Bayesian network may apply a scheme used for a data analysis of a DNA chip ( 333-356, Second issue, Volume 54, Statistical Mathematics, Yoshinori Tamada, Kiyochika Imoto, and Satoru Miyano ). Specifically, it is implemented by matching an expression level of a stationary state of the embodiment to an expression level of mRNA of a DNA chip. An existing physiology model may be used as a previous knowledge to infer a stationary state graph structure of the embodiment.
- a graph structure is first constructed in an individual level.
- An existing physiology model may not sufficiently match diversity or diversification of an individual, and thus an error may occur in a graph structure inference.
- To optimize a graph structure a plurality of individual graph structures are compared to one another, and classified into a small group having a similar structure, and a graph structure is selected again. In this way, an optimum graph structure is constructed.
- a route of a cause and effect leading to a common symptom of a plurality of patients may be different among individuals.
- an optimum graph structure is determined for each group having the same causal structure rather than causing the optimum graph structure to converge into one.
- step S9 the identification unit 16 identifies a causal relation of molecular markers and a relation with an external environment. That is, a causal relation between respective molecules and a relation with an environment are created.
- a measurement value of a time series variation of a lifestyle may be used as an external environment.
- a "constructed change" may be represented and applied to a control by analyzing a mechanism in which stimulus of different intensities received in different periods influences responsiveness of a blood molecule.
- a negative stress level may be measured by a DRM (Daily Reconstructive Method) (one day constitution method). This divides a day into an average of about 24 degrees for each event, and expresses respective positive and negative values in numerical values of 0 through 6 in a step-by-step manner.
- the environmental stimulus may be used for a control of a change of an expression level of an intended blood molecule, that is, a change in state of an organism.
- step S10 the inference and control unit 17 infers and controls changes in state. That is, a future change in state of an organism of a human is inferred, and an intervention scheme including a prevention scheme is proposed.
- An inference of a change in state classifies a group by a mutual similarity of a causal structure between constant regions acquired in step S8.
- a future change of a disease preliminary group classified in the same group may be inferred by a causal structure acquired from a patient undergoing a progression of a disease.
- a causal structure in which a disease is recovered to a health state without an onset of a disease from a potential change prior to an onset of a disease may be used for a control scheme of preventing an onset of a disease.
- the causal relation of molecular markers that is, an internal environment
- a relation with an external environment identified in step S9 may be used for a control.
- Fig. 4 is a block diagram illustrating a configuration of a biological information processing device 51 that predicts and controls a cellular state of a cultured cell.
- the biological information processing device 51 includes a selector 61, a measurement unit 62, a determining unit 63, a dividing unit 64, an identification unit 65, and an inference and control unit 66.
- the selector 61 selects measurement molecules.
- the measurement unit 62 performs a measurement.
- the determining unit 63 determines a measurement interval.
- the dividing unit 64 divides components.
- the identification unit 65 identifies a constant region, and identifies a causal structure between molecular markers and a causal structure of a molecular marker and an environmental condition.
- the inference and control unit 66 infers and controls a cellular state of a cultured cell.
- Fig. 5 is a flowchart illustrating a process of predicting and controlling a cellular state of a cultured cell.
- a prediction and control process performed by the biological information processing device 51 of Fig. 4 will be described with reference to Fig. 5 .
- step S31 the selector 61 selects measurement molecules.
- Changing a property involved in cultivation by a cultured cell is a major obstacle in a construction of an evaluation system using a cell or a development of a medicine using a cell as an active ingredient.
- a prediction and control of a change in state of a cultured cell it is possible to perform a formulation with a problem of a state inference of a mesoscale.
- a state of a mesoscale is expressed by a local extracellular environment formed by a component added in a culture medium and a molecule produced from a cultured cell.
- a time series variation of a molecular group produced from a cultured cell and a molecule in a culture medium is measured.
- a molecule produced from a cultured cell includes a molecular group expressed in a cell surface in addition to a secretory cell, but excludes an intracellular information transduction molecule or a transcription factor. As a component in a culture medium, it is useful to measure an amount of IGF-I or insulin. As a molecule produced from a cell, an integrin family molecule, a growth factor including FGF-2, EGF, and PDGF in addition to insulin and IGF-I are useful.
- step S32 the measurement unit 62 performs a measurement.
- a molecule produced from a cultured cell and a molecule in a culture medium are measured by acquiring a smaller amount of sample when compared to the culture medium.
- fluorescent labeling is performed on the molecule, and then a quantitative estimation is performed by an image analysis of a cultured cell.
- a substitute measurement is performed by a genetic expression of a secretory protein or a membrane protein by using a reporter system within a cell.
- step S33 the determining unit 63 determines a measurement interval.
- the measurement interval be in a range of about ten minutes to an hour.
- continuous data is acquired.
- step S34 the dividing unit 64 divides components.
- step S35 the identification unit 65 identifies a constant region.
- multivariate time series including a molecule produced from a cultured cell and a molecule in a culture medium is treated in a unified manner as a state space model.
- the state space model includes two submodels of a system model and an observation model. In general, the two submodels are expressed using a conditional probability as follows.
- y n denotes an observed time series of a multivariable
- x n denotes a k-dimensional vector that may not be directly measured
- q and r denote a conditional distribution of x n given by x n-1 and of y n given by x n , respectively.
- x n expresses a state of an actual cultured cell
- y n indicates an expression level of a molecule produced from a cultured cell and a molecule in a culture medium that may be measured.
- a prediction of a state of a cultured cell may be formulated by an evaluation of p(x n
- Time-series data y n of a molecular group produced from a cultured cell may be decomposed into a periodic component using a seasonal adjustment model, an environmental stimulus response component using a multi-linear model, and a baseline component using a polynomial smoothing spline model, respectively, and be extracted.
- a cell memory of a cultured cell is reflected on an amplitude and a frequency of a periodic component, a maximum expression level of an environmental stimulus response component, and a change of a baseline.
- a local constant region associated with an amplitude and a frequency of a periodic component, and a change of a baseline are noted as the "cell memory undergoing a time evolution.”
- step S36 the identification unit 65 identifies a causal relation between molecular markers.
- step S37 the identification unit 65 identifies a causal structure of a molecular marker and an environmental condition.
- a change of an amplitude and a frequency of a periodic component, a change of a baseline, a time change of an artificial component added to a culture medium, and an environmental stimulus response component form direct or indirect causal relation according to a time series.
- a causal structure is expressed by creating a graph structure associated with a probability structure/causal structure using, as a node, a local constant state of a molecular group in various culture media and a molecular group produced from a cultured cell.
- the graph structure is created based on a conventional biological knowledge, and then upgraded to an optimum graph structure using time-series data.
- a change of a graph structure is solved as a selection problem of a covariance in regression analysis.
- a route of a cause and effect of a cultured cell leading to the same change in state may be different depending on origins.
- an optimum graph structure is determined for each group of a cultured cell having the same causal structure rather than causing the optimum graph structure to converge into one.
- a change in state characteristic of the "biological state space model” is used for a classification of this group.
- a causal structure for an intervention by a change of an environmental condition such as a culture medium component, a cell culture density, an oxygen partial pressure, and a temperature is separately created.
- step S38 the inference and control unit 66 infers and controls a cellular state of a cultured cell.
- An inference and control of a change in state of a cultured cell may be performed from a causal structure of the past in which a cell originated from the same tissue is cultured in a similar condition.
- a control in a direction of obtaining a state of a cell may be performed from a causal structure of a change in state of a cell and a change of an environmental condition such as a culture medium component, a cell culture density, an oxygen partial pressure, and a temperature.
- the cell has the following characteristic.
- Time-series measurement data y(t) is presumed as follows.
- An environmental stimulus response component x(t) is formulated as a multilinear model as follows.
- x t F t ⁇ t - 1 + v t
- F(t) indicates a conversion function of an output with respect to an environmental stimulus of a cell
- v(t) indicates an environmental stimulus.
- an optimum value is searched for using an autoregression model.
- a baseline component b(t) is defined as below as a regression model of degree 2, and is used.
- b t a t - 1 ⁇ b ⁇ t - 1 + a t - 2 ⁇ b ⁇ t - 2 + v B t
- a j denotes a regression coefficient
- v B (t) denotes a noise component.
- b(t) is expressed as follows.
- b t H ⁇ t , t - 1 ⁇ b ⁇ t - 1 + V ⁇ t , t - 1
- H(t, t-1) is a 2x2 matrix
- V(t, t-1) is two-dimensional noise.
- An optimized function is selected so that a baseline is smoothed.
- a periodic component s(t) is based on a circadian rhythm of a 24 hour interval.
- the periodic component approximately satisfies the following Equation.
- s t s ⁇ t - p
- G a time delay operator
- a periodic component of degree 1 may be formulated as a seasonal adjustment model as below by white noise v(t).
- the time-series data of y of A of Fig. 7 is decomposed into a periodic component s, an environmental stimulus response component x, and a baseline component b.
- i in A of Fig. 7 denotes an induction component.
- a decomposition is performed into three constant regions of Y 1 (A), Y 2 (A), and Y 3 (A).
- a cell includes an input from an environment between time k and time 1, and an environmental stimulus response component of Y 2 (A) is a direct input with respect to the input.
- a time change division Y 2 (A) of the molecule A is a cause of changing an expression state of a factor A from Y 1 (A) to Y 3 (A).
- this relation is expressed as a change from Y 2 (A) to Y 3 (A) by a graph structure using, as a node, a constant region associated with an expression level change of the molecule A.
- the embodiment may simultaneously manage commonality and heterogeneity between individuals, and thus is an effective tool for an individual medical care.
- the embodiment may control diversification resulting from a time evolution of a cell induced by a cell culture, and be applied to a standardization of a cell evaluation system or a cell therapy.
- a change of a stationary state may be classified into a change in a direction in which an insulin resistance is improved and a change in a direction in which an insulin resistance is degraded.
- An increase in an amount of insulin secretion and a strength of insulin responsiveness is a change in an improving direction, and the opposite is a change in a degrading direction.
- an amount of secretion of glucocorticoid or leptin may be first formulated as a change from a stationary state to another stationary state.
- an amount of production of leptin with respect to a predetermined caloric intake is low, a suppression of food intake is reduced, and an obesity trend is increased.
- an amount of glucocorticoid is high, an obesity trend and a circulatory system disease onset trend are increased through a plurality of active sites.
- a change of a stationary state in a direction in which an amount of secretion of glucocorticoid is decreased and an amount of secretion of leptin is increased is a change in a direction in which an insulin resistance and an onset trend of an associated disease are improved.
- the embodiment may use an insulin secretion, insulin responsiveness, a glucocorticoid secretion, and a leptin secretion to identify an unknown molecule within an organism involved in a change from a stationary state to another stationary state.
- an insulin secretion insulin responsiveness
- a glucocorticoid secretion a glucocorticoid secretion
- a leptin secretion a leptin secretion
- a biological molecule associated with changing an amount of DHEA-S secretion from a stationary state to another stationary state, and a lifestyle associated with a change of the biological molecule may be clarified, a new proposal of a scheme of inhibiting a decrease in DHEA-S may be performed.
- a most effective scheme for delaying aging and increasing a life expectancy is a restriction of calories.
- a restriction of calories is a restriction of calories performed while taking optimum nutrition rather than merely reducing a size of a meal.
- sufficient scientific evidence regarding optimum nutrition or an appropriate caloric restriction level is not present.
- the embodiment may be used to clarify an optimum nutrition intake level or caloric intake level at an individual level.
- a restriction of calories is imposed on a patient who is likely to get diabetic
- CPP c-reactive protein
- an adiponectin production and an active oxygen production corresponding to an index of a qualitative change of a fat cell.
- a state of a fat cell, an active oxygen stress state, and an inflammatory state change from a stationary state to another stationary state.
- the embodiment may also be used to identify a new biological molecule associated with a change from the stationary state to another stationary state.
- a newly discovered time-series record associated with a biological molecule marker and a meal may be used to individually optimize a nutritional intake and a caloric intake.
- Sensitivity to stress depends on a strength of a negative feedback of a neuron of glucocorticoid responsiveness projected from a hippocampus to an amygdaloid nucleus.
- a strength of a negative feedback of the neuron depends on epigenetic modification of a glucocorticoid receptor gene.
- the time series variation may be divided into a daily variation component and a stimulus dependent component.
- the daily variation component an average amount of secretion of glucocorticoid in the blood at a measurement date may be calculated.
- a relative strength of a negative feedback may be calculated by measuring a maximum amount of secretion and duration.
- BDNF Brain Derived Neurotrophic Factor
- BDNF precursor pro-BDNF
- t-PA tissue-type plasminogen activator
- a chronic overwork such as a nursing care of a partner and psychological stress increases a frequency of an infectious disease, reduces the ability of wound healing, and increases a frequency of high pressure or a liver illness.
- a biomarker associated with the chronic overwork and psychological stress includes inflammatory cytokine IL-6 (interleukin 6). It is known that IL-6 is associated with a circulatory system disease, an osteoporosis, type 2 diabetes, cancer, a gum disease, fragile habitus, organ failure, and the like that develop aging dependently. IL-6 is induced to develop through experience entailing depression, negative feelings, and stress.
- a human body is an open system, and a future of a body condition is not a mere repetition of the past.
- a cell memory of the technology may acquire a process in which an organism undergoes a time evolution according to a history only by a measurement of a biological molecule, and formulate the process. To apply this formulated time-based change to an individuated health care, appropriate options of a future lifestyle need to be provided based on diversity and diversification of an individual.
- DNA-sequence information of individuals inherited from parents is useful for inference of substance of diversity and diversification of the past before initiating a biological state measurement of individuals based on the technology.
- a current diversity of each individual is formed by hereditary diversification and a lifestyle of the past.
- by integrating three pieces of environmental information based on cell memory information, DNA polymorphism information, and a lifestyle of a biological molecule undergoing a time evolution of the technology it is possible to enhance accuracy of a future prediction of health.
- a relation between a genetic diversity and health or illness may be classified into four types of a chromosome anomaly, a monogenic disease, a multifactorial genetic disease, and an idiopathic disease ( Thompson & Thompson "Genetic Medicine, Seventh Edition” Medical Science International, 2009 ).
- a human somatic cell contains 23 pairs, 46 chromosomes, and 22 pairs among them are autosomal chromosomes excluding a difference between the sexes. A remaining pair is referred to as a sex chromosome.
- a female has two X chromosomes, and a male has an X chromosome and a Y chromosome.
- An onset frequency of a chromosomal abnormality is high, and about six new born babies per every 1,000 new born babies are affected.
- chromosomal abnormalities an abnormality corresponding to an increased number of chromosomes frequently occurs.
- trisomy 21 causes a disease called Down syndrome. About one of every 800 people is born with Down syndrome.
- a frequency at which a baby is born with Down syndrome exponentially increases with an age of a mother, and about 1% of babies are born with Down syndrome when the age is 45 or more.
- a main issue of Down syndrome is a mental retardation.
- a risk of leukemia increases, and a lot of patients with Down syndrome develop dementia of the Alzheimer type after the age of 40.
- 90% of causes of trisomy 21 are included in a process of a reduction division that forms an egg of a mother.
- a trisomy 21 abnormality occurs from a moment of the fertilization.
- a symptom occurs in various periods, and a "time delay" is included between a formation of a hereditary cause and an onset of illness.
- a monogenic disease is a disease that develops as a result of genomic mutation of a gene, and is referred to as a Mendelian disorder. So far, 3917 types of Mendelian disorders are being reported.
- a mode of inheritance includes a dominant mode and a recessive mode.
- a dominant mode is a mode of inheritance that develops only by inheriting a genetic mutation from one of a mother and a father.
- a partially recessive mode indicates a mode of inheritance that develops only when a genetic mutation is inherited from both parents. It is known that a monogenic disease is realized by 2% of a group at a time of life.
- a monogenic disease is a disease that mostly develops during childhood. However, about less than 10% of monogenic diseases experience symptoms after puberty. Further, 1% or less may experience symptoms later in life after the end of the reproductive years. Regardless of a period in life in which a symptom starts, a "time delay" is observed between an acquisition of variation and an onset of symptoms.
- a disease observed at birth such as a congenital anomaly, and a chronic disease that develops at a middle age such as cardiac infarction, cancer, diabetes, rheumatism, a mental disease, dementia, and the like are referred to as a multifactorial disorder.
- a frequency at which this type of disease appears at birth is about 50 people per every 1,000 people. However, since a lot of people are affected by a chronic disease, it is about 600 people per every 1,000 people when seen from a group.
- a plurality of genetic factors combines for an onset, in which a regular exposure or a chance exposure to a particular environmental factor is considered to be involved.
- a genetic influence of this multifactorial disorder is analyzed by a scheme referred to as a genome-wide association study (GWAS).
- GWAS genome-wide association study
- An idiopathic disease is positioned between a mendelian genetic variation and a multifactorial disorder. Parkinson's disease or Alzheimer's disease is included in an idiopathic disease in addition to a familial disease. Unlike a multifactorial disorder, an individual genome sequence analysis needs to be used to identify this sporadic variation.
- a time delay is included between an acquisition of variation and an onset.
- a "time delay" is included between a point in time when a hereditary factor and an environmental factor are included and a point in time when a disease develops. That is, a hereditary factor and an environmental factor create a potential change in an organism as a cell memory, which is actualized as a symptom when the hereditary factor and the environmental factor form a combination.
- a cell memory is acquired when a change of an environmental condition is added to genetic polymorphism, and thus quantitatively recording an environmental condition is effective for a future prediction of health.
- an exterior environment such as stress, a diet habit, an exercise habit, an infection history, and a cure history may be quantitatively measured.
- DRM scheme Kahneman D, Krueger AB, Schkade DA, Schwarz N, Stone AA. "A survey method for characterizing daily life experience: the day reconstruction method. " Science. 306: 1776-1780, 2004 ).
- This scheme divides an event of a day into 24 degrees, and records respective mental positive and negative values. In this way, it is possible to identify a stress coping circumstance at each moment. By continuing the recording, stress may be classified into a short term stress of about several hours to a day, a medium-term stress of about several days to a month, and a long term stress of over several months.
- a diet habit by recording content of meals divided into cooking ingredients, it is possible to record an amount of intake of calorie, a carbohydrate ratio, a protein ratio, a type and amount of fat, vitamin, phytochemical, trace metal (iron, zinc, copper, cobalt, iodine, selenium, manganese, molybdenum, chrome, boron, and vanadium), drinking (alcohol), and the like.
- An infection history or a cure/dosing history may be identified by electronic chart data of a private medical doctor.
- a Chinese medicine or a general medicine taken by an individual may be recorded by the individual.
- a genetic diversity of individuals may be classified using a single nucleotide polymorphism and a structural polymorphism of DNA which is a cause of a chromosome anomaly, a monogenic disease, a multifactorial genetic disease, and an idiopathic disease. It is possible to quantitatively record a time-based change of an environmental condition using a stress state, an intake ingredient taken by a meal, an amount of exercise, an infection history, a cure/dosing history.
- the three small groups are a small group divided based on a genetic diversity, a small group divided based on a change of an environmental condition, and a small group divided based on cell memory information of a biological molecule.
- the small group divided based on a genetic diversity is a group based on a genetic diversity of a single nucleotide polymorphism and a structural polymorphism of DNA which is a cause of a chromosome anomaly, a monogenic disease, a multifactorial genetic disease, and an idiopathic disease.
- the small group divided based on a change of an environmental condition is a group based on an environmental condition such as a stress state, a diet habit, an exercise habit, an infection history, a cure/dosing history.
- the small group divided based on cell memory information of a biological molecule is a group based on a change of a biological state represented by Fig. 3 produced from a process illustrated in the flowchart of Fig. 2 .
- the relation of a conditional probability of a group may be broadly classified into the following three relations.
- Applying the technology to an individuated health care is providing options of the future to maintain health based on data of a cell memory of the past of a subject of a health care indicated as a causal relation between constant regions of an expression level of a molecule of an organism.
- a scheme of identifying options of the future include referring to a record of a lifestyle of another person (that is, a person other than a subject) synthetically having a history similar to that of the subject such as a history of gene information, a history of an environmental condition, and a history of a biological state. This scheme may be implemented by clarifying a similarity in a correlation among cell memory information of a biological molecule of individuals, gene information such as DNA polymorphism information, and environmental information based on a lifestyle illustrated in Fig. 8 .
- the similarity of data may be determined by applying a conventional clustering method.
- the clustering method may be broadly classified into a division type clustering and a hierarchal clustering. Specifically, it is possible to apply a scheme described in A. K. Jain, M.N. Murthy and P.J. Flynn, Data Clustering: A Review, ACM Computing Reviews, (1999 ) or Ying Zhao and George Karypis, "Hierarchical Clustering Algorithms for Document Datasets", Data Min. Knowl. Discov. 10(2): pp.141-168 (2005 ).
- a biological information processing device 101 is configured as illustrated in Fig. 9 .
- the biological information processing device 101 includes a selector 111, a determining unit 112, a measurement unit 113, a creation unit 114, a dividing unit 115, an identification unit 116, a detector 117, a search unit 118, a database 119, and an inference and control unit 120.
- Functions of the selector 111, the determining unit 112, the measurement unit 113, the creation unit 114, the dividing unit 115, the identification unit 116, and the inference and control unit 120 are basically similar to functions of the selector 11, the determining unit 12, the measurement unit 13, the creation unit 14, the dividing unit 15, the identification unit 16, and the inference and control unit 17 illustrated in Fig. 1 . As such, description may be repeated, and thus will be provided.
- the detector 117 detects gene information.
- the search unit 118 searches for a similar history from the database 119.
- the database 119 stores information of multiple individuals by classifying the information into any one of the three small groups described above with reference to Fig. 8 . That is, information of examination results of multiple people obtained by performing the process of Fig. 2 described in the foregoing is stored. In addition, in this instance, a measurement/examination for obtaining information used to determine one of the three small groups to be classified into is added.
- a measurement/examination that specifies a genetic diversity of a single nucleotide polymorphism and a structural polymorphism of DNA is added in addition to a measurement/examination of an environmental condition such as a stress state, a diet habit, an exercise habit, an infection history, a cure/dosing history, and a measurement/examination of cell memory information of a biological molecule.
- step S101 a database formation process is performed. That is, the process illustrated in the flowchart of Fig. 2 is performed on multiple individuals concurrently with a measurement/examination that specifies a genetic diversity of a single nucleotide polymorphism and a structural polymorphism of DNA of each individual, and a result is stored in the database 119. However, information is stored in a form of concealing privacy of individuals.
- the information stored in the database 119 is classified into a group based on a genetic diversity, a group based on a change of an environmental condition, and a group based on cell memory information of a biological molecule. Then, three relations below of each group are analyzed using a conditional probability.
- the database formation process is described as step 1 of a health state prediction process of the flowchart of Fig. 10 .
- the database may be used. In this case, the database formation process may be skipped.
- step S102 the selector 111 selects measurement molecules of a subject of a health care.
- step S103 the determining unit 112 determines a molecule measurement interval.
- step S104 the measurement unit 113 measures the measurement molecules, selected in a process of step S102, at the molecule measurement interval determined in step S103.
- step S105 the creation unit 114 creates a time-series variation graph. That is, a graph is created based on Equation (5) through (11) described above.
- the dividing unit 115 divides components. That is, using a biological state space model, time-series data is divided into a periodic component, an environmental stimulus response component, and a baseline component.
- step S107 the identification unit 116 identifies a constant region. That is, a constant region is identified using an "organism local constant model.”
- step S108 the identification unit 16 identifies a causal relation. That is, a causal relation between constant regions of each molecule is created. A dynamic construction model may be used to identify the causal relation.
- the identification unit 116 identifies a causal relation of molecular markers and a relation with an external environment. That is, a causal relation between respective molecules, and a relation with an environment are created.
- a measurement value of a time series variation of a lifestyle may be used as an external environment. Measurement values are input by the subject, or are input by a measurement device, and the like.
- step S110 the detector 117 detects DNA polymorphism. That is, the detector 117 detects a single nucleotide polymorphism and a structural polymorphism as gene information of a gene included in the subject of a health care.
- the search unit 118 searches for a history of another person similar to the history of the subject from information stored in the database 119 in step S111. That is, as described in the foregoing, a similarity in a correlation among cell memory information of a biological molecule of individuals, gene information such as DNA polymorphism information, and environmental information based on a lifestyle is determined, and a most similar history is searched for.
- FIG. 11 is a diagram illustrating a model associated with a causal relation using four constant regions y 11 , through y 14 of the five blood molecules A, B, C, D, and E as nodes.
- the states x 10 and x 11 denote a health state
- the states x 12 and x 13 denote a symptom non-onset state
- the state x 14 denotes a symptom onset state.
- a number indicates a passage of time in a direction from a small value to a large value, and a lifestyle of the subject is recorded in the order.
- the node Y 14 (A) and the node Y 14 (D) are causes, and markers that replace a state of a disease.
- the node Y 13 (A) and the node Y 13 (C) affect an induction of the node Y 14 (A), and the node Y 13 (E) affects an induction of the node Y 14 (D)
- the nodes Y 12 (C), Y 12 (A), and Y 12 (D) affect an induction of the nodes Y 13 (A), Y 13 (C), and Y 13 (E), respectively.
- the nodes Y 11 (A), Y 11 (B), and Y 11 (D) affect an induction of the nodes Y 12 (A), Y 12 (C), and Y 12 (D), respectively.
- a history of a cell memory of a subject in Fig. 11 may be expressed as a matrix of Fig. 12 .
- the sign + and the sign - of Fig. 12 correspond to states of the nodes Y 11 (A) through Y 14 (E) of Fig. 11 , respectively.
- n types of associated molecules G(A) through G(E) are detected as gene information of a gene associated with the blood molecules A through E.
- the group may be classified into n! x5 (! denotes factorial) small groups (group illustrated in the left frame in Fig. 11 ) from genome information.
- a search for a similar history When a search for a similar history is executed, data is first classified into small groups according to genome information, and then approximate data is selected from a homogeny of the matrix illustrated in Fig. 12 . When a homogeny is the highest, all items of the matrix match one another. When it is partially approximate, proximity is ranked according to a size. Since a record of a lifestyle is attached to data of a matrix, a subject may select a future lifestyle with reference to similar lifestyle information of another person.
- step S112 the inference and control unit 120 infers and controls a state change. That is, a future change in a state of an organism of a subject is inferred, and an intervention scheme including a prevention scheme is proposed.
- a simplest proposal is to present a search result of step S111 to a subject. That is, in a search process of step S111, a history of another person similar to a history of a subject is searched for. When the other searched person has a disease or an illness, the subject is highly likely to have a similar disease or illness. Thus, for example, the subject may prevent the similar disease or illness by changing a lifestyle so that an environmental condition is different from that of the other person.
- further options for maintaining health of the subject may be actively constructed and provided. For example, among environmental conditions such as stress, a diet habit, an exercise habit, an infection history, and a cure history, it may be suggested that an element having a strong causal relation is specified, and the element is changed. Further, when a factor associated with a gene may be changed, the change may be suggested.
- a step describing a process of a flowchart includes a process executed in parallel or individually even though the process is not a time series process in addition to a process executed in a time series manner according to an order.
- embodiments of the technology are not limited to the embodiments described above, and may be variously changed within a scope not departing from the spirit of the technology.
- two or more arbitrary embodiments may be combined together.
Abstract
Description
- The present technology relates to a biological information processing method and a device, a recording medium and a program, and particularly to a biological information processing method and a device, a recording medium and a program that predict and control future changes in the state of a human organism.
- A decrease in productivity of development in a new treatment scheme, diagnostic scheme, and prevention scheme has been a significant issue in resolving a social problem associated with health. The decrease in productivity is caused since enormous perception obtained in basic biology fails to be effectively used to resolve an issue in clinical practice (Non-Patent Document 1). According to recent international research, the current world population having diabetes has increased to 285 million. The population having diabetes is expected to exceed 435 million, which is larger than the population of North America, by the year 2030. This indicates that prevalence of diabetes of adults in the world is close to 7%.
- A human includes 60 trillion cells, has complexity of storing DNA (Deoxyribonucleic acid) information including 6 billion base pairs in each cell, and is a dynamic system that performs cell divisions 1016 times in the human's life. In addition to millions of base substitutions, diversity in a DNA structure such as loss, duplication, and inversion of a DNA sequence is observed between two individuals.
- One of characteristics of biology is a hierarchy. A human body is based on a "cell" including molecules such as DNA or protein, and is characterized by a subsystem, a tissue, and an organ including various cells. The hierarchy diversifies a time scale of a responsive reaction with respect to a stimulus from an environment. An information propagation within a cell proceeds in a unit of millisecond or second, an information propagation between cells proceeds in a scale of a minute or an hour, and a process of a cell growth or differentiation proceeds in a unit of date and hour. The diversity of the time scale causes a time delay in an organism.
- In a complex and diverse life phenomenon, basic biology has clarified a causal relation between molecules included in an organism to represent an organism as a mechanical system. This is implemented by a scheme of selecting a particular molecular parameter from among a plurality of parameters, and changing the particular molecular parameter.
- In a clinical science, disease is treated by emphasizing alleviation of associated symptoms.
- In addition, to obtain a clinical effect, an experimental rule such as a relational expression and a rule between an intervention such as dosing and a clinical outcome is inferred from a biological index in a specified time.
- A significant objective in modern medicine is to provide appropriate health management or treatment to each individual. When a treatment scheme or medication of which safety and efficacy have been statistically verified is marketed and used by a large-scale group, a side effect or no efficacy is observed in a portion of patients. One of the causes thereof is genetic diversity of a patient receiving treatment. With regard to a difference in disease onset rate due to genetic diversity, an analysis has been recently in progress by "(Genome wide association study; GWAS)" (Non-Patent Document 2).
- Non Patent Document 1: Nature 453; 840-9, 2008
- Non Patent Document 2: J. Hum. Genet. Doi: 10.1038/jhg.2010.19
- However, in a current clinical practice, to measure a limited biological index only in a limited time, and statistically average the index, various characteristics acquired by various people included in a group over time are abstracted accordingly. In addition, as opposed to basic biology emphasizing a micro-scale issue, clinical research handles, as a clinical outcome, a macro-scale issue of an individual level such as a physical disability, a loss of a physiological function, and a particular illness or body condition. In basic biology and clinical research, a gap is included between levels.
- In addition, a current treatment strategy is forced to construct a disease by abstracting diversification acquired over time, and thus every treatment strategy is a symptomatic therapy. However, an original health state may not be recovered from a disease by alleviating a symptom.
- These issues indicate that a concept of a current basic biology or clinical practice may not predict and control a future change in a human biological state, making it difficult to develop an effective prevention scheme and treatment scheme.
- The present technology has been contrived in view of the above circumstances, and may predict and control a future change in a human biological state.
- An aspect of the technology is a biological information processing method including the steps of: measuring an expression level of molecules in an organism over a specific time interval; dividing measured time-series data into a periodic component, an environmental stimulus response component and a baseline component; identifying constant regions of the time-series data from variations in the baseline component or from the amplitude or periodic variations of the periodic component, and identifying causal relation between the identified constant regions; and inferring changes in the state of the organism from the identified causal relation between the constant regions.
- The identifying step may further identify the relation between changes in the state of the organism and the external environment, and the inferring step may further infer disease onset in the organism from the identified relation between changes in the state of the organism and the external environment.
- The measuring step may measure the molecules representing a general state, a local state, and a chromosome state.
- The molecules may be blood molecules of the organism.
- The molecules may be molecules associated with metabolic syndrome.
- The molecules may be molecules in a culture medium.
- According to an aspect of the technology, an expression level of molecules in an organism is measured over a specific time interval, measured time-series data is divided into a periodic component, an environmental stimulus response component and a baseline component, constant regions of the time-series data are identified from variations in the baseline component or from the amplitude or periodic variations of the periodic component, and causal relation between the identified constant regions is identified. Changes in the state of the organism are inferred from the identified causal relation between the constant regions.
- A biological information processing device, a recording medium, and a program of the aspect of the technology are a biological information processing device, a recording medium, and a program corresponding to the biological information processing method of the aspect of the technology described above.
- Another aspect of the technology is a biological information processing method including the steps of: acquiring cell memory information of a biological molecule of an organism of a subject; acquiring environmental information associated with an environmental condition of the organism of the subject; acquiring gene information associated with a gene sequence included in the organism of the subject; and searching for similar information of an organism of a person other than the subject associated with the acquired cell memory information, environmental information, and gene information.
- The gene information may be a single nucleotide polymorphism and a structural polymorphism.
- The searching may be performed based on similarity in a correlation among the cell memory information, the environmental information, and the gene information.
- The step of acquiring cell memory information includes the steps of: measuring an expression level of molecules in an organism of the subject over a specific time interval; dividing measured time-series data into a periodic component, an environmental stimulus response component and a baseline component; and identifying constant regions of the time-series data from variations in the baseline component or from the amplitude or periodic variations of the periodic component, and identifying causal relation between the identified constant regions.
- According to the other aspect of the technology, cell memory information of a biological molecule of an organism of a subject is acquired, environmental information associated with an environmental condition of an organism of the subject is acquired, gene information associated with a gene sequence included in an organism of the subject is acquired, and similar information of an organism of a person other than the subject associated with the acquired cell memory information, environmental information, and gene information is searched for.
- A biological information processing device, a recording medium, and a program of the other aspect of the technology are a biological information processing device, a recording medium, and a program corresponding to the biological information processing method of the other aspect of the technology described above.
- As described above, according to an aspect and another aspect of the technology, it is possible to predict and control future changes in the state of a human organism.
-
-
Fig. 1 is a block diagram illustrating a configuration of an embodiment of a biological information processing device. -
Fig. 2 is a flowchart illustrating a health state prediction and control process. -
Fig. 3 is a diagram illustrating a model associated with a causal relation using a constant region as a node. -
Fig. 4 is a block diagram illustrating a configuration of another embodiment of a biological information processing device. -
Fig. 5 is a flowchart illustrating a prediction and control process of a cellular state of a cultured cell. -
Fig. 6 is a diagram illustrating a configuration of a model of a cell. -
Fig. 7 is a diagram illustrating a change in state of a cell. -
Fig. 8 is a diagram illustrating a causal relation of information. -
Fig. 9 is a block diagram illustrating a configuration of another embodiment of a biological information processing device. -
Fig. 10 is a flowchart illustrating another health state prediction and control process. -
Fig. 11 is a diagram illustrating a model associated with a causal relation of a lifestyle. -
Fig. 12 is a diagram illustrating a matrix representing a history of a cell memory. - Hereinafter, a mode (hereinafter, referred to as an embodiment) for carrying out the technology will be described. Description will be made in the following order.
- 1. Progress
- 2. Definition
- 3. First embodiment
- 4. Second embodiment
- 5. Third embodiment
- 6. Fourth embodiment
- 7. Fifth embodiment
- 8. Sixth embodiment
- 9. Seventh embodiment
- 10. Eighth embodiment
- 11. Ninth embodiment
- <Progress>
- First, a progress of the technology will be described as follows.
- Developers of the technology have closely examined a method of representing a time evolution of a human organism and predicting and controlling a direction of change of the future. As a result, in addition to three parameters of a genetic type, a phenotype, an external environment conventionally used to formulate a life, by introducing a new parameter referred to as a "cell memory undergoing a time evolution," it is found that a problem of a human organism undergoing a time evolution may be resolved. In addition, to formulate the "cell memory undergoing a time evolution," the developers of the technology have noted that a cell memory of a transcription factor having a property of a bistable switch expressed in each cell changes over time due to epigenetic modification and genetic modification. The epigenetic modification includes DNA methylation or histone modification, and the genetic modification includes a DNA mutation or a structural change.
- The developers of the technology have constructed the "cell memory model undergoing a time evolution" which indicates that genetic modification and epigenetic modification change a cellular state by altering an expression level of a target gene product controlled by a bistable switch. Further, according to the "cell memory model undergoing a time evolution," the developers of the technology have constructed a concept referred to as a "chromosome state" including a transcription factor that functions in a chromosome, genetic modification, and epigenetic modification.
- Next, to estimate the "chromosome state" from an observed value of a general state or a local state, the developers of the technology have linked the generate state, the local state, and the "chromosome state" which are three different levels constituting a human organism system to one another. For this, the developers of the technology have constructed a macro model, a meso model, and a micro model corresponding to each level of the general state, the local state, and the "chromosome state." Further, using this "organism level link model," the developers of the technology propose a method of linking and formulating the macro model, the meso model, and the micro model in units of cells.
- Next, to observe the "chromosome state" that manages a time evolution of a human organism, the developers of the technology have examined development of a method of integrating the "organism level link model" into a time-series model, and found a new integration method using a "biological state space model." Then, the developers of the technology propose a method of extracting the "chromosome state" by dividing time-series data of a molecular marker that reflects the general state using the "biological state space model" into a periodic component, an environmental stimulus response component, and a baseline component.
- Next, the developers of the technology have closely examined development of a control model using data of the time evolutional change of a human organism that can be represented by the technology for the first time. Then, the developers of the technology find a concept of a "constructed change" indicating that an initial input from an external environment changes responsiveness to a subsequent input from the external environment, and propose a "dynamic construction model" in which the "cell memory undergoing a time evolution" is controlled by the "constructed change."
- In addition, the developers of the technology have conducted a close examination to apply the "dynamic construction model" to an issue in clinical practice, and proposed a method of an "organism local constant region model" for identifying a constant region of time-series data associated with an expression level of a molecule produced in an organism using the "biological state space model." Furthermore, the developers of the technology propose a method of analyzing a causal structure and a biological state tracking using, as a node, an organism local constant region found during a time series variation of an expression level of a molecule produced in an organism.
- <Definition>
- Next, definition of terms used in description of embodiments of the technology will be described.
- A time evolution of a human organism indicates a process in which a state or a function of a human organism irreversibly changes over time. A human dies after undergoing irreversible changes such as generation, birth, growth, and aging from a moment of fertilization. An onset of a disease progresses to a previous step of the onset receiving a potential change, the onset, a particular disordered physiological function, a loss of a particular physiological function, a physical disability, and a death. This indicates that an instant in a human organism and the time of another instant are not homogeneous.
- The "cell memory undergoing a time evolution" indicates that a cell memory constructed by a transcription factor is changed by genetic modification and epigenetic modification introduced as an environmental input to a cell or a result from an accident. A cell memory has conventionally been defined as a phenomenon in which a change in state of a cell acquired by a stimulus from an external environment is maintained even after the stimulus from the external environment disappears (Cell 140: 13-18, 2010). A cellular state is represented by a type, an amount, and a modification property of a molecule expressed in a cell, and a maintenance and a change of the cellular state is controlled by a transcription factor.
- That is, a conventional cell memory provides a concept that a state of a cell provides a particular equilibrium by a characteristic of a bistable switch included in a transcription factor. However, only the uniform time of ON and OFF of a switch may be provided. However, actually, genetic modification and epigenetic modification introduced over time change a cellular state provided by a transcription factor over time, thereby further diversifying a state of a cell when compared to the cellular state assumed only by a transcription factor.
- That is, in the "cell memory undergoing a time evolution," a diversity of a cellular state may be formulated by a history that may be inherited such as genetic modification and epigenetic modification, and the "cell memory undergoing a time evolution" is essentially different from a conventional cell memory in that the non-uniform time may be managed.
- A transcription factor forms a molecular base of a conventional cell memory. When a circuit of a transcription factor is nonlinear and indicates a bistable characteristic, a state of a molecule is in equilibrium of ON or OFF, and the memory is inherited even after a cell division. An affinity formed between a transcription factor and a binding site of a promoter, and cooperativeness or multimerization among a plurality of transcription factors provide a characteristic of a nonlinearity to a transcription factor.
- The nonlinearity resists a transient disturbance and causes an expression level to be inherited by providing a threshold-like characteristic to a response of a transcription factor. In addition, a transcription factor acquiring a sufficiently great Hill coefficient by a positive feedback or a positive or negative dual feedback acquires a characteristic of a bistable switch, and a change in state is locked even after an original input disappears. That is, a type, an amount, and a post-translational modification of a transcription factor expressed in a cell forms a skeleton of a conventional cell memory.
- Genetic modification such as a single nucleotide polymorphism observed in a human genome, a defect, a duplication, and a change in the number of copies of a portion of a DNA sequence, and epigenetic modification such as DNA methylation, histone modification, and a protein denaturation manage a molecular base of the "cell memory undergoing a time evolution" (Nature Review Genetics 7: 85-97, 2006, Cell 128: 655-658, 2007).
- Each of genetic modification and epigenetic modification directly or indirectly changes a parameter associated with a characteristic of nonlinearity or a bistable switch of a transcription factor, thereby modifying a function of a conventional cell memory.
- As for genetic modification, a relation between a single nucleotide polymorphism and a disease onset rate is analyzed by a genome-wide linkage analysis scheme. Using the analysis scheme, nineteen genes have been identified as a related gene of
type 2 diabetes. However, only 1% of the total is diabetic patients having a mutant (Nature 462: 307-314, 2009). Similarly, aBRCA 1/2 gene mutation is observed in only 3% of the entire breast cancer patients. In an experiment comparing a lifespan of identical twins to a lifespan of non-identical twins, an epidemiologic investigation indicates that a percentage of contribution to a lifespan by a gene sequence is about 15% to 25% (Hum. Genet 97: 319-323, 1996). - Epigenetic modification is defined as an alteration of a gene function that may be inherited without entailing a change in a DNA sequence. DNA methylation and chemical modification of a chromatin protein are a molecular substance of epigenetics. In addition, an alteration of a cell function due to denaturation of protein such as prion protein and amyloid protein is classified as epigenetics in a broad sense. A concept of epigenetics was proposed by Waddington to describe a mechanism in which genetic information is changed to a phenotype in a process of generation.
- However, a function of epigenetics affects establishment and maintenance of a tissue or a cell-specific genetic expression. In addition to this, a stimulus due to nutritive conditions, a social stress, and chemical substances introduces epigenetic modification. It has been reported by an epidemiological research of humans that a stimulus from an environment received during the stage of an unborn baby or a newborn baby affects an onset rate of a chronic disease in adulthood through epigenetics (Stem Cell Res. 4; 157-164, 2010).
- The above-described epigenetic modification is referred to as environmental epigenetics to be distinguished from development-type epigenetics associated with cell differentiation. The developers of the technology have found that a function of environmental epigenetics is regarded as a "function of updating DNA information based on a change in external environment information."
- A scale of the time to be inherited is different between genetic modification and epigenetic modification affecting alteration of a function of a transcription factor. Genetic modification is a primary cause of a cell memory inherited from parents to a child. On the other hand, epigenetic modification performs a primary function as a cell memory acquired in a generation.
- However, a discovery of transgenerational·epigenetics indicates that environmental epigenetics introduced in a germ line resists an initialization of generation, and is inherited from parents to a child (Stem Cell Res.4; 157-164, 2010). In addition, new genetic modification such as a DNA mutation or transposition introduced in a somatic cell is regarded as a primary cause of carcinogenesis.
- A "model of a cell memory undergoing a time evolution" is a new concept introduced to formulate the "cell memory undergoing a time evolution" that changes over time due to genetic modification and epigenetic modification. An expression signature of a transcription factor, genetic modification, and epigenetic modification that change over time are integrated into a "chromosome state."
- This is different from a conventional cell memory which defines only two states of ON and OFF with respect to a transcription factor. In a chromosome state of the technology, an inhibitory effect and an induction with respect to a target gene product by a transcription factor discretely change. By introducing a concept of the chromosome state, a cellular state is formulated as a connection of two time series variations of the chromosome state and an external environmental state of a cell. Further, the "cell memory undergoing a time evolution" is formulated as a function of a time series variation of the "chromosome state."
- An "organism level link model" is a new model proposed for a connection of the "chromosome state" and an "individual state" requested to use the "cell memory undergoing a time evolution" for a prediction of a health or a disease of an individual level. A human individual is a continuum hierarchically put in order. A cell is formed from molecules, and a further complex entity such as a tissue and an organ is constructed on cells. A state of a human body may be classified into a general state, a local state, and a chromosome state based on the above-described hierarchical structure, and a model of three different scales of macro, meso, and micro may be constructed in response to each state.
- A macro model is a model regarding an entire body as a state. Thus, the state may be defined by an expression signature of a molecule diffusing in the entire body. Representative examples of the molecule diffusing in the entire body include a hormone of an endocrine system or an immune system, a growth factor, and a cytokine. In addition, adrenaline and noradrenaline affecting a control of an autonomic nervous system defines a state of an entire body.
- A meso model is a model that discovers a state of a homogeneous local space within an organism. Each organ or tissue forms a homogeneous state as a unity. In general, a symptom of an inflammation and the like specifically occurs in a local site. This includes multiple cells forming an inflamed site. On the other hand, a rejuvenescence of a tissue is controlled by propagation and differentiation of a few tissue stem cells. As such, the meso model includes the different number or type of cells such as one cell, an inflamed tissue, a tissue, and an organ. The local state is defined by systematic molecules in addition to an autocrine and paracrine molecular group expressed within a local environment.
- A micro model is a model that discovers a state of a chromosome included in each cell. A reason why the micro model is not in a cellular state is that a cellular state only represents an overt cell memory driven by a transcription factor, and a potential change including genetic modification or epigenetic modification is abstracted. A chromosome state is defined by genetic modification, an epigenetic modification characteristic, and an expression signature of a transcription factor.
- Epigenetic modification and an expression signature of a transcription factor in a state of a chromosome are controlled by a local environment and a systematic environment of a cell having the chromosome. A cell that produces systematic molecules is also controlled by a local state of a cell and a chromosome state in addition to a general state, and a cell that produces an autocrine and paracrine factor which is a molecule of a local environment is controlled by the general state, the local environment of the cell, and the chromosome state. That is, it is clear from an analysis that it is formulated that the "chromosome state," the local state, and the general state concurrently determine a change of one another, are concurrently directed, and concurrently undergo a time evolution. The formulation is referred to as an "organism level link model."
- A human receives stimuli from various different environments depending on a social environment, a behavioral characteristic of the human, and the like. A stimulus from external environments is recognized by various systems of a somatic cell, and is translated into an internal environment change of a human body. Therefore, due to individual differences of a somatic cell system receiving a stimulus, a stimulus from the same environment may not necessarily induce the same change of an internal environment. This indicates that a quantitative measurement of an environmental factor alone may fail to accurately predict a change in state of a human body. A stimulus from an environment may be classified, according to a characteristic, into a physical stress (temperature, oxygen, ultraviolet ray, and the like), a chemical stress (endocrine disruptor, carcinogen, and the like), a psychosocial stress, an exercise stress, a nourishment stress (excessive eating and starvation), an infection stress, a wound stress, and the like.
- A stimulus from an environment is detected by a reception system, and then is translated into a change of a general state, a local state, and a "chromosome state" with different time delays. As such, to expand the "cell memory undergoing a time evolution" to a memory of an entire body level, time needs to be regarded as a discrete distribution rather than as a continuous distribution. Instability of a time delay is controlled by a feedback system within an organism. Accordingly, when a change in state may be discovered in a time unit in which a change from a feedback system to a new feedback system may be discovered, a problem of a time delay may be abstracted.
- A "biological state space model" is a new model proposed to apply the "organism level link model" to a time-series model. Various models used for a time-series model may be generally managed in a unified manner by a state space model (
Chapters - The state space model includes two submodels of a system model (x) and an observation model (y), and two interpretations are possible. When the observation model is regarded as a regression model that expresses a structure in which observed time-series data yn is observed, a state xn of the system model (x) is a regression constant. In this case, the system model is a model that expresses a state of a temporal change in a regression coefficient. On the other hand, when the state xn is regarded as a signal to be estimated, the system model represents a model that indicates a generating mechanism of a signal, and the observation model represents a state in which the signal is converted and noise is added when the signal is actually observed.
- In a "dynamic construction model," xn expresses a state of an actual human body, yn is assumed to be a multivariate time-series vector associated with a measurable expression level of an extracellular factor group, and the state xn is regarded as a signal to be estimated. When the "organism level link model" is applied to a clinical prediction, it is not realistic to measure all of the "chromosome state" and the local state. However, an extracellular factor that circulates in an entire body such as a hormone, a growth factor, and a cytokine may be measured.
- The "organism level link model" clarifies that the "chromosome state," the local state, and the general state concurrently determine a change of one another, are concurrently directed, and substantially undergo a co-time evolution. This indicates that data of a time series variation of an extracellular factor that circulates in an entire body contains a change of the "chromosome state" and the local state. That is, components of the local state and the "chromosome state" are directly or indirectly reflected on yn which is multivariate time-series data including a systematic blood factor of a human body state xn. This formulation scheme is referred to as the "biological state space model."
- Time-series data yn of an extracellular factor that circulates in an entire body may be decomposed into a periodic component using a seasonal adjustment model, an environmental stimulus response component using a multi-linear model, and a baseline component using a polynomial smoothing spline model, respectively. A cell memory is reflected on an amplitude and a frequency of a periodic component associated with an expression of a molecule produced in an organism, a maximum expression level of a stimulus response component, and a change of a long-term baseline. Accordingly, by combining the "organism level link model" with the "biological state space model," it is possible to represent the "cell memory undergoing a time evolution" specifically and in chronological order.
- The "dynamic construction model" is a control theory with respect to a human organism undergoing a time evolution. One of functions of a time evolution of an organism is that an initial stimulus from an environment changes responsiveness to a subsequent stimulus of a similar type. A molecular entity of the responsiveness change is referred to as a "constructed change" in this specification. A human organism undergoing a time evolution may be controlled by this formulation.
- In the "constructed change," a representation "when stress that is not fatal to an organism is applied, responsiveness to a subsequent strong stress is improved" is generally referred to as a hormesis (Toxicology and Applied Pharmacology 222: 122-128, 2007). Up until now, a molecular mechanism of a hormesis is not clear. In a "cell memory model undergoing a time evolution" of the technology, the "constructed change" including a hormesis clarifies that a dynamic cell memory subjected to genetic modification and epigenetic modification manages a molecular basis. In this way, it may be understood that an onset of a chronic disease is caused by a mismatch between the "cell memory undergoing a time evolution" of the technology and a subsequent stress.
- The "constructed change" is different from a conventional control model such as a dynamic equilibrium model and a dynamic nonequilibrium model assuming a fixed genetic algorithm based on a genetic determinism. That is, the "constructed change" assumes that a function of a gene changes due to an input from an environment or an accidental factor, and a genetically defined algorithm changes when a portion of the change is inherited to the future. Accordingly, a new control theory is needed for the "constructed change."
- In the genetic determinism, a time change of a phenotype (P(t)) is expressed by a product of a given genetic type (Gx) and an environmental factor (E(t)) that changes over time, which is as follows.

- For one "constructed change," a time change of a phenotype (P(t)) is expressed by a product of a chromosome state (C(t)) that changes over time and incorporates the "cell memory undergoing a time evolution" of the technology, and an environmental factor (E(t)) that changes over time, which is as follows.

An organism model represented by Equation (2) is referred to as the "dynamic construction model." - An "organism local constant model" is a new data processing scheme for controlling a health and a disease using the "dynamic construction model" of the technology. Time-series data associated with an expression level of a molecule produced in an organism is generally non-stationary. However, even non-stationary data may be assumed to be stationary data in respective short intervals by dividing a time interval into appropriate short intervals. Time-series model in which a time interval is divided into appropriate short intervals by a calculation independently from the above-described system function, and respective short intervals may be assumed to be stationary is generally referred to as a local constant model (Chapter 8, Iwanami bookstore, Kitagawa Genshiro, Introduction to time series analysis).
- In the "organism local constant model," to allocate changes in state of a cell memory as respective different stationary states, time-series data of an expression level change of a molecule expressed in a cell within an organism or a cultured cell is first decomposed into a periodic component, an environmental stimulus response component, and a trend component of a baseline by using the "biological state space model," and then a local constant region is identified. A cell memory influences a change of a baseline component, an amplitude and a frequency of a periodic component, and a maximum expression level and a minimum expression level of an environmental stimulus response component. Among these, three categories of a change of a baseline component, and an amplitude and a frequency of a periodic component may be identified independently from a strength of an input from an environment.
- In the "organism local constant model," a local constant region is identified by the three categories. In general, the local constant region is classified into three states of an original stationary state, a new stationary state, and a change from the original stationary state to the new stationary state. The "organism local constant model" of the technology is fundamentally different from a conventional local constant model in that a constant region is specified based on a characteristic of an organism rather than simply and mechanically decomposing a time series variation into constant regions.
- A "scheme of analyzing a causal structure and a biological state tracking using a local constant region as a node" is a scheme of predicting and controlling health maintenance and a disease onset by identifying an internal cause of inducing a change in state to a human organism undergoing a time evolution. A disease starts from an asymptomatic stage acquiring a potential change, and undergoes a non-stationary time evolution of acute symptoms, chronicity, a partially disordered physiological function, a partial loss of a physiological function, a physical disability, being bedridden, and a death. That is, a time evolution of a disease may be approximated to a continuous evolution of a time division regarded as a stationary state.
- To predict and control a change in state of a health state or a disease, a local constant state region of a disease indicating a systematically complex aspect first needs to be coded using a molecule produced from a cell as a proxy index. This indicates that time-series data of a molecule expressed from a cell of an organ, a tissue, and a subsystem associated with a disease is divided from a viewpoint of a local constant region, and is associated with a phenotype of the disease. Using a causal structure model constructed by a biological knowledge as a prior probability, data of a time series variation of an expression level of a molecule within an organism is analyzed from multiple individuals by Bayes' approach, and an optimum type of molecule effective for the association may be selected. Accordingly, a blood molecule among various molecules produced from a cell may relatively easily acquire time-series data using a blood sample, and is effective for application of the "dynamic construction model" of the technology.
- As a device for measuring a blood molecule, a glucose meter is regarded as a prototype device (Freestyle lite, Abbott Corporation). The glucose meter may measure an amount of blood glucose from a small amount of blood collected using a needle. This system may be applied to a measurement of a blood molecule other than glucose. On the other hand, recently, a scheme of percutaneously measuring a blood molecule is developed.
- A time division of a constant region extracted from a time series variation of an expression level of a blood molecule is not only effective for coding a state associated with various diseases, and tracing the change in state, but also may be used to analyze a causal relation which is a cause of a disease onset. An issue of a health management is identifying a change of a blood molecule which is a cause of moving to an asymptomatic initial disease stage from a health state, and using the change for preventing an onset of a disease. In addition, an issue of a disease management is identifying a change of a blood molecule which is a cause of inducing an initial disease to a complication, and using the change for preventing an onset of the complication.
- To perform a control using the "dynamic construction model" of the technology, a causal relation between changes of an expression level of a molecular group within an organism is first modeled using biological knowledge. Then, it is used to construct a graph structure associated with a probability structure/causal structure between nodes identified by extracting a constant region from data of a time series variation of a molecule within an organism of a plurality of patients. Thereafter, it is upgraded to an optimal graph structure using time-series data of a change of expression of a biological molecule of a plurality of healthy individuals or patients. A change of a graph structure may be solved as a selection problem of a covariance in regression analysis. A constructed optimum graph structure may be used to predict and control a change of a biological state of the future intended for a health management or a disease management of each individual by continuing a serial measurement of a change of expression of a biological molecule.
- <First embodiment>
- It is an important challenge desired from modern medicine to develop an effective prophylaxis for diabetes, cancer, immunity disorder, dementia, and cardiovascular disease based on diversity of individuals and various histories of the past. Using a "dynamic construction model" of the technology, an individual prevention may be performed for the disease group.
-
Fig. 1 is a block diagram illustrating a configuration of a biologicalinformation processing device 1 that predicts and controls a health state. The biologicalinformation processing device 1 includes aselector 11, a determiningunit 12, ameasurement unit 13, acreation unit 14, a dividingunit 15, anidentification unit 16, and an inference andcontrol unit 17. - The
selector 11 selects measurement molecules. The determiningunit 12 determines a molecule measurement interval. Themeasurement unit 13 performs a measurement. Thecreation unit 14 creates a graph. The dividingunit 15 divides components. Theidentification unit 16 identifies a constant region and a causal relation, and identifies a causal relation of molecular markers and a relation with an external environment. The inference andcontrol unit 17 infers and controls change in states. -
Fig. 2 is a flowchart illustrating a process of predicting and controlling a health state. Hereinafter, a prediction and control process performed by the biologicalinformation processing device 1 ofFig. 1 will be described with reference toFig. 2 . - In step S1, the
selector 11 selects measurement molecules for prediction and control in relation to metabolic syndrome. That is, a type of blood molecule performing a measurement of an expression level is selected. - The "dynamic construction model" of the technology may be applied to prediction and control of an onset of a series of diseases developing from metabolic syndrome to a circulatory system disease. Diabetes is positioned among the series of diseases developing from metabolic syndrome to a circulatory system disease (Nature 444; 839-888, 2006). A metabolic disease causes obesity, visceral obesity, hyposecretion of adiponectin, insulin resistance, and the like from a problem of a lifestyle including poor eating habits and lack of exercise. Thereafter, a disease state proceeds to high blood pressure, postprandial hyperglycemia, and dyslipidemia. A state so far is referred to as metabolic syndrome.
- Metabolic syndrome induces an inflammation in visceral fat, activates a regenerating system of various organs, and increases oxidant stress. As a result, a fatty liver or nonalcoholic steatohepatitis is caused. Thereafter, pancreatic dysfunction and insulin hyposecretion occur, causing an onset of diabetes.
- Diabetes induces nephropathy, retinopathy, psychoneurosis, arteriosclerosis obliterans, cerebral vascular disturbance, and an ischemic cardiac disease, and proceeds to kidney dialysis, blindness, lower limb amputation, stroke, dementia, and cardiac insufficiency, resulting in death. In particular, an inflammation induced by metabolic syndrome causes cancer or a degenerative neurological disorder. When the "dynamic construction model" of the technology is applied to obesity or
type 2 diabetes, a systematic blood factor below may be used as a molecular marker to use time-series data of an expression level (Nature 444; 839-888, 2006). - First, a molecular group associated with an interaction between a fat tissue and hypothalamic pituitary performs an important function for eating, glycometabolism, lipid preservation, and energy balance, and thus may be used to represent and analyze a state of poor eating and lack of exercise. For example, a chronic social stress has an epigenetic influence on an interaction between a fat tissue and a hypothalamic-pituitary-adrenal system, and changes a production of glucocorticoid and aldosterone from an adrenal gland. As a result, a function of appetite or sleep is changed.
- To identify the change, it is useful to measure a time series variation of an expression level of leptin, adiponectin, visfatin, and omentin produced from a fat tissue, and ACTH produced from a pituitary in addition to glucocorticoid and aldosterone in the blood. To represent and control obesity, visceral obesity, hyposecretion of adiponectin, and insulin resistance, it is useful to measure a time series variation of an expression level of insulin, glucagon, amylin, and GLP produced from a pancreas, and lecithin and RBP4 produced from a fat tissue. In a progress from metabolic syndrome to an inflammation in visceral fat, it is useful to measure a time series variation of an expression level of TNF-α, IL-6, and MCP1 produced from a immunocyte or a fat tissue, and CRP, PAI-1, NEFA, VLDL, and LDL-ox produced from a liver.
- In step S2, the
selector 11 selects measurement molecules for prediction and control in relation to an inflammatory disease. - An immunity disorder including a connective tissue disease, colitis ulcerosa, and disseminated sclerosis represented by systemic lupus erythematosus (SLE) and rheumatism is also known to develop due to an infection history of the past, a characteristic of bacteria in intestines, and the like. It is useful for prediction and control of an immune system disease to track, as a molecular marker, a characteristic change of cytokine produced from a granulocyte, a monocyte, a macrophage, a dendritic cell, and a natural killer cell affecting natural immunity, and a T cell, a helper T cell (TH0, TH1, and TH2), a CD8+ positive T cell, a regulatory T cell, and a B cell affecting acquired immunity. Examples of cytokine include interleukin, interferon, chemokine, a growth factor, and a lymphotoxin factor.
- In step S3, the determining
unit 12 determines a molecule measurement interval. - It is preferable that a time interval for measuring an expression level of a molecular marker be short. However, time-series data of a long interval such as day, week, and month may be used depending on a measurement environment. A lot of molecules undergo a change of an expression level on a circadian rhythm of a 24 hour interval. Thus, when a measurement is performed at a time interval more than a day, data is needed to be acquired by setting a predetermined time period within a day. It is preferable that the acquired time-series data be analyzed using approximately 100 pieces of discrete data as a set regardless of a time interval at which the data is acquired. As such, to expect accuracy, a measurement is desired to be performed at least twice to three times a day, preferably 50 times to 100 times a day.
- In step S4, the
measurement unit 13 performs a measurement. Herein, an expression level of a blood molecule as a biological molecule is measured. Specifically, a molecule representing a general state, a local state, and a chromosome state is measured. The measurement is performed at an interval determined in step S3. - A needle may be used as a device for measuring a molecular marker in the blood. A small amount of blood may be collected using the needle. In addition, depending on molecules, a scheme of percutaneously measuring a blood molecule may be used. A type or amount of molecule may be implemented by fluorescently-labeling a selective antibody with respect to a molecule to be measured.
- In step S5, the
creation unit 14 creates a time-series variation graph. Specifically, a graph based on Equation (5) to Equation (11) below is created. In addition, in step S6, the dividingunit 15 divides components. That is, three components are extracted from time-series data using a biological state space model. The three components may be set to, for example, a periodic component, an environmental stimulus response component, and a baseline component. - Information used for prediction and control needs to be selected from time-series measurement data of a molecular marker. As a scheme, multivariate time-series data including a plurality of blood molecules is desired to be managed in a unified manner as a "state space model." The "state space model" includes two submodels of a system model and an observation model. In general, the two submodels are expressed using a conditional probability as follows.
-


- Herein, yn denotes an observed time series of a multivariable, xn denotes a k-dimensional vector that may not be directly measured, and q and r denote a conditional distribution of xn given by xn-1 and of yn given by xn, respectively. In the "biological state space model" of the technology, xn expresses a state of an actual human body, and yn indicates an expression level of a blood molecule that may be measured. When a distribution of an initial state vector x0 is disposed by P(x0|y0), a prediction of a state of a disease is an evaluation of P(xn|yn), that is, obtaining a distribution of xn given by an observed value yn and an initial distribution.
- Time-series data y(t) of respective measurable blood molecules such as a molecular group that may be used to represent a process from metabolic syndrome to diabetes, and a circulatory system disease, a molecular group associated with an immune system disease, a molecular group of an endocrine system, and the like is expressed by the following Equation. That is, it is expressible using a model including three different components.
-

- s(t): periodic component
- x(t): environmental stimulus response component
- b(t): baseline component
- v(t): observational error
- An environmental stimulus response component x(t) may be formulated as a multilinear model as follows.

i = 1, 2, 3,..., n - In the above Equation, F(t) indicates a conversion function of an output with respect to an environmental stimulus, and vx(t) indicates a change of an environmental stimulus. Regarding a parameter of the conversion function, an optimum value is selected by applying a Yule-Walker scheme, a least square scheme, or PARCO scheme to an autoregression model.
- A baseline component b(t) may be defined as below as a regression model of degree m by a polynomial smoothing spline model.
[Equation 1]
at denotes a regression coefficient, and ε(t) denotes a noise component. - Further, the baseline component b(t) may be expressed as follows.

H(t, t-1) is an m×m matrix, and V(t, t-1) is a matrix associated with m-dimensional noise. An optimum function for smoothing a baseline is selected using this model. - In the "dynamic construction model" of the technology, a main component factor of the periodic component s(t) is a circadian rhythm of a 24 hour interval. When p observed values are obtained during an interval, the periodic component approximately satisfies the following Equation.

- When this is expressed using a time delay operator G, the following Equation is approximately satisfied.

As such, a periodic component ofdegree 1 may be formulated as a seasonal adjustment model as below by white noise ν(t).
[Equation 2]
- Through this processing, time-series data of a blood molecule may be divided into a periodic component, an environmental stimulus response component, and a baseline component.
- In step S7, the
identification unit 16 identifies a constant region. That is, a constant region is identified using the "organism local constant model." - A local constant region may be discovered by analyzing time-series data using a model of a periodic component, an environmental stimulus response component, and a baseline component. In the "dynamic construction model," it is useful to emphasize a change of a stationary state caused by the "cell memory undergoing a time evolution," and an acquisition of a new stationary state. A cell memory influences a change of a baseline component, an amplitude and a frequency of a periodic component, and a maximum expression level and a minimum expression level of an environmental stimulus response component. Among these, a change of a baseline component, and changes of an amplitude and a frequency of a periodic component may be identified independently from a strength of an input from an environment. Paying attention to this point, the local constant region is identified from at least one of a change of a baseline component, a change of an amplitude of a periodic component, and a change of a frequency of a periodic component.
- A time series variation of a blood molecule group includes a pattern of a seasonal variation that repeatedly appears on a monthly basis or on a yearly basis in addition to a circadian rhythm of a 24 hour interval. When this is interpreted as a change of a baseline, there is a risk of leading to an erroneous prediction or control scheme. A seasonal component is extracted from a baseline component, and is divided as a periodic component in a long period of time.
- In step S8, the
identification unit 16 identifies a causal relation. That is, a causal relation between stationary states of respective molecules is created. The dynamic construction model may be used to identify a causal relation. - A constant region of a molecular group in the blood associated with the "cell memory undergoing a time evolution" extracted by this scheme forms a direct or indirect causal relation according to chronological order. To apply the causal relation to a control of progress of a disease, a causal structure is expressed by creating a graph structure associated with a probability structure/causal structure using the constant region as a node.
-
Fig. 3 is a diagram illustrating a model associated with a causal relation using four constant regions y1 through y4 of five blood molecules A, B, C, D, and E as nodes. Referring toFig. 3 , Yi(A) through Yi(E) denote nodes of the constant regions yi(i = 1, 2 ,3, and 4) of the blood molecules A through E, respectively, and x0 through x4 denote states of an organism. The states x0 and x1 denote a health state, the states x2 and x3 denote a symptom non-onset state, and the state x4 denotes a symptom onset state. A number indicates a passage of time in a direction from a small value to a large value. - In this model, the node Y4(A) and the node Y4(D) are causes, and markers that replace a state of a disease. The node Y3(A) and the node Y3(C) affect an induction of the node Y4(A), and the node Y3(E) affects an induction of the node Y4(D). Similarly, the nodes Y2(C), Y2(A), and Y2(D) affect an induction of the nodes Y3(A), Y3(C), and Y3(E), respectively. Further, the nodes Y1(A), Y1(B), and Y1(D) affect an induction of the nodes Y2(A), Y2(C), and Y2(D), respectively.
- An inference of the graph structure associated with a causal structure between constant regions of this biological molecule may be formulated as below. First, a value of a stationary state of a
biological molecule Molecule 1 is regarded as a random variable. That is, under a circumstance, an amount ofMolecule 1 is regarded as an instance of a random variable X1. Observation data processed by the organism local constant model of the embodiment may be regarded as data measuring an instance of a random variable of p types of blood molecules under a circumstance. Since a stationary state is observed in various time periods and circumstances, the observation data processed by the local constant model may be expressed as a data matrix. That is, observation data including n different stationary states is a pxn matrix size. An object of the analysis is to infer a dependency relation in matrix data. - As a scheme of inferring a graph indicating a dependency relation between random variables from a data matrix, various mathematical models such as Boolean network, Bayesian network, a graphical Gaussian model, and an ordinary differential equation are proposed, and may be used for the embodiment. Among these, by assuming a dependency relation expressed using a non-closed path directed graph between random variables, and assuming a Markov chain rule in a dependency relation between a node and a structure of the non-closed path directed graph, an inference using Bayesian network expressed by a product of conditional probabilities based on a given set of random variables with respect to parent variable is useful for the embodiment.
- A further detailed adaptation of Bayesian network may apply a scheme used for a data analysis of a DNA chip (333-356, Second issue, Volume 54, Statistical Mathematics, Yoshinori Tamada, Kiyochika Imoto, and Satoru Miyano). Specifically, it is implemented by matching an expression level of a stationary state of the embodiment to an expression level of mRNA of a DNA chip. An existing physiology model may be used as a previous knowledge to infer a stationary state graph structure of the embodiment.
- A graph structure is first constructed in an individual level. An existing physiology model may not sufficiently match diversity or diversification of an individual, and thus an error may occur in a graph structure inference. To optimize a graph structure, a plurality of individual graph structures are compared to one another, and classified into a small group having a similar structure, and a graph structure is selected again. In this way, an optimum graph structure is constructed.
- A route of a cause and effect leading to a common symptom of a plurality of patients may be different among individuals. As such, an optimum graph structure is determined for each group having the same causal structure rather than causing the optimum graph structure to converge into one.
- In step S9, the
identification unit 16 identifies a causal relation of molecular markers and a relation with an external environment. That is, a causal relation between respective molecules and a relation with an environment are created. A measurement value of a time series variation of a lifestyle may be used as an external environment. - When an input from an environment may be quantitatively measured, a "constructed change" may be represented and applied to a control by analyzing a mechanism in which stimulus of different intensities received in different periods influences responsiveness of a blood molecule. For example, a negative stress level may be measured by a DRM (Daily Reconstructive Method) (one day constitution method). This divides a day into an average of about 24 degrees for each event, and expresses respective positive and negative values in numerical values of 0 through 6 in a step-by-step manner.
- Referring to an influence of meal, by electronically recording content of each meal, it is possible to measure intake information such as calorie, carbohydrate (glucide), fat, protein, vitamin, and phytochemical. In addition, it is possible to measure an amount of intake of a supplement and the like. When a correlation is observed between an environmental stimulus and a change of an expression level of a blood molecule, the environmental stimulus may be used for a control of a change of an expression level of an intended blood molecule, that is, a change in state of an organism.
- In step S10, the inference and
control unit 17 infers and controls changes in state. That is, a future change in state of an organism of a human is inferred, and an intervention scheme including a prevention scheme is proposed. - An inference of a change in state classifies a group by a mutual similarity of a causal structure between constant regions acquired in step S8. In this way, a future change of a disease preliminary group classified in the same group may be inferred by a causal structure acquired from a patient undergoing a progression of a disease. In addition, a causal structure in which a disease is recovered to a health state without an onset of a disease from a potential change prior to an onset of a disease may be used for a control scheme of preventing an onset of a disease. The causal relation of molecular markers (that is, an internal environment) and a relation with an external environment identified in step S9 may be used for a control.
- <Second embodiment>
-
Fig. 4 is a block diagram illustrating a configuration of a biologicalinformation processing device 51 that predicts and controls a cellular state of a cultured cell. The biologicalinformation processing device 51 includes aselector 61, ameasurement unit 62, a determiningunit 63, a dividingunit 64, anidentification unit 65, and an inference andcontrol unit 66. - The
selector 61 selects measurement molecules. Themeasurement unit 62 performs a measurement. The determiningunit 63 determines a measurement interval. The dividingunit 64 divides components. Theidentification unit 65 identifies a constant region, and identifies a causal structure between molecular markers and a causal structure of a molecular marker and an environmental condition. The inference andcontrol unit 66 infers and controls a cellular state of a cultured cell. -
Fig. 5 is a flowchart illustrating a process of predicting and controlling a cellular state of a cultured cell. Hereinafter, a prediction and control process performed by the biologicalinformation processing device 51 ofFig. 4 will be described with reference toFig. 5 . - In step S31, the
selector 61 selects measurement molecules. - Changing a property involved in cultivation by a cultured cell is a major obstacle in a construction of an evaluation system using a cell or a development of a medicine using a cell as an active ingredient. In a prediction and control of a change in state of a cultured cell, it is possible to perform a formulation with a problem of a state inference of a mesoscale. A state of a mesoscale is expressed by a local extracellular environment formed by a component added in a culture medium and a molecule produced from a cultured cell. As such, in a state prediction and control of a cultured cell, a time series variation of a molecular group produced from a cultured cell and a molecule in a culture medium is measured.
- A molecule produced from a cultured cell includes a molecular group expressed in a cell surface in addition to a secretory cell, but excludes an intracellular information transduction molecule or a transcription factor. As a component in a culture medium, it is useful to measure an amount of IGF-I or insulin. As a molecule produced from a cell, an integrin family molecule, a growth factor including FGF-2, EGF, and PDGF in addition to insulin and IGF-I are useful.
- In step S32, the
measurement unit 62 performs a measurement. - A molecule produced from a cultured cell and a molecule in a culture medium are measured by acquiring a smaller amount of sample when compared to the culture medium. In addition, for a molecule that is acquired by an extracellularly expressed molecule and does not float in a culture medium among molecules produced from a cell, fluorescent labeling is performed on the molecule, and then a quantitative estimation is performed by an image analysis of a cultured cell. In addition, for a molecule that is difficult to be measured, a substitute measurement is performed by a genetic expression of a secretory protein or a membrane protein by using a reporter system within a cell.
- In step S33, the determining
unit 63 determines a measurement interval. - It is preferable that the measurement interval be in a range of about ten minutes to an hour. When a reporter system is used, continuous data is acquired.
- In step S34, the dividing
unit 64 divides components. In addition, in step S35, theidentification unit 65 identifies a constant region. - To extract information from acquired time-series data of a molecular marker, multivariate time series including a molecule produced from a cultured cell and a molecule in a culture medium is treated in a unified manner as a state space model. The state space model includes two submodels of a system model and an observation model. In general, the two submodels are expressed using a conditional probability as follows.
-


- Herein, yn denotes an observed time series of a multivariable, xn denotes a k-dimensional vector that may not be directly measured, and q and r denote a conditional distribution of xn given by xn-1 and of yn given by xn, respectively. In the "biological state space model," xn expresses a state of an actual cultured cell, and yn indicates an expression level of a molecule produced from a cultured cell and a molecule in a culture medium that may be measured. When a distribution of an initial state vector x0 is disposed by p(x0|y0), a prediction of a state of a cultured cell may be formulated by an evaluation of p(xn|yn), that is, obtaining a distribution of xn given by an observed value yn and an initial distribution.
- Time-series data yn of a molecular group produced from a cultured cell may be decomposed into a periodic component using a seasonal adjustment model, an environmental stimulus response component using a multi-linear model, and a baseline component using a polynomial smoothing spline model, respectively, and be extracted. A cell memory of a cultured cell is reflected on an amplitude and a frequency of a periodic component, a maximum expression level of an environmental stimulus response component, and a change of a baseline. Among these, a local constant region associated with an amplitude and a frequency of a periodic component, and a change of a baseline are noted as the "cell memory undergoing a time evolution."
- In step S36, the
identification unit 65 identifies a causal relation between molecular markers. In step S37, theidentification unit 65 identifies a causal structure of a molecular marker and an environmental condition. - A change of an amplitude and a frequency of a periodic component, a change of a baseline, a time change of an artificial component added to a culture medium, and an environmental stimulus response component form direct or indirect causal relation according to a time series. To apply the causal relation to a control of a change in state of a cultured cell, a causal structure is expressed by creating a graph structure associated with a probability structure/causal structure using, as a node, a local constant state of a molecular group in various culture media and a molecular group produced from a cultured cell.
- The graph structure is created based on a conventional biological knowledge, and then upgraded to an optimum graph structure using time-series data. A change of a graph structure is solved as a selection problem of a covariance in regression analysis. A route of a cause and effect of a cultured cell leading to the same change in state may be different depending on origins. As such, an optimum graph structure is determined for each group of a cultured cell having the same causal structure rather than causing the optimum graph structure to converge into one. A change in state characteristic of the "biological state space model" is used for a classification of this group. In addition, a causal structure for an intervention by a change of an environmental condition such as a culture medium component, a cell culture density, an oxygen partial pressure, and a temperature is separately created.
- In step S38, the inference and
control unit 66 infers and controls a cellular state of a cultured cell. - An inference and control of a change in state of a cultured cell may be performed from a causal structure of the past in which a cell originated from the same tissue is cultured in a similar condition. In addition, a control in a direction of obtaining a state of a cell may be performed from a causal structure of a change in state of a cell and a change of an environmental condition such as a culture medium component, a cell culture density, an oxygen partial pressure, and a temperature.
- <Third embodiment>
- Next, a model of a cell that produces a molecule A secreted in the blood is examined. As illustrated in
Fig. 6 , the cell has the following characteristic. - (1) A control is performed by a circadian rhythm in a stationary state.
- (2) An induced expression is generated in response to a stimulus from an environment.
- (3) A positive and negative feedback is received by a repressor R and a receptor of the molecule A.
- (4) An expression is controlled when the repressor R is epigenetically modified.
- A time series variation of the molecule A secreted in the blood from the cell changes as y of A of
Fig. 7 .
Time-series measurement data y(t) is presumed as follows. -

- s(t) : periodic component
- x(t) : environmental stimulus response component
- b(t) : baseline component
- v(t) : observational error
- An environmental stimulus response component x(t) is formulated as a multilinear model as follows.

- In the above Equation, F(t) indicates a conversion function of an output with respect to an environmental stimulus of a cell, and v(t) indicates an environmental stimulus. Regarding a parameter of the conversion function, an optimum value is searched for using an autoregression model.
- A baseline component b(t) is defined as below as a regression model of
degree 2, and is used.
Herein, aj denotes a regression coefficient, and vB(t) denotes a noise component. Then, b(t) is expressed as follows.
- Herein, H(t, t-1) is a 2x2 matrix, and V(t, t-1) is two-dimensional noise. An optimized function is selected so that a baseline is smoothed.
- A periodic component s(t) is based on a circadian rhythm of a 24 hour interval. Thus, when p observed values are obtained during an interval, the periodic component approximately satisfies the following Equation.

When this is expressed using a time delay operator G, the following Equation is approximately satisfied.
- As such, a periodic component of
degree 1 may be formulated as a seasonal adjustment model as below by white noise v(t).
[Equation 3]
- Using this model, the time-series data of y of A of
Fig. 7 is decomposed into a periodic component s, an environmental stimulus response component x, and a baseline component b. Here, i in A ofFig. 7 denotes an induction component. - Next, from a variability characteristic of a baseline, a decomposition is performed into three constant regions of Y1(A), Y2(A), and Y3(A). A cell includes an input from an environment between time k and
time 1, and an environmental stimulus response component of Y2(A) is a direct input with respect to the input. In addition, in this autogenous control model, a time change division Y2(A) of the molecule A is a cause of changing an expression state of a factor A from Y1(A) to Y3(A). As illustrated in B ofFig. 7 , this relation is expressed as a change from Y2(A) to Y3(A) by a graph structure using, as a node, a constant region associated with an expression level change of the molecule A. - In this way, in each embodiment, it is possible to formulate a time evolutional change of a human organism, to predict and control a change of a biological state that may be used for a health management, a disease prediction, a disease radical cure, and the like.
- In addition, it is possible to apply the embodiment to a control of an onset of a chronic disease and a progress of a chronic disease resulting from a long-term lifestyle that may not be treated using a conventional scheme. Further, the embodiment may simultaneously manage commonality and heterogeneity between individuals, and thus is an effective tool for an individual medical care. In addition, the embodiment may control diversification resulting from a time evolution of a cell induced by a cell culture, and be applied to a standardization of a cell evaluation system or a cell therapy.
- <Fourth embodiment>
- Most children born with a low weight as a result of hypogenesis caused by a nutritional insufficiency in the womb grow to catch up the delay by the age of two, thereby having a build of a child born with a standard body weight. When a low caloric diet is received as a diet after the birth, a growth to catch up the delay is inhibited, and a growth may not catch up the delay even with a high caloric diet received after the age of two. When a rapid growth is exhibited to catch up the delay, a risk of observing an insulin resistance in the future increases (Rotteveel, J. et al. European Journal of Endocrinology 158; 899-904, 2008). Even when a build is recovered, a decrease in a differentiation efficiency of a pancreatic β cell changed by epigenetics to adapt to a nutritional environment in the womb, responsiveness of an insulin signal, an appetite level, a stress responsiveness, and the like are not recovered, which is inferred as a cause.
- However, not all low-weight babies, resulting from hypogenesis, exhibiting a growth to catch up the delay undergo an onset of an insulin resistance. An insulin secretory ability, an insulin signal responsiveness, an appetite level, and a stress responsiveness of each individual do not exhibit a rapid change such as a growth to catch up the delay, while being changed by a lifestyle. Thus, by monitoring an amount of insulin in the blood, an amount of leptin in the blood, an amount of glucocorticoid in the blood, a blood-sugar level, an caloric intake, and the like using a scheme of the embodiment, it is possible to predict and control an obesity trend, an insulin resistance onset trend, and the like.
- Specifically, when a relation of caloric intake by eating, an amount of insulin secretion after eating, and a time change of a blood-sugar level is measured and compared each day, it is possible to measure that an amount of production per caloric intake of an insulin secretion, and a change of a strength of insulin responsiveness change from a stationary state to another stationary state. A change of a stationary state may be classified into a change in a direction in which an insulin resistance is improved and a change in a direction in which an insulin resistance is degraded. An increase in an amount of insulin secretion and a strength of insulin responsiveness is a change in an improving direction, and the opposite is a change in a degrading direction.
- Using a scheme of the embodiment, an amount of secretion of glucocorticoid or leptin may be first formulated as a change from a stationary state to another stationary state. When an amount of production of leptin with respect to a predetermined caloric intake is low, a suppression of food intake is reduced, and an obesity trend is increased. When an amount of glucocorticoid is high, an obesity trend and a circulatory system disease onset trend are increased through a plurality of active sites. Thus, a change of a stationary state in a direction in which an amount of secretion of glucocorticoid is decreased and an amount of secretion of leptin is increased is a change in a direction in which an insulin resistance and an onset trend of an associated disease are improved.
- One of characteristics of the embodiment is widely tracking a time change of a molecule within various organisms. Thus, the embodiment may use an insulin secretion, insulin responsiveness, a glucocorticoid secretion, and a leptin secretion to identify an unknown molecule within an organism involved in a change from a stationary state to another stationary state. In addition, by clarifying a relation of a new associated biological molecule and a record of a lifestyle using a scheme of the embodiment, it is possible to propose a new improvement scheme for improving an insulin resistance or obesity.
- <Fifth embodiment>
- An amount of DHEA-S in the blood in which sulfuric acid is added to dehydroepiandrosterone starts to increase at the age of about six to seven, reaches a peak at the age of about twelve to thirteen, maintains the high value until the age of about thirteen to twenty-five, and then linearly decreases with aging, for both sexes. In a long-term follow-up research, a plurality of researches all parts of the world clarify that a DHEA-S value in the blood of a male is inversely correlated with a death rate or an onset of a cardiovascular disease (vol5. No1. 42-46, 2009, antiaging medicine, Toshihiko Yanase). However, currently, it is unclear what decreases an amount of production of DHEA-S. According to the embodiment, a biological molecule associated with changing an amount of DHEA-S secretion from a stationary state to another stationary state, and a lifestyle associated with a change of the biological molecule may be clarified, a new proposal of a scheme of inhibiting a decrease in DHEA-S may be performed.
- <Sixth embodiment>
- A most effective scheme for delaying aging and increasing a life expectancy is a restriction of calories. A restriction of calories is a restriction of calories performed while taking optimum nutrition rather than merely reducing a size of a meal. However, sufficient scientific evidence regarding optimum nutrition or an appropriate caloric restriction level is not present. The embodiment may be used to clarify an optimum nutrition intake level or caloric intake level at an individual level.
- For example, when a restriction of calories is imposed on a patient who is likely to get diabetic, it is possible to measure a time series variation of c-reactive protein (CRP) corresponding to an inflammatory index, and an adiponectin production and an active oxygen production corresponding to an index of a qualitative change of a fat cell. In this way, it may be formulated that a state of a fat cell, an active oxygen stress state, and an inflammatory state change from a stationary state to another stationary state.
- In addition, the embodiment may also be used to identify a new biological molecule associated with a change from the stationary state to another stationary state. A newly discovered time-series record associated with a biological molecule marker and a meal may be used to individually optimize a nutritional intake and a caloric intake.
- <Seventh embodiment>
- A difference in sensitivity to stress induces an onset of depression or suicide entailed by chronic stress. Sensitivity to stress depends on a strength of a negative feedback of a neuron of glucocorticoid responsiveness projected from a hippocampus to an amygdaloid nucleus. In addition, a strength of a negative feedback of the neuron depends on epigenetic modification of a glucocorticoid receptor gene. When a suicide is compared with a control group as to epigenetic modification of the neuron, it is indicated that a person suffering from child abuse or child neglect has a glucocorticoid receptor gene suppressed by epigenetic modification (Hyman, S. Nature Neuroscience Vol. 12, No. 3, 241 243, 2009).
- When a level of sensitivity to stress is identified, it is possible to prevent an onset of depression by quantitatively identifying a person who is likely to undergo an onset of depression, and providing an appropriate environment. When a time series variation of glucocorticoid in the blood is measured at short intervals of about ten minutes using the embodiment, the time series variation may be divided into a daily variation component and a stimulus dependent component. Using the daily variation component, an average amount of secretion of glucocorticoid in the blood at a measurement date may be calculated. In addition, using the stimulus dependent component, a relative strength of a negative feedback may be calculated by measuring a maximum amount of secretion and duration. Accordingly, when the embodiment is applied, it is possible to measure sensitivity to stress, and to track a process in which sensitivity to stress changes with a lifestyle.
- The most notable hypothesis associated with a depression onset mechanism regards, as a cause, a lowering of BDNF (Brain Derived Neurotrophic Factor) which is a neurotrophic factor (Shi, Y. et al. Psychiatry and ). BDNF is produced from pro-BDNF (BDNF precursor) by t-PA (tissue-type plasminogen activator). That is, using the embodiment, it is possible to infer an onset or a curative effect of depression by observing a time series variation of BDNF, pro-BDNF, and t-PA in the blood, and identifying a change from a stationary state to another stationary state. In addition, the embodiment may be used to discover a new biological molecule marker associated with an onset and prevention of depression.
- <Eighth embodiment>
- A chronic overwork such as a nursing care of a partner and psychological stress increases a frequency of an infectious disease, reduces the ability of wound healing, and increases a frequency of high pressure or a liver illness. A biomarker associated with the chronic overwork and psychological stress includes inflammatory cytokine IL-6 (interleukin 6). It is known that IL-6 is associated with a circulatory system disease, an osteoporosis,
type 2 diabetes, cancer, a gum disease, fragile habitus, organ failure, and the like that develop aging dependently. IL-6 is induced to develop through experience entailing depression, negative feelings, and stress. In addition, an increase in IL-6 in the blood with is noticeable in people engaged in nursing care when compared to people not engaged in nursing care (Kiecolt-Glaser JK et al. Proc. Natl. Acad. Sci. USA 100: 9090-9095). As such, by tracking a change in expression level of IL-6, it is possible to predict and prevent an onset of an age-related disease or a stress-related disease. - <Ninth embodiment>
- A human body is an open system, and a future of a body condition is not a mere repetition of the past. A cell memory of the technology may acquire a process in which an organism undergoes a time evolution according to a history only by a measurement of a biological molecule, and formulate the process. To apply this formulated time-based change to an individuated health care, appropriate options of a future lifestyle need to be provided based on diversity and diversification of an individual.
- In addition, DNA-sequence information of individuals inherited from parents is useful for inference of substance of diversity and diversification of the past before initiating a biological state measurement of individuals based on the technology. A current diversity of each individual is formed by hereditary diversification and a lifestyle of the past. As such, by integrating three pieces of environmental information based on cell memory information, DNA polymorphism information, and a lifestyle of a biological molecule undergoing a time evolution of the technology, it is possible to enhance accuracy of a future prediction of health.
- With development of base arrangement technology, it is possible to analyze a full-genome sequence of individuals. From a sequencing analysis, it is possible to detect a single nucleotide polymorphism and structural polymorphism included in individuals. A relation between a genetic diversity and health or illness may be classified into four types of a chromosome anomaly, a monogenic disease, a multifactorial genetic disease, and an idiopathic disease (Thompson & Thompson "Genetic Medicine, Seventh Edition" Medical Science International, 2009).
- A human somatic cell contains 23 pairs, 46 chromosomes, and 22 pairs among them are autosomal chromosomes excluding a difference between the sexes. A remaining pair is referred to as a sex chromosome. A female has two X chromosomes, and a male has an X chromosome and a Y chromosome. An onset frequency of a chromosomal abnormality is high, and about six new born babies per every 1,000 new born babies are affected. Among chromosomal abnormalities, an abnormality corresponding to an increased number of chromosomes frequently occurs. When the number of chromosomes increases by one, it is referred to as trisomy. For example, trisomy 21 causes a disease called Down syndrome. About one of every 800 people is born with Down syndrome.
- A frequency at which a baby is born with Down syndrome exponentially increases with an age of a mother, and about 1% of babies are born with Down syndrome when the age is 45 or more. A main issue of Down syndrome is a mental retardation. However, furthermore, a risk of leukemia increases, and a lot of patients with Down syndrome develop dementia of the Alzheimer type after the age of 40. 90% of causes of trisomy 21 are included in a process of a reduction division that forms an egg of a mother. As such, a trisomy 21 abnormality occurs from a moment of the fertilization. However, a symptom occurs in various periods, and a "time delay" is included between a formation of a hereditary cause and an onset of illness.
- A monogenic disease is a disease that develops as a result of genomic mutation of a gene, and is referred to as a Mendelian disorder. So far, 3917 types of Mendelian disorders are being reported. A mode of inheritance includes a dominant mode and a recessive mode. A dominant mode is a mode of inheritance that develops only by inheriting a genetic mutation from one of a mother and a father. A partially recessive mode indicates a mode of inheritance that develops only when a genetic mutation is inherited from both parents. It is known that a monogenic disease is realized by 2% of a group at a time of life.
- A monogenic disease is a disease that mostly develops during childhood. However, about less than 10% of monogenic diseases experience symptoms after puberty. Further, 1% or less may experience symptoms later in life after the end of the reproductive years. Regardless of a period in life in which a symptom starts, a "time delay" is observed between an acquisition of variation and an onset of symptoms.
- A disease observed at birth such as a congenital anomaly, and a chronic disease that develops at a middle age such as cardiac infarction, cancer, diabetes, rheumatism, a mental disease, dementia, and the like are referred to as a multifactorial disorder. A frequency at which this type of disease appears at birth is about 50 people per every 1,000 people. However, since a lot of people are affected by a chronic disease, it is about 600 people per every 1,000 people when seen from a group. A plurality of genetic factors combines for an onset, in which a regular exposure or a chance exposure to a particular environmental factor is considered to be involved. A genetic influence of this multifactorial disorder is analyzed by a scheme referred to as a genome-wide association study (GWAS).
- An idiopathic disease is positioned between a mendelian genetic variation and a multifactorial disorder. Parkinson's disease or Alzheimer's disease is included in an idiopathic disease in addition to a familial disease. Unlike a multifactorial disorder, an individual genome sequence analysis needs to be used to identify this sporadic variation.
- For any of a chromosome anomaly, a mendelian monogenic disease, a multifactorial disease, and an idiopathic disease, a time delay is included between an acquisition of variation and an onset. In addition, it is inappropriate to describe that a plurality of environmental factors causes a disease to develop as an instant responsive reaction. A "time delay" is included between a point in time when a hereditary factor and an environmental factor are included and a point in time when a disease develops. That is, a hereditary factor and an environmental factor create a potential change in an organism as a cell memory, which is actualized as a symptom when the hereditary factor and the environmental factor form a combination.
- A cell memory is acquired when a change of an environmental condition is added to genetic polymorphism, and thus quantitatively recording an environmental condition is effective for a future prediction of health. Among environmental conditions, an exterior environment such as stress, a diet habit, an exercise habit, an infection history, and a cure history may be quantitatively measured.
- Stress is recognized when individuals do not adapt to the environment, and feeling stress is different between people for the same environmental condition. Thus, stress may not be identified only from an environmental condition. It is effective to record stress by, for example, a Daily Reconstruction Method (DRM scheme) (Kahneman D, Krueger AB, Schkade DA, Schwarz N, Stone AA. "A survey method for characterizing daily life experience: the day reconstruction method. " Science. 306: 1776-1780, 2004).
- This scheme divides an event of a day into 24 degrees, and records respective mental positive and negative values. In this way, it is possible to identify a stress coping circumstance at each moment. By continuing the recording, stress may be classified into a short term stress of about several hours to a day, a medium-term stress of about several days to a month, and a long term stress of over several months.
- With regard to a diet habit, by recording content of meals divided into cooking ingredients, it is possible to record an amount of intake of calorie, a carbohydrate ratio, a protein ratio, a type and amount of fat, vitamin, phytochemical, trace metal (iron, zinc, copper, cobalt, iodine, selenium, manganese, molybdenum, chrome, boron, and vanadium), drinking (alcohol), and the like.
- With regard to an amount of exercise, it is possible to automatically measure a quality or quantity of walking and running using a portable device including an acceleration sensor.
- An infection history or a cure/dosing history may be identified by electronic chart data of a private medical doctor. In addition, a Chinese medicine or a general medicine taken by an individual may be recorded by the individual.
- As described in the foregoing, a genetic diversity of individuals may be classified using a single nucleotide polymorphism and a structural polymorphism of DNA which is a cause of a chromosome anomaly, a monogenic disease, a multifactorial genetic disease, and an idiopathic disease. It is possible to quantitatively record a time-based change of an environmental condition using a stress state, an intake ingredient taken by a meal, an amount of exercise, an infection history, a cure/dosing history.
- To integrate three pieces of environmental information based on cell memory information, DNA polymorphism information, and a lifestyle of a biological molecule undergoing a time evolution of the technology, a relation among three small groups below is clarified using a conditional probability. The three small groups are a small group divided based on a genetic diversity, a small group divided based on a change of an environmental condition, and a small group divided based on cell memory information of a biological molecule. The small group divided based on a genetic diversity is a group based on a genetic diversity of a single nucleotide polymorphism and a structural polymorphism of DNA which is a cause of a chromosome anomaly, a monogenic disease, a multifactorial genetic disease, and an idiopathic disease. The small group divided based on a change of an environmental condition is a group based on an environmental condition such as a stress state, a diet habit, an exercise habit, an infection history, a cure/dosing history. The small group divided based on cell memory information of a biological molecule is a group based on a change of a biological state represented by
Fig. 3 produced from a process illustrated in the flowchart ofFig. 2 . - As illustrated in
Fig. 8 , the relation of a conditional probability of a group may be broadly classified into the following three relations. - i) Relation between a genetic diversity and an environmental condition
- ii) Relation between an environmental condition and a biological state
- iii) Relation between a genetic diversity and a biological state
- Applying the technology to an individuated health care is providing options of the future to maintain health based on data of a cell memory of the past of a subject of a health care indicated as a causal relation between constant regions of an expression level of a molecule of an organism. A scheme of identifying options of the future include referring to a record of a lifestyle of another person (that is, a person other than a subject) synthetically having a history similar to that of the subject such as a history of gene information, a history of an environmental condition, and a history of a biological state. This scheme may be implemented by clarifying a similarity in a correlation among cell memory information of a biological molecule of individuals, gene information such as DNA polymorphism information, and environmental information based on a lifestyle illustrated in
Fig. 8 . - The similarity of data may be determined by applying a conventional clustering method. The clustering method may be broadly classified into a division type clustering and a hierarchal clustering. Specifically, it is possible to apply a scheme described in A. K. Jain, M.N. Murthy and P.J. Flynn, Data Clustering: A Review, ACM Computing Reviews, (1999) or Ying Zhao and George Karypis, "Hierarchical Clustering Algorithms for Document Datasets", Data Min. Knowl. Discov. 10(2): pp.141-168 (2005).
- When a process of the embodiment is performed, a biological
information processing device 101 is configured as illustrated inFig. 9 . The biologicalinformation processing device 101 includes aselector 111, a determiningunit 112, ameasurement unit 113, acreation unit 114, adividing unit 115, anidentification unit 116, adetector 117, a search unit 118, adatabase 119, and an inference andcontrol unit 120. Functions of theselector 111, the determiningunit 112, themeasurement unit 113, thecreation unit 114, the dividingunit 115, theidentification unit 116, and the inference andcontrol unit 120 are basically similar to functions of theselector 11, the determiningunit 12, themeasurement unit 13, thecreation unit 14, the dividingunit 15, theidentification unit 16, and the inference andcontrol unit 17 illustrated inFig. 1 . As such, description may be repeated, and thus will be provided. - The
detector 117 detects gene information. The search unit 118 searches for a similar history from thedatabase 119. - The
database 119 stores information of multiple individuals by classifying the information into any one of the three small groups described above with reference toFig. 8 . That is, information of examination results of multiple people obtained by performing the process ofFig. 2 described in the foregoing is stored. In addition, in this instance, a measurement/examination for obtaining information used to determine one of the three small groups to be classified into is added. Specifically, a measurement/examination that specifies a genetic diversity of a single nucleotide polymorphism and a structural polymorphism of DNA is added in addition to a measurement/examination of an environmental condition such as a stress state, a diet habit, an exercise habit, an infection history, a cure/dosing history, and a measurement/examination of cell memory information of a biological molecule. - This process of the embodiment is illustrated in a flowchart of
Fig. 10 . Hereinafter, the process of the embodiment will be described with reference toFig. 10 . - In step S101, a database formation process is performed. That is, the process illustrated in the flowchart of
Fig. 2 is performed on multiple individuals concurrently with a measurement/examination that specifies a genetic diversity of a single nucleotide polymorphism and a structural polymorphism of DNA of each individual, and a result is stored in thedatabase 119. However, information is stored in a form of concealing privacy of individuals. - As described in the foregoing, the information stored in the
database 119 is classified into a group based on a genetic diversity, a group based on a change of an environmental condition, and a group based on cell memory information of a biological molecule. Then, three relations below of each group are analyzed using a conditional probability. - i) Relation between a genetic diversity and an environmental condition
- ii) Relation between an environmental condition and a biological state
- iii) Relation between a genetic diversity and a biological state
- For convenience of description, the database formation process is described as
step 1 of a health state prediction process of the flowchart ofFig. 10 . However, when a database is previously generated using a scheme and is present, the database may be used. In this case, the database formation process may be skipped. - Processes of step S102 through S109 of
Fig. 10 are basically similar to step S1 through step S8 ofFig. 2 . Description will be briefly made since it is repeated. That is, in step S102, theselector 111 selects measurement molecules of a subject of a health care. In step S103, the determiningunit 112 determines a molecule measurement interval. In step S104, themeasurement unit 113 measures the measurement molecules, selected in a process of step S102, at the molecule measurement interval determined in step S103. - In step S105, the
creation unit 114 creates a time-series variation graph. That is, a graph is created based on Equation (5) through (11) described above. In addition, in step S106, the dividingunit 115 divides components. That is, using a biological state space model, time-series data is divided into a periodic component, an environmental stimulus response component, and a baseline component. - In step S107, the
identification unit 116 identifies a constant region. That is, a constant region is identified using an "organism local constant model." In step S108, theidentification unit 16 identifies a causal relation. That is, a causal relation between constant regions of each molecule is created. A dynamic construction model may be used to identify the causal relation. - In step S109, the
identification unit 116 identifies a causal relation of molecular markers and a relation with an external environment. That is, a causal relation between respective molecules, and a relation with an environment are created. A measurement value of a time series variation of a lifestyle may be used as an external environment. Measurement values are input by the subject, or are input by a measurement device, and the like. - Through the processes above, environmental information and cell memory information of an organism of the subject are obtained.
- In step S110, the
detector 117 detects DNA polymorphism. That is, thedetector 117 detects a single nucleotide polymorphism and a structural polymorphism as gene information of a gene included in the subject of a health care. - When a history of the subject is obtained as described in the foregoing, the search unit 118 searches for a history of another person similar to the history of the subject from information stored in the
database 119 in step S111. That is, as described in the foregoing, a similarity in a correlation among cell memory information of a biological molecule of individuals, gene information such as DNA polymorphism information, and environmental information based on a lifestyle is determined, and a most similar history is searched for. - A search for a similar history will be described with reference to
Figs. 11 and12 . For example, as illustrated inFig. 11 , it is presumed that five blood molecules A through E of a subject of a health are selected depending on an intention, and are measured. Similarly to a case inFig. 3 ,Fig. 11 is a diagram illustrating a model associated with a causal relation using four constant regions y11, through y14 of the five blood molecules A, B, C, D, and E as nodes. Yi(A) through Yi(E) denote nodes of the constant regions yi (i = 11, 12 ,13, and 14) of the blood molecules A through E, respectively, and x10 through x14 denote states of an organism. The states x10 and x11 denote a health state, the states x12 and x13 denote a symptom non-onset state, and the state x14 denotes a symptom onset state. A number indicates a passage of time in a direction from a small value to a large value, and a lifestyle of the subject is recorded in the order. - The node Y14(A) and the node Y14(D) are causes, and markers that replace a state of a disease. The node Y13(A) and the node Y13(C) affect an induction of the node Y14(A), and the node Y13(E) affects an induction of the node Y14(D) Similarly, the nodes Y12(C), Y12(A), and Y12(D) affect an induction of the nodes Y13(A), Y13(C), and Y13(E), respectively. Further, the nodes Y11(A), Y11(B), and Y11(D) affect an induction of the nodes Y12(A), Y12(C), and Y12(D), respectively.
- When a case in which a cell memory is introduced is denoted by a sign +, and a case in which a cell memory is not introduced in denoted by a sign - in each constant region, a history of a cell memory of a subject in
Fig. 11 may be expressed as a matrix ofFig. 12 . The sign + and the sign - ofFig. 12 correspond to states of the nodes Y11(A) through Y14(E) ofFig. 11 , respectively. - Further, it is presumed that five types of associated molecules G(A) through G(E) are detected as gene information of a gene associated with the blood molecules A through E. When n types of diversities in each gene are included in a compared group from a result of a genome analysis, the group may be classified into n! x5 (! denotes factorial) small groups (group illustrated in the left frame in
Fig. 11 ) from genome information. - When a search for a similar history is executed, data is first classified into small groups according to genome information, and then approximate data is selected from a homogeny of the matrix illustrated in
Fig. 12 . When a homogeny is the highest, all items of the matrix match one another. When it is partially approximate, proximity is ranked according to a size. Since a record of a lifestyle is attached to data of a matrix, a subject may select a future lifestyle with reference to similar lifestyle information of another person. - In step S112, the inference and
control unit 120 infers and controls a state change. That is, a future change in a state of an organism of a subject is inferred, and an intervention scheme including a prevention scheme is proposed. - A simplest proposal is to present a search result of step S111 to a subject. That is, in a search process of step S111, a history of another person similar to a history of a subject is searched for. When the other searched person has a disease or an illness, the subject is highly likely to have a similar disease or illness. Thus, for example, the subject may prevent the similar disease or illness by changing a lifestyle so that an environmental condition is different from that of the other person.
- Furthermore, further options for maintaining health of the subject may be actively constructed and provided. For example, among environmental conditions such as stress, a diet habit, an exercise habit, an infection history, and a cure history, it may be suggested that an element having a strong causal relation is specified, and the element is changed. Further, when a factor associated with a gene may be changed, the change may be suggested.
- As described in the foregoing, by searching for information of an organism of a person other than a subject similar to cell memory information, environmental information, and gene information of the subject of a health case, it is possible to reliably obtain appropriate information for maintaining health of the subject.
- In this specification, a step describing a process of a flowchart includes a process executed in parallel or individually even though the process is not a time series process in addition to a process executed in a time series manner according to an order.
- In addition, embodiments of the technology are not limited to the embodiments described above, and may be variously changed within a scope not departing from the spirit of the technology. For example, two or more arbitrary embodiments may be combined together.
-
1 Biological information processing device 11 Selector 12 Determining unit 13 Measurement unit 14 Creation unit 15 Dividing unit 16 Identification unit 17 Inference and control unit 51 Biological information processing device 61 Selector 62 Measurement unit 63 Determining unit 64 Dividing unit 65 Identification unit 66 Inference and control unit
Claims (16)
- A biological information processing method comprising the steps of:measuring an expression level of molecules in an organism over a specific time interval;dividing measured time-series data into a periodic component, an environmental stimulus response component and a baseline component;identifying constant regions of the time-series data from variations in the baseline component or from the amplitude or periodic variations of the periodic component, and identifying causal relation between the identified constant regions; andinferring changes in the state of the organism from the identified causal relation between the constant regions.
- The biological information processing method according to claim 1,
wherein the identifying step comprises further identifying the relation between changes in the state of the organism and the external environment, and
the inferring step comprises further inferring disease onset in the organism from the identified relation between changes in the state of the organism and the external environment. - The biological information processing method according to claim 1, wherein the measuring step comprises measuring the molecules representing a general state, a local state, and a chromosome state.
- The biological information processing method according to claim 1, wherein the molecules are blood molecules of the organism.
- The biological information processing method according to claim 1, wherein the molecules are molecules associated with metabolic syndrome.
- The biological information processing method according to claim 1, wherein the molecules are molecules in a culture medium.
- A biological information processing device comprising:a measurement unit that measures an expression level of molecules in an organism over a specific time interval;a dividing unit that divides measured time-series data into a periodic component, an environmental stimulus response component and a baseline component;an identification unit that identifies constant regions of the time-series data from variations in the baseline component or from the amplitude or periodic variations of the periodic component, and identifies causal relation between the identified constant regions; andan inference unit that infers changes in the state of the organism from the identified causal relation between the constant regions.
- A recording medium having recorded therein a program that causes a computer to execute the steps of:measuring an expression level of molecules in an organism over a specific time interval;dividing measured time-series data into a periodic component, an environmental stimulus response component and a baseline component;identifying constant regions of the time-series data from variations in the baseline component or from the amplitude or periodic variations of the periodic component, and identifying causal relation between the identified constant regions; andinferring changes in the state of the organism from the identified causal relation between the constant regions.
- A program that causes a computer to execute the steps of:measuring an expression level of molecules in an organism over a specific time interval;dividing measured time-series data into a periodic component, an environmental stimulus response component and a baseline component;identifying constant regions of the time-series data from variations in the baseline component or from the amplitude or periodic variations of the periodic component, and identifying causal relation between the identified constant regions; andinferring changes in the state of the organism from the identified causal relation between the constant regions.
- A biological information processing method comprising the steps of:acquiring cell memory information of a biological molecule of an organism of a subject;acquiring environmental information associated with an environmental condition of the organism of the subject;acquiring gene information associated with a gene sequence included in the organism of the subject; andsearching for similar information of an organism of a person other than the subject associated with the acquired cell memory information, environmental information, and gene information.
- The biological information processing method according to claim 10, wherein the gene information is a single nucleotide polymorphism and a structural polymorphism.
- The biological information processing method according to claim 11, wherein the searching is performed based on similarity in a correlation among the cell memory information, the environmental information, and the gene information.
- The biological information processing method according to claim 12, wherein the step of acquiring cell memory information includes the steps of:measuring an expression level of molecules in an organism of the subject over a specific time interval;dividing measured time-series data into a periodic component, an environmental stimulus response component and a baseline component; andidentifying constant regions of the time-series data from variations in the baseline component or from the amplitude or periodic variations of the periodic component, and identifying causal relation between the identified constant regions.
- A biological information processing device comprising:a cell memory information acquisition unit that acquires cell memory information of a biological molecule of an organism of a subject;an environmental information acquisition unit that acquires environmental information associated with an environmental condition of the organism of the subject;a gene information acquisition unit that acquires gene information associated with a gene sequence included in the organism of the subject; anda search unit that searches for similar information of another organism associated with the acquired cell memory information, environmental information, and gene information.
- A recording medium having recorded therein a program that causes a computer to execute the steps of:acquiring cell memory information of a biological molecule of an organism of a subject;acquiring environmental information associated with an environmental condition of the organism of the subject;acquiring gene information associated with a gene sequence included in the organism of the subject; andsearching for similar information of another organism associated with the acquired cell memory information, environmental information, and gene information.
- A program that causes a computer to execute the steps of:acquiring cell memory information of a biological molecule of an organism of a subject;acquiring environmental information associated with an environmental condition of the organism of the subject;acquiring gene information associated with a gene sequence included in the organism of the subject; andsearching for similar information of another organism associated with the acquired cell memory information, environmental information, and gene information.
Applications Claiming Priority (3)
| Application Number | Priority Date | Filing Date | Title |
|---|---|---|---|
| JP2010153388 | 2010-07-05 | ||
| JP2011019632A JP5838557B2 (en) | 2010-07-05 | 2011-02-01 | Biological information processing method and apparatus, and recording medium |
| PCT/JP2011/064743 WO2012005138A1 (en) | 2010-07-05 | 2011-06-28 | Organism data processing method and device, storage medium and program |
Publications (3)
| Publication Number | Publication Date |
|---|---|
| EP2592142A1 true EP2592142A1 (en) | 2013-05-15 |
| EP2592142A4 EP2592142A4 (en) | 2016-09-28 |
| EP2592142B1 EP2592142B1 (en) | 2020-08-05 |
Family
ID=45441121
Family Applications (1)
| Application Number | Title | Priority Date | Filing Date |
|---|---|---|---|
| EP11803473.5A Active EP2592142B1 (en) | 2010-07-05 | 2011-06-28 | Organism data processing method and device, storage medium and program |
Country Status (11)
| Country | Link |
|---|---|
| US (2) | US10303845B2 (en) |
| EP (1) | EP2592142B1 (en) |
| JP (1) | JP5838557B2 (en) |
| KR (1) | KR101919623B1 (en) |
| CN (2) | CN102959081A (en) |
| AU (1) | AU2011275061B2 (en) |
| CA (1) | CA2800461A1 (en) |
| MX (1) | MX338056B (en) |
| SG (1) | SG186352A1 (en) |
| TW (1) | TWI454957B (en) |
| WO (1) | WO2012005138A1 (en) |
Families Citing this family (23)
| Publication number | Priority date | Publication date | Assignee | Title |
|---|---|---|---|---|
| US9811504B1 (en) * | 2013-11-08 | 2017-11-07 | Michael Epelbaum | Lifespan in multivariable binary regression analyses of mortality and survivorship |
| WO2015071968A1 (en) * | 2013-11-13 | 2015-05-21 | 株式会社日立製作所 | Analysis system |
| KR101445243B1 (en) * | 2014-03-28 | 2014-09-29 | 서울대학교산학협력단 | Early diagnosis of obesity-related diseases using changes in the gut microbial community structure and function |
| US10127361B2 (en) | 2014-03-31 | 2018-11-13 | Elwha Llc | Quantified-self machines and circuits reflexively related to kiosk systems and associated food-and-nutrition machines and circuits |
| US9922307B2 (en) | 2014-03-31 | 2018-03-20 | Elwha Llc | Quantified-self machines, circuits and interfaces reflexively related to food |
| US10318123B2 (en) | 2014-03-31 | 2019-06-11 | Elwha Llc | Quantified-self machines, circuits and interfaces reflexively related to food fabricator machines and circuits |
| US20170332908A1 (en) * | 2014-11-25 | 2017-11-23 | Sony Corporation | Communication device, communication method, and program |
| WO2017022312A1 (en) * | 2015-08-06 | 2017-02-09 | 新日鉄住金ソリューションズ株式会社 | Information processing device, information processing system, information processing method, and program |
| JP6787561B2 (en) * | 2016-04-18 | 2020-11-18 | 学校法人 工学院大学 | Information processing equipment, methods, and programs |
| CN107944222B (en) * | 2016-10-13 | 2020-04-14 | 中南大学 | Method for detecting case occurrence time by using correlation between DNA methylation level in human peripheral blood and biorhythm |
| CN107832586B (en) * | 2017-11-08 | 2021-11-16 | 中山大学 | Three-body combination genetic relationship identification method and device |
| JP6586184B2 (en) | 2018-03-13 | 2019-10-02 | 株式会社日立製作所 | Data analysis support device and data analysis support method |
| JP7215682B2 (en) * | 2019-09-09 | 2023-01-31 | aiwell株式会社 | Information processing system and program |
| WO2021081393A1 (en) * | 2019-10-24 | 2021-04-29 | Unm Rainforest Innovations | Accelerated evolution and restructuring techniques for developing evolved structures |
| CN110970116B (en) * | 2019-12-05 | 2023-09-01 | 吉林省蒲川生物医药有限公司 | Traditional Chinese medicine pharmacological mechanism analysis method based on transcriptome |
| JP7325755B2 (en) * | 2020-01-21 | 2023-08-15 | 本田技研工業株式会社 | Information processing device, information processing method and program |
| RU2744150C1 (en) * | 2020-07-17 | 2021-03-03 | Федеральное государственное автономное образовательное учреждение высшего образования "Крымский федеральный университет имени В.И. Вернадского" (ФГАОУ ВО "КФУ им. В.И. Вернадского") | A method for assessing the long-term effectiveness of using a hardware-software complex for the rehabilitation of children with cerebral palsy |
| CN111986814B (en) * | 2020-08-21 | 2024-01-16 | 南通大学 | Modeling method of lupus nephritis prediction model of lupus erythematosus patient |
| WO2023059331A1 (en) * | 2021-10-08 | 2023-04-13 | Nippon Telegraph And Telephone Corporation | Learning apparatus, analysis apparatus, learning method, analysis method, and program |
| JP7458618B2 (en) | 2022-01-27 | 2024-04-01 | ダイキン工業株式会社 | Systems, methods, and programs for quantifying the effects of state changes on a subject |
| KR20230116427A (en) | 2022-01-28 | 2023-08-04 | 주식회사 남전사 | Module and modem possible Summation measuring of metering |
| CN114451869B (en) * | 2022-04-12 | 2022-07-08 | 深圳市心流科技有限公司 | Sleep state evaluation method and device, intelligent terminal and storage medium |
| CN115631834B (en) * | 2022-12-23 | 2023-05-05 | 北京馐圣医学技术有限公司 | Communication method of blood scalar wave image |
Family Cites Families (32)
| Publication number | Priority date | Publication date | Assignee | Title |
|---|---|---|---|---|
| US6558952B1 (en) * | 1992-12-14 | 2003-05-06 | Waratah Pharmaceuticals, Inc. | Treatment for diabetes |
| FI118509B (en) | 1996-02-12 | 2007-12-14 | Nokia Oyj | A method and apparatus for predicting blood glucose levels in a patient |
| EP1019731B1 (en) * | 1997-07-17 | 2006-03-08 | Primus Corporation | High speed chromatographic method for hemoglobin variants screening and quantification of hemoglobins a 2? and f |
| ATE246356T1 (en) | 1998-05-13 | 2003-08-15 | Cygnus Therapeutic Systems | DEVICE FOR PREDICTING PHYSIOLOGICAL MEASUREMENTS |
| JP3340424B2 (en) | 2000-10-25 | 2002-11-05 | 株式会社日立製作所 | Gene sequence expression system and recording medium |
| US20030165864A1 (en) * | 2001-01-16 | 2003-09-04 | Lasek Amy W. | Genes regulated by DNA methylation in tumor cells |
| CA2439854A1 (en) | 2001-03-01 | 2002-09-12 | Epigenomics Ag | Method for the development of gene panels for diagnostic and therapeutic purposes based on the expression and methylatoin status of the genes |
| CA2440035A1 (en) | 2001-03-05 | 2002-09-12 | Gene Logic, Inc. | A system and method for managing gene expression data |
| EP1502222A2 (en) | 2001-07-02 | 2005-02-02 | Epigenomics AG | A distributed system for epigenetic based prediction of complex phenotypes |
| US20040162678A1 (en) * | 2001-08-13 | 2004-08-19 | Donald Hetzel | Method of screening for disorders of glucose metabolism |
| JP2003067499A (en) | 2001-08-22 | 2003-03-07 | Mitsubishi Chemicals Corp | Medical check method and system, server and terminal for the system, and program for the system |
| EP1436611A4 (en) | 2001-09-26 | 2007-04-11 | Gni Kk | Biological discovery using gene regulatory networks generated from multiple-disruption expression libraries |
| JP2005521929A (en) | 2002-03-29 | 2005-07-21 | ジェノマティカ・インコーポレイテッド | Human metabolic models and methods |
| US20060024684A1 (en) * | 2002-10-01 | 2006-02-02 | Epigenomics Ag | Prognostic markers for prediction of treatment response and/or survival of breast cell proliferative disorder patients |
| CA2507189C (en) | 2002-11-27 | 2018-06-12 | Sequenom, Inc. | Fragmentation-based methods and systems for sequence variation detection and discovery |
| US20040122708A1 (en) * | 2002-12-18 | 2004-06-24 | Avinash Gopal B. | Medical data analysis method and apparatus incorporating in vitro test data |
| CN1842356B (en) * | 2003-06-24 | 2011-05-04 | 康奥尼斯有限公司 | Apparatus and method for bioelectric stimulation, healing acceleration, pain relief, or pathogen devitalization |
| JP2005135154A (en) | 2003-10-30 | 2005-05-26 | Hitachi Ltd | Method for predicting gene ontology term based on sequence similarity |
| JP2005224238A (en) | 2004-02-10 | 2005-08-25 | Epigenomics Ag | Prognosis diagnosing marker for predicting treatment response and/or survival time of patient suffering from mammary cell growth disorder |
| JP4611372B2 (en) * | 2004-02-26 | 2011-01-12 | ダイアベティス ツールズ スウェーデン アーベー | Metabolic monitoring, method and apparatus for displaying conditions related to the health of a subject |
| JP4795666B2 (en) | 2004-10-29 | 2011-10-19 | 株式会社東芝 | Health care support device and health care support program |
| JP2007052766A (en) * | 2005-07-22 | 2007-03-01 | Mathematical Systems Inc | Pathway display method, information processing device, and pathway display program |
| US7904144B2 (en) * | 2005-08-02 | 2011-03-08 | Brainscope Company, Inc. | Method for assessing brain function and portable automatic brain function assessment apparatus |
| JP5024583B2 (en) | 2005-09-14 | 2012-09-12 | ソニー株式会社 | Information processing apparatus and information processing method, information processing system, program, and recording medium |
| US8795170B2 (en) * | 2005-11-29 | 2014-08-05 | Venture Gain LLC | Residual based monitoring of human health |
| JP5266221B2 (en) | 2006-08-08 | 2013-08-21 | コーニンクレッカ フィリップス エレクトロニクス エヌ ヴィ | Method and apparatus for monitoring physiological parameters |
| US20080214919A1 (en) | 2006-12-26 | 2008-09-04 | Lifescan, Inc. | System and method for implementation of glycemic control protocols |
| GB0700374D0 (en) * | 2007-01-09 | 2007-02-14 | Oncomethylome Sciences S A | NDRG family methylation markers |
| KR101347008B1 (en) * | 2007-06-27 | 2014-01-02 | 에프. 호프만-라 로슈 아게 | System and method for developing patient specific therapies based on modeling of patient physiology |
| JP5181741B2 (en) | 2008-03-10 | 2013-04-10 | 株式会社デンソー | Biological information generation apparatus and biological information management system |
| SG177937A1 (en) * | 2008-03-26 | 2012-02-28 | Theranos Inc | Methods and systems for assessing clinical outcomes |
| JP5365199B2 (en) * | 2009-01-06 | 2013-12-11 | ソニー株式会社 | Method, information processing apparatus, and program for evaluating lifestyle |
-
2011
- 2011-02-01 JP JP2011019632A patent/JP5838557B2/en active Active
- 2011-06-28 WO PCT/JP2011/064743 patent/WO2012005138A1/en active Application Filing
- 2011-06-28 MX MX2012014926A patent/MX338056B/en active IP Right Grant
- 2011-06-28 CN CN2011800325934A patent/CN102959081A/en active Pending
- 2011-06-28 US US13/704,940 patent/US10303845B2/en active Active
- 2011-06-28 AU AU2011275061A patent/AU2011275061B2/en not_active Ceased
- 2011-06-28 EP EP11803473.5A patent/EP2592142B1/en active Active
- 2011-06-28 KR KR1020127033602A patent/KR101919623B1/en active IP Right Grant
- 2011-06-28 CN CN202110373287.2A patent/CN113113077A/en active Pending
- 2011-06-28 CA CA2800461A patent/CA2800461A1/en not_active Abandoned
- 2011-06-28 TW TW100122716A patent/TWI454957B/en not_active IP Right Cessation
- 2011-06-28 SG SG2012092086A patent/SG186352A1/en unknown
-
2019
- 2019-04-08 US US16/377,680 patent/US11710535B2/en active Active
Also Published As
| Publication number | Publication date |
|---|---|
| TW201229802A (en) | 2012-07-16 |
| JP5838557B2 (en) | 2016-01-06 |
| US10303845B2 (en) | 2019-05-28 |
| AU2011275061B2 (en) | 2014-09-25 |
| MX2012014926A (en) | 2013-05-20 |
| KR20130094730A (en) | 2013-08-26 |
| JP2012030038A (en) | 2012-02-16 |
| CN102959081A (en) | 2013-03-06 |
| MX338056B (en) | 2016-04-01 |
| US20190237164A1 (en) | 2019-08-01 |
| EP2592142A4 (en) | 2016-09-28 |
| TWI454957B (en) | 2014-10-01 |
| US20130110409A1 (en) | 2013-05-02 |
| SG186352A1 (en) | 2013-01-30 |
| KR101919623B1 (en) | 2018-11-16 |
| CN113113077A (en) | 2021-07-13 |
| EP2592142B1 (en) | 2020-08-05 |
| WO2012005138A1 (en) | 2012-01-12 |
| AU2011275061A1 (en) | 2013-01-10 |
| CA2800461A1 (en) | 2012-01-12 |
| US11710535B2 (en) | 2023-07-25 |
Similar Documents
| Publication | Publication Date | Title |
|---|---|---|
| US11710535B2 (en) | Biological information processing method and device, recording medium and program | |
| JP6620951B2 (en) | Biological information processing apparatus and method, and program | |
| Bernard et al. | Cortisol production patterns in young children living with birth parents vs children placed in foster care following involvement of Child Protective Services | |
| Loas et al. | Relationships between anhedonia, alexithymia, impulsivity, suicidal ideation, recent suicide attempt, C-reactive protein and serum lipid levels among 122 inpatients with mood or anxious disorders | |
| Apter-Levi et al. | Maternal depression across the first years of life compromises child psychosocial adjustment; relations to child HPA-axis functioning | |
| Cacioppo et al. | Social neuroscience: Progress and implications for mental health | |
| Mensah et al. | Early puberty and childhood social and behavioral adjustment | |
| Sutin et al. | Personality and obesity across the adult life span. | |
| Ionio et al. | Paths of cognitive and language development in healthy preterm infants | |
| Özdemir et al. | Precision nutrition 4.0: A big data and ethics foresight analysis—Convergence of agrigenomics, nutrigenomics, nutriproteomics, and nutrimetabolomics | |
| Mervis et al. | Longitudinal assessment of intellectual abilities of children with Williams syndrome: multilevel modeling of performance on the Kaufman Brief Intelligence Test—Second Edition | |
| Knupp et al. | Parental perception of comorbidities in children with Dravet syndrome | |
| Mash et al. | Associations between interoceptive cognition and age in autism spectrum disorder and typical development | |
| De Smedt et al. | Coping with adverse drug events in patients with heart failure: Exploring the role of medication beliefs and perceptions | |
| Luo et al. | Recent advances in psychoradiology | |
| Ordonana et al. | Biological pathways and genetic mechanisms involved in social functioning | |
| Thompson et al. | Does specific psychopathology predict development of psychosis in ultra high-risk (UHR) patients? | |
| Uchino et al. | A cross-sectional analysis of the association between perceived network social control and telomere length. | |
| Weyn et al. | Individual differences in environmental sensitivity at physiological and phenotypic level: Two sides of the same coin? | |
| Sinderberry et al. | Subtypes in 22q11. 2 deletion syndrome associated with behaviour and neurofacial morphology | |
| Marques et al. | Increased sleep predicts annual decreases in psychological distress: Results from a 6-year longitudinal panel sample | |
| Simpson-Yap et al. | Prospective associations of better quality of the diet with improved quality of life over 7.5 years in people with multiple sclerosis | |
| Orellana et al. | Childhood maltreatment influences adult brain structure through its effects on immune, metabolic and psychosocial factors | |
| Ford et al. | Functional maturation in visual pathways predicts attention to the eyes in infant rhesus macaques: Effects of social status | |
| Peña et al. | Network analysis of frailty and aging: Empirical data from the MexicanHealth and Aging Study |
Legal Events
| Date | Code | Title | Description |
|---|---|---|---|
| PUAI | Public reference made under article 153(3) epc to a published international application that has entered the european phase |
Free format text: ORIGINAL CODE: 0009012 |
|
| 17P | Request for examination filed |
Effective date: 20121213 |
|
| AK | Designated contracting states |
Kind code of ref document: A1 Designated state(s): AL AT BE BG CH CY CZ DE DK EE ES FI FR GB GR HR HU IE IS IT LI LT LU LV MC MK MT NL NO PL PT RO RS SE SI SK SM TR |
|
| DAX | Request for extension of the european patent (deleted) | ||
| RA4 | Supplementary search report drawn up and despatched (corrected) |
Effective date: 20160829 |
|
| RIC1 | Information provided on ipc code assigned before grant |
Ipc: C12M 1/00 20060101ALI20160823BHEP Ipc: A61B 5/00 20060101ALI20160823BHEP Ipc: G06F 19/24 20110101ALI20160823BHEP Ipc: A61B 5/145 20060101ALI20160823BHEP Ipc: C12N 15/09 20060101AFI20160823BHEP |
|
| STAA | Information on the status of an ep patent application or granted ep patent |
Free format text: STATUS: EXAMINATION IS IN PROGRESS |
|
| 17Q | First examination report despatched |
Effective date: 20190218 |
|
| REG | Reference to a national code |
Ref country code: DE Ref legal event code: R079 Ref document number: 602011068108 Country of ref document: DE Free format text: PREVIOUS MAIN CLASS: C12N0015090000 Ipc: G16B0005300000 |
|
| GRAP | Despatch of communication of intention to grant a patent |
Free format text: ORIGINAL CODE: EPIDOSNIGR1 |
|
| STAA | Information on the status of an ep patent application or granted ep patent |
Free format text: STATUS: GRANT OF PATENT IS INTENDED |
|
| RIC1 | Information provided on ipc code assigned before grant |
Ipc: G16B 5/30 20190101AFI20200122BHEP Ipc: G16B 5/20 20190101ALI20200122BHEP Ipc: C12M 1/00 20060101ALI20200122BHEP Ipc: A61B 5/00 20060101ALI20200122BHEP Ipc: A61B 5/145 20060101ALI20200122BHEP Ipc: G16B 40/30 20190101ALI20200122BHEP Ipc: C12N 15/09 20060101ALI20200122BHEP Ipc: G16B 25/10 20190101ALI20200122BHEP |
|
| INTG | Intention to grant announced |
Effective date: 20200226 |
|
| GRAS | Grant fee paid |
Free format text: ORIGINAL CODE: EPIDOSNIGR3 |
|
| GRAA | (expected) grant |
Free format text: ORIGINAL CODE: 0009210 |
|
| STAA | Information on the status of an ep patent application or granted ep patent |
Free format text: STATUS: THE PATENT HAS BEEN GRANTED |
|
| AK | Designated contracting states |
Kind code of ref document: B1 Designated state(s): AL AT BE BG CH CY CZ DE DK EE ES FI FR GB GR HR HU IE IS IT LI LT LU LV MC MK MT NL NO PL PT RO RS SE SI SK SM TR |
|
| REG | Reference to a national code |
Ref country code: GB Ref legal event code: FG4D |
|
| REG | Reference to a national code |
Ref country code: CH Ref legal event code: EP |
|
| REG | Reference to a national code |
Ref country code: AT Ref legal event code: REF Ref document number: 1299838 Country of ref document: AT Kind code of ref document: T Effective date: 20200815 |
|
| REG | Reference to a national code |
Ref country code: DE Ref legal event code: R096 Ref document number: 602011068108 Country of ref document: DE |
|
| REG | Reference to a national code |
Ref country code: IE Ref legal event code: FG4D |
|
| REG | Reference to a national code |
Ref country code: LT Ref legal event code: MG4D |
|
| REG | Reference to a national code |
Ref country code: NL Ref legal event code: MP Effective date: 20200805 |
|
| REG | Reference to a national code |
Ref country code: AT Ref legal event code: MK05 Ref document number: 1299838 Country of ref document: AT Kind code of ref document: T Effective date: 20200805 |
|
| PG25 | Lapsed in a contracting state [announced via postgrant information from national office to epo] |
Ref country code: FI Free format text: LAPSE BECAUSE OF FAILURE TO SUBMIT A TRANSLATION OF THE DESCRIPTION OR TO PAY THE FEE WITHIN THE PRESCRIBED TIME-LIMIT Effective date: 20200805 Ref country code: LT Free format text: LAPSE BECAUSE OF FAILURE TO SUBMIT A TRANSLATION OF THE DESCRIPTION OR TO PAY THE FEE WITHIN THE PRESCRIBED TIME-LIMIT Effective date: 20200805 Ref country code: PT Free format text: LAPSE BECAUSE OF FAILURE TO SUBMIT A TRANSLATION OF THE DESCRIPTION OR TO PAY THE FEE WITHIN THE PRESCRIBED TIME-LIMIT Effective date: 20201207 Ref country code: HR Free format text: LAPSE BECAUSE OF FAILURE TO SUBMIT A TRANSLATION OF THE DESCRIPTION OR TO PAY THE FEE WITHIN THE PRESCRIBED TIME-LIMIT Effective date: 20200805 Ref country code: ES Free format text: LAPSE BECAUSE OF FAILURE TO SUBMIT A TRANSLATION OF THE DESCRIPTION OR TO PAY THE FEE WITHIN THE PRESCRIBED TIME-LIMIT Effective date: 20200805 Ref country code: NO Free format text: LAPSE BECAUSE OF FAILURE TO SUBMIT A TRANSLATION OF THE DESCRIPTION OR TO PAY THE FEE WITHIN THE PRESCRIBED TIME-LIMIT Effective date: 20201105 Ref country code: GR Free format text: LAPSE BECAUSE OF FAILURE TO SUBMIT A TRANSLATION OF THE DESCRIPTION OR TO PAY THE FEE WITHIN THE PRESCRIBED TIME-LIMIT Effective date: 20201106 Ref country code: SE Free format text: LAPSE BECAUSE OF FAILURE TO SUBMIT A TRANSLATION OF THE DESCRIPTION OR TO PAY THE FEE WITHIN THE PRESCRIBED TIME-LIMIT Effective date: 20200805 Ref country code: BG Free format text: LAPSE BECAUSE OF FAILURE TO SUBMIT A TRANSLATION OF THE DESCRIPTION OR TO PAY THE FEE WITHIN THE PRESCRIBED TIME-LIMIT Effective date: 20201105 Ref country code: AT Free format text: LAPSE BECAUSE OF FAILURE TO SUBMIT A TRANSLATION OF THE DESCRIPTION OR TO PAY THE FEE WITHIN THE PRESCRIBED TIME-LIMIT Effective date: 20200805 |
|
| PG25 | Lapsed in a contracting state [announced via postgrant information from national office to epo] |
Ref country code: PL Free format text: LAPSE BECAUSE OF FAILURE TO SUBMIT A TRANSLATION OF THE DESCRIPTION OR TO PAY THE FEE WITHIN THE PRESCRIBED TIME-LIMIT Effective date: 20200805 Ref country code: RS Free format text: LAPSE BECAUSE OF FAILURE TO SUBMIT A TRANSLATION OF THE DESCRIPTION OR TO PAY THE FEE WITHIN THE PRESCRIBED TIME-LIMIT Effective date: 20200805 Ref country code: NL Free format text: LAPSE BECAUSE OF FAILURE TO SUBMIT A TRANSLATION OF THE DESCRIPTION OR TO PAY THE FEE WITHIN THE PRESCRIBED TIME-LIMIT Effective date: 20200805 Ref country code: LV Free format text: LAPSE BECAUSE OF FAILURE TO SUBMIT A TRANSLATION OF THE DESCRIPTION OR TO PAY THE FEE WITHIN THE PRESCRIBED TIME-LIMIT Effective date: 20200805 Ref country code: IS Free format text: LAPSE BECAUSE OF FAILURE TO SUBMIT A TRANSLATION OF THE DESCRIPTION OR TO PAY THE FEE WITHIN THE PRESCRIBED TIME-LIMIT Effective date: 20201205 |
|
| PG25 | Lapsed in a contracting state [announced via postgrant information from national office to epo] |
Ref country code: SM Free format text: LAPSE BECAUSE OF FAILURE TO SUBMIT A TRANSLATION OF THE DESCRIPTION OR TO PAY THE FEE WITHIN THE PRESCRIBED TIME-LIMIT Effective date: 20200805 Ref country code: RO Free format text: LAPSE BECAUSE OF FAILURE TO SUBMIT A TRANSLATION OF THE DESCRIPTION OR TO PAY THE FEE WITHIN THE PRESCRIBED TIME-LIMIT Effective date: 20200805 Ref country code: EE Free format text: LAPSE BECAUSE OF FAILURE TO SUBMIT A TRANSLATION OF THE DESCRIPTION OR TO PAY THE FEE WITHIN THE PRESCRIBED TIME-LIMIT Effective date: 20200805 Ref country code: DK Free format text: LAPSE BECAUSE OF FAILURE TO SUBMIT A TRANSLATION OF THE DESCRIPTION OR TO PAY THE FEE WITHIN THE PRESCRIBED TIME-LIMIT Effective date: 20200805 Ref country code: CZ Free format text: LAPSE BECAUSE OF FAILURE TO SUBMIT A TRANSLATION OF THE DESCRIPTION OR TO PAY THE FEE WITHIN THE PRESCRIBED TIME-LIMIT Effective date: 20200805 |
|
| REG | Reference to a national code |
Ref country code: DE Ref legal event code: R097 Ref document number: 602011068108 Country of ref document: DE |
|
| PG25 | Lapsed in a contracting state [announced via postgrant information from national office to epo] |
Ref country code: AL Free format text: LAPSE BECAUSE OF FAILURE TO SUBMIT A TRANSLATION OF THE DESCRIPTION OR TO PAY THE FEE WITHIN THE PRESCRIBED TIME-LIMIT Effective date: 20200805 |
|
| PLBE | No opposition filed within time limit |
Free format text: ORIGINAL CODE: 0009261 |
|
| STAA | Information on the status of an ep patent application or granted ep patent |
Free format text: STATUS: NO OPPOSITION FILED WITHIN TIME LIMIT |
|
| PG25 | Lapsed in a contracting state [announced via postgrant information from national office to epo] |
Ref country code: SK Free format text: LAPSE BECAUSE OF FAILURE TO SUBMIT A TRANSLATION OF THE DESCRIPTION OR TO PAY THE FEE WITHIN THE PRESCRIBED TIME-LIMIT Effective date: 20200805 |
|
| 26N | No opposition filed |
Effective date: 20210507 |
|
| PG25 | Lapsed in a contracting state [announced via postgrant information from national office to epo] |
Ref country code: IT Free format text: LAPSE BECAUSE OF FAILURE TO SUBMIT A TRANSLATION OF THE DESCRIPTION OR TO PAY THE FEE WITHIN THE PRESCRIBED TIME-LIMIT Effective date: 20200805 |
|
| PGFP | Annual fee paid to national office [announced via postgrant information from national office to epo] |
Ref country code: DE Payment date: 20210526 Year of fee payment: 11 Ref country code: FR Payment date: 20210622 Year of fee payment: 11 |
|
| PG25 | Lapsed in a contracting state [announced via postgrant information from national office to epo] |
Ref country code: SI Free format text: LAPSE BECAUSE OF FAILURE TO SUBMIT A TRANSLATION OF THE DESCRIPTION OR TO PAY THE FEE WITHIN THE PRESCRIBED TIME-LIMIT Effective date: 20200805 |
|
| PGFP | Annual fee paid to national office [announced via postgrant information from national office to epo] |
Ref country code: GB Payment date: 20210623 Year of fee payment: 11 |
|
| PG25 | Lapsed in a contracting state [announced via postgrant information from national office to epo] |
Ref country code: MC Free format text: LAPSE BECAUSE OF FAILURE TO SUBMIT A TRANSLATION OF THE DESCRIPTION OR TO PAY THE FEE WITHIN THE PRESCRIBED TIME-LIMIT Effective date: 20200805 |
|
| REG | Reference to a national code |
Ref country code: CH Ref legal event code: PL |
|
| REG | Reference to a national code |
Ref country code: BE Ref legal event code: MM Effective date: 20210630 |
|
| PG25 | Lapsed in a contracting state [announced via postgrant information from national office to epo] |
Ref country code: LU Free format text: LAPSE BECAUSE OF NON-PAYMENT OF DUE FEES Effective date: 20210628 |
|
| PG25 | Lapsed in a contracting state [announced via postgrant information from national office to epo] |
Ref country code: LI Free format text: LAPSE BECAUSE OF NON-PAYMENT OF DUE FEES Effective date: 20210630 Ref country code: IE Free format text: LAPSE BECAUSE OF NON-PAYMENT OF DUE FEES Effective date: 20210628 Ref country code: CH Free format text: LAPSE BECAUSE OF NON-PAYMENT OF DUE FEES Effective date: 20210630 |
|
| PG25 | Lapsed in a contracting state [announced via postgrant information from national office to epo] |
Ref country code: BE Free format text: LAPSE BECAUSE OF NON-PAYMENT OF DUE FEES Effective date: 20210630 |
|
| REG | Reference to a national code |
Ref country code: DE Ref legal event code: R119 Ref document number: 602011068108 Country of ref document: DE |
|
| GBPC | Gb: european patent ceased through non-payment of renewal fee |
Effective date: 20220628 |
|
| PG25 | Lapsed in a contracting state [announced via postgrant information from national office to epo] |
Ref country code: FR Free format text: LAPSE BECAUSE OF NON-PAYMENT OF DUE FEES Effective date: 20220630 |
|
| PG25 | Lapsed in a contracting state [announced via postgrant information from national office to epo] |
Ref country code: HU Free format text: LAPSE BECAUSE OF FAILURE TO SUBMIT A TRANSLATION OF THE DESCRIPTION OR TO PAY THE FEE WITHIN THE PRESCRIBED TIME-LIMIT; INVALID AB INITIO Effective date: 20110628 Ref country code: GB Free format text: LAPSE BECAUSE OF NON-PAYMENT OF DUE FEES Effective date: 20220628 Ref country code: DE Free format text: LAPSE BECAUSE OF NON-PAYMENT OF DUE FEES Effective date: 20230103 Ref country code: CY Free format text: LAPSE BECAUSE OF FAILURE TO SUBMIT A TRANSLATION OF THE DESCRIPTION OR TO PAY THE FEE WITHIN THE PRESCRIBED TIME-LIMIT Effective date: 20200805 |
|
| PG25 | Lapsed in a contracting state [announced via postgrant information from national office to epo] |
Ref country code: MK Free format text: LAPSE BECAUSE OF FAILURE TO SUBMIT A TRANSLATION OF THE DESCRIPTION OR TO PAY THE FEE WITHIN THE PRESCRIBED TIME-LIMIT Effective date: 20200805 |