JP4611372B2 - Metabolic monitoring, method and apparatus for displaying conditions related to the health of a subject - Google Patents
Metabolic monitoring, method and apparatus for displaying conditions related to the health of a subject Download PDFInfo
- Publication number
- JP4611372B2 JP4611372B2 JP2007500167A JP2007500167A JP4611372B2 JP 4611372 B2 JP4611372 B2 JP 4611372B2 JP 2007500167 A JP2007500167 A JP 2007500167A JP 2007500167 A JP2007500167 A JP 2007500167A JP 4611372 B2 JP4611372 B2 JP 4611372B2
- Authority
- JP
- Japan
- Prior art keywords
- sequence
- samples
- biological quantity
- subject
- biological
- Prior art date
- Legal status (The legal status is an assumption and is not a legal conclusion. Google has not performed a legal analysis and makes no representation as to the accuracy of the status listed.)
- Expired - Fee Related
Links
Images


Classifications
-
- A—HUMAN NECESSITIES
- A61—MEDICAL OR VETERINARY SCIENCE; HYGIENE
- A61B—DIAGNOSIS; SURGERY; IDENTIFICATION
- A61B5/00—Measuring for diagnostic purposes; Identification of persons
- A61B5/02—Detecting, measuring or recording pulse, heart rate, blood pressure or blood flow; Combined pulse/heart-rate/blood pressure determination; Evaluating a cardiovascular condition not otherwise provided for, e.g. using combinations of techniques provided for in this group with electrocardiography or electroauscultation; Heart catheters for measuring blood pressure
- A61B5/0205—Simultaneously evaluating both cardiovascular conditions and different types of body conditions, e.g. heart and respiratory condition
-
- A—HUMAN NECESSITIES
- A61—MEDICAL OR VETERINARY SCIENCE; HYGIENE
- A61B—DIAGNOSIS; SURGERY; IDENTIFICATION
- A61B5/00—Measuring for diagnostic purposes; Identification of persons
- A61B5/02—Detecting, measuring or recording pulse, heart rate, blood pressure or blood flow; Combined pulse/heart-rate/blood pressure determination; Evaluating a cardiovascular condition not otherwise provided for, e.g. using combinations of techniques provided for in this group with electrocardiography or electroauscultation; Heart catheters for measuring blood pressure
- A61B5/021—Measuring pressure in heart or blood vessels
-
- A—HUMAN NECESSITIES
- A61—MEDICAL OR VETERINARY SCIENCE; HYGIENE
- A61B—DIAGNOSIS; SURGERY; IDENTIFICATION
- A61B5/00—Measuring for diagnostic purposes; Identification of persons
- A61B5/145—Measuring characteristics of blood in vivo, e.g. gas concentration, pH value; Measuring characteristics of body fluids or tissues, e.g. interstitial fluid, cerebral tissue
- A61B5/14532—Measuring characteristics of blood in vivo, e.g. gas concentration, pH value; Measuring characteristics of body fluids or tissues, e.g. interstitial fluid, cerebral tissue for measuring glucose, e.g. by tissue impedance measurement
-
- A—HUMAN NECESSITIES
- A61—MEDICAL OR VETERINARY SCIENCE; HYGIENE
- A61B—DIAGNOSIS; SURGERY; IDENTIFICATION
- A61B5/00—Measuring for diagnostic purposes; Identification of persons
- A61B5/22—Ergometry; Measuring muscular strength or the force of a muscular blow
- A61B5/221—Ergometry, e.g. by using bicycle type apparatus
- A61B5/222—Ergometry, e.g. by using bicycle type apparatus combined with detection or measurement of physiological parameters, e.g. heart rate
-
- A—HUMAN NECESSITIES
- A61—MEDICAL OR VETERINARY SCIENCE; HYGIENE
- A61B—DIAGNOSIS; SURGERY; IDENTIFICATION
- A61B5/00—Measuring for diagnostic purposes; Identification of persons
- A61B5/48—Other medical applications
- A61B5/4866—Evaluating metabolism
-
- A—HUMAN NECESSITIES
- A61—MEDICAL OR VETERINARY SCIENCE; HYGIENE
- A61B—DIAGNOSIS; SURGERY; IDENTIFICATION
- A61B5/00—Measuring for diagnostic purposes; Identification of persons
- A61B5/72—Signal processing specially adapted for physiological signals or for diagnostic purposes
- A61B5/7225—Details of analog processing, e.g. isolation amplifier, gain or sensitivity adjustment, filtering, baseline or drift compensation
-
- A—HUMAN NECESSITIES
- A61—MEDICAL OR VETERINARY SCIENCE; HYGIENE
- A61B—DIAGNOSIS; SURGERY; IDENTIFICATION
- A61B5/00—Measuring for diagnostic purposes; Identification of persons
- A61B5/72—Signal processing specially adapted for physiological signals or for diagnostic purposes
- A61B5/7235—Details of waveform analysis
- A61B5/7264—Classification of physiological signals or data, e.g. using neural networks, statistical classifiers, expert systems or fuzzy systems
- A61B5/7267—Classification of physiological signals or data, e.g. using neural networks, statistical classifiers, expert systems or fuzzy systems involving training the classification device
-
- A—HUMAN NECESSITIES
- A61—MEDICAL OR VETERINARY SCIENCE; HYGIENE
- A61B—DIAGNOSIS; SURGERY; IDENTIFICATION
- A61B5/00—Measuring for diagnostic purposes; Identification of persons
- A61B5/72—Signal processing specially adapted for physiological signals or for diagnostic purposes
- A61B5/7271—Specific aspects of physiological measurement analysis
- A61B5/7275—Determining trends in physiological measurement data; Predicting development of a medical condition based on physiological measurements, e.g. determining a risk factor
-
- A—HUMAN NECESSITIES
- A61—MEDICAL OR VETERINARY SCIENCE; HYGIENE
- A61B—DIAGNOSIS; SURGERY; IDENTIFICATION
- A61B5/00—Measuring for diagnostic purposes; Identification of persons
- A61B5/74—Details of notification to user or communication with user or patient ; user input means
- A61B5/746—Alarms related to a physiological condition, e.g. details of setting alarm thresholds or avoiding false alarms
-
- G—PHYSICS
- G16—INFORMATION AND COMMUNICATION TECHNOLOGY [ICT] SPECIALLY ADAPTED FOR SPECIFIC APPLICATION FIELDS
- G16H—HEALTHCARE INFORMATICS, i.e. INFORMATION AND COMMUNICATION TECHNOLOGY [ICT] SPECIALLY ADAPTED FOR THE HANDLING OR PROCESSING OF MEDICAL OR HEALTHCARE DATA
- G16H50/00—ICT specially adapted for medical diagnosis, medical simulation or medical data mining; ICT specially adapted for detecting, monitoring or modelling epidemics or pandemics
- G16H50/30—ICT specially adapted for medical diagnosis, medical simulation or medical data mining; ICT specially adapted for detecting, monitoring or modelling epidemics or pandemics for calculating health indices; for individual health risk assessment
-
- G—PHYSICS
- G16—INFORMATION AND COMMUNICATION TECHNOLOGY [ICT] SPECIALLY ADAPTED FOR SPECIFIC APPLICATION FIELDS
- G16Z—INFORMATION AND COMMUNICATION TECHNOLOGY [ICT] SPECIALLY ADAPTED FOR SPECIFIC APPLICATION FIELDS, NOT OTHERWISE PROVIDED FOR
- G16Z99/00—Subject matter not provided for in other main groups of this subclass
-
- A—HUMAN NECESSITIES
- A61—MEDICAL OR VETERINARY SCIENCE; HYGIENE
- A61B—DIAGNOSIS; SURGERY; IDENTIFICATION
- A61B5/00—Measuring for diagnostic purposes; Identification of persons
- A61B5/02—Detecting, measuring or recording pulse, heart rate, blood pressure or blood flow; Combined pulse/heart-rate/blood pressure determination; Evaluating a cardiovascular condition not otherwise provided for, e.g. using combinations of techniques provided for in this group with electrocardiography or electroauscultation; Heart catheters for measuring blood pressure
- A61B5/024—Detecting, measuring or recording pulse rate or heart rate
Abstract
Description
本発明は、患者データのフィルタ処理、予測および傾向分析を用いることによる、ノイズを有する生理的信号および生化学的信号の解釈の改善に関するものであり、2型糖尿病または糖尿病に関連する疾患を有する患者の動機付け、セルフコントロールおよび自主管理の向上を目指す方法および装置ならびに/またはコンピュータプログラム製品を開示する。本発明は、心臓の酸素利用、従って体調および身体の健康を監視し、興奮剤および薬物の乱用ならびに心理的および情緒的ストレスを表示する。本発明は、まばらな血液サンプリングによる血糖予測のみならず、無痛で非侵襲的な血糖の代替的測定値の利用法、および代謝能力標識を開示する。本発明は、使いやすさと相まった低コストの長期的代謝監視を提供し、かつユーザの努力をほとんど必要としない直観的方法で、この疾患に関連する代謝系の機能に関する患者の認識を生み出す。より少ない費用、ヘルスケアシステムに対するより少ない負担、患者の長寿および生活の質の向上は、本発明案を用いることから得ることができる。
The present invention relates to improved interpretation of noisy physiological and biochemical signals by using patient data filtering, prediction and trend analysis, and has
哺乳類の生理的信号および生化学的信号、例えば血糖サンプリング信号、血圧信号および他の監視信号は、長期にわたってサンプリングされる場合、ノイズが非常に多く、高い変動性を有する可能性がある。従って、その後にデータの正確な解釈を行う前に、そのようなノイズを減少させることが重要である。さらに、生化学的信号は、性質上侵襲的であることが多く、かつそのような測定を適用することは、不快、高額、または複雑となる可能性がある。本発明案は、適切なフィルタ処理方法を用いることによってそのような信号の解釈における精度を向上させ、かつ非侵襲的な代替的測定値を用いることによって不快および費用を低減することを目指す。 Mammalian physiological and biochemical signals, such as blood glucose sampling signals, blood pressure signals and other monitoring signals, can be very noisy and highly variable when sampled over time. Therefore, it is important to reduce such noise before subsequent accurate interpretation of the data. In addition, biochemical signals are often invasive in nature, and applying such measurements can be uncomfortable, expensive, or complicated. The proposed solution aims to improve the accuracy in interpreting such signals by using appropriate filtering methods and to reduce discomfort and costs by using non-invasive alternative measurements.
糖尿病は、流行伝染病のような勢いで地球規模で増加しており、医療の巨額な費用負担を象徴している。1型糖尿病は、糖尿病症例全体の約10%を占めている。従って、2型糖尿病は、糖尿病症例全体の約90%を占め、かつ確実に増加している。アメリカ合衆国においてだけでも、人口の最大7%が糖尿病を有している可能性があると推定されている。1億の個人が太り過ぎであり、従って2型糖尿病になる危険性が高い。この傾向が持続すれば、2030年には、米国の成人人口の100%が太り過ぎとなる。米国における間接費を含んだ糖尿病の年間総費用は、1997年には約1,000億米ドルと見積もられた。サウジアラビアでは、人口の最大25%が糖尿病に関連する疾患を有している可能性があると推定されている。世界保健機関(WHO)は、2025年までに糖尿病患者が全世界で3億人に増加すると予測している。この地球規模の流行傾向を覆すためのさまざまな試みがなされてきたが、今日まで、これは不成功に終わっている。
Diabetes is growing like a pandemic, on a global scale, symbolizing the huge cost of medical care.
1型糖尿病(以前はインスリン依存性糖尿病、IDDM:insulin dependent diabetes mellitusと呼ばれていた)は、通常絶対的インスリン欠乏を引き起こす不可逆性ベータ細胞破壊によって特定される。2型糖尿病(以前は非インスリン依存性糖尿病、NIDDM:non−insulin dependent diabetes mellitusと呼ばれていた)は、遺伝的要因と環境的要因との両方を含むと考えられる異質性疾患として特定される。2型糖尿病は、その大部分においてライフスタイルに関連する疾患であり、不健全な食習慣と相まった現代の座りがちなライフスタイルが問題の主要な原因であると考えられている。2型糖尿病患者は一般に、生存のためのインスリン治療を必要としない。2型糖尿病の一般的な症状は、渇き、頻尿、眠気、けん怠感、体重超過、味覚性発汗、さまざまな視覚のぼけ、血糖値の上昇、アセトン呼気および尿糖である。患者の検査によって、座りがちなライフスタイル、および飽和脂肪と精製炭水化物の多い食事に対する明確な嗜好が明らかになるのがきわめて一般的である。
インスリン抵抗性は、2型糖尿病および肥満を含むさまざまな内科的疾患によって個人を特徴付け、また多くの心臓血管の異常および代謝系の異常に関連して発生する一般的な代謝異常である。インスリン抵抗性は、身体がインスリンに適切に反応することができないことと定義される。インスリン抵抗症候群とも命名されているシンドローム−Xまたはメタボリック症候群とは、2型糖尿病および関連する心循環器疾患の発生を予測する、代謝系危険因子と生理的危険因子の群である。これは、肥満、高血圧、インスリン抵抗性、耐糖能異常および異常脂質血症の5つの主要な異常によって一般に特徴付けられる。西洋諸国におけるメタボリック症候群の罹患率は、25%〜35%である。老化は通常、インスリン抵抗性と関係があり、ベータ細胞機能の低下および肥満は、インスリン抵抗性ならびに高インスリン血症と関係がある。
Insulin resistance is a common metabolic disorder that characterizes individuals with a variety of medical illnesses, including
糖尿病性自律神経障害(DAN:diabetic autonomic neuropathy)は、糖尿病の重大かつ最も一般的な合併症のうちの1つである。ほとんどの2型糖尿病患者は、自律神経系(ANS:autonomic nervous system)の機能の低下が先行する心循環器疾患で死亡する。これは、初期段階で気付かれることはほとんどなく、2型糖尿病を、長い年月をかけてゆっくりと進行し、かつほとんどの場合、後期において発見されるまで患者が気付かない「分かりにくい」疾患としている。DANは、日常生活の通常の活動を行う能力を損ない、生活の質を低下させ、死の危険性を増大させる。DANは、体全体の多くの臓器系、例えば胃腸系、性尿器系、および心臓血管系に影響を及ぼす。DANは、血糖値上昇の「毒性」作用に関連する神経繊維の破壊および損失の結果である。従って、DANの発症を防止しかつその進行を遅くするにあたっては、集中的な血糖コントロールが必要不可欠となる。ANSの問題点およびDANは、心拍変動(HRV:heart rate variability)解析の評価によって検知に成功することが可能である。
Diabetic autonomic neuropathy (DAN) is one of the most common and most common complications of diabetes. Most patients with
高血圧症は、西欧の人々の主要な健康障害であり、心臓血管の疾患に関連性を有する。動脈硬化は、高血圧症の原因と結果の両方となる可能性があるが、最近の研究では、動脈硬化が高血圧症の典型的な前兆現象であり、また動脈硬化が遺伝的な根拠を有する可能性が高いことが示唆されている。2型糖尿病患者の大多数(50%超)が、高血圧症を患っている。従って、糖尿病患者の血圧をコントロールすることが急務である。2型糖尿病では、ライフスタイルの改善または投薬もしくは両方の組み合わせによって血圧を130/80未満に維持することが推奨されている。
Hypertension is a major health disorder in Western people and has relevance for cardiovascular disease. Atherosclerosis can be both a cause and a consequence of hypertension, but recent studies suggest that arteriosclerosis is a typical precursor to hypertension and that arteriosclerosis may have a genetic basis It is suggested that the nature is high. The vast majority (> 50%) of
インスリン抵抗性および2型糖尿病は、血漿リポタンパク値の変化と関連性を有する。2型糖尿病を有する患者の最大70%が、脂質疾患を有する。冠状動脈性心臓病は、2型糖尿病を有する患者の間での主な死亡原因である。肥満、高血圧症、および高血糖症と共に、異常脂質血症は、冠状動脈性心臓病の大きな一因となっている。軽度の異常脂質血症でさえも、冠状動脈性心臓病の危険因子を高める可能性がある。これらの危険因子は加法的または相乗的でさえあるので、ライフスタイル改善に対する戦略では、高血糖症だけでなく、異常脂質血症にも重点的に取り組むべきである。2型糖尿病における異常脂質血症は通常、より粥腫発生性のより小さくかつより密度の高いLDL粒子を示すので、コレステロール低下の標的には、上昇した中性脂肪(TG:triglyceride)の低下のみならず、超低密度リポタンパク質(VLDL:very−low−density lipoprotein)および低密度リポタンパク質(LDL:low−density lipoprotein)の低下を含めるべきである。
Insulin resistance and
精神的ストレス、血圧の上昇および心拍数の上昇は、現代社会によくある問題である。現代の仕事およびライフスタイルは、体を動かす度合いが少なく、ハイテク関連の仕事は、座りがちなライフスタイルをもたらすことが多い。高レベルのストレスが持続する要求度の高い仕事はよくあるものであり、負の努力/報酬因子は、ストレスによって誘発される疾患の一因となる可能性がある。精神的ストレスが収縮期血圧および心拍数の増大のみならず、高血糖値のように、新陳代謝に影響を及ぼす可能性があることはよく知られている。カフェイン、ニコチン、アルコール、コカインおよびアンフェタミンのようなさまざまな興奮剤も、収縮期血圧および心拍数を増大させる。 Mental stress, increased blood pressure and increased heart rate are common problems in modern society. Modern work and lifestyle are less active, and high-tech work often results in a sedentary lifestyle. The demanding work that sustains high levels of stress is common, and negative effort / reward factors can contribute to stress-induced diseases. It is well known that mental stress can affect metabolism, such as high blood glucose levels, as well as increased systolic blood pressure and heart rate. Various stimulants such as caffeine, nicotine, alcohol, cocaine and amphetamine also increase systolic blood pressure and heart rate.
エネルギーおよび脂肪分の高い現代型の食生活は、インスリン抵抗性ならびに関連する障害と関係がある。しかしながら、インスリン抵抗性の正確な原因は明らかではない。遺伝的素因と食事脂肪の質および量を含む環境要因の両方とも、血漿グルコースを正常な血漿インスリン値で適切に処理する能力の喪失が発現する原因となる。時間効率のよい食事と組み合わせられた糖度が高く、脂肪が多くかつ味のよい食品により、ファストフード店が人気を得ている。即効性のある高エネルギーの炭水化物の消費増大は、血糖過剰およびインスリン過剰となって現れ、その後、血糖不足および嗜眠状態が到来し、再び即効性のある炭水化物等の新たな摂取を要求する。この周期的応答は、新陳代謝系の調節システムに打撃を与えていることが多い。このような一過性の刺激は、長期的には有害であり、インスリン抵抗性および高インスリン値、2型糖尿病進行の早期開始の一因であると考えられている。上述のライフスタイルに関連する問題は現在、過去に前例のない大きさの健康障害を生み出している。
A modern diet with high energy and fat content is associated with insulin resistance and related disorders. However, the exact cause of insulin resistance is not clear. Both genetic predisposition and environmental factors, including dietary fat quality and quantity, cause loss of ability to properly process plasma glucose with normal plasma insulin levels. Fast food stores are gaining popularity due to their high sugar content, high fat content and good taste combined with time efficient meals. Increased consumption of fast-acting high-energy carbohydrates appears to be hyperglycemic and excessive insulin, followed by hypoglycemia and lethargy, and again demanding new intakes such as fast-acting carbohydrates. This periodic response often hurts the metabolic regulatory system. Such transient stimuli are detrimental in the long run and are thought to contribute to insulin resistance and high insulin levels, early onset of
従って、身体活動、有酸素フィットネスは、2型糖尿病に関連する疾患と闘うにあたって不可欠なものである。心臓が心臓血管系に酸素を供給する能力および効率を高めると同時に筋肉のインスリン感受性および酸素摂取量を向上させる身体活動によって、心臓血管系の健康状態を改善することが最も重要な課題である。心臓の機能は、あらゆる筋肉と同様に、訓練によってより強くかつより効率的になることができる。わずか10%の減量によって、通常、血糖および脂質値に好ましい効果が示される。特に、腹部の脂肪の塊を減らすことが重要である。
Thus, physical activity and aerobic fitness are indispensable in combating diseases associated with
身体活動およびエネルギーの消費は、患者の通常の日常活動中に患者を拘束しない種々の方法で推定することができる。歩数計、加速度計、心拍メータ等のようなさまざまな方法が存在する。1つの評判のよい方法では、簡単な方式によって、歩いた歩数を計算するかまたは歩くことによって消費されたカロリーを概算する。他の方法では、一軸加速度計、二軸加速度計または三軸加速度計を用いて、身体の動きおよび加速に関連するエネルギーの消費を計算する。別の方法では、プレチスモグラフ(光を指または耳たぶに通し、心拍数および身体活動を計算する装置)に基づく脈拍監視を用いる。別の評判のよい1つの装置、パルスウォッチは、電極を有するチェストストラップを用いてEKG信号を測定し、消費カロリーおよび身体活動に関連する他のパラメータを計算することができる特別設計の腕時計型計算機に、EKGパルスを送信する。しかしながら、身体活動の量を計るもっとも簡単な方法は、行った日々の努力および実行した身体活動の強度および持続時間に関して、例えば1から5までの段階に基づいて、日常活動を単に大まかに推定することである。さらに入念な計算方法および報告方法には、身体活動の強度の正確な指標である、MET:metabolic equivalentテーブル(代謝当量)またはMET方式が含まれる。現代の非活動的で座りがちなライフスタイルは、健康ジムの大市場、および身体の健康を改善するためのさまざまな健康関連製品ならびに身体トレーニングプログラムのマーケティングの開放をもたらしている。この好ましい傾向にもかかわらず、2型糖尿病に関連する疾患は、驚くべき速度で急速に増加している。
Physical activity and energy consumption can be estimated in various ways that do not restrain the patient during the patient's normal daily activities. There are various methods such as pedometer, accelerometer, heart rate meter and so on. One popular method is to calculate the number of steps taken or approximate the calories consumed by walking in a simple manner. Other methods use a single-axis accelerometer, a two-axis accelerometer, or a three-axis accelerometer to calculate the energy consumption associated with body movement and acceleration. Another method uses pulse monitoring based on a plethysmograph (a device that passes light through a finger or earlobe and calculates heart rate and physical activity). Another reputable device, the pulse watch, is a specially designed watch-type calculator that can measure EKG signals using a chest strap with electrodes and calculate other calories and other parameters related to physical activity The EKG pulse is transmitted. However, the simplest way to measure the amount of physical activity is simply a rough estimate of daily activity, for example, on a scale from 1 to 5, with respect to the daily effort performed and the intensity and duration of the physical activity performed. That is. More elaborate calculation and reporting methods include the MET: metabolic equivalent table (metabolic equivalent) or MET method, which is an accurate indicator of the intensity of physical activity. The modern inactive and sedentary lifestyle has led to the opening of a large market for health gyms and a variety of health-related products and physical training programs to improve physical health. Despite this favorable trend, diseases associated with
高い危険性、過体重、座りがちで糖尿病の傾向を有する個人に、ライフスタイルを変えるように動機付けることは困難である。関連する健康上の危険性と身体トレーニングの必要性および/または食習慣の修正ならびに/もしくはストレスを取り除く処理の必要性を単に個人に告げるだけでは十分ではないことが多い。健康度の低い個人は、他人に検査されたり、ジムでトレーニングを行うことを強制されるのを快く受け止めないことが多い。太りすぎの個人が自分の身体健康度の低さによって恥ずかしさを感じるのはよくあることであり、屈辱を回避するために、リハビリテーションプログラムに参加することを拒否する。本発明者は、そのような不利益な傾向を打破する唯一の方法は、好ましくは家庭でプライベートに、自身の代謝機能を監視するための簡素で直感的な道具を用いることにより、実体験で人々を教育することであると確信している。次いで、個人は、関連する問題についての理解を自ら得とくし、かつライフスタイルを変更するために必要な範囲および強度に対する洞察力を得ることができる。 It is difficult to motivate individuals with high risk, overweight, sedentary, and diabetic propensities to change their lifestyles. It is often not sufficient to simply tell an individual about the associated health risks and the need for physical training and / or the modification of eating habits and / or the need for treatment to relieve stress. Individuals with poor health often do not readily accept being tested by others or forced to work out in the gym. It is common for overweight individuals to feel embarrassed by their low physical health and refuse to participate in rehabilitation programs to avoid humiliation. The inventor believes that the only way to break down such a disadvantageous trend is by using a simple and intuitive tool to monitor his metabolic function, preferably privately at home, in real life. I am convinced that it is to educate people. The individual can then gain an understanding of the issues involved and gain insight into the scope and strength needed to change the lifestyle.
個人用血糖メータを用いた自己監視は、通常、インスリンの自律的管理を支援するために、1型インスリン依存性糖尿病(IDDM)患者に対して必要なものである。一方、顕在性2型糖尿病または2型糖尿病寸前の患者に血糖監視が処方されるのは、あまり一般的ではない。尿グルコース測定用の尿用ディップスティックを用いた自己監視は、今日ではほとんど廃止されており、腎閾値が広い範囲にわたって個人によって異なるという事実により、用いられることはほとんどない。さらに、この方法は、腎閾値を下回るグルコース値を測定することができず、長い遅延を呈しかつ感度が低いので、血糖監視を利用するのが好ましい。
Self-monitoring with a personal blood glucose meter is usually necessary for
最近の研究では、2型糖尿病を有する患者に対する食事と併せたBG監視用血糖メータの利用に関するいくつかの利点が報告されている。この考えは、患者に対する食事の代謝効果についての知識を得るために、食前および食後のグルコース値を監視することである。その後、患者は、食後にグルコース値がどのように上昇するかを経験によって学習し、さまざまな種類の食物の摂取に関連するグルコースの変動について、自身にフィードバックすることができる。この考えは、食物摂取のバランスをとることであり、精製された即効性の炭水化物を減らすことが、食後の血糖超過を低減することになる。そのような超過は、自律神経系に長期にわたる損傷を引き起こし、最終的には糖尿病および糖尿病性神経障害に至る可能性があることが分かっている。このような形の自己監視は、持続するのが煩わしくかつ非現実的であり、本方法の強度に関連する動機付けの欠如により、患者がこのような検査の試みから脱落するのはまれなことではない。血糖メータおよび道具を患者が日中持ち歩く必要があり、レストランで食事を取っている際に、検査が人目にさらされることもある。そのような煩わしい手順を患者の長期的な日常慣行の一部として含むことには、さほど成功の可能性はない。さらに、日中何本かの血糖用スティックおよび何本かの指穿刺用ランセットを消費するので、費用も無視できない。さらに、そのような検査は性質上侵襲の少ないものであるが、患者にとっては痛みを伴い、かつ非常に不快である可能性がある。さらに、結果の論理的解釈および直観的解釈の余地がほとんど与えられず、従って、患者が治療の目的を得るために一連の不都合を理解しかつ管理することが困難となる。
Recent studies have reported several advantages regarding the use of a BG monitoring blood glucose meter in conjunction with a diet for patients with
世界保健機関(WHO:The World Health Organisation)および米国糖尿病協会(ADA:American Diabetes Association)は、糖尿病の異なる段階間で区別をつけるために、特定の血糖の範囲およびレベルを設けている。症状のある患者を診断する空腹時グルコース濃度(WHO基準、1999年)を以下に示す。空腹時サンプルグルコース濃度は、mmol/Lで示す。 The World Health Organization (WHO) and the American Diabetes Association (ADA) have established specific blood glucose ranges and levels to distinguish between different stages of diabetes. The fasting glucose concentrations (WHO criteria, 1999) for diagnosing symptomatic patients are shown below. Fasting sample glucose concentration is expressed in mmol / L.

診療所で血糖値を評価する際に、残念なことであるが、強い生物学的変動および分析的変動の存在を見逃すことがかなりある。従って、測定値間に大幅な変動が存在し、経験の少ない医師が測定値の解釈を誤る可能性があり、この疾患の等級付けおよび診断の精度が低下する結果となる。 Unfortunately, when assessing blood glucose levels in the clinic, it is quite common to miss the presence of strong biological and analytical variability. Thus, there are significant variability between measurements, and less experienced physicians can misinterpret the measurements, resulting in reduced accuracy in grading and diagnosing the disease.
診療所において血液サンプルが採取される場合、いくつかの要因が、下記のような測定結果の精度に影響を及ぼす。
1.診療所の分析機器の次善の較正。図1の実例を参照されたい。
2.グルコース保存料が解糖を完全には防止しないことによる、解糖による血液サンプルの老化。
3.神経質な「針恐怖症」患者による「白衣高血糖」、高BG値。図2の実例を参照されたい。
4.時間帯の増加に関連する空腹時BG値の持続的低下。
5.時間依存性のインスリン感受性、従って日ごとに異なる感受性。
6.月経による女性の周期的なホルモンの変化。
7.BGは、一過性の急性感染症、外傷性ストレスおよび単なる風邪またはインフルエンザによって変化する可能性がある。
When blood samples are collected at a clinic, several factors affect the accuracy of measurement results such as:
1. Sub-optimal calibration of clinic analytical instruments. See the example in FIG.
2. Aging of blood samples by glycolysis because the glucose preservative does not completely prevent glycolysis.
3. "White coat hyperglycemia", high BG value by nervous "needle phobia" patients. See the example in FIG.
4). A persistent decline in fasting BG values associated with increased time zones.
5. Time-dependent insulin sensitivity, and thus sensitivity that varies from day to day.
6). Periodic hormonal changes in women due to menstruation.
7). BG can be changed by transient acute infections, traumatic stress and just a cold or flu.
上記の不確実性に関連し、本発明者は、適切な後処理方法およびフィルタ処理方法と併せた、十分な精度を有する血糖メータを用いた家庭内における管理された状態下での血糖監視によって診断分類の精度が改善されると確信している。本発明者はこれを、すでに実施されている臨床検査室での測定および現行の習慣と比較して優れていると確信している。 In connection with the above uncertainties, the inventor has performed blood glucose monitoring under controlled conditions in the home using a blood glucose meter with sufficient accuracy in conjunction with appropriate post-processing and filtering methods. I am confident that the accuracy of diagnostic classification will improve. The inventor believes this is superior to the clinical laboratory measurements and current habits that are already in place.
高インスリン値(高インスリン血症)は、高血糖値が最終的に顕在化するかなり前に血流に現れるが、高血糖値はそれでも典型的な2型糖尿病症候群分類に留まっている。インスリン値は、仮に用いられるとしても、臨床的な研究の目的以外では、糖尿病のリスクマーカまたは診断用手段として用いられることはまれである。驚くべき事実である。従って、低血糖値は、その疾患の存在を否定する。
High insulin levels (hyperinsulinemia) appear in the bloodstream long before hyperglycemia levels eventually become manifest, but hyperglycemia levels still remain in the
酸素飽和度の監視は、手術室における患者のみならず、応急処置下の患者についての一般的な方法である。現在では広く用いられているパルスオキシメータ(赤外線吸収を利用して血液ヘモグロビンの酸素飽和度を監視する機器)の発明以前は、手術中患者の心拍数と収縮期血圧の積(RPP:Rate−Pressure−Product)を計算して患者の心臓の状態および酸素利用量を確かめるのが一般的な方法であった。RPP(二重積とも呼ばれる)は、心臓の酸素利用量のかなり正確な測定値であり、収縮期血圧に心拍数を乗じることによって得られる(RPP=sBP×HR/100)。パルスオキシメータの導入後、現在RPPはほとんど用途を見出していないが、トレッドミル運動負荷試験等の間の心臓の酸素消費量を示すスポーツ医学に用いられることがある。RPPは、ストレスおよび興奮性薬物の使用も示す。 Monitoring oxygen saturation is a common method not only for patients in the operating room, but also for patients under first aid. Prior to the invention of the widely used pulse oximeter (a device that monitors the oxygen saturation of blood hemoglobin using infrared absorption), the product of heart rate and systolic blood pressure (RPP: Rate-) It was common practice to calculate the Pressure-Product) to ascertain the patient's heart condition and oxygen utilization. RPP (also called double product) is a fairly accurate measure of heart oxygen utilization and is obtained by multiplying systolic blood pressure by heart rate (RPP = sBP × HR / 100). After the introduction of the pulse oximeter, RPP currently has little use, but may be used in sports medicine to indicate cardiac oxygen consumption during treadmill exercise testing and the like. RPP also shows the use of stress and excitatory drugs.
患者に対する負担を軽減するために、本発明者は、空腹時血糖サンプルのみが正確な長期にわたる2型糖尿病に関連する疾患の監視および治療に必要であると断言する。まばらに、例えば1週間に1回サンプリングされた血糖測定値でさえも、日々のBGの正確な予測のための本発明の実施形態に関しては十分と言ってよい。空腹時血糖値が通常食後の血糖偏位の相対的大きさを示すので、日中の食前および食後の血糖測定のようなより集中的で煩わしい血糖監視は、必要であるとはみなされない。従って、より高い空腹時血糖値は、より高い食後血糖値に反映され、逆もまた同様である。これは、ライフスタイル改善期間中断時の0h、1hおよび2hにおいてサンプリングされた複数の3サンプル経口的ブドウ糖負荷試験(OGTT:oral glucose tolerance test)によって示すことができる。図3を参照されたい。より低い空腹時BGと共にライフスタイルが改善され、食後BG値も下降傾向をたどっているのが分かる。しかしながら、食後1hのBG測定値は、もちろん、必要であると考えられる場合の空腹時BGの代替値として用いることができる。しかしながら、これはより煩わしく、従って、上に説明したように、さほど現実的ではない。
In order to reduce the burden on the patient, the inventor asserts that only fasting blood glucose samples are necessary for accurate and long-term monitoring and treatment of diseases associated with
本発明の追加の実施形態では、BG値は、好ましくは血圧と心拍数(心拍数と収縮期血圧の積)のみから予測され、プレディクタの初期較正および初期設定手続きの場合を除き、痛みを伴う指穿刺または侵襲的手技を不要にしている。本発明の別の実施形態では、痛みを伴う指穿刺の必要頻度がより少なくされている。 In an additional embodiment of the present invention, the BG value is preferably predicted only from blood pressure and heart rate (the product of heart rate and systolic blood pressure) and is painful except in the case of a predictor initial calibration and initialization procedure. It eliminates the need for finger puncture or invasive procedures. In another embodiment of the invention, the frequency of painful finger punctures is less frequent.
本発明案は、例えば身体活動の強度、血糖、血圧および心拍数のような特定の生理的パラメータを測定しかつ分析する直観的方法を患者に提供する。さらに、脂質値、総コレステロール、中性脂肪、体温、体重、肥満度指数およびウエストヒップ比のような重要な患者データは、格納しかつ処理を施すことができる。そのような測定に続き、適切なフィルタ処理アルゴリズムを用いてデータに処理および最適化が施され、その後、患者の行動、進歩および結果を即座にフィードバックするために、直観的方法で患者に示される。 The inventive solution provides the patient with an intuitive way to measure and analyze specific physiological parameters such as intensity of physical activity, blood glucose, blood pressure and heart rate. In addition, important patient data such as lipid levels, total cholesterol, triglycerides, body temperature, weight, body mass index and waist-hip ratio can be stored and processed. Following such measurements, the data is processed and optimized using an appropriate filtering algorithm and then presented to the patient in an intuitive manner to provide immediate feedback on patient behavior, progress and results. .
本発明の好ましい実施形態は、以下のステップを含む。
好ましくは毎日、身体活動のレベルを推定または測定し、好ましくはこの情報をデータベースに収集するステップ。
空腹時および/または食後の血糖値をある程度頻繁に測定し、密にもしくはまばらにサンプリングし、好ましくはこの情報をデータベースに収集するステップ。
収縮期−拡張期血圧および心拍数を頻繁に測定し、密にサンプリングし、好ましくはこの情報をデータベースに収集するステップ。
収縮期血圧と心拍数とから収縮期血圧と心拍数との積を計算するステップ。
体重、体温、血中脂質等のような任意の他の関連する生理的パラメータを測定し、好ましくはこの情報をデータベースに収集するステップ。
統計的処理手法および/または信号処理手法を用いて、上記のデータに低域通過フィルタ処理、高度化、誤り訂正および欠損データ補間を施すステップ。
予測手法を適用し、好ましくは心拍数と収縮期血圧の積から血糖値を予測するステップ。
ノイズを低減させるために適切なアルゴリズムによって得られたデータを結合および/またはフィルタ処理し、そのようして得られた情報を提示用に明確化および改善するステップ。
処理、高度化および/または予測が実行されたデータを、患者パラメータを容易に解釈することができるように、直観的かつ理解しやすい方法で傾向として患者に提示するステップ。
A preferred embodiment of the present invention includes the following steps.
Estimating or measuring the level of physical activity, preferably daily, and preferably collecting this information in a database.
Measuring fasting and / or postprandial blood glucose levels somewhat frequently, sampling closely or sparsely, preferably collecting this information in a database.
Frequently measuring systolic-diastolic blood pressure and heart rate, sampling closely, and preferably collecting this information in a database.
Calculating a product of systolic blood pressure and heart rate from the systolic blood pressure and heart rate.
Measuring any other relevant physiological parameters such as body weight, body temperature, blood lipids, etc., preferably collecting this information in a database.
Performing low-pass filtering, sophistication, error correction, and missing data interpolation on the data using statistical processing techniques and / or signal processing techniques.
Applying a prediction technique, preferably predicting blood glucose levels from the product of heart rate and systolic blood pressure.
Combining and / or filtering data obtained by a suitable algorithm to reduce noise and clarifying and improving the information so obtained for presentation.
Presenting the processed, sophisticated and / or predicted data as trends to the patient in an intuitive and understandable manner so that the patient parameters can be easily interpreted.
上記のことから、糖尿病に関連する疾患の代謝監視が、少なくとも被検者の現在の状態を評価するために不可欠であることが明らかとなる。生命維持に必要な生物学的パラメータの密なサンプリングにより、いくつかの利点が提供される。主な利点は、被検者が自分の現在の状態を継続的に知り、それにより被検者の健康状態が低下しない点である。別の利点は、例えば身体活動の欠如またはより悪い場合には良好な栄養状態の欠如、もしくはよりよい場合には十分な身体活動およびよく管理された食事と関連する、患者の現在の状態におけるなんらかの変化または傾向についての概説を、患者が継続的に受け取る点である。さらに別の重要な利点は、被検者が自分の状態の即時フィードバックを受け取り、進行しつつある傾向に基づいて自分のライフスタイルを調整することができる点である。本発明による効率的な代謝監視に対する前提条件は、被検者が生命維持に必要な生物学的パラメータを監視することである。例えば、血糖値、血圧および心拍数は朝の起床時に測定することができ、身体活動は日中等に測定することができる。 From the above, it becomes clear that metabolic monitoring of diseases associated with diabetes is at least essential to assess the current condition of the subject. The close sampling of biological parameters necessary for life support provides several advantages. The main advantage is that the subject is continuously aware of his current state, so that the health status of the subject is not reduced. Another advantage is that there is something in the patient's current condition associated with, for example, lack of physical activity or worse, good nutrition, or better physical activity and a well-managed diet. This is the point at which patients receive ongoing reviews of changes or trends. Yet another important advantage is that the subject can receive immediate feedback on his condition and adjust his lifestyle based on the tendency to progress. A prerequisite for efficient metabolic monitoring according to the present invention is that the subject monitors biological parameters necessary for life support. For example, blood glucose level, blood pressure and heart rate can be measured when waking up in the morning, and physical activity can be measured during the day.
指穿刺は侵襲が少ないと見なすことができるが、正確な血糖監視には侵襲的測定が必要となる。現在、精度において侵襲的測定に匹敵可能な他の方法はない。被検者が自分の指を穿刺して少量の血液をサンプリングし、該少量の血液がその後分析装置内で検査され、該分析装置が血糖値を出力する。侵襲の少ない方法でさえ費用のかかるものであり、かつ不快感を経験することが多く、従って、患者および疾患管理に否定的な影響を有する可能性がある。 Although finger puncture can be considered less invasive, accurate blood glucose monitoring requires invasive measurements. Currently there is no other method that can be compared to invasive measurements in accuracy. The subject punctures his / her finger to sample a small amount of blood, which is then examined in the analyzer and the analyzer outputs a blood sugar level. Even less invasive methods are expensive and often experience discomfort and can thus have a negative impact on patient and disease management.
本発明の目的は、従来の方法と比較して、理解するのがより容易で、ランニングコストをより低下させ、被検者が用いるのにより快適でかつよりやる気を起こさせる、被検者の健康に関連する状態を示すための改善された考え方を提供することにある。 The purpose of the present invention is to make the subject's health easier to understand, lower in running cost, more comfortable and more motivated for use by the subject compared to conventional methods It is to provide an improved idea for indicating the state related to the.
この目的は、請求項1に記載の装置、請求項21に記載の方法または請求項22に記載のコンピュータプログラム製品によって達成される。
This object is achieved, according to
本発明は、新たな代替的測定値および予測の導入によって、ユーザの不快および費用を低減することを目指す。 The present invention aims to reduce user discomfort and costs by introducing new alternative measurements and predictions.
本発明は、高精度の侵襲的測定方法を、代理的な非侵襲的測定方法で部分的に置き換えることができることを発見したことに基づいている。被検者に対する影響力に関しては、高精度の侵襲的測定方法は一般に、費用のかかる、不快かつ「ハードな」測定方法を表し、一方で、非侵襲的測定方法は、低価格、快適かつ「ソフト」な測定方法である。 The present invention is based on the discovery that a highly accurate invasive measurement method can be partially replaced by a surrogate non-invasive measurement method. In terms of impact on a subject, high precision invasive measurement methods generally represent expensive, uncomfortable and “hard” measurement methods, while non-invasive measurement methods are inexpensive, comfortable and “ It is a “soft” measurement method.
プレディクタは、まばらにサンプリングされた侵襲的データおよび密にサンプリングされた非侵襲的データに基づいて、密にサンプリングされた侵襲的データを生成する。従って、被検者は、毎日または先行技術において必要な頻度で痛みを伴う指穿刺を行う必要はなく、さほど頻繁ではない、例えば週1回の指穿刺に戻ることができるであろう。被検者は、例えば毎日、簡単で痛みのない非侵襲的な血圧関連の測定方法を実行するだけでよく、従って、これは、被検者に対して大きい影響力は有しない。 The predictor generates densely sampled invasive data based on sparsely sampled invasive data and densely sampled non-invasive data. Thus, the subject need not perform painful finger punctures daily or as frequently as necessary in the prior art, and may be able to return to less frequent, eg, weekly finger punctures. The subject only needs to perform a simple, painless, non-invasive blood pressure related measurement method, for example every day, and therefore this has no significant impact on the subject.
別の好ましい実施形態では、プレディクタには、非侵襲的測定から導出された2以上の生物学的量が供給される。 In another preferred embodiment, the predictor is supplied with two or more biological quantities derived from non-invasive measurements.
本発明によれば、2つの測定値または生物学的量に対する唯一の前提条件は、両方の測定値が被検者の健康に関連する状態と相関関係を有することである。 According to the present invention, the only prerequisite for the two measurements or biological quantities is that both measurements correlate with a condition related to the health of the subject.
さらに、本発明は、有効な信号変動の抽出および非有効な信号変動の除去のための低域通過フィルタ処理方法を用いることによって、ノイズを有する生理的信号の解釈における精度を向上させることを目指す。 Furthermore, the present invention aims to improve the accuracy in the interpretation of noisy physiological signals by using a low-pass filtering method for the extraction of valid signal fluctuations and the removal of invalid signal fluctuations. .
ここで、図面を参照し、本発明の範囲または意識を限定することなく、説明に役立つ実例として本発明を説明する。
図1は、2つの異なる機会および診療所から得た空腹時BG値を示した図である。各機会について、検査室における測定値が、同一銘柄の3台の高品質BGメータから得た3つの測定値の平均値と比較されている。(棒1、2および4は正確であると思われる)。
図2は、3つの異なる検査機会に対する「針恐怖症」の影響を示した図である。ここでは、看護師が針を使用している際にBG値が大幅に上昇している。測定値は、同一銘柄の3台の高品質BGメータの平均値である。
図3は、3つの異なる機会から得た3つのOGTTを示した図である。わずか3サンプルのみがBG動態を十分に表現することができている。
図4は、傾向(低域通過フィルタ処理済み信号)と共にケーススタディ(点)によって提供された生の空腹時BG測定値を示した図である。WHO規制値も示す。
図5は、WHO規制値によれば、検査の際に患者の診断が機会に大きく左右されるので、一般的な検査室におけるBG測定には強い不確実性があることを示した図である。
図6は、生の空腹時BG測定値(ケーススタディから得た)の自己相関関数(acf)の推定を示した図である。acfは、信号に経時依存性があることを明白に示している。
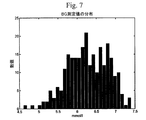
図7は、生の空腹時BG測定値の分布ヒストグラムを示した図であり、それらがほぼ正規分布していることを示している。
図8は、ケーススタディにおけるBGメータ1と2、1と3および2と3との間の測定差を示した図である。
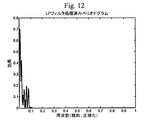
図9は、生の空腹時BG測定値(ケーススタディから得た)のペリオドグラムを示した図である。ほどんどのエネルギーが低周波数帯域内にある。従って、より高い周波数は有益な情報をほとんどまたは全く含んでおらず、従って、廃棄してもよい。
図10は、低域通過フィルタの周波数応答を示した図である。この遮断周波数は典型例であることに留意されたい。
図11は、0と1の間での遮断周波数に対する空腹時BGサンプルのフィルタ処理により生サンプルとフィルタ処理済みサンプルとの間に残差または差が生成されることを示した図である。各遮断周波数に対する二乗残差の平均値は、図11でカーブを生成する。このカーブは、適切な遮断周波数が選択されていることを示す、2本の交差する直線によって示されたクロスオーバーブレークポイントを有する。
図12は、低域通過フィルタによって処理された空腹時BGサンプルのペリオドグラムを示した図である。
図13は、生の収縮期血圧のサンプルを、上記と同じ低域通過フィルタ処理方法によって生成したその傾向と共に示した図である。
図14は、相関関係を示す空腹時BGおよび身体活動の傾向を示した図である。
図15は、100サンプルについて長方形移動窓法によって生成されたBGの傾向とRPPの傾向との間の相関関係(点線)を示した図である。相関有意性(中実線、1−P)は、有意性に対して>.95でなければならない。
図16は、100サンプルについて長方形移動窓法によって生成されたBGの傾向導出値とRPPの傾向導出値との間の相関関係(点線)を示した図である。相関有意性(中実線、1−P)は、有意性に対して>.95でなければならない。
図17は、特定されたシステムをブラックボックス手法によって表すことができることを示した図である。
図18は、低域通過フィルタ処理されたBG予測の結果を示した図である。この例では、予測フィルタは7日目毎に更新されている。
図19は、相関関係を示す代謝能力指数の傾向および身体活動の傾向を示した図である。
図20は、本コンピュータプログラム製品の第1ページのスクリーンダンプを示した図である。
図21は、フィルタ/傾向装置のブロック図である。
図22aは、第2のプロセッサを有する図21の装置のブロック図である。
図22bは、第1のプロセッサを有する図21の装置のブロック図である。
図23は、本発明の一実施形態のブロック図である。
The present invention will now be described by way of illustration and with reference to the drawings, without limiting the scope or spirit of the invention.
FIG. 1 is a chart showing fasting BG values obtained from two different opportunities and clinics. For each occasion, the measurements in the laboratory are compared to the average of three measurements taken from three high quality BG meters of the same brand. (
FIG. 2 shows the effect of “needle phobia” on three different test opportunities. Here, the BG value is significantly increased when the nurse is using the needle. The measured value is an average value of three high quality BG meters of the same brand.
FIG. 3 shows three OGTTs obtained from three different opportunities. Only 3 samples are able to fully express BG dynamics.
FIG. 4 is a diagram showing raw fasting BG measurements provided by case studies (dots) along with trends (low-pass filtered signals). The WHO regulation value is also shown.
FIG. 5 is a diagram showing that there is a strong uncertainty in BG measurement in a general laboratory because the diagnosis of a patient greatly depends on the opportunity according to the WHO regulation value. .
FIG. 6 shows an estimation of the autocorrelation function (acf) of raw fasting BG measurements (obtained from case studies). acf clearly shows that the signal is time-dependent.
FIG. 7 is a diagram showing a distribution histogram of raw fasting BG measurement values, showing that they are almost normally distributed.
FIG. 8 is a diagram showing measurement differences between the
FIG. 9 is a diagram showing a periodogram of raw fasting BG measurements (obtained from a case study). Most of the energy is in the low frequency band. Thus, higher frequencies contain little or no useful information and may therefore be discarded.
FIG. 10 is a diagram showing the frequency response of the low-pass filter. Note that this cutoff frequency is typical.
FIG. 11 is a diagram illustrating that filtering of fasting BG samples with respect to a cutoff frequency between 0 and 1 generates a residual or difference between the raw sample and the filtered sample. The average value of the square residual for each cutoff frequency generates a curve in FIG. This curve has a crossover breakpoint indicated by two intersecting straight lines indicating that the appropriate cutoff frequency has been selected.
FIG. 12 shows the periodogram of the fasting BG sample processed by the low-pass filter.
FIG. 13 shows a raw systolic blood pressure sample, along with its trend generated by the same low-pass filtering method described above.
FIG. 14 is a diagram showing a fasting BG indicating a correlation and a tendency of physical activity.
FIG. 15 is a diagram showing a correlation (dotted line) between the tendency of BG generated by the rectangular moving window method and the tendency of RPP for 100 samples. Correlation significance (solid line, 1-P) is greater than. Must be 95.
FIG. 16 is a diagram showing the correlation (dotted line) between the BG trend derivation value and the RPP trend derivation value generated by the rectangular moving window method for 100 samples. Correlation significance (solid line, 1-P) is greater than. Must be 95.
FIG. 17 is a diagram showing that the identified system can be represented by the black box method.
FIG. 18 is a diagram illustrating a result of BG prediction subjected to low-pass filter processing. In this example, the prediction filter is updated every seventh day.
FIG. 19 is a diagram showing the trend of metabolic ability index and the trend of physical activity showing the correlation.
FIG. 20 is a diagram showing a screen dump of the first page of the computer program product.
FIG. 21 is a block diagram of the filter / trend device.
FIG. 22a is a block diagram of the apparatus of FIG. 21 having a second processor.
22b is a block diagram of the apparatus of FIG. 21 having a first processor.
FIG. 23 is a block diagram of one embodiment of the present invention.
図21に、フィルタ/傾向装置を示すためのブロック図、すなわち被検者の健康に関連する状態を示すための装置のブロック図を示す。この装置は、被検者の健康状態に関連する、有効な変動および非有効な変動を有する生物学的量のサンプルの生シーケンス(図21中の矢印21)を受信するための入力インターフェース20を含む。
FIG. 21 shows a block diagram for illustrating the filter / trend device, ie, a block diagram of the device for indicating a condition related to the health of the subject. The device includes an
特定の実施形態に応じて、入力インターフェースは、例えばキーボードを介した手入力、ケーブル、無線機、赤外線または他の手段により、分析装置から、生シーケンスを形成するこれらの生物学的量のサンプルを取得する。分析装置は、例えば血液サンプルを分析し、血糖値、血圧、心拍数、身体活動または関心のある任意の他の生物学的量を、入力インターフェース20内の電子バッファ、メモリもしくは類似の手段に出力する。従って、入力インターフェース20の出力の時点で、サンプルのシーケンスとしての生シーケンスが得られ、該生シーケンスを、ブロック20とブロック22を結ぶ矢印23によって示すように、フィルタ装置22に入力することができる。
Depending on the particular embodiment, the input interface may receive samples of these biological quantities that form a raw sequence from the analyzer, for example by manual input via a keyboard, cable, radio, infrared or other means. get. The analysis device, for example, analyzes a blood sample and outputs the blood glucose level, blood pressure, heart rate, physical activity or any other biological quantity of interest to an electronic buffer, memory or similar means in the
あるいは、または付加的に、生シーケンスを処理して処理済みシーケンスを取得するために、該生シーケンスを第1のプロセッサ24に入力し、それを、プロセッサ24によって処理された後に、フィルタ装置22内でフィルタ処理することもできる。
Alternatively or additionally, to process the raw sequence to obtain a processed sequence, the raw sequence is input to the
第1のプロセッサ24は、ブロック20による生シーケンス出力を用いて処理済みのシーケンスを取得するために用意されたプレディクタ、インターポレイタまたは任意の他の手段を含むことができる。この接続形態では、第1のプロセッサは、後に概説するように、結合済み生シーケンスを得るために2つ以上の生シーケンスを結合するためのコンバイナも含むことができ、次いで、該結合済み生シーケンスを、フィルタ装置22によってフィルタ処理することができる。
The
フィルタ22は、サンプルの生シーケンスまたはサンプルの生シーケンスから導出されたサンプルの処理済みシーケンスをフィルタ処理し、フィルタ処理済みシーケンスを取得するために用意されている。ここでは、低域通過フィルタであるのが好ましいフィルタが、非有効な変動の影響力と比較して有効な変動の影響力をより強く有するフィルタ処理済みシーケンスを取得するために、非有効な変動を減少させるように構成されているか、または完全に除去することさえできるように構成されていることに留意すべきである。
The
本装置は、フィルタ処理済みシーケンスまたはフィルタ処理済みシーケンスから得られた高度化されたシーケンスを出力するための出力インターフェース25をさらに備えており、この出力インターフェースは、被検者の健康に関連する状態の有効な変動を表す、フィルタ処理済みシーケンスまたは高度化されたシーケンスの傾向として、少なくとも増加の表示、減少の表示または横ばいの表示を出力するために用意されている。図21から明らかとなるように、出力インターフェース25は、矢印26で示すように、フィルタ22によるフィルタ処理済みのシーケンス出力を直接処理する。あるいは、本発明による装置は、フィルタ処理済みシーケンスを用いて高度化されたシーケンスを導出するための第2のプロセッサ27をさらに含む。特定の環境に応じて、第2のプロセッサ27は、出力すべき高度化されたシーケンスを取得するためのフィルタ処理済みシーケンスを修正するために図22aに示すようなコンバイナを含むことができるか、または増幅器等のような何らかの信号処理手段を含むことができる。
The apparatus further comprises an
出力インターフェース25に関しては、ここでは、傾向表示は、もちろん、完全なフィルタ処理済みシーケンスまたは高度化されたシーケンスを示す、図20に示すようなグラフ表示とすることができることに留意すべきである。あるいは、出力インターフェースは、傾向が上昇している際には上向き矢印または有色光を表示することによりもしくは他の表示手段により、傾向が下降している際には下向き矢印または異なる有色光を示すことによりもしくは他の表示手段により、あるいは何も実行しないかまたは何らかの他の信号を示すことによって横ばいの表示があることを示すことにより、簡潔に傾向を示すこともできる。
With respect to the
当然ながら、これは、増加状態、減少状態または横ばい状態を示すために特定の知覚表示を出力する、例えば視覚障害者または聴覚障害者用の感覚認知インターフェースによって行うこともできる。当然ながら、増加状況に対する音または強い振動、減少状態に対する弱い振動もしくは横ばい状況に対する微弱な振動などの機械的手段によって、そのような表示を合図で伝えることができる。あるいは、各表示に対して互いに異なる周波数の振動を作ることができる。あるいは、振動による表示手段とは別に、キーを上昇させ、これによってキーが上昇されていない状態と比較してユーザがキーの上昇を感じるような任意の他の機械的マーキングも用いることができる。 Of course, this can also be done by a sensory cognitive interface for the visually impaired or deaf, for example, to output a specific sensory display to indicate an increasing, decreasing or leveling state. Of course, such an indication can be signaled by mechanical means such as a sound or strong vibration for an increasing condition, a weak vibration for a decreasing condition or a weak vibration for a leveling condition. Alternatively, vibrations with different frequencies can be created for each display. Alternatively, any other mechanical marking can be used that, apart from the display means by vibrations, raises the key so that the user feels the key raised compared to the state where the key is not raised.
図22aに、図21の第2のプロセッサ27の一実施形態を示す。この実施形態では、コンバイナは、例えば心拍数のフィルタ処理済みシーケンスのサンプルに血圧のフィルタ処理済みシーケンスのサンプルを乗じてフィルタ処理済みの心拍数と収縮期血圧との積を表す高度化されたシーケンスを取得するためのサンプルワイズコンバイナである。
FIG. 22a shows an embodiment of the
図22bに第1のプロセッサ24の一実施形態を示しているが、この場合には、フィルタ処理の前に、例えば血圧と心拍数とが結合、すなわちサンプルワイズで乗じられる。これは、図22bの実施形態が、生の心拍数と収縮期血圧との積の非有効な変動を減少させるために後でフィルタ22によってフィルタ処理される、生の心拍数と収縮期血圧との積の形成を示していることを意味する。
FIG. 22b shows one embodiment of the
図23に、第1の生物学的量のサンプルが存在しないある一定の期間に対して第1の生物学的量の推定値を提供するためのプレディクタ30を含む、本発明による独創的な装置を示す。図17および図20に関連して詳細に概説するように、侵襲的測定による測定値は、非侵襲的測定による1つまたはそれ以上の測定値を用いて予測されるのが好ましい。特定の状況に応じて、プレディクタは、自由継続のプレディクタまたは規則的もしくは不規則な時間間隔で更新されるプレディクタとすることができる。
FIG. 23 shows a creative apparatus according to the present invention comprising a
本発明は、「知識は意欲を与える」という単純な概念に基づいており、患者のライフスタイル改善を促進する。本発明は、広く証明された従来の患者測定に基づいた傾向分析を用いることにより、新たな方法で患者を監視し、かつ患者の状態を示す新たな改善された方法を提示する。そのような改善された情報は、治療計画ならびに追跡調査のために、患者および/またはその医師が利用することができる。本発明は、パフォーマンスフィードバックを用いることによって患者を動機付けしかつ教育する。そのようにすることで、患者は、そのライフスタイル修正を進展させることができる。 The present invention is based on the simple concept of “knowledge motivates” and promotes patient lifestyle improvements. The present invention presents a new and improved method of monitoring patients in new ways and indicating patient status by using trend analysis based on widely proven conventional patient measurements. Such improved information can be utilized by the patient and / or their physician for treatment planning and follow-up. The present invention motivates and educates the patient by using performance feedback. By doing so, the patient can advance their lifestyle modifications.
2型糖尿病に関連する疾患では、食習慣の変更およびライフスタイルの変更が必要であることを医師が患者に告げるのが現在の慣行であるが、必要な変更のレベルを患者が判断しかつ理解するのは通常困難である。この疾患の「無症候」性により、患者を動機付けるのは困難となることが多い。ライフスタイルの修正が過度に積極的に実行されると、極度の疲労と動機付けの喪失により、患者が断念してしまう可能性がある。その一方で、それが十分に真剣に実行されなければ、所望の効果は得られないことになる。本発明案の利点は、ライフスタイル変更の適切なレベルが直観的な方法で明確に患者に示され、その結果、やる気をそぐような過努力が回避される点である。
Although it is the current practice that doctors inform their patients that they need to change their eating habits and lifestyles for diseases related to
本発明者は、表示された「過不足のない」アプローチのレベルによるこの方法が、持続的な動機付けおよびリハビリテーション成功への鍵であると確信している。これは、明確な傾向表示と組み合わせた新たなマルチパラメータ生理監視方法を用いて達成される。この方法により、セルフコントロールが促進され、行ったよい行動および努力に対しては患者が報われ、また患者が前進しそこねた場合にはマイナス表示が与えられる。このようなパフォーマンスフィードバックの瞬時表示は、少ない通院毎にのみ医師によって与えられる非常に長期にわたるフィードバックを用いた従来の医療慣行よりはるかに優れておりかつそれとは完全に異なるものである。 The inventor believes that this method, with the level of displayed “no deficiency” approach, is the key to sustained motivation and rehabilitation success. This is achieved using a new multi-parameter physiological monitoring method combined with a clear trend display. This method promotes self-control, rewards the patient for good behavior and effort, and gives a negative indication if the patient fails to move forward. Such an instantaneous display of performance feedback is far superior to and completely different from conventional medical practices using very long-term feedback given by a physician only on a few visits.
本発明では、いくつかの患者パラメータは1日に1回または1週間に1回でも頻繁にサンプリングされ、他のパラメータはそれほど頻繁にはサンプリングされない、最低限の患者の関与ならびに努力を必要とする新たな方法および/または新たな装置について説明する。頻繁にサンプリングされるパラメータは、朝にベッドサイドで容易に実行することができ、日中機器または道具を持ち歩く必要はない。それほど頻繁にはサンプリングされない患者パラメータは、例えば診療所で行うことができる。 In the present invention, some patient parameters are frequently sampled once a day or even once a week and other parameters are sampled less frequently, requiring minimal patient involvement and effort A new method and / or a new apparatus will be described. Frequently sampled parameters can be easily performed at the bedside in the morning and do not need to carry around equipment or tools during the day. Patient parameters that are sampled less frequently can be performed, for example, in a clinic.
密にまたはまばらに、等間隔もしくは非等間隔でサンプリングされる、頻繁にサンプリングされる生理的患者パラメータは、
血糖
身体活動
血圧
心拍数
体温
体重
肥満度指数
からなることができる。
Frequently sampled physiological patient parameters that are densely or sparsely sampled at regular or non-equal intervals are
Blood glucose Physical activity Blood pressure Heart rate Body temperature Weight Weight It can consist of body mass index.
実質的にそれほど頻繁にはサンプリングされない患者パラメータは、
HbA1c
インスリン
脂質
アルブミン値
関心のある他の関連パラメータ
からなることができる。
Patient parameters that are virtually not sampled very often are
HbA1c
Insulin lipid albumin level can consist of other relevant parameters of interest.
血糖値を家庭で評価する際には、測定機器の分析の変動が低くかつ患者の生物学的変動よりも実質的に少ないことが重要である。さもなければ、測定は無意味なものとなる。残念なことに、いくつかの個人用血糖メータは、容認し難いほど高い分析の変動を有しており、それらを、正確な血糖測定に対しては信頼性および有効性の低いものにしている。一方で、いくつかの市販されている低コストの個人用血糖メータは、適切なデータの後処理が行われるならば、例えば空腹時BGの確実な測定に対して十分な精度を有することが分かっている。その一方で、より高い精度が求められる場合、例えば、数分以内に2回以上の連続測定を行い、続いて、後処理の段階で平均することができる。複数の血糖メータを同時に使用して変動を低減し、結果を平均することもできる。これは、高い精度が必要とされる臨床的研究において実行されるのが好ましく、また、該研究に用いられて本発明案が検証されてきた。 When assessing blood glucose levels at home, it is important that the instrumental analysis is low in variation and substantially less than the patient's biological variation. Otherwise, the measurement is meaningless. Unfortunately, some personal blood glucose meters have unacceptably high analytical variability, making them less reliable and effective for accurate blood glucose measurements . On the other hand, some commercially available low-cost personal blood glucose meters have been found to have sufficient accuracy for reliable measurement of fasting BG, for example, if appropriate data post-processing is performed. ing. On the other hand, when higher accuracy is required, for example, two or more continuous measurements can be performed within a few minutes, and then averaged at the post-processing stage. Multiple blood glucose meters can be used simultaneously to reduce variability and average the results. This is preferably performed in clinical studies where high accuracy is required, and has been used to validate the present invention.
血糖値測定機器の多少の分析の変動と相まった血糖値の強い生物学的変動により、かなりのデータ散乱が見られ、ノイズを有する信号の解釈を困難にしている。約10ヶ月にわたる典型的な空腹時BGのシーケンスを実証する図4を参照されたい。データにノイズが非常に多く含まれているので、患者を正確に診断するのに困難があり、その結果高い生物学的変動を示していることに留意されたい。経時データは幅広い範囲にわたって散乱しており、従って、患者のBGは、正常値から糖尿病値にまで及んでいる。我々のケーススタディのための患者に対する各WHO基準を満たす日数を考慮すれば、興味深いグラフが得られる。図5を参照されたい。257日の37%において、この患者は完全に正常であると評価された。257日の57%において、この患者は空腹時血糖異常を有する。257日の7%において、この患者は顕性糖尿病を有する。 Due to strong biological fluctuations in blood glucose levels coupled with some analytical fluctuations in blood glucose measuring instruments, considerable data scatter is seen, making it difficult to interpret noisy signals. See FIG. 4 which demonstrates a typical fasting BG sequence over about 10 months. Note that the data is so noisy that it is difficult to accurately diagnose the patient, resulting in high biological variability. The time-lapse data is scattered over a wide range and therefore the patient's BG ranges from normal to diabetic values. Considering the number of days that meet each WHO criteria for patients for our case study, an interesting graph is obtained. Please refer to FIG. In 37% of 257 days, this patient was assessed as completely normal. In 57% of 257, this patient has fasting glycemic abnormalities. In 7% of 257 days, this patient has overt diabetes.
上述のBGの強い変動性に基づき、本発明者は、現在の糖尿病基準では次善の診断に帰着し、従って改正の必要があると強く確信している。BGの解釈をより正確にするために、多数のBGデータの低域通過フィルタ処理が必要である。しかしながら、これは短期間の変動を減少させて変動の詳細を不明瞭化することになるので、データを過度にフィルタ処理しないことが重要である。最適な濾過および過濾過の回避は、後に説明する残差分析によって得ることができる。 Based on the strong variability of BG described above, the inventor is strongly convinced that current diabetes standards result in a suboptimal diagnosis and therefore need to be revised. In order to make BG interpretation more accurate, low-pass filtering of a large number of BG data is required. However, it is important not to over-filter the data, as this will reduce short-term fluctuations and obscure the details of the fluctuations. Optimal filtration and avoidance of overfiltration can be obtained by residual analysis as described below.
BGの測定は極度にノイズが多いように思われるが、それをホワイトノイズと見なすことはできない。明確にするためには、依存関係が明らかな推定自己相関関数(acf)を見るとよい(推定acfが本発明者らの長期にわたる空腹時BGに基づいている図6を参照されたい)。このケーススタディでは、測定値はほぼ正規分布している(図7参照)。測定値の変動がより大きかった場合、それは間違いなく対数正規分布することになろう。 Although the BG measurement seems extremely noisy, it cannot be considered white noise. For clarity, look at the estimated autocorrelation function (acf) with obvious dependencies (see FIG. 6 where the estimated acf is based on our long-term fasting BG). In this case study, the measured values are almost normally distributed (see FIG. 7). If the variation in the measured value was larger, it would definitely be lognormally distributed.
同一銘柄の3台の高品質BGメータを用いる本発明者の測定戦略により、分析誤差を計算することができる。これは、一度に2台のBGメータを比較することによって行われており、これにより、約0.35mmol/Lの標準偏差を有する3つのほぼ正規分布したケースが生成される(図8参照)。3台のメータによって生成されたデータ系列BG1、BG2およびBG3は、相互およびN(m,σ)に依存しない。
![]()
![]()
従って、ケーススタディで用いた3台のメータの平均値の標準偏差は、約0.14mmol/Lである。 Therefore, the standard deviation of the average value of the three meters used in the case study is about 0.14 mmol / L.
ノイズを有するデータの明瞭な傾向提示を達成するためには、データを低域通過フィルタで処理することが必要であり、これは、スペクトル解析によって行うことができる。図9に、ほとんどのエネルギーが低周波帯域内に見出されるのが分かるペリオドグラムを示す。低域通過フィルタ処理は、周波数領域内での乗算によって行われている。
![]()
![]()
特定の遮断周波数fdは0と1との間にある(離散周波数)。fdが0から1へ増加すると、二乗残差の平均を計算することができ、この場合、Nはfdの各値に対する残差ベクトルの長さである。 The specific cut-off frequency fd is between 0 and 1 (discrete frequency). As fd increases from 0 to 1, an average of the squared residuals can be calculated, where N is the length of the residual vector for each value of fd.
これにより、異なるfdに対する残差の挙動を説明するカーブが生成される(図11参照)。最適な遮断周波数を見つけるには、図11における交差部に対する周波数を選択しなければならない。図11における直線の主な目的は、残差カーブ中断の位置を明確にすることである。同じ残差分析を他の生物学的測定および信号に適用することができる。そのように設計されていると、低域通過フィルタがデータを処理し、不必要な高い周波数は、LPフィルタおよびBG測定値のゼロパッドフーリエ変換を乗じることによって除去されることになる(図12参照)。 As a result, a curve that explains the behavior of the residual with respect to different fd is generated (see FIG. 11). To find the optimum cut-off frequency, the frequency for the intersection in FIG. 11 must be selected. The main purpose of the straight line in FIG. 11 is to clarify the position of the residual curve interruption. The same residual analysis can be applied to other biological measurements and signals. When so designed, the low-pass filter processes the data, and unnecessary high frequencies will be removed by multiplying the LP filter and the zero pad Fourier transform of the BG measurement (FIG. 12). reference).
周波数領域および時間領域内の選択された遮断周波数を用いたLPフィルタ処理の結果を、それぞれ、図12および図4に示す。 The results of LP filtering using the selected cutoff frequencies in the frequency domain and time domain are shown in FIGS. 12 and 4, respectively.
代替的に、畳み込みを用いて、時間領域で同様のフィルタ処理を行ってもよい。他の種類の低域通過フィルタも、当業者は用いることができる。 Alternatively, similar filtering may be performed in the time domain using convolution. Other types of low pass filters can also be used by those skilled in the art.
血圧は、両腕で測定し、次いで、変動を減少させるために、低域通過フィルタ処理することができる。血圧は、手首、指または他の部位で測定することもできる。脈波伝搬時間(PWTT:Pulse−Wave−Transition−Time)の推定も、血圧を測定するのに用いることができる。これは、心臓が例えばEKGR波を生成するときから開始して、プレチスモグラフにより指において検出される血液のパルス密度の変化によって脈波に軽度の伝播差が生じるときまで脈波伝搬時間を測定することによって血圧を推定するものである。さらに、収縮期のデータ、拡張期のデータおよび脈のデータから平均動脈圧(MAP:Mean Arterial Pressure)ならびに脈圧(PP:Pulse Pressure)を計算し、このデータを図形として提示するのは好都合であるかもしれない。 Blood pressure can be measured with both arms and then low-pass filtered to reduce variability. Blood pressure can also be measured at the wrist, fingers or other sites. An estimation of pulse wave propagation time (PWTT) can also be used to measure blood pressure. This starts from when the heart generates an EKGR wave, for example, and measures the pulse wave propagation time until a slight propagation difference occurs in the pulse wave due to changes in blood pulse density detected at the finger by the plethysmograph Is used to estimate blood pressure. In addition, it is convenient to calculate mean arterial pressure (MAP) and pulse pressure (PP) from systolic data, diastolic data and pulse data and present this data as a graphic. might exist.
同じように、身体活動データは通常、日常活動における大きな変動またはおおまかな推定によって散乱する。従って、そのようなデータを上記と同様の方法である期間にわたって低域通過フィルタ処理することは、これによって身体活動データの解釈がより容易となるので好都合である。身体活動は、単純に強度等級に基づいて推定してもよい。そのような等級は、下記の日常活動の等級付けからなることができる。 Similarly, physical activity data is usually scattered by large fluctuations or rough estimates in daily activities. Therefore, it is advantageous to low pass filter such data over a period of time in a manner similar to that described above, as this makes it easier to interpret physical activity data. Physical activity may be simply estimated based on intensity grade. Such a grade can consist of the following daily activity grading.
非常に軽い(休憩する、読みものをする、座っている、運転する等)
軽い(歩く、掃除する、ピアノを弾く、ゆっくり歩く)
中程度(速歩、軽いジョギング、軽く自転車に乗る、スケート、軽いウェイトトレーニング)
激しい(水泳、ランニング、激しいジョギング、競輪、フットボール、バスケットボール等)
非常に激しい(ボクシング、漕艇、登山、激しいウェイトトレーニング)
Very light (resting, reading, sitting, driving, etc.)
Light (walk, clean, play piano, walk slowly)
Moderate (fast walking, light jogging, light bicycle riding, skating, light weight training)
Intense (swimming, running, intense jogging, bicycle race, football, basketball, etc.)
Very intense (boxing, rowing, climbing, intense weight training)
より正確な推定には、MET:metabolic equivalent(代謝当量)を用いることができる。1METは、安静時エネルギー消費量に相当し、軽い活動は<3METS、中程度の活動は3METS〜5.9METS、激しい活動は6METS〜8.9METS、または非常に激しい活動は>9METSの活動に相当する。MET活動表は、MET値、体重および経過時間を乗じることによって行われる消費カロリー(kcal)の簡単な計算に利用することができる。身体活動を推定するコスト効率の良い方法は、歩数計を用いる方法である。本発明の例示的なグラフ中の収集された活動データは、内蔵タイマと組み合わせて用い、日中または行われた身体活動中に消費されたおよそのカロリーを計算する歩数計を用いたものである。エネルギー消費量を消費カロリーとして示すのは、これが一般に用いられておりかつ分かりやすい用語であるので、実際的である。 For more accurate estimation, MET: metabolic equivalent can be used. 1 MET is equivalent to resting energy consumption, light activity is <3METS, moderate activity is 3METS to 5.9METS, intense activity is equivalent to 6METS to 8.9METS, or very intense activity is equivalent to> 9METS activity To do. The MET activity table can be used for simple calculation of calorie consumption (kcal) performed by multiplying MET value, weight and elapsed time. A cost-effective way to estimate physical activity is to use a pedometer. The activity data collected in the exemplary graph of the present invention is used in conjunction with a built-in timer and uses a pedometer that calculates approximate calories consumed during the day or performed physical activity. . Presenting energy consumption as calories burned is practical because it is a commonly used and straightforward term.
心拍数データも、日毎の大きい変動によって散乱する。従って、そのようなデータを上記と同様の方法で低域通過フィルタ処理することは、これによって心拍数データの解釈がより容易となるので好都合である。 Heart rate data is also scattered by large fluctuations from day to day. Therefore, it is advantageous to low pass filter such data in the same manner as described above, as this makes it easier to interpret the heart rate data.
本発明の追加の実施形態では、収縮期血圧および拡張期血圧ならびに心拍数が、好ましくは毎日、両腕において測定される。次いで、両腕からのデータを平均および低域通過フィルタ処理し、変動を減少させることができる。患者の体調を推定するために、心拍数と収縮期血圧との積(RPP)を得るために、収縮期血圧と心拍数との積が計算される。RPP=収縮期BP*心拍数/100。心臓の酸素利用量をおおまかに示すのに加え、RPPは、精神的および情緒的なストレスと同時に、カフェイン、ニコチン、コカインならびにアンフェタミンのような刺激性薬物の存在を明らかにする。従って、本発明者は、RPPが患者の全体的な健康に関連する状態を確認するためにBGと共に評価すべき重要なパラメータであることを教示する。RPPの個別の構成要素自体と同時にRPPの傾向提示を達成するために、BGの傾向を生成したものに類似した低域通過フィルタ方式を用いることができる。各腕の別個の長期平均に基づき、左腕と右腕との間の何らかの血圧差を評価することも、医師にとって価値があるかもしれない。 In additional embodiments of the invention, systolic and diastolic blood pressure and heart rate are measured in both arms, preferably daily. The data from both arms can then be averaged and low pass filtered to reduce variation. To estimate the patient's physical condition, the product of systolic blood pressure and heart rate is calculated to obtain the product of heart rate and systolic blood pressure (RPP). RPP = systolic BP * heart rate / 100. In addition to roughly showing heart oxygen utilization, RPP reveals the presence of stimulatory drugs such as caffeine, nicotine, cocaine and amphetamine, as well as mental and emotional stress. Thus, the inventor teaches that RPP is an important parameter to be evaluated with BG to confirm conditions related to the patient's overall health. In order to achieve RPP trend presentation simultaneously with the individual components of the RPP itself, a low-pass filter scheme similar to that which generated the BG trend can be used. Assessing any blood pressure difference between the left and right arms based on a separate long-term average for each arm may also be valuable to the physician.
同様に、安静時の朝の血圧データは、分析の変動に加え、日毎の大きい変動によって散乱する。患者または医師に単一点での血圧測定を行わせることは、BPデータにも存在する大きいノイズレベルにより、さほど意味があるとは考えられない。従って、そのようなデータを低域通過フィルタ処理する必要があり、これにより血圧データをより正確かつより容易に解釈することができるようになる。図13を参照されたい。 Similarly, resting morning blood pressure data is scattered by large daily fluctuations in addition to analytical fluctuations. Having a patient or doctor make a single point blood pressure measurement is not considered as meaningful due to the large noise level also present in the BP data. Therefore, it is necessary to low pass filter such data, which allows blood pressure data to be interpreted more accurately and more easily. See FIG.
上述の方法でフィルタ処理された身体活動およびBG値から表示されたデータを同時に比較することにより、血糖値が身体活動に反比例するように、身体活動の改善が血糖値の低下をもたらすことが分かる。しかしながら、極度の身体活動は、血糖値を上昇させ、特定の条件下では、実際には逆の効果を有する可能性がある。従って、患者に例えばグラフィカルに示されたそのようなデータを同時に提示することにより、患者は、所定の標的目標をかなえるためのその身体活動の努力および他のライフスタイルに関連する努力を容易に取り入れることができる。現在、これは、なされた努力を過大視する必要なく、グラフに進捗状況によって示されるように、日々時宜を得た方法で血糖、RPPおよび活動の標的目標に向かって単に努力しながら、正確かつ直観的な方法で達成することができる。図14を参照されたい。新たな興味深い非相関関係もグラフにおいて観察することができることに留意すべきである。図15を参照されたい。例えば、患者がインフルエンザまたはウイルス感染症を罹患している際は、BG値が予想外にかつ身体活動の改善に関係なく上昇する可能性がある。身体活動を増加させている際には、BG値も上昇する可能性があり、一方でRPPは減少し、相関関係は負となる。あるいは、患者がストレスの多い状況に遭遇すると、RPPは、BGよりも上昇する可能性がある。従って、そのような状況下では、負に相関する事象を疑うことができるであろう。従って、RPP、BGおよび活動間の時間窓付き相関係数を計算し、これをグラフに示すことにより、患者の状態の新たな興味深い指標が提供され、そのような負の相関関係を見て、経験のあるユーザが新たな結論を出すことができる。 By comparing the data displayed from the physical activity and BG values filtered in the manner described above at the same time, it can be seen that the improvement in physical activity results in a decrease in the blood glucose level so that the blood glucose level is inversely proportional to the physical activity. . However, extreme physical activity increases blood glucose levels and under certain conditions may actually have the opposite effect. Thus, by simultaneously presenting such data, for example graphically to the patient, the patient easily incorporates his physical activity efforts and other lifestyle related efforts to meet a predetermined target goal be able to. Currently, this is accurate and simple, with no need to overestimate the effort made, and simply striving towards the target goals of blood glucose, RPP and activity in a timely manner, as indicated by the progress in the graph. Can be achieved in an intuitive way. See FIG. It should be noted that new interesting uncorrelations can also be observed in the graph. See FIG. For example, when a patient suffers from an influenza or viral infection, the BG value can increase unexpectedly and regardless of improved physical activity. When increasing physical activity, the BG value may also increase while RPP decreases and the correlation becomes negative. Alternatively, if the patient encounters a stressful situation, RPP may be higher than BG. Thus, under such circumstances, a negatively correlated event could be suspected. Thus, calculating a time windowed correlation coefficient between RPP, BG and activity and presenting it in a graph provides a new interesting indicator of patient condition, seeing such a negative correlation, Experienced users can make new conclusions.
本発明の別の実施形態では、新たな方法を提示する。この方法において、本発明者は、RPPの動態がBGの動態とよく相関しかつ身体活動のレベルに反比例し、従って、RPPはBGの変動および動態を予測するのに用いることができることを発見した。図15および図16を参照されたい。 In another embodiment of the present invention, a new method is presented. In this way, the inventor has discovered that RPP kinetics correlate well with BG kinetics and inversely proportional to the level of physical activity, and thus RPP can be used to predict BG variability and kinetics. . See FIGS. 15 and 16.
本発明のさらに別の実施形態では、毎日のBGの代替的測定値を計算するために、予測フィルタと共にRPPを用いることができる。この新たなBG予測法は、血液をサンプリングすることが不可能、非現実的であるかまたは患者が痛みおよび不都合を感じる場合に、好都合に用いることができる。そのような状況下では、BG測定値は、BG値に対してRPPプレディクタを較正するために、治療の開始時点または介入期間においてのみ使用するとよい。そのような較正が行われた後は、患者は、RPP測定にのみ戻り、例えば医師を訪問する際にのみ、BG測定を受けるとよい。以下に説明するように、本発明のさらに別の実施形態では、BG予測フィルタは、例えば1週間に1回、まばらに更新される。従って、予測フィルタの初期トレーニングには、まず、密にサンプリングされた測定値のデータシーケンスが必要となる。このトレーニングシーケンスの長さは、例えば1週間から1ヶ月とすることができる。その後は、予測フィルタは、まばらに更新することができる。本予測方法案は、x1とx2(x2をいくつかの測定量の組み合わせとすることができることに留意されたい)との間に相関関係が検出される場合に、信号x2の中から任意の信号x1を予測するために用いることができる。 In yet another embodiment of the invention, RPP can be used with a predictive filter to calculate an alternative measure of daily BG. This new BG prediction method can be advantageously used when blood sampling is impossible, impractical, or when the patient feels pain and inconvenience. Under such circumstances, the BG measurements may only be used at the start of treatment or during the intervention period to calibrate the RPP predictor to the BG values. After such a calibration has been performed, the patient should only go back to the RPP measurement and only take a BG measurement, for example when visiting a physician. As described below, in yet another embodiment of the invention, the BG prediction filter is sparsely updated, for example, once a week. Therefore, initial training of the prediction filter first requires a data sequence of closely sampled measurement values. The length of this training sequence can be, for example, one week to one month. Thereafter, the prediction filter can be sparsely updated. The proposed prediction method can be used to generate any signal from the signal x2 when a correlation is detected between x1 and x2 (note that x2 can be a combination of several measurements). Can be used to predict x1.
従って、BGとRPPの両方を、2型糖尿病に関連する疾患におけるセルフコントロールの向上およびライフスタイル変更の重要な指標として用いることができる。RPPは、特に、座りがちなライフスタイルからより活動的なライフスタイルへの変更または強度の異なる身体活動期間間での変更のようなライフスタイル変更の過渡的段階下で、BGに対して相互関係を示す。従って、BGの導出値とRPPの導出値は、強い相関関係を有する(図16参照)。そのような状況下では、RPPとBGの両方のパラメータの傾向が、高い相関関係を示しながら同じように変化する。人間が「代謝平衡」状態にある定常状態条件下では、RPPとBGとの間の相関関係は、他の代謝過程からのデータ内の過剰なノイズにより、さほど顕著ではないかもしれない。従って、予測フィルタは、密にサンプリングされたRPPデータから日々のBGデータを予測するために用いられる。RPPを用いたBGの予測は、血糖用スティックまたは指穿刺用ランセットを全くまたはごくわずかしか使用する必要がないので、経済的で無痛の方法であることに言及する必要がある。従って、RPPを計算するための血圧測定は、BG検査に必要となるようなどのような消耗品も必要としない。本予測方法案は、そのような方法が煩わしい、非現実的または非経済的等に思われる他のBG測定および今後のBG測定にも用いることができる。そのような方法は、涙液、唾液または皮膚と接触する機器等からのBG値の測定からなることができる。
Thus, both BG and RPP can be used as important indicators of improved self-control and lifestyle changes in diseases associated with
本発明は、まばらにサンプリングされた血液サンプルを用いることによって、高い精度でRPPから日々のBGを予測する。予測は、2つの異なるアプローチ、ARXおよびFIR−Wienerによって進めることができる。先に述べたように、予測方法には、トレーニング用の一連のデータが必要となる。そのようなまばらにサンプリングされたBG値は、高度なフィルタプレディクタを更新するために用いられる。従って、血液サンプリングまたは指穿刺による外傷性感覚を有する患者に対しては、そのような痛みを伴う活動を、例えば1週につき1サンプルに減らし、それでもなお、プレディクタによって、まばらにサンプリングされたBG値から正確な日々のBG値を予測することができる。本システムは、BG、入力信号xおよびホワイトノイズと共に伝達関数を用いて特定される。xは、1つの変数のベクトルまたはいくつかの変数のマトリックスとすることができる。変数の例は、心拍数と収縮期血圧との積、収縮期血圧、拡張期血圧、脈拍、平均動脈圧、脈圧または身体活動のような測定値とすることができる。この特定は、我々がBGおよびxは同一の基本的パラメータによって部分的に影響を受けると仮定しているので行うことができる。これらのパラメータの中に、我々は、例えば身体活動、食習慣、ストレス、ウイルスおよび過体重を見出す。従って、我々は、本システムを以下の仮説によって提示することができる。 The present invention predicts daily BG from RPP with high accuracy by using sparsely sampled blood samples. Prediction can proceed with two different approaches, ARX and FIR-Wiener. As described above, the prediction method requires a series of training data. Such sparsely sampled BG values are used to update the advanced filter predictor. Thus, for patients with traumatic sensations due to blood sampling or finger puncture, such painful activity is reduced to, for example, one sample per week, yet sparsely sampled BG values by the predictor Therefore, the accurate daily BG value can be predicted. The system is identified using a transfer function along with BG, input signal x and white noise. x can be a vector of one variable or a matrix of several variables. Examples of variables may be measurements such as the product of heart rate and systolic blood pressure, systolic blood pressure, diastolic blood pressure, pulse, mean arterial pressure, pulse pressure or physical activity. This identification can be made because we assume that BG and x are partially affected by the same basic parameters. Among these parameters we find eg physical activity, eating habits, stress, viruses and overweight. Therefore, we can present this system by the following hypothesis.
![]()
![]()
システムが特定される際の重要な前処理は、平均値を引くことである。これは次の式によって得られる。
ARXモデルは次の式として書くことができる。
さらに、式2は次の式として書き直すことができる。
ベクトルθ、旧BG値および旧RPP値に最適要素が与えられれば、BGを予測することが可能である。予測は、旧BG値と旧RPP値を含むθおよび回帰ベクトルφが分かれば計算される。 If optimal elements are given to the vector θ, the old BG value, and the old RPP value, the BG can be predicted. The prediction is calculated if θ including the old BG value and the old RPP value and the regression vector φ are known.
ノイズ項e(t)がφのメンバではないことに留意されたい。さらに、θとφとの積によって予測が得られる。
この例では、プレディクタはワンステッププレディクタとして設計されており、各予測に対してそれが再トレーニングするので適応できるようになる。プレディクタの他のステップ長および他の種類のプレディクタを、当業者は用いることができる。 In this example, the predictor is designed as a one-step predictor and can adapt as it retrains for each prediction. Other step lengths and other types of predictors can be used by those skilled in the art.
時刻t−1におけるθの各計算に対して、BG(t)の推測または予測が生成されることになる。従って、時刻tにおいては、予測誤差を行うことがあり得る。
長さNのトレーニングシーケンスに対しては二次基準がある。
従って、次の式を与えるθを選択するのは容易である。
次の式に示す予測誤差がある。
![]()
![]()
従って、二次基準(11)を、次の式として書くことができる。
RNが反転可能であれば、その式は次のように書くことができる。
もし次の式が成立すれば、(19)の末尾部分は常にゼロである。
一例として、図18に、7日目毎にのみ本物のBGサンプルで更新される場合のプレディクタの結果を示す。本発明の別の実施形態では、プレディクタはフリーランで、短いBGシーケンスによって最初にのみ更新される。 As an example, FIG. 18 shows the results of the predictor when it is updated with a real BG sample only every seventh day. In another embodiment of the invention, the predictor is free-running and updated only initially with a short BG sequence.
別の予測例として、ノイズを最適に抑える強力なプレディクタであるFIR−Wienerフィルタを実装することができる。将来のBGサンプルを説明する変数は、次の式として書くことができる(もちろん、BGは本案における一例に過ぎず、BGを、密にサンプリングされる変数と相関性を有する他の何らかのまばらにサンプリングされる変数に代えることができる)。従って、予測値BGを次の式として生成する。 As another prediction example, an FIR-Wiener filter, which is a powerful predictor that optimally suppresses noise, can be implemented. The variable describing the future BG sample can be written as: (Of course, BG is just an example in this proposal, and BG is sampled in some other sparsely correlated variable that is closely sampled. Can be substituted for variables). Therefore, the predicted value BG is generated as the following equation.
![]()
![]()
BG測定値およびRPP測定値を含むベクトルを生成する。 Generate a vector containing BG measurements and RPP measurements.
さらに、自己相関関数および相互相関関数を含むマトリックスを推定する。これらの推定値を計算するために、我々は、トレーニングシーケンスとして、既知の測定値のシーケンスを用いる。 Further, a matrix including an autocorrelation function and a cross correlation function is estimated. To calculate these estimates, we use a sequence of known measurements as the training sequence.
次式に示すとおり相互相関も推定する。
ここで、次の式としてフィルタを生成することができる(各予測に対して1つ、kは予測ステップの指標である)。
これが予測値をもたらす。
関連性に対して時系列データの分析を行うべきであり、また閾値を上回るデータの脱落または外れ値には、隣接するデータの平均値を用いて代入することができる。測定し忘れることもあること、あるいは人手による測定値の解釈において誤ることもあるのは通常のことであるので、これは重要なことである。被検者が装置を忘れたり休暇に出かけたりした等の状況では、長いデータ脱落を補間する必要があるかもしれない。線形補間は、線形回帰予測法の代替案でもある。例えば、BGの測定値が毎週1回取られる場合、既知のBGデータのベクトルは、毎日サンプリングされるBGベクトルのダウンサンプル版となる。これは、任意の補間間隔M日(またはサンプル)に対して次の式で説明することができる。
さらに、本発明の別の実施形態では、欠損データのシーケンスに基づいて線形補間と予測との間で自動的に切り換えるのが好ましいかもしれない。切り換えの適切な時点は、過去の既知のデータの残差分析によって決定することができる。残差は、特定のシーケンス内の線形補間を施されたデータが生データと比較されるケース1と、全く同じシーケンス内の予測データが生データと比較されるケース2との2つのケースから生成される。言うまでもなく、これは同一の間隔/シーケンスにおいて行われ、これらの2つのケース間での有益な比較結果が提供される。その目標は、残差をできる限り小さく維持することであり、その結果、2つのケースの交差部から、二乗残差の平均値である切り換え点を決定することができる。
Furthermore, in another embodiment of the present invention, it may be preferable to automatically switch between linear interpolation and prediction based on the sequence of missing data. The appropriate time for switching can be determined by residual analysis of past known data. Residuals are generated from two cases:
BGとRPPの合計または因子分解は、本発明者が代謝能力指標(MPI:Metabolic Performance Index)と呼ぶ代謝能力指標として用いることができる。これは、いくつかの異常および疾患を対象とすることができる指標であり、従って2型糖尿病に関連する疾患におけるセルフコントロールの促進およびライフスタイル変更の明確な指標とすることができる。図19を参照されたい。先の表示は、MPIインジケータも運動選手等に対するスポーツトレーニングにおいて有利に利用することができることを示している。
The sum of BG and RPP or factorization can be used as a metabolic capacity index that the inventor calls the Metabolic Performance Index (MPI). This is an indicator that can target several abnormalities and diseases, and thus can be a clear indicator of promoting self-control and lifestyle changes in diseases associated with
本発明者は、本発明案による代謝監視・表示装置が患者にとって自己管理のための非常に価値のある資産となると同時に、医師が患者の状態を明確かつ正確に評価し、追跡を行うための新たな道具となり、従って有用な治療用具として用いることができると確信している。ソフトウェア製品のあるバージョンのスクリーンショットを図20に示す。このマルチパラメータ代謝監視・表示装置は、そのトレーナが出力データを積極的に用いてその後の訓練を指導し能力を向上させることができる、ランナーあるいは水泳選手等といった運動選手のようないずれかの人間、または競走馬あるいは競争犬のようないずれかの哺乳動物の身体状況および向上を監視するのに用いることができることも確信している。 The inventor makes it possible for a doctor to evaluate and track a patient's condition clearly and accurately, while the metabolic monitoring and display device according to the present invention becomes a very valuable asset for self-management for the patient. I am confident that it will be a new tool and can therefore be used as a useful therapeutic tool. A screen shot of a version of the software product is shown in FIG. This multi-parameter metabolic monitoring / display device can be used by any person, such as an athlete such as a runner or swimmer, whose trainer can actively use the output data to guide subsequent training and improve their ability. We are also confident that it can be used to monitor the physical condition and improvement of any mammal, such as a racehorse or a race dog.
新たなハードウェアの開発に対する代替案として、標準的な実績のある技術および大量生産型の消費者向け医療監視装置をデータ収集用に用いることができ、この場合、コンピュータプログラム製品およびコンピュータ(デスクトップ、ラップトップ、パームトップまたはスマートフォン)を用いて、実際的かつ直観的な方法で情報を収集、ダウンロード、分析および提示することができる。さらに、マイクロプロセッサと身体活動用加速度計と表示用画面とを含む、インテリジェント血糖監視装置または血糖監視装置と血圧監視装置とを組み合わせたインテリジェントな装置を構築することができる。本発明は、計算、アナログ信号もしくはデジタル信号の格納および/または伝送などのさまざまな種類の用途に対して、ソフトウェアとハードウェアチップの両方およびDSPに実装することができる。 As an alternative to the development of new hardware, standard proven technology and mass-produced consumer medical monitoring devices can be used for data collection, in which case computer program products and computers (desktops, (Laptop, palmtop or smartphone) can be used to collect, download, analyze and present information in a practical and intuitive manner. In addition, an intelligent blood glucose monitoring device or an intelligent device combining a blood glucose monitoring device and a blood pressure monitoring device including a microprocessor, a physical activity accelerometer, and a display screen can be constructed. The present invention can be implemented in both software and hardware chips and DSPs for various types of applications such as computation, analog or digital signal storage and / or transmission.
説明した実施形態は、単に本発明の原理を例証するためのものにすぎない。本明細書に説明した装置および詳細の変更および変形形態は当業者には明らかであろうことが分かる。従って、特許請求の範囲によってのみ限定され、実施形態の記載および説明の目的で本明細書に提示した特定の詳細によって限定されるものではないことを意図している。 The described embodiments are merely illustrative for the principles of the present invention. It will be appreciated that variations and modifications to the apparatus and details described herein will be apparent to those skilled in the art. Accordingly, it is intended that the invention be limited only by the claims and not by the specific details presented herein for purposes of describing and describing the embodiments.
Claims (22)
侵襲的測定であって前記被検者に対して第1の影響力を有する第1の測定方法によって得られた第1の生物学的量のサンプルの生のシーケンスを受信し、かつ非侵襲的測定であって前記被検者に対して第2の影響力を有する第2の測定方法によって得られた第2の生物学的量のサンプルの生のシーケンスを受信するための入力インターフェース(20)であって、前記生物学的量は、有効な変動および非有効な変動を有し、
前記第1の生物学的量は、前記第2の生物学的量よりも正確な前記被検者の前記健康に関連する状態の表示を与え、前記第1の生物学的量および前記第2の生物学的量は、前記被検者の前記健康に関連する状態と相関関係を有し、かつ前記第2の影響力は、前記第1の影響力よりも小さい入力インターフェース(20)と、
前記第1の生物学的量のサンプルが存在しないある一定の期間に対して、前記第2の生物学的量のサンプルおよび、入手可能な限り、前記第1の生物学的量のサンプルを用いて、予測サンプルとして前記第1の生物学的量の推定値を提供するためのプレディクタ(30)と、
前記第1の生物学的量のサンプルおよび少なくとも1つの予測サンプルを有するシーケンスをフィルタ処理するためのフィルタ(22)であって、前記フィルタ処理されたシーケンスは、有効な変動およびフィルタ処理前の前記シーケンスと比較して低減された非有効な変動を有する、フィルタ(22)と、
前記フィルタ処理されたシーケンスに基づいて、または前記プレディクタによって生成された予測シーケンスに基づいて、前記被検者の前記健康に関連する状態の有効な変動を表す前記データの傾向として、少なくとも増加の表示、減少の表示または横ばいの表示を出力するための出力インターフェース(25)と、
を備える装置。A device for indicating a condition related to the health of a subject,
Receiving a raw sequence of samples of a first biological quantity obtained by a first measurement method that is an invasive measurement and has a first influence on said subject, and non-invasive Input interface (20) for receiving a raw sequence of samples of a second biological quantity obtained by a second measurement method that is a measurement and has a second influence on the subject The biological quantity has an effective variation and an ineffective variation,
The first biological quantity provides an indication of the health related condition of the subject that is more accurate than the second biological quantity, the first biological quantity and the second biological quantity. An input interface (20) having a correlation with a health-related state of the subject, and wherein the second influence is less than the first influence;
Using the second biological quantity sample and, if available, the first biological quantity sample for a period of time in which the first biological quantity sample is not present A predictor (30) for providing an estimate of the first biological quantity as a predictive sample;
A filter (22) for filtering a sequence having the first biological quantity of samples and at least one predictive sample, the filtered sequence comprising: A filter (22) having reduced ineffective variation compared to the sequence;
An indication of at least an increase as a trend of the data representing an effective variation in the health-related condition of the subject based on the filtered sequence or based on a predicted sequence generated by the predictor An output interface (25) for outputting a decrease display or leveling display;
A device comprising:
前記第2の測定方法は、心拍数測定、血圧測定または心拍数と血圧の積を得るための方法である、
請求項1に記載の装置。The first measurement method is measurement of blood glucose or plasma glucose,
The second measurement method is a method for obtaining heart rate measurement, blood pressure measurement, or a product of heart rate and blood pressure,
The apparatus of claim 1.
前記装置は、前記第2の生物学的量のサンプルの前記シーケンスを得るために、サンプルの前記第1のサブシーケンスおよびサンプルの前記第2のシーケンスを結合して、サンプルワイズ乗算を行うために用意されたコンバイナ(27)をさらに含む、
請求項1または請求項2に記載の装置。The input interface (20) is provided for receiving a first sub-sequence of samples and a second sequence of samples as the sequence of samples of the second biological quantity;
The apparatus combines the first sub-sequence of samples and the second sequence of samples to obtain a sample-wise multiplication to obtain the sequence of samples of the second biological quantity. Further comprising a prepared combiner (27),
Apparatus according to claim 1 or claim 2.
残差表示を取得するために、各フィルタ処理済み試験信号に関して、前記生シーケンスとフィルタ処理済み試験信号との間の差に基づいて残差値を導出するステップと、
前記残差表示に基づいて、サンプルの前記生シーケンスに個別に合わせた遮断周波数を決定するステップとを用いて前記遮断周波数を決定するために用意された遮断周波数計算機により構成される、請求項10または請求項11に記載の装置。Filtering the sample to obtain a filtered test signal to determine a plurality of different cutoff frequencies for the low pass filter;
Deriving a residual value based on the difference between the raw sequence and the filtered test signal for each filtered test signal to obtain a residual indication;
11. A cutoff frequency calculator prepared for determining the cutoff frequency using the step of determining a cutoff frequency individually adapted to the raw sequence of samples based on the residual indication. Or an apparatus according to claim 11.
低遮断周波数に対する残差エネルギーを用いて第1の線を決定し、
高遮断周波数に対する残差エネルギーを用いて第2の線を決定し、
前記遮断周波数を示す、前記第1の線と前記第2の線の交差点を見つける
ことによって、前記遮断周波数を決定するために用意されている、請求項12に記載の装置。The cutoff frequency calculator is
Determine the first line using the residual energy for the low cutoff frequency;
Determine the second line using the residual energy for the high cut-off frequency,
The apparatus of claim 12, wherein the apparatus is arranged to determine the cutoff frequency by finding an intersection of the first line and the second line that indicates the cutoff frequency.
前記プレディクタ(30)はさらに、前記第2の測定方法用のサンプルが前記入力インターフェースによって受信される少なくとも1間隔の3倍を含む実行時間の後に、前記第1の測定方法から更新値を受信するために用意されている、請求項1ないし請求項19のいずれかに記載の装置。The predictor (30) is provided for executing a regression algorithm;
The predictor (30) further receives an update value from the first measurement method after an execution time in which samples for the second measurement method include at least three times an interval received by the input interface. 20. An apparatus according to any of claims 1 to 19, provided for the purpose.
侵襲的測定であって前記被検者に対して第1の影響力を有する第1の測定方法によって得られた第1の生物学的量のサンプルの生のシーケンスを受信する工程(20)と、
非侵襲的測定であって前記被検者に対して第2の影響力を有する第2の測定方法によって得られた第2の生物学的量のサンプルの生のシーケンスを受信する工程(20)と、前記第1の生物学的量は、有効な変動および非有効な変動を有し、
前記工程(20)において、前記第1の生物学的量は、前記第2の生物学的量よりも正確な前記被検者の前記健康に関連する状態の表示を与え、前記第1の生物学的量および前記第2の生物学的量は、前記被検者の前記健康に関連する状態と相関関係を有し、かつ前記第2の影響力は、前記第1の影響力よりも小さい工程(20)と、前記第2の生物学的量は、有効な変動および非有効な変動を有し、
前記第1の生物学的量のサンプルが存在しないある一定の期間に対して、前記第2の生物学的量のサンプルおよび、入手可能な限り、前記第1の生物学的量のサンプルを用いて、予測サンプルとして前記第1の生物学的量の推定値を予測によって提供する工程(30)と、
前記第1の生物学的量のサンプルおよび少なくとも1つの予測サンプルを有するシーケンスをフィルタ処理するためのフィルタをする工程(22)であって、前記フィルタ処理されたシーケンスは、有効な変動およびフィルタ処理前の前記シーケンスと比較して低減された非有効な変動を有する、フィルタをする工程(22)と、
前記フィルタ処理されたシーケンスに基づいて、または前記予測によって生成された前記予測シーケンスに基づいて、前記被検者の前記健康に関連する状態の有効な変動を表す前記データの傾向として、少なくとも増加の表示、減少の表示または横ばいの表示を出力する工程(25)と、
を含む方法。A method for indicating a condition related to the health of a subject, said method comprising:
Receiving a raw sequence of samples of a first biological quantity obtained by a first measurement method that is an invasive measurement and has a first influence on the subject; ,
Receiving a raw sequence of samples of a second biological quantity obtained by a second measurement method that is a non-invasive measurement and has a second influence on the subject (20) And the first biological quantity has an effective variation and an ineffective variation;
In the step (20), the first biological quantity provides an indication of the health-related state of the subject that is more accurate than the second biological quantity, and the first biological quantity And the second biological quantity is correlated with the health-related condition of the subject, and the second influence is less than the first influence a step (20), the second biological quantity have a valid change and non-active change,
Using the second biological quantity sample and, if available, the first biological quantity sample for a period of time in which the first biological quantity sample is not present Providing an estimate of the first biological quantity as a prediction sample by prediction (30);
Filtering (22) to filter a sequence having the first biological quantity of samples and at least one predictive sample, wherein the filtered sequence is effective variation and filtering; Filtering (22) having reduced ineffective variation compared to the previous sequence;
Based on the filtered sequence or based on the prediction sequence generated by the prediction , the trend of the data representing an effective variation in the health-related state of the subject is at least increased Outputting a display, a decrease display or a leveling display (25);
Including methods.
Applications Claiming Priority (3)
| Application Number | Priority Date | Filing Date | Title |
|---|---|---|---|
| SE0400456A SE0400456D0 (en) | 2004-02-26 | 2004-02-26 | Multiparameter metabolic monitoring, a method and device for the improvement of management and control in borderline or manifest type 2 diabetes |
| SE0402139A SE0402139D0 (en) | 2004-09-07 | 2004-09-07 | Metabolic monitoring, a method and apparatus for indicating a subject's health-related condition |
| PCT/EP2005/002006 WO2005082233A1 (en) | 2004-02-26 | 2005-02-25 | Metabolic monitoring, a method and apparatus for indicating a health-related condition of a subject |
Related Child Applications (1)
| Application Number | Title | Priority Date | Filing Date |
|---|---|---|---|
| JP2010022797A Division JP4881448B2 (en) | 2004-02-26 | 2010-02-04 | Metabolic monitoring, method and apparatus for displaying conditions related to the health of a subject |
Publications (2)
| Publication Number | Publication Date |
|---|---|
| JP2007523709A JP2007523709A (en) | 2007-08-23 |
| JP4611372B2 true JP4611372B2 (en) | 2011-01-12 |
Family
ID=34914631
Family Applications (2)
| Application Number | Title | Priority Date | Filing Date |
|---|---|---|---|
| JP2007500167A Expired - Fee Related JP4611372B2 (en) | 2004-02-26 | 2005-02-25 | Metabolic monitoring, method and apparatus for displaying conditions related to the health of a subject |
| JP2010022797A Expired - Fee Related JP4881448B2 (en) | 2004-02-26 | 2010-02-04 | Metabolic monitoring, method and apparatus for displaying conditions related to the health of a subject |
Family Applications After (1)
| Application Number | Title | Priority Date | Filing Date |
|---|---|---|---|
| JP2010022797A Expired - Fee Related JP4881448B2 (en) | 2004-02-26 | 2010-02-04 | Metabolic monitoring, method and apparatus for displaying conditions related to the health of a subject |
Country Status (10)
| Country | Link |
|---|---|
| US (4) | US7878975B2 (en) |
| EP (1) | EP1718196B1 (en) |
| JP (2) | JP4611372B2 (en) |
| AT (1) | ATE427695T1 (en) |
| CA (2) | CA2833776C (en) |
| DE (1) | DE602005013750D1 (en) |
| DK (1) | DK1718196T3 (en) |
| ES (1) | ES2325169T3 (en) |
| RU (1) | RU2345705C2 (en) |
| WO (1) | WO2005082233A1 (en) |
Families Citing this family (144)
| Publication number | Priority date | Publication date | Assignee | Title |
|---|---|---|---|---|
| US20190357827A1 (en) | 2003-08-01 | 2019-11-28 | Dexcom, Inc. | Analyte sensor |
| US7299082B2 (en) * | 2003-10-31 | 2007-11-20 | Abbott Diabetes Care, Inc. | Method of calibrating an analyte-measurement device, and associated methods, devices and systems |
| ATE427695T1 (en) * | 2004-02-26 | 2009-04-15 | Diabetes Tools Sweden Ab | METABOLIC MONITORING, METHOD AND DEVICE FOR INDICATING A HEALTH-RELATED CONDITION OF A PERSON |
| US20100331646A1 (en) * | 2009-06-30 | 2010-12-30 | Abbott Diabetes Care Inc. | Health Management Devices and Methods |
| US9636450B2 (en) | 2007-02-19 | 2017-05-02 | Udo Hoss | Pump system modular components for delivering medication and analyte sensing at seperate insertion sites |
| US7547281B2 (en) * | 2005-02-01 | 2009-06-16 | Medtronic Minimed, Inc. | Algorithm sensor augmented bolus estimator for semi-closed loop infusion system |
| US8956291B2 (en) * | 2005-02-22 | 2015-02-17 | Admetsys Corporation | Balanced physiological monitoring and treatment system |
| EP1921980A4 (en) | 2005-08-31 | 2010-03-10 | Univ Virginia | Improving the accuracy of continuous glucose sensors |
| US8880138B2 (en) * | 2005-09-30 | 2014-11-04 | Abbott Diabetes Care Inc. | Device for channeling fluid and methods of use |
| CN102908130B (en) * | 2005-11-29 | 2015-04-22 | 风险获利有限公司 | Device for monitoring human health |
| US7885698B2 (en) | 2006-02-28 | 2011-02-08 | Abbott Diabetes Care Inc. | Method and system for providing continuous calibration of implantable analyte sensors |
| US7826879B2 (en) | 2006-02-28 | 2010-11-02 | Abbott Diabetes Care Inc. | Analyte sensors and methods of use |
| US7542955B2 (en) * | 2006-03-10 | 2009-06-02 | The General Electric Company | Exercise test interpretation |
| US8478557B2 (en) | 2009-07-31 | 2013-07-02 | Abbott Diabetes Care Inc. | Method and apparatus for providing analyte monitoring system calibration accuracy |
| US8140312B2 (en) | 2007-05-14 | 2012-03-20 | Abbott Diabetes Care Inc. | Method and system for determining analyte levels |
| US9392969B2 (en) | 2008-08-31 | 2016-07-19 | Abbott Diabetes Care Inc. | Closed loop control and signal attenuation detection |
| US7630748B2 (en) | 2006-10-25 | 2009-12-08 | Abbott Diabetes Care Inc. | Method and system for providing analyte monitoring |
| US8224415B2 (en) | 2009-01-29 | 2012-07-17 | Abbott Diabetes Care Inc. | Method and device for providing offset model based calibration for analyte sensor |
| US9675290B2 (en) | 2012-10-30 | 2017-06-13 | Abbott Diabetes Care Inc. | Sensitivity calibration of in vivo sensors used to measure analyte concentration |
| US8219173B2 (en) | 2008-09-30 | 2012-07-10 | Abbott Diabetes Care Inc. | Optimizing analyte sensor calibration |
| US7618369B2 (en) | 2006-10-02 | 2009-11-17 | Abbott Diabetes Care Inc. | Method and system for dynamically updating calibration parameters for an analyte sensor |
| US8374668B1 (en) | 2007-10-23 | 2013-02-12 | Abbott Diabetes Care Inc. | Analyte sensor with lag compensation |
| US8346335B2 (en) | 2008-03-28 | 2013-01-01 | Abbott Diabetes Care Inc. | Analyte sensor calibration management |
| US7653425B2 (en) | 2006-08-09 | 2010-01-26 | Abbott Diabetes Care Inc. | Method and system for providing calibration of an analyte sensor in an analyte monitoring system |
| US8473022B2 (en) | 2008-01-31 | 2013-06-25 | Abbott Diabetes Care Inc. | Analyte sensor with time lag compensation |
| US9339217B2 (en) | 2011-11-25 | 2016-05-17 | Abbott Diabetes Care Inc. | Analyte monitoring system and methods of use |
| JP4830765B2 (en) * | 2006-09-29 | 2011-12-07 | パナソニック電工株式会社 | Activity measurement system |
| CN102772212A (en) | 2006-10-26 | 2012-11-14 | 雅培糖尿病护理公司 | Method, device and system for detection of sensitivity decline in analyte sensors |
| JP5016316B2 (en) * | 2007-01-31 | 2012-09-05 | メディアクロス株式会社 | Metabolic syndrome blood vessel evaluation system |
| US8732188B2 (en) | 2007-02-18 | 2014-05-20 | Abbott Diabetes Care Inc. | Method and system for providing contextual based medication dosage determination |
| US8930203B2 (en) | 2007-02-18 | 2015-01-06 | Abbott Diabetes Care Inc. | Multi-function analyte test device and methods therefor |
| EP3741291A1 (en) | 2007-04-14 | 2020-11-25 | Abbott Diabetes Care, Inc. | Method and apparatus for providing data processing and control in medical communication system |
| CA2683953C (en) | 2007-04-14 | 2016-08-02 | Abbott Diabetes Care Inc. | Method and apparatus for providing data processing and control in medical communication system |
| US9615780B2 (en) | 2007-04-14 | 2017-04-11 | Abbott Diabetes Care Inc. | Method and apparatus for providing data processing and control in medical communication system |
| US9008743B2 (en) | 2007-04-14 | 2015-04-14 | Abbott Diabetes Care Inc. | Method and apparatus for providing data processing and control in medical communication system |
| US8260558B2 (en) | 2007-05-14 | 2012-09-04 | Abbott Diabetes Care Inc. | Method and apparatus for providing data processing and control in a medical communication system |
| US8600681B2 (en) | 2007-05-14 | 2013-12-03 | Abbott Diabetes Care Inc. | Method and apparatus for providing data processing and control in a medical communication system |
| US9125548B2 (en) | 2007-05-14 | 2015-09-08 | Abbott Diabetes Care Inc. | Method and apparatus for providing data processing and control in a medical communication system |
| US10002233B2 (en) | 2007-05-14 | 2018-06-19 | Abbott Diabetes Care Inc. | Method and apparatus for providing data processing and control in a medical communication system |
| US8444560B2 (en) | 2007-05-14 | 2013-05-21 | Abbott Diabetes Care Inc. | Method and apparatus for providing data processing and control in a medical communication system |
| US8239166B2 (en) | 2007-05-14 | 2012-08-07 | Abbott Diabetes Care Inc. | Method and apparatus for providing data processing and control in a medical communication system |
| US8103471B2 (en) | 2007-05-14 | 2012-01-24 | Abbott Diabetes Care Inc. | Method and apparatus for providing data processing and control in a medical communication system |
| US8560038B2 (en) | 2007-05-14 | 2013-10-15 | Abbott Diabetes Care Inc. | Method and apparatus for providing data processing and control in a medical communication system |
| WO2008144616A1 (en) * | 2007-05-18 | 2008-11-27 | Heidi Kay | Lipid raft, caveolin protein, and caveolar function modulation compounds and associated synthetic and therapeutic methods |
| ES2681895T3 (en) * | 2007-06-18 | 2018-09-17 | F. Hoffmann-La Roche Ag | Glucose control method and system to monitor the individual metabolic response and to generate a nutritional response |
| CN101689224B (en) | 2007-06-27 | 2015-06-17 | 霍夫曼-拉罗奇有限公司 | System for developing patient specific therapies based on dynamic modeling of patient physiology and method thereof |
| DK2191405T3 (en) | 2007-06-27 | 2019-07-15 | Hoffmann La Roche | Medical Diagnostic, Treatment and Forecasting System for Incident Events and Procedures thereof |
| US8834366B2 (en) | 2007-07-31 | 2014-09-16 | Abbott Diabetes Care Inc. | Method and apparatus for providing analyte sensor calibration |
| CA2702408C (en) * | 2007-10-12 | 2019-08-06 | Patientslikeme, Inc. | Self-improving method of using online communities to predict health-related outcomes |
| US8377031B2 (en) | 2007-10-23 | 2013-02-19 | Abbott Diabetes Care Inc. | Closed loop control system with safety parameters and methods |
| US8216138B1 (en) | 2007-10-23 | 2012-07-10 | Abbott Diabetes Care Inc. | Correlation of alternative site blood and interstitial fluid glucose concentrations to venous glucose concentration |
| US8409093B2 (en) | 2007-10-23 | 2013-04-02 | Abbott Diabetes Care Inc. | Assessing measures of glycemic variability |
| US8882668B2 (en) * | 2007-11-19 | 2014-11-11 | Elizabeth S. Thompson | Method and process for body composition management |
| US20090164239A1 (en) | 2007-12-19 | 2009-06-25 | Abbott Diabetes Care, Inc. | Dynamic Display Of Glucose Information |
| US8066640B2 (en) * | 2008-04-22 | 2011-11-29 | EOS Health, Inc. | Cellular GPRS-communication linked glucometer—pedometer |
| US8876755B2 (en) | 2008-07-14 | 2014-11-04 | Abbott Diabetes Care Inc. | Closed loop control system interface and methods |
| WO2010022387A1 (en) * | 2008-08-22 | 2010-02-25 | Eastern Virginia Medical School | Method and apparatus for chronic disease control |
| US9943644B2 (en) | 2008-08-31 | 2018-04-17 | Abbott Diabetes Care Inc. | Closed loop control with reference measurement and methods thereof |
| US8734422B2 (en) * | 2008-08-31 | 2014-05-27 | Abbott Diabetes Care Inc. | Closed loop control with improved alarm functions |
| US8622988B2 (en) * | 2008-08-31 | 2014-01-07 | Abbott Diabetes Care Inc. | Variable rate closed loop control and methods |
| US20100057040A1 (en) | 2008-08-31 | 2010-03-04 | Abbott Diabetes Care, Inc. | Robust Closed Loop Control And Methods |
| US8986208B2 (en) | 2008-09-30 | 2015-03-24 | Abbott Diabetes Care Inc. | Analyte sensor sensitivity attenuation mitigation |
| US8185182B1 (en) * | 2008-10-14 | 2012-05-22 | Ravi Shankar | Noninvasive glucose measurement |
| ES2338624B1 (en) * | 2008-11-07 | 2011-09-13 | Sabirmedical,S.L. | SYSTEM AND APPARATUS FOR NON-INVASIVE MEASUREMENT OF GLUCOSE LEVELS IN BLOOD. |
| US9326707B2 (en) | 2008-11-10 | 2016-05-03 | Abbott Diabetes Care Inc. | Alarm characterization for analyte monitoring devices and systems |
| US8103456B2 (en) | 2009-01-29 | 2012-01-24 | Abbott Diabetes Care Inc. | Method and device for early signal attenuation detection using blood glucose measurements |
| US8216136B2 (en) | 2009-03-05 | 2012-07-10 | Nellcor Puritan Bennett Llc | Systems and methods for monitoring heart rate and blood pressure correlation |
| JP5239951B2 (en) * | 2009-03-09 | 2013-07-17 | オムロンヘルスケア株式会社 | Health management device |
| US8497777B2 (en) | 2009-04-15 | 2013-07-30 | Abbott Diabetes Care Inc. | Analyte monitoring system having an alert |
| WO2010121229A1 (en) | 2009-04-16 | 2010-10-21 | Abbott Diabetes Care Inc. | Analyte sensor calibration management |
| EP2420184B1 (en) | 2009-04-17 | 2016-05-11 | ARKRAY, Inc. | Data provision method, program and server device |
| EP2425209A4 (en) | 2009-04-29 | 2013-01-09 | Abbott Diabetes Care Inc | Method and system for providing real time analyte sensor calibration with retrospective backfill |
| AU2010242036A1 (en) | 2009-04-30 | 2011-11-03 | Patientslikeme, Inc. | Systems and methods for encouragement of data submission in online communities |
| CA2766944C (en) * | 2009-06-30 | 2019-10-29 | Lifescan, Inc. | Analyte testing methods and device for calculating basal insulin therapy |
| CN102483776A (en) * | 2009-06-30 | 2012-05-30 | 生命扫描苏格兰有限公司 | Systems for diabetes management and methods |
| CA2766865A1 (en) * | 2009-06-30 | 2011-01-06 | Lifescan, Inc. | Analyte testing method and system |
| EP3173014B1 (en) | 2009-07-23 | 2021-08-18 | Abbott Diabetes Care, Inc. | Real time management of data relating to physiological control of glucose levels |
| DK3689237T3 (en) | 2009-07-23 | 2021-08-16 | Abbott Diabetes Care Inc | Method of preparation and system for continuous analyte measurement |
| DK3718922T3 (en) | 2009-08-31 | 2022-04-19 | Abbott Diabetes Care Inc | Glucose monitoring system and procedure |
| EP2482720A4 (en) | 2009-09-29 | 2014-04-23 | Abbott Diabetes Care Inc | Method and apparatus for providing notification function in analyte monitoring systems |
| EP2482712B1 (en) * | 2009-09-29 | 2014-05-07 | Lifescan Scotland Limited | Analyte testing method and device for diabetes management |
| EP2494323A4 (en) | 2009-10-30 | 2014-07-16 | Abbott Diabetes Care Inc | Method and apparatus for detecting false hypoglycemic conditions |
| US20110184265A1 (en) * | 2010-01-22 | 2011-07-28 | Abbott Diabetes Care Inc. | Method and Apparatus for Providing Notification in Analyte Monitoring Systems |
| CA2789630C (en) * | 2010-02-11 | 2016-12-13 | The Regents Of The University Of California | Systems, devices and methods to deliver biological factors or drugs to a subject |
| WO2011106029A1 (en) * | 2010-02-25 | 2011-09-01 | Lifescan Scotland Limited | Analyte testing method and system with high and low blood glucose trends notification |
| WO2011112753A1 (en) | 2010-03-10 | 2011-09-15 | Abbott Diabetes Care Inc. | Systems, devices and methods for managing glucose levels |
| US8635046B2 (en) | 2010-06-23 | 2014-01-21 | Abbott Diabetes Care Inc. | Method and system for evaluating analyte sensor response characteristics |
| US10092229B2 (en) | 2010-06-29 | 2018-10-09 | Abbott Diabetes Care Inc. | Calibration of analyte measurement system |
| JP5838557B2 (en) * | 2010-07-05 | 2016-01-06 | ソニー株式会社 | Biological information processing method and apparatus, and recording medium |
| EP2624745A4 (en) | 2010-10-07 | 2018-05-23 | Abbott Diabetes Care, Inc. | Analyte monitoring devices and methods |
| US8928671B2 (en) | 2010-11-24 | 2015-01-06 | Fujitsu Limited | Recording and analyzing data on a 3D avatar |
| US20120197622A1 (en) * | 2011-01-31 | 2012-08-02 | Fujitsu Limited | Monitoring Insulin Resistance |
| US20120197621A1 (en) * | 2011-01-31 | 2012-08-02 | Fujitsu Limited | Diagnosing Insulin Resistance |
| ES2847578T3 (en) | 2011-04-15 | 2021-08-03 | Dexcom Inc | Advanced analyte sensor calibration and error detection |
| JP2012235869A (en) | 2011-05-11 | 2012-12-06 | Sony Corp | Information processing apparatus and information processing method |
| US20130085349A1 (en) * | 2011-06-21 | 2013-04-04 | Yofimeter, Llc | Analyte testing devices |
| US9622691B2 (en) | 2011-10-31 | 2017-04-18 | Abbott Diabetes Care Inc. | Model based variable risk false glucose threshold alarm prevention mechanism |
| US8710993B2 (en) | 2011-11-23 | 2014-04-29 | Abbott Diabetes Care Inc. | Mitigating single point failure of devices in an analyte monitoring system and methods thereof |
| US9317656B2 (en) | 2011-11-23 | 2016-04-19 | Abbott Diabetes Care Inc. | Compatibility mechanisms for devices in a continuous analyte monitoring system and methods thereof |
| US20130231949A1 (en) | 2011-12-16 | 2013-09-05 | Dimitar V. Baronov | Systems and methods for transitioning patient care from signal-based monitoring to risk-based monitoring |
| US11676730B2 (en) | 2011-12-16 | 2023-06-13 | Etiometry Inc. | System and methods for transitioning patient care from signal based monitoring to risk based monitoring |
| US9474472B2 (en) * | 2011-12-30 | 2016-10-25 | Intel Corporation | Apparatus, method, and system for accurate estimation of total energy expenditure in daily activities |
| JP6262200B2 (en) * | 2012-03-23 | 2018-01-17 | イーティオメトリー インコーポレイテッドEtiometry Inc. | System and method for transferring patient care from signal-based monitoring to risk-based monitoring |
| US9433348B2 (en) * | 2012-05-18 | 2016-09-06 | Koninklijke Philips N.V. | Method of rendering hemodynamic instability index indicator information |
| US9536449B2 (en) | 2013-05-23 | 2017-01-03 | Medibotics Llc | Smart watch and food utensil for monitoring food consumption |
| US9042596B2 (en) | 2012-06-14 | 2015-05-26 | Medibotics Llc | Willpower watch (TM)—a wearable food consumption monitor |
| US9442100B2 (en) | 2013-12-18 | 2016-09-13 | Medibotics Llc | Caloric intake measuring system using spectroscopic and 3D imaging analysis |
| US9254099B2 (en) | 2013-05-23 | 2016-02-09 | Medibotics Llc | Smart watch and food-imaging member for monitoring food consumption |
| US10314492B2 (en) | 2013-05-23 | 2019-06-11 | Medibotics Llc | Wearable spectroscopic sensor to measure food consumption based on interaction between light and the human body |
| EP3395252A1 (en) | 2012-08-30 | 2018-10-31 | Abbott Diabetes Care, Inc. | Dropout detection in continuous analyte monitoring data during data excursions |
| US9907492B2 (en) | 2012-09-26 | 2018-03-06 | Abbott Diabetes Care Inc. | Method and apparatus for improving lag correction during in vivo measurement of analyte concentration with analyte concentration variability and range data |
| US9119528B2 (en) | 2012-10-30 | 2015-09-01 | Dexcom, Inc. | Systems and methods for providing sensitive and specific alarms |
| CN104602599B (en) | 2012-11-01 | 2017-07-11 | 泰尔茂株式会社 | Sensing device further and method for sensing |
| US10433773B1 (en) | 2013-03-15 | 2019-10-08 | Abbott Diabetes Care Inc. | Noise rejection methods and apparatus for sparsely sampled analyte sensor data |
| US10076285B2 (en) | 2013-03-15 | 2018-09-18 | Abbott Diabetes Care Inc. | Sensor fault detection using analyte sensor data pattern comparison |
| US9474475B1 (en) | 2013-03-15 | 2016-10-25 | Abbott Diabetes Care Inc. | Multi-rate analyte sensor data collection with sample rate configurable signal processing |
| US9529385B2 (en) | 2013-05-23 | 2016-12-27 | Medibotics Llc | Smart watch and human-to-computer interface for monitoring food consumption |
| US11229382B2 (en) | 2013-12-31 | 2022-01-25 | Abbott Diabetes Care Inc. | Self-powered analyte sensor and devices using the same |
| EP2921105B1 (en) * | 2014-03-20 | 2018-02-28 | Physical Enterprises, Inc. (dba Mio Global) | Health risk indicator determination |
| EP3865063A1 (en) | 2014-03-30 | 2021-08-18 | Abbott Diabetes Care, Inc. | Method and apparatus for determining meal start and peak events in analyte monitoring systems |
| CA2991716A1 (en) | 2015-07-10 | 2017-01-19 | Abbott Diabetes Care Inc. | System, device and method of dynamic glucose profile response to physiological parameters |
| CN109789264B (en) | 2016-09-27 | 2021-06-22 | 比格福特生物医药公司 | Drug injection and disease management systems, devices and methods |
| USD836769S1 (en) | 2016-12-12 | 2018-12-25 | Bigfoot Biomedical, Inc. | Insulin delivery controller |
| CN109922716A (en) | 2016-12-12 | 2019-06-21 | 比格福特生物医药公司 | The alarm of medicament delivery device and vigilant and relevant system and method |
| EP3600014A4 (en) | 2017-03-21 | 2020-10-21 | Abbott Diabetes Care Inc. | Methods, devices and system for providing diabetic condition diagnosis and therapy |
| JP2018157876A (en) * | 2017-03-22 | 2018-10-11 | ルネサスエレクトロニクス株式会社 | Heartbeat measuring system and heartbeat measuring method |
| USD839294S1 (en) | 2017-06-16 | 2019-01-29 | Bigfoot Biomedical, Inc. | Display screen with graphical user interface for closed-loop medication delivery |
| JP6881064B2 (en) * | 2017-06-16 | 2021-06-02 | オムロンヘルスケア株式会社 | Devices, methods and programs for assessing Na / K specific sensitivity of blood pressure |
| EP3651647A1 (en) | 2017-07-13 | 2020-05-20 | Bigfoot Biomedical, Inc. | Multi-scale display of blood glucose information |
| FI20177098A1 (en) | 2017-08-29 | 2019-03-01 | Leppaeluoto Juhani | Methods and device arrangements for physical activity thresholds reducing risks of diabetes, cardiovascular diseases, inflammations, dementia and mortality in sedentary subjects |
| KR102498120B1 (en) * | 2017-10-17 | 2023-02-09 | 삼성전자주식회사 | Apparatus and method for correcting error of bio-information sensor, apparatus and method for estimating bio-information |
| US11331022B2 (en) | 2017-10-24 | 2022-05-17 | Dexcom, Inc. | Pre-connected analyte sensors |
| US11943876B2 (en) | 2017-10-24 | 2024-03-26 | Dexcom, Inc. | Pre-connected analyte sensors |
| US11464459B2 (en) | 2017-12-12 | 2022-10-11 | Bigfoot Biomedical, Inc. | User interface for diabetes management systems including flash glucose monitor |
| US11116899B2 (en) | 2017-12-12 | 2021-09-14 | Bigfoot Biomedical, Inc. | User interface for diabetes management systems and devices |
| CA3084378A1 (en) | 2017-12-12 | 2019-06-20 | Bigfoot Biomedical, Inc. | Therapy management systems, methods, and devices |
| US11197964B2 (en) | 2017-12-12 | 2021-12-14 | Bigfoot Biomedical, Inc. | Pen cap for medication injection pen having temperature sensor |
| US11083852B2 (en) | 2017-12-12 | 2021-08-10 | Bigfoot Biomedical, Inc. | Insulin injection assistance systems, methods, and devices |
| US11077243B2 (en) | 2017-12-12 | 2021-08-03 | Bigfoot Biomedical, Inc. | Devices, systems, and methods for estimating active medication from injections |
| US10987464B2 (en) | 2017-12-12 | 2021-04-27 | Bigfoot Biomedical, Inc. | Pen cap for insulin injection pens and associated methods and systems |
| FR3079130A1 (en) * | 2018-03-20 | 2019-09-27 | Commissariat A L'energie Atomique Et Aux Energies Alternatives | SYSTEM FOR PREDICTING THE GLYCEMIA OF A PATIENT |
| TWI685330B (en) * | 2018-11-22 | 2020-02-21 | 財團法人金屬工業研究發展中心 | Method and system for measuring spasticity |
| US11894139B1 (en) | 2018-12-03 | 2024-02-06 | Patientslikeme Llc | Disease spectrum classification |
| US11426114B2 (en) | 2018-12-21 | 2022-08-30 | Metal Industries Research & Development Centre | Method and system for measuring spasticity |
Family Cites Families (22)
| Publication number | Priority date | Publication date | Assignee | Title |
|---|---|---|---|---|
| JP3363150B2 (en) * | 1991-03-07 | 2003-01-08 | マシモ・コーポレイション | Pulse oximeter and processor in pulse oximeter |
| DE4342105A1 (en) * | 1993-12-12 | 1995-06-14 | Cho Ok Kyung | Method and device for the non-invasive determination of the concentration of glucose in parts of the human body, in particular in human blood, by performing highly accurate temperature measurements of the human body |
| US5823966A (en) | 1997-05-20 | 1998-10-20 | Buchert; Janusz Michal | Non-invasive continuous blood glucose monitoring |
| AU762922B2 (en) * | 1998-02-04 | 2003-07-10 | Dermal Therapy (Barbados) Inc. | Method and apparatus for non-invasive determination of glucose in body fluids |
| WO2000018289A1 (en) * | 1998-09-30 | 2000-04-06 | Cygnus, Inc. | Method and device for predicting physiological values |
| US6157041A (en) * | 1998-10-13 | 2000-12-05 | Rio Grande Medical Technologies, Inc. | Methods and apparatus for tailoring spectroscopic calibration models |
| US6151517A (en) * | 1999-01-22 | 2000-11-21 | Futrex Inc. | Method and apparatus for noninvasive quantitative measurement of blood analytes |
| DE60031427T2 (en) * | 1999-08-31 | 2007-09-20 | NIR Diagnostics Inc., Campbellville | METHOD FOR CALIBRATING A SPECTROSCOPY DEVICE |
| US7890295B2 (en) * | 2000-02-23 | 2011-02-15 | Medtronic Minimed, Inc. | Real time self-adjusting calibration algorithm |
| US6572542B1 (en) * | 2000-03-03 | 2003-06-03 | Medtronic, Inc. | System and method for monitoring and controlling the glycemic state of a patient |
| EP1309271B1 (en) * | 2000-08-18 | 2008-04-16 | Animas Technologies LLC | Device for prediction of hypoglycemic events |
| RU2198586C2 (en) | 2000-11-21 | 2003-02-20 | Кабардино-Балкарский государственный университет | Method of determining blood glucose level |
| RU2180514C1 (en) | 2001-01-15 | 2002-03-20 | ШМЕЛЕВ Владимир Михайлович | Method for determining glucose concentration in noninvasive way |
| AUPR343401A0 (en) * | 2001-02-28 | 2001-03-29 | Nguyen, Hung | Modelling and design for early warning systems using physiological responses |
| US8010174B2 (en) * | 2003-08-22 | 2011-08-30 | Dexcom, Inc. | Systems and methods for replacing signal artifacts in a glucose sensor data stream |
| ATE507766T1 (en) * | 2002-03-22 | 2011-05-15 | Animas Technologies Llc | PERFORMANCE IMPROVEMENT OF AN ANALYTE MONITORING DEVICE |
| AU2003227359A1 (en) * | 2002-04-24 | 2003-11-10 | Colin Corporation | Pulse wave analyzing method, pulse wave analyzing software, and so forth |
| US7778680B2 (en) * | 2003-08-01 | 2010-08-17 | Dexcom, Inc. | System and methods for processing analyte sensor data |
| US7502643B2 (en) * | 2003-09-12 | 2009-03-10 | Bodymedia, Inc. | Method and apparatus for measuring heart related parameters |
| US20050137470A1 (en) * | 2003-12-08 | 2005-06-23 | Rosenthal Robert D. | Method and apparatus for low blood glucose level detection |
| EP2329763B1 (en) * | 2003-12-09 | 2017-06-21 | DexCom, Inc. | Signal processing for continuous analyte sensor |
| ATE427695T1 (en) | 2004-02-26 | 2009-04-15 | Diabetes Tools Sweden Ab | METABOLIC MONITORING, METHOD AND DEVICE FOR INDICATING A HEALTH-RELATED CONDITION OF A PERSON |
-
2005
- 2005-02-25 AT AT05715547T patent/ATE427695T1/en not_active IP Right Cessation
- 2005-02-25 CA CA2833776A patent/CA2833776C/en not_active Expired - Fee Related
- 2005-02-25 JP JP2007500167A patent/JP4611372B2/en not_active Expired - Fee Related
- 2005-02-25 EP EP05715547A patent/EP1718196B1/en not_active Not-in-force
- 2005-02-25 CA CA2556592A patent/CA2556592C/en not_active Expired - Fee Related
- 2005-02-25 DK DK05715547T patent/DK1718196T3/en active
- 2005-02-25 WO PCT/EP2005/002006 patent/WO2005082233A1/en active Application Filing
- 2005-02-25 RU RU2006134033/14A patent/RU2345705C2/en not_active IP Right Cessation
- 2005-02-25 DE DE602005013750T patent/DE602005013750D1/en active Active
- 2005-02-25 ES ES05715547T patent/ES2325169T3/en active Active
-
2006
- 2006-08-25 US US11/467,476 patent/US7878975B2/en not_active Expired - Fee Related
-
2010
- 2010-02-04 JP JP2010022797A patent/JP4881448B2/en not_active Expired - Fee Related
- 2010-07-23 US US12/842,831 patent/US8858435B2/en not_active Expired - Fee Related
-
2014
- 2014-09-30 US US14/503,008 patent/US9384324B2/en not_active Expired - Fee Related
-
2016
- 2016-05-27 US US15/167,815 patent/US20160345842A1/en not_active Abandoned
Also Published As
| Publication number | Publication date |
|---|---|
| JP2007523709A (en) | 2007-08-23 |
| US9384324B2 (en) | 2016-07-05 |
| US20150019139A1 (en) | 2015-01-15 |
| ES2325169T3 (en) | 2009-08-27 |
| CA2833776C (en) | 2017-03-28 |
| ATE427695T1 (en) | 2009-04-15 |
| RU2345705C2 (en) | 2009-02-10 |
| EP1718196A1 (en) | 2006-11-08 |
| CA2556592A1 (en) | 2005-09-09 |
| US20110166791A1 (en) | 2011-07-07 |
| EP1718196B1 (en) | 2009-04-08 |
| DK1718196T3 (en) | 2009-07-13 |
| JP4881448B2 (en) | 2012-02-22 |
| WO2005082233A1 (en) | 2005-09-09 |
| RU2006134033A (en) | 2008-04-10 |
| US20070060803A1 (en) | 2007-03-15 |
| US20160345842A1 (en) | 2016-12-01 |
| DE602005013750D1 (en) | 2009-05-20 |
| CA2556592C (en) | 2014-01-28 |
| US7878975B2 (en) | 2011-02-01 |
| JP2010148884A (en) | 2010-07-08 |
| US8858435B2 (en) | 2014-10-14 |
| CA2833776A1 (en) | 2005-09-09 |
Similar Documents
| Publication | Publication Date | Title |
|---|---|---|
| JP4611372B2 (en) | Metabolic monitoring, method and apparatus for displaying conditions related to the health of a subject | |
| Al Osman et al. | Ubiquitous biofeedback serious game for stress management | |
| Laborde et al. | Heart rate variability and cardiac vagal tone in psychophysiological research–recommendations for experiment planning, data analysis, and data reporting | |
| Sanches et al. | Mind the body! Designing a mobile stress management application encouraging personal reflection | |
| Blumenthal et al. | Exercise and weight loss reduce blood pressure in men and women with mild hypertension: effects on cardiovascular, metabolic, and hemodynamic functioning | |
| JP4410234B2 (en) | Method and apparatus for promoting physiological coherence and autonomic balance | |
| JP6047346B2 (en) | Biological information processing system, wearable device, server system, and program | |
| KR101867198B1 (en) | Estimation device, program, estimation method, and estimation system | |
| Timmons et al. | The health outcomes and physical activity in preschoolers (HOPP) study: rationale and design | |
| JP2016131604A (en) | Biological information measurement system, biological information measurement device, and biological information measurement method | |
| Recio-Rodriguez et al. | EVIDENT 3 Study: A randomized, controlled clinical trial to reduce inactivity and caloric intake in sedentary and overweight or obese people using a smartphone application: Study protocol | |
| Medeiros et al. | Weekly vagal modulations and their associations with physical fitness and physical activity | |
| Shumate et al. | Validity of the Polar Vantage M watch when measuring heart rate at different exercise intensities | |
| Pope et al. | Accuracy of commercially available smartwatches in assessing energy expenditure during rest and exercise | |
| Leidy et al. | Sensitivity and reproducibility of the dual-mode actigraph under controlled levels of activity intensity | |
| CN100446719C (en) | Metabolic monitoring, a method and apparatus for indicating a health-related condition of a subject | |
| Hsiao et al. | Usability of wearable devices with a novel cardiac force index for estimating the dynamic cardiac function: Observational study | |
| Shephard | Physical activity and optimal health: the challenge to epidemiology | |
| Fahrenberg | Assessment in daily life. A review of computer-assisted methodologies and applications in psychology and psychophysiology, years 2000-2005 | |
| Nuss et al. | Accuracy of heart rate and energy expenditure estimations of wrist-worn and arm-worn Apple Watches | |
| Buntoro et al. | Experimentation of Gamification for Health and Fitness Mobile Application | |
| Montalvo et al. | Commercial Smart Watches and Heart Rate Monitors: A Concurrent Validity Analysis | |
| Sherman | Comparison of weekly HRV measures collected from two different recording times and their relation to performance in collegiate female rowers | |
| Van Camp | Accuracy of predicted energy expenditure from a Fitbit Inspire HR activity monitor during short-and long-duration exercise | |
| Labyak et al. | Measurement issues related to actigraphy use in older women |
Legal Events
| Date | Code | Title | Description |
|---|---|---|---|
| A131 | Notification of reasons for refusal |
Free format text: JAPANESE INTERMEDIATE CODE: A131 Effective date: 20090804 |
|
| A601 | Written request for extension of time |
Free format text: JAPANESE INTERMEDIATE CODE: A601 Effective date: 20091102 |
|
| A602 | Written permission of extension of time |
Free format text: JAPANESE INTERMEDIATE CODE: A602 Effective date: 20091110 |
|
| A521 | Request for written amendment filed |
Free format text: JAPANESE INTERMEDIATE CODE: A523 Effective date: 20100204 |
|
| A131 | Notification of reasons for refusal |
Free format text: JAPANESE INTERMEDIATE CODE: A131 Effective date: 20100413 |
|
| A521 | Request for written amendment filed |
Free format text: JAPANESE INTERMEDIATE CODE: A523 Effective date: 20100629 |
|
| TRDD | Decision of grant or rejection written | ||
| A01 | Written decision to grant a patent or to grant a registration (utility model) |
Free format text: JAPANESE INTERMEDIATE CODE: A01 Effective date: 20100928 |
|
| A01 | Written decision to grant a patent or to grant a registration (utility model) |
Free format text: JAPANESE INTERMEDIATE CODE: A01 |
|
| A61 | First payment of annual fees (during grant procedure) |
Free format text: JAPANESE INTERMEDIATE CODE: A61 Effective date: 20101013 |
|
| FPAY | Renewal fee payment (event date is renewal date of database) |
Free format text: PAYMENT UNTIL: 20131022 Year of fee payment: 3 |
|
| R150 | Certificate of patent or registration of utility model |
Free format text: JAPANESE INTERMEDIATE CODE: R150 |
|
| R250 | Receipt of annual fees |
Free format text: JAPANESE INTERMEDIATE CODE: R250 |
|
| R250 | Receipt of annual fees |
Free format text: JAPANESE INTERMEDIATE CODE: R250 |
|
| R250 | Receipt of annual fees |
Free format text: JAPANESE INTERMEDIATE CODE: R250 |
|
| R250 | Receipt of annual fees |
Free format text: JAPANESE INTERMEDIATE CODE: R250 |
|
| R250 | Receipt of annual fees |
Free format text: JAPANESE INTERMEDIATE CODE: R250 |
|
| LAPS | Cancellation because of no payment of annual fees |