EP2538185A2 - A method and system for spectrum data analysis - Google Patents
A method and system for spectrum data analysis Download PDFInfo
- Publication number
- EP2538185A2 EP2538185A2 EP12166979A EP12166979A EP2538185A2 EP 2538185 A2 EP2538185 A2 EP 2538185A2 EP 12166979 A EP12166979 A EP 12166979A EP 12166979 A EP12166979 A EP 12166979A EP 2538185 A2 EP2538185 A2 EP 2538185A2
- Authority
- EP
- European Patent Office
- Prior art keywords
- spectrum
- approximation
- elements
- data
- templates
- Prior art date
- Legal status (The legal status is an assumption and is not a legal conclusion. Google has not performed a legal analysis and makes no representation as to the accuracy of the status listed.)
- Withdrawn
Links
- 238000001228 spectrum Methods 0.000 title claims abstract description 139
- 238000000034 method Methods 0.000 title claims abstract description 46
- 238000007405 data analysis Methods 0.000 title claims abstract description 6
- 239000000463 material Substances 0.000 claims abstract description 22
- 239000000203 mixture Substances 0.000 claims description 28
- 229910052760 oxygen Inorganic materials 0.000 claims description 13
- QVGXLLKOCUKJST-UHFFFAOYSA-N atomic oxygen Chemical compound [O] QVGXLLKOCUKJST-UHFFFAOYSA-N 0.000 claims description 12
- 238000004590 computer program Methods 0.000 claims description 12
- 238000010894 electron beam technology Methods 0.000 claims description 12
- 239000001301 oxygen Substances 0.000 claims description 12
- 238000002083 X-ray spectrum Methods 0.000 claims description 5
- 230000003595 spectral effect Effects 0.000 claims description 3
- 238000006467 substitution reaction Methods 0.000 claims description 2
- 230000003287 optical effect Effects 0.000 abstract description 5
- 229910052500 inorganic mineral Inorganic materials 0.000 description 32
- 239000011707 mineral Substances 0.000 description 32
- 235000010755 mineral Nutrition 0.000 description 31
- 238000004422 calculation algorithm Methods 0.000 description 28
- PXHVJJICTQNCMI-UHFFFAOYSA-N Nickel Chemical compound [Ni] PXHVJJICTQNCMI-UHFFFAOYSA-N 0.000 description 19
- 230000005855 radiation Effects 0.000 description 17
- 238000012545 processing Methods 0.000 description 15
- 238000010183 spectrum analysis Methods 0.000 description 15
- 238000003860 storage Methods 0.000 description 14
- -1 fluorine Manganese Iron Sodium Zinc Chemical compound 0.000 description 13
- 238000004458 analytical method Methods 0.000 description 11
- 238000012937 correction Methods 0.000 description 9
- 229910052759 nickel Inorganic materials 0.000 description 9
- 229910052710 silicon Inorganic materials 0.000 description 9
- XEEYBQQBJWHFJM-UHFFFAOYSA-N Iron Chemical compound [Fe] XEEYBQQBJWHFJM-UHFFFAOYSA-N 0.000 description 8
- XUIMIQQOPSSXEZ-UHFFFAOYSA-N Silicon Chemical compound [Si] XUIMIQQOPSSXEZ-UHFFFAOYSA-N 0.000 description 8
- NINIDFKCEFEMDL-UHFFFAOYSA-N Sulfur Chemical compound [S] NINIDFKCEFEMDL-UHFFFAOYSA-N 0.000 description 8
- 238000010586 diagram Methods 0.000 description 8
- 229910052949 galena Inorganic materials 0.000 description 8
- BHEPBYXIRTUNPN-UHFFFAOYSA-N hydridophosphorus(.) (triplet) Chemical compound [PH] BHEPBYXIRTUNPN-UHFFFAOYSA-N 0.000 description 8
- XCAUINMIESBTBL-UHFFFAOYSA-N lead(ii) sulfide Chemical compound [Pb]=S XCAUINMIESBTBL-UHFFFAOYSA-N 0.000 description 8
- 239000010703 silicon Substances 0.000 description 8
- 229910052656 albite Inorganic materials 0.000 description 7
- 239000011159 matrix material Substances 0.000 description 7
- 238000005070 sampling Methods 0.000 description 7
- 229910052708 sodium Inorganic materials 0.000 description 7
- 239000011734 sodium Substances 0.000 description 7
- DGAQECJNVWCQMB-PUAWFVPOSA-M Ilexoside XXIX Chemical compound C[C@@H]1CC[C@@]2(CC[C@@]3(C(=CC[C@H]4[C@]3(CC[C@@H]5[C@@]4(CC[C@@H](C5(C)C)OS(=O)(=O)[O-])C)C)[C@@H]2[C@]1(C)O)C)C(=O)O[C@H]6[C@@H]([C@H]([C@@H]([C@H](O6)CO)O)O)O.[Na+] DGAQECJNVWCQMB-PUAWFVPOSA-M 0.000 description 6
- 239000005864 Sulphur Substances 0.000 description 6
- 238000004364 calculation method Methods 0.000 description 6
- 230000000694 effects Effects 0.000 description 6
- 239000011133 lead Substances 0.000 description 6
- RUFLMLWJRZAWLJ-UHFFFAOYSA-N nickel silicide Chemical compound [Ni]=[Si]=[Ni] RUFLMLWJRZAWLJ-UHFFFAOYSA-N 0.000 description 6
- ZOKXTWBITQBERF-UHFFFAOYSA-N Molybdenum Chemical compound [Mo] ZOKXTWBITQBERF-UHFFFAOYSA-N 0.000 description 5
- 229910052782 aluminium Inorganic materials 0.000 description 5
- 230000000875 corresponding effect Effects 0.000 description 5
- 229910052750 molybdenum Inorganic materials 0.000 description 5
- 239000011733 molybdenum Substances 0.000 description 5
- 229910021334 nickel silicide Inorganic materials 0.000 description 5
- 229910052683 pyrite Inorganic materials 0.000 description 5
- 239000011028 pyrite Substances 0.000 description 5
- NIFIFKQPDTWWGU-UHFFFAOYSA-N pyrite Chemical compound [Fe+2].[S-][S-] NIFIFKQPDTWWGU-UHFFFAOYSA-N 0.000 description 5
- ZSLUVFAKFWKJRC-IGMARMGPSA-N 232Th Chemical compound [232Th] ZSLUVFAKFWKJRC-IGMARMGPSA-N 0.000 description 4
- 230000005461 Bremsstrahlung Effects 0.000 description 4
- RYGMFSIKBFXOCR-UHFFFAOYSA-N Copper Chemical compound [Cu] RYGMFSIKBFXOCR-UHFFFAOYSA-N 0.000 description 4
- 229910052776 Thorium Inorganic materials 0.000 description 4
- 229910052770 Uranium Inorganic materials 0.000 description 4
- QCWXUUIWCKQGHC-UHFFFAOYSA-N Zirconium Chemical compound [Zr] QCWXUUIWCKQGHC-UHFFFAOYSA-N 0.000 description 4
- 239000004411 aluminium Substances 0.000 description 4
- XAGFODPZIPBFFR-UHFFFAOYSA-N aluminium Chemical compound [Al] XAGFODPZIPBFFR-UHFFFAOYSA-N 0.000 description 4
- 229910052802 copper Inorganic materials 0.000 description 4
- 239000010949 copper Substances 0.000 description 4
- 229910052742 iron Inorganic materials 0.000 description 4
- BASFCYQUMIYNBI-UHFFFAOYSA-N platinum Chemical compound [Pt] BASFCYQUMIYNBI-UHFFFAOYSA-N 0.000 description 4
- 238000010926 purge Methods 0.000 description 4
- 229910052709 silver Inorganic materials 0.000 description 4
- JFALSRSLKYAFGM-UHFFFAOYSA-N uranium(0) Chemical compound [U] JFALSRSLKYAFGM-UHFFFAOYSA-N 0.000 description 4
- 229910052726 zirconium Inorganic materials 0.000 description 4
- OKTJSMMVPCPJKN-UHFFFAOYSA-N Carbon Chemical compound [C] OKTJSMMVPCPJKN-UHFFFAOYSA-N 0.000 description 3
- BQCADISMDOOEFD-UHFFFAOYSA-N Silver Chemical compound [Ag] BQCADISMDOOEFD-UHFFFAOYSA-N 0.000 description 3
- 229910052775 Thulium Inorganic materials 0.000 description 3
- 238000000441 X-ray spectroscopy Methods 0.000 description 3
- 238000013459 approach Methods 0.000 description 3
- 230000005540 biological transmission Effects 0.000 description 3
- 229910052799 carbon Inorganic materials 0.000 description 3
- 230000002596 correlated effect Effects 0.000 description 3
- 238000005457 optimization Methods 0.000 description 3
- UQWLEJDCBWVKSN-UHFFFAOYSA-N platinum zirconium Chemical compound [Zr].[Pt] UQWLEJDCBWVKSN-UHFFFAOYSA-N 0.000 description 3
- 239000004332 silver Substances 0.000 description 3
- 229910052715 tantalum Inorganic materials 0.000 description 3
- GUVRBAGPIYLISA-UHFFFAOYSA-N tantalum atom Chemical compound [Ta] GUVRBAGPIYLISA-UHFFFAOYSA-N 0.000 description 3
- 239000011573 trace mineral Substances 0.000 description 3
- 235000013619 trace mineral Nutrition 0.000 description 3
- XKRFYHLGVUSROY-UHFFFAOYSA-N Argon Chemical compound [Ar] XKRFYHLGVUSROY-UHFFFAOYSA-N 0.000 description 2
- 229910052684 Cerium Inorganic materials 0.000 description 2
- 229910052693 Europium Inorganic materials 0.000 description 2
- GYHNNYVSQQEPJS-UHFFFAOYSA-N Gallium Chemical compound [Ga] GYHNNYVSQQEPJS-UHFFFAOYSA-N 0.000 description 2
- 229910052689 Holmium Inorganic materials 0.000 description 2
- 206010037544 Purging Diseases 0.000 description 2
- VYPSYNLAJGMNEJ-UHFFFAOYSA-N Silicium dioxide Chemical compound O=[Si]=O VYPSYNLAJGMNEJ-UHFFFAOYSA-N 0.000 description 2
- 238000002441 X-ray diffraction Methods 0.000 description 2
- 229910052769 Ytterbium Inorganic materials 0.000 description 2
- HCHKCACWOHOZIP-UHFFFAOYSA-N Zinc Chemical compound [Zn] HCHKCACWOHOZIP-UHFFFAOYSA-N 0.000 description 2
- MCMNRKCIXSYSNV-UHFFFAOYSA-N Zirconium dioxide Chemical compound O=[Zr]=O MCMNRKCIXSYSNV-UHFFFAOYSA-N 0.000 description 2
- 229910052793 cadmium Inorganic materials 0.000 description 2
- GWXLDORMOJMVQZ-UHFFFAOYSA-N cerium Chemical compound [Ce] GWXLDORMOJMVQZ-UHFFFAOYSA-N 0.000 description 2
- IKNAJTLCCWPIQD-UHFFFAOYSA-K cerium(3+);lanthanum(3+);neodymium(3+);oxygen(2-);phosphate Chemical compound [O-2].[La+3].[Ce+3].[Nd+3].[O-]P([O-])([O-])=O IKNAJTLCCWPIQD-UHFFFAOYSA-K 0.000 description 2
- 230000003247 decreasing effect Effects 0.000 description 2
- 238000002149 energy-dispersive X-ray emission spectroscopy Methods 0.000 description 2
- 238000005516 engineering process Methods 0.000 description 2
- OGPBJKLSAFTDLK-UHFFFAOYSA-N europium atom Chemical compound [Eu] OGPBJKLSAFTDLK-UHFFFAOYSA-N 0.000 description 2
- 229910052733 gallium Inorganic materials 0.000 description 2
- KJZYNXUDTRRSPN-UHFFFAOYSA-N holmium atom Chemical compound [Ho] KJZYNXUDTRRSPN-UHFFFAOYSA-N 0.000 description 2
- 229910052738 indium Inorganic materials 0.000 description 2
- 238000002955 isolation Methods 0.000 description 2
- 229910052590 monazite Inorganic materials 0.000 description 2
- 229910052697 platinum Inorganic materials 0.000 description 2
- 238000011002 quantification Methods 0.000 description 2
- 239000011593 sulfur Substances 0.000 description 2
- 229910052717 sulfur Inorganic materials 0.000 description 2
- 238000012360 testing method Methods 0.000 description 2
- 238000004876 x-ray fluorescence Methods 0.000 description 2
- NAWDYIZEMPQZHO-UHFFFAOYSA-N ytterbium Chemical compound [Yb] NAWDYIZEMPQZHO-UHFFFAOYSA-N 0.000 description 2
- 239000011701 zinc Substances 0.000 description 2
- 229910052725 zinc Inorganic materials 0.000 description 2
- WKBOTKDWSSQWDR-UHFFFAOYSA-N Bromine atom Chemical compound [Br] WKBOTKDWSSQWDR-UHFFFAOYSA-N 0.000 description 1
- 229910052692 Dysprosium Inorganic materials 0.000 description 1
- 229910052691 Erbium Inorganic materials 0.000 description 1
- 108010083687 Ion Pumps Proteins 0.000 description 1
- FYYHWMGAXLPEAU-UHFFFAOYSA-N Magnesium Chemical compound [Mg] FYYHWMGAXLPEAU-UHFFFAOYSA-N 0.000 description 1
- 229910052779 Neodymium Inorganic materials 0.000 description 1
- 229910052771 Terbium Inorganic materials 0.000 description 1
- 229910000611 Zinc aluminium Inorganic materials 0.000 description 1
- GZZMEFFUSRGCNW-UHFFFAOYSA-N [Br].[Br] Chemical compound [Br].[Br] GZZMEFFUSRGCNW-UHFFFAOYSA-N 0.000 description 1
- YYUUMJDSMZORES-UHFFFAOYSA-N [Cd].[U] Chemical compound [Cd].[U] YYUUMJDSMZORES-UHFFFAOYSA-N 0.000 description 1
- GACQBOJYMXJNSQ-UHFFFAOYSA-N [Ce].[Cr] Chemical compound [Ce].[Cr] GACQBOJYMXJNSQ-UHFFFAOYSA-N 0.000 description 1
- CFXVEGVCTMYVIW-UHFFFAOYSA-N [Fe].[Eu] Chemical compound [Fe].[Eu] CFXVEGVCTMYVIW-UHFFFAOYSA-N 0.000 description 1
- KXNHBEGDNICPHA-UHFFFAOYSA-N [Fe].[Ho] Chemical compound [Fe].[Ho] KXNHBEGDNICPHA-UHFFFAOYSA-N 0.000 description 1
- KMEIFXQHEFYFMU-UHFFFAOYSA-N [K].[In] Chemical compound [K].[In] KMEIFXQHEFYFMU-UHFFFAOYSA-N 0.000 description 1
- FIMLVRCVMNGRMP-UHFFFAOYSA-N [Mn].[Eu] Chemical compound [Mn].[Eu] FIMLVRCVMNGRMP-UHFFFAOYSA-N 0.000 description 1
- KSHPUQQHKKJVIO-UHFFFAOYSA-N [Na].[Zn] Chemical compound [Na].[Zn] KSHPUQQHKKJVIO-UHFFFAOYSA-N 0.000 description 1
- CEPICIBPGDWCRU-UHFFFAOYSA-N [Si].[Hf] Chemical compound [Si].[Hf] CEPICIBPGDWCRU-UHFFFAOYSA-N 0.000 description 1
- MIDOFQRPAXDZET-UHFFFAOYSA-N [Si].[Sr] Chemical compound [Si].[Sr] MIDOFQRPAXDZET-UHFFFAOYSA-N 0.000 description 1
- SKAXWKNRKROCKK-UHFFFAOYSA-N [V].[Ce] Chemical compound [V].[Ce] SKAXWKNRKROCKK-UHFFFAOYSA-N 0.000 description 1
- XERMIIYGOQTIKJ-UHFFFAOYSA-N [Zn].[Re] Chemical compound [Zn].[Re] XERMIIYGOQTIKJ-UHFFFAOYSA-N 0.000 description 1
- DNNCGBUTBRELFI-UHFFFAOYSA-N [Zn].[Ta] Chemical compound [Zn].[Ta] DNNCGBUTBRELFI-UHFFFAOYSA-N 0.000 description 1
- 238000010521 absorption reaction Methods 0.000 description 1
- 229910052787 antimony Inorganic materials 0.000 description 1
- 229910052786 argon Inorganic materials 0.000 description 1
- NFMAZVUSKIJEIH-UHFFFAOYSA-N bis(sulfanylidene)iron Chemical compound S=[Fe]=S NFMAZVUSKIJEIH-UHFFFAOYSA-N 0.000 description 1
- GDTBXPJZTBHREO-UHFFFAOYSA-N bromine Substances BrBr GDTBXPJZTBHREO-UHFFFAOYSA-N 0.000 description 1
- 229910052794 bromium Inorganic materials 0.000 description 1
- BDOSMKKIYDKNTQ-UHFFFAOYSA-N cadmium atom Chemical compound [Cd] BDOSMKKIYDKNTQ-UHFFFAOYSA-N 0.000 description 1
- 238000012512 characterization method Methods 0.000 description 1
- UKFZQMQAGNFWJQ-UHFFFAOYSA-N chromium neodymium Chemical compound [Cr].[Nd] UKFZQMQAGNFWJQ-UHFFFAOYSA-N 0.000 description 1
- OQNSTCKCORYGQO-UHFFFAOYSA-N cobalt holmium Chemical compound [Co].[Ho].[Ho].[Ho] OQNSTCKCORYGQO-UHFFFAOYSA-N 0.000 description 1
- 238000004891 communication Methods 0.000 description 1
- 239000000470 constituent Substances 0.000 description 1
- 238000010276 construction Methods 0.000 description 1
- CIYRLONPFMPRLH-UHFFFAOYSA-N copper tantalum Chemical compound [Cu].[Ta] CIYRLONPFMPRLH-UHFFFAOYSA-N 0.000 description 1
- 239000013078 crystal Substances 0.000 description 1
- 230000007812 deficiency Effects 0.000 description 1
- 230000001419 dependent effect Effects 0.000 description 1
- KBQHZAAAGSGFKK-UHFFFAOYSA-N dysprosium atom Chemical compound [Dy] KBQHZAAAGSGFKK-UHFFFAOYSA-N 0.000 description 1
- RDTHZIGZLQSTAG-UHFFFAOYSA-N dysprosium iron Chemical compound [Fe].[Dy] RDTHZIGZLQSTAG-UHFFFAOYSA-N 0.000 description 1
- 238000001493 electron microscopy Methods 0.000 description 1
- UYAHIZSMUZPPFV-UHFFFAOYSA-N erbium Chemical compound [Er] UYAHIZSMUZPPFV-UHFFFAOYSA-N 0.000 description 1
- HXGCMFTYYKFAQH-UHFFFAOYSA-N erbium iron Chemical compound [Fe].[Er] HXGCMFTYYKFAQH-UHFFFAOYSA-N 0.000 description 1
- 238000000084 gamma-ray spectrum Methods 0.000 description 1
- PCHJSUWPFVWCPO-UHFFFAOYSA-N gold Chemical compound [Au] PCHJSUWPFVWCPO-UHFFFAOYSA-N 0.000 description 1
- 229910052737 gold Inorganic materials 0.000 description 1
- 239000010931 gold Substances 0.000 description 1
- 229910052735 hafnium Inorganic materials 0.000 description 1
- VBJZVLUMGGDVMO-UHFFFAOYSA-N hafnium atom Chemical compound [Hf] VBJZVLUMGGDVMO-UHFFFAOYSA-N 0.000 description 1
- APFVFJFRJDLVQX-UHFFFAOYSA-N indium atom Chemical compound [In] APFVFJFRJDLVQX-UHFFFAOYSA-N 0.000 description 1
- 229910052740 iodine Inorganic materials 0.000 description 1
- 229910052741 iridium Inorganic materials 0.000 description 1
- GKOZUEZYRPOHIO-UHFFFAOYSA-N iridium atom Chemical compound [Ir] GKOZUEZYRPOHIO-UHFFFAOYSA-N 0.000 description 1
- JSUSQWYDLONJAX-UHFFFAOYSA-N iron terbium Chemical compound [Fe].[Tb] JSUSQWYDLONJAX-UHFFFAOYSA-N 0.000 description 1
- VCKMWHWYBADVBA-UHFFFAOYSA-N iron thulium Chemical compound [Fe].[Fe].[Fe].[Tm] VCKMWHWYBADVBA-UHFFFAOYSA-N 0.000 description 1
- 239000011777 magnesium Substances 0.000 description 1
- 229910052749 magnesium Inorganic materials 0.000 description 1
- 238000004949 mass spectrometry Methods 0.000 description 1
- 238000001819 mass spectrum Methods 0.000 description 1
- 238000002044 microwave spectrum Methods 0.000 description 1
- 238000012986 modification Methods 0.000 description 1
- 230000004048 modification Effects 0.000 description 1
- QEFYFXOXNSNQGX-UHFFFAOYSA-N neodymium atom Chemical compound [Nd] QEFYFXOXNSNQGX-UHFFFAOYSA-N 0.000 description 1
- VKYCJJPUIMCYIB-UHFFFAOYSA-N nickel ytterbium Chemical compound [Ni].[Ni].[Yb] VKYCJJPUIMCYIB-UHFFFAOYSA-N 0.000 description 1
- 229910052762 osmium Inorganic materials 0.000 description 1
- SYQBFIAQOQZEGI-UHFFFAOYSA-N osmium atom Chemical compound [Os] SYQBFIAQOQZEGI-UHFFFAOYSA-N 0.000 description 1
- KKSPHMOIKQHQFL-UHFFFAOYSA-N osmium zirconium Chemical compound [Zr].[Os] KKSPHMOIKQHQFL-UHFFFAOYSA-N 0.000 description 1
- 229910052763 palladium Inorganic materials 0.000 description 1
- 230000000737 periodic effect Effects 0.000 description 1
- DWDQAMUKGDBIGM-UHFFFAOYSA-N phosphanylidyneyttrium Chemical compound [Y]#P DWDQAMUKGDBIGM-UHFFFAOYSA-N 0.000 description 1
- 238000002360 preparation method Methods 0.000 description 1
- 238000005086 pumping Methods 0.000 description 1
- 239000010453 quartz Substances 0.000 description 1
- 229910052761 rare earth metal Inorganic materials 0.000 description 1
- 238000007670 refining Methods 0.000 description 1
- 229910052702 rhenium Inorganic materials 0.000 description 1
- WUAPFZMCVAUBPE-UHFFFAOYSA-N rhenium atom Chemical compound [Re] WUAPFZMCVAUBPE-UHFFFAOYSA-N 0.000 description 1
- HWEYZGSCHQNNEH-UHFFFAOYSA-N silicon tantalum Chemical compound [Si].[Ta] HWEYZGSCHQNNEH-UHFFFAOYSA-N 0.000 description 1
- WNUPENMBHHEARK-UHFFFAOYSA-N silicon tungsten Chemical compound [Si].[W] WNUPENMBHHEARK-UHFFFAOYSA-N 0.000 description 1
- WCIGAKYWEKKAHK-UHFFFAOYSA-N silver thorium Chemical compound [Ag].[Th].[Th] WCIGAKYWEKKAHK-UHFFFAOYSA-N 0.000 description 1
- 239000007787 solid Substances 0.000 description 1
- 230000004936 stimulating effect Effects 0.000 description 1
- 229910052712 strontium Inorganic materials 0.000 description 1
- CIOAGBVUUVVLOB-UHFFFAOYSA-N strontium atom Chemical compound [Sr] CIOAGBVUUVVLOB-UHFFFAOYSA-N 0.000 description 1
- 239000000126 substance Substances 0.000 description 1
- PTISTKLWEJDJID-UHFFFAOYSA-N sulfanylidenemolybdenum Chemical compound [Mo]=S PTISTKLWEJDJID-UHFFFAOYSA-N 0.000 description 1
- 229910052714 tellurium Inorganic materials 0.000 description 1
- GZCRRIHWUXGPOV-UHFFFAOYSA-N terbium atom Chemical compound [Tb] GZCRRIHWUXGPOV-UHFFFAOYSA-N 0.000 description 1
- 229910052718 tin Inorganic materials 0.000 description 1
- WFKWXMTUELFFGS-UHFFFAOYSA-N tungsten Chemical compound [W] WFKWXMTUELFFGS-UHFFFAOYSA-N 0.000 description 1
- 229910052721 tungsten Inorganic materials 0.000 description 1
- 239000010937 tungsten Substances 0.000 description 1
- 238000005303 weighing Methods 0.000 description 1
- VNQQJIQPDCMEMS-UHFFFAOYSA-N ytterbium zinc Chemical compound [Zn].[Yb] VNQQJIQPDCMEMS-UHFFFAOYSA-N 0.000 description 1
- 229910052727 yttrium Inorganic materials 0.000 description 1
- VWQVUPCCIRVNHF-UHFFFAOYSA-N yttrium atom Chemical compound [Y] VWQVUPCCIRVNHF-UHFFFAOYSA-N 0.000 description 1
Images










Classifications
-
- G—PHYSICS
- G01—MEASURING; TESTING
- G01N—INVESTIGATING OR ANALYSING MATERIALS BY DETERMINING THEIR CHEMICAL OR PHYSICAL PROPERTIES
- G01N23/00—Investigating or analysing materials by the use of wave or particle radiation, e.g. X-rays or neutrons, not covered by groups G01N3/00 – G01N17/00, G01N21/00 or G01N22/00
- G01N23/20—Investigating or analysing materials by the use of wave or particle radiation, e.g. X-rays or neutrons, not covered by groups G01N3/00 – G01N17/00, G01N21/00 or G01N22/00 by using diffraction of the radiation by the materials, e.g. for investigating crystal structure; by using scattering of the radiation by the materials, e.g. for investigating non-crystalline materials; by using reflection of the radiation by the materials
- G01N23/207—Diffractometry using detectors, e.g. using a probe in a central position and one or more displaceable detectors in circumferential positions
- G01N23/2076—Diffractometry using detectors, e.g. using a probe in a central position and one or more displaceable detectors in circumferential positions for spectrometry, i.e. using an analysing crystal, e.g. for measuring X-ray fluorescence spectrum of a sample with wavelength-dispersion, i.e. WDXFS
-
- G—PHYSICS
- G01—MEASURING; TESTING
- G01N—INVESTIGATING OR ANALYSING MATERIALS BY DETERMINING THEIR CHEMICAL OR PHYSICAL PROPERTIES
- G01N23/00—Investigating or analysing materials by the use of wave or particle radiation, e.g. X-rays or neutrons, not covered by groups G01N3/00 – G01N17/00, G01N21/00 or G01N22/00
- G01N23/22—Investigating or analysing materials by the use of wave or particle radiation, e.g. X-rays or neutrons, not covered by groups G01N3/00 – G01N17/00, G01N21/00 or G01N22/00 by measuring secondary emission from the material
- G01N23/225—Investigating or analysing materials by the use of wave or particle radiation, e.g. X-rays or neutrons, not covered by groups G01N3/00 – G01N17/00, G01N21/00 or G01N22/00 by measuring secondary emission from the material using electron or ion
- G01N23/2251—Investigating or analysing materials by the use of wave or particle radiation, e.g. X-rays or neutrons, not covered by groups G01N3/00 – G01N17/00, G01N21/00 or G01N22/00 by measuring secondary emission from the material using electron or ion using incident electron beams, e.g. scanning electron microscopy [SEM]
- G01N23/2252—Measuring emitted X-rays, e.g. electron probe microanalysis [EPMA]
-
- H—ELECTRICITY
- H01—ELECTRIC ELEMENTS
- H01J—ELECTRIC DISCHARGE TUBES OR DISCHARGE LAMPS
- H01J37/00—Discharge tubes with provision for introducing objects or material to be exposed to the discharge, e.g. for the purpose of examination or processing thereof
- H01J37/26—Electron or ion microscopes; Electron or ion diffraction tubes
- H01J37/28—Electron or ion microscopes; Electron or ion diffraction tubes with scanning beams
Definitions
- the present invention relates broadly to a method and system for spectrum data analysis
- information about a sample is determined by accumulating radiation from the sample over a period of time.
- a characteristic of the radiation such as its energy profile or its diffraction pattern, can often be correlated to the type of material present in the sample. For example, when bombarded by electrons, a sample gives off characteristic x-rays whose energy correlates to the elements in the sample. Similarly, when bombarded with x-rays, crystals produce a characteristic diffraction pattern, and the frequency spectrum of gamma rays and other radiation are used by astronomers to learn about the composition of universe.
- sample is used broadly herein to include an object under observation.
- a scanning electron microscope can be used to determine the elemental composition of an unknown material.
- the scanning electron microscope (SEM) sends high-energy electrons smashing into material. When these electrons enter an atom, they can knock electrons out of the material. In the process, the first electron looses some energy, but can go on to smash into other atoms until it no longer has enough energy to continue doing so.
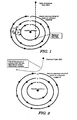
- Figure 1 shows an atom with electrons bound to the K, L, and M energy levels.
- An electron from the SEM is fired into this atom at a very high energy, dislodging one of the electrons from the atom. A very short time later, an electron from a higher energy level will fall into the created gap.
- K shell In the process of falling into the lower energy K shell, it emits a single x-ray to balance the overall energy. The energy of the emitted x-ray depends on the initial location of the electron. If the electron originates from the L shell, then the radiation is designated as K ⁇ radiation. If it originates from the M shell, then the radiation is designated as K ⁇ radiation, which has a higher energy than K ⁇ radiation.
- Figure 1 shows that an electron falling from the M shell to the L shell is associated with the emission of L ⁇ radiation.
- the emitted x-rays are dependent on the specific starting and finishing energy levels.
- the type of the emitting atom can be determined.
- Each element in the periodic table has a specific set of energies corresponding to these x-ray energies.
- the energy of the K ⁇ radiation for carbon is 277eV, compared to 523eV for oxygen, or 98434eV for uranium. If the electron from the SEM has a lower energy than this binding energy, then it is unable to dislodge the electron from the atom.
- the electrons from the SEM may not enter an atom, but may be deflected away from an atom. This is caused by the negative electric charge on the electron being repelled by the negative charge of the electron cloud around the atoms.
- Figure 2 shows that the path of the electron is deflected away from an atom due to mutual electrostatic repulsion.
- the deflection of the path causes a small drop in energy of the high energy electron.
- This generates the Bremsstrahlung radiation.
- This effect occurs at lower intensities than the emission of x-rays seen in Figure 1 .
- the Bremsstrahlung radiation is an artefact of using an electron beam from a SEM. It must be taken into account when calculating the elemental composition.
- the shape of the Bremsstrahlung radiation depends on the average density of the material being analyzed, and is also affected by the standard based spectral analysis.
- Standard based spectral analysis is a term used to describe the process of comparing the spectrum of an unknown mineral or element with a set of known spectra to determine the composition of the unknown spectrum in terms of the known spectra. This approach generates a solution that represents a multiplication factor for each of the known templates, which are then added together to synthesize the unknown spectrum.
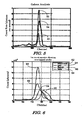
- Figure 3 shows the spectrum of pyrite (FeS 2 ).
- the spectrum comprises several peaks, and some regions of Bremsstrahlung radiation. There are some additional smaller peaks in this plot that are due to carbon (at 277eV), and the iron L ⁇ peak at 705eV.
- Figure 4 shows that scaling the iron spectrum 44 to 42.0% and the sulphur spectrum 46 to 41.5% allows them to fit the peaks in the pyrite spectrum 42.
- These numbers are the peak ratios of these elements, because they represent the ratio of the area of each peak relative to a pure sample of the element. They do not represent the weight percentage of the material.
- the peak ratios obtained previously can be converted to a weight percentage using a standard matrix correction algorithm such as ZAF corrections.
- ZAF corrections account for differences in the atomic number (Z) of the elements, the absorption factor (A) of x-rays travelling through the material, and fluorescence (F) of x-rays from elements stimulating the emission of x-rays from other elements.
- the operating conditions of the SEM must be determined.
- the factors that influence spectral analysis are the beam voltage, x-ray detector angles and beam current.
- the beam voltage affects the peaks that are stimulated and produce x-rays. As discussed previously in the text, if the beam voltage is lower than a particular binding energy for an elemental peak, then the peak is not present in the spectrum. In addition, the peaks that have a significantly lower binding energy are stimulated far more than peaks with binding energy close to the beam voltage. This results in the spectrum containing very large peaks in the low energy range, and very small peaks in the high energy range.
- the x-ray detector angle affects the calculations for ZAF corrections, because it models the length of the path that the x-rays traverse through the material before reaching the detector.
- the beam current affects the rate at which x-rays are generated.
- the standards need to be collected at the same current as the analysis is performed.
- Some elemental spectra have peaks that overlap other element peaks. For instance, sulphur, lead and molybdenum have a peak at 2307eV, 2342eV and 2293eV respectively. The elements have other peaks at different energies, but these spectra look very similar because the SEM beam voltage is too low to excite the molybdenum K peaks significantly (at 17481eV). In addition, the lead K peaks are not excited at all because their energy is too high (74989eV). This causes difficulties trying to resolve minerals that contain lead, sulphur or molybdenum. This is particularly difficult for galena which contains both lead and sulphur.
- Figure 5 shows the spectrum 52 for galena, and the scaled spectra 54 for lead and sulfur 56.
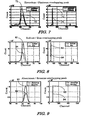
- Figures 6 to 12 show further examples of such overlapping elements.
- Figure 7 shows that the platinum spectrum 74 and the zirconium spectrum 72 have an overlapping peak at 2.04keV (channel 102). This causes problems in the analysis because it can incorrectly introduce zirconium to the analyzed composition if platinum is present.
- Figure 8 shows the same type of overlapping peaks for the sodium spectrum 82 and the zinc spectrum 84. This causes sodium artefacts to be reported in minerals containing zinc.
- Figure 9 shows that this type of overlap is also present for the aluminium spectrum 92 and the bromine spectrum 94.
- Figure 10 shows the overlapping peak of the cadmium spectrum 102 and the uranium spectrum 104, which are very similar and could be confused at low concentration.
- Figure 11 shows the close overlap of the peaks of the silver spectrum 112 and the thorium spectrum 114. This close overlap causes problems at low count because the only difference between the spectra of these elements is the small peak at channel 648, which is invisible for low count spectra. This causes the identification of minerals containing either thorium or silver to incorrectly include the other element because of this overlap.
- Figure 12 shows the overlapping peaks of the Yttrium spectrum 122 and the Iridium spectrum 124. Even such a relatively small overlap seems to cause problems for zirconia.
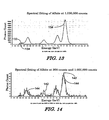
- Figure 13 shows the spectrum of the mineral Albite (NaAlSi 3 O 8 ) with the peaks shown very smoothly. The total number of x-rays collected to generate this spectrum was one million.
- Figure 14 shows the same mineral where the total number of x-rays collected was three hundred.
- the jagged plot 142 shows the spectrum of the mineral, while the smooth plot 144 shows a fit of elemental spectra to the mineral. In the second example there is significant noise in the spectra and the peaks are not smooth.
- the elements reported for the low count spectra contain a number of artefacts that appear to be present based on the spectra, but are not present in the mineral.
- the task of analyzing spectra at low counts is more difficult because there is far more variability in the underlying spectrum, and the peaks of each element are not Gaussian. Therefore, the techniques used by existing approaches are unsuitable for low count spectral analysis for mineral identification, because they generally assume a smooth spectrum.
- a method for spectrum data analysis comprising the steps of:
- an electronic system for spectrum data analysis comprising:
- memory means for storing a set of element data templates
- a computer program product including a computer readable medium having recorded thereon a computer program for implementing the aforementioned method.
- Figs. 1 and 2 show conceptual energy diagrams and in principal functionality behind the method of standard electron microscopy (SEM).
- Fig. 3 shows the spectrum of mineral pyrite.
- Fig. 4 shows a two-element spectral analysis of pyrite.
- Fig. 5 shows the spectrum of Galena with nearby elements.
- Fig. 6 illustrates the concept of element peak overlap.
- Figs. 7 to 12 show the overlapping peaks of various elements.
- Figs. 13 and 14 show two spectra of Albite obtained on the basis of different count number.
- Fig. 15 shows a high-level flow diagram of the currently described Itterative Least Square Algorithm.
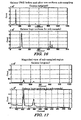
- Fig. 16 shows galena(PbS) before and after non uniform sub-sampling.
- Fig. 17 shows magnified view of sub-sampled region.
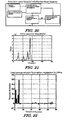
- Figs. 18 and 19 show template spectra obtained without and with non-uniform sub-sampling, respectively..
- Fig. 20 shows interative least squares initialization block diagram.
- Fig. 21 shows albite spectrum (NaAlSi 3 O 2 ).
- Fig. 22 shows raw template multipliers for albite after 1 st iteration.
- Fig. 23 shows scaled templates for albite.
- Fig. 24 shows magnified portion of scaled templates.
- Fig. 25 shows background element substitution algorithm.
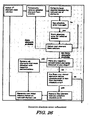
- Fig. 26 shows interative absolute error refinement.
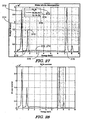
- Fig. 27 shows simple two element spectral analysis of nickel silicide.
- Fig. 28 shows Ni 2 Si spectrum.
- Fig. 29 shows monazite
- Fig. 30 shows portions of the spectrum used to calculate the nickel K peak ratio.
- Fig. 31 shows peak ratio calculation block diagram.
- Fig. 32 shows average processing time.
- Figs. 33 to 48 show the compositions of various minerals calculated by way of the algorithm of the present invention.
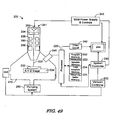
- Fig. 49 shows a typical electron beam system embodying the present invention.
- Embodiments of the invention are particularly well suited for determining sample characteristics using a relatively small number of "counts," that is, a relatively small amount of detected radiation.
- the radiation can be, for example, an x-ray spectrum for an electron microscope, an x-ray spectrum from X-ray fluorescence, an x-ray diffraction pattern, a light, microwave, or gamma ray spectra from an astronomical object, or a mass spectrum from a mass spectrometer. While the prior art interprets a smooth spectrum produced by a large number of counts, embodiments of the invention are suitable for determining materials from a rough, noisy spectrum having, for example, fewer than 100,000 counts, fewer than 10,000 counts, fewer than 1,000 counts, or fewer than 500 counts.
- Embodiments of the invention allow for more rapid characterization of materials compared to the prior art.
- Embodiments of the invention can be used to determine, for example, the elemental composition of a sample in an x-ray spectroscopy embodiment, the mineral composition of a sample in an x-ray diffraction embodiment, or the mass composition of a sample, in a mass spectroscopy embodiment.
- the standard operating conditions of the SEM configuration used in obtaining at least some of the results presented in the present description include 25keV beam voltage, 5nA beam current, and 35 degree x-ray detector angle.
- the beam voltage is too low to dislodge the electrons for uranium in the K shell, which require nearly four times that energy.
- it is high enough to dislodge the M shell electrons for uranium because they require 3165eV.
- the present specification discloses both a method and an apparatus for performing the operations of the method.
- Such apparatus may be specially constructed for the required purposes, or may comprise a general purpose computer or other device selectively activated or reconfigured by a computer program stored in the computer.
- the algorithms and displays presented herein are not inherently related to any particular computer or other apparatus.
- Various general purpose machines may be used with programs in accordance with the teachings herein.
- the construction of more specialized apparatus to perform the required method steps may be appropriate.
- the structure of a conventional general purpose computer will appear from the description below.
- the present specification also implicitly discloses a computer program, in that it would be apparent to the person skilled in the art that the individual steps of the method described herein may be put into effect by computer code.
- the computer program is not intended to be limited to any particular programming language and implementation thereof. It will be appreciated that a variety of programming languages and coding thereof may be used to implement the teachings of the disclosure contained herein.
- the computer program is not intended to be limited to any particular control flow. There are many other variants of the computer program, which can use different control flows without departing from the spirit or scope of the invention.
- Such a computer program may be stored on any computer readable medium.
- the computer readable medium may include storage devices such as magnetic or optical disks, memory chips, or other storage devices suitable for interfacing with a general purpose computer.
- the computer readable medium may also include a hard-wired medium such as exemplified in the Internet system, or wireless medium such as exemplified in the GSM mobile telephone system.
- the computer program when loaded and executed on such a general-purpose computer effectively results in an apparatus that implements the steps of the preferred method.
- the invention may also be implemented as hardware modules. More particular, in the hardware sense, a module is a functional hardware unit designed for use with other components or modules. For example, a module may be implemented using discrete electronic components, or it can form a portion of an entire electronic circuit such as an Application Specific Integrated Circuit (ASIC). Numerous other possibilities exist. Those skilled in the art will appreciate that the system can also be implemented as a combination of hardware and software modules.
- ASIC Application Specific Integrated Circuit
- Embodiments of the invention use one or more mathematical algorithms to approximate a measured property, such as an x-ray spectrograph, by using known data templates corresponding to various materials, and weighting factors that correlate to the relative abundance of those materials in the sample. Weighting factors are determined that produce, in combination with the data templates, a spectrum, diffraction pattern, or other pattern, that closely matches the measured pattern. The difference between the measured pattern and the combination of the data templates and weighting factors, is referred to an error value. Mathematical algorithms are used to minimize the error value. One preferred algorithm to find weighting factors that minimize the error value is an iterative least squares method, and is described in detail below. The invention is not limited to any particular algorithm.
- the iterative least squares analysis is a technique which uses standard linear least squares curve fitting to find the optimal weights for each template in order to synthesise the spectrum of an unknown material. It builds a list of candidate elements and uses various conditions to detect which elements are artefacts and which elements are in the solution.
- the spectral analysis algorithm disclosed here is presented in Figure 15 .
- the algorithm is directed at analysing low-count spectra (typically 1000 counts), but can also be applied for analysing high count spectra. It performs element identification and quantification simultaneously to compute the peak ratios of each element. It also applies real-world knowledge to address various minor deficiencies and to minimize the chance of reporting artefact elements that appear to be in the spectrum but are not actually present.
- the raw spectrum data is altered to improve the discrimination ability between similar elements.
- spectrum data When spectrum data is acquired, the data tends to have larger peaks at lower energy, and if any peaks are present at high energy they are generally far smaller in magnitude. This presents a problem for discriminating between similar elements (see Figure 4 for example).
- the spectrum is sub-sampled non uniformly.
- Such sampling preserves the resolution of the low energy portion of the spectrum, while increasing the peak signal-to-noise ratio at high energy at the expense of peak resolution. This trade-off is acceptable for two reasons - firstly the tiny high energy peaks become more important, and secondly the Energy-Dispersive Spectroscopy (EDS) x-ray detector has a resolution that is significantly worse at high energy compared to low energy.
- EDS Energy-Dispersive Spectroscopy
- the non-uniform sub-sampling is implemented as follows:
- Figure 16 shows the original Galena (lead-sulphide) mineral before and after this processing. In standard operating conditions of the described system, the processing changes the number of channels in a spectrum from 1024 to 504.
- Figure 17 shows the channels for 8keV - 25keV for the original and sub-sampled spectra.
- the original Galena mineral peak at channel 527 is approximately 3000 photons, compared to 45,000 photons for the peak at channel 117.
- this peak has increased in height to 20,000 photons (approximately a factor of 6), while decreasing the number of channels in this region by a factor of 6. This assists in the discrimination between similar elements because the small peaks suddenly become far more important in the least squares fitting. It also reduces the processing time significantly because fewer channels are processed.
- the algorithm optimizes the analysis by reducing the number of channels analyzed for the spectrum based on the templates used and the number of photons in the spectrum. For example, low count spectra generally have no peaks at higher energies because there aren't enough photons detected at those energies to create a statistically meaningful peak.
- Figure 18 shows an overlay of 45 million count spectra for the elemental templates. If a random spectrum is analyzed which contains only 1000 counts, then any peaks below the thick horizontal line are unlikely to be created because the probability that a photon will be detected there is less than 1/1000. Therefore, it isn't necessary to analyze all 1024 channels for a 1000 count analysis, and thus the number of channels analyzed can be reduced to about 800.
- This range is dynamically generated based on the templates used for analysis, and increases the computation speed for each iteration.
- the low count channel optimization is performed after the non-uniform sub-sampling. This reduces the upper channel from about 800 to about 480 for a 1000 count analysis, as shown in Figure 19 .
- Figure 20 shows the block diagram for a proposed algorithm for iterative least squares initialization.
- the purpose is to quickly remove artefact elements from the solution by purging elements whose concentration is negative.
- elemental concentration is calculated, there are no restrictions on the weights calculated for each element.
- this algorithm uses the fact that elements can't have negative concentration as the rule to remove elements. Once there are no negative concentration elements then the stage has completed.
- the calculation to generate the optimal weights uses the standard linear least squares algorithm.
- the least squares algorithm solves an over-determined system of linear equations of the form
- A is the matrix of known data points
- x is the set of unknowns which linearly scale the known matrix A to generate the vector b.
- A represents the known element templates
- b represents the spectrum being analyzed
- x is the multiplication factor applied to each template to generate the spectrum.
- Figure 23 shows each of the element templates after they've been scaled by the values shown in Figure 22 .
- Figure 24 shows that some of the peaks introduced into the solution are being cancelled out by the presence of anti-peaks. If the elements which generate the anti-peaks are removed, the template multipliers for the remaining elements can be improved. In order to reduce the artefact elements, all elements with concentrations below 0.0 are removed and the solution is re-calculated. This process is repeated until there are no more negative concentrations. This removes most of the artefact elements from the mineral. The entire process can be summarised as follows:
- This phase of the processing analyzes the solution and substitutes a predefined set of overlapping elements for each element in the solution.
- the purpose of this phase is to determine whether an element has been removed from the solution prematurely and to restore it if so.
- the algorithm outline is shown in Figure 25 .
- This phase scans through each element and verifies whether any of the elements is listed with overlapping elements. If so, each overlapping element is added to the composition, one at a time, and the composition is re-computed.
- the algorithm also tries substituting each of the overlapping elements for the original element. It tests whether the composition has improved by examining the absolute error of the synthesised spectrum given by the composition against the original. A list of overlapping elements is shown in Table 1.
- Overlapping element 1 Overlapping element 2 Overlapping element 3 Overlapping element 4 fluorine Manganese Iron Sodium Zinc Aluminium Bromine Silicon Sirontium Tungsten Tantalum Rubidium Phosphorous Zirconlium Platinium Iridium Yttrium Sulfur Molybdenum Lead Chlorine Rhodium Rubidium Potassium Indium Calcium Antimony Vanadium Oxygen Chromium Vanadium Manganese Manganese Fluorine Europium Iron Manganese Cobalt Fluorine Cobalt Iron Nickel Nickel Cobalt Zinc Sodium Bromine Aluminium Rubidium Silicon Tungsten Tantalum Strontium Silicon Tungsten Yttrium Osmium Phosphorous Zirconium Platinum Phosphorous Iridium Niobium Mercury Molybdenum Sulfur Lead Ruthenlum Chlorine Rhodium Chlorine Sliver Therlum Cadmium Uranium Indium Potassium Antimony Calcium Prasecdymium Lanthanum Neodymium Cerium Europium Manganes
- this step removes oxygen if the concentration is bellow 5%.
- This arbitrary threshold was reached after analysing all 76 minerals and elements and determining that this threshold was appropriate to retain oxygen that was indeed present in the minerals.
- the chosen concentration also allowed to successfully remove from the calculations oxygen that was merely an artefact. This reduces the amount of trace oxygen reported for all results.
- the purpose of this stage is to reduce the complexity of the results reported.
- Figure 26 shows the block diagram for the iterative absolute error refinement stage.
- the purpose of this stage is to remove element artefacts from the composition by minimising the absolute error between the synthesised spectrum and the source spectrum. It iterates through the elements and removes each element one at a time. It then recomputes the concentrations of the remaining elements and checks if the absolute error has decreased. This is repeated for all elements. It then removes the element that had the largest decrease in error, and repeats the process iteratively.
- the stage is designed to remove elements that may appear to be in the spectrum, but are usually the result of matrix effects distorting the mineral spectrum and altering the relative intensity of element peaks.
- the synthetic mineral nickel silicide (Ni 2 Si) consists of nickel (plot 274) and silicon (plot 276). If the relative heights of the nickel K and L peaks are compared for Ni 2 Si and pure nickel, the Ni 2 Si L ⁇ peak 272 (851eV) is significantly taller than expected, as shown in Figure 27 .
- the increase in height is caused by x-rays generated from the silicon interacting with the nickel atoms and generating additional x-rays. This causes the spectral fitting to match poorly for this peak, and other elements may be added to the solution to try to reduce the mismatch. This stage is designed to detect elements that may have been added incorrectly and to remove them.
- the solution for pairs of elements is analyzed and, if both elements are found, one of the elements is removed.
- the relative concentration of each element pair is stored, because some of the elements can occur in minerals together (such as molybdenum and sulphur), but others do not (such as thorium and silver). In the case where they do not occur together, the relative concentration required is 0, which means that the less common element will always be removed if both have been reported in the composition. The higher the relative concentration required, the more difficult it is to remove the potentially overlapping elements.
- the relative concentrations specified here have been derived empirically from a test set, and may not represent the optimal set of relative concentration thresholds for all minerals.
- Iron Holmium 3 Holmium, Cobalt Holmium 0.5 Erbium, Iron Erbium 8 Thulium, Copper Thutium 0.5 Thulium, Aluminium Thulium 5 Thulium, Iron Thulium 10 Ytterbium, Nickel Ytterbium 5 Ytterbium, Zinc Ytterbium 4 Hafnium, Silicon Hafnium 6 Tantalum, Silicon Tantalum 1 Tantalum, Zinc Tantalum 0 Tantalum, Copper Tantalum 3 Tungsten, Silicon Tungsten 3.5 Rhenium, Zinc Rhenium 7.0 Osmium, Zirconium Osmium 10.0 Thorium, Silver Thorium 2.0
- This step removes trace elements from the solution and normalises the result. It uses a magic threshold of less than 2.5% as the criteria for retaining elements. The reason is
- This stage is required because the element ratios up to this point refer to the optimal set of multiplication factors required to fit the element spectra to the unknown mineral.
- the final output of the spectrum processing must be a weight percentage per element, which requires a matrix correction.
- the ZAF corrections applied at the end require that the elements are quantified relative to a single peak rather than for the entire spectrum. Therefore, this stage computes the peak ratio of each element and specifies the peak that was used to calculate the percentage.
- the peak for each element is determined, and the ratio for that peak is computed. It is desirable to use higher energy peaks because they are not subject to as many ZAF effects as lower energy peaks.
- the highest peak for each element is selected for which the ratio of the beam energy to the peak energy does not exceed 2.5. Therefore, when using a beam voltage of 25kV, the selected highest peak has voltage of 10kV or less. In the case of nickel (in Ni 2 Si), this is the K peak at 7477eV ( Figure 28 ).
- Figure 29 shows a portion of the spectrum for the mineral "monazite" (plot 292) which contains several rare earth elements, such as La (plot 294), Ce (plot 296), Pr (plot 297), Nd (plot 298) and Th (plot 299).
- the spectra 297 for Pr and the spectrum 298 for Nd have been highlighted to illustrate that these cannot be computed in isolation of the other elements because there are significant overlapping portions of the spectra from other elements.
- Equation 2 the existing technique of computing the element concentration can be directly applied to computing the peak ratios by using Equation 2. However, rather than compute the solution for the entire spectrum, the technique uses as much of the spectrum as possible, and removes the other peaks.
- Figure 30 shows a diagrammatic representation of this computation for computing the nickel K peak ratio. The nickel L peak is omitted from the calculation, but otherwise it directly solves for the peak ratio by solving equation 2.
- FIG. 31 A block diagram for this computational algorithm is shown in Figure 31 .
- the beam voltage is 25keV. Consequently, the elements Pd, Ag, Cd, In, Sn, Sb, Te and I only have one peak, because the K peak is higher than the beam voltage and they do not have any M peaks. This provides a minor performance optimization by avoiding recomputing the peak ratios for these elements.
- the algorithm also contains a second path which drops elements from the composition if their concentration changes significantly. This is intended to catch elements that have been reported in trace amounts, but whose concentration increases by a factor of 10x, if a single peak is analyzed in isolation.
- the peak ratios are corrected using ZAF corrections prior to being reported.
- FIG. 32 shows the average execution time of the entire spectral analysis engine when analysing the set of minerals from the SPI_MINERALS and Smithsonian standard blocks.
- the processing time was found to be inversely proportional to the number of counts in the spectrum. This is expected, because the spectrum becomes smoother at higher counts and it is less difficult to establish the correct set of elements, and there are fewer incorrect elements that need refining or exchange.
- the longer than expected processing time may be associated with some programming overhead translating between the managed C# code and the unmanaged C++ spectral analysis engine code.
- the execution time is also proportional to the number of elements used for analysis. The figures shown in Figure 32 were generated when analysing with 72 elements.
- embodiments of the present invention can use fewer than 100,000 counts, fewer than 50,000 counts, fewer than 10,000 counts, fewer than 3000 counts, fewer than 1000 counts or fewer than 500 counts, depending on the accuracy required.
- embodiments of the present invention can determine the elements present in a sample in less than one hundred milliseconds, less than a ten milliseconds, and in some embodiments, on the order of a few milliseconds.
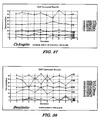
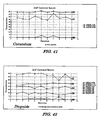
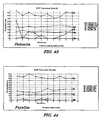
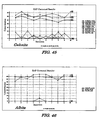
- composition results of the described method for spectral analysis are shown in Figures 33 to 48 .
- the theoretical composition of each mineral is listed at the bottom of each plot.
- the mean and standard deviation of each result is reported in the legend of each plot.
- Each of these analyzes was performed at 1000 counts.
- the main observations that can be made is that carbon and oxygen vary far more widely than other elements.
- low concentration elements may appear or disappear from the composition if their composition is too small.
- artefact elements are present in nearly every composition, but at low concentrations.
- FIG. 49 shows a scanning electron beam system 200 with an x-ray detector 240 suitable for practicing embodiments of the present invention.
- a scanning electron microscope 241, along with power supply and control unit 245, is provided with system 200.
- An electron beam 232 is emitted from a cathode 253 by applying voltage between cathode 253 and an anode 254.
- Electron beam 232 is focused to a fine spot by means of a condensing lens 256 and an objective lens 258.
- Electron beam 232 is scanned two-dimensionally on the specimen by means of a deflection coil 260. Operation of condensing lens 256, objective lens 258, and deflection coil 260 is controlled by power supply and control unit 245.
- a system controller 233 controls the operations of the various parts of scanning electron beam system 200.
- the vacuum chamber 210 is evacuated with ion pump 268 and mechanical pumping system 269 under the control of vacuum controller 232.
- Electron beam 232 can be focused onto sample 202, which is on movable X-Y stage 204 within lower vacuum chamber 210.
- sample 202 When the electrons in the electron beam strike sample 202, the sample gives off x-rays whose energy correlated to the elements in the sample.
- X-rays 232 having energy inherent to the elemental composition of the sample are produced in the vicinity of the electron beam incident region.
- Emitted x-rays are collected by x-ray detector 240, preferably an energy dispersive detector of the silicon drift detector type, although other types of detectors could be employed, which generates a signal having an amplitude proportional to the energy of the detected x-ray.
- Output from detector 240 is amplified and sorted by the processor 220, which counts and sorts the total number of X-rays detected during a specified period of time, at a selected energy and energy resolution, and a channel width (energy range) of preferably between 10-20 eV per channel.
- Processor 220 can comprise a computer processor; operator interface means (such as a keyboard or computer mouse); program memory 222 for storing data and executable instructions; interface means for data input and output, executable software instructions embodied in executable computer program code; and display 244 for displaying the results of a multivariate spectral analysis by way of video circuit 242.
- Processor 220 can be a part of a standard laboratory personal computer, and is typically coupled to at least some form of computer-readable media.
- Computer-readable media which include both volatile and nonvolatile media, removable and non-removable media, may be any available medium that can be accessed by processor 220.
- Computer-readable media comprise computer storage media and communication media.
- Computer storage media include volatile and nonvolatile, removable and non-removable media implemented in any method or technology for storage of information such as computer-readable instructions, data structures, program modules or other data.
- computer storage media include RAM, ROM, EEPROM, flash memory or other memory technology, CD-ROM, digital versatile disks (DVD) or other optical disk storage, magnetic cassettes, magnetic tape, magnetic disk storage or other magnetic storage devices, or any other medium that can be used to store the desired information and that can be accessed by processor 220.
- Program memory 222 can include computer storage media in the form of removable and/or non-removable, volatile and/or nonvolatile memory and can provide storage of computer-readable instructions, data structures, program modules and other data.
- the processor 220 is programmed by means of instructions stored at different times in the various computer-readable storage media of the computer.
- Programs and operating systems are typically distributed, for example, on floppy disks or CD-ROMs. From there, they are installed or loaded into the secondary memory of a computer. At execution, they are loaded at least partially into the computer's primary electronic memory.
- the invention described herein includes these and other various types of computer-readable storage media when such media contain instructions or programs for implementing the steps described below in conjunction with a microprocessor or other data processor.
- the invention also includes the computer itself when programmed according to the methods and techniques described herein.
- An x-ray spectrum obtained as described above can be stored in a portion of memory 222, such as the measured spectra memory portion 223.
- Data template memory portion 224 stores data templates, such as known spectra of elements or, in some embodiments, known diffraction patterns of materials.
- Weighing Factor Memory portion 225 stores weighting factor for each of the data templates, the weighting factors combining with the data templates to produce a calculated spectrum approximating the measured spectrum. The weighting factors correlated to the abundance in the sample of the element corresponding to the data template.
- Processor 220 uses the methods described above to minimize an error value which represents the different between the measured pattern and the combination of the data templates and weighting factors.
- While the embodiment shown includes a scanning electron microscope, related embodiment could use a transmission electron microscope or a scanning transmission electron microscope to generate x-rays from the sample.
- An x-ray fluorescence system could also be used to generate x-rays from the sample.
- Other embodiments may detect other characteristic radiation, such as gamma rays, from a sample.
- compositions reported are affected by a number of factors outside of the algorithm of this engine.
- the definition of the standards used as pure elements was not defined. Although some elements standards, such as gold or iron can be measured directly, other elements a be derived from minerals because they cannot be measured directly. For example, oxygen is derived by measuring quartz (SiO 2 ) and silicon, and subtracting a portion of the silicon from the quartz spectrum. This is repeated for a large number of elements to create the full element list. Therefore, these derived elements may not be as accurate in their spectra or lifetime. Consequently, additional work is underway to improve the quality of the standards, irrespective of the algorithm presented here.
- spectrum includes any property that is represented by an intensity graph including for example, an x-ray or a diffraction pattern.
Landscapes
- Chemical & Material Sciences (AREA)
- Physics & Mathematics (AREA)
- Analytical Chemistry (AREA)
- Immunology (AREA)
- Life Sciences & Earth Sciences (AREA)
- Biochemistry (AREA)
- General Health & Medical Sciences (AREA)
- General Physics & Mathematics (AREA)
- Health & Medical Sciences (AREA)
- Pathology (AREA)
- Dispersion Chemistry (AREA)
- Spectroscopy & Molecular Physics (AREA)
- Crystallography & Structural Chemistry (AREA)
- Analysing Materials By The Use Of Radiation (AREA)
- Investigating, Analyzing Materials By Fluorescence Or Luminescence (AREA)
- Investigating Or Analysing Materials By Optical Means (AREA)
- Spectrometry And Color Measurement (AREA)
Abstract
Description
- The present invention relates broadly to a method and system for spectrum data analysis
- In many applications, information about a sample is determined by accumulating radiation from the sample over a period of time. A characteristic of the radiation, such as its energy profile or its diffraction pattern, can often be correlated to the type of material present in the sample. For example, when bombarded by electrons, a sample gives off characteristic x-rays whose energy correlates to the elements in the sample. Similarly, when bombarded with x-rays, crystals produce a characteristic diffraction pattern, and the frequency spectrum of gamma rays and other radiation are used by astronomers to learn about the composition of universe. The term "sample" is used broadly herein to include an object under observation.
- In one widely used application, a scanning electron microscope can be used to determine the elemental composition of an unknown material. The scanning electron microscope (SEM) sends high-energy electrons smashing into material. When these electrons enter an atom, they can knock electrons out of the material. In the process, the first electron looses some energy, but can go on to smash into other atoms until it no longer has enough energy to continue doing so.
-
Figure 1 shows an atom with electrons bound to the K, L, and M energy levels. An electron from the SEM is fired into this atom at a very high energy, dislodging one of the electrons from the atom. A very short time later, an electron from a higher energy level will fall into the created gap. In the process of falling into the lower energy K shell, it emits a single x-ray to balance the overall energy. The energy of the emitted x-ray depends on the initial location of the electron. If the electron originates from the L shell, then the radiation is designated as Kα radiation. If it originates from the M shell, then the radiation is designated as Kβ radiation, which has a higher energy than Kα radiation. - Alternatively, if an electron was dislodged from the L energy level, then a different set of x-rays may be omitted, depending from where the electron that will fill in the emptied position originates.
Figure 1 shows that an electron falling from the M shell to the L shell is associated with the emission of Lα radiation. - The emitted x-rays are dependent on the specific starting and finishing energy levels. By analyzing the energy of the emitted x-ray, the type of the emitting atom can be determined. Each element in the periodic table has a specific set of energies corresponding to these x-ray energies. For example, the energy of the Kα radiation for carbon is 277eV, compared to 523eV for oxygen, or 98434eV for uranium. If the electron from the SEM has a lower energy than this binding energy, then it is unable to dislodge the electron from the atom.
- A complete list of binding energies for each element can be seen at http://xdb.lbl.gov/Section1/Table_1-2.pdf.
- Alternatively, the electrons from the SEM may not enter an atom, but may be deflected away from an atom. This is caused by the negative electric charge on the electron being repelled by the negative charge of the electron cloud around the atoms.
-
Figure 2 shows that the path of the electron is deflected away from an atom due to mutual electrostatic repulsion. The deflection of the path causes a small drop in energy of the high energy electron. This generates the Bremsstrahlung radiation. This effect occurs at lower intensities than the emission of x-rays seen inFigure 1 . However, it also occurs at all energy levels, rather than at discrete energy levels. The Bremsstrahlung radiation is an artefact of using an electron beam from a SEM. It must be taken into account when calculating the elemental composition. The shape of the Bremsstrahlung radiation depends on the average density of the material being analyzed, and is also affected by the standard based spectral analysis. - Standard based spectral analysis is a term used to describe the process of comparing the spectrum of an unknown mineral or element with a set of known spectra to determine the composition of the unknown spectrum in terms of the known spectra. This approach generates a solution that represents a multiplication factor for each of the known templates, which are then added together to synthesize the unknown spectrum.
-
Figure 3 shows the spectrum of pyrite (FeS2). The spectrum comprises several peaks, and some regions of Bremsstrahlung radiation. There are some additional smaller peaks in this plot that are due to carbon (at 277eV), and the iron Lα peak at 705eV. - If one measures a sample of pure iron and pure sulphur, the spectra of these elements can be overlaid onto the spectrum of pyrite appropriately. The result is shown in
Figure 4 . In particular,Figure 4 shows that scaling theiron spectrum 44 to 42.0% and thesulphur spectrum 46 to 41.5% allows them to fit the peaks in thepyrite spectrum 42. These numbers are the peak ratios of these elements, because they represent the ratio of the area of each peak relative to a pure sample of the element. They do not represent the weight percentage of the material. - The peak ratios obtained previously can be converted to a weight percentage using a standard matrix correction algorithm such as ZAF corrections. ZAF corrections account for differences in the atomic number (Z) of the elements, the absorption factor (A) of x-rays travelling through the material, and fluorescence (F) of x-rays from elements stimulating the emission of x-rays from other elements.
- In order to use standard-based spectral analysis, the operating conditions of the SEM must be determined. The factors that influence spectral analysis are the beam voltage, x-ray detector angles and beam current. The beam voltage affects the peaks that are stimulated and produce x-rays. As discussed previously in the text, if the beam voltage is lower than a particular binding energy for an elemental peak, then the peak is not present in the spectrum. In addition, the peaks that have a significantly lower binding energy are stimulated far more than peaks with binding energy close to the beam voltage. This results in the spectrum containing very large peaks in the low energy range, and very small peaks in the high energy range.
- The x-ray detector angle affects the calculations for ZAF corrections, because it models the length of the path that the x-rays traverse through the material before reaching the detector.
- The beam current affects the rate at which x-rays are generated. The standards need to be collected at the same current as the analysis is performed.
- Some elemental spectra have peaks that overlap other element peaks. For instance, sulphur, lead and molybdenum have a peak at 2307eV, 2342eV and 2293eV respectively. The elements have other peaks at different energies, but these spectra look very similar because the SEM beam voltage is too low to excite the molybdenum K peaks significantly (at 17481eV). In addition, the lead K peaks are not excited at all because their energy is too high (74989eV). This causes difficulties trying to resolve minerals that contain lead, sulphur or molybdenum. This is particularly difficult for galena which contains both lead and sulphur.
-
Figure 5 shows thespectrum 52 for galena, and the scaledspectra 54 for lead and sulfur 56. The peaks for lead and sulfur overlap significantly, which makes the analysis of galena more difficult than pyrite. There are other elements whose elemental peaks overlap strongly and, thus, elemental artefacts may occur if one of these elements is present in the mineral.Figures 6 to 12 show further examples of such overlapping elements. - In particular,
Figure 7 shows that theplatinum spectrum 74 and thezirconium spectrum 72 have an overlapping peak at 2.04keV (channel 102). This causes problems in the analysis because it can incorrectly introduce zirconium to the analyzed composition if platinum is present.Figure 8 shows the same type of overlapping peaks for thesodium spectrum 82 and thezinc spectrum 84. This causes sodium artefacts to be reported in minerals containing zinc.Figure 9 shows that this type of overlap is also present for thealuminium spectrum 92 and thebromine spectrum 94.Figure 10 shows the overlapping peak of thecadmium spectrum 102 and theuranium spectrum 104, which are very similar and could be confused at low concentration. -
Figure 11 shows the close overlap of the peaks of thesilver spectrum 112 and thethorium spectrum 114. This close overlap causes problems at low count because the only difference between the spectra of these elements is the small peak at channel 648, which is invisible for low count spectra. This causes the identification of minerals containing either thorium or silver to incorrectly include the other element because of this overlap. Finally,Figure 12 shows the overlapping peaks of theYttrium spectrum 122 and theIridium spectrum 124. Even such a relatively small overlap seems to cause problems for zirconia. - The calculation of the constituent elements from a spectrum is not particularly difficult if high count spectra are used. For instance,
Figure 13 shows the spectrum of the mineral Albite (NaAlSi3O8) with the peaks shown very smoothly. The total number of x-rays collected to generate this spectrum was one million. In contrast,Figure 14 shows the same mineral where the total number of x-rays collected was three hundred. In this figure, thejagged plot 142 shows the spectrum of the mineral, while thesmooth plot 144 shows a fit of elemental spectra to the mineral. In the second example there is significant noise in the spectra and the peaks are not smooth. The elements reported for the low count spectra contain a number of artefacts that appear to be present based on the spectra, but are not present in the mineral. The task of analyzing spectra at low counts is more difficult because there is far more variability in the underlying spectrum, and the peaks of each element are not Gaussian. Therefore, the techniques used by existing approaches are unsuitable for low count spectral analysis for mineral identification, because they generally assume a smooth spectrum. - On the other hand, the accuracy of element quantification is lower for low-count spectra. If the elements shown in
Figure 13 and Figure 14 are compared, it is apparent that the quantities of the four elements O, Na, Al and Si are slightly inaccurate at 300 counts. - It is an object of the present invention to substantially overcome, or at least ameliorate, one or more disadvantages of existing arrangements; or to provide a useful alternative.
- According to a first aspect of the present disclosure, there is provided a method for spectrum data analysis, the method comprising the steps of:
- collecting a spectrum of an unknown material;
- providing a set of element data templates;
- calculate optical least squares weights for the element data templates in approximating the spectrum;
- removing one or more of the templates having negative weights in approximating the spectrum; and
- re-calculating an approximation of the spectrum with said one or more templates removed.
- According to a second aspect of the present disclosure, there is provided an electronic system for spectrum data analysis, the system comprising:
- spectrum acquisition means for obtaining an x-ray spectrum of an unknown material;
- memory means for storing a set of element data templates; and
- processing means for;
- calculating least squares weights for the element data templates in approximating the obtained spectrum;
- removing one or more of the templates having negative weights in approximating the spectrum; and
- re-calculating an approximation of the spectrum with said one or more templates removed.
- According to another aspect of the present disclosure there is provided a computer program product including a computer readable medium having recorded thereon a computer program for implementing the aforementioned method.
- Other aspects of the invention are also disclosed.
- Some conceptual diagrams and at least one embodiment of the present invention will now be described with reference to the drawings and appendices, in which:
-
Figs. 1 and 2 show conceptual energy diagrams and in principal functionality behind the method of standard electron microscopy (SEM). -
Fig. 3 shows the spectrum of mineral pyrite. -
Fig. 4 shows a two-element spectral analysis of pyrite. -
Fig. 5 shows the spectrum of Galena with nearby elements. -
Fig. 6 illustrates the concept of element peak overlap. -
Figs. 7 to 12 show the overlapping peaks of various elements. -
Figs. 13 and 14 show two spectra of Albite obtained on the basis of different count number. -
Fig. 15 shows a high-level flow diagram of the currently described Itterative Least Square Algorithm. -
Fig. 16 shows galena(PbS) before and after non uniform sub-sampling. -
Fig. 17 shows magnified view of sub-sampled region. -
Figs. 18 and 19 show template spectra obtained without and with non-uniform sub-sampling, respectively.. -
Fig. 20 shows interative least squares initialization block diagram. -
Fig. 21 shows albite spectrum (NaAlSi3O2). -
Fig. 22 shows raw template multipliers for albite after 1st iteration. -
Fig. 23 shows scaled templates for albite. -
Fig. 24 shows magnified portion of scaled templates. -
Fig. 25 shows background element substitution algorithm. -
Fig. 26 shows interative absolute error refinement. -
Fig. 27 shows simple two element spectral analysis of nickel silicide. -
Fig. 28 shows Ni2Si spectrum. -
Fig. 29 shows monazite. -
Fig. 30 shows portions of the spectrum used to calculate the nickel K peak ratio. -
Fig. 31 shows peak ratio calculation block diagram. -
Fig. 32 shows average processing time. -
Figs. 33 to 48 show the compositions of various minerals calculated by way of the algorithm of the present invention. -
Fig. 49 shows a typical electron beam system embodying the present invention. - . Embodiments of the invention are particularly well suited for determining sample characteristics using a relatively small number of "counts," that is, a relatively small amount of detected radiation. The radiation can be, for example, an x-ray spectrum for an electron microscope, an x-ray spectrum from X-ray fluorescence, an x-ray diffraction pattern, a light, microwave, or gamma ray spectra from an astronomical object, or a mass spectrum from a mass spectrometer. While the prior art interprets a smooth spectrum produced by a large number of counts, embodiments of the invention are suitable for determining materials from a rough, noisy spectrum having, for example, fewer than 100,000 counts, fewer than 10,000 counts, fewer than 1,000 counts, or fewer than 500 counts. Because it takes time to accumulate counts, embodiments of the invention allow for more rapid characterization of materials compared to the prior art. Embodiments of the invention can be used to determine, for example, the elemental composition of a sample in an x-ray spectroscopy embodiment, the mineral composition of a sample in an x-ray diffraction embodiment, or the mass composition of a sample, in a mass spectroscopy embodiment.
- In an embodiment in which the invention is used to determine the elemental composition of a sample using x-ray spectroscopy, the standard operating conditions of the SEM configuration used in obtaining at least some of the results presented in the present description include 25keV beam voltage, 5nA beam current, and 35 degree x-ray detector angle. The beam voltage is too low to dislodge the electrons for uranium in the K shell, which require nearly four times that energy. However, it is high enough to dislodge the M shell electrons for uranium because they require 3165eV.
- Some portions of the description which follows are explicitly or implicitly presented in terms of algorithms and functional or symbolic representations of operations on data within a processor or a computer memory. These algorithmic descriptions and functional or symbolic representations are the means used by those skilled in the data processing arts to convey most effectively the substance of their work to others skilled in the art. An algorithm is here, and generally, conceived to be a self-consistent sequence of steps leading to a desired result. The steps are those requiring physical manipulations of physical quantities, such as electrical, magnetic or optical signals capable of being stored, transferred, combined, compared, and otherwise manipulated.
- Unless specifically stated otherwise, and as apparent from the following, it will be appreciated that throughout the present specification, discussions utilizing terms such as "scanning", "calculating", "determining", "replacing", "generating", "initializing", "outputting", or the like, refer to the action and processes of a computer system, or similar electronic device, that manipulates and transforms data represented as physical quantities within the computer system into other data similarly represented as physical quantities within the computer system or other information storage, transmission or display devices.
- Thus, the present specification discloses both a method and an apparatus for performing the operations of the method. Such apparatus may be specially constructed for the required purposes, or may comprise a general purpose computer or other device selectively activated or reconfigured by a computer program stored in the computer. The algorithms and displays presented herein are not inherently related to any particular computer or other apparatus. Various general purpose machines may be used with programs in accordance with the teachings herein. Alternatively, the construction of more specialized apparatus to perform the required method steps may be appropriate. The structure of a conventional general purpose computer will appear from the description below.
- In addition, the present specification also implicitly discloses a computer program, in that it would be apparent to the person skilled in the art that the individual steps of the method described herein may be put into effect by computer code. The computer program is not intended to be limited to any particular programming language and implementation thereof. It will be appreciated that a variety of programming languages and coding thereof may be used to implement the teachings of the disclosure contained herein. Moreover, the computer program is not intended to be limited to any particular control flow. There are many other variants of the computer program, which can use different control flows without departing from the spirit or scope of the invention.
- Furthermore, one or more of the steps of the computer program may be performed in parallel rather than sequentially. Such a computer program may be stored on any computer readable medium. The computer readable medium may include storage devices such as magnetic or optical disks, memory chips, or other storage devices suitable for interfacing with a general purpose computer. The computer readable medium may also include a hard-wired medium such as exemplified in the Internet system, or wireless medium such as exemplified in the GSM mobile telephone system. The computer program when loaded and executed on such a general-purpose computer effectively results in an apparatus that implements the steps of the preferred method.
- The invention may also be implemented as hardware modules. More particular, in the hardware sense, a module is a functional hardware unit designed for use with other components or modules. For example, a module may be implemented using discrete electronic components, or it can form a portion of an entire electronic circuit such as an Application Specific Integrated Circuit (ASIC). Numerous other possibilities exist. Those skilled in the art will appreciate that the system can also be implemented as a combination of hardware and software modules.
- Embodiments of the invention use one or more mathematical algorithms to approximate a measured property, such as an x-ray spectrograph, by using known data templates corresponding to various materials, and weighting factors that correlate to the relative abundance of those materials in the sample. Weighting factors are determined that produce, in combination with the data templates, a spectrum, diffraction pattern, or other pattern, that closely matches the measured pattern. The difference between the measured pattern and the combination of the data templates and weighting factors, is referred to an error value. Mathematical algorithms are used to minimize the error value. One preferred algorithm to find weighting factors that minimize the error value is an iterative least squares method, and is described in detail below. The invention is not limited to any particular algorithm.
- The iterative least squares analysis is a technique which uses standard linear least squares curve fitting to find the optimal weights for each template in order to synthesise the spectrum of an unknown material. It builds a list of candidate elements and uses various conditions to detect which elements are artefacts and which elements are in the solution.
- The spectral analysis algorithm disclosed here is presented in
Figure 15 . The algorithm is directed at analysing low-count spectra (typically 1000 counts), but can also be applied for analysing high count spectra. It performs element identification and quantification simultaneously to compute the peak ratios of each element. It also applies real-world knowledge to address various minor deficiencies and to minimize the chance of reporting artefact elements that appear to be in the spectrum but are not actually present. - The raw spectrum data is altered to improve the discrimination ability between similar elements. When spectrum data is acquired, the data tends to have larger peaks at lower energy, and if any peaks are present at high energy they are generally far smaller in magnitude. This presents a problem for discriminating between similar elements (see
Figure 4 for example). - In the non-uniform spectra sub-sampling phase, the spectrum is sub-sampled non uniformly. Such sampling preserves the resolution of the low energy portion of the spectrum, while increasing the peak signal-to-noise ratio at high energy at the expense of peak resolution. This trade-off is acceptable for two reasons - firstly the tiny high energy peaks become more important, and secondly the Energy-Dispersive Spectroscopy (EDS) x-ray detector has a resolution that is significantly worse at high energy compared to low energy.
- The non-uniform sub-sampling is implemented as follows:
- 1. Retain the original spectrum for all channels below 8keV. The purpose is to preserve the high resolution obtained by the x-ray detector for these channels. It also fits with the fact that elements have a higher count rate (i.e. rate at which x-rays are generated) at lower energy compared to higher energy. This arbitrary threshold was selected based on the spectra of nickel and copper, where the K-L ratio changes from greater-than-1 for nickel to a value of less-than-1 for copper. The copper K-alpha peak occurs at 8040eV, and will be magnified accordingly.
- 2. For the remaining data (i.e. above 8keV), accumulate six consecutive channels to form a new channel. This has the effect of increasing the height of all data within this region, and will reinforce peaks while leaving the noise spread out.
Figure 16 shows the original Galena (lead-sulphide) mineral before and after this processing. In standard operating conditions of the described system, the processing changes the number of channels in a spectrum from 1024 to 504.Figure 17 shows the channels for 8keV - 25keV for the original and sub-sampled spectra. The original Galena mineral peak at channel 527 is approximately 3000 photons, compared to 45,000 photons for the peak at channel 117. After processing, this peak has increased in height to 20,000 photons (approximately a factor of 6), while decreasing the number of channels in this region by a factor of 6. This assists in the discrimination between similar elements because the small peaks suddenly become far more important in the least squares fitting. It also reduces the processing time significantly because fewer channels are processed. - The algorithm optimizes the analysis by reducing the number of channels analyzed for the spectrum based on the templates used and the number of photons in the spectrum. For example, low count spectra generally have no peaks at higher energies because there aren't enough photons detected at those energies to create a statistically meaningful peak.
Figure 18 shows an overlay of 45 million count spectra for the elemental templates. If a random spectrum is analyzed which contains only 1000 counts, then any peaks below the thick horizontal line are unlikely to be created because the probability that a photon will be detected there is less than 1/1000. Therefore, it isn't necessary to analyze all 1024 channels for a 1000 count analysis, and thus the number of channels analyzed can be reduced to about 800. This range is dynamically generated based on the templates used for analysis, and increases the computation speed for each iteration. The low count channel optimization is performed after the non-uniform sub-sampling. This reduces the upper channel from about 800 to about 480 for a 1000 count analysis, as shown inFigure 19 . -
Figure 20 shows the block diagram for a proposed algorithm for iterative least squares initialization. The purpose is to quickly remove artefact elements from the solution by purging elements whose concentration is negative. When the elemental concentration is calculated, there are no restrictions on the weights calculated for each element. Thus, this algorithm uses the fact that elements can't have negative concentration as the rule to remove elements. Once there are no negative concentration elements then the stage has completed. The calculation to generate the optimal weights uses the standard linear least squares algorithm. The least squares algorithm solves an over-determined system of linear equations of the form -

- where:
- A is the matrix of known data points;
- b is final solution; and
- x is the set of unknowns which linearly scale the known matrix A to generate the vector b.
- In the presently disclosed approach, A represents the known element templates, b represents the spectrum being analyzed, and x is the multiplication factor applied to each template to generate the spectrum. This is solved as follows
-

- This calculates the optimal set of weights that minimize the squared error
-

- In
Figure 21 the spectrum of the mineral albite is shown. The four peaks are generated by the elements oxygen, sodium, aluminium and silicon respectively. The "concentration" of each element is calculated to minimize the squared error, not to calculate the composition of the mineral. Thus, they are not concentrations but actually represent a multiplier with respect to the reference spectrum for each element. These multipliers are not guaranteed to lie between 0 and 100% but could be any value. In addition, some elements may have negative concentrations, because they are creating "anti-peaks" which are in turn used to offset artefact peaks of other elements that aren't present. This effect is demonstrated inFigure 22 ,Figure 23 and Figure 24 . -
Figure 23 shows each of the element templates after they've been scaled by the values shown inFigure 22 . The four main elements, oxygen, sodium, aluminium and silicon, stand out quite strongly for this mineral.Figure 24 shows that some of the peaks introduced into the solution are being cancelled out by the presence of anti-peaks. If the elements which generate the anti-peaks are removed, the template multipliers for the remaining elements can be improved. In order to reduce the artefact elements, all elements with concentrations below 0.0 are removed and the solution is re-calculated. This process is repeated until there are no more negative concentrations. This removes most of the artefact elements from the mineral. The entire process can be summarised as follows: - 1. Generate the matrix A from the set of templates (accounting for template spectra live time)
- 2. Solve for the optimal weights for x
- 3. If any negative concentrations are present in x, remove those corresponding templates from A, or equivalently, set the weight corresponding to those elements to zero, and go back to
step 1. - This phase of the processing analyzes the solution and substitutes a predefined set of overlapping elements for each element in the solution. The purpose of this phase is to determine whether an element has been removed from the solution prematurely and to restore it if so. The algorithm outline is shown in
Figure 25 . - This phase scans through each element and verifies whether any of the elements is listed with overlapping elements. If so, each overlapping element is added to the composition, one at a time, and the composition is re-computed. The algorithm also tries substituting each of the overlapping elements for the original element. It tests whether the composition has improved by examining the absolute error of the synthesised spectrum given by the composition against the original. A list of overlapping elements is shown in Table 1.
Table 1 Reference Element Overlapping element 1 Overlapping element 2Overlapping element 3Overlapping element 4fluorine Manganese Iron Sodium Zinc Aluminium Bromine Silicon Sirontium Tungsten Tantalum Rubidium Phosphorous Zirconlium Platinium Iridium Yttrium Sulfur Molybdenum Lead Chlorine Rhodium Rubidium Potassium Indium Calcium Antimony Vanadium Oxygen Chromium Vanadium Manganese Manganese Fluorine Europium Iron Manganese Cobalt Fluorine Cobalt Iron Nickel Nickel Cobalt Zinc Sodium Bromine Aluminium Rubidium Silicon Tungsten Tantalum Strontium Silicon Tungsten Yttrium Osmium Phosphorous Zirconium Platinum Phosphorous Iridium Niobium Mercury Molybdenum Sulfur Lead Ruthenlum Chlorine Rhodium Chlorine Sliver Therlum Cadmium Uranium Indium Potassium Antimony Calcium Prasecdymium Lanthanum Neodymium Cerium Europium Manganese Terbium Iron Dysprosium Iron Tantalum Silicon Tungsten Rubidium Copper Tungsten Silicon Strontium Tantalum Rubidium Osmium Yttrium Iridium Zirconium Platinum Phosphorous Platinum Zirconium Phosphorous Iridium Mercury Niobium Lead Sulfur Molybdenum Thosium Sürer Uranium Cadmium - This is an optional single processing step which can be implemented either at this stage of the algorithm, or in the stage of purging trace elements, described later in the text. In particular, this step removes oxygen if the concentration is bellow 5%. This arbitrary threshold was reached after analysing all 76 minerals and elements and determining that this threshold was appropriate to retain oxygen that was indeed present in the minerals. At the same time the chosen concentration also allowed to successfully remove from the calculations oxygen that was merely an artefact. This reduces the amount of trace oxygen reported for all results. The purpose of this stage is to reduce the complexity of the results reported.
-
Figure 26 shows the block diagram for the iterative absolute error refinement stage. The purpose of this stage is to remove element artefacts from the composition by minimising the absolute error between the synthesised spectrum and the source spectrum. It iterates through the elements and removes each element one at a time. It then recomputes the concentrations of the remaining elements and checks if the absolute error has decreased. This is repeated for all elements. It then removes the element that had the largest decrease in error, and repeats the process iteratively. - This is a final processing stage which represents a set of rules for removing certain elements if their overlapping element (see Table 2) is also present. The stage is designed to remove elements that may appear to be in the spectrum, but are usually the result of matrix effects distorting the mineral spectrum and altering the relative intensity of element peaks. For example, the synthetic mineral nickel silicide (Ni2Si) consists of nickel (plot 274) and silicon (plot 276). If the relative heights of the nickel K and L peaks are compared for Ni2Si and pure nickel, the Ni2Si Lα peak 272 (851eV) is significantly taller than expected, as shown in
Figure 27 . - The increase in height is caused by x-rays generated from the silicon interacting with the nickel atoms and generating additional x-rays. This causes the spectral fitting to match poorly for this peak, and other elements may be added to the solution to try to reduce the mismatch. This stage is designed to detect elements that may have been added incorrectly and to remove them.
- During this stage, the solution for pairs of elements is analyzed and, if both elements are found, one of the elements is removed. The relative concentration of each element pair is stored, because some of the elements can occur in minerals together (such as molybdenum and sulphur), but others do not (such as thorium and silver). In the case where they do not occur together, the relative concentration required is 0, which means that the less common element will always be removed if both have been reported in the composition. The higher the relative concentration required, the more difficult it is to remove the potentially overlapping elements. The relative concentrations specified here have been derived empirically from a test set, and may not represent the optimal set of relative concentration thresholds for all minerals.
-
Table 2 Elements Present Element Removed Relative concentration required Sodium, zinc Sodium 2 Phosphorous, Yttrium Phosphorus 4 Phosphorous, Zirconium Phosphorous 3 Gallium, Sodium Gallium 0 Aluminium, Bromine Bromine 0 Strontium, Silicon Strontium 5 Zirconium, Platinum Zirconium 5 Molybdenum, Sulfur Molybdenum 6 Indium, Potassium Indium 0 Cerium, Vanadium Cerium 0.6 Cerium, Chromium Cerium 2.7 Neodymium, Chromium Neodymium 1 Europium, Manganese Europium 0.5 Europium, Iron Europium 0.5 Terbium, Iron Terbium 0.5 Dysprosium, Iron Dysprosium 6 Holmium. Iron Holmium 3 Holmium, Cobalt Holmium 0.5 Erbium, Iron Erbium 8 Thulium, Copper Thutium 0.5 Thulium, Aluminium Thulium 5 Thulium, Iron Thulium 10 Ytterbium, Nickel Ytterbium 5 Ytterbium, Zinc Ytterbium 4 Hafnium, Silicon Hafnium 6 Tantalum, Silicon Tantalum 1 Tantalum, Zinc Tantalum 0 Tantalum, Copper Tantalum 3 Tungsten, Silicon Tungsten 3.5 Rhenium, Zinc Rhenium 7.0 Osmium, Zirconium Osmium 10.0 Thorium, Silver Thorium 2.0 - This step removes trace elements from the solution and normalises the result. It uses a magic threshold of less than 2.5% as the criteria for retaining elements. The reason is
- that elements of such a low concentration are generally artefacts in the composition rather than being present. The specific threshold for elements being removed in the currently disclosed system and method is approximately 0.5%. The solution is then normalized to 100%.
- This stage is required because the element ratios up to this point refer to the optimal set of multiplication factors required to fit the element spectra to the unknown mineral. However, the final output of the spectrum processing must be a weight percentage per element, which requires a matrix correction. The ZAF corrections applied at the end require that the elements are quantified relative to a single peak rather than for the entire spectrum. Therefore, this stage computes the peak ratio of each element and specifies the peak that was used to calculate the percentage.
- The peak for each element is determined, and the ratio for that peak is computed. It is desirable to use higher energy peaks because they are not subject to as many ZAF effects as lower energy peaks. In the presently described method, the highest peak for each element is selected for which the ratio of the beam energy to the peak energy does not exceed 2.5. Therefore, when using a beam voltage of 25kV, the selected highest peak has voltage of 10kV or less. In the case of nickel (in Ni2Si), this is the K peak at 7477eV (
Figure 28 ). - However, when overlapping elements are present, the peak ratios cannot be calculated individually because emissions from the other elements are often contributing significantly to a particular peak.
Figure 29 shows a portion of the spectrum for the mineral "monazite" (plot 292) which contains several rare earth elements, such as La (plot 294), Ce (plot 296), Pr (plot 297), Nd (plot 298) and Th (plot 299). Thespectra 297 for Pr and thespectrum 298 for Nd have been highlighted to illustrate that these cannot be computed in isolation of the other elements because there are significant overlapping portions of the spectra from other elements. - Fortunately, the existing technique of computing the element concentration can be directly applied to computing the peak ratios by using
Equation 2. However, rather than compute the solution for the entire spectrum, the technique uses as much of the spectrum as possible, and removes the other peaks.Figure 30 shows a diagrammatic representation of this computation for computing the nickel K peak ratio. The nickel L peak is omitted from the calculation, but otherwise it directly solves for the peak ratio by solvingequation 2. - A block diagram for this computational algorithm is shown in
Figure 31 . The algorithm attempts to prevent having to compute the peak ratios for elements that only have one peak (such as magnesium) by reusing the existing result. All elements below Argon (Z=18) have one peak. In addition, in the standard operating conditions of the presently disclosed mehtod, the beam voltage is 25keV. Consequently, the elements Pd, Ag, Cd, In, Sn, Sb, Te and I only have one peak, because the K peak is higher than the beam voltage and they do not have any M peaks. This provides a minor performance optimization by avoiding recomputing the peak ratios for these elements. - The algorithm also contains a second path which drops elements from the composition if their concentration changes significantly. This is intended to catch elements that have been reported in trace amounts, but whose concentration increases by a factor of 10x, if a single peak is analyzed in isolation.
- The peak ratios are corrected using ZAF corrections prior to being reported.
- The processing time for the algorithm was targeted at 10 milliseconds for a 1000 count spectrum.
Figure 32 shows the average execution time of the entire spectral analysis engine when analysing the set of minerals from the SPI_MINERALS and Smithsonian standard blocks. The processing time was found to be inversely proportional to the number of counts in the spectrum. This is expected, because the spectrum becomes smoother at higher counts and it is less difficult to establish the correct set of elements, and there are fewer incorrect elements that need refining or exchange. - The longer than expected processing time may be associated with some programming overhead translating between the managed C# code and the unmanaged C++ spectral analysis engine code. The execution time is also proportional to the number of elements used for analysis. The figures shown in
Figure 32 were generated when analysing with 72 elements. - Whereas convention x-ray spectroscopy analysis uses millions of counts that are accumulated on the order or a second or more, to produce a sufficiently smooth surve for conventional analysis, embodiments of the present invention can use fewer than 100,000 counts, fewer than 50,000 counts, fewer than 10,000 counts, fewer than 3000 counts, fewer than 1000 counts or fewer than 500 counts, depending on the accuracy required. Using a typical silicon drifted x-ray detector in which having a surface area of between 10mm2 and 30mm2 and subtending a solid angle of about 0.3 sr, embodiments of the present invention can determine the elements present in a sample in less than one hundred milliseconds, less than a ten milliseconds, and in some embodiments, on the order of a few milliseconds.
- Some composition results of the described method for spectral analysis are shown in
Figures 33 to 48 . The theoretical composition of each mineral is listed at the bottom of each plot. The mean and standard deviation of each result is reported in the legend of each plot. Each of these analyzes was performed at 1000 counts. The main observations that can be made is that carbon and oxygen vary far more widely than other elements. Secondly, low concentration elements may appear or disappear from the composition if their composition is too small. Finally, artefact elements are present in nearly every composition, but at low concentrations. -
FIG. 49 shows a scanningelectron beam system 200 with anx-ray detector 240 suitable for practicing embodiments of the present invention. Ascanning electron microscope 241, along with power supply andcontrol unit 245, is provided withsystem 200. Anelectron beam 232 is emitted from acathode 253 by applying voltage betweencathode 253 and ananode 254.Electron beam 232 is focused to a fine spot by means of a condensinglens 256 and anobjective lens 258.Electron beam 232 is scanned two-dimensionally on the specimen by means of adeflection coil 260. Operation of condensinglens 256,objective lens 258, anddeflection coil 260 is controlled by power supply andcontrol unit 245. - A
system controller 233 controls the operations of the various parts of scanningelectron beam system 200. Thevacuum chamber 210 is evacuated withion pump 268 andmechanical pumping system 269 under the control ofvacuum controller 232. -
Electron beam 232 can be focused ontosample 202, which is on movable X-Y stage 204 withinlower vacuum chamber 210. When the electrons in the electronbeam strike sample 202, the sample gives off x-rays whose energy correlated to the elements in the sample.X-rays 232 having energy inherent to the elemental composition of the sample are produced in the vicinity of the electron beam incident region. Emitted x-rays are collected byx-ray detector 240, preferably an energy dispersive detector of the silicon drift detector type, although other types of detectors could be employed, which generates a signal having an amplitude proportional to the energy of the detected x-ray. - Output from
detector 240 is amplified and sorted by theprocessor 220, which counts and sorts the total number of X-rays detected during a specified period of time, at a selected energy and energy resolution, and a channel width (energy range) of preferably between 10-20 eV per channel.Processor 220 can comprise a computer processor; operator interface means (such as a keyboard or computer mouse);program memory 222 for storing data and executable instructions; interface means for data input and output, executable software instructions embodied in executable computer program code; and display 244 for displaying the results of a multivariate spectral analysis by way ofvideo circuit 242. -
Processor 220 can be a part of a standard laboratory personal computer, and is typically coupled to at least some form of computer-readable media. Computer-readable media, which include both volatile and nonvolatile media, removable and non-removable media, may be any available medium that can be accessed byprocessor 220. By way of example and not limitation, computer-readable media comprise computer storage media and communication media. Computer storage media include volatile and nonvolatile, removable and non-removable media implemented in any method or technology for storage of information such as computer-readable instructions, data structures, program modules or other data. For example, computer storage media include RAM, ROM, EEPROM, flash memory or other memory technology, CD-ROM, digital versatile disks (DVD) or other optical disk storage, magnetic cassettes, magnetic tape, magnetic disk storage or other magnetic storage devices, or any other medium that can be used to store the desired information and that can be accessed byprocessor 220. -
Program memory 222 can include computer storage media in the form of removable and/or non-removable, volatile and/or nonvolatile memory and can provide storage of computer-readable instructions, data structures, program modules and other data. Generally, theprocessor 220 is programmed by means of instructions stored at different times in the various computer-readable storage media of the computer. Programs and operating systems are typically distributed, for example, on floppy disks or CD-ROMs. From there, they are installed or loaded into the secondary memory of a computer. At execution, they are loaded at least partially into the computer's primary electronic memory. The invention described herein includes these and other various types of computer-readable storage media when such media contain instructions or programs for implementing the steps described below in conjunction with a microprocessor or other data processor. The invention also includes the computer itself when programmed according to the methods and techniques described herein. - An x-ray spectrum obtained as described above can be stored in a portion of
memory 222, such as the measured spectra memory portion 223. Datatemplate memory portion 224 stores data templates, such as known spectra of elements or, in some embodiments, known diffraction patterns of materials. WeighingFactor Memory portion 225 stores weighting factor for each of the data templates, the weighting factors combining with the data templates to produce a calculated spectrum approximating the measured spectrum. The weighting factors correlated to the abundance in the sample of the element corresponding to the data template.Processor 220 uses the methods described above to minimize an error value which represents the different between the measured pattern and the combination of the data templates and weighting factors. - While the embodiment shown includes a scanning electron microscope, related embodiment could use a transmission electron microscope or a scanning transmission electron microscope to generate x-rays from the sample. An x-ray fluorescence system could also be used to generate x-rays from the sample. Other embodiments may detect other characteristic radiation, such as gamma rays, from a sample.
- The compositions reported are affected by a number of factors outside of the algorithm of this engine. The definition of the standards used as pure elements was not defined. Although some elements standards, such as gold or iron can be measured directly, other elements a be derived from minerals because they cannot be measured directly. For example, oxygen is derived by measuring quartz (SiO2) and silicon, and subtracting a portion of the silicon from the quartz spectrum. This is repeated for a large number of elements to create the full element list. Therefore, these derived elements may not be as accurate in their spectra or lifetime. Consequently, additional work is underway to improve the quality of the standards, irrespective of the algorithm presented here.
- As used herein, the term spectrum includes any property that is represented by an intensity graph including for example, an x-ray or a diffraction pattern.
- It will be appreciated by a person skilled in the art that numerous variations and/or modifications may be made to the present invention as shown in the specific embodiments without departing from the spirit or scope of the invention as broadly described. The present embodiments are, therefore, to be considered in all respects to be illustrative and not restrictive.
Claims (13)
- A method of spectrum data analysis, the method comprising the steps of:collecting a spectrum of an unknown material;providing a set of element data templates;calculating least squares weighting factors for the element data templates to form an approximation of the spectrum and determining an error factor for the approximation;characterized by:substituting for one of the data templates in the set a data template corresponding to a material having a spectral peak that overlaps with a spectral peak of the one of the data templates in the set;calculating updated least squares weighting factors for a new set of data templates that reflects the substitution to determine an updated approximation and determining an error factor for the updated approximation; andif the error factor of the updated approximation is smaller than the error factor for the approximation, storing the updated approximation of the spectrum.
- The method as claimed in claim 1, in which collecting a spectrum of an unknown material includes collecting less than 10,000 x-ray counts.
- The method of claim 1 or claim 2 in which collecting a spectrum of an unknown material includes collecting a spectrum determined by a histogram of the number of counts within energy ranges and in which some of the energy ranges are broader than others.
- The method of any of the above claims in which collecting a spectrum of an unknown material includes reducing the number of channels analyzed based on the element data templates used and the number of photons in the spectrum.
- The method of any of the above claims further comprising:removing one or more of the templates having a negative weighting factor from the set of element data templates; andre-calculating an approximation of the spectrum the remaining element data templates and determining an error factor for the approximation.
- The method of claim 5 further comprising iteratively:removing one or more of the templates having a negative weighting factor from the set of element data templates; andre-calculating an approximation of the spectrum the remaining element data templates and determining an error factor for the approximation;
- The method of any of the above claims further comprising removing the data element template corresponding to oxygen if the oxygen concentration is less than 5%.
- The method of any of the above claims further comprising:selecting one data element template of the approximation;calculating least square weighting factors for a reduced set of elements with said one element temporarily removed;determining whether an error factor is reduced; andif the error factor is reduced, storing an updated approximation of the spectrum.
- The method of claim 8, further comprising iteratively:selecting an additional data element template of the approximation;calculating least square weighting factors for a reduced set of elements with said additional element temporarily removed;determining whether an error factor is reduced; andif the error factor is reduced, storing an updated approximation of the spectrum.
- The method of any of the above claims further comprising:removing from the set of data templates or from the new set of data templates a data template of an element having an peak that overlaps with the peak of another element of the set;calculating a least squares candidate solution for the remaining set of elements and determining an error factor;if the error factor is reduced by the removal, storing an updated approximation of the spectrum in which the element corresponding to the removed template is removed.
- The method of claim 10 comprising iteratively:removing from the set of data templates or from the new set of data templates an additional data template of an element having an peak that overlaps with the peak of another element of the set;calculating a least squares candidate solution for the remaining set of elements and determining an error factor;if the error factor is reduced by the removal, storing an updated approximation of the spectrum in which the element corresponding to the removed template is removed.
- The method of any of the above claims further comprising removing from the approximation any elements having a concentration less than a specified threshold and normalizing the remaining elements to 100%.
- An apparatus (200) for determining the elemental composition of a sample (202):a source of an electron beam (232) for impinging on a sample;an x-ray detector (240) for detecting x-rays emitted from the sample upon impingement of the electron beam;computer memory (222, 223, 224, 225) for:accumulating information from the x-ray detector to determine an x-ray spectrum of the sample;storing data templates corresponding to elements;storing a computer program including instructions for a method of analyzing spectrum data according to any of the preceding claims: anda processor (220) for executing the computer instructions to determine the composition of the sample.
Applications Claiming Priority (2)
| Application Number | Priority Date | Filing Date | Title |
|---|---|---|---|
| AU2008900546A AU2008900546A0 (en) | 2008-02-06 | A method and system for spectrum data analysis | |
| EP09707645A EP2250474A4 (en) | 2008-02-06 | 2009-02-06 | METHOD AND SYSTEM FOR ANALYZING SPECTRAL DATA |
Related Parent Applications (2)
| Application Number | Title | Priority Date | Filing Date |
|---|---|---|---|
| WOPCT/US2009/033493 Previously-Filed-Application | 2009-02-06 | ||
| EP09707645.9 Division | 2009-02-06 |
Publications (2)
| Publication Number | Publication Date |
|---|---|
| EP2538185A2 true EP2538185A2 (en) | 2012-12-26 |
| EP2538185A3 EP2538185A3 (en) | 2013-10-30 |
Family
ID=40952728
Family Applications (2)
| Application Number | Title | Priority Date | Filing Date |
|---|---|---|---|
| EP12166979.0A Withdrawn EP2538185A3 (en) | 2008-02-06 | 2009-02-06 | A method and system for spectrum data analysis |
| EP09707645A Withdrawn EP2250474A4 (en) | 2008-02-06 | 2009-02-06 | METHOD AND SYSTEM FOR ANALYZING SPECTRAL DATA |
Family Applications After (1)
| Application Number | Title | Priority Date | Filing Date |
|---|---|---|---|
| EP09707645A Withdrawn EP2250474A4 (en) | 2008-02-06 | 2009-02-06 | METHOD AND SYSTEM FOR ANALYZING SPECTRAL DATA |
Country Status (9)
| Country | Link |
|---|---|
| US (1) | US8880356B2 (en) |
| EP (2) | EP2538185A3 (en) |
| CN (2) | CN102084229B (en) |
| AU (1) | AU2009212187B2 (en) |
| BR (1) | BRPI0907766A2 (en) |
| CA (1) | CA2713984C (en) |
| RU (1) | RU2518230C2 (en) |
| WO (1) | WO2009100404A2 (en) |
| ZA (1) | ZA201005582B (en) |
Families Citing this family (29)
| Publication number | Priority date | Publication date | Assignee | Title |
|---|---|---|---|---|
| US7490009B2 (en) | 2004-08-03 | 2009-02-10 | Fei Company | Method and system for spectroscopic data analysis |
| EP2605005A1 (en) | 2011-12-14 | 2013-06-19 | FEI Company | Clustering of multi-modal data |
| WO2013084905A1 (en) * | 2011-12-09 | 2013-06-13 | 株式会社堀場製作所 | X-ray analysis device |
| EP2834624B1 (en) * | 2012-04-05 | 2019-07-24 | Renishaw PLC | A method for measuring performance of a spectroscopy system |
| EP2653891A1 (en) | 2012-04-19 | 2013-10-23 | Fei Company | Method for analyzing an EDS signal |
| US8664595B2 (en) | 2012-06-28 | 2014-03-04 | Fei Company | Cluster analysis of unknowns in SEM-EDS dataset |
| US9188555B2 (en) * | 2012-07-30 | 2015-11-17 | Fei Company | Automated EDS standards calibration |
| US8937282B2 (en) | 2012-10-26 | 2015-01-20 | Fei Company | Mineral identification using mineral definitions including variability |
| US9048067B2 (en) | 2012-10-26 | 2015-06-02 | Fei Company | Mineral identification using sequential decomposition into elements from mineral definitions |
| US9778215B2 (en) | 2012-10-26 | 2017-10-03 | Fei Company | Automated mineral classification |
| US9091635B2 (en) | 2012-10-26 | 2015-07-28 | Fei Company | Mineral identification using mineral definitions having compositional ranges |
| US9194829B2 (en) | 2012-12-28 | 2015-11-24 | Fei Company | Process for performing automated mineralogy |
| EP2835817B1 (en) | 2013-08-09 | 2017-12-20 | Carl Zeiss Microscopy Ltd. | Method for semi-automated particle analysis using a charged particle beam |
| US9714908B2 (en) * | 2013-11-06 | 2017-07-25 | Fei Company | Sub-pixel analysis and display of fine grained mineral samples |
| WO2015123615A1 (en) * | 2014-02-13 | 2015-08-20 | Brewmetrix, Inc. | Analytical system with iterative method of analyzing data in web-based data processor with results display designed for non-experts |
| EP2960865A1 (en) * | 2014-06-23 | 2015-12-30 | Fei Company | Blend modes for mineralogy images |
| US9183656B2 (en) | 2014-03-11 | 2015-11-10 | Fei Company | Blend modes for mineralogy images |
| EP2990783B1 (en) * | 2014-08-29 | 2019-10-02 | Carl Zeiss Microscopy Ltd. | Method and system for performing EDS analysis |
| US9627175B2 (en) * | 2014-10-17 | 2017-04-18 | Jeol Ltd. | Electron microscope and elemental mapping image generation method |
| US9719950B2 (en) | 2015-02-25 | 2017-08-01 | Fei Company | Sample-specific reference spectra library |
| EP3062096B1 (en) | 2015-02-25 | 2017-10-11 | FEI Company | Sample-specific reference spectra library |
| EP3073253A1 (en) | 2015-03-26 | 2016-09-28 | Fei Company | Sample-specific reference spectra library |
| DE102016014213A1 (en) * | 2015-12-08 | 2017-07-06 | Shimadzu Corporation | X-RAY SPECTROSCOPIC ANALYSIS DEVICE AND ELEMENTARY ANALYSIS METHOD |
| JP6776917B2 (en) * | 2016-02-05 | 2020-10-28 | 住友金属鉱山株式会社 | Method of analyzing elemental sulfur distribution |
| FR3065285B1 (en) * | 2017-04-14 | 2019-07-05 | Commissariat A L'energie Atomique Et Aux Energies Alternatives | METHOD FOR ACQUIRING A SPECTRUM |
| CN108398447B (en) * | 2018-03-01 | 2019-05-24 | 武汉工程大学 | A method for the analysis of the distribution characteristics of zinc element in gold-copper mine tailings |
| GB202208289D0 (en) * | 2022-06-06 | 2022-07-20 | Oxford Instruments Nanotechnology Tools Ltd | Ebsd data enhancement using simulated pattern matching |
| EP4310485B1 (en) * | 2022-07-21 | 2026-03-18 | FEI Company | Method of examining a sample using a charged particle microscope |
| US20250044245A1 (en) * | 2023-07-31 | 2025-02-06 | Fei Company | Energy dispersive x-ray spectroscopy phase spectrum synthesis |
Family Cites Families (51)
| Publication number | Priority date | Publication date | Assignee | Title |
|---|---|---|---|---|
| US1037101A (en) * | 1912-04-26 | 1912-08-27 | Plume & Atwood Mfg Company | Combined socket-cover and shade-holder for electric-light devices. |
| JPS51119289A (en) | 1974-11-29 | 1976-10-19 | Agency Of Ind Science & Technol | Method of determining the heterogenous sample of micro-particles |
| EP0053620B1 (en) * | 1980-06-11 | 1986-10-01 | Commonwealth Scientific And Industrial Research Organisation | Method and apparatus for material analysis |
| US4592082A (en) | 1984-08-10 | 1986-05-27 | The United States Of America As Represented By The United States Department Of Energy | Quantitative determination of mineral composition by powder X-ray diffraction |
| JPH0815185B2 (en) | 1984-11-16 | 1996-02-14 | 株式会社日立製作所 | Method for manufacturing semiconductor integrated circuit device |
| US4807148A (en) * | 1987-05-29 | 1989-02-21 | Hewlett-Packard Company | Deconvolving chromatographic peaks |
| US4839516A (en) | 1987-11-06 | 1989-06-13 | Western Atlas International, Inc. | Method for quantitative analysis of core samples |
| US6018587A (en) | 1991-02-21 | 2000-01-25 | Applied Spectral Imaging Ltd. | Method for remote sensing analysis be decorrelation statistical analysis and hardware therefor |
| US5817462A (en) | 1995-02-21 | 1998-10-06 | Applied Spectral Imaging | Method for simultaneous detection of multiple fluorophores for in situ hybridization and multicolor chromosome painting and banding |
| US5798262A (en) | 1991-02-22 | 1998-08-25 | Applied Spectral Imaging Ltd. | Method for chromosomes classification |
| US5991028A (en) | 1991-02-22 | 1999-11-23 | Applied Spectral Imaging Ltd. | Spectral bio-imaging methods for cell classification |
| JP3076118B2 (en) | 1991-11-27 | 2000-08-14 | シスメックス株式会社 | Particle counting method |
| RU2054660C1 (en) | 1991-12-28 | 1996-02-20 | Алексей Никифорович Никифоров | Method for performing high precision x-ray spectrometry analysis of nonhomogeneous materials |
| US5741707A (en) | 1992-12-31 | 1998-04-21 | Schlumberger Technology Corporation | Method for quantitative analysis of earth samples |
| JP3452278B2 (en) * | 1994-06-30 | 2003-09-29 | 理学電機株式会社 | Qualitative analysis method and qualitative analyzer using X-ray diffraction |
| AUPN226295A0 (en) | 1995-04-07 | 1995-05-04 | Technological Resources Pty Limited | A method and an apparatus for analysing a material |
| JP3607023B2 (en) * | 1996-05-10 | 2005-01-05 | 株式会社堀場製作所 | X-ray quantitative analysis apparatus and method |
| US5798525A (en) | 1996-06-26 | 1998-08-25 | International Business Machines Corporation | X-ray enhanced SEM critical dimension measurement |
| US6058322A (en) | 1997-07-25 | 2000-05-02 | Arch Development Corporation | Methods for improving the accuracy in differential diagnosis on radiologic examinations |
| US6466929B1 (en) | 1998-11-13 | 2002-10-15 | University Of Delaware | System for discovering implicit relationships in data and a method of using the same |
| JP2000249668A (en) | 1999-03-02 | 2000-09-14 | Jeol Ltd | Quantitative analyzer for heterogeneous composite tissue samples |
| US6341257B1 (en) | 1999-03-04 | 2002-01-22 | Sandia Corporation | Hybrid least squares multivariate spectral analysis methods |
| US6282301B1 (en) | 1999-04-08 | 2001-08-28 | The United States Of America As Represented By The Secretary Of The Army | Ares method of sub-pixel target detection |
| US6674894B1 (en) | 1999-04-20 | 2004-01-06 | University Of Utah Research Foundation | Method and apparatus for enhancing an image using data optimization and segmentation |
| US6993170B2 (en) | 1999-06-23 | 2006-01-31 | Icoria, Inc. | Method for quantitative analysis of blood vessel structure |
| JP3527955B2 (en) | 1999-08-26 | 2004-05-17 | 理学電機工業株式会社 | X-ray fluorescence analyzer |
| JP3889187B2 (en) * | 1999-09-09 | 2007-03-07 | 株式会社リガク | X-ray fluorescence analysis method and apparatus |
| US6377652B1 (en) | 2000-01-05 | 2002-04-23 | Abb Automation Inc. | Methods and apparatus for determining mineral components in sheet material |
| US6470335B1 (en) | 2000-06-01 | 2002-10-22 | Sas Institute Inc. | System and method for optimizing the structure and display of complex data filters |
| US6724940B1 (en) | 2000-11-24 | 2004-04-20 | Canadian Space Agency | System and method for encoding multidimensional data using hierarchical self-organizing cluster vector quantization |
| US7761270B2 (en) | 2000-12-29 | 2010-07-20 | Exxonmobil Upstream Research Co. | Computer system and method having a facility management logic architecture |
| US20050037515A1 (en) | 2001-04-23 | 2005-02-17 | Nicholson Jeremy Kirk | Methods for analysis of spectral data and their applications osteoporosis |
| US6584413B1 (en) * | 2001-06-01 | 2003-06-24 | Sandia Corporation | Apparatus and system for multivariate spectral analysis |
| US6687620B1 (en) | 2001-08-01 | 2004-02-03 | Sandia Corporation | Augmented classical least squares multivariate spectral analysis |
| CA2468861C (en) | 2001-12-05 | 2012-06-12 | The Regents Of The University Of California | Robotic microscopy systems |
| US6658143B2 (en) | 2002-04-29 | 2003-12-02 | Amersham Biosciences Corp. | Ray-based image analysis for biological specimens |
| US20040027350A1 (en) | 2002-08-08 | 2004-02-12 | Robert Kincaid | Methods and system for simultaneous visualization and manipulation of multiple data types |
| US7245696B2 (en) * | 2002-05-29 | 2007-07-17 | Xradia, Inc. | Element-specific X-ray fluorescence microscope and method of operation |
| AU2003285926A1 (en) * | 2002-10-25 | 2004-05-25 | Liposcience, Inc. | Methods, systems and computer programs for deconvolving the spectral contribution of chemical constituents with overlapping signals |
| JP2004151045A (en) * | 2002-11-01 | 2004-05-27 | Hitachi High-Technologies Corp | Electron microscope or X-ray analyzer and sample analysis method |
| US7400770B2 (en) | 2002-11-06 | 2008-07-15 | Hrl Laboratories | Method and apparatus for automatically extracting geospatial features from multispectral imagery suitable for fast and robust extraction of landmarks |
| US20040147830A1 (en) | 2003-01-29 | 2004-07-29 | Virtualscopics | Method and system for use of biomarkers in diagnostic imaging |
| WO2005029016A2 (en) * | 2003-03-13 | 2005-03-31 | University Of Florida | Material identification employing a grating spectrometer |
| CN100498309C (en) | 2003-09-28 | 2009-06-10 | 中国石油化工股份有限公司 | Method for analyzing metal content in catalytic cracking catalyst through X ray fluorescence method |
| WO2005043171A1 (en) * | 2003-10-23 | 2005-05-12 | Liposcience, Inc. | Methods, systems and computer programs for assessing chd risk using mathematical models that consider in vivo concentration gradients of ldl particle subclasses of discrete size |
| DE10352013B4 (en) * | 2003-11-07 | 2008-02-07 | Siemens Ag | Method and device for the spatially resolved determination of element concentrations in examination objects |
| US20070279629A1 (en) * | 2004-01-07 | 2007-12-06 | Jacob Grun | Method and apparatus for identifying a substance using a spectral library database |
| US7490009B2 (en) * | 2004-08-03 | 2009-02-10 | Fei Company | Method and system for spectroscopic data analysis |
| KR101063106B1 (en) * | 2004-11-08 | 2011-09-07 | 에스아이아이 나노 테크놀로지 가부시키가이샤 | Fluorescence X-ray Analyzer |
| US7382853B2 (en) * | 2004-11-24 | 2008-06-03 | General Electric Company | Method and system of CT data correction |
| GB0512945D0 (en) * | 2005-06-24 | 2005-08-03 | Oxford Instr Analytical Ltd | Method and apparatus for material identification |
-
2009
- 2009-02-06 WO PCT/US2009/033493 patent/WO2009100404A2/en not_active Ceased
- 2009-02-06 AU AU2009212187A patent/AU2009212187B2/en active Active
- 2009-02-06 BR BRPI0907766-9A patent/BRPI0907766A2/en not_active Application Discontinuation
- 2009-02-06 CN CN200980112490.1A patent/CN102084229B/en active Active
- 2009-02-06 CN CN201310203778.8A patent/CN103776855B/en active Active
- 2009-02-06 EP EP12166979.0A patent/EP2538185A3/en not_active Withdrawn
- 2009-02-06 US US12/866,697 patent/US8880356B2/en active Active
- 2009-02-06 EP EP09707645A patent/EP2250474A4/en not_active Withdrawn
- 2009-02-06 RU RU2010135871/28A patent/RU2518230C2/en active
- 2009-02-06 CA CA2713984A patent/CA2713984C/en active Active
-
2010
- 2010-08-02 ZA ZA2010/05582A patent/ZA201005582B/en unknown
Non-Patent Citations (1)
| Title |
|---|
| None * |
Also Published As
| Publication number | Publication date |
|---|---|
| AU2009212187B2 (en) | 2014-05-01 |
| US8880356B2 (en) | 2014-11-04 |
| WO2009100404A3 (en) | 2009-10-15 |
| CA2713984A1 (en) | 2009-08-13 |
| BRPI0907766A2 (en) | 2015-07-14 |
| RU2010135871A (en) | 2012-03-20 |
| EP2538185A3 (en) | 2013-10-30 |
| WO2009100404A9 (en) | 2009-12-03 |
| AU2009212187A1 (en) | 2009-08-13 |
| ZA201005582B (en) | 2012-01-25 |
| CN102084229B (en) | 2014-10-15 |
| CN103776855A (en) | 2014-05-07 |
| CA2713984C (en) | 2016-06-07 |
| EP2250474A2 (en) | 2010-11-17 |
| CN102084229A (en) | 2011-06-01 |
| EP2250474A4 (en) | 2011-11-02 |
| US20110144922A1 (en) | 2011-06-16 |
| WO2009100404A2 (en) | 2009-08-13 |
| RU2518230C2 (en) | 2014-06-10 |
| CN103776855B (en) | 2017-05-31 |
Similar Documents
| Publication | Publication Date | Title |
|---|---|---|
| US8880356B2 (en) | Method and system for spectrum data analysis | |
| AU2013335211B2 (en) | Automated mineral classification | |
| US9734986B2 (en) | Mineral identification using sequential decomposition into elements from mineral definitions | |
| US8937282B2 (en) | Mineral identification using mineral definitions including variability | |
| JP7635493B2 (en) | Method and system for acquiring electron backscatter diffraction patterns - Patents.com | |
| US8748816B2 (en) | Clustering of multi-modal data | |
| EP2880428B1 (en) | Automated eds standards calibration | |
| US9091635B2 (en) | Mineral identification using mineral definitions having compositional ranges | |
| AU2016201122B2 (en) | Sample-specific reference spectra library | |
| EP2690432B1 (en) | X-ray spectroscopic technique using merged spectral data | |
| US9245711B2 (en) | Charged particle beam apparatus and image forming method | |
| EP3062096B1 (en) | Sample-specific reference spectra library | |
| EP3217420A1 (en) | Method, analysis system and computer program product for semi-automated x-ray elemental analysis using a particle microscope | |
| US11784034B2 (en) | Method and device for analysing SIMS mass spectrum data | |
| Shen et al. | Back-to-basics tutorial: Secondary ion mass spectrometry (SIMS) in ceramics | |
| Trigueiro et al. | XPS spectrometer transmission function optimization by the differential evolution algorithm | |
| EP3073253A1 (en) | Sample-specific reference spectra library | |
| Fultz et al. | Inelastic electron scattering and spectroscopy |
Legal Events
| Date | Code | Title | Description |
|---|---|---|---|
| PUAI | Public reference made under article 153(3) epc to a published international application that has entered the european phase |
Free format text: ORIGINAL CODE: 0009012 |
|
| AC | Divisional application: reference to earlier application |
Ref document number: 2250474 Country of ref document: EP Kind code of ref document: P |
|
| AK | Designated contracting states |
Kind code of ref document: A2 Designated state(s): AT BE BG CH CY CZ DE DK EE ES FI FR GB GR HR HU IE IS IT LI LT LU LV MC MK MT NL NO PL PT RO SE SI SK TR |
|
| RIN1 | Information on inventor provided before grant (corrected) |
Inventor name: GOTTLIEB, PAUL Inventor name: OWEN, MICHAEL Inventor name: MENZIES, ANDREW Inventor name: CORBETT, DANIEL |
|
| PUAL | Search report despatched |
Free format text: ORIGINAL CODE: 0009013 |
|
| AK | Designated contracting states |
Kind code of ref document: A3 Designated state(s): AT BE BG CH CY CZ DE DK EE ES FI FR GB GR HR HU IE IS IT LI LT LU LV MC MK MT NL NO PL PT RO SE SI SK TR |
|
| RIC1 | Information provided on ipc code assigned before grant |
Ipc: G01J 3/30 20060101ALI20130923BHEP Ipc: G01N 23/207 20060101ALN20130923BHEP Ipc: G01J 3/46 20060101ALI20130923BHEP Ipc: G01N 23/223 20060101ALI20130923BHEP Ipc: G01J 3/28 20060101AFI20130923BHEP |
|
| 17P | Request for examination filed |
Effective date: 20140409 |
|
| RBV | Designated contracting states (corrected) |
Designated state(s): AT BE BG CH CY CZ DE DK EE ES FI FR GB GR HR HU IE IS IT LI LT LU LV MC MK MT NL NO PL PT RO SE SI SK TR |
|
| 17Q | First examination report despatched |
Effective date: 20170421 |
|
| STAA | Information on the status of an ep patent application or granted ep patent |
Free format text: STATUS: THE APPLICATION IS DEEMED TO BE WITHDRAWN |
|
| 18D | Application deemed to be withdrawn |
Effective date: 20171103 |