EP2507620B1 - Lecteur optique d'essai à billes - Google Patents
Lecteur optique d'essai à billes Download PDFInfo
- Publication number
- EP2507620B1 EP2507620B1 EP10795779.7A EP10795779A EP2507620B1 EP 2507620 B1 EP2507620 B1 EP 2507620B1 EP 10795779 A EP10795779 A EP 10795779A EP 2507620 B1 EP2507620 B1 EP 2507620B1
- Authority
- EP
- European Patent Office
- Prior art keywords
- beads
- light
- detection area
- analyte
- detector
- Prior art date
- Legal status (The legal status is an assumption and is not a legal conclusion. Google has not performed a legal analysis and makes no representation as to the accuracy of the status listed.)
- Not-in-force
Links
- 239000011324 bead Substances 0.000 title claims description 398
- 238000003556 assay Methods 0.000 title description 31
- 230000003287 optical effect Effects 0.000 title description 13
- 238000001514 detection method Methods 0.000 claims description 206
- 239000012491 analyte Substances 0.000 claims description 127
- 238000000034 method Methods 0.000 claims description 74
- 238000005259 measurement Methods 0.000 claims description 20
- 230000003993 interaction Effects 0.000 claims description 15
- 239000000126 substance Substances 0.000 claims description 8
- 230000005284 excitation Effects 0.000 claims description 6
- 238000010521 absorption reaction Methods 0.000 claims description 4
- 230000000903 blocking effect Effects 0.000 claims description 2
- 238000001228 spectrum Methods 0.000 claims description 2
- 239000012530 fluid Substances 0.000 description 34
- 238000002474 experimental method Methods 0.000 description 27
- 230000008901 benefit Effects 0.000 description 17
- 239000000463 material Substances 0.000 description 15
- 230000003068 static effect Effects 0.000 description 14
- 239000000975 dye Substances 0.000 description 12
- 102000004190 Enzymes Human genes 0.000 description 9
- 108090000790 Enzymes Proteins 0.000 description 9
- XLYOFNOQVPJJNP-UHFFFAOYSA-N water Substances O XLYOFNOQVPJJNP-UHFFFAOYSA-N 0.000 description 9
- 230000006870 function Effects 0.000 description 8
- 230000000284 resting effect Effects 0.000 description 8
- 238000012360 testing method Methods 0.000 description 8
- 239000012141 concentrate Substances 0.000 description 7
- 239000003446 ligand Substances 0.000 description 7
- 238000009826 distribution Methods 0.000 description 6
- 239000000203 mixture Substances 0.000 description 6
- 238000012546 transfer Methods 0.000 description 6
- 238000003384 imaging method Methods 0.000 description 5
- 239000007788 liquid Substances 0.000 description 5
- 230000033001 locomotion Effects 0.000 description 5
- 238000002965 ELISA Methods 0.000 description 4
- 230000001133 acceleration Effects 0.000 description 4
- 230000000875 corresponding effect Effects 0.000 description 4
- 238000003745 diagnosis Methods 0.000 description 4
- 230000005484 gravity Effects 0.000 description 4
- 239000002245 particle Substances 0.000 description 4
- 238000005406 washing Methods 0.000 description 4
- XEEYBQQBJWHFJM-UHFFFAOYSA-N Iron Chemical compound [Fe] XEEYBQQBJWHFJM-UHFFFAOYSA-N 0.000 description 3
- 239000000872 buffer Substances 0.000 description 3
- 150000001875 compounds Chemical class 0.000 description 3
- 239000007850 fluorescent dye Substances 0.000 description 3
- 238000005286 illumination Methods 0.000 description 3
- 239000004005 microsphere Substances 0.000 description 3
- 229910052761 rare earth metal Inorganic materials 0.000 description 3
- 150000002910 rare earth metals Chemical class 0.000 description 3
- 230000004044 response Effects 0.000 description 3
- 239000008280 blood Substances 0.000 description 2
- 210000004369 blood Anatomy 0.000 description 2
- 238000004364 calculation method Methods 0.000 description 2
- 238000006243 chemical reaction Methods 0.000 description 2
- 239000011248 coating agent Substances 0.000 description 2
- 238000000576 coating method Methods 0.000 description 2
- 201000010099 disease Diseases 0.000 description 2
- 208000037265 diseases, disorders, signs and symptoms Diseases 0.000 description 2
- 238000011534 incubation Methods 0.000 description 2
- 239000004615 ingredient Substances 0.000 description 2
- 238000002156 mixing Methods 0.000 description 2
- 238000012986 modification Methods 0.000 description 2
- 230000004048 modification Effects 0.000 description 2
- 230000035699 permeability Effects 0.000 description 2
- 230000010287 polarization Effects 0.000 description 2
- 238000012545 processing Methods 0.000 description 2
- 238000011160 research Methods 0.000 description 2
- 239000002356 single layer Substances 0.000 description 2
- 230000005374 Kerr effect Effects 0.000 description 1
- 230000002159 abnormal effect Effects 0.000 description 1
- 230000009471 action Effects 0.000 description 1
- XAGFODPZIPBFFR-UHFFFAOYSA-N aluminium Chemical compound [Al] XAGFODPZIPBFFR-UHFFFAOYSA-N 0.000 description 1
- 229910052782 aluminium Inorganic materials 0.000 description 1
- 238000004458 analytical method Methods 0.000 description 1
- 230000033115 angiogenesis Effects 0.000 description 1
- 238000003491 array Methods 0.000 description 1
- 238000003149 assay kit Methods 0.000 description 1
- 238000004166 bioassay Methods 0.000 description 1
- 238000010256 biochemical assay Methods 0.000 description 1
- 238000005842 biochemical reaction Methods 0.000 description 1
- 239000012620 biological material Substances 0.000 description 1
- 239000000090 biomarker Substances 0.000 description 1
- 239000007853 buffer solution Substances 0.000 description 1
- 238000011088 calibration curve Methods 0.000 description 1
- 239000003054 catalyst Substances 0.000 description 1
- 230000008859 change Effects 0.000 description 1
- 239000003153 chemical reaction reagent Substances 0.000 description 1
- 238000003271 compound fluorescence assay Methods 0.000 description 1
- 238000010276 construction Methods 0.000 description 1
- 230000001276 controlling effect Effects 0.000 description 1
- 230000002596 correlated effect Effects 0.000 description 1
- 238000006073 displacement reaction Methods 0.000 description 1
- 230000000694 effects Effects 0.000 description 1
- 239000003792 electrolyte Substances 0.000 description 1
- 238000005516 engineering process Methods 0.000 description 1
- 230000002255 enzymatic effect Effects 0.000 description 1
- 230000014509 gene expression Effects 0.000 description 1
- 238000010348 incorporation Methods 0.000 description 1
- 230000010354 integration Effects 0.000 description 1
- 229910052742 iron Inorganic materials 0.000 description 1
- 239000010410 layer Substances 0.000 description 1
- 239000004973 liquid crystal related substance Substances 0.000 description 1
- 238000004020 luminiscence type Methods 0.000 description 1
- 239000000696 magnetic material Substances 0.000 description 1
- 238000004519 manufacturing process Methods 0.000 description 1
- 239000003550 marker Substances 0.000 description 1
- 230000007246 mechanism Effects 0.000 description 1
- 230000005499 meniscus Effects 0.000 description 1
- 229910001172 neodymium magnet Inorganic materials 0.000 description 1
- 238000012856 packing Methods 0.000 description 1
- 230000000144 pharmacologic effect Effects 0.000 description 1
- 238000003825 pressing Methods 0.000 description 1
- 230000008569 process Effects 0.000 description 1
- 230000001105 regulatory effect Effects 0.000 description 1
- 238000012552 review Methods 0.000 description 1
- 229910000938 samarium–cobalt magnet Inorganic materials 0.000 description 1
- 238000009738 saturating Methods 0.000 description 1
- 210000002966 serum Anatomy 0.000 description 1
- 238000003860 storage Methods 0.000 description 1
- 239000000758 substrate Substances 0.000 description 1
- 239000000725 suspension Substances 0.000 description 1
- 239000002699 waste material Substances 0.000 description 1
Images


Classifications
-
- G—PHYSICS
- G01—MEASURING; TESTING
- G01N—INVESTIGATING OR ANALYSING MATERIALS BY DETERMINING THEIR CHEMICAL OR PHYSICAL PROPERTIES
- G01N21/00—Investigating or analysing materials by the use of optical means, i.e. using sub-millimetre waves, infrared, visible or ultraviolet light
- G01N21/75—Systems in which material is subjected to a chemical reaction, the progress or the result of the reaction being investigated
- G01N21/76—Chemiluminescence; Bioluminescence
-
- G—PHYSICS
- G01—MEASURING; TESTING
- G01N—INVESTIGATING OR ANALYSING MATERIALS BY DETERMINING THEIR CHEMICAL OR PHYSICAL PROPERTIES
- G01N21/00—Investigating or analysing materials by the use of optical means, i.e. using sub-millimetre waves, infrared, visible or ultraviolet light
- G01N21/62—Systems in which the material investigated is excited whereby it emits light or causes a change in wavelength of the incident light
- G01N21/63—Systems in which the material investigated is excited whereby it emits light or causes a change in wavelength of the incident light optically excited
- G01N21/64—Fluorescence; Phosphorescence
- G01N21/6428—Measuring fluorescence of fluorescent products of reactions or of fluorochrome labelled reactive substances, e.g. measuring quenching effects, using measuring "optrodes"
-
- G—PHYSICS
- G01—MEASURING; TESTING
- G01N—INVESTIGATING OR ANALYSING MATERIALS BY DETERMINING THEIR CHEMICAL OR PHYSICAL PROPERTIES
- G01N21/00—Investigating or analysing materials by the use of optical means, i.e. using sub-millimetre waves, infrared, visible or ultraviolet light
- G01N21/62—Systems in which the material investigated is excited whereby it emits light or causes a change in wavelength of the incident light
- G01N21/63—Systems in which the material investigated is excited whereby it emits light or causes a change in wavelength of the incident light optically excited
- G01N21/64—Fluorescence; Phosphorescence
- G01N21/645—Specially adapted constructive features of fluorimeters
- G01N21/6452—Individual samples arranged in a regular 2D-array, e.g. multiwell plates
-
- G—PHYSICS
- G01—MEASURING; TESTING
- G01N—INVESTIGATING OR ANALYSING MATERIALS BY DETERMINING THEIR CHEMICAL OR PHYSICAL PROPERTIES
- G01N21/00—Investigating or analysing materials by the use of optical means, i.e. using sub-millimetre waves, infrared, visible or ultraviolet light
- G01N21/62—Systems in which the material investigated is excited whereby it emits light or causes a change in wavelength of the incident light
- G01N21/63—Systems in which the material investigated is excited whereby it emits light or causes a change in wavelength of the incident light optically excited
- G01N21/64—Fluorescence; Phosphorescence
- G01N21/645—Specially adapted constructive features of fluorimeters
- G01N21/6456—Spatial resolved fluorescence measurements; Imaging
-
- G—PHYSICS
- G01—MEASURING; TESTING
- G01N—INVESTIGATING OR ANALYSING MATERIALS BY DETERMINING THEIR CHEMICAL OR PHYSICAL PROPERTIES
- G01N21/00—Investigating or analysing materials by the use of optical means, i.e. using sub-millimetre waves, infrared, visible or ultraviolet light
- G01N21/75—Systems in which material is subjected to a chemical reaction, the progress or the result of the reaction being investigated
- G01N21/77—Systems in which material is subjected to a chemical reaction, the progress or the result of the reaction being investigated by observing the effect on a chemical indicator
- G01N21/78—Systems in which material is subjected to a chemical reaction, the progress or the result of the reaction being investigated by observing the effect on a chemical indicator producing a change of colour
-
- G—PHYSICS
- G01—MEASURING; TESTING
- G01N—INVESTIGATING OR ANALYSING MATERIALS BY DETERMINING THEIR CHEMICAL OR PHYSICAL PROPERTIES
- G01N35/00—Automatic analysis not limited to methods or materials provided for in any single one of groups G01N1/00 - G01N33/00; Handling materials therefor
- G01N35/0098—Automatic analysis not limited to methods or materials provided for in any single one of groups G01N1/00 - G01N33/00; Handling materials therefor involving analyte bound to insoluble magnetic carrier, e.g. using magnetic separation
-
- G—PHYSICS
- G01—MEASURING; TESTING
- G01N—INVESTIGATING OR ANALYSING MATERIALS BY DETERMINING THEIR CHEMICAL OR PHYSICAL PROPERTIES
- G01N15/00—Investigating characteristics of particles; Investigating permeability, pore-volume, or surface-area of porous materials
- G01N15/06—Investigating concentration of particle suspensions
- G01N15/0606—Investigating concentration of particle suspensions by collecting particles on a support
- G01N15/0612—Optical scan of the deposits
-
- G01N15/1433—
-
- G—PHYSICS
- G01—MEASURING; TESTING
- G01N—INVESTIGATING OR ANALYSING MATERIALS BY DETERMINING THEIR CHEMICAL OR PHYSICAL PROPERTIES
- G01N15/00—Investigating characteristics of particles; Investigating permeability, pore-volume, or surface-area of porous materials
- G01N15/10—Investigating individual particles
- G01N15/14—Electro-optical investigation, e.g. flow cytometers
- G01N2015/1486—Counting the particles
-
- G—PHYSICS
- G01—MEASURING; TESTING
- G01N—INVESTIGATING OR ANALYSING MATERIALS BY DETERMINING THEIR CHEMICAL OR PHYSICAL PROPERTIES
- G01N21/00—Investigating or analysing materials by the use of optical means, i.e. using sub-millimetre waves, infrared, visible or ultraviolet light
- G01N21/62—Systems in which the material investigated is excited whereby it emits light or causes a change in wavelength of the incident light
- G01N21/63—Systems in which the material investigated is excited whereby it emits light or causes a change in wavelength of the incident light optically excited
- G01N21/64—Fluorescence; Phosphorescence
- G01N2021/6417—Spectrofluorimetric devices
- G01N2021/6419—Excitation at two or more wavelengths
-
- G—PHYSICS
- G01—MEASURING; TESTING
- G01N—INVESTIGATING OR ANALYSING MATERIALS BY DETERMINING THEIR CHEMICAL OR PHYSICAL PROPERTIES
- G01N21/00—Investigating or analysing materials by the use of optical means, i.e. using sub-millimetre waves, infrared, visible or ultraviolet light
- G01N21/62—Systems in which the material investigated is excited whereby it emits light or causes a change in wavelength of the incident light
- G01N21/63—Systems in which the material investigated is excited whereby it emits light or causes a change in wavelength of the incident light optically excited
- G01N21/64—Fluorescence; Phosphorescence
- G01N2021/6417—Spectrofluorimetric devices
- G01N2021/6421—Measuring at two or more wavelengths
-
- G—PHYSICS
- G01—MEASURING; TESTING
- G01N—INVESTIGATING OR ANALYSING MATERIALS BY DETERMINING THEIR CHEMICAL OR PHYSICAL PROPERTIES
- G01N35/00—Automatic analysis not limited to methods or materials provided for in any single one of groups G01N1/00 - G01N33/00; Handling materials therefor
- G01N35/10—Devices for transferring samples or any liquids to, in, or from, the analysis apparatus, e.g. suction devices, injection devices
- G01N2035/1027—General features of the devices
- G01N2035/1034—Transferring microquantities of liquid
- G01N2035/1046—Levitated, suspended drops
-
- Y—GENERAL TAGGING OF NEW TECHNOLOGICAL DEVELOPMENTS; GENERAL TAGGING OF CROSS-SECTIONAL TECHNOLOGIES SPANNING OVER SEVERAL SECTIONS OF THE IPC; TECHNICAL SUBJECTS COVERED BY FORMER USPC CROSS-REFERENCE ART COLLECTIONS [XRACs] AND DIGESTS
- Y10—TECHNICAL SUBJECTS COVERED BY FORMER USPC
- Y10T—TECHNICAL SUBJECTS COVERED BY FORMER US CLASSIFICATION
- Y10T436/00—Chemistry: analytical and immunological testing
- Y10T436/25—Chemistry: analytical and immunological testing including sample preparation
Definitions
- the present invention which is defined in the appended claims, in some embodiments thereof, relates to a system and method for assaying an analyte in a fluid using beads, and, more particularly, but not exclusively, to a biochemical, biological or biomedical assay where the analyte adheres to the beads and is measured by fluorescence.
- US published patent application 2007/0281311, to Roth et al describes a system for measuring emission from microspheres or beads coupled to fluorescent dyes or tags, where the fluorescent dyes or tags indicate or are approximately proportional to a biological reaction.
- the beads are magnetic, and are immobilized by a magnet in an imaging volume, while they are being imaged by a CCD, many beads at a time.
- the system is compared to a prior art system using a flow cytometer, in which fluorescent particles are detected serially, one at a time, which is said to be described in US patent 5,981,180 to Chandler et al.
- EP-1 729 113 A1 relates to an apparatus and a method for reading fluorescence from bead arrays.
- the position of individual beads is automatically obtained and accurate fluorescence quantity is measured based on the obtained information in a bead chip array for which no array form information exists or whose array form information cannot be obtained in advance.
- bead reflected light is detected at the same time, so as to recognize the bead position.
- the reflected light from a bead can be detected in a similar manner for all beads, regardless of the presence or absence of a fluorescent substance. If the positions of all the beads are detected, accurate detection can be achieved by quantifying only the fluorescence at the detected positions.
- a fluorescent substance is caused to emit fluorescence using a light source having the absorption wavelength of the fluorescent substance.
- the fluorescence wavelength alone is detected by a first detector using a wavelength selection filter. Wavelengths other than the fluorescence wavelength are detected by a second detector, thereby obtaining the reflected light.
- Data on the thus obtained reflected light is processed into an image for obtaining the profile of the bead, the position of the bead is recognized by detecting the center position based on the profile, and the fluorescence is quantified based on the position of the bead.
- US 2008/0246968 A1 relates to systems and methods to analyze multiplexed bead-based assays using backscattered light. More particularly, it relates to relates to a system and method related to an epifluorescence microscope based optical system equipped with a tunable filter to localize microspheres in bead-based assays based on a back-scattered light (also known as reflected light) image.
- a back-scattered light also known as reflected light
- a common optical path for reflected and emitted luminescence in conjunction with a tunable filter negates the requirement of an additional sensor employed in existing technologies for localizing microspheres based on light scatter measurements.
- the invention provides a method according to claim 1 and a system according to claim 13.
- An aspect of some embodiments of the invention concerns a bead-based assay of an analyte, in which the beads are concentrated in a detection area using magnetic fields and vibration, and/or the number of beads in the detection area is measured optically, separately from measuring the concentration of analyte adhering to the beads.
- determining the normalized quantity of analyte comprises:
- measuring the second light comprises measuring an integrated intensity of the second light from the detection area, and determining the normalized quantity of analyte comprises using the integrated intensity of the second light.
- estimating the quantity of beads comprises estimating using only an integrated intensity of the second light from the detection area, or using only the integrated intensity of the second light from the detection area and one or more calibration parameters.
- estimating the quantity of beads comprises estimating a quantity proportional to the integrated intensity of the second light from the detection area.
- the interaction comprises reflection of the light from the beads.
- the interaction comprises refraction of the light through the beads.
- the interaction comprises exciting fluorescent emission from the beads with the light.
- the complex is caused to emit the first light at a different range of wavelengths than the second light.
- the complex is caused to emit the first light fluorescently with different time dependence than the second light, by illuminating the beads with excitation light with a spectrum that varies with time.
- the interaction comprises blocking or absorption of the light by the beads, and reflecting from or passing through areas between the beads, by the light.
- the complex is caused to emit the first light, and the beads are located in same places when measuring the first light and the second light.
- the beads are magnetic
- the method also comprises concentrating the beads in the detection area by vibrating the cell while attracting the beads to the detection area using a magnetic field.
- the first detector is a single, i.e. non-array detector.
- a method of concentrating magnetic beads, used for assaying an analyte, in a detection area of a cell comprising vibrating the cell while attracting the beads to the detection area using a magnetic field.
- vibrating the cell comprises vibrating with a predominant frequency between 30 and 200 Hz.
- the predominant frequency is between 60 and 100 Hz.
- vibrating the cell comprises vibrating with a peak to peak amplitude of at least 0.5 mm.
- the peak to peak amplitude is at least 1 mm.
- vibrating the cell comprises vibrating so that, for horizontal components, vertical components or both, for at least most of the beads, the mass of the bead times maximum acceleration of the bead would be between 0.3 and 10 times the magnetic force on the bead, if the bead were located at the edge of the detection area.
- a system for assaying an analyte adhering to beads comprising:
- system also comprises:
- the vibrator is capable of vibrating the detection cell so that, for at least some of the beads, the mass of the bead, times the maximum acceleration of the detection cell, is greater than the static frictional force between the bead and the resting surface when the magnet is attracting the bead, at least for some part of the resting surface outside the detection area.
- Implementation of the method and/or system of embodiments of the invention can involve performing or completing selected tasks manually, automatically, or a combination thereof. Moreover, according to actual instrumentation and equipment of embodiments of the method and/or system of the invention, several selected tasks could be implemented by hardware, by software or by firmware or by a combination thereof using an operating system.
- a data processor such as a computing platform for executing a plurality of instructions.
- the data processor includes a volatile memory for storing instructions and/or data and/or a non-volatile storage, for example, a magnetic hard-disk and/or removable media, for storing instructions and/or data.
- a network connection is provided as well.
- a display and/or a user input device such as a keyboard or mouse are optionally provided as well.
- the present invention which is defined by the appended claims, in some embodiments thereof, relates to a system and method for assaying an analyte in a fluid using beads, and, more particularly, but not exclusively, to a biochemical or biological assay where the analyte adheres to the beads and is measured by an assay using fluorescence or chemiluminescence, or by an enzyme-linked assay.
- an assay can be used in biomedical research, as well as for clinical use.
- the assay may show the presence or concentration of a known analyte in the fluid sample, for example a biological marker in a blood sample, based on a known tendency of the analyte to bind to a particular ligand. Additionally or alternatively, the assay may show the presence or concentration of any analyte, even a previously unknown analyte, that binds to a particular ligand, for example in order to discover the target of an antibody.
- a known analyte in the fluid sample for example a biological marker in a blood sample
- the assay may show the presence or concentration of any analyte, even a previously unknown analyte, that binds to a particular ligand, for example in order to discover the target of an antibody.
- the results of the assay do not directly provide a diagnosis of a disease or other abnormal medical condition.
- the results of the assay may be used as evidence in making a diagnosis, for example as one of a plurality of factors used in making the diagnosis.
- the assay is a diagnostic assay, which directly provides a diagnostic result, for example finding the presence or concentration of a marker for a disease.
- An aspect of some embodiments of the invention concerns a system and method for performing an assay of an analyte in a fluid, using beads to which the analyte adheres, in which the quantity of analyte adhering to the beads is measured by exciting fluorescent or chemiluminescent emission from a complex of the analyte and measuring the integrated intensity of the emission from all the beads in a detection area, and a separate optical measurement is made of the number of beads present, in order to normalize the quantity of analyte.
- the quantity of analyte adhering to the beads is measured by catalyzing a complex of the analyte to release a dye or a chemiluminescent material into a liquid surrounding the beads, for example using an appropriate enzyme, and optically measuring a concentration of the dye or chemiluminescent material in the liquid.
- a complex of the analyte to release a dye or a chemiluminescent material into a liquid surrounding the beads
- an appropriate enzyme for example, the SuperSignal Chemiluminescent Substrate sold by Pierce uses HRP enzyme to catalyze the excitation of a chemiluminescent material when an analyte binds to a ligand attached to a bead.
- fluorescent emission from a complex of the analyte or “from the analyte complex” and “exciting the analyte complex to fluorescently emit,” include both fluorescent emission from the analyte molecule itself, and the more usual case of fluorescent emission from a fluorescent tag molecule attached directly or indirectly to the analyte molecule.
- Such a system has a potential advantage over prior art systems in which only one bead at a time is measured, since it does not require the complicated fluidics needed to pass only one bead at a time past the detector. It also has a potential advantage over prior art systems in which the fluorescent emission from the analyte complex is imaged using an array detector, and image processing software is used to count the beads, since such array detectors, in order to measure the low emission power of individual beads, generally have to be very expensive cooled array detectors. Instead, the integrated fluorescent emission from the analyte complex in all the beads in the detection area can be measured by a single detector, which can optionally be relatively insensitive and inexpensive. Alternatively, the single detector is a relatively expensive and sensitive detector, which has the potential advantage that it may make more precise measurements of the emission power than an array detector would, because it measures the integrated emission from many beads, and signal to noise ratio is not critical.
- the separate optical measurement of the number of beads present, used for normalizing the quantity of analyte may also be made by a single inexpensive detector measuring integrated light reflected, refracted, emitted, silhouetted by, or otherwise interacting with all the beads in the detection area.
- "interacting with a bead” includes interacting with a molecule directly or indirectly attached to the bead, such as a fluorescent tag not associated with the analyte.
- the number of beads present may be measured by using an array detector and imaging software for counting the beads, but the array detector need not be an especially sensitive and expensive one, since the light used to measure the number of beads can be brighter than the fluorescent light emitted by the analyte adhering to the beads.
- An aspect of some examples concerns a system and method for performing an assay of an analyte in a fluid, using magnetic beads to which the analyte adheres, in which the beads are concentrated in a detection area using a combination of vibrations and a magnetic field.
- a gradient in the magnetic field attracts the beads to a detection area on the surface on which they are located, while the vibrations overcome static friction between the beads and the surface, allowing them to move in response to the magnetic force.
- Concentrating the beads in the detection area has the potential advantage that the number of beads in the detection area will not vary very much, so the number of beads can be estimated more accurately, than if the beads are not as concentrated. This is particularly true if the beads are packed into a layer at close to their maximum possible single-layer density, with hexagonal packing, over much of the detection area. But even if the beads are not packed at close to their maximum possible density, the percentage variation in the number of randomly distributed beads over the detection area may be lower, for example in proportion to the square root of the number of beads, if there are more beads present.
- Having a greater number of beads in the detection area also improves the signal to noise ratio for measuring the quantity of analyte adhering to the beads, which is generally done by exciting fluorescent emission from the analyte complex and measuring its intensity.
- the power emitted per bead is generally rather low, so it is advantageous to have the beads packed densely in the detection area. This is especially true if the integrated fluorescent emission over the detection area is measured, for example by a single detector.
- the integrated fluorescent emission from the analyte complex, over the detection area is measured, and a separate optical measurement is made of the number of beads, in order to normalize the quantity of analyte measured by the fluorescent emission, as described above.
- FIG. 1 illustrates a system 100 for assaying an analyte in a sample of fluid, for example for assaying a bio-molecule in a sample of blood or serum.
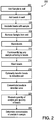
- a method of using system 100 will be described with reference to a flowchart 200 in FIG. 2 .
- System 100 is designed to assay a large number of samples automatically or semiautomatically, but the methods described can also be used manually for one sample at a time.
- samples to be analyzed are added to different wells in a well plate 106.
- a fluidics sub-system 102 draws beads, suspended in a fluid in a reservoir 104, and transfers them to the wells in well plate 106 that have samples in them. Alternatively, the beads are placed in the wells before the samples.
- the fluidics sub-system optionally uses vacuum and fluidics or micro-fluidics components, such as pumps, valves and tubes, to move the suspension of beads, and other fluids, between different reservoirs and the well plate.
- a distribution arm 108 simultaneously transfers the beads to multiple wells, for example all of the wells in one row of the well plate, and then optionally the distribution arm moves, and/or the well plate moves, and this action is repeated for another group of wells, for example the next row, until beads have been deposited in all the wells for which a sample is to be assayed.
- the same procedure may be used for transferring other fluids such as a buffer solution in a reservoir 110, and water in a reservoir 112, to and from the wells, as will be described below.
- the beads are incubated with the sample, so that molecules of the analyte adhere to a ligand on the surface of the beads.
- the ligand may comprise antibodies, coating the surface of the bead, that recognize and capture molecules of the analyte.
- the well plate is vibrated, by one or more vibrators coupled to a well plate base 114, which may mix the beads and the sample more effectively, and shorten the time needed for the analyte to adhere to the beads.
- Mixing of the beads and the sample may also be facilitate by repeatedly drawing the mixture out of the well and putting it back, by the fluidics sub-system. These means of facilitating mixing may also be used in any of the steps described below, where the beads are incubated with another material.
- the sample and other fluids are optionally removed from the well by fluidics sub-system 102, and optionally the beads are washed, for example with water from reservoir 112 or buffer fluid from reservoir 110, at 210.
- base 114 vibrates the well plate during the washing, to facilitate the washing, and this is also optionally done any of the other times when the beads are washed, as described below.
- the beads are magnetic, and magnets attached to base 114 keep the beads in the wells when the sample and other fluids are removed, and when water or buffer fluid is removed after washing the beads.
- the magnets may be arranged to attract the beads to side walls of each well, while the fluid or water is drained from the bottom of the well, or the magnets may attract the beads to the bottom of each well while the fluid or water is suctioned out the top.
- there is a filter in place which fluid can pass through but beads cannot pass through, on a line through which fluid is removed from the well by suction or by gravity.
- This filter is located, for example, at the bottom of the well, and the beads remain there when fluid or water is removed from the well, but the line closed, for example by a valve, when fluid or water is not being removed. These procedures are also optionally done any of the other times when the beads are washed.
- the removed fluid or water is optionally transferred by fluidics sub-system 102 to a waste disposal location 116.
- analyte adhering to the beads is optionally fluorescently tagged. This step may be omitted if the analyte itself is already fluorescent.
- a chemiluminescent tag is used instead of a fluorescent tag, and it should be understood that, in many contexts, when fluorescent emission is mentioned herein, chemiluminescent emission may be used instead.
- the analyte may be tagged by a dye molecule, which is used in an enzyme-linked assay, as will be explained below.
- fluorescent tagging of the analyte involves the following steps. First, detection antibodies, stored in reservoir 118, are added to the wells with the beads by fluidics sub-system 102, optionally together with buffer from reservoir 110.
- the detection antibodies which may be similar to the capturing antibodies coated on the surface of the beads, attach to the analyte which is adhering to the beads.
- the beads and detection antibodies are incubated together. The fluid containing the detection antibodies is then optionally removed, and the beads are optionally washed.
- the detection antibodies may differ from the capturing antibodies coating the beads, in that they are modified to attach to molecules of a fluorescent tag.
- the detection antibodies may be biotinylated.
- a fluorescent tag material from a reservoir 120 is added to the well by fluidics sub-system 102.
- a suitable fluorescent tag material for example, is streptavidin-PE, which bonds to biotinylated antibodies.
- Other fluorescent tag materials, and other ways to modify the antibodies are also possible.
- the fluorescent tag material is incubated with the beads, the fluid is removed, and the beads are optionally washed at 214.
- the beads are optionally transferred, while suspended in fluid, by fluidics sub-system 102, from well plate 106 to a detection station 122.
- the beads are suspended in small droplets of fluid, which are then manipulated, for example electrostatically, to transfer the beads, instead of using a conventional fluidics system. Additionally or alternatively, this technique of manipulating droplets can be used to move the beads around to position them in a detection area, within detection station 122, or within well plate 106.
- detection station 122 the analyte is detected by fluorescent emission from the fluorescent tag, or optionally from the analyte itself if it is fluorescent. As noted above, both these cases are referred to herein as fluorescent emission from the analyte complex.
- detection station 122 has a plurality of detection cells, and beads from different wells in well plate 106 are transferred to different cells in detection station 122, using a distribution arm 124 to deposit the beads in the detection cells.
- the beads from one row of wells in well plate 106 are transferred to corresponding cells in detection station 122.
- transfer from a plurality of wells to a plurality of corresponding cells is done simultaneously. Alternatively, the transfer is done serially, and, for example, detection station 122 moves relative to distribution arm 124 when preparing to transfer beads to a different cell.
- Detection station 122 includes an optics and detector sub-system 126 which detects fluorescent emission from the analyte complex, in each detection cell.
- there is a single detector set with associated optics which moves from cell to cell, if the detection station has more than one cell.
- there is more than one detector set with associated optics, or one detector set for each detection cell, and measurements in different detection cells may be made simultaneously. Using multiple detector sets simultaneously may increase the cost of detectors and optics, and the complexity of controlling them, but may speed up the measurement for a large number of samples.
- detector station 122 also has associated vibrators and/or magnets, whose function will be described below.
- the beads are not transferred to a separate detection station, but well plate 106 also functions as a detection station, and each well functions as a detector cell.
- well-plate 106 is used as a detection station, then optionally the vibrators and magnets associated with base 114 are also used in the detection process, as will be described below.
- the magnets are optionally moved relative to the wells, between the incubation procedures and the detection procedure, since the magnets may be used to attract the beads to the sides of the well when fluid is changed during the incubation and washing procedures described above, while the magnets may be used to attract the beads to a detection area in the center of the well, during the detection procedure as will be described below.
- beads are optionally concentrated in a detection area of each detection cell that has beads in it.
- the optics and detector sub-system measures fluorescent emission from the analyte complex adhering to the beads in the detection area of each detection cell, to determine a quantity of analyte.
- the optics and detector sub-system also makes a separate optical measurement of the quantity of beads in each detection area, in order to normalize the quantity of analyte to the number of beads. This normalized quantity of analyte is used in 222 to determine a concentration of analyte in the sample that was being tested, for each detection cell.
- a catalyst for example an enzyme
- a concentration of the dye in the detection cell is then measured by one or more optical detectors, for example by passing light of different wavelengths through the fluid, and comparing how much light is absorbed at different wavelengths.
- a chemiluminescent molecule is used instead of or in addition to a dye molecule, and its concentration in the fluid is measured by measuring the emitted light.
- ELISA enzyme-linked immunoassay
- the calculation made by controller 128 is calibrated by first performing tests using different known concentrations of analyte in the sample, and observing the signals from the detectors in each case. For example, tests are optionally performed for 5 to 8 different concentrations of the analyte, covering a range of 3 to 4 orders of magnitude, and tests at a given concentration are optionally repeated one or more times and averaged, to reduce errors. The test results are optionally fitted to a model, for example a model with 5 parameters, to obtain a calibration curve relating the concentration of analyte in the sample to the quantity of analyte measured on the beads, normalized to the number of beads.
- Controller 128, or one or more different controllers is also optionally used to control one or more of the following: the functions of fluidics sub-system 102, the motion of distribution arms 108 and 124, operation of the vibrators associated with well plate 106 and detector station 122, motion of the magnets if they are moveable, a user interface, and functions of the optics and detector sub-system as described below.
- the user interface optionally allows the user to develop complex protocols for automated tasks that can be performed while the system is left unattended. It also optionally recommends modes of operation to the user; optionally includes an analysis module that analyzes results; optionally graphically shows the user the placement of samples in the plates; and optionally displays the results of measurements in real time, while the measurements are still taking place, as well when they are completed.
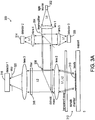
- FIGs. 3A through 3D show different configurations of the optics and detector sub-system, used for measuring fluorescent emission from the analyte complex, and for measuring the total number of beads in the detection area of a detection cell.
- These drawings are not drawn to scale, and angles shown in the drawings may not be accurate, for example mirrors that reflect a light beam by 90 degrees may appear not to be oriented at 45 degrees with respect to the direction of the light beam, although in the actual device they are oriented at 45 degrees.
- FIG. 3A shows an optics and detector configuration 300, with a light source 302 producing a beam of light at a wavelength ⁇ 1 , or a range of wavelengths including ⁇ 1 .
- a light source 302 producing a beam of light at a wavelength ⁇ 1 , or a range of wavelengths including ⁇ 1 .
- the light beam, or another light beam will sometimes be described as behaving in a certain way because of some property of light with wavelength ⁇ 1 , or a different wavelength, but it should be understood in these cases that if the light has a range of wavelengths, these properties also apply to other wavelengths in the range, or to a range of wavelengths including most of the power in the beam.
- Wavelength ⁇ 1 is chosen from wavelengths that excite fluorescent emission from the analyte complex.
- light source 302 produces a relatively narrow range of wavelengths, for example less than 100 nm full width half maximum, or less than 50 nm, or less than 20 nm, so that stray light from light source 302 can be easily filtered out of detectors that are intended to detect other wavelengths, for example fluorescent emission from the beads, as will be described below.
- the light beam from light source 302 is optionally focused by a lens, and reaches a beam-splitter 304, for example a half-silvered mirror.
- a polarizing beam splitter may also be used, although polarization does not generally play a role in the interaction of the light with the beads.
- Part of the light beam is optionally reflected by beam-splitter 304 to a detector 306, which is used to monitor the intensity of light source 302.
- a signal from detector 306 may be used to correct output signals from the other detectors, described below, for variations in the intensity of the light source. Additionally or alternatively, a signal from detector 306 may be used to control the intensity of light source 302, by feedback, keeping it constant. Alternatively, there is no detector 306, and the intensity of light source 302 is optionally monitored and/or controlled by other means, for example internal to light source 302.
- the rest of the light beam passes through beam splitter 304, and reaches dichroic mirror 308, which reflects light of wavelength ⁇ 1 towards beads 310, which are shown located at a bottom surface of a detection cell 312.
- the light is focused on the beads by a lens, and passes through a transparent cover of detection cell 312.
- wavelength ⁇ 1 excites fluorescent emission from the analyte complex, with wavelength ⁇ 2 .
- wavelength ⁇ 2 may be considered shorthand for "a range of wavelengths including wavelength ⁇ 2 ,” and statements about properties of light at this wavelength are intended to apply to all wavelengths in the range, or at least to a range of wavelengths that includes the bulk of the power of fluorescent emission.
- Dichroic mirror 308 reflects the light of wavelength ⁇ 1 , which was reflected from the beads, but passes the light of wavelength ⁇ 2 , which was fluorescently emitted from the beads.
- the passed light of wavelength ⁇ 2 is measured by a detector 316.
- a filter 318 in front of detector 316, which removes stray light of other wavelengths that could not have come from the fluorescent emission from the analyte complex.
- a stop 320 which blocks light that did not come from a detection area of detection cell 312, an area on the bottom surface, for example, of detection cell 312, where the beads are optionally concentrated.
- the stop, the filter, and the lens need not be situated along the path of the emitted light beam in the order shown.
- the other detectors described, which detect light from the detection area may also have stops to limit the light they receive to light coming from the detection area, even if not shown in the drawings, and these stops may be situated before, after or between lenses, filters, or other optical elements along the light path.
- a single stop, situated on a light path before a dichroic mirror, may be used to limit the light from two or more different detectors that receive light travelling on that light path, after the light beam is split by a dichroic mirror.
- Any of the detectors may also use lenses, filters, polarizers, diffusers, and other optical elements, in any order, even if they are not explicitly described, in order to increase the light they receive of a desired range of wavelength and from a desired location, and/or to decrease the light they receive of other wavelengths and from other locations.
- Detector 316 responds to an integrated intensity of the emitted fluorescent light from the analyte complex, from the beads in the detection area, rather than producing a useful image of the beads using the relatively low intensity emitted fluorescent light.
- detector 316 is a single detector, which produces a single output signal corresponding to the total intensity of light reaching it, which depends on an integrated intensity of the light emitted from the analyte complex on the beads in the detection area.
- detector 316 may comprise an array of detector elements, in which the output of each element is added up, using hardware or software, to produce an output signal depending on the integrated intensity of light emitted from the analyte complex on the beads in the detection area. In this case, the individual elements of the array need not be sensitive enough to produce a useful image of the beads using the emitted fluorescent light from the analyte complex.
- chemiluminescence is used instead of or in addition to fluorescence for measuring the quantity of analyte, then the emitted light is not excited by optical excitation of the beads as in the case of fluorescence, and a chemical is added to the detection cell to induce the chemiluminescence of the analyte complex adhering to the beads.
- an enzyme-linked assay method for measuring the quantity of analyte
- an appropriate enzyme is added to the detection cell, to induce the analyte complex adhering to the beads to emit dye molecules into the fluid surrounding the beads
- a detector such as detector 316
- light source 302 is used as the source of light for measuring the concentration of dye molecules
- filters, mirrors, or any other optical elements such as those described above are optionally used to transmit the light of these one or more wavelengths to the detection cell and through the fluid, and then to the detector.
- fluorescent, chemiluminescent, enzymatic, or other methods, for determining the concentration of electrolyte, reflected light from the beads is optionally used for estimating the number of beads.
- the reflected light from the beads of wavelength ⁇ 1 , which reflected from dichroic mirror 308, passes back to beam splitter 304, where some of it is reflected to a detector 314, optionally through a lens and a stop.
- Measurements of the light received by detector 314 are used to estimate the number of beads in the detection area of the detection cell.
- detector 314 produces an output signal which depends on the integrated light reflected from the beads in the detection area.
- detector 314 is an array detector which produces an image of the beads in the detection area. Because the reflected light from the beads may be relatively bright, detector 314 may comprise a relatively inexpensive CCD or CMOS array, such as the array in a digital camera sold for the consumer market. The image produced by detector 314 may then be analyzed by image processing software, to produce a count of the number of beads in the detection area.
- Using image processing in this way has the potential advantage that the measured number of beads is relatively insensitive to changes in the intensity of light source 302, or to stray light that enters detector 314, as long as there is enough light reflected from the beads, and entering detector 314, to form a clear enough image.
- Estimating the number of beads from a single signal depending on the integrated light reflected from the beads in the detection area has the potential advantage that it is not necessary to use more than a single detector element, and it is not necessary to run image processing software.
- FIG. 3B shows an alternative optics and detector configuration 322.
- a dichroic mirror 324 instead of beam splitter 304, there is a dichroic mirror 324.
- Much or all of the light of wavelength ⁇ 1 from light source 302 passes through dichroic mirror 324, but optionally some of the light is reflected to detector 306, which is used to monitor the intensity of light source 302.
- detector 306 which is used to monitor the intensity of light source 302.
- Dichroic mirror 326 replaces dichroic mirror 308 in FIG.
- dichroic mirror 326 reflects light of wavelength ⁇ 1 into detector cell 312, where it illuminates beads 328.
- Beads 328 in addition to emitting fluorescent light at wavelength ⁇ 2 from the analyte complex adhering to them, also emit fluorescent light at a wavelength ⁇ 3 , in response to the light of wavelength ⁇ 1 illuminating them, independent of the analyte adhering to them.
- the light of wavelength ⁇ 3 for example, is emitted from a fluorescent dye coated on all the beads by a chemical or biochemical reaction, or embedded in all the beads, not just those with analyte adhering to them.
- dichroic mirror 326 which passes light of wavelength ⁇ 2 to detector 316, and reflects light of wavelengths ⁇ 1 and ⁇ 3 toward dichroic mirror 324.
- Light of wavelength ⁇ 3 is reflected from dichroic mirror 324, and reaches detector 329.
- a signal from detector 329 is used to estimate the number of beads in the detection area of detection cell 312, since the intensity of the emitted light of wavelength of ⁇ 3 depends on the number of beads, not on the quantity of analyte.
- a signal from detector 316 as in configuration 300 in FIG. 3A , is used to determine the amount of analyte adhering to the beads.
- wavelength ⁇ 1 Light of wavelength ⁇ 1 , reaching dichroic mirror 324 from dichroic mirror 326, largely or completely passes through dichroic mirror 324. Any light of wavelength ⁇ 1 that does reflect from dichroic mirror 324 and reaches detector 329, might not do any harm, since the light of wavelength ⁇ 1 also has an intensity that is proportional to the number of beads in the detection area. But if desired, light of wavelength ⁇ 1 may be filtered out by a filter, not shown, located in front of detector 329.
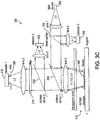
- FIG. 3C shows an optics and detector configuration 330, an alternative to the configurations shown in FIGs. 3A and 3B .
- detector cell 312 in configuration 330 has beads 328 which emit fluorescent light at wavelength ⁇ 3 , regardless of how much analyte is adhering to them, in addition to emitting fluorescent light of wavelength ⁇ 2 , from the analyte complex adhering to them.
- configuration 330 has a beam-splitter 304 and a dichroic mirror 308 which behave like the corresponding beam-splitter and dichroic mirror in configuration 300 in FIG. 3A .
- light of wavelength ⁇ 3 like light of wavelength ⁇ 2 , passes through dichroic mirror 308.
- a second dichroic mirror 332 then separates light of wavelength ⁇ 2 from light of wavelength ⁇ 3 , reflecting one, for example wavelength ⁇ 3 , and sending it to detector 329, while transmitting the other, for example wavelength ⁇ 2 , sending it to detector 316.
- a signal from detector 316 is used to estimate the quantity of analyte present in the detection area
- a signal from detector 329 is used to estimate the number of beads present in the detection area.
- configurations 322 and 330 there are two light sources illuminating the beads, producing different ranges of wavelengths, largely non-overlapping.
- One of the wavelength ranges excites emission of wavelength ⁇ 2 from the analyte complex adhering to the beads, while the other wavelength range excites emission of wavelength ⁇ 3 from a fluorescent material on or in the beads, independent of how much analyte adheres to them. If the two light sources are turned on during different time intervals, with enough time between them so that the fluorescent emission has time to fade, then there is no need to separate light of wavelength ⁇ 2 from light of wavelength ⁇ 3 using dichroic mirrors directing the different wavelengths to different detectors, as in configurations 322 and 330.
- both light of wavelength ⁇ 2 and light of wavelength ⁇ 3 can be detected by a single detector, for example detector 316, and they can be distinguished by their timing, relative to the timing of the two light sources.
- dichroic mirrors and different detectors are used for light of wavelength ⁇ 2 and light of wavelength ⁇ 3 , and the different timing is used to exclude stray light of the wrong fluorescent wavelength reaching each detector.
- the on and off timing pattern of the light sources can also be used to distinguish the fluorescent emission from other stray light, which is not correlated with the light from the light sources. This can be done also in configurations such as configurations 300, 322, and 330, where there is only a single light source, by modulating the light source in a known pattern.
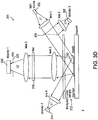
- FIG. 3D shows another configuration 334 of optics and detectors, which does not use dichroic mirrors at all.
- Light source 302 illuminates beads 310 in detection cell 312 directly, with a part of the light from light source 302 optionally monitored by detector 306, as in the other configurations, to monitor its intensity.
- Detector 314 directly views the beads, to measure an intensity of light reflected from them, and/or to form an image of them to count them.
- detector 314 has a filter in front of it, not shown, to block light of wavelength ⁇ 2 emitted from analyte complex adhering to the beads, although this may not be necessary since the light of wavelength ⁇ 1 reflected from the beads is likely to be much brighter than light of wavelength ⁇ 2 emitted from the analyte complex, and if detector 314 forms an image of the beads and they are counted using image processing software, then it will not matter what the intensity of light is.
- Detector 316 has filter 318 in front of it, which may be an interference filter for example, which passes very little light of wavelength ⁇ 1 , but passes much more of wavelength ⁇ 2 , so that the signal produced by detector 316 is dominated by light of wavelength ⁇ 2 , in spite of the relatively low intensity of light of wavelength ⁇ 2 emitted from the beads, compared to reflected light of wavelength ⁇ 1 . It may be particularly advantageous in this case to use a narrow range of wavelengths for light source 302, so that a narrow band notch filter can be used to effectively keep light of wavelength ⁇ 1 out of detector 316, without much reducing the amount of light of wavelength ⁇ 2 that reaches detector 316. As in configuration 300 in FIG. 3A , a signal from detector 316 is used to estimate the quantity of analyte present in the detection area, and a signal from detector 314 is used to estimate the number of beads present in the detection area.
- a signal from detector 316 is used to estimate the quantity of analyte present in the detection area
- detector 316 which is used to measure both light of wavelength ⁇ 1 and light of wavelength ⁇ 2 , by moving filter 318 in and out of the light path in front of detector 316.
- filter 318 is in place in front of detector 316, then light of wavelength ⁇ 1 is largely blocked from entering detector 316, and detector 316 produces an output signal that depends primarily on the intensity of the fluorescent emission of wavelength ⁇ 2 emitted from the analyte.
- detector 316 When filter 318 is moved out of the light path in front of detector 316, then detector 316 will receive mostly light of wavelength ⁇ 1 , which is generally more intense than the light of wavelength ⁇ 2 , and detector 316 will produce an output signal that depends primarily on the intensity of light of wavelength ⁇ 1 reflected from the beads.
- another filter which specifically blocks light of wavelength ⁇ 2 and admits light of wavelength ⁇ 1 , is moved into the light path in front of detector 316, to further reduce the amount of light of wavelength ⁇ 2 received by detector 316 at that time.
- Moving filter 318, and optionally another filter, in and out of the light path in front of detector 316 may be done mechanically, for example by using a filter wheel which rotates.
- changing filters may be done electronically, for example by using interference filters that are activated or de-activated using the Kerr effect, or by using polarization of liquid crystals, or by similar electronic effects.
- Mechanically or electronically switching filters may also be used to switch a single detector from being sensitive to light of wavelength ⁇ 2 to being sensitive to light of wavelength ⁇ 3 and back again, instead of using separate detectors for light of wavelength ⁇ 2 and light of wavelength ⁇ 3 as described above for configurations 322 and 330.
- a multiplexed assay may be performed, in which more than one analyte is assayed simultaneously, by using different fluorescent tags for the different analytes, which emit fluorescence at different wavelengths, and/or which are excited by light of different wavelengths. Different emitted wavelengths may be separated and sent to different detectors by dichroic mirrors. Additionally or alternatively, light emitted by different fluorescent tags may be detected by a same detector and distinguished because they are excited by different excitation light turned on in different time intervals, and/or because the emitted light has different wavelengths, and different filters are switched in and out of the optical path in front of the detector.
- ligands for more than one analyte are attached to the same beads, so that the number of beads, used for normalizing the signals from the different analytes, is the same for each analyte.
- a multiplexed assay is performed using a mixture of different types of beads, which have ligands that bind to different analytes. In this case, the number of beads of each type is optionally measured independently, in order to normalize the signal from each analyte.
- This may be done, for example, by exciting a fluorescent material on or in the beads, independent of the concentration of the analytes, using a different fluorescent emission wavelength, and/or a different excitation wavelength, for each type of bead.
- the numbers of some or all of the types of beads are not measured independently, but the different types of beads are homogeneously mixed together, and it is assumed that the ratio of the different types of beads is constant, so that the number of beads of each type may be estimated by measuring the combined number of beads of different types, or the number of beads of one type.
- light from the beads is detected when the beads are covered with water or another liquid, for example in well plate 106, or in detection cell 122.
- the beads are optionally viewed through a flat transparent plate which has one side immersed in the liquid, and the other side, facing the detectors, is dry. This configuration has the potential advantage of avoiding distortions in the appearance of the beads, as seen from the detector, due to a curved meniscus or waves on the surface of the liquid.
- FIGs. 3A-3D show configurations in which the number of beads is estimated from light reflected from the beads, or fluorescently emitted by the beads. It is also possible to use light refracted from the beads, or silhouetted by the beads, in order to estimate the number of beads.
- FIG. 4A shows a configuration 400, in which a light source 402 illuminates beads 404 resting on a surface 406 in a detection cell. In this configuration, surface 406 is transparent, and light source 402 is located on the other side of the surface from the beads, i.e. beneath the surface. However, light source 402 could also illuminate the beads from above, for example at an oblique angle as in FIG. 3D , in which case surface 406 need not be transparent.
- Beads 404 are transparent, and they act like small lenses, refracting light passing through them. Some light rays 408 refracted from beads 404 reach a detector 410. But light source 402 and detector 410 are arranged so that light from light source 402, which is not refracted by the beads, for example light rays 412 which miss the beads, does not reach detector 410, but is blocked by a stop 414 in front of detector 410, for example.
- the configuration of the light source, the beads, and the detector may also be such that relatively little light reflected from the beads reaches detector 410, because the detector and the light source are almost on opposite sides of the beads. However, in some embodiments of the invention a substantial amount of light reflecting from the beads may also reach detector 410.
- a signal from detector 410 is used to estimate the number of beads, while another detector, similar to detector 316 is FIGs. 3A-3D , is used to estimate the quantity of analyte adhering to the beads.
- the beads are colored, transmitting only some wavelengths.
- a filter in front of detector 410 may then preferentially admit those wavelengths, while rejecting much stray light which comes from the light source without passing through the beads.
- Detector 410 may produce a signal depending on the integrated light from the beads in the detection area, and/or may produce an image which is used to count the beads using image processing software.
- FIG. 4B shows a configuration 416, in which a light source 402 illuminates beads 404, from the other side of a transparent surface 406 on which the beads are located.
- Light source 402 is aimed so that its light reaches detector 410, for light rays, such as light rays 418, which miss beads 404.
- light rays that hit beads 404 are scattered, by reflection from the curved surfaces of the beads, as seen in light rays 420, or by refraction through the curved surfaces of the beads, if the beads are transparent, or by internal scattering if the beads are translucent or opalescent, or by absorption if the beads are dark in color.
- the beads block some of the light from reaching detector 410, and a signal from detector 410, measuring the light reaching it, can be used to estimate how many beads are in the detection area. If detector 410 is an imaging detector, the beads will appear dark on a light background, and can be counted by image processing software.
- light 402 is located on the same side of surface 406 as the beads, i.e. above the surface, and the surface is light in color, or a mirror which reflects the light directly toward detector 410, while the beads are dark. Then the beads will again appear dark on a light background, as seen from detector 410, and a signal from detector 410, either representing an integrated intensity of light reaching the detector from the detection area, or an image of the detection area, can be used to estimate the number of beads in the detection area.
- controller 128, or one of more other controllers performs any of the functions of the optics and detector sub-systems described above, including, but not limited to, running image processing software, switching between using different light sources or different detectors, modulating light sources, and switching between different filters.
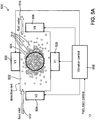
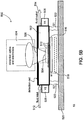
- FIGs. 5A and 5B show a top view and a side view, respectively, of a detection station 500, in which magnets and vibrations are used to concentrate magnetic beads in a detection area, before they are measured.
- the detection station comprises an array of detection cells, as in detection station 122 in FIG. 1 .
- the whole array optionally has one set of vibrators vibrating all of the detection cells together, and each detection cell optionally has its own magnet, drawing the beads towards the detection area of that detection cell.
- FIG. 5A shows a detection area 504, optionally circular and in the center of detection cell 502.
- Vibrators 506, optionally located on each side of the detection cell vibrate the cell, under the control of vibration controller 508.
- the vibrations produce momentary accelerations sufficiently great to overcome static frictional forces between the magnetic beads 510 and a bottom surface of the detection cell on which they rest.
- a magnet 516 not visible in the top view of FIG. 5A because it is located under the detection cell, but visible in the side view of FIG. 5B , produces a non-uniform magnetic field, which attracts the beads toward the detection area.
- the magnet is a circular magnet, centered on the center of the detection area, and not too much shorter in height than its diameter, so that the gradient of the magnetic field has a radially inward pointing component over the whole bottom surface of the detection cell, or at least everywhere outside the detection area.
- the magnetic field gradient of such a magnet will also generally have a vertical component which pulls the magnetic beads vertically against the bottom of the detection cell, generally with a force considerably greater than the force of gravity, for the large magnetic field gradients produced by a rare earth magnet only a few millimeters in diameter.
- This vertical force may make the static frictional force greater than or comparable to the radial magnetic force, for a reasonably large coefficient of static friction, over much of the area of the detection cell, and if there were no vibrations, the beads might not move at all.
- a fluid inlet 512 to the detection cell, and a fluid outlet 514, are shown schematically.
- magnet 516 can move vertically, close to or further away from the detection cell, for example to position 518 in FIG. 5B .
- Both magnet 516, and the vertical distance between magnet 516 and alternative magnet position 518, are not drawn to scale in FIG. 5B , and in fact the magnet is generally taller relative to its diameter, and moves vertically a greater distance relative to its diameter, than shown in FIG. 5B .
- Having the option of moving the magnet further away may make it easier to empty the detection cell after the measurement is made, to allow the cell to be used for a new set of beads, since if the magnet is too close to the bottom surface of the detection cell, it might be difficult to dislodge the beads from the surface.
- detection cell 502 is coupled to a base 520 of the detection station by flexible springs or restraints 522.
- the springs or restraints optionally exert a relatively small force on the detection cell, compared to the inertial forces from the vibration, or exert no force when the detection cell is in its nominal position, but prevent the detection cell from sliding away too far from its nominal position.
- the springs exert significant force compared to the inertial forces of vibration, and the detection cell has a resonant frequency comparable to the frequency of the vibration.
- the resonant system of the detection cell and springs has relatively high Q, and the vibration frequency is close to resonance, so that the amplitude of vibration is increased significantly by this high Q, potentially resulting in more effective concentration of the beads, for a given vibrator.
- Detection optics 524 optionally configured as described in FIGs. 3A-3D or 4A-4B , with associated detectors and other electronics, optionally view the detection area though transparent window 526 in the top of the detection cell, above the detection area.
- the detection station has an array of eight detection cells, made of a piece of aluminum, 9 cm long and 1.5 cm across, with the centers of the cells spaced 9 mm apart.
- the detection area in each cell is a circle 5 mm in diameter, at the center of the cell.
- the magnetic field at the center of the detection area, 1 mm from the top surface of the magnet and along the axis of the magnet, is 2300 gauss. These magnets are sold by TMM Israel.
- the vibrators are two motors taken from MACH3 Gilette razors, which have an off-axis mass on the rotor which causes them to vibrate.
- the two motors are mounted on opposite ends of the length of the array of cells.
- the speed of the motor is controlled by the voltage delivered to the motor, and different speeds were tried to find a speed which optimizes the concentration of beads.
- a rotation rate of 83 Hz which produces vibrations principally at 83 Hz with some higher harmonics, and a peak-to-peak horizontal vibration amplitude of 1.5 mm, was found to produce a good concentration of beads, if allowed to continue for about 30 seconds.
- the entire assembly of detection cells, motors, and magnets was placed on a smooth flat base, and the horizontal motion of the assembly was limited to about 1 mm in every direction by pins protruding from the base, but the assembly was not otherwise constrained.
- the magnetic beads used for these tests were the same as the beads included in the assay kits sold by Bio-Rad, for example kit 170-A4011M, the Bio-Plex® Pro Human Angiogenesis 9-Plex Panel Complete Kit.
- the detection area is optionally about 0.5 mm, 1 mm, 2 mm, 5 mm, or 10 mm in diameter, or a larger, smaller, or intermediate length.
- the magnet diameter is also optionally about 0.5 mm, 1 mm, 2 mm, 5 mm, or 10 mm, or a larger, smaller, or intermediate length.
- the ratio of magnet diameter to magnetic height is optionally about 0.1, 0.2, 0.3, 0.5, 1, 1.5, 2, or 3, or a larger, smaller, or intermediate number.
- the magnet need not have a circular cross-section, or be a cylinder of uniform cross-section, although using a circular magnet with axis aligned with the center of the detection area may have the potential advantage of producing azimuthally uniform radial magnetic forces on the beads.
- the distance of the center of the detection area from the nearest point on the magnet is optionally about 0.2, 0.5, 1, 1.5, 2 or 3 mm, or a greater, smaller, or intermediate distance.
- the magnet is optionally a rare earth magnet, such as NdFeB, or SmCo, which have the potential advantage of producing strong magnetic fields and not demagnetizing easily.
- the peak-to-peak vibration amplitude of the detection cells is optionally about 0.3, 0.5, 1, 2 or 3 mm, or a greater, smaller, or intermediate distance.
- the vibration frequency is optionally about 10, 20, 30, 50, 100, 200, or 300 Hz, or a greater, smaller, or intermediate frequency.
- two or more different vibration frequencies are used, simultaneously or in succession, which may have the potential advantage of better optimizing the concentration of beads than any single vibration frequency.
- the vibrations are optionally applied to the detection cell for about 1 second, 3 seconds, 10 seconds, 30 seconds, 100 seconds, 5 minutes, 10 minutes, or a longer, shorter, or intermediate time.
- the coefficient of static friction between at least some of the beads and the surface of the detection area is optionally about 0.05, 0.1, 0.2, 0.3, 0.5, or a greater, smaller, or intermediate number.
- the ratio of the peak inertial force (mass times acceleration) of the beads from the vibration, and the normal component of the magnetic force pressing the beads against the detection area in the center of the detection area is optionally about 0.05, 0.1, 0.2, 0.3, 0.5, 1, 1.5, 2, 3, 5, 10 or a greater, smaller, or intermediate number.
- the beads are optionally about 2, 5, 10, 20, or 50 micrometers in diameter, or a greater, smaller or intermediate distance, and the diameter of their magnetic core may be about 10%, 20%, 30%, 50%, 70% or 85% of their diameter, or a greater, smaller or number.
- the beads may be spherical, or another shape, and need not all be the same shape or the same size, or have the same coefficient of friction or the same magnetic core size and shape, even approximately. But using spherical beads of approximately uniform size has the potential advantage that their response to magnetic forces, and frictional forces with the detection surface, and their flow behavior, may be independent of their orientation and more predictable than if they are a non-spherical shape or of different shapes and sizes. The same remarks apply to the shape of the magnetic cores of the beads.
- Vibration of the detection cell may be vertical, horizontal, or a combination of both.
- the vibrations may be linear in any direction, circular or elliptical in any plane and with principal axes in any direction, or a combination of motions in different directions and on different planes, for example at different frequencies.
- vertical refers to a direction perpendicular to the surface on which the beads are resting, but since the magnetic force attracting the beads to the surface is often greater than the force of gravity, the surface on which the beads are resting need not be horizontal with respect to gravity.
- Vertical and horizontal vibrations may allow the beads to overcome static friction by different mechanisms.
- Vertical vibrations may produce inertial forces that, at least in part of the vibration cycle, act in a direction to counter the magnetic force attracting the bead to the surface. This may reduce the static friction acting between the bead and the surface, and if great enough may even lift the bead off the surface completely, in either case allowing the bead to overcome static friction and to move horizontally under the influence of the horizontal magnetic force.
- Horizontal vibrations may produce inertial forces that add to the horizontal magnetic force in part of the vibration cycle, allowing the bead to overcome static friction to move in the direction of the horizontal magnetic force.
- the inertial force will oppose the horizontal magnetic force, either producing a weaker net horizontal force that cannot overcome static friction, or at least a weaker net horizontal force that will move the bead in the direction of the inertial force a smaller distance than when the inertial force and horizontal magnetic force are in the same direction. In either case, the bead will undergo a net drift in the direction of the horizontal magnetic force.
- the inertial force is not too many times greater than the magnetic force, at least for most of the beads, at least at the edge of the detection area.
- the inertial force is no more than 3 times as great, or no more than 5 times as great, or no more than 10 times a great as the magnetic force.
- the inertial force is at least 0.3 times, at least 0.5 times, or at least equal to the magnetic force, which has the potential advantage that the inertial force may be great enough to overcome static friction.
- a rough estimate of the vibration frequency and amplitude sufficient to overcome static friction may be obtained by calculating a frequency and amplitude at which the inertial force on the bead is comparable to the magnetic force, whether horizontal or vertical.
- the magnetic force if the bead has a spherical core made of iron or a similar high permeability magnetic material, may be approximated by the volume of the iron core, times the spatial gradient of the magnetic field energy density B 2 / ⁇ 0 , where B is the magnetic field strength, and ⁇ 0 is the permeability of vacuum.
- the inertial force may be given by half the peak-to-peak displacement, times the square of the vibration frequency ⁇ in radians per second, times the mass of the bead.
- the condition for the inertial force to be comparable to the magnetic force may depend only on the magnetic field strength, the scale length of the magnetic field gradient, which is comparable to the radius of the magnet, the vibration frequency and amplitude, and the density of the magnetic core.
- the frequency needed to make the inertial force comparable to the magnetic force is expected to be a few tens of Hz. This is comparable to the vibration frequencies that were found by the inventors to be most effective at causing the beads to concentrate in the center of the detection area under the influence of the magnet. So this way of estimating a vibration frequency and amplitude that will overcome static friction appears to be reasonably accurate, at least when the beads are in air, since air resistance forces on the beads may be relatively weak compared to the inertial and magnetic forces.
- composition or method may include additional ingredients and/or steps, but only if the additional ingredients and/or steps do not materially alter the basic and novel characteristics of the claimed composition or method.
- a compound or “at least one compound” may include a plurality of compounds, including mixtures thereof.
- range format is merely for convenience and brevity and should not be construed as an inflexible limitation on the scope of the invention. Accordingly, the description of a range should be considered to have specifically disclosed all the possible subranges as well as individual numerical values within that range. For example, description of a range such as from 1 to 6 should be considered to have specifically disclosed subranges such as from 1 to 3, from 1 to 4, from 1 to 5, from 2 to 4, from 2 to 6, from 3 to 6 etc., as well as individual numbers within that range, for example, 1, 2, 3, 4, 5, and 6. This applies regardless of the breadth of the range.
- method refers to manners, means, techniques and procedures for accomplishing a given task including, but not limited to, those manners, means, techniques and procedures either known to, or readily developed from known manners, means, techniques and procedures by practitioners of the chemical, pharmacological, biological, biochemical and medical arts.
- IL8 assays were made, with seven different concentrations of IL8 in the sample fluid, ranging from 2 to 8000 picograms per milliliter. No vibration was used to concentrate the beads in the detection area. At each concentration, three different runs were made. For each run, the beads in the detection area were imaged with a cooled CCD detector, the Sensicam qe, sold by PCO. The integrated fluorescent emission over the detection area from the analyte complex was measured, and the number of beads in the detection area was counted, using image processing software on the digital image of the beads. On average there were about 300 beads in the detection area, in each run.
- the standard deviation of the three test runs is substantially lower when the integrated fluorescence is normalized to the number of beads. This is because the number of beads, which averaged about 300, varied considerably from run to run, with a standard deviation of about 100. Only at the lowest concentrations of IL8 was the standard deviation comparable for the raw and normalized integrated fluorescence. This was due to the fact that, at the lowest concentrations of IL8, the measured amplitude of the fluorescence was close to the noise level of the detectors, so there was a high percentage standard deviation in the normalized fluorescence as well.
- the greater accuracy of using the normalized fluorescence, for determining the IL8 concentration may also be seen by comparing the mean values of the raw fluorescence and the normalized fluorescence as a function of IL8 concentration.
- the normalized mean value is a smoother function of IL8 concentration, being approximately linear at low concentrations, and smoothly saturating at higher concentrations.
- the standard deviation for the three experiments is a measure of the degree to which the results are affected by different conditions: for example differences in temperature, differences in the size and shape of the beads due to variations in the way they were manufactured, differences in the way the protocol for the assay was carried out, differences in the strength of the various chemical reagents due to finite shelf life or manufacturing differences, and differences in the number and distribution of beads in the detection cell.
- Tables 2, 3, 4, and 5 show the percent of standard deviation for each concentration of IL8, for methods 1-4 respectively, for the different measurements within each experiment, and for the three experiments. Table 2. Imaging beads Experiment 1 Experiment 2 Experiment 3 3 Experiments Cone (pg/ml) Mean Percent s.d. Mean Percent s.d. Mean Percent s.d. Mean Percent s.d.
Claims (14)
- Procédé de détermination d'une quantité d'une substance à analyser appliquée contre des billes d'un système d'analyse basé sur des billes, le procédé comprenant :a) fournir une zone de détection (504) ;b) fournir des billes (310 ; 328 ; 404 ; 510) contre lesquelles la substance à analyser a été appliquée ;c) amener un complexe de la substance à analyser à émettre de manière fluorescence ou chimique une première lumière, ou à libérer un colorant ;caractérisé pard) mesurer intégralement la première lumière émise par les billes (310 ; 328 ; 404 ; 510) dans la zone de détection (504) pour déterminer une intensité intégrée de la première lumière, ou mesurer une concentration du colorant libéré par les billes (310 ; 328 ; 404 ; 510) dans la zone de détection (504), ou les deux, l'intensité intégrée de la première lumière ou la concentration du colorant, ou les deux, fournissant une indication de la quantité de substance à analyser appliquée contre les billes (310 ; 328 ; 404 ; 510) dans la zone de détection (504) ;e) amener de la lumière à interagir avec les billes (310 ; 328 ; 404 ; 510) dans la zone de détection (504), l'interaction ne dépendant ni du fait que la substance à analyser est appliquée ou non contre les billes (310 ; 328 ; 404 ; 510) ni de la proportion dans laquelle ladite substance à analyser est appliquée contre lesdites billes ;f) mesurer intégralement une deuxième lumière dans la zone de détection (504), la deuxième lumière résultant de l'interaction avec les billes (310 ; 328 ; 404 ; 510) qui ne dépend pas de la substance à analyser pour déterminer une deuxième lumière mesurée, la deuxième lumière mesurée fournissant une indication de la quantité de billes (310 ; 328 ; 404 ; 510) dans la zone de détection (504) ; etg) déterminer une quantité normalisée de substance à analyser à partir de l'intensité intégrée de la première lumière ou de la concentration du colorant ou des deux, et à partir de la deuxième lumière mesurée.
- Procédé selon la revendication 1, dans lequel déterminer la quantité normalisée de substance à analyser comprend :a) déterminer une quantité de substance à analyser appliquée contre les billes (310 ; 328 ; 404 ; 510) dans la zone de détection (504), à partir de l'intensité intégrée de la première lumière ou de la concentration du colorant ou des deux ;b) estimer une quantité de billes (310 ; 328 ; 404 ; 510) dans la zone de détection à partir de la deuxième lumière mesurée ; etc) normaliser la quantité de substance à analyser en utilisant la quantité estimée de billes (310 ; 328 ; 404 ; 510).
- Procédé selon la revendication 1 ou la revendication 2, dans lequel mesurer intégralement la deuxième lumière comprend mesurer une intensité intégrée de la deuxième lumière provenant de la zone de détection, et dans lequel déterminer la quantité normalisée de substance à analyser comprend utiliser l'intensité intégrée de la deuxième lumière.
- Procédé selon la revendication 2, dans lequel estimer la quantité de billes (310 ; 328 ; 404 ; 510) comprend estimer en utilisant uniquement une intensité intégrée de la deuxième lumière provenant de la zone de détection (504), ou en utilisant uniquement l'intensité intégrée de la deuxième lumière provenant de la zone de détection (504) et au moins un des paramètres d'étalonnage.
- Procédé selon la revendication 4, dans lequel estimer la quantité de billes (310 ; 328 ; 404 ; 510) comprend estimer une quantité proportionnelle à l'intensité intégrée de la deuxième lumière provenant de la zone de détection (504).
- Procédé selon l'une quelconque des revendications précédentes, dans lequel l'interaction comprend la réflexion de la lumière depuis les billes (310 ; 328 ; 404 ; 510).
- Procédé selon l'une quelconque des revendications 1 à 5, dans lequel l'interaction comprend la réfraction de la lumière à travers les billes (310 ; 328 ; 404 ; 510).
- Procédé selon l'une quelconque des revendications 1 à 5, dans lequel l'interaction comprend le fait d'exciter une émission fluorescente depuis les billes (310 ; 328 ; 404 ; 510) avec la lumière.
- Procédé selon la revendication 8, dans lequel le complexe est amené à émettre la première lumière à des plages de longueurs d'onde différentes de celles de la deuxième lumière.
- Procédé selon la revendication 8 ou la revendication 9, dans lequel le complexe est amené à émettre la première lumière de manière fluorescente et avec une dépendance temporelle différente de celle de la deuxième lumière, en illuminant les billes (310 ; 328 ; 404 ; 510) avec une lumière d'excitation dont le spectre varie en fonction du temps.
- Procédé comprenant l'une quelconque des revendications 1 à 5, dans lequel l'interaction comprend le blocage ou l'absorption de la lumière par les billes (310 ; 328 ; 404 ; 510) et la réflexion depuis ou en passant à travers des zones entre les billes (310 ; 328 ; 404 ; 510) par la lumière.
- Procédé selon l'une quelconque des revendications précédentes, dans lequel le complexe est amené à émettre la première lumière, et les billes (310 ; 328 ; 404 ; 510) sont situées aux mêmes endroits au moment de mesurer la première lumière et la deuxième lumière.
- Système d'analyse d'une substance à analyser appliquée contre des billes, le système comprenant :a) une zone de détection (504) pour contenir les billes (310 ; 328 ; 404 ; 510) avec la substance à analyser appliquée contre elles ;b) un premier détecteur (316) ;c) une source de lumière (302 ; 402) ;d) un deuxième détecteur (314 ; 329 ; 410), identique au ou différent du premier détecteur (316) ;e) un régulateur (128) ;caractérisé en ce que :f) le premier détecteur (316) est configuré pour intégralement mesurer une intensité d'une émission fluorescente ou chimique d'une première lumière depuis les billes (310 ; 328 ; 404 ; 510) dans la zone de détection (504) pour déterminer une intensité intégrée de la première lumière, dans lequel le premier détecteur (316) est configuré pour intégralement mesurer une libération catalysée d'un colorant par les billes (310 ; 328 ; 404 ; 510) dans la zone de détection (504), en fonction d'une dose de substance à analyser appliquée contre elles ;g) la source de lumière (302 ; 402) est configurée pour produire une lumière qui interagit avec les billes (310 ; 328 ; 404 ; 510) dans la zone de détection (504), l'interaction ne dépendant ni du fait que la substance à analyser est appliquée ou non contre les billes (310 ; 328 ; 404 ; 510) ni de la proportion dans laquelle ladite substance à analyser est appliquée contre lesdites billes ;h) le deuxième détecteur (314 ; 329 ; 410) est configuré pour intégralement mesurer une deuxième lumière reçue des billes (310 ; 328 ; 404 ; 510) dans la zone de détection (504) en tant que résultat de l'interaction pour déterminer une deuxième lumière mesurée, la deuxième lumière mesurée fournissant une indication de la quantité de billes dans la zone de détection (504) ;i) le régulateur (128) est configuré pour utiliser les mesures du premier détecteur (316), c'est-à-dire l'intensité intégrée de la première lumière ou la libération catalysée du colorant dans la zone de détection, et la mesure du deuxième détecteur (314 ; 329 ; 410), c'est-à-dire la deuxième lumière mesurée, pour déterminer une quantité normalisée de substance à analyser appliquée contre les billes (310 ; 328 ; 404 ; 510).
- Système selon la revendication 13, dans lequel le premier détecteur (316) est un détecteur simple, c'est-à-dire sans réseau.
Applications Claiming Priority (2)
| Application Number | Priority Date | Filing Date | Title |
|---|---|---|---|
| US26487309P | 2009-11-30 | 2009-11-30 | |
| PCT/IL2010/000993 WO2011064778A2 (fr) | 2009-11-30 | 2010-11-29 | Lecteur de billes |
Publications (2)
| Publication Number | Publication Date |
|---|---|
| EP2507620A2 EP2507620A2 (fr) | 2012-10-10 |
| EP2507620B1 true EP2507620B1 (fr) | 2017-03-22 |
Family
ID=43513694
Family Applications (1)
| Application Number | Title | Priority Date | Filing Date |
|---|---|---|---|
| EP10795779.7A Not-in-force EP2507620B1 (fr) | 2009-11-30 | 2010-11-29 | Lecteur optique d'essai à billes |
Country Status (5)
| Country | Link |
|---|---|
| US (1) | US8927294B2 (fr) |
| EP (1) | EP2507620B1 (fr) |
| JP (1) | JP2013512450A (fr) |
| CA (1) | CA2781824A1 (fr) |
| WO (1) | WO2011064778A2 (fr) |
Families Citing this family (9)
| Publication number | Priority date | Publication date | Assignee | Title |
|---|---|---|---|---|
| EP2910930A4 (fr) * | 2012-10-22 | 2016-06-15 | Universal Bio Research Co Ltd | Procédé d'analyse et trousse d'analyse pour quantifier ou détecter simultanément de multiples types de substances cible |
| US20140112840A1 (en) * | 2012-10-23 | 2014-04-24 | Wisconsin Alumni Research Foundation | Device For And Method Of Extracting A Fraction From A Biological Sample |
| US10040062B2 (en) | 2014-01-14 | 2018-08-07 | Wisconsin Alumni Research Foundation | Device and method for transferring a target between locations |
| US20160293502A1 (en) * | 2015-03-31 | 2016-10-06 | Lam Research Corporation | Method and apparatus for detecting defects on wafers |
| US20190234978A1 (en) * | 2016-09-23 | 2019-08-01 | ArcherDX, Inc. | System for nucleic acid preparation |
| ES2956109T3 (es) * | 2018-02-15 | 2023-12-13 | Procisedx Inc | Analizador |
| US10866192B2 (en) * | 2018-10-19 | 2020-12-15 | Endress+Hauser Conducta Gmbh+Co. Kg | Optochemical sensor unit and a method for the qualitative and/or quantitative determination of an analyte in a measuring medium with the sensor unit |
| EP3938785A4 (fr) * | 2020-05-25 | 2022-11-30 | Quantum Ip Holdings Pty Limited | Utilisation de nanoparticules magnétiques pour la détection et la quantification d'un ou de plusieurs analytes |
| US11606147B1 (en) * | 2022-06-06 | 2023-03-14 | Bae Systems Information And Electronic Systems Integration Inc. | Frequency and bandwidth agile optical bench |
Family Cites Families (9)
| Publication number | Priority date | Publication date | Assignee | Title |
|---|---|---|---|---|
| JPH01172755A (ja) | 1987-12-28 | 1989-07-07 | Tosoh Corp | 封入済み免疫反応試薬の異常を検出する方法及び装置 |
| CA2164167A1 (fr) * | 1994-12-20 | 1996-06-21 | Izak Bahar | Methode de normalisation d'une analyse |
| US5981180A (en) | 1995-10-11 | 1999-11-09 | Luminex Corporation | Multiplexed analysis of clinical specimens apparatus and methods |
| US7428322B2 (en) * | 2004-04-20 | 2008-09-23 | Bio-Rad Laboratories, Inc. | Imaging method and apparatus |
| JP4733433B2 (ja) | 2005-06-03 | 2011-07-27 | 株式会社日立ソリューションズ | ビーズアレイ用蛍光読取装置及びビーズアレイ用蛍光読取方法 |
| CN102622746B (zh) * | 2005-09-21 | 2016-05-25 | 卢米尼克斯股份有限公司 | 图像数据处理的方法和系统 |
| EP1942334A4 (fr) * | 2005-09-28 | 2011-01-12 | Olympus Corp | Analyseur spectral de fluorescence |
| EP2038655A2 (fr) | 2006-06-02 | 2009-03-25 | Luminex Corporation | Systèmes et procédés pour effectuer des mesures sur un ou plusieurs matériaux |
| US7764361B2 (en) | 2006-07-27 | 2010-07-27 | Northwestern University | Systems and methods to analyze multiplexed bead-based assays using backscattered light |
-
2010
- 2010-11-29 WO PCT/IL2010/000993 patent/WO2011064778A2/fr active Application Filing
- 2010-11-29 EP EP10795779.7A patent/EP2507620B1/fr not_active Not-in-force
- 2010-11-29 JP JP2012541621A patent/JP2013512450A/ja not_active Ceased
- 2010-11-29 CA CA2781824A patent/CA2781824A1/fr not_active Abandoned
- 2010-11-29 US US12/954,955 patent/US8927294B2/en not_active Expired - Fee Related
Non-Patent Citations (1)
| Title |
|---|
| None * |
Also Published As
| Publication number | Publication date |
|---|---|
| WO2011064778A2 (fr) | 2011-06-03 |
| US8927294B2 (en) | 2015-01-06 |
| EP2507620A2 (fr) | 2012-10-10 |
| CA2781824A1 (fr) | 2011-06-03 |
| WO2011064778A3 (fr) | 2011-08-04 |
| JP2013512450A (ja) | 2013-04-11 |
| US20110136250A1 (en) | 2011-06-09 |
Similar Documents
| Publication | Publication Date | Title |
|---|---|---|
| EP2507620B1 (fr) | Lecteur optique d'essai à billes | |
| KR101888909B1 (ko) | 하나 이상의 재료의 측정을 수행하기 위한 시스템 및 방법 | |
| JP6573864B2 (ja) | 分子または粒子の超高感度検出用のシステム、デバイスおよび方法 | |
| JP3535144B2 (ja) | 自動連続ランダムアクセス分析システムおよびその構成要素 | |
| EP3394597B1 (fr) | Détection optique d'une substance dans un fluide | |
| US9829434B2 (en) | Optical detection system for liquid samples | |
| US9671345B2 (en) | Mapping volumes of interest in selected planes in liquid samples | |
| US20130274119A1 (en) | Methods and apparatuses for detection of positional freedom of particles in biological and chemical analyses and applications in immunodiagnostics | |
| JP6625519B2 (ja) | アッセイシステムおよびカートリッジデバイス | |
| US20180264464A1 (en) | Nitrocellulose extrusion for porous film strips | |
| TW201802245A (zh) | 樣本使用最大化之系統及方法 | |
| KR20070097434A (ko) | 이미지화를 위해 마이크로스피어를 배치하는 방법 및시스템 | |
| WO2012059784A1 (fr) | Procédé et dispositif de mesure de fluorescence d'échantillons | |
| EP2799871B1 (fr) | Dispositif d'analyse d'échantillon et procédé d'analyse d'échantillon | |
| JP2006292410A (ja) | 分析装置およびそれに使用する分析デバイス | |
| US20110093213A1 (en) | Fluid providing apparatus | |
| CN101918835A (zh) | 用于在免疫或酶法测定中定量被分析物的系统和方法 | |
| CN109073554B (zh) | 利用双光子激发荧光的生物亲和性测定方法 | |
| WO2018185672A1 (fr) | Surfaces de capture d'essai biologique à autofluorescence décolorée | |
| US20220097064A1 (en) | Apparatus for Automatic Sampling of Biological Species Employing Disk Microfluidics System | |
| JP2009222562A (ja) | 測定チップとそれを用いた測定方法 |
Legal Events
| Date | Code | Title | Description |
|---|---|---|---|
| PUAI | Public reference made under article 153(3) epc to a published international application that has entered the european phase |
Free format text: ORIGINAL CODE: 0009012 |
|
| 17P | Request for examination filed |
Effective date: 20120629 |
|
| AK | Designated contracting states |
Kind code of ref document: A2 Designated state(s): AL AT BE BG CH CY CZ DE DK EE ES FI FR GB GR HR HU IE IS IT LI LT LU LV MC MK MT NL NO PL PT RO RS SE SI SK SM TR |
|
| DAX | Request for extension of the european patent (deleted) | ||
| GRAP | Despatch of communication of intention to grant a patent |
Free format text: ORIGINAL CODE: EPIDOSNIGR1 |
|
| RIC1 | Information provided on ipc code assigned before grant |
Ipc: G01N 21/64 20060101AFI20160928BHEP Ipc: G01N 35/00 20060101ALI20160928BHEP Ipc: G01N 15/06 20060101ALN20160928BHEP Ipc: G01N 15/14 20060101ALN20160928BHEP Ipc: G01N 21/76 20060101ALI20160928BHEP Ipc: G01N 35/10 20060101ALN20160928BHEP |
|
| INTG | Intention to grant announced |
Effective date: 20161018 |
|
| GRAS | Grant fee paid |
Free format text: ORIGINAL CODE: EPIDOSNIGR3 |
|
| GRAA | (expected) grant |
Free format text: ORIGINAL CODE: 0009210 |
|
| AK | Designated contracting states |
Kind code of ref document: B1 Designated state(s): AL AT BE BG CH CY CZ DE DK EE ES FI FR GB GR HR HU IE IS IT LI LT LU LV MC MK MT NL NO PL PT RO RS SE SI SK SM TR |
|
| REG | Reference to a national code |
Ref country code: GB Ref legal event code: FG4D |
|
| REG | Reference to a national code |
Ref country code: CH Ref legal event code: EP |
|
| REG | Reference to a national code |
Ref country code: AT Ref legal event code: REF Ref document number: 878280 Country of ref document: AT Kind code of ref document: T Effective date: 20170415 |
|
| REG | Reference to a national code |
Ref country code: IE Ref legal event code: FG4D |
|
| REG | Reference to a national code |
Ref country code: DE Ref legal event code: R096 Ref document number: 602010040993 Country of ref document: DE |
|
| REG | Reference to a national code |
Ref country code: NL Ref legal event code: MP Effective date: 20170322 |
|
| PG25 | Lapsed in a contracting state [announced via postgrant information from national office to epo] |
Ref country code: NO Free format text: LAPSE BECAUSE OF FAILURE TO SUBMIT A TRANSLATION OF THE DESCRIPTION OR TO PAY THE FEE WITHIN THE PRESCRIBED TIME-LIMIT Effective date: 20170622 Ref country code: HR Free format text: LAPSE BECAUSE OF FAILURE TO SUBMIT A TRANSLATION OF THE DESCRIPTION OR TO PAY THE FEE WITHIN THE PRESCRIBED TIME-LIMIT Effective date: 20170322 Ref country code: FI Free format text: LAPSE BECAUSE OF FAILURE TO SUBMIT A TRANSLATION OF THE DESCRIPTION OR TO PAY THE FEE WITHIN THE PRESCRIBED TIME-LIMIT Effective date: 20170322 Ref country code: GR Free format text: LAPSE BECAUSE OF FAILURE TO SUBMIT A TRANSLATION OF THE DESCRIPTION OR TO PAY THE FEE WITHIN THE PRESCRIBED TIME-LIMIT Effective date: 20170623 Ref country code: LT Free format text: LAPSE BECAUSE OF FAILURE TO SUBMIT A TRANSLATION OF THE DESCRIPTION OR TO PAY THE FEE WITHIN THE PRESCRIBED TIME-LIMIT Effective date: 20170322 |
|
| REG | Reference to a national code |
Ref country code: LT Ref legal event code: MG4D |
|
| REG | Reference to a national code |
Ref country code: AT Ref legal event code: MK05 Ref document number: 878280 Country of ref document: AT Kind code of ref document: T Effective date: 20170322 |
|
| PG25 | Lapsed in a contracting state [announced via postgrant information from national office to epo] |
Ref country code: RS Free format text: LAPSE BECAUSE OF FAILURE TO SUBMIT A TRANSLATION OF THE DESCRIPTION OR TO PAY THE FEE WITHIN THE PRESCRIBED TIME-LIMIT Effective date: 20170322 Ref country code: BG Free format text: LAPSE BECAUSE OF FAILURE TO SUBMIT A TRANSLATION OF THE DESCRIPTION OR TO PAY THE FEE WITHIN THE PRESCRIBED TIME-LIMIT Effective date: 20170622 Ref country code: SE Free format text: LAPSE BECAUSE OF FAILURE TO SUBMIT A TRANSLATION OF THE DESCRIPTION OR TO PAY THE FEE WITHIN THE PRESCRIBED TIME-LIMIT Effective date: 20170322 Ref country code: LV Free format text: LAPSE BECAUSE OF FAILURE TO SUBMIT A TRANSLATION OF THE DESCRIPTION OR TO PAY THE FEE WITHIN THE PRESCRIBED TIME-LIMIT Effective date: 20170322 |
|
| PG25 | Lapsed in a contracting state [announced via postgrant information from national office to epo] |
Ref country code: NL Free format text: LAPSE BECAUSE OF FAILURE TO SUBMIT A TRANSLATION OF THE DESCRIPTION OR TO PAY THE FEE WITHIN THE PRESCRIBED TIME-LIMIT Effective date: 20170322 |
|
| PG25 | Lapsed in a contracting state [announced via postgrant information from national office to epo] |
Ref country code: CZ Free format text: LAPSE BECAUSE OF FAILURE TO SUBMIT A TRANSLATION OF THE DESCRIPTION OR TO PAY THE FEE WITHIN THE PRESCRIBED TIME-LIMIT Effective date: 20170322 Ref country code: RO Free format text: LAPSE BECAUSE OF FAILURE TO SUBMIT A TRANSLATION OF THE DESCRIPTION OR TO PAY THE FEE WITHIN THE PRESCRIBED TIME-LIMIT Effective date: 20170322 Ref country code: SK Free format text: LAPSE BECAUSE OF FAILURE TO SUBMIT A TRANSLATION OF THE DESCRIPTION OR TO PAY THE FEE WITHIN THE PRESCRIBED TIME-LIMIT Effective date: 20170322 Ref country code: AT Free format text: LAPSE BECAUSE OF FAILURE TO SUBMIT A TRANSLATION OF THE DESCRIPTION OR TO PAY THE FEE WITHIN THE PRESCRIBED TIME-LIMIT Effective date: 20170322 Ref country code: IT Free format text: LAPSE BECAUSE OF FAILURE TO SUBMIT A TRANSLATION OF THE DESCRIPTION OR TO PAY THE FEE WITHIN THE PRESCRIBED TIME-LIMIT Effective date: 20170322 Ref country code: EE Free format text: LAPSE BECAUSE OF FAILURE TO SUBMIT A TRANSLATION OF THE DESCRIPTION OR TO PAY THE FEE WITHIN THE PRESCRIBED TIME-LIMIT Effective date: 20170322 Ref country code: ES Free format text: LAPSE BECAUSE OF FAILURE TO SUBMIT A TRANSLATION OF THE DESCRIPTION OR TO PAY THE FEE WITHIN THE PRESCRIBED TIME-LIMIT Effective date: 20170322 |
|
| REG | Reference to a national code |
Ref country code: FR Ref legal event code: PLFP Year of fee payment: 8 |
|
| PG25 | Lapsed in a contracting state [announced via postgrant information from national office to epo] |
Ref country code: IS Free format text: LAPSE BECAUSE OF FAILURE TO SUBMIT A TRANSLATION OF THE DESCRIPTION OR TO PAY THE FEE WITHIN THE PRESCRIBED TIME-LIMIT Effective date: 20170722 Ref country code: PT Free format text: LAPSE BECAUSE OF FAILURE TO SUBMIT A TRANSLATION OF THE DESCRIPTION OR TO PAY THE FEE WITHIN THE PRESCRIBED TIME-LIMIT Effective date: 20170724 Ref country code: PL Free format text: LAPSE BECAUSE OF FAILURE TO SUBMIT A TRANSLATION OF THE DESCRIPTION OR TO PAY THE FEE WITHIN THE PRESCRIBED TIME-LIMIT Effective date: 20170322 Ref country code: SM Free format text: LAPSE BECAUSE OF FAILURE TO SUBMIT A TRANSLATION OF THE DESCRIPTION OR TO PAY THE FEE WITHIN THE PRESCRIBED TIME-LIMIT Effective date: 20170322 |
|
| REG | Reference to a national code |
Ref country code: DE Ref legal event code: R097 Ref document number: 602010040993 Country of ref document: DE |
|
| PLBE | No opposition filed within time limit |
Free format text: ORIGINAL CODE: 0009261 |
|
| STAA | Information on the status of an ep patent application or granted ep patent |
Free format text: STATUS: NO OPPOSITION FILED WITHIN TIME LIMIT |
|
| PG25 | Lapsed in a contracting state [announced via postgrant information from national office to epo] |
Ref country code: DK Free format text: LAPSE BECAUSE OF FAILURE TO SUBMIT A TRANSLATION OF THE DESCRIPTION OR TO PAY THE FEE WITHIN THE PRESCRIBED TIME-LIMIT Effective date: 20170322 |
|
| 26N | No opposition filed |
Effective date: 20180102 |
|
| PG25 | Lapsed in a contracting state [announced via postgrant information from national office to epo] |
Ref country code: SI Free format text: LAPSE BECAUSE OF FAILURE TO SUBMIT A TRANSLATION OF THE DESCRIPTION OR TO PAY THE FEE WITHIN THE PRESCRIBED TIME-LIMIT Effective date: 20170322 |
|
| PG25 | Lapsed in a contracting state [announced via postgrant information from national office to epo] |
Ref country code: MC Free format text: LAPSE BECAUSE OF FAILURE TO SUBMIT A TRANSLATION OF THE DESCRIPTION OR TO PAY THE FEE WITHIN THE PRESCRIBED TIME-LIMIT Effective date: 20170322 |
|
| PG25 | Lapsed in a contracting state [announced via postgrant information from national office to epo] |
Ref country code: CH Free format text: LAPSE BECAUSE OF NON-PAYMENT OF DUE FEES Effective date: 20171130 Ref country code: LI Free format text: LAPSE BECAUSE OF NON-PAYMENT OF DUE FEES Effective date: 20171130 |
|
| PG25 | Lapsed in a contracting state [announced via postgrant information from national office to epo] |
Ref country code: LU Free format text: LAPSE BECAUSE OF NON-PAYMENT OF DUE FEES Effective date: 20171129 |
|
| REG | Reference to a national code |
Ref country code: BE Ref legal event code: MM Effective date: 20171130 |
|
| REG | Reference to a national code |
Ref country code: IE Ref legal event code: MM4A |
|
| PG25 | Lapsed in a contracting state [announced via postgrant information from national office to epo] |
Ref country code: MT Free format text: LAPSE BECAUSE OF NON-PAYMENT OF DUE FEES Effective date: 20171129 |
|
| PG25 | Lapsed in a contracting state [announced via postgrant information from national office to epo] |
Ref country code: IE Free format text: LAPSE BECAUSE OF NON-PAYMENT OF DUE FEES Effective date: 20171129 |
|
| PG25 | Lapsed in a contracting state [announced via postgrant information from national office to epo] |
Ref country code: BE Free format text: LAPSE BECAUSE OF NON-PAYMENT OF DUE FEES Effective date: 20171130 |
|
| PG25 | Lapsed in a contracting state [announced via postgrant information from national office to epo] |
Ref country code: HU Free format text: LAPSE BECAUSE OF FAILURE TO SUBMIT A TRANSLATION OF THE DESCRIPTION OR TO PAY THE FEE WITHIN THE PRESCRIBED TIME-LIMIT; INVALID AB INITIO Effective date: 20101129 |
|
| PG25 | Lapsed in a contracting state [announced via postgrant information from national office to epo] |
Ref country code: CY Free format text: LAPSE BECAUSE OF NON-PAYMENT OF DUE FEES Effective date: 20170322 |
|
| PG25 | Lapsed in a contracting state [announced via postgrant information from national office to epo] |
Ref country code: MK Free format text: LAPSE BECAUSE OF FAILURE TO SUBMIT A TRANSLATION OF THE DESCRIPTION OR TO PAY THE FEE WITHIN THE PRESCRIBED TIME-LIMIT Effective date: 20170322 |
|
| PG25 | Lapsed in a contracting state [announced via postgrant information from national office to epo] |
Ref country code: TR Free format text: LAPSE BECAUSE OF FAILURE TO SUBMIT A TRANSLATION OF THE DESCRIPTION OR TO PAY THE FEE WITHIN THE PRESCRIBED TIME-LIMIT Effective date: 20170322 |
|
| PG25 | Lapsed in a contracting state [announced via postgrant information from national office to epo] |
Ref country code: AL Free format text: LAPSE BECAUSE OF FAILURE TO SUBMIT A TRANSLATION OF THE DESCRIPTION OR TO PAY THE FEE WITHIN THE PRESCRIBED TIME-LIMIT Effective date: 20170322 |
|
| PGFP | Annual fee paid to national office [announced via postgrant information from national office to epo] |
Ref country code: GB Payment date: 20201126 Year of fee payment: 11 Ref country code: FR Payment date: 20201126 Year of fee payment: 11 |
|
| PGFP | Annual fee paid to national office [announced via postgrant information from national office to epo] |
Ref country code: DE Payment date: 20210128 Year of fee payment: 11 |
|
| REG | Reference to a national code |
Ref country code: DE Ref legal event code: R119 Ref document number: 602010040993 Country of ref document: DE |
|
| GBPC | Gb: european patent ceased through non-payment of renewal fee |
Effective date: 20211129 |
|
| PG25 | Lapsed in a contracting state [announced via postgrant information from national office to epo] |
Ref country code: GB Free format text: LAPSE BECAUSE OF NON-PAYMENT OF DUE FEES Effective date: 20211129 Ref country code: DE Free format text: LAPSE BECAUSE OF NON-PAYMENT OF DUE FEES Effective date: 20220601 |
|
| PG25 | Lapsed in a contracting state [announced via postgrant information from national office to epo] |
Ref country code: FR Free format text: LAPSE BECAUSE OF NON-PAYMENT OF DUE FEES Effective date: 20211130 |