EP2446234B1 - Determining the resonance parameters for mechanical oscillators - Google Patents
Determining the resonance parameters for mechanical oscillators Download PDFInfo
- Publication number
- EP2446234B1 EP2446234B1 EP10728984.5A EP10728984A EP2446234B1 EP 2446234 B1 EP2446234 B1 EP 2446234B1 EP 10728984 A EP10728984 A EP 10728984A EP 2446234 B1 EP2446234 B1 EP 2446234B1
- Authority
- EP
- European Patent Office
- Prior art keywords
- frequency
- resonance
- excitation
- oscillator
- amplitude
- Prior art date
- Legal status (The legal status is an assumption and is not a legal conclusion. Google has not performed a legal analysis and makes no representation as to the accuracy of the status listed.)
- Active
Links
Images




Classifications
-
- G—PHYSICS
- G01—MEASURING; TESTING
- G01D—MEASURING NOT SPECIALLY ADAPTED FOR A SPECIFIC VARIABLE; ARRANGEMENTS FOR MEASURING TWO OR MORE VARIABLES NOT COVERED IN A SINGLE OTHER SUBCLASS; TARIFF METERING APPARATUS; MEASURING OR TESTING NOT OTHERWISE PROVIDED FOR
- G01D1/00—Measuring arrangements giving results other than momentary value of variable, of general application
-
- G—PHYSICS
- G01—MEASURING; TESTING
- G01D—MEASURING NOT SPECIALLY ADAPTED FOR A SPECIFIC VARIABLE; ARRANGEMENTS FOR MEASURING TWO OR MORE VARIABLES NOT COVERED IN A SINGLE OTHER SUBCLASS; TARIFF METERING APPARATUS; MEASURING OR TESTING NOT OTHERWISE PROVIDED FOR
- G01D15/00—Component parts of recorders for measuring arrangements not specially adapted for a specific variable
-
- G—PHYSICS
- G01—MEASURING; TESTING
- G01H—MEASUREMENT OF MECHANICAL VIBRATIONS OR ULTRASONIC, SONIC OR INFRASONIC WAVES
- G01H13/00—Measuring resonant frequency
-
- G—PHYSICS
- G01—MEASURING; TESTING
- G01N—INVESTIGATING OR ANALYSING MATERIALS BY DETERMINING THEIR CHEMICAL OR PHYSICAL PROPERTIES
- G01N17/00—Investigating resistance of materials to the weather, to corrosion, or to light
- G01N17/04—Corrosion probes
-
- G—PHYSICS
- G01—MEASURING; TESTING
- G01N—INVESTIGATING OR ANALYSING MATERIALS BY DETERMINING THEIR CHEMICAL OR PHYSICAL PROPERTIES
- G01N29/00—Investigating or analysing materials by the use of ultrasonic, sonic or infrasonic waves; Visualisation of the interior of objects by transmitting ultrasonic or sonic waves through the object
- G01N29/44—Processing the detected response signal, e.g. electronic circuits specially adapted therefor
- G01N29/46—Processing the detected response signal, e.g. electronic circuits specially adapted therefor by spectral analysis, e.g. Fourier analysis or wavelet analysis
Definitions
- the present invention relates to mechanical oscillators for the measurement of corrosion and/or deposition.
- the invention relates to the determination of the resonance parameters of a mechanical oscillator in the presence of noise.
- US 2007/0199379 A1 describes a mechanical oscillator loss sensor for use in a corrosive or erosive environment.
- the elements include a means for mechanical excitation, and a mechanical oscillator with two regions that corrode differently, where the regions are determined to affect specific influences on the resonance parameters, wherein said mechanical oscillator has a resonant frequency, f, and a quality factor, Q.
- the mechanical oscillator has the shape of a tuning fork.
- US 2006/0037399 A1 describes a method for inferring possible or impending corrosion or fouling of process elements from fluid flowing in a pipe of an industrial process. A frequency response of a body is measured. The measured frequency response is compared against a stored value. Corrosion or fouling of the process elements is identified based upon the comparison between the measured frequency response and the stored value.
- the prior art describes the application of mechanical oscillators for the measurement of corrosion and/or deposition.
- Mechanical oscillators employ the use of resonance parameters, frequency and the quality factor Q, for the measurement of corrosion or deposition.
- the prior art does not consider the required precision for measuring frequency or Q in the presence of noise to make these measurements.
- the ability of the mechanical oscillator to measure small amounts of metal loss or deposition is not only dependent upon the mechanical design but is limited by the precision in determining the resonance frequency and Q.
- the present invention is related to methods for measuring these resonance parameters with a high precision in the presence of noise. This degree of precision is required to maximize the utility of these devices as sensitive probes for corrosion and deposition (fouling) measurement.
- the invention provides a method for determining resonance parameters, resonance frequency f and quality factor Q, for a mechanical oscillator in a service fluid environment in the presence of noise produced by the service fluid as set out in claim 1 below.
- Preferred optional features are set out in the dependent claims.
- the present disclosure includes three methods for determining resonance parameters: Fast Fourier Transform (FFT) (passive method); frequency sweep (time domain active method); and ring-down (time domain active method). All of the embodiments described herein employ curve fitting consistent with modeling the mechanical oscillator as a simple harmonic oscillator. This curve fitting procedure, combined with averaging and utilizing signal processing parameters to mitigate noise effects, adds considerable precision in measuring resonance parameters.
- FFT Fast Fourier Transform
- frequency sweep time domain active method
- ring-down time domain active method
- the prior art For applications directed at measuring service fluid properties (such as viscosity), the prior art identifies algorithms to account for changes in temperature and/or density that occur from a base case calibration. Even for the case where the aforementioned environmental parameters are invariant, fluid flow provides random excitation and relaxation to the mechanical oscillator such as the tines of a tuning fork. These successive excitations and relaxations randomly impact the tines with random phase. This randomness can cause very minor variations in the apparent resonance frequency that would not be observed in the absence of fluid flow. The result is added noise to the measurement of the resonance parameters.
- the prior art documents the ability to apply signal averaging as a means to reduce variability from noise.
- signal averaging is beneficial and is included in the strategy of this invention, it has negative impact of introducing additional noise. Additional noise is introduced because averaging inherently requires an increase in the time required to collect the data. In cases where the noise is correlated with a process variable (such as a biased increase in temperature), the measurement of the resonance parameters will also be biased. This invention discloses embodiments that enable a reduction of the measurement time to reduce this averaging bias.
- the prior art also discloses the possibility of using active excitation frequency sweep methods for measuring the resonance parameters.
- those methods do not consider the presence of noise and can be tedious (time consuming) since they require that the excitation frequency precisely match the resonance frequency.
- Such methods typically define resonance as the excitation frequency causing maximum oscillator amplitude or minimum excitation current draw.
- the instant invention does not require that the electrical excitation frequency match the actual resonance of the mechanical oscillator.
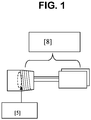
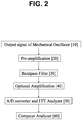
- FIG. 1 shows the typical hardware used for the frequency domain FFT-derived response.
- the electrical output signal [10] of the mechanical oscillator typically needs amplification prior to subsequent signal analysis.
- preamplifier [20] is typically a charge type amplifier. The output of preamplifier [20] will drive some degree of analog filtering.
- Bandpass filter [30] preceding the analog to digital (A/D) [50] conversion for computing the FFT is a well-known method for reducing noise that is not in the immediate vicinity of the resonance frequency.
- Bandpass filtering not only provides relief from low frequency noise (such as 60 Hz interference) but also provides high pass anti-aliasing filter required prior to the analog to digital conversion.
- an optional amplifier [40] might be required ahead of the FFT analyzer [50] which includes an analog to digital (A/D) converter.
- additional digital filtering can supplement noise suppression available in computer processor [60].
- none of these filters will have the capability to suppress noise in the immediate vicinity of the mechanical resonance. Algorithms implemented by the computer [60] enable the curve fitting and computation of the resonance parameters.
- Figure 3a shows an example of the FFT-derived frequency domain spectrum. These data were collected in a stirred reactor where the liquid temperature was 287°C (550°F) and the stirring speed was 300 rpm.
- the FFT resolution step size is 0.05Hz and 400 frequency domain averages were used to make the average shown in Figure 3a .
- the resolution step size of 0.05 Hz dictates that the time required for collection of a single FFT spectrum is 20 seconds (1/0.05). Therefore, 2000 seconds are required to collect sufficient spectra for 100 averages.
- An analog bandpass filter with a passband range of 820-850 Hz was employed as shown in Figure 2 . Although the filter frequency roll-off is 6dB/octave, it was not sufficient to suppress several extraneous amplitude peaks that are not directly related to the fundamental mechanical resonance.
- Figure 3b presents the spectrum of Figure 3a in more detail around the resonance frequency of the mechanical oscillator.
- the resonance frequency of the mechanical oscillator in this environment was independently determined using the time domain methods subsequently described that provide considerably reduced noise.
- a bounded search range is specified encompassing the frequency of the most probable resonance.
- the search range is centered on the most recently determined or estimated resonance frequency.
- the search range parameters ( ⁇ f) for this example are shown in Figure 4a .
- the resonance frequency is determined by finding the maximum amplitude of the curve fit.
- the parameters a (Amplitude), f o , and b are free parameters available for a best-fit adjustment.
- a best fit is obtained by using commonly available search algorithms to minimize the error between the average spectral data and the harmonic oscillator fit. Since the parameters of interest are defined at resonance, the curve is fit only to data within 5 dB of the maximum spectral amplitude.
- the resonance quality factor Q is computed by the computation of the 3 dB (half power) points of the harmonic oscillator curve.
- the time domain methods require the application of an external electrical excitation.
- the hardware for the time domain methods, including the electrical excitation, is shown in Figure 5 .
- the primary hardware differences between the time domain and the previously described frequency domain set-up are the added transmit/receive (T/R) switch [70] and the required signal generator [80].
- the time domain method does not use FFT hardware nor does it compute the full frequency response.
- Signal generator [80] provides the electrical excitation to the transducer ( Figure 2 , item [5]) in the mechanical oscillator.
- T/R switch [70] connects the mechanical oscillator to the signal generator while the tone burst is active and changes the connection of the mechanical oscillator to the A/D and analysis hardware [90] when the tone burst signal is off. In some embodiments it is possible to forgo a T/R switch.
- the Frequency Sweep Method and Ring-Down Method are considered time domain methods since there is no explicit computation or measurement of the full frequency response. Both methods employ averaging by computing each data point in the resonance calculation several times at the same frequency.
- the primary advantage of the time domain methods compared to the FFT method is their improved stability and precision. However, this advantage is only maintained if the mechanical oscillator can be driven at a sufficient level so that its forced excitation signal is greater than the passive signal, if any.
- lock-in amplifiers are well-known devices where the bandpass frequency of the receiving electronics is narrowly matched to electronic excitation frequency. Although lock-in amplifiers may be most advantageous for low Q devices where there is high background noise, the benefit should be assessed for mechanical oscillators which are typically high Q.
- the electrical excitation may be a tone burst signal as shown in Figure 6a .
- the tone burst in this example consists of a sine wave signal whose frequency is in the vicinity of resonance of the mechanical oscillator.
- the amplitude and length of the burst signal should be sufficient to activate the mechanical oscillator to a level greater than provided by the flow of the service fluid.
- a typical duration range for the burst signal is 100-5000 cycles with an off period of 0.5 to 10 seconds.
- the burst signal in this example is sine wave, alternatively, it can be a square wave or a series of pulses.
- a benefit of the time domain method is that erroneous resonances (such as the peak in the Figure 3b FFT at 820 Hz) cannot be energized.
- time domain operation may include a transmit/receive switch (T/R switch) [70] as shown in Figure 5 .
- T/R switch transmit/receive switch
- the purpose of the T/R switch is to change the connection of the transducer in the mechanical oscillator to either the tone burst signal generator or to the receiving circuit.
- a T/R switch would not be required in applications where the hardware receiving circuit can accommodate the strong signal produced during the transmit cycle.
- the actual signal used by the time domain method occurs after the tone burst stops (denoted as the ringdown signal of Figure 6b ).
- This ringdown signal has the frequency equal to the resonance of mechanical oscillator.
- Its amplitude is a function of the frequency of the burst signal. The amplitude is greatest when the frequency of the burst signal is equal to the resonance frequency of the mechanical oscillator.
- the decay time of the ringdown signal is related to the Q of the mechanical oscillator: higher Q correlating to a longer ringdown signal.
- the computer [90] serves two purposes: combined with the A/ D converter, it enables manipulation of the data in the frequency sweep and ringdown methods. Secondly, the computer serves as a controller for the tone burst generator [80] and the T/R switch [70].
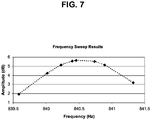
- the frequency sweep method does map out a portion of the frequency response function immediately around resonance, as shown in Figure 7 .
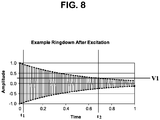
- This measurement is made by driving the mechanical oscillator at specific frequencies near resonance. By operating in a transceive mode, the amplitude at the drive frequency is measured. The measurement is made by computing the root mean square (rms) signal level over a time interval that initiates after a fixed time (t 1 in Figure 8 ) after the excitation terminates.
- the frequency scale for Figure 8 is the excitation frequency.
- the interval for computing the rms signal level ends at time t 2 in Figure 8 .
- Time t 2 is selected so that the amplitude of the ringdown signal is not significantly impacted by any background noise.
- Additional drive frequencies are algorithmically selected to map out the oscillator response immediately around the resonance frequency ( Figure 7 ). The time period t 1 to t 2 remains approximately constant for all applied frequencies and represents a fixed number of whole cycles.
- the first applied frequency is either the initial resonance estimate or the previously determined measured resonance frequency. This frequency is denoted below as f o . Subsequent frequencies are alternatively selected higher and lower than this frequency to map out amplitudes in the vicinity of the resonance.
- the harmonic oscillator curve fit described previously is applied to the data to determine resonance frequency and Q. If the curve fit does not satisfy the conditions listed in Appendix 1, additional drive frequencies are added to generate more points for the curve fitting process. With this algorithm, it is not necessary to actually drive the oscillator at its resonance frequency to determine the exact resonance or Q. The resonance frequency is determined by the curve fit.
- the frequency sweep method is more noise immune than the FFT method in cases where the assumption of exciting the mechanical oscillator more than the flow excitation is satisfied.
- Figure 9 compares results from the FFT method to the frequency sweep method. This example is from a 1 liter reactor with a stirrer operating at approximately 300 rpm. The temperature is fixed at 287°C (550°F) so the primary noise is from the fluid flow by stirring. The Figure 9 results show a much reduced variability for the frequency sweep method compared to the FFT method.
- the FFT method with a resolution of 0.05 Hz and 400 averages requires 8000 seconds to compute each resonance frequency estimate.
- the frequency sweep method applies 10 averages to compute each amplitude plotted in Figure 8 and can compute a resonance frequency estimate in approximately 300 seconds.
- the ring-down approach uses the same data as the frequency sweep method.
- the drive signal for ring-down is the same tone burst used for the frequency sweep method.
- This ring-down signal is the same signal used in the frequency sweep method.
- the value for t 2 ( Figure 8 ) is selected so that the ring-down signal is not compromised by passive background noise.
- the frequency is computed by counting the number of zero crossings that occur between t 1 and t 2 . Since the mechanical oscillator vibrates at it resonance frequency, it is not necessary that the drive frequency matches the true resonance frequency. However, the signal to noise ratio benefits when the drive frequency is close to the true resonance frequency.
- Q 4.34 ⁇ 2 ⁇ ⁇ ⁇ fo D
- the decay rate parameter D is computed by fitting a linear regression to rms amplitude decibel (dB) data.
- the rms amplitude is computed on a per cycle basis, where the start of a cycle is defined as a transition from positive to negative signal in Figures 10a /b and the end of the cycle is defined as the last point before the next positive to negative transition. In cases of more signal variability, it can be beneficial to increase the computational time period to several cycles.
- Figures 11a /b compare the results of the ring-down method to the FFT method.
- Figure 11a compares the resonance frequencies and
- Figure 11b compares the resonance Qs.
- the data for Figures 9a /b and 11a/b were all collected at the same time for the same reactor.
- Figure 11a /b show a much reduced variability for the ringdown method compared to the FFT method.
- the ring-down data for Figures 11a /b are the same data collected during the same 300 second time period required for the collection of the frequency sweep method.
- Figures 9a /b and Figures 11a /b demonstrate the improved noise immunity for the time domain methods compared to the FFT method for situations where the variability has zero bias.
- zero bias implies that the frequency and Q should be stable over the time period of the measurement.
- the data collection conditions for Figures 9 and 11 should exhibit a high degree of stability for the resonance conditions of the mechanical oscillator.
- the reduced data acquisition time for the time domain methods is preferable in situations where factors affecting the resonance parameters may be variable with a non-zero bias.
- the other advantage of the time domain method is that it provides 2 independent data analysis methods for computing the resonance parameters without increasing the data collection time.
- the frequency sweep and ringdown methods are also amenable for successive, recursive, automated implementation.
- the primary difference for these time domain methods is that the starting frequency for the signal generator [70] is the previously determined resonance frequency
- One approach for implementing the time and frequency domain methods described above is to use the previously determined frequency and Q as the starting point for finding the next values.
- this approach is generally reliable for the FFT frequency domain method, there are cases where changes in noise may temporarily compromise the time domain measurement.
- An example of such a situation is when one or more parameters changes very rapidly during the data collection interval. In such cases, the resulting time domain measurement may be completely erroneous because of varying amplitudes and frequency smearing.
- this problem is resolved by using the frequency domain results as the starting point for the next time domain search computation.
- this sort of dual domain data collection may not always be necessary, and it can be made available on an as needed basis.
- the data shown in Figures 9 and 11 are for mechanical tuning fork oscillators with a length scale of a few inches and corresponding resonance frequencies on the order of 1000Hz and Qs in the range of 200-5000. Data are also available for microcantilevers with length scales on the order of tens to hundreds of microns (1 ⁇ 10 ⁇ -6 meters). Typical resonance frequencies for such oscillators are 10- 300KHz, and Q's in the range of 200-500. These tuning forks can operate either with passive or active actuation with the signal collected in the methods mentioned above.
Landscapes
- Physics & Mathematics (AREA)
- General Physics & Mathematics (AREA)
- Life Sciences & Earth Sciences (AREA)
- General Health & Medical Sciences (AREA)
- Immunology (AREA)
- Signal Processing (AREA)
- Health & Medical Sciences (AREA)
- Chemical & Material Sciences (AREA)
- Analytical Chemistry (AREA)
- Biochemistry (AREA)
- Engineering & Computer Science (AREA)
- Pathology (AREA)
- Environmental Sciences (AREA)
- Biodiversity & Conservation Biology (AREA)
- Ecology (AREA)
- Mathematical Physics (AREA)
- Environmental & Geological Engineering (AREA)
- Spectroscopy & Molecular Physics (AREA)
- Measurement Of Mechanical Vibrations Or Ultrasonic Waves (AREA)
- Testing Resistance To Weather, Investigating Materials By Mechanical Methods (AREA)
Description
- The present invention relates to mechanical oscillators for the measurement of corrosion and/or deposition. In particular, the invention relates to the determination of the resonance parameters of a mechanical oscillator in the presence of noise.
- There is prior art on the use of the resonance parameters of mechanical oscillators to measure corrosion and/or deposition. To determine small changes in these corrosion and/or deposition parameters, it is necessary to reliably measure small variations of the resonance parameters. However, noise often compromises the consistency in determining resonance parameters. The prior art does not disclose the determination of the resonance parameters in the presence of noise.
-
US 2007/0199379 A1 describes a mechanical oscillator loss sensor for use in a corrosive or erosive environment. The elements include a means for mechanical excitation, and a mechanical oscillator with two regions that corrode differently, where the regions are determined to affect specific influences on the resonance parameters, wherein said mechanical oscillator has a resonant frequency, f, and a quality factor, Q. In a preferred embodiment, the mechanical oscillator has the shape of a tuning fork.US 2006/0037399 A1 describes a method for inferring possible or impending corrosion or fouling of process elements from fluid flowing in a pipe of an industrial process. A frequency response of a body is measured. The measured frequency response is compared against a stored value. Corrosion or fouling of the process elements is identified based upon the comparison between the measured frequency response and the stored value. - The prior art describes the application of mechanical oscillators for the measurement of corrosion and/or deposition. Mechanical oscillators employ the use of resonance parameters, frequency and the quality factor Q, for the measurement of corrosion or deposition. However, the prior art does not consider the required precision for measuring frequency or Q in the presence of noise to make these measurements. In particular, the ability of the mechanical oscillator to measure small amounts of metal loss or deposition is not only dependent upon the mechanical design but is limited by the precision in determining the resonance frequency and Q. The present invention is related to methods for measuring these resonance parameters with a high precision in the presence of noise. This degree of precision is required to maximize the utility of these devices as sensitive probes for corrosion and deposition (fouling) measurement.
- The invention provides a method for determining resonance parameters, resonance frequency f and quality factor Q, for a mechanical oscillator in a service fluid environment in the presence of noise produced by the service fluid as set out in
claim 1 below. Preferred optional features are set out in the dependent claims. - The present disclosure includes three methods for determining resonance parameters: Fast Fourier Transform (FFT) (passive method); frequency sweep (time domain active method); and ring-down (time domain active method). All of the embodiments described herein employ curve fitting consistent with modeling the mechanical oscillator as a simple harmonic oscillator. This curve fitting procedure, combined with averaging and utilizing signal processing parameters to mitigate noise effects, adds considerable precision in measuring resonance parameters.
-
-
Figure 1 depicts a mechanical oscillator with a piezo-electric transducer. -
Figure 2 shows the hardware arrangement for data capture and analysis in the frequency domain. -
Figure 3a shows Frequency Domain Result via FFT over the Full Spectrum. -
Figure 3b shows the Frequency Domain Result via FFT in the vicinity of the resonance of the mechanical oscillator; A-area of fundamental resonance. -
Figure 4a shows the FFT Derived Response in the Vicinity of the Mechanical Oscillator Resonance Frequency; Search range restricted to the frequency range defined by Δf. -
Figure 4b shows the FFT Derived Response in the Vicinity of the Mechanical Oscillator Resonance Frequency Including a Curve Fit Representing a Simple Harmonic Oscillator; 1- original data; 2- curve fit. -
Figure 4c illustrates the order for selecting the frequencies for the time domain method algorithm outlined inAnnex 1. The number at each point indicates the order in which the algorithm selected the excitation frequency. -
Figure 5 shows the hardware arrangement for data capture and analysis in the time domain: [10] - Mechanical Oscillator; [70] - Transmit/Receive Switch; [20] - Pre-amplification; [30] - Bandpass Filter (optional); [90] - A/D and analysis hardware; [80] - Tone Burst Signal Generator. -
Figure 6a shows a representative time domain excitation tone burst electrical signal used to drive the mechanical oscillator. -
Figure 6b shows the time domain response of the mechanical oscillator to the applied tone burst signal ofFigure 6a ; Example ring-down after excitation. -
Figure 7 shows the result of the frequency sweep in the vicinity of the resonance (Frequency sweep maps out a portion of the frequency response immediately around resonance). -
Figure 8 provides the definitions of the time domain ring-down signal: Time domain signal and parameters used to compute the resonance parameters using the ring-down embodiment:- t1 = fixed delay after excitation stops prior to data collection to minimize aberrations from the excitation
- "Ringdown min voltages": V1 = voltage must be above this level for cycle to be considered as an acceptable time domain signal
- T2 = time at which V1 occurs
- Minimum number of ring-down cycles between t and t2 for signal to be considered as an acceptable time domain.
-
Figures 9a /b compare the FFT result with the frequency sweep method: (a) the resonance frequency and (b) the resonance Q. -
Figure 10a /b illustrate how the time domain decay parameter, D, is computed.Fig. 10a - Example of computing RMS Results to compute Q from ring-down;Fig. 10b - Expanded detail for Data inFigure 10a . -
Figures 11ab compare the FFT result with the ring-down method: (a) the resonance frequency and (b) the resonance Q. - Prior art has disclosed and described the application of mechanical oscillators for: measuring fouling deposition; measuring metal loss; and service fluid properties such as density or viscosity. The ability to measure these parameters is linked to the precision and accuracy of measuring the resonance parameters of Q (the quality factor) and the resonance frequency of the mechanical oscillator. The measurement of these resonance parameters may be compromised by the presence of noise. In some cases, the noise may be the inherent measurement reproducibility caused by limitations of the electrical instrumentation. In other cases, noise may be introduced by the environmental effects presented to the mechanical oscillator. These variations are caused by changes in the service environment surrounding the mechanical oscillator. Examples of environmental variables include changes in service fluid density, viscosity, temperature, flow, pressure. For applications directed at measuring service fluid properties (such as viscosity), the prior art identifies algorithms to account for changes in temperature and/or density that occur from a base case calibration. Even for the case where the aforementioned environmental parameters are invariant, fluid flow provides random excitation and relaxation to the mechanical oscillator such as the tines of a tuning fork. These successive excitations and relaxations randomly impact the tines with random phase. This randomness can cause very minor variations in the apparent resonance frequency that would not be observed in the absence of fluid flow. The result is added noise to the measurement of the resonance parameters.
- What is absent in the prior art is a methodology to accurately account for the following two separate situations: 1) random variations that occur during the measurement of resonance parameters; and 2) biased drifts in the resonance parameters that smear their determination if the measurement time is sufficiently long to permit a significant drift of the resonance parameters.
- The prior art documents the ability to apply signal averaging as a means to reduce variability from noise. Although signal averaging is beneficial and is included in the strategy of this invention, it has negative impact of introducing additional noise. Additional noise is introduced because averaging inherently requires an increase in the time required to collect the data. In cases where the noise is correlated with a process variable (such as a biased increase in temperature), the measurement of the resonance parameters will also be biased. This invention discloses embodiments that enable a reduction of the measurement time to reduce this averaging bias.
- The prior art also discloses the possibility of using active excitation frequency sweep methods for measuring the resonance parameters. However, those methods do not consider the presence of noise and can be tedious (time consuming) since they require that the excitation frequency precisely match the resonance frequency. Such methods typically define resonance as the excitation frequency causing maximum oscillator amplitude or minimum excitation current draw. The instant invention does not require that the electrical excitation frequency match the actual resonance of the mechanical oscillator.
- Mechanical oscillators have been used for the measurement of corrosion and/or deposition. However, the accuracy of the measurements depends on the presence of noise from the medium, such as flow, viscosity, and temperature. The present invention reduces the noise impact of measuring the resonance parameters with three methods. One of the methods uses fast fourier transform (FFT) and the other two use time domain (frequency sweep and ring-down) techniques. The ability to determine the resonance parameters in the presence of noise also enables their automated determination. Accordingly, it is then able to fit the mechanical oscillator with a hardware/software system that enables automated successive determination of the resonance parameters. These methods are described below.
- The assumption for this method is that the flow of the service fluid provides the mechanical excitation of the oscillator. As such, this FFT approach is said to be operating passively since there is no external electrical excitation to the mechanical oscillator. As shown in
Figure 1 , the passive signal is provided by transducer [5] attached to the mechanical oscillator [8] that converts the mechanical energy to an electrical signal. The selected transducer type (e.g. piezo, inductive, displacement sensor etc.) has little impact on the methodology described in this invention. An FFT is computed over the desired frequency range using a pre-selected frequency resolution. Filtering in the time and frequency domains combined with frequency domain averaging provide considerable smoothing of the resonance peak. Although increasing resolution and averaging may be directionally beneficial, each has the undesirable effect of increasing the data collection time. Increasing the data collection time increases frequency domain smearing for systems where the resonance parameters are not time invariant.Figure 2 shows the typical hardware used for the frequency domain FFT-derived response. The electrical output signal [10] of the mechanical oscillator typically needs amplification prior to subsequent signal analysis. In the case where a piezo device is used to transform the mechanical energy into electrical energy, preamplifier [20] is typically a charge type amplifier. The output of preamplifier [20] will drive some degree of analog filtering. Bandpass filter [30] preceding the analog to digital (A/D) [50] conversion for computing the FFT is a well-known method for reducing noise that is not in the immediate vicinity of the resonance frequency. Bandpass filtering not only provides relief from low frequency noise (such as 60 Hz interference) but also provides high pass anti-aliasing filter required prior to the analog to digital conversion. Depending on the particular hardware, an optional amplifier [40] might be required ahead of the FFT analyzer [50] which includes an analog to digital (A/D) converter. After A/D conversion, additional digital filtering can supplement noise suppression available in computer processor [60]. However, none of these filters will have the capability to suppress noise in the immediate vicinity of the mechanical resonance. Algorithms implemented by the computer [60] enable the curve fitting and computation of the resonance parameters. - Increasing the number of averages increases the required data collection time in proportion to the number of averages. In cases where very fine frequency resolution is required, the FFT resolution step size must be reduced. This action also increases the data collection time in direct proportion to the step size reduction.
-
Figure 3a shows an example of the FFT-derived frequency domain spectrum. These data were collected in a stirred reactor where the liquid temperature was 287°C (550°F) and the stirring speed was 300 rpm. For this case, the FFT resolution step size is 0.05Hz and 400 frequency domain averages were used to make the average shown inFigure 3a . The resolution step size of 0.05 Hz dictates that the time required for collection of a single FFT spectrum is 20 seconds (1/0.05). Therefore, 2000 seconds are required to collect sufficient spectra for 100 averages. An analog bandpass filter with a passband range of 820-850 Hz was employed as shown inFigure 2 . Although the filter frequency roll-off is 6dB/octave, it was not sufficient to suppress several extraneous amplitude peaks that are not directly related to the fundamental mechanical resonance. -
Figure 3b presents the spectrum ofFigure 3a in more detail around the resonance frequency of the mechanical oscillator. The resonance frequency of the mechanical oscillator in this environment was independently determined using the time domain methods subsequently described that provide considerably reduced noise. In order to prevent other extraneous high amplitude peaks to be mistaken for the resonance (such as the one at 820 Hz inFigure 3b ) a bounded search range is specified encompassing the frequency of the most probable resonance. For mechanical oscillators with Q's in the range of 200-4000 and resonance frequencies between 500-1500Hz, experience indicates that a search range 2-20 Hz as being satisfactory. The search range is centered on the most recently determined or estimated resonance frequency. The search range parameters (Δf) for this example are shown inFigure 4a . As can be observed, the environmental conditions associated with the results presented inFigure 3b show that the exact resonance frequency cannot be accurately determined by inspection. Although those data shown inFigure 4a do indicate that the resonance appears to be in the vicinity of 840-842 Hz, it is not clear if the maximum amplitude is actually the true resonance. Algorithmically, one could use the rule to select the frequency corresponding to the peak amplitude in that range. However, that rule is problematic when it is desired to make a measurement that will not be dependent upon very small shifts in the frequency response at the resonance that are attributable to noise. Because of variability of flow noise, the frequency corresponding to the peak amplitude in the 840-842 Hz range is variable. - Repeated testing at the conditions that created the
Figure 3b results shows that the approximate resonance range is exceptionally consistent but the spectral details within the 840-842 Hz range are variable. That observation motivates the selection of resonance frequency by applying a curve fit to the averaged FFT spectra. The variability in selecting the peak amplitude can be minimized by using the fitted curve to estimate the resonance parameters rather than making that selection from the actual the data.Figure 4b shows the result of using a curve fit based on the harmonic oscillator (see the following equations).
- a (Amplitude) and b are free parameters used in the curve fitting process
- f0= the resonance frequency determined by the curve fitting
- Q = the quality factor = fo/(f2-f1) where f1, f2 are the half
power points 

- f = the frequency parameter
- The resonance frequency is determined by finding the maximum amplitude of the curve fit. For the 2nd order system, the parameters a (Amplitude), fo, and b are free parameters available for a best-fit adjustment. In the
Figure 4b example, a best fit is obtained by using commonly available search algorithms to minimize the error between the average spectral data and the harmonic oscillator fit. Since the parameters of interest are defined at resonance, the curve is fit only to data within 5 dB of the maximum spectral amplitude. As shown inFigure 4b , the resonance quality factor Q is computed by the computation of the 3 dB (half power) points of the harmonic oscillator curve. - In contrast to the previously described FFT method, the time domain methods require the application of an external electrical excitation. The hardware for the time domain methods, including the electrical excitation, is shown in
Figure 5 . The primary hardware differences between the time domain and the previously described frequency domain set-up are the added transmit/receive (T/R) switch [70] and the required signal generator [80]. Moreover, the time domain method does not use FFT hardware nor does it compute the full frequency response. Signal generator [80] provides the electrical excitation to the transducer (Figure 2 , item [5]) in the mechanical oscillator. T/R switch [70] connects the mechanical oscillator to the signal generator while the tone burst is active and changes the connection of the mechanical oscillator to the A/D and analysis hardware [90] when the tone burst signal is off. In some embodiments it is possible to forgo a T/R switch. - The Frequency Sweep Method and Ring-Down Method are considered time domain methods since there is no explicit computation or measurement of the full frequency response. Both methods employ averaging by computing each data point in the resonance calculation several times at the same frequency. The primary advantage of the time domain methods compared to the FFT method is their improved stability and precision. However, this advantage is only maintained if the mechanical oscillator can be driven at a sufficient level so that its forced excitation signal is greater than the passive signal, if any.
- One approach for selecting the frequencies of the frequency sweep method is to excite the mechanical oscillator at equally spaced successively higher frequencies. Although this approach will generate a satisfactory frequency response, it may require the use of many frequencies. Consequently, the time to generate the frequency response may be unacceptable in the presence of variable noise. The algorithm shown in
Annex 1 andFigure 4c is an approach to significantly reduce the number of frequencies required for the frequency sweep method. - Recursive application of the methods described in
Figures 3 and4a ,4b ,Annex 1 enables successive and automated computation of the resonance parameters. This capability enables the mechanical oscillator to be used in applications where continual and unattended computations of the resonance parameters are required. Typically, the frequency range to search for the new resonance frequency will be centered around the most recently determined resonance frequency. Examples of applications benefiting from successive, automated measurements include corrosion and fouling monitoring. - In some embodiments, it may be desirable for the time domain methods to operate using a lock-in amplifier. Lock-in amplifiers are well-known devices where the bandpass frequency of the receiving electronics is narrowly matched to electronic excitation frequency. Although lock-in amplifiers may be most advantageous for low Q devices where there is high background noise, the benefit should be assessed for mechanical oscillators which are typically high Q.
- The electrical excitation may be a tone burst signal as shown in
Figure 6a . The tone burst in this example consists of a sine wave signal whose frequency is in the vicinity of resonance of the mechanical oscillator. The amplitude and length of the burst signal should be sufficient to activate the mechanical oscillator to a level greater than provided by the flow of the service fluid. For the frequency and Q ranges described for FFT operation, a typical duration range for the burst signal is 100-5000 cycles with an off period of 0.5 to 10 seconds. Although the burst signal in this example is sine wave, alternatively, it can be a square wave or a series of pulses. A benefit of the time domain method is that erroneous resonances (such as the peak in theFigure 3b FFT at 820 Hz) cannot be energized. - In addition to the tone burst generator [80], time domain operation may include a transmit/receive switch (T/R switch) [70] as shown in
Figure 5 . The purpose of the T/R switch is to change the connection of the transducer in the mechanical oscillator to either the tone burst signal generator or to the receiving circuit. A T/R switch would not be required in applications where the hardware receiving circuit can accommodate the strong signal produced during the transmit cycle. The actual signal used by the time domain method occurs after the tone burst stops (denoted as the ringdown signal ofFigure 6b ). This ringdown signal has the frequency equal to the resonance of mechanical oscillator. Its amplitude is a function of the frequency of the burst signal. The amplitude is greatest when the frequency of the burst signal is equal to the resonance frequency of the mechanical oscillator. The decay time of the ringdown signal is related to the Q of the mechanical oscillator: higher Q correlating to a longer ringdown signal. - The computer [90] serves two purposes: combined with the A/ D converter, it enables manipulation of the data in the frequency sweep and ringdown methods. Secondly, the computer serves as a controller for the tone burst generator [80] and the T/R switch [70].
- The frequency sweep method does map out a portion of the frequency response function immediately around resonance, as shown in
Figure 7 . This measurement is made by driving the mechanical oscillator at specific frequencies near resonance. By operating in a transceive mode, the amplitude at the drive frequency is measured. The measurement is made by computing the root mean square (rms) signal level over a time interval that initiates after a fixed time (t1 inFigure 8 ) after the excitation terminates. The frequency scale forFigure 8 is the excitation frequency. The interval for computing the rms signal level ends at time t2 inFigure 8 . Time t2 is selected so that the amplitude of the ringdown signal is not significantly impacted by any background noise. Additional drive frequencies are algorithmically selected to map out the oscillator response immediately around the resonance frequency (Figure 7 ). The time period t1 to t2 remains approximately constant for all applied frequencies and represents a fixed number of whole cycles. - The first applied frequency is either the initial resonance estimate or the previously determined measured resonance frequency. This frequency is denoted below as fo. Subsequent frequencies are alternatively selected higher and lower than this frequency to map out amplitudes in the vicinity of the resonance. This algorithm deploys a search routine using the estimated or previously measured Q to determine the frequency step size. Step sizes around this estimated resonance frequency or previously measured resonance frequency are determined as follows:

- Δf = frequency step parameter
- fo = estimated resonance frequency or previously measured resonance frequency
- Q = estimated quality factor or previously measured quality factor
- After the applying the electrical excitation at the five frequencies identified above, the corresponding rms amplitude at each frequency is determined. Using these amplitudes and frequencies, the harmonic oscillator curve fit described previously is applied to the data to determine resonance frequency and Q. If the curve fit does not satisfy the conditions listed in
Appendix 1, additional drive frequencies are added to generate more points for the curve fitting process. With this algorithm, it is not necessary to actually drive the oscillator at its resonance frequency to determine the exact resonance or Q. The resonance frequency is determined by the curve fit. - The frequency sweep method is more noise immune than the FFT method in cases where the assumption of exciting the mechanical oscillator more than the flow excitation is satisfied.
Figure 9 compares results from the FFT method to the frequency sweep method. This example is from a 1 liter reactor with a stirrer operating at approximately 300 rpm. The temperature is fixed at 287°C (550°F) so the primary noise is from the fluid flow by stirring. TheFigure 9 results show a much reduced variability for the frequency sweep method compared to the FFT method. The FFT method with a resolution of 0.05 Hz and 400 averages requires 8000 seconds to compute each resonance frequency estimate. In contrast, the frequency sweep method applies 10 averages to compute each amplitude plotted inFigure 8 and can compute a resonance frequency estimate in approximately 300 seconds. - The ring-down approach uses the same data as the frequency sweep method. The drive signal for ring-down is the same tone burst used for the frequency sweep method. This ring-down signal is the same signal used in the frequency sweep method. Similar to the frequency sweep method, the value for t2 (
Figure 8 ) is selected so that the ring-down signal is not compromised by passive background noise. For the ring-down approach, the frequency is computed by counting the number of zero crossings that occur between t1 and t2. Since the mechanical oscillator vibrates at it resonance frequency, it is not necessary that the drive frequency matches the true resonance frequency. However, the signal to noise ratio benefits when the drive frequency is close to the true resonance frequency. - Using the approaches described above for computing the resonance frequency via ring-down and frequency sweep, data that follow demonstrate that the ring-down approach provides less variability. That observation is attributed to directionally more averaging associated with the ring-down computation than the frequency sweep computation. As described previously, both methods use the same data. For example presented in
Figure 7 , eight points are used to define the curve fit for the frequency sweep method. After fitting the curve, the equation inFigure 6 is used to compute the resonance frequency. In contrast, the ring-down method computes the average frequency measured from each of the ringdowns used in the data forFigure 7 . InFigure 7 each point is computed from 10 ring-downs. Therefore, the resonance frequency for the ring-down method uses the average of 80 ring-downs to compute the resonance frequency (8points X 10 ring-downs per point). - The value of Q is determined by curve fitting a linear regression to the envelope of the ring-down signal.

- where π = 3.14159....
- D = decay rate (dB/second) as shown in
Figures 10a /b - fo = resonance frequency (determined by zero crossings)
- As shown in
Figures 10a /b, the decay rate parameter D is computed by fitting a linear regression to rms amplitude decibel (dB) data. In this example, the rms amplitude is computed on a per cycle basis, where the start of a cycle is defined as a transition from positive to negative signal inFigures 10a /b and the end of the cycle is defined as the last point before the next positive to negative transition. In cases of more signal variability, it can be beneficial to increase the computational time period to several cycles. - Similar to
Figures 9a /B,Figures 11a /b compare the results of the ring-down method to the FFT method.Figure 11a compares the resonance frequencies andFigure 11b compares the resonance Qs. The data forFigures 9a /b and 11a/b were all collected at the same time for the same reactor.Figure 11a /b show a much reduced variability for the ringdown method compared to the FFT method. The ring-down data forFigures 11a /b are the same data collected during the same 300 second time period required for the collection of the frequency sweep method. -
Figures 9a /b andFigures 11a /b demonstrate the improved noise immunity for the time domain methods compared to the FFT method for situations where the variability has zero bias. In this case, zero bias implies that the frequency and Q should be stable over the time period of the measurement. To within experimental stability, the data collection conditions forFigures 9 and11 should exhibit a high degree of stability for the resonance conditions of the mechanical oscillator. The reduced data acquisition time for the time domain methods is preferable in situations where factors affecting the resonance parameters may be variable with a non-zero bias. The other advantage of the time domain method is that it provides 2 independent data analysis methods for computing the resonance parameters without increasing the data collection time. - Similar to the frequency domain FFT method, the frequency sweep and ringdown methods are also amenable for successive, recursive, automated implementation. The primary difference for these time domain methods is that the starting frequency for the signal generator [70] is the previously determined resonance frequency
- One approach for implementing the time and frequency domain methods described above is to use the previously determined frequency and Q as the starting point for finding the next values. Although this approach is generally reliable for the FFT frequency domain method, there are cases where changes in noise may temporarily compromise the time domain measurement. An example of such a situation is when one or more parameters changes very rapidly during the data collection interval. In such cases, the resulting time domain measurement may be completely erroneous because of varying amplitudes and frequency smearing. According to the invention, this problem is resolved by using the frequency domain results as the starting point for the next time domain search computation. In an example not forming part of the invention, this sort of dual domain data collection may not always be necessary, and it can be made available on an as needed basis.
- The data shown in
Figures 9 and11 are for mechanical tuning fork oscillators with a length scale of a few inches and corresponding resonance frequencies on the order of 1000Hz and Qs in the range of 200-5000. Data are also available for microcantilevers with length scales on the order of tens to hundreds of microns (1 ∗ 10^-6 meters). Typical resonance frequencies for such oscillators are 10- 300KHz, and Q's in the range of 200-500. These tuning forks can operate either with passive or active actuation with the signal collected in the methods mentioned above. - Algorithm for Determining the Excitation Frequencies around the Resonance
- 1) Start with Estimated Primary Frequency (Hz) and Estimated Q Value (EstF0 and EstQ)
- 2) Compute

- 3) Collect signal at 5 frequencies: EstF0, EstF0± ¼ΔF, EstF0 ± ½ΔF
- 4) Loop: Remove any data points that is less than 10 % of maximum signal
- 5) Fit data (frequency and power which is square of signal) with

- 6)
Compute 

- 7) If there is no data point between


- 8) If there is no data point between


- 9) If there is no data point between


- 10) If there is no data point between


- 11) If there is no data point between


- 12) If there is no data point between


- 13) If there is no data point between


- 14) CollectNextPoint: Stop if next frequency is not set
- 15) Collect data at next frequency
- 16) Stop if number of data points is equal to or larger than Max TD Pts
- 17) Go to Loop
± Δf/4; ± Δf/2
Claims (8)
- A method for determining resonance parameters, resonance frequency f and quality factor Q, for a mechanical oscillator (8) in a service fluid environment in the presence of noise produced by the service fluid, the method comprising:a) estimating the resonance parameters, f and Q, for a mechanical oscillator (8) in a service fluid environment based on an excitation of the mechanical oscillator by a flow of the service fluid, the estimate of the resonance parameters being determined from the steps of determining a fast Fourier transform of oscillator amplitude as a function of frequency, wherein said estimate of the resonance parameters is determined from averaging the fast Fourier transform run multiple times;b) exciting the mechanical oscillator (8) in the service fluid environment using a signal generator at one or more excitation frequencies selected based on the estimated resonance parameters, f and Q, the service fluid environment producing noise that causes an excitation;c) determining an amplitude response of the oscillator (8) to said exciting of the oscillator (8) at the one or more excitation frequencies; andd) determining the resonance parameters, f and Q, from said amplitude response with multiple measurements, curve fitting and averaging.
- The method of claim 1 wherein the determination of step c) is accomplished with a digital computer.
- The method of claim 1 wherein f and Q are determined from the steps of terminating the excitation at the one or more excitation frequencies produced by said signal generator so that the amplitude of said oscillator decreases from which amplitude as a function of excitation frequency is determined repeating this step so as to obtain an average value of f and Q.
- The method of claim 1 wherein f and Q are determined from the steps of terminating the excitation at the one or more excitation frequencies produced by said signal generator so that the amplitude of said oscillator decreases, obtaining f from the crossing of the amplitude of zero and Q from the decline of the amplitude, repeating the above steps to obtain an average value for f and Q.
- The method of claim 4 wherein f and Q are determined from a ringdown signal.
- The method of claim 3 wherein f and Q are determined from a frequency sweep signal.
- The method of claim 1 applied recursively to determine f and Q as a function of time.
- The method of claim 1 where the one or more signal generator excitation frequencies are algorithmically selected based on the estimated resonance parameters to minimize the required number of frequencies.
Applications Claiming Priority (3)
| Application Number | Priority Date | Filing Date | Title |
|---|---|---|---|
| US26932909P | 2009-06-23 | 2009-06-23 | |
| US12/792,500 US8676543B2 (en) | 2009-06-23 | 2010-06-02 | Determining the resonance parameters for mechanical oscillators |
| PCT/US2010/039108 WO2011005454A2 (en) | 2009-06-23 | 2010-06-18 | Determining the resonance parameters for mechanical oscillators |
Publications (2)
| Publication Number | Publication Date |
|---|---|
| EP2446234A2 EP2446234A2 (en) | 2012-05-02 |
| EP2446234B1 true EP2446234B1 (en) | 2020-03-11 |
Family
ID=43355033
Family Applications (1)
| Application Number | Title | Priority Date | Filing Date |
|---|---|---|---|
| EP10728984.5A Active EP2446234B1 (en) | 2009-06-23 | 2010-06-18 | Determining the resonance parameters for mechanical oscillators |
Country Status (7)
| Country | Link |
|---|---|
| US (1) | US8676543B2 (en) |
| EP (1) | EP2446234B1 (en) |
| JP (1) | JP5409907B2 (en) |
| AU (1) | AU2010271044B2 (en) |
| CA (1) | CA2764416C (en) |
| SG (1) | SG176533A1 (en) |
| WO (1) | WO2011005454A2 (en) |
Families Citing this family (14)
| Publication number | Priority date | Publication date | Assignee | Title |
|---|---|---|---|---|
| WO2012152328A1 (en) * | 2011-05-11 | 2012-11-15 | Siemens Aktiengesellschaft | System and method for determining a natural frequency of an ultrasonic transducer |
| IN2014DN09377A (en) | 2012-04-10 | 2015-07-17 | Corinthian Ophthalmic Inc | |
| US9539604B2 (en) * | 2012-05-15 | 2017-01-10 | Eyenovia, Inc. | Ejector devices, methods, drivers, and circuits therefor |
| US10502677B2 (en) | 2013-10-14 | 2019-12-10 | Exxonmobil Research And Engineering Company | Detection of corrosion rates in processing pipes and vessels |
| GB2540338A (en) * | 2015-05-18 | 2017-01-18 | Rosemount Measurement Ltd | Improvements in or relating to field devices |
| BR112018003357B1 (en) * | 2015-08-28 | 2021-09-28 | Micro Motion, Inc. | SIGNAL GENERATION METER AND METHOD |
| CN105784103B (en) * | 2016-01-22 | 2019-01-29 | 北京航空航天大学 | A kind of frequency characteristic measurement method of the change signal-to-noise ratio based on nonlinear frequency modulation excitation |
| JP2017146277A (en) * | 2016-02-19 | 2017-08-24 | 株式会社ショーワ | Weight controller, program, and vehicle |
| DE102016006989A1 (en) * | 2016-06-07 | 2017-12-07 | Daimler Ag | Method for controlling at least two mechanical oscillators |
| DE102016120454B4 (en) * | 2016-10-26 | 2025-05-28 | Bundesrepublik Deutschland, Vertreten Durch Den Bundesminister Für Wirtschaft Und Energie, Dieser Vertreten Durch Den Präsidenten Der Bundesanstalt Für Materialforschung Und -Prüfung (Bam) | Method and device for examining a sample and its use |
| CN109238308B (en) * | 2018-10-31 | 2022-04-12 | 中国船舶重工集团公司第七0七研究所 | High-precision modal testing system and method for metal cylindrical resonant gyroscope |
| US11714039B2 (en) * | 2020-11-06 | 2023-08-01 | Saudi Arabian Oil Company | Device and method to obtain the viscosity of polymer fluids used for enhanced oil recovery |
| EP4362808A4 (en) | 2021-06-29 | 2025-05-14 | OtoNexus Medical Technologies, Inc. | METHODS AND SYSTEMS FOR DETERMINING CMUT RESONANCE |
| CN115060355B (en) * | 2022-04-12 | 2024-03-26 | 东南大学 | Harmonic oscillator quality factor measurement method based on linear frequency modulation pulse |
Citations (1)
| Publication number | Priority date | Publication date | Assignee | Title |
|---|---|---|---|---|
| WO2010065131A2 (en) * | 2008-12-05 | 2010-06-10 | Anasys Instruments | High frequenct deflection measurement of ir absorption |
Family Cites Families (39)
| Publication number | Priority date | Publication date | Assignee | Title |
|---|---|---|---|---|
| US3253219A (en) | 1961-06-01 | 1966-05-24 | Union Oil Co | Method using change of piezoelectric crystal frequency to determine corrosion rate and apparatus therefor |
| US3903732A (en) | 1974-06-17 | 1975-09-09 | Honeywell Inc | Viscosimeter and densitometer apparatus |
| US4095474A (en) | 1976-07-19 | 1978-06-20 | Imperial Chemical Industries Limited | Monitoring systems and instruments |
| US4312228A (en) | 1979-07-30 | 1982-01-26 | Henry Wohltjen | Methods of detection with surface acoustic wave and apparati therefor |
| GB2079949B (en) | 1980-05-30 | 1983-11-23 | Atomic Energy Authority Uk | Improvements in or relating to the monitoring of corrosion |
| US4361026A (en) | 1980-06-24 | 1982-11-30 | Muller Richard S | Method and apparatus for sensing fluids using surface acoustic waves |
| US4696191A (en) | 1986-06-24 | 1987-09-29 | The United States Of America As Represented By The United States Department Of Energy | Apparatus and method for void/particulate detection |
| US4862384A (en) | 1987-08-03 | 1989-08-29 | Rockwell International Corporation | Method of measuring the dynamic viscosity of a viscous fluid utilizing acoustic transducer |
| US5208162A (en) | 1990-05-08 | 1993-05-04 | Purafil, Inc. | Method and apparatus for monitoring corrosion |
| US5046338A (en) | 1990-06-13 | 1991-09-10 | Ingersoll-Rand Company | Multiphase pulp washer |
| JPH0523332A (en) * | 1991-07-19 | 1993-02-02 | Hitachi Medical Corp | Probe and ultrasonic diagnosing apparatus using the same |
| JPH05203485A (en) * | 1992-01-28 | 1993-08-10 | Koichi Nakano | Method and apparatus for automatically detecting resonance frequency |
| JPH0684920B2 (en) * | 1992-09-30 | 1994-10-26 | 岩崎通信機株式会社 | Method and apparatus for detecting defect and different hardness portion |
| US5455475A (en) * | 1993-11-01 | 1995-10-03 | Marquette University | Piezoelectric resonant sensor using the acoustoelectric effect |
| US5646338A (en) | 1994-07-20 | 1997-07-08 | Betzdearborn Inc. | Deposition sensing method and apparatus |
| US6030917A (en) | 1996-07-23 | 2000-02-29 | Symyx Technologies, Inc. | Combinatorial synthesis and analysis of organometallic compounds and catalysts |
| US5852229A (en) | 1996-05-29 | 1998-12-22 | Kimberly-Clark Worldwide, Inc. | Piezoelectric resonator chemical sensing device |
| JP3853923B2 (en) * | 1997-08-29 | 2006-12-06 | 沖電気工業株式会社 | Speech synthesizer |
| US6494079B1 (en) | 2001-03-07 | 2002-12-17 | Symyx Technologies, Inc. | Method and apparatus for characterizing materials by using a mechanical resonator |
| US6247354B1 (en) * | 1998-05-13 | 2001-06-19 | The United States Of America As Represented By The Secretary Of The Army | Techniques for sensing the properties of fluids with resonators |
| JP2001074579A (en) * | 1999-09-06 | 2001-03-23 | Aisin Seiki Co Ltd | Tire pressure detection method and pressure detection device |
| GB0006758D0 (en) | 2000-03-22 | 2000-05-10 | Copipe Systems Limited | Pipeline pigging device for the non-destructive inspection of the fluid environment in a pipeline |
| US6490927B2 (en) | 2000-12-22 | 2002-12-10 | Honeywell International Inc. | Method for detecting multiple types of corrosion |
| WO2002095346A1 (en) * | 2001-05-21 | 2002-11-28 | Sensor System Co., Ltd. | Bolting tester |
| US6832179B2 (en) | 2001-06-26 | 2004-12-14 | Invensys Systems, Inc. | Evaluating a vortex flow-meter signal |
| US7043969B2 (en) | 2002-10-18 | 2006-05-16 | Symyx Technologies, Inc. | Machine fluid sensor and method |
| US6823736B1 (en) | 2002-11-20 | 2004-11-30 | The United States Of America As Represented By The Secretary Of The Navy | Nondestructive acoustic emission testing system using electromagnetic excitation and method for using same |
| RU2324171C2 (en) * | 2003-07-18 | 2008-05-10 | Роузмаунт Инк. | Process diagnostic |
| JP4121426B2 (en) * | 2003-07-18 | 2008-07-23 | 協同油脂株式会社 | Method and apparatus for measuring coefficient for vibration energy loss |
| US7866211B2 (en) | 2004-07-16 | 2011-01-11 | Rosemount Inc. | Fouling and corrosion detector for process control industries |
| US7598723B2 (en) * | 2005-02-14 | 2009-10-06 | Clemson University | Method and apparatus for detecting resonance in electrostatically driven elements |
| JP4715354B2 (en) * | 2005-07-20 | 2011-07-06 | 株式会社ジェイテクト | Bearing device |
| JP2007198799A (en) * | 2006-01-24 | 2007-08-09 | Daishinku Corp | Frequency measurement method for piezoelectric vibration parts |
| US7681449B2 (en) * | 2006-02-28 | 2010-03-23 | Exxonmobil Research And Engineering Company | Metal loss rate sensor and measurement using a mechanical oscillator |
| US7671511B2 (en) * | 2006-12-12 | 2010-03-02 | Concentris Gmbh | System for oscillating a micromechanical cantilever |
| US7779690B2 (en) | 2007-02-06 | 2010-08-24 | Campbell Scientific, Inc. | Vibrating wire sensor using spectral analysis |
| US7721605B2 (en) | 2007-06-15 | 2010-05-25 | Exxonmobil Research And Engineering Company | Mechanical oscillator activated or deactivated by a predetermined condition |
| JP2009098032A (en) * | 2007-10-17 | 2009-05-07 | Canon Inc | Oscillator device, optical deflection device, and resonance frequency detection method |
| EP2221614A1 (en) * | 2007-11-26 | 2010-08-25 | Tokyo Electron Limited | Microstructure inspecting device, and microstructure inspecting method |
-
2010
- 2010-06-02 US US12/792,500 patent/US8676543B2/en not_active Expired - Fee Related
- 2010-06-18 WO PCT/US2010/039108 patent/WO2011005454A2/en not_active Ceased
- 2010-06-18 SG SG2011088721A patent/SG176533A1/en unknown
- 2010-06-18 CA CA2764416A patent/CA2764416C/en not_active Expired - Fee Related
- 2010-06-18 AU AU2010271044A patent/AU2010271044B2/en not_active Ceased
- 2010-06-18 EP EP10728984.5A patent/EP2446234B1/en active Active
- 2010-06-18 JP JP2012517592A patent/JP5409907B2/en not_active Expired - Fee Related
Patent Citations (1)
| Publication number | Priority date | Publication date | Assignee | Title |
|---|---|---|---|---|
| WO2010065131A2 (en) * | 2008-12-05 | 2010-06-10 | Anasys Instruments | High frequenct deflection measurement of ir absorption |
Also Published As
| Publication number | Publication date |
|---|---|
| JP2012531589A (en) | 2012-12-10 |
| CA2764416C (en) | 2015-02-24 |
| US20100324852A1 (en) | 2010-12-23 |
| AU2010271044A1 (en) | 2012-01-19 |
| US8676543B2 (en) | 2014-03-18 |
| JP5409907B2 (en) | 2014-02-05 |
| WO2011005454A2 (en) | 2011-01-13 |
| CA2764416A1 (en) | 2011-01-13 |
| AU2010271044B2 (en) | 2014-10-09 |
| SG176533A1 (en) | 2012-01-30 |
| WO2011005454A3 (en) | 2011-12-01 |
| EP2446234A2 (en) | 2012-05-02 |
Similar Documents
| Publication | Publication Date | Title |
|---|---|---|
| US8676543B2 (en) | Determining the resonance parameters for mechanical oscillators | |
| US9709475B2 (en) | Method for determining and/or monitoring viscosity and corresponding apparatus | |
| CN101641582B (en) | Vibrating wire sensor using spectral analysis | |
| CN101855440B (en) | Knock signal detection in automotive systems | |
| US7275013B1 (en) | Plasma anemometer and method for using same | |
| CN101586997A (en) | Method for calculating guy cable vibrating base frequency | |
| US10401215B2 (en) | Method and device for monitoring a process variable with vibronic sensor | |
| US20230236152A1 (en) | Acoustic resonance fluid flow measurement device and method | |
| CN101360980B (en) | Method and device for detecting the position of a pulsed mechanical action on a plant component | |
| CN116222682A (en) | Vortex Street Frequency Extraction and Moisture Split-Phase Flow Measurement Method Combining Disturbance Wave-Frequency Characteristics | |
| CN104748704A (en) | Thin-walled structure ultrasonic resonance thickness measurement frequency spectrum analysis interpolation correction method | |
| CN111693136B (en) | A Frequency Estimation Algorithm for Surface Acoustic Wave Resonators Using Autocorrelation Phase Spectrum of Echo Signals | |
| CN120947959B (en) | Vibration testing method and system of millet processing equipment | |
| US10578661B2 (en) | Method for determining the quality factor of an oscillator | |
| US10746624B2 (en) | Determining the root mean square value of a machine vibration variable | |
| CN108491777A (en) | A kind of Lamb wave spatial sampling signal fitting method based on Morlet morther wavelets | |
| CN111239638B (en) | A detection method for periodic and random changes of output frequency of AC voltage source | |
| Lucena et al. | An innovative ultrasonic time of flight method based on extended Kalman filter for wind speed measurement | |
| EP4389308B1 (en) | Method and system for real-time monitoring noise squeezing effects of a nonlinear device and/or system | |
| RU2466368C1 (en) | Method of determining dynamic characteristics of tensometric pressure transducer (versions) | |
| CN109374070A (en) | A vortex flowmeter measurement method integrating on-line measurement of pipeline natural frequency | |
| Crenna et al. | Evolutionary sea state estimation for short-term forecasts | |
| CN118464138A (en) | Mass flow measurement method, system and computer storage medium | |
| Ntakpe et al. | Two-Stage Interpolation Algorithm for Precise Frequency Estimation of Vibration Signals | |
| Grechikhin | Spectral estimates of the signal parameters of laser Doppler measuring systems |
Legal Events
| Date | Code | Title | Description |
|---|---|---|---|
| PUAI | Public reference made under article 153(3) epc to a published international application that has entered the european phase |
Free format text: ORIGINAL CODE: 0009012 |
|
| 17P | Request for examination filed |
Effective date: 20120119 |
|
| AK | Designated contracting states |
Kind code of ref document: A2 Designated state(s): AL AT BE BG CH CY CZ DE DK EE ES FI FR GB GR HR HU IE IS IT LI LT LU LV MC MK MT NL NO PL PT RO SE SI SK SM TR |
|
| DAX | Request for extension of the european patent (deleted) | ||
| STAA | Information on the status of an ep patent application or granted ep patent |
Free format text: STATUS: EXAMINATION IS IN PROGRESS |
|
| 17Q | First examination report despatched |
Effective date: 20180726 |
|
| GRAP | Despatch of communication of intention to grant a patent |
Free format text: ORIGINAL CODE: EPIDOSNIGR1 |
|
| STAA | Information on the status of an ep patent application or granted ep patent |
Free format text: STATUS: GRANT OF PATENT IS INTENDED |
|
| RIC1 | Information provided on ipc code assigned before grant |
Ipc: G01N 17/04 20060101ALI20190815BHEP Ipc: G01H 13/00 20060101AFI20190815BHEP Ipc: G01N 29/46 20060101ALI20190815BHEP Ipc: G01D 1/00 20060101ALI20190815BHEP Ipc: G01D 15/00 20060101ALI20190815BHEP |
|
| INTG | Intention to grant announced |
Effective date: 20190918 |
|
| RIN1 | Information on inventor provided before grant (corrected) |
Inventor name: YABLON, DALIA Inventor name: ALVAREZ, MANUEL S. Inventor name: AKEHURST, GEORGE P. Inventor name: CHENG, CHUNG-MIN Inventor name: SCHILOWITZ, ALAN M. Inventor name: WOLF, ALAN H. |
|
| GRAS | Grant fee paid |
Free format text: ORIGINAL CODE: EPIDOSNIGR3 |
|
| GRAA | (expected) grant |
Free format text: ORIGINAL CODE: 0009210 |
|
| STAA | Information on the status of an ep patent application or granted ep patent |
Free format text: STATUS: THE PATENT HAS BEEN GRANTED |
|
| AK | Designated contracting states |
Kind code of ref document: B1 Designated state(s): AL AT BE BG CH CY CZ DE DK EE ES FI FR GB GR HR HU IE IS IT LI LT LU LV MC MK MT NL NO PL PT RO SE SI SK SM TR |
|
| REG | Reference to a national code |
Ref country code: GB Ref legal event code: FG4D |
|
| REG | Reference to a national code |
Ref country code: CH Ref legal event code: EP |
|
| REG | Reference to a national code |
Ref country code: AT Ref legal event code: REF Ref document number: 1243723 Country of ref document: AT Kind code of ref document: T Effective date: 20200315 |
|
| REG | Reference to a national code |
Ref country code: IE Ref legal event code: FG4D |
|
| REG | Reference to a national code |
Ref country code: DE Ref legal event code: R096 Ref document number: 602010063448 Country of ref document: DE |
|
| REG | Reference to a national code |
Ref country code: NL Ref legal event code: FP |
|
| PG25 | Lapsed in a contracting state [announced via postgrant information from national office to epo] |
Ref country code: NO Free format text: LAPSE BECAUSE OF FAILURE TO SUBMIT A TRANSLATION OF THE DESCRIPTION OR TO PAY THE FEE WITHIN THE PRESCRIBED TIME-LIMIT Effective date: 20200611 Ref country code: FI Free format text: LAPSE BECAUSE OF FAILURE TO SUBMIT A TRANSLATION OF THE DESCRIPTION OR TO PAY THE FEE WITHIN THE PRESCRIBED TIME-LIMIT Effective date: 20200311 |
|
| PG25 | Lapsed in a contracting state [announced via postgrant information from national office to epo] |
Ref country code: BG Free format text: LAPSE BECAUSE OF FAILURE TO SUBMIT A TRANSLATION OF THE DESCRIPTION OR TO PAY THE FEE WITHIN THE PRESCRIBED TIME-LIMIT Effective date: 20200611 Ref country code: LV Free format text: LAPSE BECAUSE OF FAILURE TO SUBMIT A TRANSLATION OF THE DESCRIPTION OR TO PAY THE FEE WITHIN THE PRESCRIBED TIME-LIMIT Effective date: 20200311 Ref country code: SE Free format text: LAPSE BECAUSE OF FAILURE TO SUBMIT A TRANSLATION OF THE DESCRIPTION OR TO PAY THE FEE WITHIN THE PRESCRIBED TIME-LIMIT Effective date: 20200311 Ref country code: HR Free format text: LAPSE BECAUSE OF FAILURE TO SUBMIT A TRANSLATION OF THE DESCRIPTION OR TO PAY THE FEE WITHIN THE PRESCRIBED TIME-LIMIT Effective date: 20200311 Ref country code: GR Free format text: LAPSE BECAUSE OF FAILURE TO SUBMIT A TRANSLATION OF THE DESCRIPTION OR TO PAY THE FEE WITHIN THE PRESCRIBED TIME-LIMIT Effective date: 20200612 |
|
| REG | Reference to a national code |
Ref country code: LT Ref legal event code: MG4D |
|
| PG25 | Lapsed in a contracting state [announced via postgrant information from national office to epo] |
Ref country code: SM Free format text: LAPSE BECAUSE OF FAILURE TO SUBMIT A TRANSLATION OF THE DESCRIPTION OR TO PAY THE FEE WITHIN THE PRESCRIBED TIME-LIMIT Effective date: 20200311 Ref country code: EE Free format text: LAPSE BECAUSE OF FAILURE TO SUBMIT A TRANSLATION OF THE DESCRIPTION OR TO PAY THE FEE WITHIN THE PRESCRIBED TIME-LIMIT Effective date: 20200311 Ref country code: IS Free format text: LAPSE BECAUSE OF FAILURE TO SUBMIT A TRANSLATION OF THE DESCRIPTION OR TO PAY THE FEE WITHIN THE PRESCRIBED TIME-LIMIT Effective date: 20200711 Ref country code: RO Free format text: LAPSE BECAUSE OF FAILURE TO SUBMIT A TRANSLATION OF THE DESCRIPTION OR TO PAY THE FEE WITHIN THE PRESCRIBED TIME-LIMIT Effective date: 20200311 Ref country code: SK Free format text: LAPSE BECAUSE OF FAILURE TO SUBMIT A TRANSLATION OF THE DESCRIPTION OR TO PAY THE FEE WITHIN THE PRESCRIBED TIME-LIMIT Effective date: 20200311 Ref country code: LT Free format text: LAPSE BECAUSE OF FAILURE TO SUBMIT A TRANSLATION OF THE DESCRIPTION OR TO PAY THE FEE WITHIN THE PRESCRIBED TIME-LIMIT Effective date: 20200311 Ref country code: PT Free format text: LAPSE BECAUSE OF FAILURE TO SUBMIT A TRANSLATION OF THE DESCRIPTION OR TO PAY THE FEE WITHIN THE PRESCRIBED TIME-LIMIT Effective date: 20200805 Ref country code: CZ Free format text: LAPSE BECAUSE OF FAILURE TO SUBMIT A TRANSLATION OF THE DESCRIPTION OR TO PAY THE FEE WITHIN THE PRESCRIBED TIME-LIMIT Effective date: 20200311 |
|
| REG | Reference to a national code |
Ref country code: AT Ref legal event code: MK05 Ref document number: 1243723 Country of ref document: AT Kind code of ref document: T Effective date: 20200311 |
|
| REG | Reference to a national code |
Ref country code: DE Ref legal event code: R097 Ref document number: 602010063448 Country of ref document: DE |
|
| REG | Reference to a national code |
Ref country code: DE Ref legal event code: R119 Ref document number: 602010063448 Country of ref document: DE |
|
| PLBE | No opposition filed within time limit |
Free format text: ORIGINAL CODE: 0009261 |
|
| STAA | Information on the status of an ep patent application or granted ep patent |
Free format text: STATUS: NO OPPOSITION FILED WITHIN TIME LIMIT |
|
| PG25 | Lapsed in a contracting state [announced via postgrant information from national office to epo] |
Ref country code: AT Free format text: LAPSE BECAUSE OF FAILURE TO SUBMIT A TRANSLATION OF THE DESCRIPTION OR TO PAY THE FEE WITHIN THE PRESCRIBED TIME-LIMIT Effective date: 20200311 Ref country code: DK Free format text: LAPSE BECAUSE OF FAILURE TO SUBMIT A TRANSLATION OF THE DESCRIPTION OR TO PAY THE FEE WITHIN THE PRESCRIBED TIME-LIMIT Effective date: 20200311 Ref country code: ES Free format text: LAPSE BECAUSE OF FAILURE TO SUBMIT A TRANSLATION OF THE DESCRIPTION OR TO PAY THE FEE WITHIN THE PRESCRIBED TIME-LIMIT Effective date: 20200311 Ref country code: MC Free format text: LAPSE BECAUSE OF FAILURE TO SUBMIT A TRANSLATION OF THE DESCRIPTION OR TO PAY THE FEE WITHIN THE PRESCRIBED TIME-LIMIT Effective date: 20200311 |
|
| REG | Reference to a national code |
Ref country code: CH Ref legal event code: PL |
|
| 26N | No opposition filed |
Effective date: 20201214 |
|
| PG25 | Lapsed in a contracting state [announced via postgrant information from national office to epo] |
Ref country code: PL Free format text: LAPSE BECAUSE OF FAILURE TO SUBMIT A TRANSLATION OF THE DESCRIPTION OR TO PAY THE FEE WITHIN THE PRESCRIBED TIME-LIMIT Effective date: 20200311 Ref country code: SI Free format text: LAPSE BECAUSE OF FAILURE TO SUBMIT A TRANSLATION OF THE DESCRIPTION OR TO PAY THE FEE WITHIN THE PRESCRIBED TIME-LIMIT Effective date: 20200311 |
|
| PG25 | Lapsed in a contracting state [announced via postgrant information from national office to epo] |
Ref country code: LU Free format text: LAPSE BECAUSE OF NON-PAYMENT OF DUE FEES Effective date: 20200618 |
|
| PG25 | Lapsed in a contracting state [announced via postgrant information from national office to epo] |
Ref country code: CH Free format text: LAPSE BECAUSE OF NON-PAYMENT OF DUE FEES Effective date: 20200630 Ref country code: IE Free format text: LAPSE BECAUSE OF NON-PAYMENT OF DUE FEES Effective date: 20200618 Ref country code: LI Free format text: LAPSE BECAUSE OF NON-PAYMENT OF DUE FEES Effective date: 20200630 |
|
| PG25 | Lapsed in a contracting state [announced via postgrant information from national office to epo] |
Ref country code: DE Free format text: LAPSE BECAUSE OF NON-PAYMENT OF DUE FEES Effective date: 20210101 |
|
| PGFP | Annual fee paid to national office [announced via postgrant information from national office to epo] |
Ref country code: IT Payment date: 20210610 Year of fee payment: 12 Ref country code: NL Payment date: 20210517 Year of fee payment: 12 Ref country code: FR Payment date: 20210520 Year of fee payment: 12 |
|
| PGFP | Annual fee paid to national office [announced via postgrant information from national office to epo] |
Ref country code: BE Payment date: 20210526 Year of fee payment: 12 Ref country code: GB Payment date: 20210528 Year of fee payment: 12 |
|
| PG25 | Lapsed in a contracting state [announced via postgrant information from national office to epo] |
Ref country code: TR Free format text: LAPSE BECAUSE OF FAILURE TO SUBMIT A TRANSLATION OF THE DESCRIPTION OR TO PAY THE FEE WITHIN THE PRESCRIBED TIME-LIMIT Effective date: 20200311 Ref country code: MT Free format text: LAPSE BECAUSE OF FAILURE TO SUBMIT A TRANSLATION OF THE DESCRIPTION OR TO PAY THE FEE WITHIN THE PRESCRIBED TIME-LIMIT Effective date: 20200311 Ref country code: CY Free format text: LAPSE BECAUSE OF FAILURE TO SUBMIT A TRANSLATION OF THE DESCRIPTION OR TO PAY THE FEE WITHIN THE PRESCRIBED TIME-LIMIT Effective date: 20200311 |
|
| PG25 | Lapsed in a contracting state [announced via postgrant information from national office to epo] |
Ref country code: MK Free format text: LAPSE BECAUSE OF FAILURE TO SUBMIT A TRANSLATION OF THE DESCRIPTION OR TO PAY THE FEE WITHIN THE PRESCRIBED TIME-LIMIT Effective date: 20200311 Ref country code: AL Free format text: LAPSE BECAUSE OF FAILURE TO SUBMIT A TRANSLATION OF THE DESCRIPTION OR TO PAY THE FEE WITHIN THE PRESCRIBED TIME-LIMIT Effective date: 20200311 |
|
| REG | Reference to a national code |
Ref country code: NL Ref legal event code: MM Effective date: 20220701 |
|
| REG | Reference to a national code |
Ref country code: BE Ref legal event code: MM Effective date: 20220630 |
|
| GBPC | Gb: european patent ceased through non-payment of renewal fee |
Effective date: 20220618 |
|
| PG25 | Lapsed in a contracting state [announced via postgrant information from national office to epo] |
Ref country code: NL Free format text: LAPSE BECAUSE OF NON-PAYMENT OF DUE FEES Effective date: 20220701 |
|
| PG25 | Lapsed in a contracting state [announced via postgrant information from national office to epo] |
Ref country code: FR Free format text: LAPSE BECAUSE OF NON-PAYMENT OF DUE FEES Effective date: 20220630 |
|
| PG25 | Lapsed in a contracting state [announced via postgrant information from national office to epo] |
Ref country code: GB Free format text: LAPSE BECAUSE OF NON-PAYMENT OF DUE FEES Effective date: 20220618 Ref country code: BE Free format text: LAPSE BECAUSE OF NON-PAYMENT OF DUE FEES Effective date: 20220630 |
|
| PG25 | Lapsed in a contracting state [announced via postgrant information from national office to epo] |
Ref country code: IT Free format text: LAPSE BECAUSE OF NON-PAYMENT OF DUE FEES Effective date: 20220618 |