EP2244486B1 - Color calibration system and method for a display - Google Patents
Color calibration system and method for a display Download PDFInfo
- Publication number
- EP2244486B1 EP2244486B1 EP09007777.7A EP09007777A EP2244486B1 EP 2244486 B1 EP2244486 B1 EP 2244486B1 EP 09007777 A EP09007777 A EP 09007777A EP 2244486 B1 EP2244486 B1 EP 2244486B1
- Authority
- EP
- European Patent Office
- Prior art keywords
- display
- color
- image data
- curves
- data set
- Prior art date
- Legal status (The legal status is an assumption and is not a legal conclusion. Google has not performed a legal analysis and makes no representation as to the accuracy of the status listed.)
- Active
Links
Images







Classifications
-
- H—ELECTRICITY
- H04—ELECTRIC COMMUNICATION TECHNIQUE
- H04N—PICTORIAL COMMUNICATION, e.g. TELEVISION
- H04N17/00—Diagnosis, testing or measuring for television systems or their details
- H04N17/02—Diagnosis, testing or measuring for television systems or their details for colour television signals
-
- G—PHYSICS
- G09—EDUCATION; CRYPTOGRAPHY; DISPLAY; ADVERTISING; SEALS
- G09G—ARRANGEMENTS OR CIRCUITS FOR CONTROL OF INDICATING DEVICES USING STATIC MEANS TO PRESENT VARIABLE INFORMATION
- G09G5/00—Control arrangements or circuits for visual indicators common to cathode-ray tube indicators and other visual indicators
- G09G5/02—Control arrangements or circuits for visual indicators common to cathode-ray tube indicators and other visual indicators characterised by the way in which colour is displayed
-
- H—ELECTRICITY
- H04—ELECTRIC COMMUNICATION TECHNIQUE
- H04N—PICTORIAL COMMUNICATION, e.g. TELEVISION
- H04N1/00—Scanning, transmission or reproduction of documents or the like, e.g. facsimile transmission; Details thereof
- H04N1/46—Colour picture communication systems
- H04N1/56—Processing of colour picture signals
- H04N1/60—Colour correction or control
- H04N1/6083—Colour correction or control controlled by factors external to the apparatus
- H04N1/6086—Colour correction or control controlled by factors external to the apparatus by scene illuminant, i.e. conditions at the time of picture capture, e.g. flash, optical filter used, evening, cloud, daylight, artificial lighting, white point measurement, colour temperature
-
- H—ELECTRICITY
- H04—ELECTRIC COMMUNICATION TECHNIQUE
- H04N—PICTORIAL COMMUNICATION, e.g. TELEVISION
- H04N17/00—Diagnosis, testing or measuring for television systems or their details
- H04N17/04—Diagnosis, testing or measuring for television systems or their details for receivers
-
- H—ELECTRICITY
- H04—ELECTRIC COMMUNICATION TECHNIQUE
- H04N—PICTORIAL COMMUNICATION, e.g. TELEVISION
- H04N9/00—Details of colour television systems
- H04N9/64—Circuits for processing colour signals
- H04N9/68—Circuits for processing colour signals for controlling the amplitude of colour signals, e.g. automatic chroma control circuits
- H04N9/69—Circuits for processing colour signals for controlling the amplitude of colour signals, e.g. automatic chroma control circuits for modifying the colour signals by gamma correction
-
- H—ELECTRICITY
- H04—ELECTRIC COMMUNICATION TECHNIQUE
- H04N—PICTORIAL COMMUNICATION, e.g. TELEVISION
- H04N9/00—Details of colour television systems
- H04N9/64—Circuits for processing colour signals
- H04N9/73—Colour balance circuits, e.g. white balance circuits or colour temperature control
-
- G—PHYSICS
- G09—EDUCATION; CRYPTOGRAPHY; DISPLAY; ADVERTISING; SEALS
- G09G—ARRANGEMENTS OR CIRCUITS FOR CONTROL OF INDICATING DEVICES USING STATIC MEANS TO PRESENT VARIABLE INFORMATION
- G09G2320/00—Control of display operating conditions
- G09G2320/02—Improving the quality of display appearance
- G09G2320/0271—Adjustment of the gradation levels within the range of the gradation scale, e.g. by redistribution or clipping
- G09G2320/0276—Adjustment of the gradation levels within the range of the gradation scale, e.g. by redistribution or clipping for the purpose of adaptation to the characteristics of a display device, i.e. gamma correction
-
- G—PHYSICS
- G09—EDUCATION; CRYPTOGRAPHY; DISPLAY; ADVERTISING; SEALS
- G09G—ARRANGEMENTS OR CIRCUITS FOR CONTROL OF INDICATING DEVICES USING STATIC MEANS TO PRESENT VARIABLE INFORMATION
- G09G2320/00—Control of display operating conditions
- G09G2320/06—Adjustment of display parameters
- G09G2320/0666—Adjustment of display parameters for control of colour parameters, e.g. colour temperature
-
- G—PHYSICS
- G09—EDUCATION; CRYPTOGRAPHY; DISPLAY; ADVERTISING; SEALS
- G09G—ARRANGEMENTS OR CIRCUITS FOR CONTROL OF INDICATING DEVICES USING STATIC MEANS TO PRESENT VARIABLE INFORMATION
- G09G2320/00—Control of display operating conditions
- G09G2320/06—Adjustment of display parameters
- G09G2320/0693—Calibration of display systems
-
- G—PHYSICS
- G09—EDUCATION; CRYPTOGRAPHY; DISPLAY; ADVERTISING; SEALS
- G09G—ARRANGEMENTS OR CIRCUITS FOR CONTROL OF INDICATING DEVICES USING STATIC MEANS TO PRESENT VARIABLE INFORMATION
- G09G2340/00—Aspects of display data processing
- G09G2340/06—Colour space transformation
Definitions
- the present invention is related to a calibration system and a method thereof for calibrating a display, and more specifically, to a calibration system and a method thereof for color calibration of a display.
- the display part of the panel display includes the pixel array.
- the pixel array is an ordinary matrix array, and the pixel array is driven by a driver.
- the driver drives the corresponding pixels based on the arrayed image data.
- the pixels display the specific colors at the specific time under control by the driver. However, the color of the pixel is still required to be calibrated (such as gamma curve correction) in order to match the ideal color for the human eyes.
- FIG. 1 is a diagram showing the relationships between the gray level and two chromaticity values x and y of the CIE xyY color space of a conventional display panel.
- the vertical axis represents the two chromaticity values x and y
- the horizontal axis represents the gray level.
- the curve 260 responds to the chromaticity value x
- the curve 262 responds to the chromaticity value y.
- the two chromaticity values x and y are measured when the display panel displays patterns. Each of the patterns corresponds to a gray level, and the gray level is regarded as the graduation of the horizontal axis of FIG. 1 .
- Each of the patterns may be a black pattern, a gray pattern, or a white pattern.
- the pattern corresponded to the gray level of 0 is a black pattern
- the pattern corresponded to the gray level of 255 is a white pattern
- the pattern corresponded to the gray level of 1 to 254 is a gray pattern.
- the two measured chromaticity values x and y may be constant. Otherwise, the color temperature corresponded to the gray levels is various. In other words, if the measured chromaticity values x and y are not constant, the color temperature of each of the gray levels is not fixed, such that display panel does not displays the color uniformly.
- the Taiwan Patent No. 200306123 corresponding to the U.S. Patent No. 7,079,155 , provides an image display device, an image processing method, and a computer-readable medium adapted to perform proper color reproduction while saving memory capacity.
- the image display device uses a first color corrector to refer to a three-dimensional color correction table, matching a color characteristic of the image display device with a reference color characteristic based on a characteristic value of the image display device, and to apply desired color correction to the inputted image data.
- the image display device uses second color corrector to refer to a one-dimensional color correction table for correcting gradation according to an application circumstances, and applies desired color correction to the inputted image data.
- Taiwan Patent No. 1283852 corresponding to the U.S. Patent No. 7,375,854 , discloses a method for color correction.
- a plurality of groups of gray levels and luminance of a light source of a display device are respectively selected by a color measurement system.
- the selected data of each color light are respectively calculated to obtain fitting functions, and the fitting functions may fit the gray level data of each interval.
- the fitting luminance of the gray levels in interval is obtained by the fitting functions and formed into a look-up table.
- the two gamma curves are first taken to logarithmic calculation and the modified gray signals are obtained from the look-up table, then the modified gray signals are transmitted out for providing the display device to express the gray distribution state.
- US2002/0126106 A1 shows V-T characteristic curves of three liquid crystal devices, which respectively modulate each chromatic light of red (R), green (G), or blue (B) in the projection display device.
- Color temperature adjustment based on the color temperature control is allowed in the following procedure: when the values of x and y coordinates for R, G, and B remains constant, as given above, the color temperature is determined by the mixture ratio of R, G, and B, regardless of values of the luminance.
- an ideal y characteristic curve as shown in FIG. 6 , which is obtained by multiplying a constant by an ideal y characteristic curve for gamma correction calculation (see
- FIG. 3 of one or more of the three liquid crystal devices (light valves), so that the displayed color made of a mixture of R, G, and B has a targeted color temperature (targeted points on the x and y coordinates on the chromaticity diagram).
- Each value of G and B is multiplied by a different constant so as to create a deviation between the ideal y characteristic curves of G and B.
- US2006/0071940 A1 discloses a method and a system according to the preamble of the respective independent claims.
- a liquid crystal display unit using the gradation correction method To measure the device characteristic of the image display unit the input image signals are supplied to the maximum gradation value adjustment unit and the data conversion unit and set up so that the input image signals turn to correction image signals.
- the displays are shown respectively the three primary colors and black, and measured with the color brightness meter.
- a XYZ-RGB conversion matrix is created from measured brightness and chromaticity. All the displays of R, G and B displayed in gray from the minimum to the maximum respectively, and brightness and chromaticity of gray display are measured with the color brightness meter.
- the ⁇ correction data is generated according to the change characteristic of color mixture ratio of R, G and B to such an obtained input gradation value and the data is stored in memory unit constituting the data conversion unit.
- a value of ⁇ of the characteristic is e.g. "2.2" when a display based on NTSC signals is executed. As described above, any white balance can be displayed only by adjustment of the maximum gradation adjustment unit without a necessity of plural ⁇ correction data and without changing the ⁇ correction data.
- the present invention is to provide a method of calibrating a liquid crystal display, such that the color temperature of the display may be substantially constant for every gray-level, and a corresponding calibration system.
- a method of calibrating a liquid crystal display includes steps of: measuring the display to generate three first measured data sets by utilizing a measurement unit while the display displays three primary-color patterns according to three primary-color-image data sets; measuring the display to generate a second measured data set by utilizing the measurement unit while the display displays a black pattern according to a black-image data set; establishing a transform model according to the three first measured data sets, the second measured data set, the three primary-color-image data sets, and the black-image data set by utilizing a processing unit; measuring the display to generate a plurality of third measured data sets by utilizing the measurement unit while the display displays a plurality of gray-level patterns according to a plurality of gray-image data sets; establishing three first native display curves according to the second measured data set and the third measured data sets by utilizing the processing unit; transforming the three first native display curves into three second native display curves by utilizing the transform model; defining three final target curves by utilizing the processing unit; establishing three look-up tables according to the three
- a calibration system includes a measurement unit and a processing unit.
- the measurement unit is configured to measure the display so as to generate measured data sets while the display displays patterns according to image data sets.
- the processing unit is coupled to the measurement unit and configured to establish a transform model and three look-up tables.
- the processing unit establishes the transform model according to three first measured data sets, a second measured data set, three primary-color-image data sets, and a black-image data set.
- the measurement unit generates the three first measured data sets by measuring the display while the display displays three primary-color patterns according to the three primary-color-image data sets.
- the measurement unit generates the second measured data set by measuring the display while the display displays a black pattern according to the black-image data set.
- the processing unit uses the transform model to transform three first native display curves into three second native display curves.
- the processing unit establishes the three first native display curves according to the second measured data set and a plurality of third measured data sets, and the measurement unit generates the third measured data sets by measuring the display while the display displays a plurality of gray-level patterns according to a plurality of gray-image data sets.
- the processing unit defines three final target curves and establishes the three look-up tables according to the three final target curves and the three second native display curves.
- the processing unit converts an input image data set to a calibrated image data set according to the three look-up tables, and the processing unit outputs the calibrated image data set to the display, such that the display displays a calibrated image according to the calibrated image data set.
- the processing unit includes a signal generator coupled to the display and configured to output image data sets to the display.
- the three primary-color-image data sets are a red-image data set, a green-image data set, and a blue-image data set
- the three primary-color patterns are a red pattern, a green pattern, and a blue pattern.
- the display displays the red pattern according to the red-image data set, the display displays the green pattern according to the green-image data set, and the display displays the blue pattern according to the blue-image data set.
- Each of the gray-image data sets has a first color subset, a second color subset, and a third color subset. Three pixel values of the first color subset, the second color subset, and the third color subset are identical.
- the processing unit obtains the three final target curves by normalizing three second target curves, and the processing unit uses the transform model to transform three first target curves into the three second target curves.
- the processing unit normalizes the three second target curves by scaling the three second target curves by a ratio of a standard level to a maximum of three maximum levels of the three second target curves.
- the processing unit defines two of the three first target curves according to the rest one of the three first target curves and three chromaticity values x, y, and z of the CIE xyY color space.
- the processing unit defines the rest one of the three first target curves by scaling a gamma curve by a maximum level of a corresponding one of the three first native display curves.
- the rest one of the three first native display curves is a curve of tristimulus value Y of the CIE 1931 XYZ color space.
- the processing unit calculates a compensation ratio according to the transform model and three maximum levels of the three final target curves, and the processing unit increases a power of a light source of the display according the compensation ratio.
- a transform model is established for color transformation between a first color space and a second color space.
- Three first target curves are defined and transformed by the transform model so as to establish three look-up tables.
- the display is calibrated according to the look-up tables such that the color temperature of the display may be substantially constant for every gray-level.
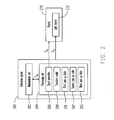
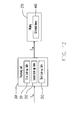
- FIG. 2 is a functional block diagram of a display 270 and a calibration system 280 according to an embodiment of the present invention.
- the calibration system 280 is used for color calibration of the display 270.
- the display 270 may be, for example, a thin film transistor-liquid crystal display (TFT-LCD), an organic light emitting diode (OLED) display, a plasma display, a cathode ray tube (CRT) display, or the like.
- the calibration system 280 has a measurement unit 282 and a processing unit 284.
- the measurement unit 282 is a photo-sensing device for sensing the color-density of the display 270.
- the measurement unit 282 may be a CA-210 display color analyzer produced by KONICA MINOLTA ⁇ ,R, Inc.
- the processing unit 284 may be a computer, a personal digital assistant (PDA), a set to box (STB), or the like.
- the processing unit 284 is coupled to the measurement unit 282 and the display 270, and the processing unit 284 includes a signal generator 286.
- the signal generator 286 is coupled to the display 270 and configured to output image data sets S G to the display 270, such that the display 270 displays corresponding patterns based on the received output image data sets S G .
- the signal generator 286 is a graphic adapter.
- the present invention is not limited thereto.
- the measurement unit 282 is configured to measure the display 270 so as to generate measured data sets S M while the display 270 displays patterns according to the image data sets S G .
- the image data sets S G are image data of the RGB color system and may be represented as R G B .
- the parameters R, G, and B represent the pixel values of the image data sets S G for red, green, and blue respectively.
- the measured data sets S M are data of the CIE 1931 XYZ color space and may be represented as X Y Z .
- the parameters X, Y, and Z represent the tristimulus values X, Y, and Z of the measured data sets S M respectively.
- the CIE 1931 XYZ color space is created by the International Commission on Illumination (CIE) in 1931.
- FIG. 3 is a flow chart of the method of calibrating the display 270 according to an embodiment of the present invention.
- the processing unit 284 establishes a transform model 288 for color transformation between a first color space and a second color space.
- the first color space is the RGB color space
- the RGB color space is defined by the three chromaticities of the red, green, and blue additive primaries.
- the second color space is the CIE 1931 XYZ color space.
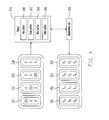
- the signal generator 286 transmits three primary-color-image data sets 331-333 to the display 270, such that the display 270 displays three primary-color patterns 341-343 according to the received primary-color-image data sets 331-333.
- the three primary-color-image data sets 331-333 are a red-image data set 331, a green-image data set 332, and a blue-image data set 333.
- the three primary-color patterns 341-343 are a red pattern 341, a green pattern 342, and a blue pattern 343.
- the display 270 displays the red pattern 341 according to the red-image data set 331, displays the green pattern 342 according to the green-image data set 332, and displays the blue pattern 343 according to the blue-image data set 333.
- the three primary-color-image data sets 331-333 are image data of the RGB color system and are respectively represented as 255 0 0 , 0 255 0 , and 0 0 255 .
- the three primary-color patterns 341-343 may be simultaneously or sequentially displayed on the display 270.
- the measurement unit 282 is used to measure the display 270 so as to generate three first measured data sets 351-353.
- the three first measured data sets 351-353 are respectively represented as X R Y R Z R , X G Y G Z G , and X B Y B Z B .
- the measurement unit 282 generates the measured data set X R Y R Z R while the display 270 displays the red pattern 341
- the measurement unit 282 generates the measured data set X G Y G Z G while the display 270 displays the green pattern 342
- the measurement unit 282 generates the measured data set X B Y B Z B while the display 270 displays the blue pattern 343.
- a black-image data set 334 is transmitted to the display 270, such that the display 270 displays a black pattern 344 according to the black-image data set 334.
- the black-image data set 334 is represented as 0 0 0 .
- the measurement unit 282 measures the display 270 so as to generate a second measured data set 354.
- the second measured data set 354 is represented as X 0 Y 0 Z 0 .
- the processing unit 284 may calculate the values of the parameters C 11 -C 13 , C 21 -C 23 , C 31 -C 33 , O R , O G , and O B according to the equations (2)-(5). Therefore, the processing unit 284 establishes the transform model 288 according to the three first measured data sets 351-354, the second measured data set 354, the three primary-color-image data sets 331-333, and the black-image data set 334.
- the processing unit 284 establishes three first native display curves of the display 270 in step S304.
- the signal generator 286 of the processing unit 284 transmits a plurality of gray-image data sets to the display 270. Please refer to FIGs. 2 and 5 .
- the signal generator 286 transmits a plurality of gray-image data sets TPI-TP255 to the display 270, such that the display 270 displays a plurality of gray-level patterns GP1-GP255 according to a plurality of gray-image data sets TP1-TP255.
- the gray-image data sets TP1-TP255 are image data of the RGB color system and are respectively represented as 1 1 1 , 2 2 2 , 3 3 3 , ..., and 255 255 255 .
- the parameters R, G, and B of the matrix R G B represent three pixel values of a first color subset, a second color subset, and a third color subset of the image data sets S G respectively.
- the symbol R of the matrix R G B represents the pixel value of the first color subset for red
- the symbol G of the matrix R G B represents the pixel value of the first color subset for green
- the symbol R of the matrix R G B represents the pixel value of the first color subset for blue.
- the three pixel values of the first color subset, the second color subset, and the third color subset of the same one of the gray-image data sets TP1-TP255 are identical.
- the three pixel values of the 1 st gray-image data set TP1 are all 1
- the three pixel values of the 2 nd gray-image data set TP2 are all 2
- the three pixel values of the 3 rd gray-image data set TP3 are all 3, and so on.
- the display 270 displays the gray-level pattern GP according to the 1 st gray-image data set TP1, displays the gray-level pattern GP2 according to the 2 nd gray-image data set TP2, displays the gray-level pattern GP3 according to the 3 rd gray-image data set TP3, and so on.
- the gray-image data sets TP1-TP255 may be simultaneously or sequentially displayed on the display 270.
- the measurement unit 282 measures the display 270 so as to generate a plurality of third measured data sets MD1-MD255.
- the measurement unit 282 generates the measured data set MD1 by measuring the display 270 while the display 270 displays the gray-level pattern GP1, and the measurement unit 282 generates the measured data set MD2 by measuring the display 270 while the display 270 displays the gray-level pattern GP2, and so on.
- the third measured data sets MD1-MD255 are data of the CIE 1931 XYZ color space and are respectively represented as X 1 Y 1 Z 1 , X 2 Y 2 Z 2 , X 3 Y 3 Z 3 , ..., and X 255 Y 255 Z 255 .
- the processing unit 284 establishes the three first native display curves of the display 270 according to the second measured data set X 0 Y 0 Z 0 and the third measured data sets X 1 Y 1 Z 1 to X 255 Y 255 Z 255 .
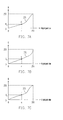
- FIGs. 6A-6C are diagrams illustrating the three first native display curves 361-363 according to an embodiment of the present invention.
- the vertical axes of the three first native display curves 361-363 respectively represent the tristimulus values X, Y, and Z of the CIE 1931 XYZ color space
- the horizontal axes of the three first native display curves 361-363 represent an index corresponded to the gray level of one of the gray-image data sets TP1-TP255 or to the gray level of the black-image data set 334.
- the measurement unit 282 measures the n th gray-level pattern GPn
- the measurement unit 282 generates corresponding one (i.e. the n th one MDn) of the third measured data sets MD1-MD255, where the measured data set MDn may be represented as X n Y n Z n .
- a node A of the native display curves 361, a node B of the native display curves 362, and node C of the native display curves 363 may be orientated based on the index of n and the measured data set X n Y n Z n .
- the origins of FIGs. 6A-6C are determined based on the second measured data set X 0 Y 0 Z 0 , such that the origins of FIGs. 6A-6C are (0, X 0 ), (0, Y 0 ), and (0, Z 0 ) respectively.
- step S306 the processing unit 284 transforms the three first native display curves 361-363 into three second native display curves by using the transform model 288.
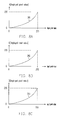
- FIGs. 7A-7C are diagrams illustrating the three second native display curves 371-373 according to an embodiment of the present invention.
- the vertical axes of the three second native display curves 371-373 respectively represent the visual pixel values R, G, and B of the RGB color space
- the horizontal axes of the second native display curves 371-373 represent the original pixel values R, G, and B of the RGB color space.
- a node D of the native display curve 371, a node E of the native display curve 372, and a node F of the native display curve 373 are corresponding to an original pixel value of n, while the nodes D, E, and F correspond to the visual pixel values R n , G n , and B n respectively.
- the processing unit 284 is capable of transforming the three first native display curves 361-363 into the three second native display curves 371-373 by using the transform model 288.
- step S308 the processing unit 284 defines three final target curves.
- the three final target curves 381-383 defined by the processing unit 284 are illustrated.
- the characteristics of the calibrated display 270 may be substantially represented by the three final target curves 381-383.
- the horizontal axes of FIGs. 8A-8C represent the input pixel value for red, green, and blue respectively.
- the vertical axes of FIGs. 8A-8C represent the displayed pixel value of the display 270 for red, green, and blue respectively.
- the processing unit 284 when the processing unit 284 defines the three final target curves 381-383, the processing unit 284 firstly transforms three first target curves into three second target curves and then normalizes the three second target curves to obtain the three final target curves.
- three first target curves 391-393 are transformed into three second target curves 401-403 by the processing unit 284, and the processing unit 284 normalizes the three second target curves 401-403 to obtain the three final target curves 381-383.
- the three first target curves 391-393 are curves showing the desired tristimulus values X, Y, and Z of the display 270 after finishing the color calibration of the display 270.
- the first target curve 392 is transformed from a gamma curve.
- the other two first target curves 391 and 393 may be defined by the processing unit 284 according to the first target curve 392 and three chromaticity values x, y, and z of the CIE xyY color space.
- the maximum levels of the three second target curves 401-403 may be greater than 255 (i.e. a standard level for the RGB system). In such case, the three second target curves 401-403 may be scaled so as to match the standard level.
- a scaling ratio is defined by the processing unit 284. In an embodiment, the scaling ratio is equal to a ratio of the standard level to a maximum of three maximum levels of the three second target curves 401-403.
- the three maximum levels of the three second target curves 401-403 are 265, 255, and 240, such that the maximum of three maximum levels of the three second target curves 401-403 is 265. Since the standard level is equal to 255 (i.e.
- the scaling ratio is 255/265.
- FIG. 9 is a diagram illustrating an exemplary embodiment of the present invention when a constant color temperature of 6500K and a gamma curve of 2.2 are desired.
- the processing unit 284 may establish different three final target curves based on different requirements of color calibration of the display 270.
- the display 270 may be a specific display satisfying with the specification of Digital Imaging and Communications in Medicine (DICOM).
- DICOM Digital Imaging and Communications in Medicine
- FIG. 10 three first target curves 411-413 of a DICOM display are illustrated.
- the processing unit 284 uses the transform model 288 to transform the three first target curves 411-413 into three second target curves 421-423, and then scales the three second target curves 421-423 by a scaling ratio.
- the scaling ratio is equal to 255/336.
- the processing unit 284 establishes three look-up tables 291-293 according to the three final target curves and the three second native display curves. Take the embodiment shown in FIGs. 7A-7C and FIG. 9 for example, the processing unit 284 establishes the three look-up tables 291-293 according to the three final target curves 381-383 and the three second native display curves 371-373.
- the processing unit 284 establishes the first look-up table 291 according to the final target curves 381 and the second native display curves 371, the processing unit 284 establishes the second look-up table 292 according to the final target curves 382 and the second native display curves 372, and the processing unit 284 establishes the third look-up table 293 according to the final target curves 383 and the second native display curves 373.
- the three look-up tables 291-293 are used for color calibration of the display 270 for red, green, and blue respectively.
- FIG. 11 shows how to establish one of the three look-up tables 291-293 according to an embodiment of the present invention. As shown in FIG.
- FIG. 11 shows the mapping relationships between the input pixel values and the displayed pixel values of the final target curve.
- the look-up table, the second native display curve, and the final target curve correspond to the same color (i.e. red, green, or blue).
- the final target curve shown in FIG. 11 when an input pixel value is 130, the corresponding displayed pixel value may be 102.
- FIG. 11 shows that when an input pixel value is 130, the corresponding displayed pixel value may be 102.
- a calibrated pixel value of the second native display curve corresponding to the displayed pixel value of 102 is 128, such that a relationship, of the look-up table, between the input pixel value of 130 and the calibrated pixel value of 128 may be established by the processing unit 284. Similarly, more relationships between the input pixel value and the calibrated pixel value may be established in the look-up table. After the relationships between the input pixel values and the calibrated pixel values are established in the three look-up tables, the processing unit 284 may convert a received input image data set to a calibrated image data set according to the three look-up tables.
- the processing unit 284 converts the input image data set S in to a calibrated image data set S cb according to the three look-up tables 291-293.
- the calibrated image data set S cb may be transmitted to the display 270, such that the display 270 displays a calibrated image 440 according to the calibrated image data set S cb .
- FIG. 13 is an experimental diagram showing the relationships between the gray level and two chromaticity values x and y of the display 270 according to an embodiment of the present invention.
- the vertical axis represents the two chromaticity values x and y, and the horizontal axis represents the gray level.
- the curve 450 responds to the chromaticity value y
- the curve 452 responds to the chromaticity value x.
- the two chromaticity values x and y are substantially constant, such that the display 270 substantially has a constant color temperature for every gray-level.
- FIG. 14 is another experimental diagram showing the relationships between the gray level and two chromaticity values x and y of the display 270 according to an embodiment of the present invention.
- the vertical axis represents the two chromaticity values x and y, and the horizontal axis represents the gray level.
- the curve 460 responds to the chromaticity value y
- the curve 462 responds to the chromaticity value x.
- the two chromaticity values x and y are substantially constant, such that the color temperature of the display 270 is substantially constant for every gray-level.
- the display 270 is a liquid crystal display (LCD) and has a light source 272.
- the light source 272 is a backlight module, and the backlight module provides light when the display 270 is turned on. According the equations (17)-(19) or (21)-(23), after the three second target curves 401-403 or 421-423 are scaled (i.e.
- the processing unit 284 transmits a control signal Sc to the backlight module 272 so as to increase the power of the backlight module 272. Accordingly, the images displayed on the display 270 may become brighter and may be satisfied by the user.
- the processing unit 284 generates the control signal Sc according to the three maximum levels of the three final target curves.
- the three maximum levels of the three final target curves 381-383 are 255, 245, and 231.
- the three maximum levels of the three final target curves 381-383 are 255, 245, and 231, the corresponding values (X m , Y m , Z m ) of the three tristimulus values X, Y, and Z are 146, 161, and 85.
- the processing unit 284 obtains a compensation ratio of Yt 255 161 i . e . Yt 255 Y m .
- the compensation ratio is associated with the tristimulus value Y m .
- the processing unit 284 generates the control signal Sc according to the compensation ratio of Yt 255 Y m , such that the images displayed on the display 270 become brighter due to the increase of the power of the backlight module 272.
- the tristimulus value Y of the display 270 is equal to Y 255 , such that the display 270 displays images with enough illumination, and the user may see the desired images.
- the tristimulus value Y' m is equal to 135.97, such that the related compensation ratio is equal to Yt ⁇ 255 135.97 i . e . Yt ⁇ 255 Y ⁇ m . Therefore, the illumination difference between the displayed images and the desired images of the display may be compensated according to the compensation ratio Yt ⁇ 255 Y ⁇ m .
- a transform model is established for color transformation between a first color space and a second color space.
- Three first native display curves are established according to measured data sets, wherein the measured data sets are generated by a measurement unit when the display displays three primary-color patterns, a black pattern, and a plurality of gray-level patterns. Therefore, a total number of the test patterns for establishing the three first native display curves of the display is reduced.
- the three first native display curves then are converted into three second native display curves according to the transform model. Therefore, the native color characteristics of the display in the second color space may be established by the three second native display curves.
- three look-up tables for color calibration of the display are established according to three final target curves and the three second native display curves.
- the display is calibrated according to the three look-up tables such that the color temperature of the display may be substantially constant for every gray-level.
- the power of a light source (e.g. a backlight module) of the display may be adjusted according to a compensation ratio, such that the illumination difference between the displayed images and the desired images may be compensated.
- the term "the invention”, “the present invention” or the like does not necessarily limit the claim scope to a specific embodiment, and the reference to particularly preferred exemplary embodiments of the invention does not imply a limitation on the invention, and no such limitation is to be inferred.
- the invention is limited only by the spirit and scope of the appended claims.
- the abstract of the disclosure is provided to comply with the rules requiring an abstract, which will allow a searcher to quickly ascertain the subject matter of the technical disclosure of any patent issued from this disclosure. It is submitted with the understanding that it will not be used to interpret or limit the scope or meaning of the claims. Any advantages and benefits described may not apply to all embodiments of the invention.
Landscapes
- Engineering & Computer Science (AREA)
- Multimedia (AREA)
- Signal Processing (AREA)
- Health & Medical Sciences (AREA)
- Biomedical Technology (AREA)
- General Health & Medical Sciences (AREA)
- Physics & Mathematics (AREA)
- Computer Hardware Design (AREA)
- General Physics & Mathematics (AREA)
- Theoretical Computer Science (AREA)
- Control Of Indicators Other Than Cathode Ray Tubes (AREA)
- Controls And Circuits For Display Device (AREA)
- Processing Of Color Television Signals (AREA)
Description
- The present invention is related to a calibration system and a method thereof for calibrating a display, and more specifically, to a calibration system and a method thereof for color calibration of a display.
- In the recent years, the display technology has significantly developed. A significant portion of the traditional cathode ray tube (CRT) displays has been replaced by the panel displays. One of the most common panel displays is the thin-film transistor liquid crystal display (TFT-LCD). In addition, the plasma display and the organic light emitting diode (OLED) display become more and more common. The display part of the panel display includes the pixel array. The pixel array is an ordinary matrix array, and the pixel array is driven by a driver. The driver drives the corresponding pixels based on the arrayed image data. The pixels display the specific colors at the specific time under control by the driver. However, the color of the pixel is still required to be calibrated (such as gamma curve correction) in order to match the ideal color for the human eyes.
- Please refer to
FIG. 1, and FIG. 1 is a diagram showing the relationships between the gray level and two chromaticity values x and y of the CIE xyY color space of a conventional display panel. The vertical axis represents the two chromaticity values x and y, and the horizontal axis represents the gray level. In addition, thecurve 260 responds to the chromaticity value x, and thecurve 262 responds to the chromaticity value y. The two chromaticity values x and y are measured when the display panel displays patterns. Each of the patterns corresponds to a gray level, and the gray level is regarded as the graduation of the horizontal axis ofFIG. 1 . Each of the patterns may be a black pattern, a gray pattern, or a white pattern. For instance, the pattern corresponded to the gray level of 0 is a black pattern, the pattern corresponded to the gray level of 255 is a white pattern, and the pattern corresponded to the gray level of 1 to 254 is a gray pattern. In an ideal case, the two measured chromaticity values x and y may be constant. Otherwise, the color temperature corresponded to the gray levels is various. In other words, if the measured chromaticity values x and y are not constant, the color temperature of each of the gray levels is not fixed, such that display panel does not displays the color uniformly. - The Taiwan Patent No.
200306123 U.S. Patent No. 7,079,155 , provides an image display device, an image processing method, and a computer-readable medium adapted to perform proper color reproduction while saving memory capacity. The image display device uses a first color corrector to refer to a three-dimensional color correction table, matching a color characteristic of the image display device with a reference color characteristic based on a characteristic value of the image display device, and to apply desired color correction to the inputted image data. Then, the image display device uses second color corrector to refer to a one-dimensional color correction table for correcting gradation according to an application circumstances, and applies desired color correction to the inputted image data. - Another Taiwan Patent No.
1283852 U.S. Patent No. 7,375,854 , discloses a method for color correction. A plurality of groups of gray levels and luminance of a light source of a display device are respectively selected by a color measurement system. The selected data of each color light are respectively calculated to obtain fitting functions, and the fitting functions may fit the gray level data of each interval. The fitting luminance of the gray levels in interval is obtained by the fitting functions and formed into a look-up table. Then in order to correspond a gamma curve of normalized gray data of image to a predetermined target curve, the two gamma curves are first taken to logarithmic calculation and the modified gray signals are obtained from the look-up table, then the modified gray signals are transmitted out for providing the display device to express the gray distribution state. - Further, calibration systems and corresponding methods are disclosed by
US2005/0128497 A1 andUS2008/0309766 A1 . - In detail,
US2002/0126106 A1 shows V-T characteristic curves of three liquid crystal devices, which respectively modulate each chromatic light of red (R), green (G), or blue (B) in the projection display device. Color temperature adjustment based on the color temperature control is allowed in the following procedure: when the values of x and y coordinates for R, G, and B remains constant, as given above, the color temperature is determined by the mixture ratio of R, G, and B, regardless of values of the luminance. In order to achieve a function for changing color temperature, it is necessary to determine an ideal y characteristic curve as shown inFIG. 6 , which is obtained by multiplying a constant by an ideal y characteristic curve for gamma correction calculation (see -
FIG. 3 ) of one or more of the three liquid crystal devices (light valves), so that the displayed color made of a mixture of R, G, and B has a targeted color temperature (targeted points on the x and y coordinates on the chromaticity diagram). Each value of G and B is multiplied by a different constant so as to create a deviation between the ideal y characteristic curves of G and B. -
US2006/0071940 A1 discloses a method and a system according to the preamble of the respective independent claims. Here a liquid crystal display unit using the gradation correction method. To measure the device characteristic of the image display unit the input image signals are supplied to the maximum gradation value adjustment unit and the data conversion unit and set up so that the input image signals turn to correction image signals. The displays are shown respectively the three primary colors and black, and measured with the color brightness meter. A XYZ-RGB conversion matrix is created from measured brightness and chromaticity. All the displays of R, G and B displayed in gray from the minimum to the maximum respectively, and brightness and chromaticity of gray display are measured with the color brightness meter. The γ correction data is generated according to the change characteristic of color mixture ratio of R, G and B to such an obtained input gradation value and the data is stored in memory unit constituting the data conversion unit. A value of γ of the characteristic is e.g. "2.2" when a display based on NTSC signals is executed. As described above, any white balance can be displayed only by adjustment of the maximum gradation adjustment unit without a necessity of plural γ correction data and without changing the γ correction data. - The present invention is to provide a method of calibrating a liquid crystal display, such that the color temperature of the display may be substantially constant for every gray-level, and a corresponding calibration system.
- This object is achieved by the method of
claims 1 and the system of claim 7. - A method of calibrating a liquid crystal display includes steps of: measuring the display to generate three first measured data sets by utilizing a measurement unit while the display displays three primary-color patterns according to three primary-color-image data sets; measuring the display to generate a second measured data set by utilizing the measurement unit while the display displays a black pattern according to a black-image data set; establishing a transform model according to the three first measured data sets, the second measured data set, the three primary-color-image data sets, and the black-image data set by utilizing a processing unit; measuring the display to generate a plurality of third measured data sets by utilizing the measurement unit while the display displays a plurality of gray-level patterns according to a plurality of gray-image data sets; establishing three first native display curves according to the second measured data set and the third measured data sets by utilizing the processing unit; transforming the three first native display curves into three second native display curves by utilizing the transform model; defining three final target curves by utilizing the processing unit; establishing three look-up tables according to the three final target curves and the three second native display curves by utilizing the processing unit; providing an input image data set to the processing unit; converting the input image data set to a calibrated image data set according to the three look-up tables; and displaying a calibrated image on the display according to the calibrated image data set.
- A calibration system includes a measurement unit and a processing unit. The measurement unit is configured to measure the display so as to generate measured data sets while the display displays patterns according to image data sets. The processing unit is coupled to the measurement unit and configured to establish a transform model and three look-up tables. The processing unit establishes the transform model according to three first measured data sets, a second measured data set, three primary-color-image data sets, and a black-image data set. The measurement unit generates the three first measured data sets by measuring the display while the display displays three primary-color patterns according to the three primary-color-image data sets. The measurement unit generates the second measured data set by measuring the display while the display displays a black pattern according to the black-image data set. The processing unit uses the transform model to transform three first native display curves into three second native display curves. The processing unit establishes the three first native display curves according to the second measured data set and a plurality of third measured data sets, and the measurement unit generates the third measured data sets by measuring the display while the display displays a plurality of gray-level patterns according to a plurality of gray-image data sets. The processing unit defines three final target curves and establishes the three look-up tables according to the three final target curves and the three second native display curves. The processing unit converts an input image data set to a calibrated image data set according to the three look-up tables, and the processing unit outputs the calibrated image data set to the display, such that the display displays a calibrated image according to the calibrated image data set.
- The processing unit includes a signal generator coupled to the display and configured to output image data sets to the display.
- The three primary-color-image data sets are a red-image data set, a green-image data set, and a blue-image data set, and the three primary-color patterns are a red pattern, a green pattern, and a blue pattern. The display displays the red pattern according to the red-image data set, the display displays the green pattern according to the green-image data set, and the display displays the blue pattern according to the blue-image data set.
- Each of the gray-image data sets has a first color subset, a second color subset, and a third color subset. Three pixel values of the first color subset, the second color subset, and the third color subset are identical.
- The processing unit obtains the three final target curves by normalizing three second target curves, and the processing unit uses the transform model to transform three first target curves into the three second target curves.
- The processing unit normalizes the three second target curves by scaling the three second target curves by a ratio of a standard level to a maximum of three maximum levels of the three second target curves.
- The processing unit defines two of the three first target curves according to the rest one of the three first target curves and three chromaticity values x, y, and z of the CIE xyY color space.
- The processing unit defines the rest one of the three first target curves by scaling a gamma curve by a maximum level of a corresponding one of the three first native display curves.
- The rest one of the three first native display curves is a curve of tristimulus value Y of the CIE 1931 XYZ color space.
- The processing unit calculates a compensation ratio according to the transform model and three maximum levels of the three final target curves, and the processing unit increases a power of a light source of the display according the compensation ratio.
- A transform model is established for color transformation between a first color space and a second color space. Three first target curves are defined and transformed by the transform model so as to establish three look-up tables. The display is calibrated according to the look-up tables such that the color temperature of the display may be substantially constant for every gray-level.
- Other objectives, features and advantages of the present invention will be further understood from the further technological features disclosed by the embodiments of the present invention wherein there are shown and described preferred embodiments of this invention, simply by way of illustration of modes best suited to carry out the invention.
- The accompanying drawings are included to provide a further understanding of the invention, and are incorporated in and constitute a part of this specification. The drawings illustrate embodiments of the invention and, together with the description, serve to explain the principles of the invention.
-
FIG. 1 is a diagram showing the relationships between the gray level and two chromaticity values x and y of the CIE xyY color space of a conventional display panel. -
FIG. 2 is a functional block diagram of a display and a calibration system according to an embodiment of the present invention. -
FIG. 3 is a flow chart of the method of calibrating the display according to an embodiment of the present invention. -
FIG. 4 shows how to generate the measured data sets 351-354 by measuring the test patterns 341-344 displayed on the display according to an embodiment of the present invention. -
FIG. 5 shows how to generate the measured data sets MDI-MD255 by measuring the test patterns GPI-GP255 displayed on the display according to an embodiment of the present invention. -
FIGs. 6A-6C are diagrams illustrating three first native display curves according to an embodiment of the present invention. -
FIGs. 7A-7C are diagrams illustrating three second native display curves according to an embodiment of the present invention. -
FIGs. 8A-8C are diagrams illustrating three final target curves according to an embodiment of the present invention. -
FIG. 9 is a diagram illustrating an exemplary embodiment of the present invention when a constant color temperature of 6500K and a gamma curve of 2.2 are desired. -
FIG. 10 shows how to establish the three final target curves according to another embodiment of the present invention. -
FIG. 11 shows a way to establish one of the three look-up tables according to an embodiment of the present invention. -
FIG. 12 is a block diagram showing how the processing unit uses the three look-up tables for color calibration of the display. -
FIG. 13 is an experimental diagram showing the relationships between the gray level and two chromaticity values x and y of the display according to an embodiment of the present invention. -
FIG. 14 is another experimental diagram showing the relationships between the gray level and two chromaticity values x and y of the display according to an embodiment of the present invention. - It is to be understood that other embodiment may be utilized and structural changes may be made without departing from the scope of the present invention. Also, it is to be understood that the phraseology and terminology used herein are for the purpose of description and should not be regarded as limiting. The use of "including," "comprising," or "having" and variations thereof herein is meant to encompass the items listed thereafter and equivalents thereof as well as additional items. Unless limited otherwise, the terms "connected," "coupled," and "mounted," and variations thereof herein are used broadly and encompass direct and indirect connections, couplings, and mountings.
- Please refer to
FIG. 2, and FIG. 2 is a functional block diagram of adisplay 270 and acalibration system 280 according to an embodiment of the present invention. Thecalibration system 280 is used for color calibration of thedisplay 270. Thedisplay 270 may be, for example, a thin film transistor-liquid crystal display (TFT-LCD), an organic light emitting diode (OLED) display, a plasma display, a cathode ray tube (CRT) display, or the like. Thecalibration system 280 has ameasurement unit 282 and aprocessing unit 284. In the embodiment, themeasurement unit 282 is a photo-sensing device for sensing the color-density of thedisplay 270. For example, themeasurement unit 282 may be a CA-210 display color analyzer produced by KONICA MINOLTA○,R, Inc. However, the present invention is not limited thereto. In addition, theprocessing unit 284 may be a computer, a personal digital assistant (PDA), a set to box (STB), or the like. Theprocessing unit 284 is coupled to themeasurement unit 282 and thedisplay 270, and theprocessing unit 284 includes asignal generator 286. Thesignal generator 286 is coupled to thedisplay 270 and configured to output image data sets SG to thedisplay 270, such that thedisplay 270 displays corresponding patterns based on the received output image data sets SG. In the embodiment, thesignal generator 286 is a graphic adapter. However, the present invention is not limited thereto. Themeasurement unit 282 is configured to measure thedisplay 270 so as to generate measured data sets SM while thedisplay 270 displays patterns according to the image data sets SG. In the embodiment, the image data sets SG are image data of the RGB color system and may be represented as

- Please refer to
FIG. 3, and FIG. 3 is a flow chart of the method of calibrating thedisplay 270 according to an embodiment of the present invention. In Step S302, theprocessing unit 284 establishes atransform model 288 for color transformation between a first color space and a second color space. In the embodiment, the first color space is the RGB color space, and the RGB color space is defined by the three chromaticities of the red, green, and blue additive primaries. The second color space is the CIE 1931 XYZ color space. An exemplary transform model, established by theprocessing unit 284, for color transformation between the RGB color space and the CIE 1931 XYZ color space is mathematically represented as follows:
where the parameters OR, OG, and OB represent the offsets of the pixel values of the image data sets SG for red, green, and blue respectively; and the parameters C11-C13, C21-C23, and C31-C33 are coefficients of a transformation matrix
- Referring to
FIGs. 4 and2 , before establishing thetransform model 288, thesignal generator 286 transmits three primary-color-image data sets 331-333 to thedisplay 270, such that thedisplay 270 displays three primary-color patterns 341-343 according to the received primary-color-image data sets 331-333. The three primary-color-image data sets 331-333 are a red-image data set 331, a green-image data set 332, and a blue-image data set 333. The three primary-color patterns 341-343 are ared pattern 341, agreen pattern 342, and ablue pattern 343. Thedisplay 270 displays thered pattern 341 according to the red-image data set 331, displays thegreen pattern 342 according to the green-image data set 332, and displays theblue pattern 343 according to the blue-image data set 333. In the embodiment, the three primary-color-image data sets 331-333 are image data of the RGB color system and are respectively represented as

display 270. When thedisplay 270 displays the three primary-color patterns 341-343, themeasurement unit 282 is used to measure thedisplay 270 so as to generate three first measured data sets 351-353. In the embodiment, the three first measured data sets 351-353 are respectively represented as

measurement unit 282 generates the measured data set
display 270 displays thered pattern 341, themeasurement unit 282 generates the measured data set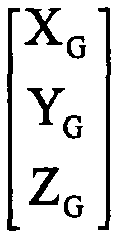
display 270 displays thegreen pattern 342, and themeasurement unit 282 generates the measured data set
display 270 displays theblue pattern 343. According to the equation (1), the relationships between the three primary-color-image data sets 331-333 and the three first measured data sets 351-353 are described as follows:


- Moreover, a black-
image data set 334 is transmitted to thedisplay 270, such that thedisplay 270 displays ablack pattern 344 according to the black-image data set 334. In the embodiment, the black-image data set 334 is represented as
display 270 displays theblack pattern 344, themeasurement unit 282 measures thedisplay 270 so as to generate a second measureddata set 354. In the embodiment, the second measureddata set 354 is represented as
image data set 334 and the second measureddata set 354 are described as follows:
- Since each parameter of the measured data sets


processing unit 284 may calculate the values of the parameters C11-C13, C21-C23, C31-C33, OR, OG, and OB according to the equations (2)-(5). Therefore, theprocessing unit 284 establishes thetransform model 288 according to the three first measured data sets 351-354, the second measureddata set 354, the three primary-color-image data sets 331-333, and the black-image data set 334. Anexemplary transform model 288 is represented as follows:
- Please refer
FIG. 3 again. After thetransform model 288 is established, theprocessing unit 284 establishes three first native display curves of thedisplay 270 in step S304. Before establishing the three first native display curves of thedisplay 270, thesignal generator 286 of theprocessing unit 284 transmits a plurality of gray-image data sets to thedisplay 270. Please refer toFIGs. 2 and5 . Thesignal generator 286 transmits a plurality of gray-image data sets TPI-TP255 to thedisplay 270, such that thedisplay 270 displays a plurality of gray-level patterns GP1-GP255 according to a plurality of gray-image data sets TP1-TP255. In the embodiment, the gray-image data sets TP1-TP255 are image data of the RGB color system and are respectively represented as


display 270 displays the gray-level pattern GP according to the 1st gray-image data set TP1, displays the gray-level pattern GP2 according to the 2nd gray-image data set TP2, displays the gray-level pattern GP3 according to the 3rd gray-image data set TP3, and so on. The gray-image data sets TP1-TP255 may be simultaneously or sequentially displayed on thedisplay 270. When thedisplay 270 displays the gray-level patterns GP1-GP255, themeasurement unit 282 measures thedisplay 270 so as to generate a plurality of third measured data sets MD1-MD255. Themeasurement unit 282 generates the measured data set MD1 by measuring thedisplay 270 while thedisplay 270 displays the gray-level pattern GP1, and themeasurement unit 282 generates the measured data set MD2 by measuring thedisplay 270 while thedisplay 270 displays the gray-level pattern GP2, and so on. In the embodiment, the third measured data sets MD1-MD255 are data of the CIE 1931 XYZ color space and are respectively represented as

- In the step S304, the
processing unit 284 establishes the three first native display curves of thedisplay 270 according to the second measured data set


FIGs. 6A-6C, and FIGs. 6A-6C are diagrams illustrating the three first native display curves 361-363 according to an embodiment of the present invention. The vertical axes of the three first native display curves 361-363 respectively represent the tristimulus values X, Y, and Z of the CIE 1931 XYZ color space, and the horizontal axes of the three first native display curves 361-363 represent an index corresponded to the gray level of one of the gray-image data sets TP1-TP255 or to the gray level of the black-image data set 334. For instance, after themeasurement unit 282 measures the nth gray-level pattern GPn, themeasurement unit 282 generates corresponding one (i.e. the nth one MDn) of the third measured data sets MD1-MD255, where the measured data set MDn may be represented as

FIGs. 6A-6C are determined based on the second measured data set
FIGs. 6A-6C are (0, X0), (0, Y0), and (0, Z0) respectively. - Please refer
FIG. 3 again. In step S306, theprocessing unit 284 transforms the three first native display curves 361-363 into three second native display curves by using thetransform model 288. Please refer toFIGs. 7A-7C, and FIGs. 7A-7C are diagrams illustrating the three second native display curves 371-373 according to an embodiment of the present invention. The vertical axes of the three second native display curves 371-373 respectively represent the visual pixel values R, G, and B of the RGB color space, and the horizontal axes of the second native display curves 371-373 represent the original pixel values R, G, and B of the RGB color space. For example, a node D of thenative display curve 371, a node E of thenative display curve 372, and a node F of thenative display curve 373 are corresponding to an original pixel value of n, while the nodes D, E, and F correspond to the visual pixel values Rn, Gn, and Bn respectively. By using thetransform model 288, the measured data set


processing unit 284 is capable of transforming the three first native display curves 361-363 into the three second native display curves 371-373 by using thetransform model 288. - Please refer
FIG. 3 again. In step S308, theprocessing unit 284 defines three final target curves. ReferringFIGs. 8A-8C , the three final target curves 381-383 defined by theprocessing unit 284 are illustrated. After the color calibration of thedisplay 270 is finished, the characteristics of the calibrateddisplay 270 may be substantially represented by the three final target curves 381-383. The horizontal axes ofFIGs. 8A-8C represent the input pixel value for red, green, and blue respectively. The vertical axes ofFIGs. 8A-8C represent the displayed pixel value of thedisplay 270 for red, green, and blue respectively. - In an embodiment of the present invention, when the
processing unit 284 defines the three final target curves 381-383, theprocessing unit 284 firstly transforms three first target curves into three second target curves and then normalizes the three second target curves to obtain the three final target curves. Referring toFIG. 9 , three first target curves 391-393 are transformed into three second target curves 401-403 by theprocessing unit 284, and theprocessing unit 284 normalizes the three second target curves 401-403 to obtain the three final target curves 381-383. The three first target curves 391-393 are curves showing the desired tristimulus values X, Y, and Z of thedisplay 270 after finishing the color calibration of thedisplay 270. In the present embodiment, thefirst target curve 392 is transformed from a gamma curve. For example, a gamma curve with a gamma value of 2.2 is defined by:
where VIN represents the input of the gamma curve, VIN represents the output of the gamma curve, 0 ≦ VIn ≦ 1, and 0 ≦ VOut ≦ 1. - In the embodiment, the
processing unit 284 defines thefirst target curve 392 by scaling the gamma curve by a maximum level of the firstnative display curve 362, wherein the firstnative display curve 362 corresponds to thefirst target curve 392, such that thefirst target curve 392 may be represented as follows:
- where, in the embodiment, Yt255 is equal to the maximum of the tristimulus value Y of the native display curves 362 (i.e. Yt255= Y255);
- n represents the value of the index; and
- Ytn represents a corresponding tristimulus value Y of the
first target curve 392 when the index is equal to n. - After the
processing unit 284 defines thefirst target curve 392, the other two first target curves 391 and 393 may be defined by theprocessing unit 284 according to thefirst target curve 392 and three chromaticity values x, y, and z of the CIE xyY color space. According to the specification of the CIE xyY color space, the three chromaticity values x, y, and z are respectively defined as:


- Therefore, the tristimulus values X and Z may be represented as follows:


- In the embodiment, a constant color temperature is desired, such that the three chromaticity values x, y, and z for the constant color temperature are fixed. Since the chromaticity values x, y, and z are fixed, the other two first target curves 391 and 393 may be respectively represented as follows:


- After the
processing unit 284 defines the three first target curves 391-393, theprocessing unit 284 uses thetransform model 288 to transform the three first target curves 391-393 into three second target curves 401-403. Therefore, the pixel values Rtn, Gtn, and Btn of the three second target curves 401-403 shown inFIG. 9 may be calculated as follows:
- Noticeably, the maximum levels of the three second target curves 401-403 may be greater than 255 (i.e. a standard level for the RGB system). In such case, the three second target curves 401-403 may be scaled so as to match the standard level. Before the
processing unit 284 scales the three second target curves 401-403, a scaling ratio is defined by theprocessing unit 284. In an embodiment, the scaling ratio is equal to a ratio of the standard level to a maximum of three maximum levels of the three second target curves 401-403. For example, in the embodiment, the three maximum levels of the three second target curves 401-403 are 265, 255, and 240, such that the maximum of three maximum levels of the three second target curves 401-403 is 265. Since the standard level is equal to 255 (i.e. 28-1), the scaling ratio is 255/265. In detail, the three final target curves 381-383 may be respectively represented as follows:


where the parameter Rs represents the scaling ratio. -
FIG. 9 is a diagram illustrating an exemplary embodiment of the present invention when a constant color temperature of 6500K and a gamma curve of 2.2 are desired. In other embodiments of the present invention, theprocessing unit 284 may establish different three final target curves based on different requirements of color calibration of thedisplay 270. For example, thedisplay 270 may be a specific display satisfying with the specification of Digital Imaging and Communications in Medicine (DICOM). Referring toFIG. 10 , three first target curves 411-413 of a DICOM display are illustrated. Theprocessing unit 284 uses thetransform model 288 to transform the three first target curves 411-413 into three second target curves 421-423, and then scales the three second target curves 421-423 by a scaling ratio. In the embodiment, the scaling ratio is equal to 255/336. The pixel values Rt'n, Gt'n, and Bt'n of the three second target curves 421-423 shown inFIG. 10 may be calculated as follows:
- Moreover, the three final target curves 431-433 may be respectively represented as follows:


where the parameter R's represents the scaling ratio of the present embodiment. - Please refer to
FIGs. 2 and3 again. After the three final target curves are established, theprocessing unit 284 establishes three look-up tables 291-293 according to the three final target curves and the three second native display curves. Take the embodiment shown inFIGs. 7A-7C andFIG. 9 for example, theprocessing unit 284 establishes the three look-up tables 291-293 according to the three final target curves 381-383 and the three second native display curves 371-373. In detail, theprocessing unit 284 establishes the first look-up table 291 according to the final target curves 381 and the second native display curves 371, theprocessing unit 284 establishes the second look-up table 292 according to the final target curves 382 and the second native display curves 372, and theprocessing unit 284 establishes the third look-up table 293 according to the final target curves 383 and the second native display curves 373. The three look-up tables 291-293 are used for color calibration of thedisplay 270 for red, green, and blue respectively.FIG. 11 shows how to establish one of the three look-up tables 291-293 according to an embodiment of the present invention. As shown inFIG. 11 , one of the three final target curves 381-383 is illustrated on the right, one of the three second native display curves 371-373 is illustrated on the middle, and the corresponding look-up table established by theprocessing unit 284 is illustrated on the left.FIG. 11 shows the mapping relationships between the input pixel values and the displayed pixel values of the final target curve. The look-up table, the second native display curve, and the final target curve correspond to the same color (i.e. red, green, or blue). According to the final target curve shown inFIG. 11 , when an input pixel value is 130, the corresponding displayed pixel value may be 102. Moreover, as shown inFIG. 11 , a calibrated pixel value of the second native display curve corresponding to the displayed pixel value of 102 is 128, such that a relationship, of the look-up table, between the input pixel value of 130 and the calibrated pixel value of 128 may be established by theprocessing unit 284. Similarly, more relationships between the input pixel value and the calibrated pixel value may be established in the look-up table. After the relationships between the input pixel values and the calibrated pixel values are established in the three look-up tables, theprocessing unit 284 may convert a received input image data set to a calibrated image data set according to the three look-up tables. - Please refer to
FIG. 12 . When theprocessing unit 284 receives an input image data set Sin, theprocessing unit 284 converts the input image data set Sin to a calibrated image data set Scb according to the three look-up tables 291-293. The calibrated image data set Scb may be transmitted to thedisplay 270, such that thedisplay 270 displays a calibratedimage 440 according to the calibrated image data set Scb. - Please refer to
FIG. 13, and FIG. 13 is an experimental diagram showing the relationships between the gray level and two chromaticity values x and y of thedisplay 270 according to an embodiment of the present invention. The vertical axis represents the two chromaticity values x and y, and the horizontal axis represents the gray level. In addition, thecurve 450 responds to the chromaticity value y, and thecurve 452 responds to the chromaticity value x. The two chromaticity values x and y are substantially constant, such that thedisplay 270 substantially has a constant color temperature for every gray-level. - Please refer to
FIG. 14, and FIG. 14 is another experimental diagram showing the relationships between the gray level and two chromaticity values x and y of thedisplay 270 according to an embodiment of the present invention. The vertical axis represents the two chromaticity values x and y, and the horizontal axis represents the gray level. In addition, thecurve 460 responds to the chromaticity value y, and thecurve 462 responds to the chromaticity value x. The two chromaticity values x and y are substantially constant, such that the color temperature of thedisplay 270 is substantially constant for every gray-level. - Please refer to
FIG. 2 again. In an embodiment of the present embodiment, thedisplay 270 is a liquid crystal display (LCD) and has alight source 272. Thelight source 272 is a backlight module, and the backlight module provides light when thedisplay 270 is turned on. According the equations (17)-(19) or (21)-(23), after the three second target curves 401-403 or 421-423 are scaled (i.e. normalized) by theprocessing unit 284, the pixel values (Rfn, Gfn, Bin) or (Rf'n, Gf'n, Bf'n) are decreased as compared with the pixel values (Rtn, Gtn, Btn) or (Rt'n, Gt'n, Bt'n). Therefore, the images displayed on thedisplay 270 may be darker than the images that a user desires to see. In order to compensate the illumination difference between the displayed images and the desired images, theprocessing unit 284 transmits a control signal Sc to thebacklight module 272 so as to increase the power of thebacklight module 272. Accordingly, the images displayed on thedisplay 270 may become brighter and may be satisfied by the user. - In an embodiment of the present invention, the
processing unit 284 generates the control signal Sc according to the three maximum levels of the three final target curves. Referring toFIG. 9 , the three maximum levels of the three final target curves 381-383 are 255, 245, and 231. According to the equation (1), the relationships between the three maximum levels of the three final target curves 381-383 and three corresponding tristimulus values (Xm, Ym, Zm) may be represented as follows:
- In the embodiment, the three maximum levels of the three final target curves 381-383 are 255, 245, and 231, the corresponding values (Xm, Ym, Zm) of the three tristimulus values X, Y, and Z are 146, 161, and 85. Then, the
processing unit 284 obtains a compensation ratio of
processing unit 284 generates the control signal Sc according to the compensation ratio of
display 270 become brighter due to the increase of the power of thebacklight module 272. Finally, after the power of thebacklight module 272 is increased, the tristimulus value Y of thedisplay 270 is equal to Y255, such that thedisplay 270 displays images with enough illumination, and the user may see the desired images. - Similarly, three tristimulus values (X'm, Y'm, Z'm) corresponded to the three maximum levels of the three final target curves 431-433 shown in
FIG. 10 , may be calculated according to the equation (1). That is:
In this case, the tristimulus value Y'm, is equal to 135.97, such that the related compensation ratio is equal to
compensation ratio 
- In overview, in the embodiments of the invention, a transform model is established for color transformation between a first color space and a second color space. Three first native display curves are established according to measured data sets, wherein the measured data sets are generated by a measurement unit when the display displays three primary-color patterns, a black pattern, and a plurality of gray-level patterns. Therefore, a total number of the test patterns for establishing the three first native display curves of the display is reduced. The three first native display curves then are converted into three second native display curves according to the transform model. Therefore, the native color characteristics of the display in the second color space may be established by the three second native display curves. Then, three look-up tables for color calibration of the display are established according to three final target curves and the three second native display curves. The display is calibrated according to the three look-up tables such that the color temperature of the display may be substantially constant for every gray-level. Moreover, the power of a light source (e.g. a backlight module) of the display may be adjusted according to a compensation ratio, such that the illumination difference between the displayed images and the desired images may be compensated.
- The foregoing description of the preferred embodiments of the invention has been presented for purposes of illustration and description. It is not intended to be exhaustive or to limit the invention to the precise form or to exemplary embodiments disclosed. Accordingly, the foregoing description should be regarded as illustrative rather than restrictive. Obviously, many modifications and variations will be apparent to practitioners skilled in this art. The embodiments are chosen and described in order to best explain the principles of the invention and its best mode practical application, thereby to enable persons skilled in the art to understand the invention for various embodiments and with various modifications as are suited to the particular use or implementation contemplated. It is intended that the scope of the invention be defined by the claims appended hereto and their equivalents in which all terms are meant in their broadest reasonable sense unless otherwise indicated. Therefore, the term "the invention", "the present invention" or the like does not necessarily limit the claim scope to a specific embodiment, and the reference to particularly preferred exemplary embodiments of the invention does not imply a limitation on the invention, and no such limitation is to be inferred. The invention is limited only by the spirit and scope of the appended claims. The abstract of the disclosure is provided to comply with the rules requiring an abstract, which will allow a searcher to quickly ascertain the subject matter of the technical disclosure of any patent issued from this disclosure. It is submitted with the understanding that it will not be used to interpret or limit the scope or meaning of the claims. Any advantages and benefits described may not apply to all embodiments of the invention. It should be appreciated that variations may be made in the embodiments described by persons skilled in the art without departing from the scope of the present invention as defined by the following claims. Moreover, no element and component in the present disclosure is intended to be dedicated to the public regardless of whether the element or component is explicitly recited in the following claims.
Claims (14)
- A method of calibrating a liquid crystal display (270), the method comprising steps of:measuring the display (270) to generate three first measured data sets (351-353) of the CIE XYZ color space of three primary-color patterns by utilizing a measurement unit (282) while the display (270) is displaying three primary-color patterns (341-343) according to three primary-color-image data sets (331-333);measuring the display (270) to generate a second measured data set (354) of the CIE XYZ color space of a black pattern by utilizing the measurement unit (282) while the display (270) is displaying a black pattern (344) according to a black-image data set (334);establishing a color transform model (288) between a first color space and a second color space according to the three first measured data sets (351-353), the second measured data set (354), the three primary-color-image data sets (331-333), and the black-image data set (334) by utilizing a processing unit (284), wherein the second color space is CIE XYZ color space;measuring the display (270) to generate a plurality of third measured data sets (MD1-MD255) of the CIE XYZ color space of gray-level patterns by utilizing the measurement unit (282) while the display (270) is displaying a plurality of gray-level patterns (GP1-GP255) according to a plurality of gray-image data sets (TP1-TP255);establishing three first native display curves (361-363) according to the second measured data set (354) and the third measured data sets (MD1-MD255) by utilizing the processing unit (284);transforming the three first native display curves (361-363) into three second native display curves (371-373) by utilizing the color transform model (288);defining three final target curves (381-383) for representing the characteristics of the calibration display after the color calibration of the display is finished, by utilizing the processing unit (284), comprising:normalizing three second target curves (401-403) to obtain the three final target curves (381-383) by utilizing the processing unit (284);transforming three first target curves (391-393) in the first color space into the three second target curves (401-403) in the second color space by utilizing the color transform model (288), and the processing unit (284) is normalizing the three second target curves (401-403) by scaling the three second target curves (401-403) by a ratio of a standard level to a maximum of three maximum levels of the three second target curves (401-403);establishing three look-up tables (291-293) according to input pixel values of the three final target curves (381-383) and calibrated pixel values of the three second native display curves (371-373) wherein the three look-up tables (291-293) are used for color calibration of the display for red, green, and blue respectively, by utilizing the processing unit (284);providing an input image data set (Sin) to the processing unit (284);converting the input image data set (Sin) to a calibrated image data set (Scb) according to the three look-up tables (291-293); anddisplaying a calibrated image (440) on the display (270) according to the calibrated image data set (Scb),wherein the vertical axes of the three first native display curves (361-363) respectively represent the tristimulus values X, Y, and of the CIE XYZ color space and the horizontal axes of the three first native display curves (361-363) represent an index corresponding to the gray level;characterized bycalculating a compensation ratio according to the color transform model (288) from three tristimulus values (X, Y, and Z) corresponding to and three maximum levels of the three final target curves (381-383), wherein a maximum of one of the three first native display curves (361-363) divided by a corresponding tristimulus value Ym is the compensation ratio, and the corresponding tristimulus value Ym is calculated by using the color transform model (288) and the three maximum levels of the three final target curves (381-383); andincreasing a power of a light source of the display (270) according the compensation ratio.
- The method as claimed in claim 1, wherein the three primary-color-image data sets (331-333) are a red-image data set (331), a green-image data set (332), and a blue-image data set (333), and the three primary-color patterns (341-343) are a red pattern (341), a green pattern (342), and a blue pattern (343), wherein the display (270) is displaying the red pattern (341) according to the red-image data set (331), the display (270) is displaying the green pattern (342) according to the green-image data set (332), and the display (270) is displaying the blue pattern (343) according to the blue-image data set (333).
- The method as claimed in claim 1, wherein each of the gray-image data sets (TP1-TP255) has a first color subset, a second color subset, and a third color subset, and three pixel values of the first color subset, the second color subset, and the third color subset are identical.
- The method as claimed in claim 1, wherein the processing unit (284) is defining two of the three first target curves (391-393) according to the rest one of the three first target curves (391-393) and three chromaticity values x, y, and z of the CIE xyY color space.
- The method as claimed in claim 4, wherein the processing unit (284) is defining the rest one of the three first target curves (391-393) by scaling a gamma curve by a maximum level of a corresponding one of the three first native display curves (361-363).
- The method as claimed in claim 5, wherein the rest one of the three first native display curves (361-363) is a curve of tristimulus value Y of the CIE 1931 XYZ color space.
- A calibration system for calibrating a liquid crystal display (270), the calibration system comprising:a measurement unit (282) configured to measure the display (270) so as to generate measured data sets of CIE XYZ color space while the display (270) is displaying patterns according to different image data sets; anda processing unit (284), coupled to the measurement unit (282) and configured to establish a color transform model (288) and three look-up tables (291-293);wherein the processing unit (284) is establishing the color transform model (288) between a first color space and a second color space according to three first measured data sets (351-353) of three primary-color patterns, a second measured data set (354) of a black pattern, three primary-color-image data sets (331-333), and a black-image data set (334), the measurement unit (282) is generating the three first measured data sets (351-353) by measuring the display (270) while the display (270) is displaying three primary-color patterns (341-343) according to the three primary-color-image data sets (331-333), and the measurement unit (282) is generating the second measured data set (354) by measuring the display (270) while the display (270) is displaying a black pattern (344) according to the black-image data set (334), wherein the second color space is CIE XYZ color space;wherein the processing unit (284) is using the color transform model (288) to transform three first native display curves (361-363) into three second native display curves (371-373), the processing unit (284) is establishing the three first native display curves (361-363) according to the second measured data set (354) and a plurality of third measured data sets (MD1-MD255) of gray-level patterns, and the measurement unit (282) is generating the third measured data sets (MD1-MD255) by measuring the display (270) while the display (270) is displaying a plurality of gray-level patterns (GP1-GP255) according to a plurality of gray-image data sets (TP1-TP255);wherein the processing unit (284) is defining three final target curves (381-383) for representing the characteristics of the calibration display after the color calibration of the display is finished by normalizing three second target curves (401-403), the processing unit (284) is using the color transform model (288) to transform three first target curves (381-383) in the first color space into the three second target curves (401-403) in the second color space, and the processing unit (284) is establishing the three look-up tables (291-293) according to input pixel values of the three final target curves (381-383) and calibrated pixel values of the three second native display curves (371-373), wherein the three look-up tables (291-293) are used for color calibration of the display for red, green, and blue respectively, andwherein the processing unit (284) is converting an input image data set (Sin) to a calibrated image data set (Scb) according to the three look-up tables (291-293), and the processing unit (284) is outputting the calibrated image data set (Scb) to the display (270), such that the display (270) is displaying a calibrated image (440) according to the calibrated image data set (Scb),wherein the vertical axes of the three first native display curves (361-363) respectively represent the tristimulus values X, Y, and Z of the CIE XYZ color space, and the horizontal axes of the three first native display curves (361-363) represent an index corresponding to the gray level;characterized in thatthe processing unit (284) is calculating a compensation ratio according to the color transform model (288) from three tristimulus values (X, Y, and Z) corresponding to and three maximum levels of the three final target curves (381-383), wherein a maximum of one of the three first native display curves (361-363) divided by a corresponding tristimulus value Ym is the compensation ratio, and the corresponding tristimulus value Ym is calculated by using the color transform model (288) and the three maximum levels of the three final target curves (381-383), and the processing unit (284) is increasing a power of a light source of the display (270) according the compensation ratio.
- The calibration system as claimed in claim 7, wherein the processing unit (284) has a signal generator (286) coupled to the display (270) and configured to output image data sets (SG) to the display (270).
- The calibration system as claimed in claim 7, wherein the three primary-color-image data sets (331-333) are a red-image data set (331), a green-image data set (332), and a blue-image data set (333), and the three primary-color patterns (341-343) are a red pattern (341), a green pattern (342), and a blue pattern (343), wherein the display (270) is displaying the red pattern (341) according to the red-image data set (331), the display (270) is displaying the green pattern (342) according to the green-image data set (332), and the display (270) is displaying the blue pattern (343) according to the blue-image data set (333).
- The calibration system as claimed in claim 7, wherein each of the gray-image data sets (TP1-TP255) has a first color subset, a second color subset, and a third color subset, and three pixel values of the first color subset, the second color subset, and the third color subset are identical.
- The calibration system as claimed in claim 7, wherein the processing unit (284) is normalizing the three second target curves (401-403) by scaling the three second target curves (401-403) by a ratio of a standard level to a maximum of three maximum levels of the three second target curves (401-403).
- The calibration system as claimed in claim 7, wherein the processing unit (284) is defining two of the three first target curves (391-393) according to the rest one of the three first target curves (391-393) and three chromaticity values x, y, and z of the CIE xyY color space.
- The calibration system as claimed in claim 12, wherein the processing unit (284) is defining the rest one of the three first target curves (391-393) by scaling a gamma curve by a maximum level of a corresponding one of the three first native display curves (361-363).
- The calibration system as claimed in claim 13, wherein the rest one of the three first native display curves (361-363) is a curve of tristimulus value Y of the CIE 1931 XYZ color space.
Applications Claiming Priority (1)
| Application Number | Priority Date | Filing Date | Title |
|---|---|---|---|
| US17144809P | 2009-04-21 | 2009-04-21 |
Publications (3)
| Publication Number | Publication Date |
|---|---|
| EP2244486A2 EP2244486A2 (en) | 2010-10-27 |
| EP2244486A3 EP2244486A3 (en) | 2012-10-31 |
| EP2244486B1 true EP2244486B1 (en) | 2014-12-31 |
Family
ID=40834491
Family Applications (1)
| Application Number | Title | Priority Date | Filing Date |
|---|---|---|---|
| EP09007777.7A Active EP2244486B1 (en) | 2009-04-21 | 2009-06-12 | Color calibration system and method for a display |
Country Status (3)
| Country | Link |
|---|---|
| US (1) | US8704848B2 (en) |
| EP (1) | EP2244486B1 (en) |
| TW (1) | TWI457553B (en) |
Families Citing this family (19)
| Publication number | Priority date | Publication date | Assignee | Title |
|---|---|---|---|---|
| KR101803571B1 (en) * | 2011-06-17 | 2017-11-30 | 엘지디스플레이 주식회사 | Stereoscopic Image Display Device and Driving Method thereof |
| US9076252B2 (en) | 2012-01-05 | 2015-07-07 | Qualcomm Incorporated | Image perceptual attribute adjustment |
| TWI602419B (en) | 2012-12-24 | 2017-10-11 | 台達電子工業股份有限公司 | Adjusting method and display apparatus using same |
| KR102071056B1 (en) * | 2013-03-11 | 2020-01-30 | 삼성디스플레이 주식회사 | Display device and method for compensation of image data of the same |
| US9881586B2 (en) | 2014-05-22 | 2018-01-30 | Disney Enterprises, Inc. | Utilizing heuristics to enable self-adjusting displays |
| JP2016050982A (en) * | 2014-08-29 | 2016-04-11 | サイバネットシステム株式会社 | Luminance correction device and system including the same, and luminance correction method |
| TWI600856B (en) * | 2016-10-28 | 2017-10-01 | Full color lighting fixtures method | |
| CN108024410B (en) * | 2016-11-02 | 2020-06-02 | 新谱光科技股份有限公司 | Calibration method of full-color LED lighting fixtures |
| TWI619111B (en) * | 2017-02-16 | 2018-03-21 | 明基電通股份有限公司 | Display system |
| TWI667610B (en) * | 2018-08-07 | 2019-08-01 | 鈺緯科技開發股份有限公司 | Automatic Gamma curve setting method for display |
| US11114059B2 (en) * | 2018-11-02 | 2021-09-07 | Portrait Displays, Inc. | System and method for color calibration |
| CN109729333B (en) * | 2018-12-28 | 2021-02-05 | 深圳Tcl新技术有限公司 | Color space mapping method, device, computer readable storage medium and system |
| US10964240B1 (en) * | 2019-10-23 | 2021-03-30 | Pixelworks, Inc. | Accurate display panel calibration with common color space circuitry |
| KR102714847B1 (en) * | 2019-10-25 | 2024-10-10 | 삼성전자주식회사 | Display apparatus and driving method thereof |
| CN113496683B (en) * | 2020-04-01 | 2022-10-21 | 敦泰电子股份有限公司 | Display adjustment method of vehicle display |
| TWI751571B (en) * | 2020-06-02 | 2022-01-01 | 仁寶電腦工業股份有限公司 | Video playback system and environment atmosphere adjusting method |
| WO2023085037A1 (en) * | 2021-11-10 | 2023-05-19 | 三井化学株式会社 | Information processing device, information processing method, and computer program |
| CN114690464A (en) * | 2022-03-21 | 2022-07-01 | Tcl华星光电技术有限公司 | Display panel and manufacturing method thereof |
| WO2025147948A1 (en) * | 2024-01-11 | 2025-07-17 | Jade Bird Display (shanghai) Limited | Method and system for correcting nonuniformity of near-eye display |
Citations (1)
| Publication number | Priority date | Publication date | Assignee | Title |
|---|---|---|---|---|
| US20060071940A1 (en) * | 2004-10-01 | 2006-04-06 | Canon Kabushiki Kaisha | Correction data setting method and manufacturing method of image display apparatus |
Family Cites Families (17)
| Publication number | Priority date | Publication date | Assignee | Title |
|---|---|---|---|---|
| JPH04109702A (en) | 1990-08-30 | 1992-04-10 | Asahi Chem Ind Co Ltd | Coupling device for microwave strip line/waveguide |
| JP4834896B2 (en) | 1997-10-31 | 2011-12-14 | ソニー株式会社 | Image processing apparatus and method, image transmission / reception system and method, and recording medium |
| JP4189062B2 (en) | 1998-07-06 | 2008-12-03 | セイコーエプソン株式会社 | Electronics |
| JP3815542B2 (en) | 2000-12-13 | 2006-08-30 | 富士ゼロックス株式会社 | Color conversion device, color conversion coefficient calculation device, color conversion method, and color conversion coefficient calculation method |
| JP4150876B2 (en) | 2001-02-20 | 2008-09-17 | セイコーエプソン株式会社 | Image display system, image processing method, program, and information storage medium |
| JP4372401B2 (en) | 2001-12-21 | 2009-11-25 | シャープ株式会社 | Correction characteristic determination device, correction characteristic determination method, and display device |
| JP2003271121A (en) | 2002-03-15 | 2003-09-25 | Seiko Epson Corp | Image display system, image processing method, program, and information storage medium |
| JP3775666B2 (en) | 2002-03-18 | 2006-05-17 | セイコーエプソン株式会社 | Image display device |
| CN100533543C (en) | 2003-12-12 | 2009-08-26 | 松下电器产业株式会社 | Color image display device, color conversion device, color simulation device and method |
| JP2005196156A (en) | 2003-12-12 | 2005-07-21 | Matsushita Electric Ind Co Ltd | Color image display device, color conversion device, color simulation device, and methods thereof |
| TWI283852B (en) | 2003-12-31 | 2007-07-11 | Vast View Technology Inc | Method for color correction |
| US7375854B2 (en) | 2004-03-12 | 2008-05-20 | Vastview Technology, Inc. | Method for color correction |
| JP2005328386A (en) | 2004-05-14 | 2005-11-24 | Sharp Corp | White balance correction circuit setting system and method, LSI circuit used in the system, and liquid crystal television |
| GB0415160D0 (en) | 2004-07-06 | 2004-08-11 | Chiron Srl | Inhibitors of bacterial infection |
| JP2006113151A (en) | 2004-10-12 | 2006-04-27 | Seiko Epson Corp | Image quality adjustment method for display device, image quality adjustment device, and display device |
| JP4109702B1 (en) | 2007-02-08 | 2008-07-02 | 株式会社イクス | Image quality adjustment apparatus, image quality adjustment method, and image quality adjustment program |
| TWI336587B (en) | 2007-06-12 | 2011-01-21 | Etron Technology Inc | Color calibrating method for setting target gamma curves of target display device |
-
2009
- 2009-06-10 US US12/482,438 patent/US8704848B2/en active Active
- 2009-06-12 EP EP09007777.7A patent/EP2244486B1/en active Active
- 2009-12-16 TW TW098143239A patent/TWI457553B/en active
Patent Citations (1)
| Publication number | Priority date | Publication date | Assignee | Title |
|---|---|---|---|---|
| US20060071940A1 (en) * | 2004-10-01 | 2006-04-06 | Canon Kabushiki Kaisha | Correction data setting method and manufacturing method of image display apparatus |
Also Published As
| Publication number | Publication date |
|---|---|
| TWI457553B (en) | 2014-10-21 |
| EP2244486A2 (en) | 2010-10-27 |
| US8704848B2 (en) | 2014-04-22 |
| EP2244486A3 (en) | 2012-10-31 |
| TW201038931A (en) | 2010-11-01 |
| US20100265266A1 (en) | 2010-10-21 |
Similar Documents
| Publication | Publication Date | Title |
|---|---|---|
| EP2244486A2 (en) | Color calibration system and method for a display | |
| EP2367348B1 (en) | Method for generating a lookup table for color correction for an image display device | |
| US7502038B2 (en) | Display characteristics calibration method, display characteristics calibration apparatus, and computer program | |
| CN101521001B (en) | Color correction method and device for display device | |
| KR101367199B1 (en) | Image display device and method for revising display character thereof | |
| US7215343B2 (en) | Color correction using a device-dependent display profile | |
| CN102063888B (en) | Method and device for managing colors | |
| US20140002481A1 (en) | Method for converting data, display device, computing device and program incorporating same, and method for optimising coefficients and device and program incorporating same | |
| US8098932B2 (en) | Color correction method and apparatus of display apparatus | |
| US11380239B2 (en) | Image processing system, image processing device, and computer program | |
| US20110148907A1 (en) | Method and system for image display with uniformity compensation | |
| JP5326144B2 (en) | Calibration system and method for calibrating a display | |
| CN117746808A (en) | Display calibration method, display panel calibration system and display device | |
| CN104010176B (en) | One utilizes human eye to realize from display to printer color calibration method | |
| CN112700747B (en) | Accurate display calibration method with common color space circuitry | |
| US7969449B2 (en) | Systems and methods for color control of display devices | |
| TWI425495B (en) | Color temperature compensation method and applications thereof | |
| CN112885300B (en) | Panel calibration using multiple nonlinear models | |
| US20070146268A1 (en) | Method of realizing images in a portable display apparatus | |
| CN112802418B (en) | Panel color temperature matching correction method and system | |
| KR100843696B1 (en) | Color correction method and device of liquid crystal display device | |
| JP5203344B2 (en) | CONTROL DEVICE AND ITS CONTROL METHOD, DISPLAY CONTROL DEVICE, ELECTRONIC DEVICE, CONTROL PROGRAM USED FOR CONTROL DEVICE, AND RECORDING MEDIUM CONTAINING THE PROGRAM | |
| JP2001036758A (en) | Color correction processing method and device therefor | |
| TWI530936B (en) | Method of compensating color gamut of display |
Legal Events
| Date | Code | Title | Description |
|---|---|---|---|
| PUAI | Public reference made under article 153(3) epc to a published international application that has entered the european phase |
Free format text: ORIGINAL CODE: 0009012 |
|
| AK | Designated contracting states |
Kind code of ref document: A2 Designated state(s): AT BE BG CH CY CZ DE DK EE ES FI FR GB GR HR HU IE IS IT LI LT LU LV MC MK MT NL NO PL PT RO SE SI SK TR |
|
| AX | Request for extension of the european patent |
Extension state: AL BA RS |
|
| PUAL | Search report despatched |
Free format text: ORIGINAL CODE: 0009013 |
|
| AK | Designated contracting states |
Kind code of ref document: A3 Designated state(s): AT BE BG CH CY CZ DE DK EE ES FI FR GB GR HR HU IE IS IT LI LT LU LV MC MK MT NL NO PL PT RO SE SI SK TR |
|
| AX | Request for extension of the european patent |
Extension state: AL BA RS |
|
| RIC1 | Information provided on ipc code assigned before grant |
Ipc: H04N 9/69 20060101ALI20120927BHEP Ipc: H04N 17/02 20060101AFI20120927BHEP Ipc: H04N 9/73 20060101ALN20120927BHEP Ipc: H04N 17/04 20060101ALI20120927BHEP |
|
| 17P | Request for examination filed |
Effective date: 20130429 |
|
| 17Q | First examination report despatched |
Effective date: 20130927 |
|
| RIC1 | Information provided on ipc code assigned before grant |
Ipc: H04N 17/04 20060101ALI20140711BHEP Ipc: H04N 17/02 20060101AFI20140711BHEP Ipc: H04N 9/73 20060101ALN20140711BHEP Ipc: H04N 9/69 20060101ALI20140711BHEP |
|
| GRAP | Despatch of communication of intention to grant a patent |
Free format text: ORIGINAL CODE: EPIDOSNIGR1 |
|
| INTG | Intention to grant announced |
Effective date: 20140904 |
|
| RIN1 | Information on inventor provided before grant (corrected) |
Inventor name: LIU, CHAO-WEN Inventor name: CHIH, HUNG-WEI |
|
| GRAS | Grant fee paid |
Free format text: ORIGINAL CODE: EPIDOSNIGR3 |
|
| GRAA | (expected) grant |
Free format text: ORIGINAL CODE: 0009210 |
|
| RAP1 | Party data changed (applicant data changed or rights of an application transferred) |
Owner name: YOUNG LIGHTING TECHNOLOGY INC. |
|
| AK | Designated contracting states |
Kind code of ref document: B1 Designated state(s): AT BE BG CH CY CZ DE DK EE ES FI FR GB GR HR HU IE IS IT LI LT LU LV MC MK MT NL NO PL PT RO SE SI SK TR |
|
| REG | Reference to a national code |
Ref country code: CH Ref legal event code: EP Ref country code: GB Ref legal event code: FG4D |
|
| REG | Reference to a national code |
Ref country code: IE Ref legal event code: FG4D |
|
| REG | Reference to a national code |
Ref country code: AT Ref legal event code: REF Ref document number: 704967 Country of ref document: AT Kind code of ref document: T Effective date: 20150215 |
|
| REG | Reference to a national code |
Ref country code: DE Ref legal event code: R096 Ref document number: 602009028631 Country of ref document: DE Effective date: 20150219 |
|
| PG25 | Lapsed in a contracting state [announced via postgrant information from national office to epo] |
Ref country code: FI Free format text: LAPSE BECAUSE OF FAILURE TO SUBMIT A TRANSLATION OF THE DESCRIPTION OR TO PAY THE FEE WITHIN THE PRESCRIBED TIME-LIMIT Effective date: 20141231 Ref country code: LT Free format text: LAPSE BECAUSE OF FAILURE TO SUBMIT A TRANSLATION OF THE DESCRIPTION OR TO PAY THE FEE WITHIN THE PRESCRIBED TIME-LIMIT Effective date: 20141231 Ref country code: NO Free format text: LAPSE BECAUSE OF FAILURE TO SUBMIT A TRANSLATION OF THE DESCRIPTION OR TO PAY THE FEE WITHIN THE PRESCRIBED TIME-LIMIT Effective date: 20150331 |
|
| REG | Reference to a national code |
Ref country code: NL Ref legal event code: VDEP Effective date: 20141231 |
|
| REG | Reference to a national code |
Ref country code: LT Ref legal event code: MG4D |
|
| PG25 | Lapsed in a contracting state [announced via postgrant information from national office to epo] |
Ref country code: SE Free format text: LAPSE BECAUSE OF FAILURE TO SUBMIT A TRANSLATION OF THE DESCRIPTION OR TO PAY THE FEE WITHIN THE PRESCRIBED TIME-LIMIT Effective date: 20141231 Ref country code: GR Free format text: LAPSE BECAUSE OF FAILURE TO SUBMIT A TRANSLATION OF THE DESCRIPTION OR TO PAY THE FEE WITHIN THE PRESCRIBED TIME-LIMIT Effective date: 20150401 Ref country code: LV Free format text: LAPSE BECAUSE OF FAILURE TO SUBMIT A TRANSLATION OF THE DESCRIPTION OR TO PAY THE FEE WITHIN THE PRESCRIBED TIME-LIMIT Effective date: 20141231 Ref country code: HR Free format text: LAPSE BECAUSE OF FAILURE TO SUBMIT A TRANSLATION OF THE DESCRIPTION OR TO PAY THE FEE WITHIN THE PRESCRIBED TIME-LIMIT Effective date: 20141231 |
|
| REG | Reference to a national code |
Ref country code: AT Ref legal event code: MK05 Ref document number: 704967 Country of ref document: AT Kind code of ref document: T Effective date: 20141231 |
|
| PG25 | Lapsed in a contracting state [announced via postgrant information from national office to epo] |
Ref country code: NL Free format text: LAPSE BECAUSE OF FAILURE TO SUBMIT A TRANSLATION OF THE DESCRIPTION OR TO PAY THE FEE WITHIN THE PRESCRIBED TIME-LIMIT Effective date: 20141231 |
|
| PG25 | Lapsed in a contracting state [announced via postgrant information from national office to epo] |
Ref country code: ES Free format text: LAPSE BECAUSE OF FAILURE TO SUBMIT A TRANSLATION OF THE DESCRIPTION OR TO PAY THE FEE WITHIN THE PRESCRIBED TIME-LIMIT Effective date: 20141231 Ref country code: SK Free format text: LAPSE BECAUSE OF FAILURE TO SUBMIT A TRANSLATION OF THE DESCRIPTION OR TO PAY THE FEE WITHIN THE PRESCRIBED TIME-LIMIT Effective date: 20141231 Ref country code: CZ Free format text: LAPSE BECAUSE OF FAILURE TO SUBMIT A TRANSLATION OF THE DESCRIPTION OR TO PAY THE FEE WITHIN THE PRESCRIBED TIME-LIMIT Effective date: 20141231 Ref country code: RO Free format text: LAPSE BECAUSE OF FAILURE TO SUBMIT A TRANSLATION OF THE DESCRIPTION OR TO PAY THE FEE WITHIN THE PRESCRIBED TIME-LIMIT Effective date: 20141231 |
|
| PG25 | Lapsed in a contracting state [announced via postgrant information from national office to epo] |
Ref country code: AT Free format text: LAPSE BECAUSE OF FAILURE TO SUBMIT A TRANSLATION OF THE DESCRIPTION OR TO PAY THE FEE WITHIN THE PRESCRIBED TIME-LIMIT Effective date: 20141231 Ref country code: PL Free format text: LAPSE BECAUSE OF FAILURE TO SUBMIT A TRANSLATION OF THE DESCRIPTION OR TO PAY THE FEE WITHIN THE PRESCRIBED TIME-LIMIT Effective date: 20141231 Ref country code: IS Free format text: LAPSE BECAUSE OF FAILURE TO SUBMIT A TRANSLATION OF THE DESCRIPTION OR TO PAY THE FEE WITHIN THE PRESCRIBED TIME-LIMIT Effective date: 20150430 |
|
| REG | Reference to a national code |
Ref country code: DE Ref legal event code: R097 Ref document number: 602009028631 Country of ref document: DE |
|
| PG25 | Lapsed in a contracting state [announced via postgrant information from national office to epo] |
Ref country code: DK Free format text: LAPSE BECAUSE OF FAILURE TO SUBMIT A TRANSLATION OF THE DESCRIPTION OR TO PAY THE FEE WITHIN THE PRESCRIBED TIME-LIMIT Effective date: 20141231 Ref country code: EE Free format text: LAPSE BECAUSE OF FAILURE TO SUBMIT A TRANSLATION OF THE DESCRIPTION OR TO PAY THE FEE WITHIN THE PRESCRIBED TIME-LIMIT Effective date: 20141231 |
|
| PLBE | No opposition filed within time limit |
Free format text: ORIGINAL CODE: 0009261 |
|
| STAA | Information on the status of an ep patent application or granted ep patent |
Free format text: STATUS: NO OPPOSITION FILED WITHIN TIME LIMIT |
|
| 26N | No opposition filed |
Effective date: 20151001 |
|
| PG25 | Lapsed in a contracting state [announced via postgrant information from national office to epo] |
Ref country code: IT Free format text: LAPSE BECAUSE OF FAILURE TO SUBMIT A TRANSLATION OF THE DESCRIPTION OR TO PAY THE FEE WITHIN THE PRESCRIBED TIME-LIMIT Effective date: 20141231 |
|
| PG25 | Lapsed in a contracting state [announced via postgrant information from national office to epo] |
Ref country code: MC Free format text: LAPSE BECAUSE OF FAILURE TO SUBMIT A TRANSLATION OF THE DESCRIPTION OR TO PAY THE FEE WITHIN THE PRESCRIBED TIME-LIMIT Effective date: 20141231 |
|
| REG | Reference to a national code |
Ref country code: CH Ref legal event code: PL |
|
| PG25 | Lapsed in a contracting state [announced via postgrant information from national office to epo] |
Ref country code: SI Free format text: LAPSE BECAUSE OF FAILURE TO SUBMIT A TRANSLATION OF THE DESCRIPTION OR TO PAY THE FEE WITHIN THE PRESCRIBED TIME-LIMIT Effective date: 20141231 Ref country code: LU Free format text: LAPSE BECAUSE OF FAILURE TO SUBMIT A TRANSLATION OF THE DESCRIPTION OR TO PAY THE FEE WITHIN THE PRESCRIBED TIME-LIMIT Effective date: 20150612 |
|
| REG | Reference to a national code |
Ref country code: IE Ref legal event code: MM4A |
|
| PG25 | Lapsed in a contracting state [announced via postgrant information from national office to epo] |
Ref country code: LI Free format text: LAPSE BECAUSE OF NON-PAYMENT OF DUE FEES Effective date: 20150630 Ref country code: CH Free format text: LAPSE BECAUSE OF NON-PAYMENT OF DUE FEES Effective date: 20150630 Ref country code: IE Free format text: LAPSE BECAUSE OF NON-PAYMENT OF DUE FEES Effective date: 20150612 |
|
| PG25 | Lapsed in a contracting state [announced via postgrant information from national office to epo] |
Ref country code: BE Free format text: LAPSE BECAUSE OF FAILURE TO SUBMIT A TRANSLATION OF THE DESCRIPTION OR TO PAY THE FEE WITHIN THE PRESCRIBED TIME-LIMIT Effective date: 20141231 |
|
| REG | Reference to a national code |
Ref country code: FR Ref legal event code: PLFP Year of fee payment: 8 |
|
| PG25 | Lapsed in a contracting state [announced via postgrant information from national office to epo] |
Ref country code: MT Free format text: LAPSE BECAUSE OF FAILURE TO SUBMIT A TRANSLATION OF THE DESCRIPTION OR TO PAY THE FEE WITHIN THE PRESCRIBED TIME-LIMIT Effective date: 20141231 |
|
| PG25 | Lapsed in a contracting state [announced via postgrant information from national office to epo] |
Ref country code: BG Free format text: LAPSE BECAUSE OF FAILURE TO SUBMIT A TRANSLATION OF THE DESCRIPTION OR TO PAY THE FEE WITHIN THE PRESCRIBED TIME-LIMIT Effective date: 20141231 Ref country code: HU Free format text: LAPSE BECAUSE OF FAILURE TO SUBMIT A TRANSLATION OF THE DESCRIPTION OR TO PAY THE FEE WITHIN THE PRESCRIBED TIME-LIMIT; INVALID AB INITIO Effective date: 20090612 |
|
| REG | Reference to a national code |
Ref country code: FR Ref legal event code: PLFP Year of fee payment: 9 |
|
| PG25 | Lapsed in a contracting state [announced via postgrant information from national office to epo] |
Ref country code: CY Free format text: LAPSE BECAUSE OF FAILURE TO SUBMIT A TRANSLATION OF THE DESCRIPTION OR TO PAY THE FEE WITHIN THE PRESCRIBED TIME-LIMIT Effective date: 20141231 |
|
| PG25 | Lapsed in a contracting state [announced via postgrant information from national office to epo] |
Ref country code: TR Free format text: LAPSE BECAUSE OF FAILURE TO SUBMIT A TRANSLATION OF THE DESCRIPTION OR TO PAY THE FEE WITHIN THE PRESCRIBED TIME-LIMIT Effective date: 20141231 |
|
| REG | Reference to a national code |
Ref country code: FR Ref legal event code: PLFP Year of fee payment: 10 |
|
| PG25 | Lapsed in a contracting state [announced via postgrant information from national office to epo] |
Ref country code: MK Free format text: LAPSE BECAUSE OF FAILURE TO SUBMIT A TRANSLATION OF THE DESCRIPTION OR TO PAY THE FEE WITHIN THE PRESCRIBED TIME-LIMIT Effective date: 20141231 |
|
| PG25 | Lapsed in a contracting state [announced via postgrant information from national office to epo] |
Ref country code: PT Free format text: LAPSE BECAUSE OF FAILURE TO SUBMIT A TRANSLATION OF THE DESCRIPTION OR TO PAY THE FEE WITHIN THE PRESCRIBED TIME-LIMIT Effective date: 20141231 |
|
| REG | Reference to a national code |
Ref country code: DE Ref legal event code: R081 Ref document number: 602009028631 Country of ref document: DE Owner name: CORETRONIC CORPORATION, TW Free format text: FORMER OWNER: YOUNG LIGHTING TECHNOLOGY INC., HSINCHU, TW Ref country code: DE Ref legal event code: R082 Ref document number: 602009028631 Country of ref document: DE Representative=s name: TER MEER STEINMEISTER & PARTNER PATENTANWAELTE, DE |
|
| REG | Reference to a national code |
Ref country code: GB Ref legal event code: 732E Free format text: REGISTERED BETWEEN 20190110 AND 20190116 |
|
| PGFP | Annual fee paid to national office [announced via postgrant information from national office to epo] |
Ref country code: DE Payment date: 20250626 Year of fee payment: 17 |
|
| PGFP | Annual fee paid to national office [announced via postgrant information from national office to epo] |
Ref country code: GB Payment date: 20250620 Year of fee payment: 17 |
|
| PGFP | Annual fee paid to national office [announced via postgrant information from national office to epo] |
Ref country code: FR Payment date: 20250618 Year of fee payment: 17 |