US8704848B2 - Calibration system and method thereof for calibrating display - Google Patents
Calibration system and method thereof for calibrating display Download PDFInfo
- Publication number
- US8704848B2 US8704848B2 US12/482,438 US48243809A US8704848B2 US 8704848 B2 US8704848 B2 US 8704848B2 US 48243809 A US48243809 A US 48243809A US 8704848 B2 US8704848 B2 US 8704848B2
- Authority
- US
- United States
- Prior art keywords
- display
- image data
- curves
- data set
- processing unit
- Prior art date
- Legal status (The legal status is an assumption and is not a legal conclusion. Google has not performed a legal analysis and makes no representation as to the accuracy of the status listed.)
- Active, expires
Links
Images


Classifications
-
- H—ELECTRICITY
- H04—ELECTRIC COMMUNICATION TECHNIQUE
- H04N—PICTORIAL COMMUNICATION, e.g. TELEVISION
- H04N17/00—Diagnosis, testing or measuring for television systems or their details
- H04N17/02—Diagnosis, testing or measuring for television systems or their details for colour television signals
-
- G—PHYSICS
- G09—EDUCATION; CRYPTOGRAPHY; DISPLAY; ADVERTISING; SEALS
- G09G—ARRANGEMENTS OR CIRCUITS FOR CONTROL OF INDICATING DEVICES USING STATIC MEANS TO PRESENT VARIABLE INFORMATION
- G09G5/00—Control arrangements or circuits for visual indicators common to cathode-ray tube indicators and other visual indicators
- G09G5/02—Control arrangements or circuits for visual indicators common to cathode-ray tube indicators and other visual indicators characterised by the way in which colour is displayed
-
- H—ELECTRICITY
- H04—ELECTRIC COMMUNICATION TECHNIQUE
- H04N—PICTORIAL COMMUNICATION, e.g. TELEVISION
- H04N1/00—Scanning, transmission or reproduction of documents or the like, e.g. facsimile transmission; Details thereof
- H04N1/46—Colour picture communication systems
- H04N1/56—Processing of colour picture signals
- H04N1/60—Colour correction or control
- H04N1/6083—Colour correction or control controlled by factors external to the apparatus
- H04N1/6086—Colour correction or control controlled by factors external to the apparatus by scene illuminant, i.e. conditions at the time of picture capture, e.g. flash, optical filter used, evening, cloud, daylight, artificial lighting, white point measurement, colour temperature
-
- H—ELECTRICITY
- H04—ELECTRIC COMMUNICATION TECHNIQUE
- H04N—PICTORIAL COMMUNICATION, e.g. TELEVISION
- H04N17/00—Diagnosis, testing or measuring for television systems or their details
- H04N17/04—Diagnosis, testing or measuring for television systems or their details for receivers
-
- H—ELECTRICITY
- H04—ELECTRIC COMMUNICATION TECHNIQUE
- H04N—PICTORIAL COMMUNICATION, e.g. TELEVISION
- H04N9/00—Details of colour television systems
- H04N9/64—Circuits for processing colour signals
- H04N9/68—Circuits for processing colour signals for controlling the amplitude of colour signals, e.g. automatic chroma control circuits
- H04N9/69—Circuits for processing colour signals for controlling the amplitude of colour signals, e.g. automatic chroma control circuits for modifying the colour signals by gamma correction
-
- H—ELECTRICITY
- H04—ELECTRIC COMMUNICATION TECHNIQUE
- H04N—PICTORIAL COMMUNICATION, e.g. TELEVISION
- H04N9/00—Details of colour television systems
- H04N9/64—Circuits for processing colour signals
- H04N9/73—Colour balance circuits, e.g. white balance circuits or colour temperature control
-
- G—PHYSICS
- G09—EDUCATION; CRYPTOGRAPHY; DISPLAY; ADVERTISING; SEALS
- G09G—ARRANGEMENTS OR CIRCUITS FOR CONTROL OF INDICATING DEVICES USING STATIC MEANS TO PRESENT VARIABLE INFORMATION
- G09G2320/00—Control of display operating conditions
- G09G2320/02—Improving the quality of display appearance
- G09G2320/0271—Adjustment of the gradation levels within the range of the gradation scale, e.g. by redistribution or clipping
- G09G2320/0276—Adjustment of the gradation levels within the range of the gradation scale, e.g. by redistribution or clipping for the purpose of adaptation to the characteristics of a display device, i.e. gamma correction
-
- G—PHYSICS
- G09—EDUCATION; CRYPTOGRAPHY; DISPLAY; ADVERTISING; SEALS
- G09G—ARRANGEMENTS OR CIRCUITS FOR CONTROL OF INDICATING DEVICES USING STATIC MEANS TO PRESENT VARIABLE INFORMATION
- G09G2320/00—Control of display operating conditions
- G09G2320/06—Adjustment of display parameters
- G09G2320/0666—Adjustment of display parameters for control of colour parameters, e.g. colour temperature
-
- G—PHYSICS
- G09—EDUCATION; CRYPTOGRAPHY; DISPLAY; ADVERTISING; SEALS
- G09G—ARRANGEMENTS OR CIRCUITS FOR CONTROL OF INDICATING DEVICES USING STATIC MEANS TO PRESENT VARIABLE INFORMATION
- G09G2320/00—Control of display operating conditions
- G09G2320/06—Adjustment of display parameters
- G09G2320/0693—Calibration of display systems
-
- G—PHYSICS
- G09—EDUCATION; CRYPTOGRAPHY; DISPLAY; ADVERTISING; SEALS
- G09G—ARRANGEMENTS OR CIRCUITS FOR CONTROL OF INDICATING DEVICES USING STATIC MEANS TO PRESENT VARIABLE INFORMATION
- G09G2340/00—Aspects of display data processing
- G09G2340/06—Colour space transformation
Definitions
- the present invention is related to a calibration system and a method thereof for calibrating a display, and more specifically, to a calibration system and a method thereof for color calibration of a display.
- the display part of the panel display includes the pixel array.
- the pixel array is an ordinary matrix array, and the pixel array is driven by a driver.
- the driver drives the corresponding pixels based on the arrayed image data.
- the pixels display the specific colors at the specific time under control by the driver. However, the color of the pixel is still required to be calibrated (such as gamma curve correction) in order to match the ideal color for the human eyes.
- FIG. 1 is a diagram showing the relationships between the gray level and two chromaticity values x and y of the CIE xyY color space of a conventional display panel.
- the vertical axis represents the two chromaticity values x and y
- the horizontal axis represents the gray level.
- the curve 260 responds to the chromaticity value x
- the curve 262 responds to the chromaticity value y.
- the two chromaticity values x and y are measured when the display panel displays patterns. Each of the patterns corresponds to a gray level, and the gray level is regarded as the graduation of the horizontal axis of FIG. 1 .
- Each of the patterns may be a black pattern, a gray pattern, or a white pattern.
- the pattern corresponded to the gray level of 0 is a black pattern
- the pattern corresponded to the gray level of 255 is a white pattern
- the pattern corresponded to the gray level of 1 to 254 is a gray pattern.
- the two measured chromaticity values x and y may be constant. Otherwise, the color temperature corresponded to the gray levels is various. In other words, if the measured chromaticity values x and y are not constant, the color temperature of each of the gray levels is not fixed, such that display panel does not displays the color uniformly.
- the Taiwan Patent No. 200306123 corresponding to the U.S. Pat. No. 7,079,155, provides an image display device, an image processing method, and a computer-readable medium adapted to perform proper color reproduction while saving memory capacity.
- the image display device uses a first color corrector to refer to a three-dimensional color correction table, matching a color characteristic of the image display device with a reference color characteristic based on a characteristic value of the image display device, and to apply desired color correction to the inputted image data.
- the image display device uses second color corrector to refer to a one-dimensional color correction table for correcting gradation according to an application circumstances, and applies desired color correction to the inputted image data.
- Taiwan Patent No. I283852 corresponding to the U.S. Pat. No. 7,375,854, discloses a method for color correction.
- a plurality of groups of gray levels and luminance of a light source of a display device are respectively selected by a color measurement system.
- the selected data of each color light are respectively calculated to obtain fitting functions, and the fitting functions may fit the gray level data of each interval.
- the fitting luminance of the gray levels in interval is obtained by the fitting functions and formed into a look-up table.
- the two gamma curves are first taken to logarithmic calculation and the modified gray signals are obtained from the look-up table, then the modified gray signals are transmitted out for providing the display device to express the gray distribution state.
- the present invention is to provide a method of calibrating a display, such that the color temperature of the display may be substantially constant for every gray-level.
- the present invention is to provide a calibration system for color calibration of a display, such that the color temperature of the display may be substantially constant for every gray-level.
- An embodiment of the present invention provides a method of calibrating a display.
- the method includes steps of: measuring the display to generate three first measured data sets by utilizing a measurement unit while the display displays three primary-color patterns according to three primary-color-image data sets; measuring the display to generate a second measured data set by utilizing the measurement unit while the display displays a black pattern according to a black-image data set; establishing a transform model according to the three first measured data sets, the second measured data set, the three primary-color-image data sets, and the black-image data set by utilizing a processing unit; measuring the display to generate a plurality of third measured data sets by utilizing the measurement unit while the display displays a plurality of gray-level patterns according to a plurality of gray-image data sets; establishing three first native display curves according to the second measured data set and the third measured data sets by utilizing the processing unit; transforming the three first native display curves into three second native display curves by utilizing the transform model; defining three final target curves by utilizing the processing unit;
- An embodiment of the present invention provides calibration system for calibrating a display.
- the calibration system includes a measurement unit and a processing unit.
- the measurement unit is configured to measure the display so as to generate measured data sets while the display displays patterns according to image data sets.
- the processing unit is coupled to the measurement unit and configured to establish a transform model and three look-up tables.
- the processing unit establishes the transform model according to three first measured data sets, a second measured data set, three primary-color-image data sets, and a black-image data set.
- the measurement unit generates the three first measured data sets by measuring the display while the display displays three primary-color patterns according to the three primary-color-image data sets.
- the measurement unit generates the second measured data set by measuring the display while the display displays a black pattern according to the black-image data set.
- the processing unit uses the transform model to transform three first native display curves into three second native display curves.
- the processing unit establishes the three first native display curves according to the second measured data set and a plurality of third measured data sets, and the measurement unit generates the third measured data sets by measuring the display while the display displays a plurality of gray-level patterns according to a plurality of gray-image data sets.
- the processing unit defines three final target curves and establishes the three look-up tables according to the three final target curves and the three second native display curves.
- the processing unit converts an input image data set to a calibrated image data set according to the three look-up tables, and the processing unit outputs the calibrated image data set to the display, such that the display displays a calibrated image according to the calibrated image data set.
- the processing unit includes a signal generator coupled to the display and configured to output image data sets to the display.
- the three primary-color-image data sets are a red-image data set, a green-image data set, and a blue-image data set
- the three primary-color patterns are a red pattern, a green pattern, and a blue pattern.
- the display displays the red pattern according to the red-image data set, the display displays the green pattern according to the green-image data set, and the display displays the blue pattern according to the blue-image data set.
- each of the gray-image data sets has a first color subset, a second color subset, and a third color subset. Three pixel values of the first color subset, the second color subset, and the third color subset are identical.
- the processing unit obtains the three final target curves by normalizing three second target curves, and the processing unit uses the transform model to transform three first target curves into the three second target curves.
- the processing unit normalizes the three second target curves by scaling the three second target curves by a ratio of a standard level to a maximum of three maximum levels of the three second target curves.
- the processing unit defines two of the three first target curves according to the rest one of the three first target curves and three chromaticity values x, y, and z of the CIE xyY color space.
- the processing unit defines the rest one of the three first target curves by scaling a gamma curve by a maximum level of a corresponding one of the three first native display curves.
- the rest one of the three first native display curves is a curve of tristimulus value Y of the CIE 1931 XYZ color space.
- the processing unit calculates a compensation ratio according to the transform model and three maximum levels of the three final target curves, and the processing unit increases a power of a light source of the display according the compensation ratio.
- a transform model is established for color transformation between a first color space and a second color space.
- Three first target curves are defined and transformed by the transform model so as to establish three look-up tables.
- the display is calibrated according to the look-up tables such that the color temperature of the display may be substantially constant for every gray-level.
- FIG. 1 is a diagram showing the relationships between the gray level and two chromaticity values x and y of the CIE xyY color space of a conventional display panel.
- FIG. 2 is a functional block diagram of a display and a calibration system according to an embodiment of the present invention.
- FIG. 3 is a flow chart of the method of calibrating the display according to an embodiment of the present invention.
- FIG. 4 shows how to generate the measured data sets 351 - 354 by measuring the test patterns 341 - 344 displayed on the display according to an embodiment of the present invention.
- FIG. 5 shows how to generate the measured data sets MD 1 -MD 255 by measuring the test patterns GP 1 -GP 255 displayed on the display according to an embodiment of the present invention.
- FIGS. 6A-6C are diagrams illustrating three first native display curves according to an embodiment of the present invention.
- FIGS. 7A-7C are diagrams illustrating three second native display curves according to an embodiment of the present invention.
- FIGS. 8A-8C are diagrams illustrating three final target curves according to an embodiment of the present invention.
- FIG. 9 is a diagram illustrating an exemplary embodiment of the present invention when a constant color temperature of 6500K and a gamma curve of 2.2 are desired.
- FIG. 10 shows how to establish the three final target curves according to another embodiment of the present invention.
- FIG. 11 shows a way to establish one of the three look-up tables according to an embodiment of the present invention.
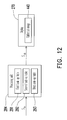
- FIG. 12 is a block diagram showing how the processing unit uses the three look-up tables for color calibration of the display.
- FIG. 13 is an experimental diagram showing the relationships between the gray level and two chromaticity values x and y of the display according to an embodiment of the present invention.
- FIG. 14 is another experimental diagram showing the relationships between the gray level and two chromaticity values x and y of the display according to an embodiment of the present invention.
- FIG. 2 is a functional block diagram of a display 270 and a calibration system 280 according to an embodiment of the present invention.
- the calibration system 280 is used for color calibration of the display 270 .
- the display 270 may be, for example, a thin film transistor-liquid crystal display (TFT-LCD), an organic light emitting diode (OLED) display, a plasma display, a cathode ray tube (CRT) display, or the like.
- the calibration system 280 has a measurement unit 282 and a processing unit 284 .
- the measurement unit 282 is a photo-sensing device for sensing the color-density of the display 270 .
- the measurement unit 282 may be a CA-210 display color analyzer produced by KONICA MINOLTAR, Inc.
- the processing unit 284 may be a computer, a personal digital assistant (PDA), a set to box (STB), or the like.
- the processing unit 284 is coupled to the measurement unit 282 and the display 270 , and the processing unit 284 includes a signal generator 286 .
- the signal generator 286 is coupled to the display 270 and configured to output image data sets S G to the display 270 , such that the display 270 displays corresponding patterns based on the received output image data sets S G .
- the signal generator 286 is a graphic adapter.
- the measurement unit 282 is configured to measure the display 270 so as to generate measured data sets S M while the display 270 displays patterns according to the image data sets S G .
- the image data sets S G are image data of the RGB color system and may be represented as
- the parameters R, G, and B represent the pixel values of the image data sets S G for red, green, and blue respectively.
- the measured data sets S M are data of the CIE 1931 XYZ color space and may be represented as
- the parameters X, Y, and Z represent the tristimulus values X, Y, and Z of the measured data sets S M respectively.
- the CIE 1931 XYZ color space is created by the International Commission on Illumination (CIE) in 1931.
- FIG. 3 is a flow chart of the method of calibrating the display 270 according to an embodiment of the present invention.
- the processing unit 284 establishes a transform model 288 for color transformation from a first color space to a second color space.
- the first color space is the RGB color space
- the RGB color space is defined by the three chromaticities of the red, green, and blue additive primaries.
- the second color space is the CIE 1931 XYZ color space.
- the present invention is not limited thereto.
- the first color space and the second color space are two different color spaces selected from a group consisting of the RGB color space, Adobe RGB color space, sRGB color space, CIE 1931 XYZ color space, CIE xyY color space, CIE 1960 color space, CIE 1964 color space, and CIE 1976 color space.
- An exemplary transform model, established by the processing unit 284 , for color transformation between the RGB color space and the CIE 1931 XYZ color space is mathematically represented as follows:
- [ R G B ] [ C 11 C 12 C 13 C 21 C 22 C 23 C 31 C 32 C 33 ] ⁇ [ X Y Z ] + [ O R O G O B ] ( 1 )
- the parameters O R , O G , and O B represent the offsets of the pixel values of the image data sets S G for red, green, and blue respectively
- the parameters C 11 -C 13 , C 21 -C 23 , and C 31 -C 33 are coefficients of a transformation matrix
- the signal generator 286 transmits three primary-color-image data sets 331 - 333 to the display 270 , such that the display 270 displays three primary-color patterns 341 - 343 according to the received primary-color-image data sets 331 - 333 .
- the three primary-color-image data sets 331 - 333 are a red-image data set 331 , a green-image data set 332 , and a blue-image data set 333 .
- the three primary-color patterns 341 - 343 are a red pattern 341 , a green pattern 342 , and a blue pattern 343 .
- the display 270 displays the red pattern 341 according to the red-image data set 331 , displays the green pattern 342 according to the green-image data set 332 , and displays the blue pattern 343 according to the blue-image data set 333 .
- the three primary-color-image data sets 331 - 333 are image data of the RGB color system and are respectively represented as
- the three primary-color patterns 341 - 343 may be simultaneously or sequentially displayed on the display 270 .
- the measurement unit 282 is used to measure the display 270 so as to generate three first measured data sets 351 - 353 .
- the three first measured data sets 351 - 353 are respectively represented as
- the measurement unit 282 generates the measured data set
- the measurement unit 282 generates the measured data set
- a black-image data set 334 is transmitted to the display 270 , such that the display 270 displays a black pattern 344 according to the black-image data set 334 .
- the black-image data set 334 is represented as
- the measurement unit 282 measures the display 270 so as to generate a second measured data set 354 .
- the second measured data set 354 is represented as
- the processing unit 284 may calculate the values of the parameters C 11 -C 13 , C 21 -C 23 , C 31 -C 33 , O R , O G , and O B according to the equations (2)-(5). Therefore, the processing unit 284 establishes the transform model 288 according to the three first measured data sets 351 - 354 , the second measured data set 354 , the three primary-color-image data sets 331 - 333 , and the black-image data set 334 .
- An exemplary transform model 288 is represented as follows:
- the processing unit 284 establishes three first native display curves of the display 270 in step S 304 .
- the signal generator 286 of the processing unit 284 transmits a plurality of gray-image data sets to the display 270 .
- the signal generator 286 transmits a plurality of gray-image data sets TP 1 -TP 255 to the display 270 , such that the display 270 displays a plurality of gray-level patterns GP 1 -GP 255 according to a plurality of gray-image data sets TP 1 -TP 255 .
- the gray-image data sets TP 1 -TP 255 are image data of the RGB color system and are respectively represented as
- [ R G B ] represent three pixel values of a first color subset, a second color subset, and a third color subset of the image data sets S G respectively.
- [ R G B ] represents the pixel value of the first color subset for red, the symbol G of the matrix
- [ R G B ] represents the pixel value of the first color subset for green, and the symbol R of the matrix
- [ R G B ] represents the pixel value of the first color subset for blue.
- the three pixel values of the first color subset, the second color subset, and the third color subset of the same one of the gray-image data sets TP 1 -TP 255 are identical.
- the three pixel values of the 1 st gray-image data set TP 1 are all 1
- the three pixel values of the 2 nd gray-image data set TP 2 are all 2
- the three pixel values of the 3 rd gray-image data set TP 3 are all 3, and so on.
- the display 270 displays the gray-level pattern GP 1 according to the 1 st gray-image data set TP 1 , displays the gray-level pattern GP 2 according to the 2 nd gray-image data set TP 2 , displays the gray-level pattern GP 3 according to the 3 rd gray-image data set TP 3 , and so on.
- the gray-image data sets TP 1 -TP 255 may be simultaneously or sequentially displayed on the display 270 .
- the measurement unit 282 measures the display 270 so as to generate a plurality of third measured data sets MD 1 -MD 255 .
- the measurement unit 282 generates the measured data set MD 1 by measuring the display 270 while the display 270 displays the gray-level pattern GP 1 , and the measurement unit 282 generates the measured data set MD 2 by measuring the display 270 while the display 270 displays the gray-level pattern GP 2 , and so on.
- the third measured data sets MD 1 -MD 255 are data of the CIE 1931 XYZ color space and are respectively represented as
- the processing unit 284 establishes the three first native display curves of the display 270 according to the second measured data set
- FIGS. 6A-6C are diagrams illustrating the three first native display curves 361 - 363 according to an embodiment of the present invention.
- the vertical axes of the three first native display curves 361 - 363 respectively represent the tristimulus values X, Y, and Z of the CIE 1931 XYZ color space
- the horizontal axes of the three first native display curves 361 - 363 represent an index corresponded to the gray level of one of the gray-image data sets TP 1 -TP 255 or to the gray level of the black-image data set 334 .
- the measurement unit 282 After the measurement unit 282 measures the n th gray-level pattern GPn, the measurement unit 282 generates corresponding one (i.e. the n th one MDn) of the third measured data sets MD 1 -MD 255 , where the measured data set MDn may be represented as
- a node A of the native display curves 361 , a node B of the native display curves 362 , and node C of the native display curves 363 may be orientated based on the index of n and the measured data set
- FIGS. 6A-6C are determined based on the second measured data set
- step S 306 the processing unit 284 transforms the three first native display curves 361 - 363 into three second native display curves by using the transform model 288 .
- FIGS. 7A-7C are diagrams illustrating the three second native display curves 371 - 373 according to an embodiment of the present invention.
- the vertical axes of the three second native display curves 371 - 373 respectively represent the visual pixel values R, G, and B of the RGB color space
- the horizontal axes of the second native display curves 371 - 373 represent the original pixel values R, G, and B of the RGB color space.
- a node D of the native display curve 371 , a node E of the native display curve 372 , and a node F of the native display curve 373 are corresponding to an original pixel value of n, while the nodes D, E, and F correspond to the visual pixel values R n , G n , and B n respectively.
- the transform model 288 the measured data set
- the processing unit 284 is capable of transforming the three first native display curves 361 - 363 into the three second native display curves 371 - 373 by using the transform model 288 .
- step S 308 the processing unit 284 defines three final target curves.
- the three final target curves 381 - 383 defined by the processing unit 284 are illustrated.
- the characteristics of the calibrated display 270 may be substantially represented by the three final target curves 381 - 383 .
- the horizontal axes of FIGS. 8A-8C represent the input pixel value for red, green, and blue respectively.
- the vertical axes of FIGS. 8A-8C represent the displayed pixel value of the display 270 for red, green, and blue respectively.
- the processing unit 284 when the processing unit 284 defines the three final target curves 381 - 383 , the processing unit 284 firstly transforms three first target curves into three second target curves and then normalizes the three second target curves to obtain the three final target curves.
- three first target curves 391 - 393 are transformed into three second target curves 401 - 403 by the processing unit 284 , and the processing unit 284 normalizes the three second target curves 401 - 403 to obtain the three final target curves 381 - 383 .
- the three first target curves 391 - 393 are curves showing the desired tristimulus values X, Y, and Z of the display 270 after finishing the color calibration of the display 270 .
- the first target curve 392 is transformed from a gamma curve.
- the processing unit 284 defines the first target curve 392 by scaling the gamma curve by a maximum level of the first native display curve 362 , wherein the first native display curve 362 corresponds to the first target curve 392 , such that the first target curve 392 may be represented as follows:
- Yt n ( n 255 ) 2.2 ⁇ Yt 255 ( 8 ) where, in the embodiment, Yt 255 is equal to the maximum of the tristimulus value Y of
- n the value of the index
- Yt n represents a corresponding tristimulus value Y of the first target curve 392 when the index is equal to n.
- the processing unit 284 defines the first target curve 392
- the other two first target curves 391 and 393 may be defined by the processing unit 284 according to the first target curve 392 and three chromaticity values x, y, and z of the CIE xyY color space.
- the three chromaticity values x, y, and z are respectively defined as:
- tristimulus values X and Z may be represented as follows:
- a constant color temperature is desired, such that the three chromaticity values x, y, and z for the constant color temperature are fixed. Since the chromaticity values x, y, and z are fixed, the other two first target curves 391 and 393 may be respectively represented as follows:
- the processing unit 284 uses the transform model 288 to transform the three first target curves 391 - 393 into three second target curves 401 - 403 . Therefore, the pixel values Rt n , Gt n , and Bt n of the three second target curves 401 - 403 shown in FIG. 9 may be calculated as follows:
- the maximum levels of the three second target curves 401 - 403 may be greater than 255 (i.e. a standard level for the RGB system). In such case, the three second target curves 401 - 403 may be scaled so as to match the standard level.
- a scaling ratio is defined by the processing unit 284 . In an embodiment, the scaling ratio is equal to a ratio of the standard level to a maximum of three maximum levels of the three second target curves 401 - 403 .
- the three maximum levels of the three second target curves 401 - 403 are 265, 255, and 240, such that the maximum of three maximum levels of the three second target curves 401 - 403 is 265. Since the standard level is equal to 255 (i.e. 2 8 ⁇ 1), the scaling ratio is 255/265.
- the three final target curves 381 - 383 may be respectively represented as follows:
- R s represents the scaling ratio
- FIG. 9 is a diagram illustrating an exemplary embodiment of the present invention when a constant color temperature of 6500K and a gamma curve of 2.2 are desired.
- the processing unit 284 may establish different three final target curves based on different requirements of color calibration of the display 270 .
- the display 270 may be a specific display satisfying with the specification of Digital Imaging and Communications in Medicine (DICOM).
- DICOM Digital Imaging and Communications in Medicine
- FIG. 10 three first target curves 411 - 413 of a DICOM display are illustrated.
- the processing unit 284 uses the transform model 288 to transform the three first target curves 411 - 413 into three second target curves 421 - 423 , and then scales the three second target curves 421 - 423 by a scaling ratio.
- the scaling ratio is equal to 255/336.
- the pixel values Rt′ n , Gt′ n , and Bt′ n of the three second target curves 421 - 423 shown in FIG. 10 may be calculated as follows:
- the three final target curves 431 - 433 may be respectively represented as follows:
- the parameter R′ s represents the scaling ratio of the present embodiment.
- the processing unit 284 establishes three look-up tables 291 - 293 according to the three final target curves and the three second native display curves in step S 310 .
- the processing unit 284 establishes the three look-up tables 291 - 293 according to the three final target curves 381 - 383 and the three second native display curves 371 - 373 .
- the processing unit 284 establishes the first look-up table 291 according to the final target curves 381 and the second native display curves 371 , the processing unit 284 establishes the second look-up table 292 according to the final target curves 382 and the second native display curves 372 , and the processing unit 284 establishes the third look-up table 293 according to the final target curves 383 and the second native display curves 373 .
- the three look-up tables 291 - 293 are used for color calibration of the display 270 for red, green, and blue respectively.
- FIG. 11 shows how to establish one of the three look-up tables 291 - 293 according to an embodiment of the present invention. As shown in FIG.
- FIG. 11 shows the mapping relationships between the input pixel values and the displayed pixel values of the final target curve.
- the look-up table, the second native display curve, and the final target curve correspond to the same color (i.e. red, green, or blue).
- the final target curve shown in FIG. 11 when an input pixel value is 130 , the corresponding displayed pixel value may be 102 .
- FIG. 11 shows the mapping relationships between the input pixel values and the displayed pixel values of the final target curve.
- the look-up table, the second native display curve, and the final target curve correspond to the same color (i.e. red, green, or blue).
- a calibrated pixel value of the second native display curve corresponding to the displayed pixel value of 102 is 128 , such that a relationship, of the look-up table, between the input pixel value of 130 and the calibrated pixel value of 128 may be established by the processing unit 284 .
- more relationships between the input pixel value and the calibrated pixel value may be established in the look-up table.
- the processing unit 284 may convert a received input image data set to a calibrated image data set according to the three look-up tables.
- step S 312 when the processing unit 284 receives an input image data set S in , the processing unit 284 converts the input image data set S in to a calibrated image data set S cb according to the three look-up tables 291 - 293 .
- the calibrated image data set S cb may be transmitted to the display 270 , such that the display 270 displays a calibrated image 440 according to the calibrated image data set S cb .
- FIG. 13 is an experimental diagram showing the relationships between the gray level and two chromaticity values x and y of the display 270 according to an embodiment of the present invention.
- the vertical axis represents the two chromaticity values x and y, and the horizontal axis represents the gray level.
- the curve 450 responds to the chromaticity value y
- the curve 452 responds to the chromaticity value x.
- the two chromaticity values x and y are substantially constant, such that the display 270 substantially has a constant color temperature for every gray-level.
- FIG. 14 is another experimental diagram showing the relationships between the gray level and two chromaticity values x and y of the display 270 according to an embodiment of the present invention.
- the vertical axis represents the two chromaticity values x and y, and the horizontal axis represents the gray level.
- the curve 460 responds to the chromaticity value y
- the curve 462 responds to the chromaticity value x.
- the two chromaticity values x and y are substantially constant, such that the color temperature of the display 270 is substantially constant for every gray-level.
- the display 270 is a liquid crystal display (LCD) and has a light source 272 .
- the light source 272 is a backlight module, and the backlight module provides light when the display 270 is turned on. According the equations (17)-(19) or (21)-(23), after the three second target curves 401 - 403 or 421 - 423 are scaled (i.e.
- the processing unit 284 normalized) by the processing unit 284 , the pixel values (Rf n , Gf n , Bf n ) or (Rf′ n , Gf′ n , Bf′ n ) are decreased as compared with the pixel values (Rt n , Gt n , Bt n ) or (Rt′ n , Gt′ n , Bt′ n ). Therefore, the images displayed on the display 270 may be darker than the images that a user desires to see. In order to compensate the illumination difference between the displayed images and the desired images, the processing unit 284 transmits a control signal Sc to the backlight module 272 so as to increase the power of the backlight module 272 . Accordingly, the images displayed on the display 270 may become brighter and may be satisfied by the user.
- the processing unit 284 generates the control signal Sc according to the three maximum levels of the three final target curves.
- the three maximum levels of the three final target curves 381 - 383 are 255, 245, and 231.
- the relationships between the three maximum levels of the three final target curves 381 - 383 and three corresponding tristimulus values (X m , Y m , Z m ) may be represented as follows:
- the processing unit 284 obtains a compensation ratio of
- the processing unit 284 generates the control signal Sc according to the compensation ratio of
- the tristimulus value Y of the display 270 is equal to Y 255 , such that the display 270 displays images with enough illumination, and the user may see the desired images.
- three tristimulus values (X′ m , Y′ m , Z′ m ) corresponded to the three maximum levels of the three final target curves 431 - 433 shown in FIG. 10 , may be calculated according to the equation (1). That is:
- the illumination difference between the displayed images and the desired images of the display may be compensated according to the compensation ratio
- a transform model is established for color transformation between a first color space and a second color space.
- Three first native display curves are established according to measured data sets, wherein the measured data sets are generated by a measurement unit when the display displays three primary-color patterns, a black pattern, and a plurality of gray-level patterns. Therefore, a total number of the test patterns for establishing the three first native display curves of the display is reduced.
- the three first native display curves then are converted into three second native display curves according to the transform model. Therefore, the native color characteristics of the display in the second color space may be established by the three second native display curves.
- three look-up tables for color calibration of the display are established according to three final target curves and the three second native display curves.
- the display is calibrated according to the three look-up tables such that the color temperature of the display may be substantially constant for every gray-level.
- the power of a light source (e.g. a backlight module) of the display may be adjusted according to a compensation ratio, such that the illumination difference between the displayed images and the desired images may be compensated.
- the term “the invention”, “the present invention” or the like does not necessarily limit the claim scope to a specific embodiment, and the reference to particularly preferred exemplary embodiments of the invention does not imply a limitation on the invention, and no such limitation is to be inferred.
- the invention is limited only by the spirit and scope of the appended claims.
- the abstract of the disclosure is provided to comply with the rules requiring an abstract, which will allow a searcher to quickly ascertain the subject matter of the technical disclosure of any patent issued from this disclosure. It is submitted with the understanding that it will not be used to interpret or limit the scope or meaning of the claims. Any advantages and benefits described may not apply to all embodiments of the invention.
Abstract
Description
The parameters R, G, and B represent the pixel values of the image data sets SG for red, green, and blue respectively. In addition, the measured data sets SM are data of the CIE 1931 XYZ color space and may be represented as
The parameters X, Y, and Z represent the tristimulus values X, Y, and Z of the measured data sets SM respectively. The CIE 1931 XYZ color space is created by the International Commission on Illumination (CIE) in 1931.
where the parameters OR, OG, and OB represent the offsets of the pixel values of the image data sets SG for red, green, and blue respectively; and the parameters C11-C13, C21-C23, and C31-C33 are coefficients of a transformation matrix
of the transform model.
The three primary-color patterns 341-343 may be simultaneously or sequentially displayed on the
In detail, the
while the
while the
while the
When the
According to the equation (1), the relationship between the black-
is known, the
In detail, the parameters R, G, and B of the matrix
represent three pixel values of a first color subset, a second color subset, and a third color subset of the image data sets SG respectively. The symbol R of the matrix
represents the pixel value of the first color subset for red, the symbol G of the matrix
represents the pixel value of the first color subset for green, and the symbol R of the matrix
represents the pixel value of the first color subset for blue. Moreover, the three pixel values of the first color subset, the second color subset, and the third color subset of the same one of the gray-image data sets TP1-TP255 are identical. For example, the three pixel values of the 1st gray-image data set TP1 are all 1, the three pixel values of the 2nd gray-image data set TP2 are all 2, the three pixel values of the 3rd gray-image data set TP3 are all 3, and so on. In addition, the
and the third measured data sets
Please refer to
Accordingly, a node A of the native display curves 361, a node B of the native display curves 362, and node C of the native display curves 363 may be orientated based on the index of n and the measured data set
In addition, the origins of
such that the origins of
may be transformed into
That is,
Accordingly, the
V Out=(V In)2.2 (7)
where VIN represents the input of the gamma curve, VIN represents the output of the gamma curve, 0≦VIn≦1, and 0≦VOut≦1.
where, in the embodiment, Yt255 is equal to the maximum of the tristimulus value Y of
- the native display curves 362 (i.e. Yt255=Y255);
where the parameter Rs represents the scaling ratio.
where the parameter R′s represents the scaling ratio of the present embodiment.
In detail, the compensation ratio is associated with the tristimulus value Ym. The
such that the images displayed on the
In this case, the tristimulus value Y′m is equal to 135.97, such that the related compensation ratio is equal to
Therefore, the illumination difference between the displayed images and the desired images of the display may be compensated according to the compensation ratio
Claims (15)
Priority Applications (2)
| Application Number | Priority Date | Filing Date | Title |
|---|---|---|---|
| US12/482,438 US8704848B2 (en) | 2009-04-21 | 2009-06-10 | Calibration system and method thereof for calibrating display |
| TW098143239A TWI457553B (en) | 2009-04-21 | 2009-12-16 | Clibration system and method thereof for calibrating display |
Applications Claiming Priority (2)
| Application Number | Priority Date | Filing Date | Title |
|---|---|---|---|
| US17144809P | 2009-04-21 | 2009-04-21 | |
| US12/482,438 US8704848B2 (en) | 2009-04-21 | 2009-06-10 | Calibration system and method thereof for calibrating display |
Publications (2)
| Publication Number | Publication Date |
|---|---|
| US20100265266A1 US20100265266A1 (en) | 2010-10-21 |
| US8704848B2 true US8704848B2 (en) | 2014-04-22 |
Family
ID=40834491
Family Applications (1)
| Application Number | Title | Priority Date | Filing Date |
|---|---|---|---|
| US12/482,438 Active 2032-09-06 US8704848B2 (en) | 2009-04-21 | 2009-06-10 | Calibration system and method thereof for calibrating display |
Country Status (3)
| Country | Link |
|---|---|
| US (1) | US8704848B2 (en) |
| EP (1) | EP2244486B1 (en) |
| TW (1) | TWI457553B (en) |
Cited By (1)
| Publication number | Priority date | Publication date | Assignee | Title |
|---|---|---|---|---|
| US20120320036A1 (en) * | 2011-06-17 | 2012-12-20 | Lg Display Co., Ltd. | Stereoscopic Image Display Device and Driving Method Thereof |
Families Citing this family (16)
| Publication number | Priority date | Publication date | Assignee | Title |
|---|---|---|---|---|
| US9076252B2 (en) | 2012-01-05 | 2015-07-07 | Qualcomm Incorporated | Image perceptual attribute adjustment |
| TWI602419B (en) | 2012-12-24 | 2017-10-11 | 台達電子工業股份有限公司 | Adjusting method and display apparatus using same |
| KR102071056B1 (en) * | 2013-03-11 | 2020-01-30 | 삼성디스플레이 주식회사 | Display device and method for compensation of image data of the same |
| US9881586B2 (en) | 2014-05-22 | 2018-01-30 | Disney Enterprises, Inc. | Utilizing heuristics to enable self-adjusting displays |
| JP2016050982A (en) * | 2014-08-29 | 2016-04-11 | サイバネットシステム株式会社 | Luminance correction device and system including the same, and luminance correction method |
| TWI600856B (en) * | 2016-10-28 | 2017-10-01 | Full color lighting fixtures method | |
| CN108024410B (en) * | 2016-11-02 | 2020-06-02 | 新谱光科技股份有限公司 | Correction method of full-color LED lighting lamp |
| TWI619111B (en) * | 2017-02-16 | 2018-03-21 | 明基電通股份有限公司 | Display system |
| TWI667610B (en) * | 2018-08-07 | 2019-08-01 | 鈺緯科技開發股份有限公司 | Automatic Gamma curve setting method for display |
| US11114059B2 (en) * | 2018-11-02 | 2021-09-07 | Portrait Displays, Inc. | System and method for color calibration |
| CN109729333B (en) * | 2018-12-28 | 2021-02-05 | 深圳Tcl新技术有限公司 | Color space mapping method, device, computer readable storage medium and system |
| US10964240B1 (en) * | 2019-10-23 | 2021-03-30 | Pixelworks, Inc. | Accurate display panel calibration with common color space circuitry |
| KR20210049607A (en) * | 2019-10-25 | 2021-05-06 | 삼성전자주식회사 | Display apparatus and driving method thereof |
| CN113496683B (en) * | 2020-04-01 | 2022-10-21 | 敦泰电子股份有限公司 | Display adjusting method of vehicle display |
| TWI751571B (en) * | 2020-06-02 | 2022-01-01 | 仁寶電腦工業股份有限公司 | Video playback system and environment atmosphere adjusting method |
| CN114690464A (en) * | 2022-03-21 | 2022-07-01 | Tcl华星光电技术有限公司 | Display panel and manufacturing method thereof |
Citations (17)
| Publication number | Priority date | Publication date | Assignee | Title |
|---|---|---|---|---|
| JPH04109702A (en) | 1990-08-30 | 1992-04-10 | Asahi Chem Ind Co Ltd | Coupling device for microwave strip line/waveguide |
| WO1999023637A1 (en) | 1997-10-31 | 1999-05-14 | Sony Corporation | Image processing device and method, image transmission/reception system and method, and providing medium |
| JP2002182633A (en) | 2000-12-13 | 2002-06-26 | Fuji Xerox Co Ltd | Method and device for color conversion and method and device for calculating color conversion coefficient |
| JP2002247401A (en) | 2001-02-20 | 2002-08-30 | Seiko Epson Corp | Image display system, image processing method, program and information storage medium |
| US20020126106A1 (en) | 1998-07-06 | 2002-09-12 | Seiko Epson Corporation | Display device, gamma correction method, and electronic equipment |
| JP2003248467A (en) | 2001-12-21 | 2003-09-05 | Sharp Corp | Device and method for correction characteristic determination, and display device |
| JP2003271121A (en) | 2002-03-15 | 2003-09-25 | Seiko Epson Corp | Image display system, image processing method, program and information storage medium |
| JP2003271122A (en) | 2002-03-18 | 2003-09-25 | Seiko Epson Corp | Image display device, image processing method, program and recording medium |
| US20050128497A1 (en) | 2003-12-12 | 2005-06-16 | Tsuyoshi Hirashima | Color image display apparatus, color converter, color-simulating apparatus, and method for the same |
| JP2005196156A (en) | 2003-12-12 | 2005-07-21 | Matsushita Electric Ind Co Ltd | Color image display apparatus, color converter, color-simulating apparatus, and methods for them |
| JP2005328386A (en) | 2004-05-14 | 2005-11-24 | Sharp Corp | System and method for setting white balance correction circuit, lsi circuit used for the system, and liquid crystal television |
| JP2006113151A (en) | 2004-10-12 | 2006-04-27 | Seiko Epson Corp | Image quality adjusting method of display device, image quality adjusting device and display device |
| TWI283852B (en) | 2003-12-31 | 2007-07-11 | Vast View Technology Inc | Method for color correction |
| JP2008056669A (en) | 2004-07-06 | 2008-03-13 | Chiron Srl | Inhibitor based on fusion, hr1 and hr2 sequences in bacterial adhesin |
| US7375854B2 (en) | 2004-03-12 | 2008-05-20 | Vastview Technology, Inc. | Method for color correction |
| JP4109702B1 (en) | 2007-02-08 | 2008-07-02 | 株式会社イクス | Image quality adjustment apparatus, image quality adjustment method, and image quality adjustment program |
| US20080309766A1 (en) | 2007-06-12 | 2008-12-18 | Lin Chia-Hung | Color calibrating method for setting target gamma curves of target display device |
Family Cites Families (1)
| Publication number | Priority date | Publication date | Assignee | Title |
|---|---|---|---|---|
| JP2006129456A (en) * | 2004-10-01 | 2006-05-18 | Canon Inc | Correction data setting method and manufacturing method of image display apparatus |
-
2009
- 2009-06-10 US US12/482,438 patent/US8704848B2/en active Active
- 2009-06-12 EP EP09007777.7A patent/EP2244486B1/en active Active
- 2009-12-16 TW TW098143239A patent/TWI457553B/en active
Patent Citations (19)
| Publication number | Priority date | Publication date | Assignee | Title |
|---|---|---|---|---|
| JPH04109702A (en) | 1990-08-30 | 1992-04-10 | Asahi Chem Ind Co Ltd | Coupling device for microwave strip line/waveguide |
| WO1999023637A1 (en) | 1997-10-31 | 1999-05-14 | Sony Corporation | Image processing device and method, image transmission/reception system and method, and providing medium |
| US20020126106A1 (en) | 1998-07-06 | 2002-09-12 | Seiko Epson Corporation | Display device, gamma correction method, and electronic equipment |
| JP2002182633A (en) | 2000-12-13 | 2002-06-26 | Fuji Xerox Co Ltd | Method and device for color conversion and method and device for calculating color conversion coefficient |
| JP2002247401A (en) | 2001-02-20 | 2002-08-30 | Seiko Epson Corp | Image display system, image processing method, program and information storage medium |
| JP2003248467A (en) | 2001-12-21 | 2003-09-05 | Sharp Corp | Device and method for correction characteristic determination, and display device |
| JP2003271121A (en) | 2002-03-15 | 2003-09-25 | Seiko Epson Corp | Image display system, image processing method, program and information storage medium |
| TW200306123A (en) | 2002-03-18 | 2003-11-01 | Seiko Epson Corp | Image display device, image processing method, program, and storage medium |
| JP2003271122A (en) | 2002-03-18 | 2003-09-25 | Seiko Epson Corp | Image display device, image processing method, program and recording medium |
| US7079155B2 (en) | 2002-03-18 | 2006-07-18 | Seiko Epson Corporation | Image display device, image processing method, program, and storage medium |
| US20050128497A1 (en) | 2003-12-12 | 2005-06-16 | Tsuyoshi Hirashima | Color image display apparatus, color converter, color-simulating apparatus, and method for the same |
| JP2005196156A (en) | 2003-12-12 | 2005-07-21 | Matsushita Electric Ind Co Ltd | Color image display apparatus, color converter, color-simulating apparatus, and methods for them |
| TWI283852B (en) | 2003-12-31 | 2007-07-11 | Vast View Technology Inc | Method for color correction |
| US7375854B2 (en) | 2004-03-12 | 2008-05-20 | Vastview Technology, Inc. | Method for color correction |
| JP2005328386A (en) | 2004-05-14 | 2005-11-24 | Sharp Corp | System and method for setting white balance correction circuit, lsi circuit used for the system, and liquid crystal television |
| JP2008056669A (en) | 2004-07-06 | 2008-03-13 | Chiron Srl | Inhibitor based on fusion, hr1 and hr2 sequences in bacterial adhesin |
| JP2006113151A (en) | 2004-10-12 | 2006-04-27 | Seiko Epson Corp | Image quality adjusting method of display device, image quality adjusting device and display device |
| JP4109702B1 (en) | 2007-02-08 | 2008-07-02 | 株式会社イクス | Image quality adjustment apparatus, image quality adjustment method, and image quality adjustment program |
| US20080309766A1 (en) | 2007-06-12 | 2008-12-18 | Lin Chia-Hung | Color calibrating method for setting target gamma curves of target display device |
Non-Patent Citations (3)
| Title |
|---|
| "Office Action of Japan counterpart application" issued on Apr. 17, 2012, p. 1-p. 4, in which the listed references were cited. |
| "Search Report of European Counterpart Application", issued on Oct. 4, 2012, p. 1-p. 10. |
| Authored by Wang, Yi-Ping, article titled as "Color transformation and gray balance of liquid crystal display", the master thesis of Department of graphic communications and technology, urn: etd-1227104-121001 Jul. 28, 2004. |
Cited By (2)
| Publication number | Priority date | Publication date | Assignee | Title |
|---|---|---|---|---|
| US20120320036A1 (en) * | 2011-06-17 | 2012-12-20 | Lg Display Co., Ltd. | Stereoscopic Image Display Device and Driving Method Thereof |
| US8988453B2 (en) * | 2011-06-17 | 2015-03-24 | Lg Display Co., Ltd. | Stereoscopic image display device and driving method thereof |
Also Published As
| Publication number | Publication date |
|---|---|
| TW201038931A (en) | 2010-11-01 |
| EP2244486A2 (en) | 2010-10-27 |
| TWI457553B (en) | 2014-10-21 |
| EP2244486A3 (en) | 2012-10-31 |
| US20100265266A1 (en) | 2010-10-21 |
| EP2244486B1 (en) | 2014-12-31 |
Similar Documents
| Publication | Publication Date | Title |
|---|---|---|
| US8704848B2 (en) | Calibration system and method thereof for calibrating display | |
| EP2367348B1 (en) | Method for generating a lookup table for color correction for an image display device | |
| CN110197642B (en) | Method for acquiring tricolor brightness correction relationship, correction method and correction device of display | |
| CN103080999B (en) | For having the self-adaptation color correction of the indicating meter of backlight modulation | |
| US6677958B2 (en) | Method for calibrating, characterizing and driving a color flat panel display | |
| CN102402937B (en) | Color adjustment device, color adjustment method and display | |
| KR101367199B1 (en) | Image display device and method for revising display character thereof | |
| CN101521001B (en) | Color correcting method and device of display device | |
| CN101635858B (en) | Color correction method and integrated chip using same | |
| US10297186B2 (en) | Display device and image processing method thereof | |
| CN112292851B (en) | Color gamut correction method and device | |
| WO2005041165A1 (en) | Display characteristic calibration method, display characteristic calibration device, and computer program | |
| US20080285851A1 (en) | Color correction method and apparatus of display apparatus | |
| CN104332143B (en) | Display device and color conversion method thereof | |
| KR20150077750A (en) | Display apparatus and driving method thereof | |
| US20110148907A1 (en) | Method and system for image display with uniformity compensation | |
| JP5326144B2 (en) | Calibration system and method for calibrating a display | |
| CN103366711B (en) | The method of the precision of four look white balance adjustment is improved with three primary colors luminance parameter | |
| US9111478B2 (en) | Method of compensating color gamut of display | |
| CN105306917B (en) | Low gray level white balance control method, control system and display | |
| US20030025688A1 (en) | Method for calibrating, characterizing and driving a color flat panel display | |
| KR20110061947A (en) | Color gamut mapping method and display device using the same | |
| CN112885300B (en) | Panel calibration using multiple nonlinear models | |
| CN112700747B (en) | Accurate display calibration method with common color space circuitry | |
| CN101552926B (en) | Method and device for processing color picture signals |
Legal Events
| Date | Code | Title | Description |
|---|---|---|---|
| AS | Assignment |
Owner name: CORETRONIC DISPLAY SOLUTION CORPORATION, TAIWAN Free format text: ASSIGNMENT OF ASSIGNORS INTEREST;ASSIGNORS:LIU, CHAO-WEN;CHIH, HUNG-WEI;REEL/FRAME:022840/0939 Effective date: 20090610 |
|
| AS | Assignment |
Owner name: YOUNG LIGHTING TECHNOLOGY INC., TAIWAN Free format text: MERGER;ASSIGNORS:CORETRONIC DISPLAY SOLUTION CORPORATION;NANO PRECISION CORPORATION;REEL/FRAME:032307/0745 Effective date: 20120101 |
|
| STCF | Information on status: patent grant |
Free format text: PATENTED CASE |
|
| FEPP | Fee payment procedure |
Free format text: PAYOR NUMBER ASSIGNED (ORIGINAL EVENT CODE: ASPN); ENTITY STATUS OF PATENT OWNER: LARGE ENTITY |
|
| MAFP | Maintenance fee payment |
Free format text: PAYMENT OF MAINTENANCE FEE, 4TH YEAR, LARGE ENTITY (ORIGINAL EVENT CODE: M1551) Year of fee payment: 4 |
|
| AS | Assignment |
Owner name: CORETRONIC CORPORATION, TAIWAN Free format text: MERGER;ASSIGNOR:YOUNG LIGHTING TECHNOLOGY INC.;REEL/FRAME:048039/0223 Effective date: 20181001 |
|
| MAFP | Maintenance fee payment |
Free format text: PAYMENT OF MAINTENANCE FEE, 8TH YEAR, LARGE ENTITY (ORIGINAL EVENT CODE: M1552); ENTITY STATUS OF PATENT OWNER: LARGE ENTITY Year of fee payment: 8 |