EP2192399A1 - Visible/near-infrared spectrum analyzing method and grape fermenting method - Google Patents
Visible/near-infrared spectrum analyzing method and grape fermenting method Download PDFInfo
- Publication number
- EP2192399A1 EP2192399A1 EP08831838A EP08831838A EP2192399A1 EP 2192399 A1 EP2192399 A1 EP 2192399A1 EP 08831838 A EP08831838 A EP 08831838A EP 08831838 A EP08831838 A EP 08831838A EP 2192399 A1 EP2192399 A1 EP 2192399A1
- Authority
- EP
- European Patent Office
- Prior art keywords
- under examination
- sample under
- visible
- grape
- spectrum
- Prior art date
- Legal status (The legal status is an assumption and is not a legal conclusion. Google has not performed a legal analysis and makes no representation as to the accuracy of the status listed.)
- Withdrawn
Links
- 238000000034 method Methods 0.000 title claims abstract description 75
- 235000009754 Vitis X bourquina Nutrition 0.000 title claims abstract description 61
- 235000012333 Vitis X labruscana Nutrition 0.000 title claims abstract description 61
- 235000014787 Vitis vinifera Nutrition 0.000 title claims abstract description 61
- 238000002329 infrared spectrum Methods 0.000 title claims abstract description 42
- 240000006365 Vitis vinifera Species 0.000 title 1
- 235000013399 edible fruits Nutrition 0.000 claims abstract description 63
- 241000219095 Vitis Species 0.000 claims abstract description 60
- 238000001228 spectrum Methods 0.000 claims abstract description 52
- 238000011514 vinification Methods 0.000 claims abstract description 52
- 238000000862 absorption spectrum Methods 0.000 claims abstract description 24
- 238000000491 multivariate analysis Methods 0.000 claims abstract description 20
- 238000002835 absorbance Methods 0.000 claims description 42
- 241000219094 Vitaceae Species 0.000 claims description 20
- 235000021021 grapes Nutrition 0.000 claims description 20
- 239000000049 pigment Substances 0.000 claims description 18
- BJEPYKJPYRNKOW-REOHCLBHSA-N (S)-malic acid Chemical compound OC(=O)[C@@H](O)CC(O)=O BJEPYKJPYRNKOW-REOHCLBHSA-N 0.000 claims description 15
- BJEPYKJPYRNKOW-UHFFFAOYSA-N alpha-hydroxysuccinic acid Natural products OC(=O)C(O)CC(O)=O BJEPYKJPYRNKOW-UHFFFAOYSA-N 0.000 claims description 15
- 239000001630 malic acid Substances 0.000 claims description 15
- 235000011090 malic acid Nutrition 0.000 claims description 15
- 238000002790 cross-validation Methods 0.000 claims description 14
- 238000004458 analytical method Methods 0.000 claims description 11
- 230000001678 irradiating effect Effects 0.000 claims description 10
- 238000004445 quantitative analysis Methods 0.000 claims description 5
- 238000007619 statistical method Methods 0.000 abstract description 2
- 238000010200 validation analysis Methods 0.000 description 10
- 235000009120 camo Nutrition 0.000 description 8
- 244000213578 camo Species 0.000 description 8
- 238000005259 measurement Methods 0.000 description 5
- 238000010238 partial least squares regression Methods 0.000 description 5
- 230000007423 decrease Effects 0.000 description 4
- 238000004364 calculation method Methods 0.000 description 3
- 238000005314 correlation function Methods 0.000 description 3
- 230000000694 effects Effects 0.000 description 3
- 238000009499 grossing Methods 0.000 description 3
- 238000003306 harvesting Methods 0.000 description 3
- 238000010183 spectrum analysis Methods 0.000 description 3
- 239000000126 substance Substances 0.000 description 3
- 238000010521 absorption reaction Methods 0.000 description 2
- 238000007796 conventional method Methods 0.000 description 2
- 238000001514 detection method Methods 0.000 description 2
- 230000002542 deteriorative effect Effects 0.000 description 2
- 238000012417 linear regression Methods 0.000 description 2
- 230000033001 locomotion Effects 0.000 description 2
- 238000007781 pre-processing Methods 0.000 description 2
- 230000002028 premature Effects 0.000 description 2
- VEXZGXHMUGYJMC-UHFFFAOYSA-N Hydrochloric acid Chemical compound Cl VEXZGXHMUGYJMC-UHFFFAOYSA-N 0.000 description 1
- 241000135194 Pione Species 0.000 description 1
- 240000004808 Saccharomyces cerevisiae Species 0.000 description 1
- 239000002253 acid Substances 0.000 description 1
- 150000001413 amino acids Chemical class 0.000 description 1
- 239000007864 aqueous solution Substances 0.000 description 1
- 230000003542 behavioural effect Effects 0.000 description 1
- 238000004422 calculation algorithm Methods 0.000 description 1
- 230000008030 elimination Effects 0.000 description 1
- 238000003379 elimination reaction Methods 0.000 description 1
- 238000004128 high performance liquid chromatography Methods 0.000 description 1
- 238000005070 sampling Methods 0.000 description 1
- 238000000926 separation method Methods 0.000 description 1
- 239000007787 solid Substances 0.000 description 1
- 230000007704 transition Effects 0.000 description 1
Images



Classifications
-
- G—PHYSICS
- G01—MEASURING; TESTING
- G01N—INVESTIGATING OR ANALYSING MATERIALS BY DETERMINING THEIR CHEMICAL OR PHYSICAL PROPERTIES
- G01N21/00—Investigating or analysing materials by the use of optical means, i.e. using sub-millimetre waves, infrared, visible or ultraviolet light
- G01N21/17—Systems in which incident light is modified in accordance with the properties of the material investigated
- G01N21/25—Colour; Spectral properties, i.e. comparison of effect of material on the light at two or more different wavelengths or wavelength bands
- G01N21/31—Investigating relative effect of material at wavelengths characteristic of specific elements or molecules, e.g. atomic absorption spectrometry
- G01N21/35—Investigating relative effect of material at wavelengths characteristic of specific elements or molecules, e.g. atomic absorption spectrometry using infrared light
- G01N21/359—Investigating relative effect of material at wavelengths characteristic of specific elements or molecules, e.g. atomic absorption spectrometry using infrared light using near infrared light
-
- G—PHYSICS
- G01—MEASURING; TESTING
- G01N—INVESTIGATING OR ANALYSING MATERIALS BY DETERMINING THEIR CHEMICAL OR PHYSICAL PROPERTIES
- G01N21/00—Investigating or analysing materials by the use of optical means, i.e. using sub-millimetre waves, infrared, visible or ultraviolet light
- G01N21/84—Systems specially adapted for particular applications
- G01N21/85—Investigating moving fluids or granular solids
- G01N2021/8592—Grain or other flowing solid samples
-
- G—PHYSICS
- G01—MEASURING; TESTING
- G01N—INVESTIGATING OR ANALYSING MATERIALS BY DETERMINING THEIR CHEMICAL OR PHYSICAL PROPERTIES
- G01N21/00—Investigating or analysing materials by the use of optical means, i.e. using sub-millimetre waves, infrared, visible or ultraviolet light
- G01N21/17—Systems in which incident light is modified in accordance with the properties of the material investigated
- G01N21/25—Colour; Spectral properties, i.e. comparison of effect of material on the light at two or more different wavelengths or wavelength bands
- G01N21/31—Investigating relative effect of material at wavelengths characteristic of specific elements or molecules, e.g. atomic absorption spectrometry
- G01N21/35—Investigating relative effect of material at wavelengths characteristic of specific elements or molecules, e.g. atomic absorption spectrometry using infrared light
- G01N21/3563—Investigating relative effect of material at wavelengths characteristic of specific elements or molecules, e.g. atomic absorption spectrometry using infrared light for analysing solids; Preparation of samples therefor
-
- G—PHYSICS
- G01—MEASURING; TESTING
- G01N—INVESTIGATING OR ANALYSING MATERIALS BY DETERMINING THEIR CHEMICAL OR PHYSICAL PROPERTIES
- G01N2201/00—Features of devices classified in G01N21/00
- G01N2201/12—Circuits of general importance; Signal processing
- G01N2201/129—Using chemometrical methods
- G01N2201/1293—Using chemometrical methods resolving multicomponent spectra
Definitions
- the visible/near-infrared spectrum analyzing method measures sugar content (Brix), malic acid concentration and amount of pigment of a grape of a small fruit cultivar for wine making, the sample under examination.
- the visible/near-infrared spectrum analyzing method continuously selects the grape of a small fruit cultivar for wine making according to a specified arbitrary sugar content (Brix) using the calibration formula model.
- Table 2 shows a correlation function between the calibration formula and prediction formula, and values of accuracy indices of the calibration formula and prediction formula.
- symbols in Table 2 represent meanings similar to those of the symbols used for Table 1.
Landscapes
- Physics & Mathematics (AREA)
- Spectroscopy & Molecular Physics (AREA)
- Health & Medical Sciences (AREA)
- Life Sciences & Earth Sciences (AREA)
- Chemical & Material Sciences (AREA)
- Analytical Chemistry (AREA)
- Biochemistry (AREA)
- General Health & Medical Sciences (AREA)
- General Physics & Mathematics (AREA)
- Immunology (AREA)
- Pathology (AREA)
- Investigating Or Analysing Materials By Optical Means (AREA)
Abstract
Description
- The present invention relates to a spectrum analyzing method for determining components in each sample using visible light and/or near-infrared light (at least one of visible light and near-infrared light), and more particularly, to a visible/near-infrared spectrum analyzing method suitable for determining components such as sugar content, malic acid concentration and amount of pigment of a grape of a small fruit cultivar for wine making.
- Furthermore, the present invention also relates to a grape fermenting method using the visible/near-infrared spectrum analyzing method.
- Visible light and near-infrared light having a wavelength of 400 to 2500 nm are generally electromagnetic waves having extremely small absorption intensity with respect to matter, less susceptible to scattering and with low energy, and thereby allow chemical and physical information to be obtained without destroying a sample under examination. Therefore, it is possible to immediately obtain information on the sample under examination by irradiating the sample under examination with visible light and/or near-infrared light, detecting intensity of a transmitted light or scattered reflected light spectrum from the sample under examination, determining absorbance by the sample under examination and subjecting the absorbance data obtained to a multivariate statistical analysis (hereinafter, referred to as "multivariate analysis").
- Recently, quantitative determination of components in a fruit is made by various types of apparatuses using visible light and/or near-infrared light (see Patent Document 1).
Furthermore, regarding quantitative determination locations, there are examples of handy type visible/near-infrared spectrum analyzers targeted at not only indoor but also outdoor analyses (see Patent Document 2).
Patent Document 1: Japanese Patent Laid-Open No.2007-024651
Patent Document 2: Japanese Patent Laid-Open No.2005-127847 - Regarding conventional component analyzing methods using visible light and/or near-infrared light, there are examples of application to objects (samples under examination) such as "Kyoho" and "Pione" which are grapes of a large fruit cultivar and kind of grapes to be eaten raw, but such methods are not applicable to grapes of a small fruit cultivar for wine making.
- Here, the grapes of a small fruit cultivar for wine making refer to cultivars like Cabernet Sauvignon, Cabernet Franc, Merleau, Chardonnay and Sauvignon Blanc.
- The reason that the component analyzing method using visible light and/or near-infrared light applicable to grapes of a large fruit cultivar is not applicable to grapes of a small fruit cultivar for wine making will be described below.
- Grapes for wine making have not only a feature that they are small fruits but also a feature that there are greater variations in amounts of fruit components such as sugar content and acid degree as the maturity of the fruit progresses than other fruits or grapes of a large fruit to be eaten raw. Therefore, when chronologically measuring the progress of components of fruit of grape in a farm field, it is necessary to create a calibration formula model using a multivariate analysis over a wide range of component concentration, and the component analyzing method using visible light and/or near-infrared light applicable to grapes of a large fruit cultivar cannot be used as they are.
- Furthermore, there are a variety of cultivars of grape for wine making and it is desirable to create a calibration formula model which can be commonly applied to some of those cultivars.
- However, when an attempt is made to apply one calibration formula model to a wide component concentration range, the waveform of the spectrum is greatly affected by maturity of grape, and it has been hard to create a calibration formula model that allows practical measurement.
- Furthermore, even if an attempt is made to change a model to be applied according to the maturity of grape, there is no method for accurately determining the maturity in a nondestructive way and determination of the maturity is substantially impossible.
- Furthermore, to keep track of a variation in maturity for a grape growing period, it is important to measure the maturity of grapes bearing fruit on bearing branches in an outdoor farm field, but this measurement is conducted under circumstances where there are various disturbing factors such as humidity and light compared to an indoor environment, which results in a problem that influences of such an external environment further make it harder to create a calibration formula model.
- As described above, it is difficult to apply the component analyzing method for grapes of a large fruit cultivar to grapes of a small fruit cultivar, and moreover there are a variety of cultivars of grapes for wine making and attempting to create a calibration formula model common to various cultivars also results in a problem that it is difficult to create a practical calibration formula model.
- In order to solve the above described problems, it is an object of the present invention to provide a spectrum analyzing method for determining components in each sample using visible light and/or near-infrared light; a visible/near-infrared spectrum analyzing method capable of determining each component of a grape of a small fruit cultivar for wine making.
- In order to attain the above described object, the visible/near-infrared spectrum analyzing method according to
claim 1 relates to a visible/near-infrared spectrum analyzing method including a step of irradiating a sample under examination indoors or outdoors with at least one of visible light and near-infrared light whose wavelength is included in a range of 400 nm to 2500 nm and determining a spectrum of the sample under examination, and a step of calculating an absorption spectrum from the spectrum, applying a multivariate analysis to the absorption spectrum calculated and creating an analysis model. In this visible/near-infrared spectrum analyzing method, the sample under examination is a grape of a small fruit cultivar for wine making. Furthermore, in this visible/near-infrared spectrum analyzing method, a configuration is adopted in which a spectrum of transmitted light or scattered reflected light from a fruit of grape, the sample under examination, is determined, a quantitative analysis is performed which digitizes characteristics of components using a multivariate analysis, for example, by a PLS method (Partial Least Squares) or MLR method (Multi Linear Regression) and a calibration formula model capable of determining the components of the sample under examination is created. - The invention according to
claim 1 having the above described configuration makes a spectrum analysis by determining a variation in a response spectrum due to a variation in concentration of the components such as sugar content, malic acid concentration, amount of pigment of a grape of a small fruit cultivar for wine making and makes a multivariate analysis. Therefore, it is possible to catch a variation in response which cannot be directly determined from a graph of the spectrum and obtain a calibration formula model capable of determining the components of grape of a small fruit cultivar, which have been hard to determine using conventional methods. - In the visible/near-infrared spectrum analyzing method according to
claim 2, light irradiated onto the sample under examination has a wavelength of 600 nm to 1100 nm. - According to the invention of
claim 2 having the above described configuration, light of 600 nm to 1100 nm (visible light and near-infrared light) has extremely small absorption intensity of irradiating light with respect to matter, and is electromagnetic wave less susceptible to scattering and with low energy, and can thereby obtain chemical and physical information without destroying the sample under examination. - The visible/near-infrared spectrum analyzing method according to claim 3 is targeted at each cultivar and/or a plurality of cultivars of grape of a small fruit cultivar for wine making.
- According to the invention of claim 3 having the above described configuration, it is possible to obtain not only a calibration formula model for each single cultivar of grape of a small fruit cultivar for wine making, which is the sample under examination, but also a calibration formula model applicable to a plurality of cultivars.
- The invention according to
claim 4 having the above described configuration determines maturity of the sample under examination according to a value of an absorption spectrum obtained over a certain range of wavelength or the absorption spectrum subjected to standardization processing or first-order derivative processing or second-order derivative processing and changes a calibration formula model to be applied according to the maturity determination result. - According to the invention of
claim 4 having the above described configuration, in a relationship between the absorption spectrum over a certain range of wavelength or the absorption spectrum subjected to standardization processing or first-order derivative processing or second-order derivative processing and a target component in the sample, it is possible to classify the samples under examination from the standpoint of maturity by dividing the samples under examination into two groups at a value at which the movement of the spectrum varies significantly. By changing the calibration formula model according to the classification, it is possible to avoid influences of the difference in maturity causing the waveform of the spectrum to vary significantly and deteriorating the accuracy of the calibration formula model, and it is possible to obtain a high accuracy, practical calibration formula model. - In the visible/near-infrared spectrum analyzing method according to
claim 5, the wavelength at which maturity of the sample under examination is determined is 600 nm to 640 nm or 700 nm to 760 nm. - According to the invention of
claim 5 having the above described configuration, maturity of the sample under examination is classified using the value obtained from the absorption spectrum having a wavelength of 600 nm to 640 nm or 700 nm to 760 nm, and it is thereby possible to immediately determine maturity without destroying the sample under examination. - The visible/near-infrared spectrum analyzing method according to
claim 6 measures sugar content (Brix), malic acid concentration and amount of pigment of a grape of a small fruit cultivar for wine making, the sample under examination. - According to the invention of
claim 6 having the above described configuration, it is possible to create a calibration formula model that can measure sugar content, malic acid concentration and amount of pigment, which is important in controlling maturity of the fruit of grape for wine making and determining a harvesting time. - The visible/near-infrared spectrum analyzing method according to claim 7 continuously selects the grape of a small fruit cultivar for wine making according to a specified arbitrary sugar content (Brix) using the calibration formula model.
- According to the invention of claim 7 having the above described configuration, it is possible to select a grape of a small fruit cultivar for wine making accurately according to the sugar content without destroying the sample under examination.
- The grape fermenting method according to claim 8 ferments a grape of a small fruit cultivar for wine making selected in the selecting step of claim 7.
- According to the invention of
claim 8 having the above described configuration, it is possible to improve the quality of grape for wine making and improve the quality of wine. - The visible/near-infrared spectrum analyzing method according to claim 9 includes a step of continuously selecting grapes for wine making according to a specified arbitrary amount of pigment using the calibration formula model.
- According to the invention of claim 9 having the above described configuration, it is possible to accurately select a grape of a small fruit cultivar for wine making according to the sugar content without destroying the sample under examination.
- The grape fermenting method according to claim 10 ferments a grape of a small fruit cultivar for wine making selected in the selecting step of claim 9.
- According to the invention of
claim 10 having the above described configuration, it is possible to improve the quality of grape for wine making and improve the quality of wine. - The visible/near-infrared spectrum analyzing method according to claim 11 irradiates light onto the sample under examination and determines the spectrum of the sample under examination with the sample under examination bearing fruit on a bearing branch.
- According to this visible/near-infrared spectrum analyzing method, it is possible to measure each component with a grape of a small fruit cultivar for wine making bearing fruit on a bearing branch and thereby chronologically measure transition of components of the grape of a small fruit cultivar for wine making in a growth period in a farm field.
- The calibration formula model creating method according to
claim 12 is a visible/near-infrared spectrum analyzing method for creating a calibration formula model to measure component values of a grape of a small fruit cultivar for wine making, including a step of irradiating visible light and/or near-infrared light onto a grape of a small fruit cultivar for wine making as a sample under examination and determining a spectrum of transmitted light or scattered reflected light, a step of calculating an absorption spectrum made up of absorbance of each wavelength based on the spectrum and a step of performing a quantitative analysis that digitizes characteristics of the components of the sample under examination through a multivariate analysis using the absorption spectrum and creating a calibration formula model that can determine the components of the sample under examination. - This visible/near-infrared spectrum analyzing method has operations and effects similar to those of
claim 1. - The calibration formula model creating method according to claim 13 further includes a step of calculating a derivative value per wavelength of the absorption spectrum, wherein in the step of creating a calibration formula model, a multivariate analysis is performed using the derivative value as an explanatory variable and the component value of the sample under examination as a target variable to thereby create a visible/near-infrared spectrum analyzing method that can determine the component value of the sample under examination.
- Since the absorbance itself often has a broad shape with influences of various contained substances overlapping with each other and therefore a derivative value of absorbance is used for the purpose of elimination of base line fluctuation, peak separation effect, emphasis of micro peaks and shoulder peak detection or the like. The accuracy of the multivariate analysis can thereby be improved.
- Here, for example, a first-order derivative value or a second-order derivative value of absorbance can be used as the derivative value of absorbance. When a calibration formula model on the component value of fruit is created, it is empirically known that the accuracy is high when the first-order derivative value of absorbance is used, and therefore the first-order derivative value of absorbance is preferably used.
- In the visible/near-infrared spectrum analyzing method according to
claim 14, in the step of creating a calibration formula model, the calibration formula model is validated through cross-validation. According to this visible/near-infrared spectrum analyzing method, a high accuracy model can be created through cross-validation. - The visible/near-infrared spectrum analyzing method according to
claim 15 determines maturity of the sample under examination based on the derivative value and changes a calibration formula model to be applied according to the maturity determination result. This visible/near-infrared spectrum analyzing method has operations and effects similar to those ofclaim 4. - According to the visible/near-infrared spectrum analyzing method according to the present invention, it is possible to obtain a high accuracy calibration formula model capable of determining fruit components of a grape of a small fruit cultivar for wine making, which has been conventionally hard to determine and thereby immediately determine components of the grape of a small fruit cultivar for wine making in a nondestructive way.
- Furthermore, since nondestructive sampling on many samples is possible, it is possible to keep track of growing situations of grapes of a small fruit cultivar for wine making or determine a harvesting time or measure components more accurately to select grapes after harvest.
- Furthermore, the visible/near-infrared spectrum analyzing method according to the present invention is applicable to quantitative determination of FAN (free amino acid) metabolizable by yeast in the grape sample.
-
-
Figure 1 illustrates data obtained by performing smoothing processing and first-order derivative processing on the absorbance obtained from spectrum data; -
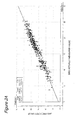
Figure 2A illustrates a calibration formula model created using a PLS method assuming an absorbance first-order derivative value of spectrum of each wavelength as an explanatory variable and Brix in each sample as a target variable; -
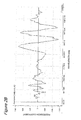
Figure 2B illustrates a calculation result of a regression coefficient; -
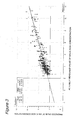
Figure 3 illustrates a calibration formula model created using a PLS method assuming an absorbance first-order derivative value of spectrum of each wavelength as an explanatory variable and malic acid concentration in each sample as a target variable; -
Figure 4 illustrates a calibration formula model created using a PLS method assuming an absorbance first-order derivative value of spectrum of each wavelength as an explanatory variable and an amount of pigment in each sample as a target variable; -
Figure 5 illustrates an example of relationship between Brix of the sample of grape for wine making according to Example 1 and a first-order derivative value of spectrum absorbance atwavelength 720 nm; and -
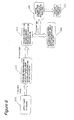
Figure 6 is a flowchart illustrating a procedure for creating a calibration formula. - In order to attain an object of obtaining a visible/near-infrared spectrum analyzing method capable of determining components such as Brix (sugar content), malic acid concentration and amount of pigment of a grape of a small fruit cultivar for wine making, which have been hard to determine using conventional methods, the present invention allows the respective components of a sample under examination to be determined by irradiating the sample under examination of the grape of a small fruit cultivar for wine making with visible light and/or near-infrared light to apply a spectrum analysis to the sample under examination and creating a calibration formula model through a multivariate analysis using a PLS method or MLR method assuming each component of the grape of a small fruit cultivar for wine making as a target variable from many pieces of measured data obtained.
- Hereinafter, an embodiment of the present invention will be explained with reference to the accompanying drawings.
- As a spectrum analyzer used for a visible/near-infrared spectrum analysis according to the present invention, it is possible to use, for example, an apparatus capable of analyzing a transmitted light or scattered reflected light spectrum obtained by irradiating continuous wavelength light (visible light and/or near-infrared light) whose wavelength is included in a range of 400 nm to 2500 nm. For example, FQA-NIR GUN (manufactured by FANTEC Co., Ltd.), fruit selector K-BA100R (manufactured by Kubota Corporation) or Luminar 5030 AOTF NIR Analyzer (manufactured by Brimrose Corporation) can be used. However, the present invention is not limited to these apparatuses.
- The calibration formula model according to the present embodiment is created by taking a case where an apparatus manufactured by FANTEC Co., Ltd. is used according to a procedure shown in
Figure 6 as an example. - First, a sample under examination of grape for wine making is irradiated with visible light and/or near-infrared light to obtain a transmitted light or scattered reflected light spectrum (original spectrum (T)) (step S10). Here, the fruit of grape is irradiated with, for example, visible light and near-infrared light of 600 nm to 1100 nm. The irradiating light is preferably visible light and/or near-infrared light whose wavelength is included in a range of 400 nm to 2500 nm.
- Next, absorbance is determined by calculating a logarithm of the reciprocal of the original spectrum (T) with respect to each wavelength of the irradiating light (log(1/T)) and an absorption spectrum is obtained by plotting these absorbances for each wavelength. For example, absorbance is calculated for each wavelength of 600 to 1100 nm and an absorption spectrum is obtained (step S20). For example, FQA-NIR GUN (manufactured by FANTEC Co., Ltd.) can be used for steps S10 and S20.
- Furthermore, to perform a quantitative analysis using this absorption spectrum, by performing preprocessing such as auto scaling, smoothing processing, first-order derivative processing or second-order derivative processing on the absorption spectrum data, a first- or second-order derivative value (first- or second-order derivative data) of absorbance is obtained for each wavelength (step S30). For example, Unscrambler (manufactured by CAMO ASA) can be used for this step.
- Furthermore, known component values (concentration or characteristic value) such as Brix, malic acid concentration, amount of pigment in the target sample under examination are measured separately (step S35). Here, "Brix" indicates percent concentration of a soluble solid content included in the sample under examination (aqueous solution) and indicates sugar content when the sample under examination is a fruit such as grape.
- After that, it is possible to obtain a calibration formula model assuming the first- or second-order derivative data for each wavelength as an explanatory variable and a known component value (concentration or characteristic value: actually measured value) in the target sample under examination as a target variable, and performing a multivariate analysis to associate the two variables with each other using a PLS method (Partial Least Squares) or MLR method (Multi Linear Regression) (step S40). For this step, for example, Unscrambler (manufactured by CAMO ASA) can be used as in the case of step S30.
- When the MLR method is used, the multivariate analysis can be performed by determining the following calculation (Equation 1).
-

- y(λ): first- or second-order derivative value of absorbance at wavelength λ
- A1, A2, ... : coefficients
- Furthermore, a step of evaluating and validating prediction accuracy of the calibration formula through cross-validation may be added (step S50). Cross-validation is a validation method for evaluating prediction accuracy of the calibration formula using a sample under examination different from that when the calibration formula is created.
- The above described preprocessing of the spectrum and multivariate analysis are performed using data processing software such as Unscrambler (manufactured by CAMO ASA), FQA utility (manufactured by FANTEC Co., Ltd.), Pirouette3.02 (manufactured by GL Sciences ASA). The data processing software is not limited to these software but any software for which a multivariate analysis can be used is applicable.
- For measurements in the following examples, a nondestructive analyzing method was perfected for grapes for wine making that allows measurement with grapes actually bearing fruit on bearing branches in an outdoor farm field by shielding light with a cover covering the detection head section and photoflood head section of the measuring instrument to avoid influences of daylight and further creating a calibration formula model resistant to variations in fruit core temperature.
- Example 1 is an example where an analysis was made on a model applicable to three cultivars of grape; Cabernet Sauvignon, Merleau and Cabernet Franc, which are grapes for wine making. A total of 157 samples including Cabernet Sauvignon (60 samples), Merleau (52 samples) and Cabernet Franc (45 samples) were measured using a portable type near-infrared spectroscope FQA-NIR GUN (manufactured by FANTEC Co., Ltd.) at three levels of temperature of 15°C, 25°C and 35°C at a wavelength ranging from 600 nm to 1100 nm and a total of 628 pieces of spectrum data were obtained. Assuming the absorbance first-order derivative value as an explanatory variable and Brix of the sample grape for wine making as a target variable, a model associating both variables with each other was created.
- In
Figure 1 , the horizontal axis shows a wavelength (nm) and the vertical axis shows data (absorbance first-order derivative value) obtained by performing smoothing processing and first-order derivative processing on the absorbance obtained from spectrum data using Unscrambler (manufactured by CAMO ASA). This absorbance first-order derivative value is data resulting from the processing corresponding to steps S10 to S30 inFigure 6 . - Furthermore, analysis values of Brix (actually measured values of Brix) were obtained for their respective spectra. Brix was measured using a digital sugar content meter (manufactured by Atago, Co., Ltd.) (corresponding to step S35 in
Figure 6 ). - In order to explain these Brix values with spectrum absorbance first-order derivative values, a multivariate analysis was performed using a PLS method (corresponding to step S40 in
Figure 6 ). In the present embodiment, a validation through cross-validation was conducted when the analysis was performed using the PLS method to create a high accuracy model (corresponding to step S50 inFigure 6 ). Here, the "cross-validation" is a validation method for evaluating prediction accuracy of a calibration formula using a sample under examination different from that when the calibration formula is created. -
Figure 2A illustrates a result of a calibration formula model created assuming an absorbance first-order derivative value of spectrum of each wavelength as an explanatory variable and Brix in each sample as a target variable using Unscrambler (manufactured by CAMO ASA) by a PLS method and cross-validation. In the graph inFigure 2A , the horizontal axis shows an actually measured value of Brix and the vertical axis shows a predicted value of Brix according to the PLS regression analysis. In the figure, white circles denote a relationship between actually measured values and predicted values obtained by applying samples used to create a calibration formula to the created calibration formula and black circles denote a relationship between actually measured values and predicted values obtained by applying samples different from the samples used to create the calibration formula to the created calibration formula. - Table 1 shows a correlation function between a calibration formula and a prediction formula, and values of accuracy indices of the calibration formula and prediction formula. In Table 1, "CAL" denotes the calibration formula, "VAL" denotes the prediction formula, "Correlation" denotes a correlation coefficient, "SEC" denotes accuracy of the calibration formula, "SEP" denotes accuracy of the prediction formula and "PC Number" denotes the number of factors of a PLS regression analysis.
- It is evident from
Figure 2A and Table 1 that the actually measured value and the predicted value according to the created calibration formula have a significantly high correlation. -
[Table 1] Brix Correlation SEC SEP PC Number All data CAL 0.968 1.15 13 VAL 0.964 1.22 13 Figure 2B illustrates a calculation result of a regression vector. InFigure 2B , the horizontal axis shows a wavelength and the vertical axis shows a regression coefficient. The regression coefficient on the vertical axis represents the degree of contribution to the regression formula per wavelength and indicates that the greater the absolute value of the regression coefficient of a wavelength, the higher is the contribution. - Example 2 is a case where malic acid concentration in a sample of grape for wine making is assumed to be a target variable. The malic acid concentration in the sample was measured using a high performance liquid chromatography (manufactured by Shimadzu Corporation) (corresponding to step S35 in
Figure 6 ). - In order to explain the malic acid concentration (ppm) in the sample using an absorbance first-order derivative value of each wavelength obtained in Example 1 (data resulting from the processing corresponding to steps S10 to S30 in
Figure 6 ), a calibration formula model is created using a PLS method and cross-validation (corresponding to steps S40 and S50 inFigure 6 ). The result is shown inFigure 3 . -
Figure 3 illustrates a result of a calibration formula model created using Unscrambler (manufactured by CAMO ASA) assuming an absorbance first-order derivative value of a spectrum of each wavelength as an explanatory variable and malic acid concentration (ppm) in each sample as a target variable using a PLS method and cross-validation. In the graph inFigure 3 , the horizontal axis shows an actually measured value of malic acid concentration (ppm) and the vertical axis shows a predicted value of malic acid concentration (ppm) by a PLS regression analysis. In the figure, white circles denote a relationship between actually measured values and predicted values obtained by applying samples used to create a calibration formula to the created calibration formula and black circles denote a relationship between actually measured values and predicted values obtained by applying samples different from the samples used to create the calibration formula to the created calibration formula. - Table 2 shows a correlation function between the calibration formula and prediction formula, and values of accuracy indices of the calibration formula and prediction formula. Here, symbols in Table 2 represent meanings similar to those of the symbols used for Table 1.
- It is evident from
Figure 3 and Table 2 that the actually measured value and the predicted value according to the created calibration formula have a significantly high correlation also in the case where malic acid concentration in each sample is assumed to be a target variable. -
[Table 2] MAL Correlation SEC SEP PC Number All data CAL 0.874 1.201 10 VAL 0.863 1.247 10 - Example 3 is a case where an amount of pigment in a sample of grape for wine making is assumed to be a target variable. The amount of pigment was measured by immersing the fruit skin of grape crushed using a homogenizer in hydrochloric acid in methanol and measuring absorbance at 520 nm.
- A calibration formula model is created assuming the absorbance first-order derivative value of each wavelength obtained in Example 1 as an explanatory variable and the amount of pigment in the sample as a target variable using a PLS method and cross-validation.
-
Figure 4 illustrates a result of a calibration formula model created using Unscrambler (manufactured by CAMO ASA) assuming the absorbance first-order derivative value of the spectrum of each wavelength as an explanatory variable and the amount of pigment in each sample as a target variable using a PLS method and cross-validation. In the graph inFigure 4 , the horizontal axis shows an actually measured value of the amount of pigment and the vertical axis shows a predicted value of the amount of pigment by a PLS regression analysis. In the figure, white circles denote a relationship between actually measured values and predicted values obtained by applying samples used to create a calibration formula to the created calibration formula and black circles denote a relationship between actually measured values and predicted values obtained by applying samples different from the samples used to create the calibration formula to the created calibration formula. - Table 3 shows a correlation function between the calibration formula and prediction formula, and values of accuracy indices of the calibration formula and prediction formula. Here, symbols in Table 3 represent meanings similar to those of the symbols used for Table 1.
- It is evident from
Figure 4 and Table 3 that the actually measured value and the predicted value according to the created calibration formula have a significantly high correlation also in the case where the amount of pigment in each sample is assumed to be a target variable. -
[Table 3] Amount of pigment Correlation SEC SEP PC Number All data CAL 0.839 1.448 4 VAL 0.833 1.469 4 -
Figure 5 illustrates an example of a relationship between Brix of the sample of grape for wine making in Example 1 and a first-order derivative value of spectrum absorbance atwavelength 720 nm. In the same figure, the horizontal axis shows Brix and the vertical axis shows a first-order derivative value of a spectrum absorbance atwavelength 720 nm. As denoted by reference character "m" inFigure 5 , the first-order derivative value of the spectrum absorbance shows a range of substantially constant values in a range where Brix is low (that is, where the maturity level is low), but when Brix then increases (that is, where the maturity level increases), the first-order derivative value of spectrum absorbance decreases in a range denoted by reference character "n" and it is observed that the behavior of the first-order derivative value of spectrum absorbance apparently differs before and after a certain Brix value (15 degrees in this example). - It is possible to assume that this variation in the relationship between Brix and the first-order derivative value of the spectrum absorbance degrades the accuracy of the calibration formula model. Therefore, the maturity of the sample under examination is classified by the first-order derivative value of the spectrum absorbance at this wavelength. That is, the maturity is divided into two groups; data corresponding to predetermined maturity or above and data corresponding to less than the predetermined maturity. A calibration formula model is then created for each of the two groups using Unscrambler (manufactured by CAMO ASA) through a PLS method and cross-validation. The result is shown in Table 4.
-
[Table 4] Brix 720nm Correlation SEC SEP PC Number All data (Example 1) CAL 0.968 1.15 13 VAL 0.964 1.22 13 Premature CAL 0.961 0.98 14 VAL 0.946 1.14 14 Reasonably mature CAL 0.921 0.88 13 VAL 0.891 1.02 13 - According to present Example 4, it is possible to classify a sample under examination from the standpoint of maturity by dividing the samples under examination into two groups according to a value at which the motion of spectrum changes significantly in a relationship between an absorption spectrum or absorption spectrum subjected to standardization processing or first-order derivative processing or second-order derivative processing, and a target component (sugar content) in the samples. By changing the model of calibration formula according to the classification, it is possible to avoid the influences of the difference in maturity causing the waveform of the spectrum to vary significantly and deteriorating the accuracy of the calibration formula model, and obtain a high accuracy, practical calibration formula model.
- Although the first-order derivative value of the spectrum absorbance at
wavelength 720 nm was used in present Example 4, first-order derivative values of spectrum absorbance at other wavelengths may also be used. It is known by measurement that in a wavelength region of 600 nm to 640 nm or 700 nm to 760 nm, a distinct behavioral variation of the first-order derivative value of spectrum absorbance appears as in the case ofFigure 5 . Therefore, the wavelength for determining maturity of a sample under examination (sample of grape for wine making) is preferably selected from a wavelength region of 600 nm to 640 nm or 700 nm to 760 nm.
Claims (15)
- A visible/near-infrared spectrum analyzing method comprising:a step of irradiating a sample under examination indoors or outdoors with at least one of visible light and near-infrared light whose wavelength is included in a range of 400 nm to 2500 nm and determining a spectrum of the sample under examination; anda step of calculating an absorption spectrum from the spectrum, applying a multivariate analysis to the absorption spectrum calculated and creating an analysis model,wherein the sample under examination is a grape of a small fruit cultivar for wine making, and
a spectrum of transmitted light or scattered reflected light from a fruit of grape, the sample under examination, is determined, a quantitative analysis is performed which digitizes characteristics of components using a multivariate analysis by a PLS method or MLR method and a calibration formula model capable of determining the components of the sample under examination is created. - The visible/near-infrared spectrum analyzing method according to claim 1, wherein light irradiated onto the sample under examination has a wavelength of 600 nm to 1100 nm.
- The visible/near-infrared spectrum analyzing method according to claim 1 or 2, wherein a calibration formula model is created which is applicable to each cultivar or a plurality of cultivars of grape of a small fruit cultivar for wine making, the sample under examination.
- The visible/near-infrared spectrum analyzing method according to any one of claims 1 to 3, wherein maturity of the sample under examination is determined according to a value of an absorption spectrum obtained over a certain range of wavelength or the absorption spectrum subjected to mathematical standardization processing or first-order derivative processing or second-order derivative processing and a calibration formula model to be applied is changed according to the maturity determination result.
- The visible/near-infrared spectrum analyzing method according to claim 4, wherein the wavelength at which maturity of the sample under examination is determined is 600 nm to 640 nm or 700 nm to 760 nm.
- The visible/near-infrared spectrum analyzing method according to any one of claims 1 to 5, wherein sugar content (Brix), malic acid concentration or amount of pigment of a grape of a small fruit cultivar for wine making, the sample under examination, are measured.
- The visible/near-infrared spectrum analyzing method according to any one of claims 1 to 5, further comprising a step of continuously selecting the grape of a small fruit cultivar for wine making according to a specified arbitrary sugar content (Brix) using the calibration formula model.
- A grape fermenting method for fermenting a grape of a small fruit cultivar for wine making selected in the selecting step according to claim 7.
- The visible/near-infrared spectrum analyzing method according to any one of claims 1 to 5, further comprising a step of continuously selecting grapes for wine making according to a specified arbitrary amount of pigment using the calibration formula model.
- A grape fermenting method for fermenting a grape of a small fruit cultivar for wine making selected in the selecting step according to claim 9.
- The visible/near-infrared spectrum analyzing method according to any one of claims 1 to 7 or 9, wherein light is irradiated onto the sample under examination and the spectrum of the sample under examination is determined with the sample under examination bearing fruit on a bearing branch.
- A visible/near-infrared spectrum analyzing method for creating a calibration formula model to measure component values of a grape of a small fruit cultivar for wine making, comprising:a step of irradiating at least one of visible light and near-infrared light onto a grape of a small fruit cultivar for wine making as a sample under examination and determining a spectrum of transmitted light or scattered reflected light;a step of calculating an absorption spectrum made up of absorbance of each wavelength based on the spectrum; anda step of performing a quantitative analysis that digitizes characteristics of the components of the sample under examination through a multivariate analysis using the absorption spectrum and creating a calibration formula model that can determine the components of the sample under examination.
- The visible/near-infrared spectrum analyzing method according to claim 12, further comprising a step of calculating a derivative value per wavelength of the absorption spectrum,
wherein in the step of creating a calibration formula model, a multivariate analysis is performed using the derivative value as an explanatory variable and the component value of the sample under examination as a target variable to thereby create a calibration formula model that can determine the component value of the sample under examination. - The visible/near-infrared spectrum analyzing method according to claim 12 or 13, wherein in the step of creating a calibration formula model, the calibration formula model is validated through cross-validation.
- The visible/near-infrared spectrum analyzing method according to any one of claims 12 to 14, wherein maturity of the sample under examination is determined based on the derivative value and a calibration formula model to be applied is changed according to the maturity determination result.
Applications Claiming Priority (2)
| Application Number | Priority Date | Filing Date | Title |
|---|---|---|---|
| JP2007246268 | 2007-09-21 | ||
| PCT/JP2008/067066 WO2009038206A1 (en) | 2007-09-21 | 2008-09-22 | Visible/near-infrared spectrum analyzing method and grape fermenting method |
Publications (2)
| Publication Number | Publication Date |
|---|---|
| EP2192399A1 true EP2192399A1 (en) | 2010-06-02 |
| EP2192399A4 EP2192399A4 (en) | 2018-01-10 |
Family
ID=40468015
Family Applications (1)
| Application Number | Title | Priority Date | Filing Date |
|---|---|---|---|
| EP08831838.1A Withdrawn EP2192399A4 (en) | 2007-09-21 | 2008-09-22 | Visible/near-infrared spectrum analyzing method and grape fermenting method |
Country Status (5)
| Country | Link |
|---|---|
| US (1) | US20100297291A1 (en) |
| EP (1) | EP2192399A4 (en) |
| JP (1) | JP5441703B2 (en) |
| AU (1) | AU2008301534A1 (en) |
| WO (1) | WO2009038206A1 (en) |
Cited By (6)
| Publication number | Priority date | Publication date | Assignee | Title |
|---|---|---|---|---|
| WO2010131197A3 (en) * | 2009-05-12 | 2011-04-28 | Universidade Católica Portuguesa | Method and device for monitoring the production of grapes with uv-vis-swnir spectroscopy |
| CN104949922A (en) * | 2014-03-31 | 2015-09-30 | 徐军 | Method for realizing sensory evaluation to white wine by use of near infrared spectrum |
| WO2015166121A1 (en) * | 2014-04-30 | 2015-11-05 | Universidad De Sevilla | Device for discrete measurement of the brix/acid ratio in wine-making grapes, by means of multiband nir reflectance |
| CN105044021A (en) * | 2015-07-08 | 2015-11-11 | 湖南环境生物职业技术学院 | Mid-autumn crispy jujube sugar degree nondestructive test method |
| CN105092518A (en) * | 2015-06-16 | 2015-11-25 | 江西农业大学 | Navel orange sugar degree rapid nondestructive detection method and device |
| CN106841101A (en) * | 2017-01-17 | 2017-06-13 | 安徽莱姆佳生物科技股份有限公司 | The method of near-infrared quick detection wheat stalk rotten degree |
Families Citing this family (31)
| Publication number | Priority date | Publication date | Assignee | Title |
|---|---|---|---|---|
| JP2011017570A (en) * | 2009-07-08 | 2011-01-27 | Graduate School For The Creation Of New Photonics Industries | Fruit ripeness measuring apparatus and ripeness measuring method |
| JP5626982B2 (en) * | 2010-10-01 | 2014-11-19 | ヤンマー株式会社 | Quality assessment method for fruits and vegetables |
| JP5959103B2 (en) * | 2011-11-25 | 2016-08-02 | 国立研究開発法人農業・食品産業技術総合研究機構 | Spontaneous dormant arousal judgment method for low temperature demanding deciduous trees |
| FR2985033B1 (en) * | 2011-12-23 | 2014-09-19 | Accumulateurs Fixes | METHOD FOR DETERMINING A STATE PARAMETER OF AN ELECTROCHEMICAL ELEMENT BY COMPLEX IMPEDANCE AT RADIO FREQUENCIES |
| US9836031B2 (en) * | 2012-02-02 | 2017-12-05 | Foss Analytical A/S | Method of controlling a production process using prediction model output directly linking interacted probe radiation information with morphological process step control parameters |
| JP6288507B2 (en) * | 2014-05-13 | 2018-03-07 | パナソニックIpマネジメント株式会社 | Food analyzer |
| KR101574895B1 (en) * | 2014-06-26 | 2015-12-04 | 제주대학교 산학협력단 | Method for predicting sugar contents and acidity of citrus using ft-ir fingerprinting combined by multivariate analysis |
| KR101579381B1 (en) * | 2014-07-09 | 2015-12-21 | 제주대학교 산학협력단 | Method for predicting quantity of citrus functional ingredients using ft-ir fingerprinting combined by multivariate analysis |
| ES2879953T3 (en) | 2015-12-04 | 2021-11-23 | Atten2 Advanced Monitoring Tech S L U | Near infrared spectroscopy-based fluid monitoring system |
| CN106442386A (en) * | 2016-10-31 | 2017-02-22 | 浙江大学 | Fast detection method of oleanolic acid content at different medicinal parts of clematis florida |
| CN106546551A (en) * | 2016-10-31 | 2017-03-29 | 浙江大学 | A kind of method for quick of clematis Anemonin content |
| US10408748B2 (en) * | 2017-01-26 | 2019-09-10 | ClariFruit | System and method for evaluating fruits and vegetables |
| KR102525937B1 (en) | 2018-03-20 | 2023-04-28 | 삼성전자주식회사 | The electronic device comprising a pluraliaty of light sources |
| CN109655414B (en) * | 2018-11-27 | 2021-11-02 | Oppo广东移动通信有限公司 | Electronic equipment, information push method and related products |
| CN110210005A (en) * | 2019-06-11 | 2019-09-06 | 浙江中烟工业有限责任公司 | A kind of spectrum wave number selection method of no reference value |
| CN111044483A (en) * | 2019-12-27 | 2020-04-21 | 武汉工程大学 | A method, system and medium for determination of pigment in cream based on near-infrared spectroscopy |
| US11231324B2 (en) * | 2020-02-13 | 2022-01-25 | Kaiser Optical Systems Inc. | Real-time monitoring of wine fermentation properties using Raman spectroscopy |
| JP2021139901A (en) * | 2020-03-05 | 2021-09-16 | 国立研究開発法人農業・食品産業技術総合研究機構 | Functional component measuring method, functional component measuring unit and functional component measuring program |
| CN112161949B (en) * | 2020-09-16 | 2023-07-18 | 贵州国台酒业集团股份有限公司 | A method for identifying the brewing process of Maotai-flavor liquor based on infrared spectroscopy |
| CN112595692A (en) * | 2020-11-24 | 2021-04-02 | 南宁国拓生物科技有限公司 | Establishment method of fruit total sugar content prediction model and fruit total sugar content prediction method |
| CN113267466B (en) * | 2021-04-02 | 2023-02-03 | 中国科学院合肥物质科学研究院 | Non-destructive detection method for sugar content and acidity of fruit based on spectral wavelength optimization |
| CN113720797B (en) * | 2021-08-30 | 2024-02-09 | 四川轻化工大学 | Online rapid quality measuring and liquor picking method for distilled liquor |
| CN114235723B (en) * | 2021-11-04 | 2024-04-02 | 福建师范大学 | Nondestructive measurement method and terminal for internal quality of fruits |
| CN113933305B (en) * | 2021-11-12 | 2022-12-20 | 江南大学 | Thin-skinned fruit sugar content nondestructive measurement method and system based on smart phone |
| US20250044209A1 (en) * | 2021-11-22 | 2025-02-06 | Horiba Advanced Techno, Co., Ltd. | Component concentration measuring device, component concentration measuring program, and component concentration measuring method |
| CN114136887B (en) * | 2021-12-07 | 2023-10-20 | 广东省农业科学院蔬菜研究所 | Method for rapidly detecting white gourd taste determining factor malic acid based on near infrared spectrum technology |
| CN114813621A (en) * | 2022-04-24 | 2022-07-29 | 学林苑(深圳)葡萄酒文化有限公司 | Detection method and device for grape wine apple milk fermentation process |
| CN115606409B (en) * | 2022-08-22 | 2023-07-21 | 中国农业大学 | Method for evaluating grafting affinity of fruit trees in vitro and application thereof |
| CN115728268A (en) * | 2022-11-16 | 2023-03-03 | 贵州茅台酒股份有限公司 | The construction method, detection method and device of the physical and chemical index detection model of dismantling bins |
| JP2025099256A (en) | 2023-12-21 | 2025-07-03 | 株式会社クボタ | Fruit and vegetable quality measurement system, calibration curve switching method, and computer program |
| JP2026001589A (en) * | 2024-06-19 | 2026-01-07 | 株式会社日立製作所 | Method for generating an estimation model of oil properties, method for diagnosing oil properties, and system for diagnosing oil properties |
Family Cites Families (18)
| Publication number | Priority date | Publication date | Assignee | Title |
|---|---|---|---|---|
| JPH07117490B2 (en) * | 1988-02-25 | 1995-12-18 | 農林水産省食品総合研究所長 | Non-destructive method for determining the taste of fruits and vegetables by near infrared rays |
| JPH0640069B2 (en) * | 1989-04-30 | 1994-05-25 | 株式会社ニレコ | Estimation method of taste value by near infrared |
| JP3526652B2 (en) * | 1995-05-11 | 2004-05-17 | 倉敷紡績株式会社 | Optical measuring method and optical measuring device |
| JPH11173986A (en) * | 1997-12-12 | 1999-07-02 | Jasco Corp | Measuring device and processing method in the measuring device |
| AUPP365298A0 (en) * | 1998-05-21 | 1998-06-11 | Elan Group Ltd | An optical apparatus |
| EP1285244A4 (en) * | 2000-03-13 | 2008-04-16 | Food Processing Systems | Apparatus and method for measuring and correlating characteristics of fruit with visible/near infra-red spectrum |
| US6512577B1 (en) * | 2000-03-13 | 2003-01-28 | Richard M. Ozanich | Apparatus and method for measuring and correlating characteristics of fruit with visible/near infra-red spectrum |
| JP3947819B2 (en) * | 2001-07-10 | 2007-07-25 | 静岡県 | Plant individual selection method using optical technique |
| FR2852785B1 (en) * | 2003-03-31 | 2006-04-07 | Pellenc Sa | METHOD AND DEVICE FOR ANALYZING THE STRUCTURE AND CONSTITUTION OF CULTURAL HEDGES, SUCH AS FOR EXAMPLE RANKS OF VINE |
| JP4201683B2 (en) | 2003-10-23 | 2008-12-24 | 静岡シブヤ精機株式会社 | Handy type internal quality inspection device |
| JP2006170669A (en) * | 2004-12-13 | 2006-06-29 | Mitsui Mining & Smelting Co Ltd | Fruit and vegetable quality inspection equipment |
| US20060167926A1 (en) * | 2005-01-27 | 2006-07-27 | James Verhey | Vineyard information collection and management system |
| JP2006226775A (en) * | 2005-02-16 | 2006-08-31 | Toyohashi Univ Of Technology | Fruit taste component evaluation method and evaluation apparatus |
| JP4904446B2 (en) * | 2005-03-07 | 2012-03-28 | 井関農機株式会社 | Prediction method and prediction apparatus for fruit component information |
| JP2006300666A (en) * | 2005-04-19 | 2006-11-02 | Univ Nagoya | Equipment for measuring the internal quality of agricultural products |
| JP2007024651A (en) | 2005-07-14 | 2007-02-01 | Wide Techno:Kk | Non-destructive sugar content meter, and non-destructive sugar content measuring method |
| WO2007041755A1 (en) * | 2005-10-07 | 2007-04-19 | The Australian Wine Research Institute | Hyperspectral imaging of contaminants in products and processes of agriculture |
| WO2007080935A1 (en) * | 2006-01-12 | 2007-07-19 | The New Industry Research Organization | Method of examining and determining the environment of host for producing bioproduct |
-
2008
- 2008-09-22 WO PCT/JP2008/067066 patent/WO2009038206A1/en not_active Ceased
- 2008-09-22 AU AU2008301534A patent/AU2008301534A1/en not_active Abandoned
- 2008-09-22 JP JP2009533215A patent/JP5441703B2/en not_active Expired - Fee Related
- 2008-09-22 US US12/679,126 patent/US20100297291A1/en not_active Abandoned
- 2008-09-22 EP EP08831838.1A patent/EP2192399A4/en not_active Withdrawn
Non-Patent Citations (1)
| Title |
|---|
| See references of WO2009038206A1 * |
Cited By (7)
| Publication number | Priority date | Publication date | Assignee | Title |
|---|---|---|---|---|
| WO2010131197A3 (en) * | 2009-05-12 | 2011-04-28 | Universidade Católica Portuguesa | Method and device for monitoring the production of grapes with uv-vis-swnir spectroscopy |
| CN104949922A (en) * | 2014-03-31 | 2015-09-30 | 徐军 | Method for realizing sensory evaluation to white wine by use of near infrared spectrum |
| WO2015166121A1 (en) * | 2014-04-30 | 2015-11-05 | Universidad De Sevilla | Device for discrete measurement of the brix/acid ratio in wine-making grapes, by means of multiband nir reflectance |
| CN105092518A (en) * | 2015-06-16 | 2015-11-25 | 江西农业大学 | Navel orange sugar degree rapid nondestructive detection method and device |
| CN105044021A (en) * | 2015-07-08 | 2015-11-11 | 湖南环境生物职业技术学院 | Mid-autumn crispy jujube sugar degree nondestructive test method |
| CN105044021B (en) * | 2015-07-08 | 2018-07-17 | 湖南环境生物职业技术学院 | A kind of mid-autumn crisp jujube pol lossless detection method |
| CN106841101A (en) * | 2017-01-17 | 2017-06-13 | 安徽莱姆佳生物科技股份有限公司 | The method of near-infrared quick detection wheat stalk rotten degree |
Also Published As
| Publication number | Publication date |
|---|---|
| JP5441703B2 (en) | 2014-03-12 |
| WO2009038206A1 (en) | 2009-03-26 |
| AU2008301534A1 (en) | 2009-03-26 |
| US20100297291A1 (en) | 2010-11-25 |
| EP2192399A4 (en) | 2018-01-10 |
| JPWO2009038206A1 (en) | 2011-01-13 |
Similar Documents
| Publication | Publication Date | Title |
|---|---|---|
| US20100297291A1 (en) | Visible/near-infrared spectrum analyzing method and grape fermenting method | |
| Sheng et al. | Model development for soluble solids and lycopene contents of cherry tomato at different temperatures using near-infrared spectroscopy | |
| Gao et al. | Hyperspectral image information fusion-based detection of soluble solids content in red globe grapes | |
| Zhang et al. | Nondestructive measurement of soluble solids content in apple using near infrared hyperspectral imaging coupled with wavelength selection algorithm | |
| Urraca et al. | Estimation of total soluble solids in grape berries using a hand‐held NIR spectrometer under field conditions | |
| Fernández-Novales et al. | Shortwave-near infrared spectroscopy for determination of reducing sugar content during grape ripening, winemaking, and aging of white and red wines | |
| Patz et al. | Application of FT-MIR spectrometry in wine analysis | |
| Zhang et al. | Fast prediction of sugar content in Dangshan pear (Pyrus spp.) using hyperspectral imagery data | |
| Larraín et al. | A multipurpose portable instrument for determining ripeness in wine grapes using NIR spectroscopy | |
| Qing et al. | Non-destructive analyses of apple quality parameters by means of laser-induced light backscattering imaging | |
| Cuadrado et al. | Comparison and joint use of near infrared spectroscopy and Fourier transform mid infrared spectroscopy for the determination of wine parameters | |
| Sorol et al. | Visible/near infrared-partial least-squares analysis of Brix in sugar cane juice: a test field for variable selection methods | |
| Li et al. | Pears characteristics (soluble solids content and firmness prediction, varieties) testing methods based on visible-near infrared hyperspectral imaging | |
| CN106918567B (en) | A method and device for measuring the concentration of trace metal ions | |
| Fernández-Novales et al. | A feasibility study on the use of a miniature fiber optic NIR spectrometer for the prediction of volumic mass and reducing sugars in white wine fermentations | |
| Aleixandre-Tudo et al. | Towards on-line monitoring of phenolic content in red wine grapes: A feasibility study | |
| Rabasco-Vílchez et al. | Evaluating the shelf life of strawberries using a portable Vis-NIR spectrophotometer and a Reflectance Quality Index (RQI) | |
| Wang et al. | Phenotyping of navel orange based on hyperspectral imaging technology | |
| Zhang et al. | Applications of Near‐Infrared Spectroscopy in Pear Quality Assessment: A Comprehensive Review | |
| He et al. | Modeling of table grape soluble solids content, titratable acidity and pH prediction during storage based on Vis-NIR spectroscopy | |
| Qiao et al. | Hyperspectral imaging with machine learning for non-destructive prediction of quality attributes in Lanzhou frozen pears | |
| Subedi et al. | Assessment of titratable acidity in fruit using short wave near infrared spectroscopy. Part B: intact fruit studies | |
| CN110210005A (en) | A kind of spectrum wave number selection method of no reference value | |
| Shen et al. | Evaluation of near‐infrared and mid‐infrared spectroscopy for the determination of routine parameters in Chinese rice wine | |
| CN120375070A (en) | Grape SSC detection and origin tracing method based on NIR multitasking integrated learning |
Legal Events
| Date | Code | Title | Description |
|---|---|---|---|
| PUAI | Public reference made under article 153(3) epc to a published international application that has entered the european phase |
Free format text: ORIGINAL CODE: 0009012 |
|
| 17P | Request for examination filed |
Effective date: 20100322 |
|
| AK | Designated contracting states |
Kind code of ref document: A1 Designated state(s): AT BE BG CH CY CZ DE DK EE ES FI FR GB GR HR HU IE IS IT LI LT LU LV MC MT NL NO PL PT RO SE SI SK TR |
|
| AX | Request for extension of the european patent |
Extension state: AL BA MK RS |
|
| DAX | Request for extension of the european patent (deleted) | ||
| RA4 | Supplementary search report drawn up and despatched (corrected) |
Effective date: 20171207 |
|
| RIC1 | Information provided on ipc code assigned before grant |
Ipc: G01N 21/3563 20140101ALI20171201BHEP Ipc: C12G 1/02 20060101ALI20171201BHEP Ipc: G01N 21/35 20140101AFI20171201BHEP Ipc: G01N 21/359 20140101ALI20171201BHEP Ipc: G01N 21/85 20060101ALI20171201BHEP Ipc: A01G 7/00 20060101ALI20171201BHEP |
|
| STAA | Information on the status of an ep patent application or granted ep patent |
Free format text: STATUS: THE APPLICATION IS DEEMED TO BE WITHDRAWN |
|
| 18D | Application deemed to be withdrawn |
Effective date: 20180714 |
|
| RIC1 | Information provided on ipc code assigned before grant |
Ipc: A01G 7/00 20060101ALI20171201BHEP Ipc: G01N 21/3563 20140101ALI20171201BHEP Ipc: G01N 21/359 20140101ALI20171201BHEP Ipc: G01N 21/35 20140101AFI20171201BHEP Ipc: C12G 1/02 20060101ALI20171201BHEP Ipc: G01N 21/85 20060101ALI20171201BHEP |