EP2157524A2 - Procédés d'identification, de diagnostic et de prédiction pour la survie des lymphomes - Google Patents
Procédés d'identification, de diagnostic et de prédiction pour la survie des lymphomes Download PDFInfo
- Publication number
- EP2157524A2 EP2157524A2 EP09170243A EP09170243A EP2157524A2 EP 2157524 A2 EP2157524 A2 EP 2157524A2 EP 09170243 A EP09170243 A EP 09170243A EP 09170243 A EP09170243 A EP 09170243A EP 2157524 A2 EP2157524 A2 EP 2157524A2
- Authority
- EP
- European Patent Office
- Prior art keywords
- lymphoma
- genes
- validation
- training
- gene expression
- Prior art date
- Legal status (The legal status is an assumption and is not a legal conclusion. Google has not performed a legal analysis and makes no representation as to the accuracy of the status listed.)
- Withdrawn
Links
Images


Classifications
-
- C—CHEMISTRY; METALLURGY
- C12—BIOCHEMISTRY; BEER; SPIRITS; WINE; VINEGAR; MICROBIOLOGY; ENZYMOLOGY; MUTATION OR GENETIC ENGINEERING
- C12Q—MEASURING OR TESTING PROCESSES INVOLVING ENZYMES, NUCLEIC ACIDS OR MICROORGANISMS; COMPOSITIONS OR TEST PAPERS THEREFOR; PROCESSES OF PREPARING SUCH COMPOSITIONS; CONDITION-RESPONSIVE CONTROL IN MICROBIOLOGICAL OR ENZYMOLOGICAL PROCESSES
- C12Q1/00—Measuring or testing processes involving enzymes, nucleic acids or microorganisms; Compositions therefor; Processes of preparing such compositions
- C12Q1/68—Measuring or testing processes involving enzymes, nucleic acids or microorganisms; Compositions therefor; Processes of preparing such compositions involving nucleic acids
- C12Q1/6876—Nucleic acid products used in the analysis of nucleic acids, e.g. primers or probes
- C12Q1/6883—Nucleic acid products used in the analysis of nucleic acids, e.g. primers or probes for diseases caused by alterations of genetic material
- C12Q1/6886—Nucleic acid products used in the analysis of nucleic acids, e.g. primers or probes for diseases caused by alterations of genetic material for cancer
-
- G—PHYSICS
- G16—INFORMATION AND COMMUNICATION TECHNOLOGY [ICT] SPECIALLY ADAPTED FOR SPECIFIC APPLICATION FIELDS
- G16B—BIOINFORMATICS, i.e. INFORMATION AND COMMUNICATION TECHNOLOGY [ICT] SPECIALLY ADAPTED FOR GENETIC OR PROTEIN-RELATED DATA PROCESSING IN COMPUTATIONAL MOLECULAR BIOLOGY
- G16B25/00—ICT specially adapted for hybridisation; ICT specially adapted for gene or protein expression
- G16B25/30—Microarray design
-
- G—PHYSICS
- G16—INFORMATION AND COMMUNICATION TECHNOLOGY [ICT] SPECIALLY ADAPTED FOR SPECIFIC APPLICATION FIELDS
- G16B—BIOINFORMATICS, i.e. INFORMATION AND COMMUNICATION TECHNOLOGY [ICT] SPECIALLY ADAPTED FOR GENETIC OR PROTEIN-RELATED DATA PROCESSING IN COMPUTATIONAL MOLECULAR BIOLOGY
- G16B40/00—ICT specially adapted for biostatistics; ICT specially adapted for bioinformatics-related machine learning or data mining, e.g. knowledge discovery or pattern finding
- G16B40/20—Supervised data analysis
-
- C—CHEMISTRY; METALLURGY
- C12—BIOCHEMISTRY; BEER; SPIRITS; WINE; VINEGAR; MICROBIOLOGY; ENZYMOLOGY; MUTATION OR GENETIC ENGINEERING
- C12Q—MEASURING OR TESTING PROCESSES INVOLVING ENZYMES, NUCLEIC ACIDS OR MICROORGANISMS; COMPOSITIONS OR TEST PAPERS THEREFOR; PROCESSES OF PREPARING SUCH COMPOSITIONS; CONDITION-RESPONSIVE CONTROL IN MICROBIOLOGICAL OR ENZYMOLOGICAL PROCESSES
- C12Q2600/00—Oligonucleotides characterized by their use
- C12Q2600/112—Disease subtyping, staging or classification
-
- C—CHEMISTRY; METALLURGY
- C12—BIOCHEMISTRY; BEER; SPIRITS; WINE; VINEGAR; MICROBIOLOGY; ENZYMOLOGY; MUTATION OR GENETIC ENGINEERING
- C12Q—MEASURING OR TESTING PROCESSES INVOLVING ENZYMES, NUCLEIC ACIDS OR MICROORGANISMS; COMPOSITIONS OR TEST PAPERS THEREFOR; PROCESSES OF PREPARING SUCH COMPOSITIONS; CONDITION-RESPONSIVE CONTROL IN MICROBIOLOGICAL OR ENZYMOLOGICAL PROCESSES
- C12Q2600/00—Oligonucleotides characterized by their use
- C12Q2600/118—Prognosis of disease development
-
- C—CHEMISTRY; METALLURGY
- C12—BIOCHEMISTRY; BEER; SPIRITS; WINE; VINEGAR; MICROBIOLOGY; ENZYMOLOGY; MUTATION OR GENETIC ENGINEERING
- C12Q—MEASURING OR TESTING PROCESSES INVOLVING ENZYMES, NUCLEIC ACIDS OR MICROORGANISMS; COMPOSITIONS OR TEST PAPERS THEREFOR; PROCESSES OF PREPARING SUCH COMPOSITIONS; CONDITION-RESPONSIVE CONTROL IN MICROBIOLOGICAL OR ENZYMOLOGICAL PROCESSES
- C12Q2600/00—Oligonucleotides characterized by their use
- C12Q2600/158—Expression markers
-
- G—PHYSICS
- G16—INFORMATION AND COMMUNICATION TECHNOLOGY [ICT] SPECIALLY ADAPTED FOR SPECIFIC APPLICATION FIELDS
- G16B—BIOINFORMATICS, i.e. INFORMATION AND COMMUNICATION TECHNOLOGY [ICT] SPECIALLY ADAPTED FOR GENETIC OR PROTEIN-RELATED DATA PROCESSING IN COMPUTATIONAL MOLECULAR BIOLOGY
- G16B25/00—ICT specially adapted for hybridisation; ICT specially adapted for gene or protein expression
-
- Y—GENERAL TAGGING OF NEW TECHNOLOGICAL DEVELOPMENTS; GENERAL TAGGING OF CROSS-SECTIONAL TECHNOLOGIES SPANNING OVER SEVERAL SECTIONS OF THE IPC; TECHNICAL SUBJECTS COVERED BY FORMER USPC CROSS-REFERENCE ART COLLECTIONS [XRACs] AND DIGESTS
- Y02—TECHNOLOGIES OR APPLICATIONS FOR MITIGATION OR ADAPTATION AGAINST CLIMATE CHANGE
- Y02A—TECHNOLOGIES FOR ADAPTATION TO CLIMATE CHANGE
- Y02A90/00—Technologies having an indirect contribution to adaptation to climate change
- Y02A90/10—Information and communication technologies [ICT] supporting adaptation to climate change, e.g. for weather forecasting or climate simulation
Definitions
- the present invention relates to the field of diagnosing, identifying, and predicting survival in lymphoproliferative disorders.
- Table 1 contains a list of the B and T cell neoplasms that have been recognized by the WHO classification. Each malignancy is listed according to its WHO classification nomenclature, followed by a WHO classification number.
- Table 1 B-cell neoplasms Category Name WHO ID # Precursor B-cell neoplasms Precursor B-cell lymphoblastic leukemia 9835/3 Precursor B-cell lymphoblastic lymphoma 9728/3 Mature B-cell neoplasms Chronic lymphocytic leukemla 9823/3 Small lymphocytic lymphoma 9670/3 B-cell prolymphocytic leukemia 9833/3 Lymphopiasmacytic lymphoma 9671/3 Splenic marginal zone lymphoma 9689/3 Hairy cell leukemia 9940/3 Plasma cell myeloma 9732/3 Solitary plasmacytoma of bone 9731/3 Extraosseous plasmacytoma 9734/3 Extranodal marginal zone B-cell
- lymphoma type or subtype in a subject suffering from a lymphoproliferative disorder is important for developing an appropriate therapeutic strategy.
- Previous attempts have been made to identify lymphoma using gene expression data obtained using a microarray.
- gene expression data obtained using a microarray.
- there is a need in the art for more accurate and predictive methods of analyzing this gene expression data.
- the present invention discloses a novel microarray for obtaining gene expression data to be used in identifying lymphoma types and predicting survival in a subject.
- the present invention further discloses a variety of methods for analyzing gene expression data obtained from a lymphoma sample, and specific algorithms for predicting survival and clinical outcome in a subject suffering from a lymphoma.
- compositions comprising the set of probes listed in Table 2, located at the end of the Detailed Description section.
- this composition comprises a microarray.
- the present invention provides a method of generating a survival predictor for a particular lymphoma type.
- a method of generating a survival predictor for a particular lymphoma type In this method, one or more biopsy samples that have been diagnosed as belonging to a particular lymphoma type are obtained. Gene expression data is obtained for these samples, and genes with expression patterns associated with longer or shorter survival are identified. Hierarchical clustering is performed to group these genes into gene expression signatures, and the expression of all genes within each signature are averaged to obtain a gene expression signature value for each signature. These gene expression signature values are then used to generate a multivariate survival predictor.
- the present invention provides a method for predicting survival in a follicular lymphoma (FL) subject,
- a biopsy sample is obtained from the subject and gene expression data is obtained from the biopsy sample.
- the expression level of those genes belonging to an immune response-1 or immune response-2 gene expression signature are averaged to generate gene expression signature values for each signature.
- a survival predictor score is then calculated using an equation: [2.71*(immune response-2 gene expression signature value)] - [2.36*(immune response-1 gene expression signature value)].
- a higher survival predictor score is associated with a less favorable outcome.
- the gene expression data used in this method is obtained using a microarray.
- the present invention provides another method for predicting survival in a follicular lymphoma (FL) subject.
- a biopsy sample is obtained from the subject and gene expression data is obtained from the biopsy sample.
- the expression level of those genes belonging to a B cell differentiation, T-cell, or macrophage gene expression signature are averaged to generate gene expression signature values for each signature.
- a survival predictor score is then calculated using an equation: [2.053*(macrophage gene expression signature value)] - [2.344*(T-cell gene expression signature value)] - [0.729*(B-cell gene expression signature value)].
- a higher survival predictor score is associated with a less favorable outcome,
- the gene expression data used in this method is obtained using a microarray.
- the present invention provides yet another method for predicting survival in a follicular lymphoma (FL) subject.
- a biopsy sample is obtained from the subject and gene expression data is obtained from the biopsy sample.
- the expression level of those genes belonging to a macrophage, T-cell, or B-cell differentiation gene expression signature are averaged to generate gene expression signature values for each signature.
- a survival predictor score is then calculated using an equation: [1.51*(macrophage gene expression signature value)]- [2.11*(T-cell gene expression signature value)] - [0.505*(B-cell differentiation gene expression signature value)].
- a higher survival predictor score is associated with a less favorable outcome.
- the gene expression data used in this method is obtained using a microarray.
- the present invention provides a method for predicting survival in a diffuse large B cell lymphoma (DLBCL) subject.
- a biopsy sample is obtained from the subject and gene expression data is obtained from the biopsy sample.
- the expression level of those genes belonging to an ABC DLBCL high, lymph node, or MHC class II gene expression signature are averaged to generate gene expression signature values for each signature.
- a survival predictor score is then calculated using an equation: [0,586*(ABC DLBCL high gene expression signature value)]- [0.468*(lymph node gene expression signature value)] - [0.336*(MHC class II gene expression signature value)].
- a higher survival predictor score is associated with a less favorable outcome.
- the gene expression data used in this method is obtained using a microarray.
- the present invention provides another method for predicting survival in a diffuse large B cell lymphoma (DLBCL) subject.
- a biopsy sample is obtained from the subject and gene expression data is obtained from the biopsy sample.
- the expression level of those genes belonging to a lymph node, germinal B cell, proliferation, or MHC class II gene expression signature are averaged to generate gene expression signature values for each signature.
- a survival predictor score is then calculated using an equation: [-0.4337*(lymph node gene expression signature)] + [0,09*(proliferation gene expression signature)]- [0.4144*(germinal center B-cell gene expression signature)] - [0.2006*(MHC class II gene expression signature)].
- a higher survival predictor score is associated with a less favorable outcome.
- the gene expression data used in this method is obtained using a microarray.
- the present invention provides yet another method for predicting survival in a diffuse large B cell lymphoma (DLBCL) subject.
- a biopsy sample is obtained from the subject and gene expression data is obtained from the biopsy sample.
- the expression level of those genes belonging to a lymph node, germinal B cell, or MHC class Il gene expression signature are averaged to generate gene expression signature values for each signature.
- a survival predictor score is then calculated using an equation: [-0.32*(lymph node gene expression signature)]- [0.176*(germinal B cell gene expression signature)]-[0,206*(MHC class II gene expression signature)].
- a higher survival predictor score is associated with a less favorable outcome.
- the gene expression data used in this method is obtained using a microarray.
- the gene expression data is obtained using RT-PCR.
- the present invention provides a method for predicting survival in a mantle cell lymphoma (MCL) subject.
- MCL mantle cell lymphoma
- a biopsy sample is obtained from the subject and gene expression data is obtained from the biopsy sample.
- the expression level of those genes belonging to a proliferation gene expression signature are averaged to generate a gene expression signature value.
- a survival predictor score is then calculated using an equation: [1.66*(proliferation gene expression signature value)].
- a higher survival predictor score is associated with a less favorable outcome.
- the gene expression data used in this method is obtained using a microarray.
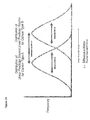
- the present invention provides a method for determining the probability that a sample X belongs to a first lymphoma type or a second lymphoma type.
- a set of genes is identified that is differentially expressed between the two lymphoma types in question, and a set of scale factors representing the difference in expression between the lymphoma types for each of these genes are calculated.
- a series of linear predictor scores are generated for samples belonging to either of the two lymphoma types based on expression of these genes.
- Gene expression data is then obtained for sample X , and a linear predictor score is calculated for this sample.
- the probability that sample X belongs to the first lymphoma type is calculated using an equation that incorporates the linear predictor score of sample X and the mean and variance of the linear predictor scores for the known samples of either lymphoma type.
- the present invention provides a method for determining the lymphoma type of a sample X .
- a set of genes is identified that is differentially expressed between a first lymphoma type and a second lymphoma type, and a set of scale factors representing the difference in expression of each of these genes between the two lymphoma types are calculated.
- a series of linear predictor scores are generated for samples belonging to either of the two lymphoma types based on expression of these genes. Gene expression data is then obtained for sample X , and a linear predictor score is calculated for this sample.
- the probability that sample X belongs to the first lymphoma type is calculated using an equation that incorporates the linear predictor score of sample X and the mean and variance of the linear predictor scores for the known samples of either lymphoma type. This entire process is then repeated with various lymphoma types being substituted for the first lymphoma type, the second lymphoma type, or both.
- the present invention provides another method for determining the lymphoma type of a sample X .
- a series of lymphoma type pairs are created, with each pair consisting of a first lymphoma type and a second lymphoma type.
- gene expression data is obtained for a set of genes, and a series of scale factors representing the difference in expression of each of these genes between the two lymphoma types are calculated.
- a subset of z genes with the largest scale factors are identified, and a series of linear predictor scores are generated for samples belonging to either of the two lymphoma types. Linear predictor scores are calculated for anywhere from 1 to z of these genes.
- the number of genes from 1 to z that results in the largest difference in linear predictor scores between the two lymphoma types is selected, and gene expression data for these genes is obtained for sample X .
- a linear predictor score is generated for sample X , and the probability that the sample belongs to the first lymphoma type is calculated using an equation that incorporates the linear predictor score for sample X and the mean and variance of the linear predictor scores for the known samples of either lymphoma type.
- the present invention provides another method for determining the lymphoma type of a sample X .
- a series of lymphoma type pairs are created, with each pair consisting of a first lymphoma type and a second lymphoma type.
- gene expression data is obtained for a set of genes, and a series of scale factors representing the difference in expression of each of these genes between the two lymphoma types are calculated.
- the set of genes is divided into gene-list categories indicating correlation with a gene expression signature. Within each gene-list category, a subset of z genes with the largest scale factors are identified, and a series of linear predictor scores are generated for samples belonging to either of the two lymphoma types.
- Linear predictor scores are calculated for anywhere from 1 to z of these genes. The number of genes from 1 to z that results in the largest difference in linear predictor scores between the two lymphoma types is selected, and gene expression data for these genes is obtained for sample X . A linear predictor score is generated for sample X , and the probability q that the sample belongs to the first lymphoma type is calculated using an equation that incorporates the linear predictor score for sample X and the mean and variance of the linear predictor scores for the known samples of either lymphoma type.
- a high probability q indicates that sample X belongs to the first lymphoma type
- a low probability q indicates that sample X belongs to the second lymphoma type
- a middle probability q indicates that sample X belongs to neither lymphoma type
- the cut-off point between high, middle, and low probability values is determined by ranking samples of known lymphoma type according to their probability values, then analyzing every possible cut-off point between adjacent samples using the equation: 3,99*[(% of first lymphoma type misidentified as second lymphoma type) + (% of second lymphoma type misidentified as a first lymphoma type)]+ [(% of first lymphoma type identified as belonging to neither lymphoma type) + (% of second lymphoma type identified as belonging to neither lymphoma type)].
- the final cut-off points are those that minimize the value of this equation.
- Gene expression profiling of a cancer cell or biopsy reflects the molecular phenotype of a cancer at the time of diagnosis.
- the detailed picture provided by the genomic expression pattern provides the basis for a new systematic classification of cancers and more accurate predictors of survival and response to treatment.
- the present invention discloses methods for identifying, diagnosing, and/or classifying a lymphoma, lymphoid malignancy, or lymphoproliferative disorder based on its gene expression patterns.
- the present invention also discloses methods for predicting survival in a subject diagnosed with a particular lymphoma type or subtype using gene expression data. The information obtained using these methods will be useful in evaluating the optimal therapeutic approach to be employed with regards to a particular subject.
- lymphoproliferative disorder refers to any tumor of lymphocytes, and may refer to both malignant and benign tumors.
- lymphocytes and may refer to both malignant and benign tumors.
- lymphoid malignancy refer specifically to malignant tumors derived from lymphocytes and lymphoblasts.
- lymphomas include, but are not limited to, follicular lymphomas (FL), Burkitt lymphoma (BL), mantle cell lymphoma (MCL), follicular hyperplasia (FH), small cell lymphocytic lymphoma (SLL), mucosa-associated lymphoid tissue lymphoma (MALT), splenic lymphoma, multiple myeloma, lymphoplasmacytic lymphoma, post-transplant lymphoproliferative disorder (PTLD), lymphoblastic lymphoma, nodal marginal zone lymphoma (NMZ), germinal center B cell-like diffuse large B cell lymphoma (GCB), activated B cell-like diffuse large B cell lymphoma (ABC) and primary mediastinal B cell lymphoma (PMBL).
- FL follicular lymphomas
- BL Burkitt lymphoma
- MCL mantle cell lymphoma
- FH small cell lymphocytic lymphoma
- lymphoma type refers to a diagnostic classification of a lymphoma.
- the phrase may refer to a broad lymphoma class (e.g., DLBCL, FL, MCL, etc.) or to a subtype or subgroup failing within a broad lymphoma class (e.g., GCB DLBCL, ABC DLBCL).
- gene expression data refers to information regarding the relative or absolute level of expression of a gene or set of genes in a cell or group of cells.
- the level of expression of a gene may be determined based on the level of RNA, such as mRNA, encoded by the gene. Alternatively, the level of expression may be determined based on the level of a polypeptide or fragment thereof encoded by the gene.
- Gene expression data may be acquired for an individual cell, or for a group of cells such as a tumor or biopsy sample.
- microarray refers to a plurality of nucleic acid probes coupled to the surface of a substrate in different known locations.
- the substrate is preferably solid.
- Microarrays have been generally described in the art in, for example, U.S. Patent Nos. 5,143,854 (Pirrung ), 6,424,186 (Fodor ), 5,445,934 (Fodor ), 5,677,195 (Winkler ), 5,744,305 (Fodor ), 5,800,992 (Fodor ), 6,040,193 (Winkler ), and Fodor et al. 1991. Light-directed, spatially addressable parallel chemical synthesis. Science, 251:767-777 . Each of these references is incorporated by reference herein in their entirety.
- gene expression signature refers to a group of coordinately expressed genes.
- the genes making up this signature may be expressed in a specific cell lineage, stage of differentiation, or during a particular biological response.
- the genes can reflect biological aspects of the tumors in which they are expressed, such as the cell of origin of the cancer, the nature of the non-malignant cells in the biopsy, and the oncogenic mechanisms responsible for the cancer (Shaffer 2001).
- Examples of gene expression signatures include lymph node (Shaffer 2001), proliferation (Rosenwald 2002), MHC class II, ABC DLBCL high, B-cell differentiation, T-cell, macrophage, immune response-1, immune response-2, and germinal center B cell.
- survival predictor score refers to a score generated by a multivariate model used to predict survival based on gene expression. A subject with a higher survival predictor score is predicted to have poorer survival than a subject with a lower survival predictor score.
- survival may refer to the probability or likelihood of a subject surviving for a particular period of time. Alternatively, it may refer to the likely term of survival for a subject, such as expected mean or median survival time for a subject with a particular gene expression pattern.
- linear predictor score refers to a score that denotes the probability that a sample belongs to a particular lymphoma type.
- a linear predictor score may be generated by other methods including but not limited to linear discriminant analysis (Dudoit 2002), support vector machines (Furey 2000), or shrunken centroids (Tibshirani 2002)
- scale factor refers to a factor that defines the relative difference in expression of a particular gene between two samples.
- An example of a scale factor is a t-score generated by a Student's t-test.
- lymphoma subject wherein “lymphoma” is a specific lymphoma type (e.g., "follicular lymphoma subject”), may refer to a subject that has been diagnosed with a particular lymphoma by any method known in the art or discussed herein. This phrase may also refer to a subject with a known or suspected predisposition or risk of developing a particular lymphoma type.
- the pattern of expression of a particular gene is closely connected to the biological role and effect of its gene product. For this reason, the systematic study of variations in gene expression provides an alternative approach for linking specific genes with specific diseases and for recognizing heritable gene variations that are important for immune function. For example, alielic differences in the regulatory region of a gene may influence the expression levels of that gene. An appreciation for such quantitative traits in the immune system may help elucidate the genetics of autoimmune diseases and lymphoproliferative disorders.
- Genes that encode components of the same multi-subunit protein complex are often coordinately regulated. Coordinate regulation is also observed among genes whose products function in a common differentiation program or in the same physiological response pathway. Recent application of gene expression profiling to the immune system has shown that lymphocyte differentiation and activation are accompanied by parallel changes in expression among hundreds of genes. Gene expression databases may be used to interpret the pathological changes in gene expression that accompany autoimmunity, immune deficiencies, cancers of immune cells and of normal immune responses.
- Mathematical analysis of gene expression generally has three goals. First, it may be used to identify groups of genes that are coordinately regulated within a biological system. Second, it may be used to recognize and interpret similarities between biological samples on the basis of similarities In gene expression patterns. Third, it may be used to recognize and identify those features of a gene expression pattern that are related to distinct biological processes or phenotypes.
- Mathematical analysis of gene expression data often begins by establishing the expression pattern for each gene on an array across n experimental samples.
- the expression pattern of each gene can be represented by a point in n-dimensional space, with each coordinate specified by an expression measurement in one of the n samples (Eisen 1998).
- a clustering algorithm that uses distance metrics can then be applied to locate clusters of genes in this n-dimensional space. These clusters indicate genes with similar patterns of variation in expression over a series of experiments.
- Clustering methods that have been applied to microarray data in the past include hierarchical clustering (Eisen 1998), self-organizing maps (SOMs) (Tamayo 1999), k-means (Tavazoie 1999), and deterministic annealing (Alon 1999).
- Hierarchical clustering begins by determining the gene expression correlation coefficients for each pair of the n genes studied. Genes with similar gene expression correlation coefficients are grouped next to one another in a hierarchical fashion. Generally, genes with similar expression patterns under a particular set of conditions encode protein products that play related roles in the physiological adaptation to those conditions. Novel genes of unknown function that are clustered with a large group of functionally related genes are likely to participate in the same biological process. Likewise, the other clustering methods mentioned herein may also group genes together that encode proteins with related biological function.
- Gene expression maps may be constructed by organizing the gene expression data from multiple samples using any of the various clustering algorithms outlined herein. The ordered tables of data may then be displayed graphically in a way that allows researchers and clinicians to assimilate both the choreography of gene expression on a broad scale and the fine distinctions in expression of individual genes.
- genes that are clustered together reflect a particular biological function, and are termed gene expression signatures (Shaffer 2001).
- One general type of gene expression signature includes genes that are characteristically expressed in a particular cell type or at a particular stage of cellular differentiation or activation.
- Another general type of gene expression signature includes genes that are regulated in their expression by a particular biological process such as proliferation, or by the activity of a particular transcription factor or signaling pathway.
- the pattern of gene expression in a biological sample provides a distinctive and accessible molecular picture of its functional state and identity (DeRisi 1997; Cho 1998; Chu 1998; Holstege 1998; Spellman 1998). Each cell transduces variation in its environment, internal state, and developmental state into readily measured and recognizable variation in gene expression patterns. Two different samples that have related gene expression patterns are therefore likely to be biologically and functionally similar to one another. Some biological processes are reflected by the expression of genes in a gene expression signature, as described above. The expression of gene expression signatures in a particular sample can provide important biological insights regarding its cellular composition and the function of various intracellular pathways within the cells.
- the present invention discloses a variety of gene expression signatures related to the clinical outcome of lymphoma patients. While several of these signatures share a name with a previously disclosed signature, each of the gene expression signatures disclosed herein comprises a novel combination of genes.
- the lymph node signature disclosed herein includes genes encoding extracellular matrix components and genes that are characteristically expressed In macrophage, NK, and T cells (e.g., ⁇ -Actinln, collagen type III ⁇ 1, connective tissue growth factor, fibronectin, KIAA0233, urokinase plasminogen activator).
- the proliferation signature includes genes that are characteristically expressed by cells that are rapidly multiplying or proliferating (e.g., c-myc, E21G3, NPM3, BMP6).
- the MHC class II signature includes genes that interact with lymphocytes in order to allow the recognition of foreign antigens (e.g., HLA-DP ⁇ , HLA-DQ ⁇ , HLA-DR ⁇ , HLA-DR ⁇ ).
- the immune response-1 signature includes genes encoding T cell markers (e.g., CD7, CD8B1, ITK, LEF1, STAT4), as well as genes that are highly expressed in macrophages (e.g., ACTN1, TNFSF13B).
- the immune response-2 signature includes genes known to be preferentially expressed in macrophages and/or dendritic cells (e.g., TLR5, FCGR1A, SEPT10, LGMN, C3AR1).
- the germinal center B cell signature includes genes known to be overexpressed at this stage of B cell differentiation (e.g., MME, MEF2C, BCL6, LMO2, PRSPAP2, MBD4, EBF, MYBL1.
- genes from the germinal center B-cell signature in a lymphoma biopsy suggests that the lymphoma is derived from this stage of B cell differentiation.
- the expression of genes from the T cell signature can be used to estimate the degree of infiltration of the tumor by host T cells, while the expression of genes from the proliferation signature can be used to quantitate the tumor cell proliferation rate.
- gene expression signatures provide an "executive summary" of the biological properties of a tumor specimen. Gene expression signatures can also be helpful in interpreting the results of a supervised analysis of gene expression data.
- Gene expression profiles can be used to create multivariate models for predicting survival.
- the methods for creating these models are called "supervised” because they use clinical data to guide the selection of genes to be used in the prognostic classification.
- a supervised method might identify genes with expression patterns that correlate with the length of overall survival following chemotherapy.
- the general method used to create a multivariate model for predicting survival may utilize the following steps:
- This approach has been utilized in the present invention to create novel survival prediction models for FL, DLBCL, and MCL.
- Each of these models generates a survival predictor score, with a higher score being associated with worse clinical outcome.
- Each of these models may be used separately to predict survival. Alternatively, these models may be used in conjunction with one or more other models, disclosed herein or in other references, to predict survival.
- Gene expression data can also be used to diagnose and identify lymphoma types.
- a statistical method based on Bayesian analysis was developed to classify lymphoma specimens according to their gene expression profiles. This method does not merely assign a tumor to a particular lymphoma type, but also determines the probability that the tumor belongs to that lymphoma type.
- Many different methods have been formulated to predict cancer subgroups (Golub 1999; Ramaswamy 2001; Dudoit 2002; Radmacher 2002). These methods assign tumors to one of two subgroups based on expression of a set of differentially expressed genes. However, they do not provide a probability of membership in a subgroup.
- the method disclosed herein used Bayes' rule to estimate this probability, thus allowing one to vary the probability cut-off for assignment of a tumor to a particular subgroup.
- the present method allows samples that do not meet the gene expression criteria of known subgroups to fall into an unclassified group with intermediate probability.
- a cancer subgroup predictor of the type described herein may be used clinically to provide quantitative diagnostic information for an individual cancer patient. This information can in turn be used to provide a predictor of treatment outcome for a particular cancer patient.
- lymphoma If only two types of lymphoma are being distinguished, then a single probability score is sufficient to discriminate between the two types. However, if more than two lymphoma types are being distinguished, multiple scores will be needed to highlight specific differences between the types.
- a novel microarray entitled the Lymph Dx microarray was developed for the identification and diagnosis of lymphoma types.
- the Lymph Dx microarray contains cDNA probes corresponding to approximately 2,653 genes, fewer than the number seen on microarrays that have been used previously for lymphoma diagnosis.
- the reduced number of probes on the Lymph Dx microarray is the result of eliminating genes that are less useful for the identification of lymphoma types and predicting clinical outcome. This reduction allows for simplified analysis of gene expression data.
- the genes represented on the Lymph Dx microarray can be divided into four broad categories: 1,101 lymphoma predictor genes identified previously using the Affymetrix U133 microarray, 171 outcome predictor genes, 167 new genes not found on the Affymetrix U133 microarray, and 1,121 named genes.
- a list of the probe sets on the Lymph Dx microarray is presented in Table 2, located at the end of the Detailed Description section.
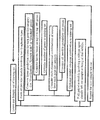
- gene expression data obtained using the Lymph Dx microarray was used to identify and classify lymphomas using Bayesian analysis. This method was similar to that outlined above, but included additional steps designed to optimize the number of genes used and the cut-off points between lymphoma types. A general overview of this method is presented in Figure 1 .
- Each gene represented on the Lymph Dx microarrays was placed into one of three gone-list categories based on its correlation with the lymph node or proliferation gene expression signatures: lymph node, proliferation, or standard. These signatures were identified by clustering of the DLBCL cases using hierarchical clustering and centrold-correlation of 0.35. Standard genes were those with expression patterns that did not correlate highly with expression of the lymph node or proliferation signatures.
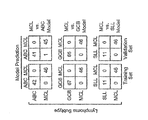
- Lymph Dx gene expression data was first used to identify samples as FL, MCL, SLL, FH, or DLBCL/BL, then to identify DLBCL/BL samples as ABC, GCB, PMBL, or BL.
- a series of pair-wise models was created, with each model containing a different pair of lymphoma types (e.g., FL vs. MCL, SLL vs. FH, etc.).
- the difference in expression of each gene on the microarray was measured, and a t-statistic was generated representing this difference.
- Genes from each gene-list category were ordered based on their t-statistic, and those with the largest t-statistics were used to generate a series of LPSs for samples belonging to either lymphoma type.
- the number of genes used to generate the LPSs was optimized by repeating the calculation using between five and 100 genes from each gene-list category.
- the number of genes from each category used in the final LPS calculation was that which gave rise to the largest difference in LPS between the two lymphoma types. Once the number of genes in each gene-list category was optimized, four different LPSs were calculated for each sample.
- LPS(X) is the LPS for sample X
- ⁇ ( x; ⁇ , ⁇ ) is the normal density function with mean ⁇ and standard deviation ⁇
- ⁇ 1 and ⁇ 1 are the mean and variance of the LPSs for samples belonging to the first lymphoma type
- ⁇ 2 and ⁇ 2 are the mean and variance of the LPSs for samples belonging to the second lymphoma type. Samples with high q values were classified as the first lymphoma type, samples with low q values were classified as the second lymphoma type, and samples with middle range q values were deemed unclassified.
- every possible cut-off point between adjacent samples was analyzed by an equation: 3.99 * % of type 1 misidentified as type 2 + % of type 2 misidentified as type 1 + % of type 1 unclassified + % of type 2 misidentified .
- This equation was used to favor the assignment of a sample to an "unclassified" category rather than to an incorrect lymphoma type.
- the final cut-off points were those which minimized this equation.
- the coefficient of 3.99 was chosen arbitrarily to allow an additional classification error only if the adjustment resulted in four or more unclassified samples becoming correctly classified.
- the coefficient can be varied to achieve a different set of trade-offs between the number of unclassified and misidentified samples.
- each model was validated by leave-one-out cross-validation. This entailed removing each sample of known lymphoma type from the data one at a time, and then determining whether the model could predict the missing sample. This process confirmed the accuracy of the prediction method.
- a lymphoproliferative disorder in accordance with embodiments of the present invention may be used in combination with any other effective classification feature or set of features.
- a disorder may be classified by a method of the present invention in conjunction with WHO suggested guidelines, morphological properties, histochemical properties, chromosomal structure, genetic mutation, cellular proliferation rates, immunoreactivity, clinical presentation, and/or response to chemical, biological, or other agents.
- Embodiments of the present invention may be used in lieu of or in conjunction with other methods for lymphoma diagnosis, such as immunohistochemistry, flow cytometry, FISH for translocations, or viral diagnostics.
- lymphoma type in a subject allows for better selection and application of therapeutic methods.
- Knowledge about the exact lymphoma affecting a subject allows a clinician to select therapies or treatments that are most appropriate and useful for that subject, while avoiding therapies that are nonproductive or even counterproductive.
- CNS prophylaxis may be useful for treating BL but not DLBCL
- CHOP treatment may be useful for treating DLBCL but not blastic MCL (Fisher 1993; Khouri 1998)
- subjects with follicular lymphoma frequently receive treatment while subjects with follicular hyperplasia do not.
- the lymphoma types or subtypes in question can be difficult to distinguish using prior art diagnostic methods.
- the diagnostic and identification methods of the present invention allow for more precise delineation between these lymphomas, which simplifies the decision of whether to pursue a particular therapeutic option.
- the survival prediction methods disclosed in the present invention also allow for better selection of therapeutic options.
- a subject with a very low survival predictor score i.e., very good prognosis
- survival predictor scores increase (i.e., prognosis gets worse)
- subjects may receive more intensive treatments.
- Those subjects with the highest survival predictor scores i.e., very poor prognosis
- Accurate survival prediction using the methods disclosed herein provides an improved tool for selecting treatment options and for predicting the likely clinical outcome of those options.
- gene expression data may be measured or estimated using one or more microarrays.
- the microarrays may be of any effective type, including but not limited to nucleic acid based or antibody based.
- Gene expression may also be measured by a variety of other techniques, including but not limited to PCR, quantitative RT-PCR, real-time PCR, RNA amplification, in situ hybridization, immunohistochemistry, immunocytochemistry, FACS, serial analysis of gene expression (SAGE) (Velculescu 1995), Northern blot hybridization, or western blot hybridization.
- Nucleic acid microarrays generally comprise nucleic acid probes derived from individual genes and placed in an ordered array on a support.
- This support may be, for example, a glass slide, a nylon membrane, or a silicon wafer.
- Gene expression patterns in a sample are obtained by hybridizing the microarray with the gene expression product from the sample.
- This gene expression product may be, for example, total cellular mRNA, rRNA, or cDNA obtained by reverse transcription of total cellular mRNA.
- the gene expression product from a sample is labeled with a radioactive, fluorescent, or other label to allow for detection.
- the microarray is washed, and hybridization of gene expression product to each nucleic acid probe on the microarray is detected and quantified using a detection device such as a phosphorimager or scanning confocal microscope.
- cDNA arrays consist of hundreds or thousands of cDNA probes immobilized on a solid support. These cDNA probes are usually 100 nucleotides or greater in size.
- nitrocellulose filter array which is generally prepared by robotic spotting of purified DNA fragments or lysates of bacteria containing cDNA clones onto a nitrocellulose filter (Southern 1992; Southern 1994; Gress 1996; Pietu 1996).
- cDNA arrays The other commonly used cDNA arrays is fabricated by robotic spotting of PCR fragments from cDNA clones onto glass microscope slides (Schena 1995; DeRisi 1996; Schena 1996; Shalon 1996; DeRisi 1997; Heller 1997; Lashkari 1997). These cDNA microarrays are simultaneously hybridized with two fluorescent cDNA probes, each labeled with a different fluorescent dye (typically Cy3 or Cy5). In this format, the relative mRNA expression in two samples is directly compared for each gene on the microarray. Oligonucleotide arrays differ from cDNA arrays in that the probes are 20- to 25-mer oligonucleotides.
- Oligonucleotide arrays are generally produced by in situ oligonucleotide synthesis in conjunction with photolithographic masking techniques (Pease 1994; Lipshutz 1995; Chee 1996; Lockhart 1996; Wodicka 1997).
- the solid support for oligonucleotide arrays is typically a glass or silicon surface.
- Microarrays may generally be produced using a variety of techniques, such as mechanical or light directed synthesis methods that incorporate a combination of photolithographic methods and solid phase synthesis methods. Techniques for the synthesis of microarrays using mechanical synthesis methods are described in, for example, U.S. Patent Nos. 5,384,261 (Winkler ) and 6,040,193 (Winkler ). Although a planar array surface is preferred, the microarray may be fabricated on a surface of virtually any shape, or even on a multiplicity of surfaces. Microarrays may be nucleic acids on beads, gels, polymeric surfaces, fibers such as fiber optics, glass or any other appropriate substrate. See, for example, U.S. Patent Nos.
- Microarrays may be packaged in such a manner as to allow for diagnostic use, or they can be an all-inclusive device. See, for example, U.S. Patent Nos. 5,856,174 (Lipshutz ) and 5,922,591 (Anderson ), both of which are incorporated by reference herein in their entirety.
- Microarrays directed to a variety of purposes are commercially available from Affymetrix (Affymetrix, Santa Clara, CA). For instance, these microarrays may be used for genotyping and gene expression monitoring for a variety of eukaryotic and prokaryotic species.
- Example 1 Collection and analysis of gene expression data using Affymetrix U133A and U133B microarrays:
- the 231 DLBCL samples were subdivided into the following lymphoma types based on gene expression (see below):
- the 16 MALT samples were subdivided into the following four group based on tumor origin:
- Each of the 568 cell samples was given a unique sample ID number consisting of the lymphoma type followed by a unique numerical identifier.
- “ABC_304” refers to an ABC DLBCL sample numbered 304.
- Cells were purified and RNA was isolated from the purified cells according to known methods described in the literature.
- RNA from each sample were applied to Affymetrix U133A and Affymetrix U133B microarrays according to standard Affymetrix protocol.
- the U133A and U133B microarrays are divided into probe sets, with each probe set consisting of up to 69 oligonucleotide probes 25 nucleotides in length. Each probe set represents a distinct human gene. Information pertaining to these microarrays is available at www.affymetrix.com.
- Each microarray was scanned using an Affymetrix scanner, which records signal intensity for every probe on the microarray.
- This information can be transformed into summary signal values for each probe set using a number of different algorithms, including MAS 5.0, D-chip (Li 2001), or Bioconductor's RMA algorithms (Irizarry 2003).
- the images produced by the scanner were evaluated by Affymetrix MAS 5.0 software.
- the signal value for each probe on the U133A and U133B microarrays was normalized to a target value of 500, and the base-2 log of the normalized values was used for the following analyses.
- Log-signal files were statistically analyzed using S+ software and the following S+ subtype predictor script: Although the log-signal values were analyzed using S+ software and the above algorithm, any effective software/algorithm combination may be used.
- Example 2 Collection of gene expression data using the novel Lymph Dx microarray :
- the novel Lymph Dx microarray contains cDNA probes corresponding to approximately 2,734 genes, 174 of these are "housekeeping" genes present for quality control, since they represent genes that are most variably expressed across all lymphoma samples. Other genes represented on the microarray were selected for their utility in identifying particular lymphoma samples and predicting survival in those samples.
- the genes represented on the Lymph Dx microarray can be divided into four broad categories: 1,101 lymphoma predictor genes identified previously using the Affymetrix U133 microarray, 171 outcome predictor genes identified using the Affymetrix U133 microarray, 167 genes not found on the Affymetrix U133 microarray but represented on the Lymphochip microarray (Alizadeh 1999), and 1,121 named genes.
- BL_2032_52748 refers to a Burkitt lymphoma sample with the numerical identifier 2032_52748.
- Cells were purified and RNA was isolated from the purified cells according to known methods described in the literature.
- RNA from each sample was applied to the Lymph Dx microarrays according to standard Affymetrix microarray protocol.
- Each microarray was scanned on an Affymetrix scanner. This scanner produced an image of the microarray, which was then evaluated by Affymetrix MAS 5.0 software.
- the signal intensity for each probe on the microarray can be transformed into summary signal values for each probe set through a number of different algorithms, including but not limited to MAS 5.0, D-chip (Li 2001), or Bioconductor's RMA algorithms (Irizarry 2003),
- Example 3 Development of a first FL survival predictor using gene expression data from Affymetrix U133A and U133B microarrays:
- Survival Signature Analysis begins by identifying genes whose expression patterns are statistically associated with survival. A hierarchical clustering algorithm is then used to identify subsets of these genes with correlated expression patterns across the lymphoma samples. These subsets are operationally defined as "survival-associated signatures.” Evaluating a limited number of survival-associated signatures mitigates the multiple comparison problems that are inherent in the use of large-scale gene expression data sets to create statistical models of survival (Ransohoff 2004).
- FL samples were divided into two equivalent groups: a training set (95 samples) for developing the survival prediction model, and a validation set (96 samples) for evaluating the reproducibility of the model.
- the overall survival of this cohort is depicted in Figure 3 .
- the median age at diagnosis was 51 years (ranging from 23 to 81 years), and the patients had a median follow-up of 6.6 years (8.1 years for survivors, with a range of ⁇ 1 to 28.2 years).
- Gene expression data from Affymetrix U133A and U133B microarrays was obtained for each sample.
- a Cox proportional hazards model was used to identify "survival predictor" genes, which were genes whose expression levels were, associated with long survival (good prognosis genes) or short survival (poor prognosis genes).
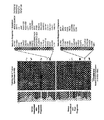
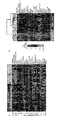
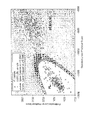
- a hierarchical clustering algorithm (Eisen 1998) was used to identify gene expression signatures within the good and poor prognosis genes according to their expression pattern across all samples. Ten gene expression signatures were observed within either the good prognosis or poor prognosis gene sets ( Figure 4 ). The expression level of every component gene in each of these ten gene expression signatures was averaged to create a gene expression signature value.
- the immune response-1 gene expression signature included genes encoding T cell markers (e.g., CD7, CD8B1, ITK, LEF1, STAT4) and genes that are highly expressed in macrophages (e.g., ACTN1, TNFSF13B).
- the immune response-1 signature is not merely a surrogate for the number of T cells in the FL biopsy sample because many other standard T cell genes (e.g., CD2, CD4, LAT, TRIM, SH2D1A) were not associated with survival.
- the immune response-2 gene expression signature included genes known to be preferentially expressed in macrophages and/or dendritic cells (e.g., TLR5, FCGR1A, SEPT10, LGMN, C3AR1). Table 4 lists the genes that were used to generate the gene expression signature values for the immune response-1 and immune response-2 signatures.
- the binary model formed by combining the two was more predictive of survival in the training set than any other binary model (p ⁇ .001).
- the immune response-1 and immune response-2 gene expression signatures contributed to the predictive power of the model in both the training set and the validation set.
- survival predictor score 2.71 * immune response - 2 gene expression signature value - 2.36 ⁇ immune response - 1 gene expression signature value .
- the two-signature model was associated with survival in a statistically significant fashion in both the training set (p ⁇ 0,001) and the validation set (p ⁇ 0.001), which demonstrated that the model was reproducible.
- the survival predictor score had a mean of 1.6 and a standard deviation of 0.894, with each unit increase in the predictor score corresponding to a 2.5 fold increase in the relative risk of death. Data for all 191 samples is shown in Table 6.
- Prognostic Index 4 Scores 0-1 63.1 47.5 N/A 0.029 2.28 (1.46- 3.57) ⁇ 0.001 Scores 2-3 33.3 45 2.07 (1.07- 4.00) Scores 4-5 3.6 7.5 3.73 (1.18- 11.18) 1 Due to rounding, percentages may not total 100 2 Relative risk of death (RR) based on 2-fold increase in expression 3 RR for grades 2 and 3 calculated with respect to risk of death for grade 1. The p-value is calculated for all grades. 4 RR for scores 2-3 and 4-5 calculated with respect to risk of death for scores 0-1. The p-value is calculated for all grades.
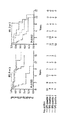
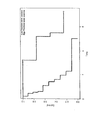
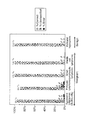
- the samples in the validation set were divided into three groups based on their IPI score, and the relationship between survival and IPI score was visualized by Kaplan-Meier plot ( Figure 6 ).
- the gene-expression-based survival predictor could stratify patients into groups differing by more than 5 years with regards to median survival ( Figure 7 ).
- the high-risk IPI group (IPI 4-5) comprised less than 5% of the samples, and was omitted from this analysis.
- Example 4 Development of a second FL survival predictor using gene expression data from Affymetrix U133A and U133B microarrays :
- 191 FL were divided into two equivalent groups: a training set (95 samples) for developing the survival prediction model, and a validation set (96 samples) for evaluating the reproducibility of the model.
- Gene expression data from Affymetrix U133A and U133B microarrays was obtained for each of the samples.
- a Cox proportional hazards model was used to identify survival predictor genes whose expression levels were associated with long survival (good prognosis genes) or short survival (poor prognosis genes) in the training set.
- a positive Cox coefficient indicated increasing mortality with increasing expression of the gene, while a negative Cox coefficient indicated decreasing mortality with increasing expression of the gene.
- a hierarchical clustering algorithm (Eisen 1998) was used to identify gene expression signatures within the good and poor prognosis genes according to their expression pattern across all samples. Eight clusters of coordinately regulated genes were observed within the good prognosis gene set and six clusters were observed in the poor prognosis gene sets. The expression level of every component gene in each of these gene expression signatures was averaged to create a gene expression signature value, After averaging, only ten of the gene expression signatures were found to be significantly associated with survival in the training set (p ⁇ 0.01). To create a multivariate model of survival, different combinations of these ten gene expression signature averages were generated and evaluated for their ability to predict survival within the training set.
- T-cell and macrophage based on the biological function of certain genes within each signature.
- the T-cell gene expression signature included genes that were typically expressed in T-cells, while the macrophage gene expression signature included a number of genes typically expressed in macrophages.
- these two signatures taken individually were not the best predictors of survival, the binary model formed by combining the two was more predictive than any combination of three signatures that did not contain these two signatures. Using these two signatures as an anchor, other signatures were added to the model using a step up procedure (Drapner 1966).
- the B-cell differentiation signature included a number of genes that appear to be involved in B-cell signal transduction. Table 9 lists the genes that were used to generate the gene expression signature values for the T-cell, macrophage, and B-cell differentiation gene expression signatures. Table 9 Signature UNIQID Unigene ID Build 167 (http://www.ncbi.nlm.
- Survival predictor score [ 2.053 * ( macrophage gene expression signature value ) ] - 2.344 * T - cell gene expression signature value - 0.729 * B - cell differentiation gene expression signature value .
- Example 5 Development of a third FL survival predictor using gene expression data from the Lymph Dx microarray :
- 191 FL samples were divided into two equivalent groups: a training set for developing the survival prediction model, and a validation set for evaluating the reproducibility of the model.
- Example 6 Development of a first DLBCL survival predictor using gene expression data from Affymetrix U133A and U133B microarrays:
- Genes that were significantly correlated with survival were grouped into gene expression signatures using a hierarchical clustering algorithm. The expression level of every component gene in each of these gene expression signatures was averaged for each sample to create a gene expression signature value.
- a step-up procedure (Drapner 1966) was applied to determine the optimal number of gene signatures to use In the survival predictor model. First, the gene expression signature that was most significantly associated with survival was included in the model. Next, the gene expression signature with the second highest association with survival was added to the model to form a two-component model. This procedure was repeated until there was no gene expression signature to add to the model with a p-value of ⁇ 0.05.
- the final prediction model Incorporated gene expression signature values from three gene expression signatures.
- the first gene expression signature added to the model was termed “ABC DLBCL high,” because it included genes that were more highly expressed in ABC than in GCB (Rosenwald 2002).
- the second gene expression signature added to the model was termed “lymph node,” because it reflected the response of non-tumor cells in the lymph node to the malignant lymphoma cells.
- the final gene expression signature added to the model was termed "MHC class II,” because it included all of the genes encoding the MHC class II alpha and beta chains. Table 14 shows the genes that were averaged to form each of these signatures.
- Survival predictor score 0.586 * ABC DLBCL high gene expression signature value - [ 0.468 * ( lymph node gene expression signature value ) ] - 0.336 * MHC Class II gene expression signature value .
- Example 7 Development of a second DLBCL survival predictor using gene expression data from the Lymph Dx microarray :
- DLBCL survival model based on gene expression had been developed previously using proliferation, germinal center B-cell, lymph node, and MHC class II gene expression signatures and the expression of the single gene BMP-6 (Rosenwald 2002). BMP-6 expression was poorly measured on the Lymph Dx microarray, but genes associated with each of these four gene expression signatures exhibited associations with survival similar to those observed using Lymphochip microarrays. DLBCL samples were divided into two groups: a training set (100 samples) for developing the survival prediction model, and a validation set (100 samples) for evaluating the reproducibility of the model. Gene expressed in the training set samples were clustered, and lymph node, germinal center B-cell, MHC class II, and proliferation gene expression signatures were identified.
- Table 17 lists p-values for the association of each signature with survival in the training set, the validation set, and overall.
- Table 17 Signature Training set Validation set Overall Lymph node 4.0 x 10 -5 2.3 x 10 -6 6.8 x 10 -10 Proliferation 8.1 x 10 -5 3.4 x 10 -3 2.1 x 10 -6 Germinal center B-cell 6.2 x 10 -6 2.1 x 10 -3 5.0 x 10 -8 MHC class II 2.4 x 10 -2 2.7 x 10 -3 3.1 x 10 -4
- Survival predictor score - 0.4337 * lymph node gene expression signature value + 0.09 * proliferation gene expression signature value - 0.4144 * germinal center B - cell gene expression signature value - 0.2006 * MHC class II gene expression signature value .
- the survival predictor score had a mean of 5.7 and a standard deviation of 0.78, with each unit increase in the predictor score corresponding to an approximately 2.7 fold increase in the relative risk of death. Data for all 200 samples is presented in Table 18.
- Example 8 Development of a third DLBCL survival predictor using gene expression data from the Lymph Dx microarray :
- the number of genes used to generate the DLBCL survival predictor in Example 7 were reduced in order to create a survival predictor compatible with RT-PCR.
- the list of genes from the lymph node and germinal center B-cell gene expression signatures was narrowed to those three genes from each signature that were most closely correlated with the lymph node and germinal center B-cell gene expression signature values, respectively.
- the genes from the proliferation gene expression signature did not add significantly to the reduced gene survival prediction model, so they were removed entirely.
- the expression of the genes within each signature was averaged on the log 2 scale to generate a gene expression signature value for each signature. Table 19 lists the genes that were used to generate these gene expression signature values.
- Table 20 lists p-values for the association of each signature with survival in the training set, the validation set, and overall.
- Table 20 Signature Training set Validation set Overall Lymph node 6.1 x 10 -6 0.0021 2.1 x 10 -17 Germinal center B-cell 3.5 x 10 -4 0.0099 2.7 x 10 -5 MHC class II 0.024 0.0026 0.00031
- Survival predictor score - 0.32 * lymph node gene expression signature value - [ 0.176 * ( germinal center B - cell gene expression signature value ) ] - 0.206 * MHC class II gene expression signature value .
- the survival predictor score had a mean of 6.54 and a standard deviation of 0.69, with each unit increase in the predictor score corresponding to an approximately 2.7 fold increase in the relative risk of death. Data for all 200 samples is presented in Table 21.
- Example 9 Development of an MCL survival predictor using gene expression data from Affymetrix U133A and U133B microarrays:
- survival predictor score 1.66 * proliferation gene expression signature value .
- the 21 MCL samples were divided into two equivalent groups based on their survival predictor scores. Those samples with survival predictor scores above the median were placed in the high proliferation group, while those with survival predictor scores below the median were placed in the low proliferation group.
- Figure 13 illustrates the Kaplan Meier survival estimates for these two groups, Median survival for the high proliferation group was 1.07 years, while median survival for the low proliferation group was 5.18 years.
- Example 10 Development of an MCL survival predictor using gene expression data from the Lymph Dx microarray :
- the 21 MCL samples were divided into two equivalent groups based on their survival predictor scores. Those samples with survival predictor scores above the median were placed in the high proliferation group, while those with survival predictor scores below the median were placed in the low proliferation group.
- Figure 14 illustrates the Kaplan Meier survival estimates for these two groups.
- Example 11 Identification of lymphoma samples as MCL based on Bayesian analysis of gene expression data from Affymetrix U133A and U133B microarrays:
- a statistical method based on Bayesian analysis was developed to distinguish MCL samples from samples belonging to other lymphoma types based on gene expression profiling. This method was developed using the gene expression data obtained in Example 1 for the following lymphoma types: ABC, GCB, PMBL, BL, FH, FL, MALT, MCL, PTLD, SLL, and splenic marginal zone lymphoma (splenic).
- Each predictor model calculates the probability that the sample belongs to a first lymphoma type rather than a second lymphoma type.
- a method was developed to determine whether a sample was MCL, or one of the following lymphoma types: ABC, BL, FH, FL, GCB, MALT, PMBL, PTLD, SLL, or splenic. This method required ten different predictor models, each designed to determine whether the sample belonged to MCL or one of the other ten lymphoma types (e.g., MCL vs. ABC, MCL vs. BL, etc.).
- lymphoma samples analyzed displayed a tendency towards elevated or reduced expression of genes from the lymph node and proliferation gene expression signatures. These genes are likely to be highly differentially expressed between the lymphoma types, but they do not serve as good predictor genes because they are often variably expressed within a single lymphoma type. For this reason, any gene that displayed a correlation with the proliferation or lymph node signatures was eliminated from consideration.
- LPS linear predictor score
- type 1 is MCL
- type 2 is one of the other nine lymphoma types
- ⁇ ( x ; ⁇ , ⁇ ) is the normal density function with mean ⁇ and standard deviation ⁇
- ⁇ 1 and ⁇ 1 are the sample mean and variance of the LPS values for lymphoma type 1
- ⁇ 2 and ⁇ 2 are the sample mean and variance of the LPS values for lymphoma type 2.
- This method was used to develop ten predictor models, one for each pairing of MCL and a second lymphoma type.
- a sample was classified as MCL if each of the ten predictors generated at least a 90% probability that the sample was MCL. If any of the ten predictors indicated a probability of less than 90%, the sample was classified as non-MCL.
- Table 26 MCL vs. ABC predictor genes UNIQID Gene name Scale Factor 1103711 Homo sapiens cDNA FLJ11833 fis, clone HEMBA1008579.
- Example 12 Identification of lymphoma samples as MCL based on Bayesian analysis of gene expression data from a Lymphochip microarray:
- Lymphoma samples with morphology consistent with MCL were identified by pathological review. Since t(11;14) translocation and cyclin D1 overexpression have been consistently associated with MAL, cyclin D1 mRNA levels were measured in each sample by quantitative RT-PCR. Of the 101 samples analyzed, 92 expressed cyclin D1 mRNA. These 92 samples, which were deemed the "core group" of MCLs, were divided into a training set and a validation set. Gene expression was measured in all 101 samples using a Lymphochip microarray (Alizadeh 1999). For comparison, gene expression was measured in 20 samples identified as SLL.
- MCL expression data was compared to expression data obtained previously for GCB (134 cases) and ABC (83 cases) (Rosenwald 2002).
- Several thousand genes were differentially expressed between cyclin D1-posltive MCL and the other lymphoma types with high statistical significance (p ⁇ 0.001). A complete listing of these genes is available at http://llmpp.nih.gov/MCl.
- MCL vs. SLL Three different binary predictor models were developed: MCL vs. SLL, MCL vs. GCB, and MCL vs. ABC. Each of these models was designed to calculate the probability that a sample was MCL rather than the other iymphoma type in the pair. For each pair, the genes that were most differentially expressed between MCL and the other lymphoma type in the pair were identified, and the difference in expression between the lymphoma types was quantified using a Student's t-test.
- LPS X ⁇ j ⁇ G t j ⁇ X j , where X j is the expression of gene j in sample X and t j is the t-statistic for the difference in expression of gene j between the two lymphoma types in the pair. Cyclin D1 was excluded from the calculation of LPS so that the model could be used to identify potential MCL cases that were cyclin D1 negative.
- ⁇ ( x ; ⁇ , ⁇ ) is the normal density function with mean ⁇ and standard deviation ⁇
- ⁇ MCL and ⁇ MCL are the sample mean and variance of the LPS values for MCL
- ⁇ 2 and ⁇ 2 are the sample mean and variance of the LPS values for the second lymphoma type of the pair.
- a cut-off point of 90% was selected for assigning a sample to a particular lymphoma type. Every sample in the training set were classified correctly using this model ( Figure 16 ). When applied to the validation set, the model correctly classified 98% of the cyclin D1-positive MCL cases as MCL ( Figure 16 ).
- This diagnostic test was applied to nine lymphoma cases that were morphologically consistent with MCL, but negative for cyclin D1 expression. Seven of these samples were classified as MCL, one was classified as GCB, and one was not assigned to any lymphoma type because none of the pairs generated a probability of 90% or greater.
- Example 13 Classification of DLBCL samples based on Bayesian analysis of gene expression data from the Lymphochip microarray:
- a statistical method to classify DLBCL samples based on Bayesian analysis was developed using gene expression data obtained using the Lymphochip cDNA microarray ((Rosenwald 2002). This data is available at http://llmpp.nih.gov/DLBCL. The data was divided into two sets: a training set used to create and optimize the prediction model, and a validation set to evaluate the performance of the model.
- the training set consisted of 42 ABC DLBCL samples and 67 GCB DLBCL samples
- the validation set consisted of 41 ABC DLBCL samples, 67 GCB DLBCL samples, and 57 type 3 DLBCL samples (Shipp 2002).
- LPS X ⁇ j t j ⁇ X j
- X j represents the expression level of gene j
- t j is a scaling factor whose value depends on the difference in expression of gene j between the two lymphoma types.
- the scaling factor used in this example was the t-statistic generated by a t test of the difference in gene j expression between two lymphoma types. Only those genes with the largest t-statistics were included when calculating the LPS for each sample. The list of genes used to generate the LPS was narrowed further by including only those genes that were most variably expressed within the training set.
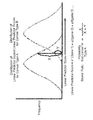
- the LPS is a linear combination of gene expression values
- its distribution within each lymphoma type should be approximately normal, provided that it includes a sufficient number of genes and the correlation structure of those genes is not extreme.
- the mean and variance of these normal distributions within a lymphoma type can then be estimated from the combined LPS's of all samples within the type.
- the LPS distribution of two lymphoma types can be used to estimate the probability that a new sample belongs to one of the types using Bayes' rule.
- Example 14 Classification of DLBCL samples based on Bayesian analysis of gene expression data from the Affymetrix HU6800 microarray:
- Example 13 The prediction method described in Example 13 above was applied to gene expression data from 58 DLBCL samples obtained using an Affymetrix HU 6800 oligonucleotide microarray (Shipp 2002). This data is available at www.genome.wi.mit.edu/MPR/lymphoma. The first step in analyzing this data was to exclude all microarray features with a median signal value of ⁇ 200 across the samples. Multiple microarray features representing the same gene were then averaged. Of the 27 genes in the DLBCL subtype predictor developed using the Lymphochip data (above), only 14 were represented on the Affymetrix array and passed this filtering process. These 14 genes are listed in Table 39.
- Example 15 Identification of DLBCL samples as PMBL based on Bayesian analysis of gene expression data from the Lymphochip microarray:
- lymphoma biopsy samples identified as DLBCL by a panel of hematopathologists were divided into a 36 sample training set and a 274 sample validation set, with the validation set consisting of the DLBCL samples classified previously in Example 13. All patients from whom the samples were derived had been treated with anthracycline-containing multiagent chemotherapy protocols, with some patients additionally receiving radiation therapy.
- the training set was profiled for gene expression using Lymphochip microarrays comprising 15,133 cDNA elements as described previously (Alizadeh 2000). This data is available at http://llmpp.nih.gov/PMBL.
- the validation set had previously been profiled using Lymphochip microarrays comprising 12,196 cDNA elements (Rosenwald 2002).
- a hierarchical clustering algorithm (Eisen 1998) was used to organize the genes by their expression patterns across the 36 samples in the training set.
- This cluster of genes included two genes, MAL and FIG1 , previously shown to be highly expressed in PMBL (Copie-Bergman 2002; Copie-Bergman 2003).
- Several of the lymphomas with mediastinal involvement did not express this set of putative PMBL signature genes, and it was suspected that these samples were more likely to be conventional DLBCL than PMBL.
- Hierarchical clustering was used to organize the samples according to their expression of the PMBL signature genes, resulting in two major clusters of cases ( Figure 20B ).
- One cluster contained 21 samples designated "PMBL core” samples by virtue of their higher expression of PMBL signature genes.
- the other cluster contained some samples that had virtually no expression of these genes, and other samples that did express these genes but at lower levels than the PMBL core samples.
- a gene expression-based method for distinguishing PMBL core cases from GCB and ABC DLBCL cases based on Bayesian analysis was developed using the methods described in Examples 13 and 14.
- a set of genes were selected that were differentially expressed between the PMBL core samples and both GCB and ABC (p ⁇ 0.001).
- This set of genes included all of the PMBL signature genes identified by hierarchical clustering ( Figure 20A ), as well as a large number of additional genes. Many of the genes in this set belonged to the lymph node gene expression signature (Alizadeh 2000; Rosenwald 2002). These genes were excluded from the final predictor because they might cause some DLBCL samples with higher expression of lymph node gene expression signature genes to be misclassified as PMBL.
- the list of PMBL distinction genes was refined by adding a requirement that they also be differential expressed between the PMBL core samples and a subgroup of six DLBCL samples with higher expression of lymph node gene expression signature genes (p ⁇ 0.001).
- the resulting set of 46 genes included 35 genes that were more highly expressed in PMBL and 11 genes that were more highly expressed in DLBCL ( Figure 21A ).
- the 46 genes in this set were PDL2, SNFT, IL13RA1, FGFR1, FLJ10420, CCL17/TARC, TNFRSF8/CD30, E2F2, MAL, TNFSF4/OX40 ligand, IL411/ Fig1 , IMAGE:686580, BST2, FLJ31131, FCER2/CD23, SAMSN1, JAK2, FLJ00066, MST1R, TRAF1, SLAM, LY75, TNFRSF6/Fas, FNBP1, TLR7, TNFRSF17/BCMA, CDKN1A/p21CIP1, RGS9, IMAGE:1340506, NFKB2, KIAA0339, ITGAM, IL23A, SPINT2, MEF2A, PFDN5, ZNF141, IMAGE:4154313, IMAGE:825382, DLEU1, ITGAE, SH3BP5, BANK, TCL1A, PRKAR1B, and CARD11.
- a series of linear predictor scores were generated based on the expression of this gene set. Based on the distribution of linear predictor scores within a particular lymphoma type, Bayes' rule can be used to estimate the probability that a particular sample belongs to either of the two types. An arbitrary probability cut-off of 90% or greater was used to classify a sample as a particular lymphoma type. All of the PMBL core samples were classified as PMBL using this method, as were six of the other lymphoma samples with mediastinal involvement. However, nine of the lymphoma samples with mediastinal involvement were classified as a DLBCL, as were all of the GCB and ABC samples.
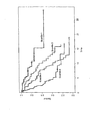
- PMBL represents a third subgroup of DLBCL than can be distinguished from ABC and GCB by gene expression profiling.
- Table 40 compares the clinical parameters of patients assigned to the PMBL, ABC, and GCB subgroups of DLBCL using this prediction method.
- Table 40 ABC DLBCL GCB DLBCL PMBL Training set PMBL Validation set PMBL All cases
- PMBL patients were significantly younger than other DLBCL patients, with a median age at diagnosis of 33 years compared with a median age of 66 and 61 years for ABC and GCB patients, respectively. Although there was no significant difference in gender distribution among the DLBCL subgroups, young women ( ⁇ 35 years) accounted for 35% of PMBL patients, more than any other DLBCL subgroup. Young men ( ⁇ 35 years) were also more frequently represented in the PMBL subgroup, accounting for 19% of the patients. Correspondingly, older men and women (age >60) were significantly underrepresented in the PMBL subgroup. These clinical characteristics were observed In both the training set and the validation set of PMBL cases, demonstrating that the PMBL predictor reproducibly identified a clinically distinct subgroup of DLBCL patients.
- the PMBL subgroup defined by the PMBL predictor had a relatively favorable overall survival rate after therapy ( Figure 22 ).
- Example 16 Classification of lymphomas into types based on Bayesian analysis of gene expression data from the Lymph Dx microarray:
- a cluster of "proliferation signature” genes and a cluster of "lymph node signature” genes were identified. The expression of these genes was averaged to form a proliferation signature and a lymph node signature.
- Each gene represented on the Lymph Dx microarray was placed into one of three “gene-list categories” based on its correlation with the proliferation or lymph node gene signatures. "Proliferation" genes were defined as those genes for which the correlation between their expression and the proliferation signature was greater than 0.35.
- Lymph node genes were defined as those genes for which the correlation between their expression and the lymph node signature was greater than 0.35.
- the remaining genes on the array were classified as standard genes. This classification resulted in 323 proliferation genes and 375 lymph node genes.
- the samples were divided into five types: FL, MCL, SLL, FH, and a class of aggressive lymphomas that included DLBCL and BL.
- Samples obtained from subjects with other diagnoses e.g., MALT, LPC
- Data from the Lymph Dx microarray was then used to compare gene expression in each possible lymphoma type pair (e.g., FH vs. FL, MCL vs. SLL, etc.). This resulted in the creation of ten "pair-wise models" (one for each possible lymphoma type pair) for predicting whether a sample fell into a particular lymphoma type.
- each lymphoma type pair For each lymphoma type pair, the difference in expression between the two types for every gene on the microarray was calculated, and a t-statistic was generated to represent this difference.
- gene-list category proliferation, lymph node, and standard
- individual genes were ordered based on the absolute value of their t-statistic. Only those genes that displayed a statistically significant difference in expression between the two types were included in the model. Those genes with largest absolute t-statistics in each gene-list category were then used to generate a linear predictor score (LPS) for each sample.
- LPS linear predictor score
- LPS X ⁇ j ⁇ G t j ⁇ X j
- X j is the expression of gene j in the sample
- t j is the t-statistic representing the difference in expression of gene j between the two lymphoma types.
- This formulation of LPS known as the compound covariate predictor, has previously been used successfully (Radmacher 2002; Rosenwald 2003; Wright 2003).
- Other ways to formulate an LPS include Fisher linear discriminant analysis (Dudoit 2002), weighted voting (Golub 1999), linear support vector machines (Ramaswamy 2001), and nearest shrunken centroids (Tibshirani 2002).
- LPS's were calculated for each sample using four different combinations. In the first, LPS was calculated using the standard genes only. In the second, LPS's were calculated for both the standard and proliferation genes, but not the lymph node genes. In the third, LPS's were calculated for both the standard and lymph node genes, but not the proliferation genes. In the fourth, LPS's were calculated using all three gene-list categories.
- each sample could be thought of as a vector in a space of between one and three dimensions. Since the LPSs were sums of individual expressions, it was reasonable to approximate the distributions as normal. Multivariate normal distributions are defined by two quantities: a mean vector, which indicates the average value of each of the models within a given lymphoma type, and a covariance matrix, which indicates the magnitude and orientation spread of points away from this center. Both of these quantities can be estimated empirically from the observed data.
- Figure 24 shows the Standard and Proliferation LPS's for the FL vs. DLBCL/BL pair-wise model. The dotted lines indicate the standard deviations from the fitted multivariate normal distributions.
- Bayes' rule (Bayes 1763) can be used to estimate the probability that a given sample belongs to one lymphoma type or another. Bayesian analysis of an LPS has been successfully employed in the past to distinguish DLBCL subtypes (Rosenwald 2003, Wright 2003).
- LPS(X) is the linear predictor score for sample X
- ⁇ ( x; ⁇ , ⁇ ) is the normal density function with mean ⁇ and standard deviation ⁇
- ⁇ 1 and ⁇ 1 are the mean and variance of the LPS's for the first lymphoma type
- ⁇ 2 and ⁇ 2 are the mean and variance of the LPS's for the second lymphoma type.
- a single probability q value can be developed for each sample and for each of the four LPS combinations. This q value can then be used to classify a sample as a first lymphoma type, a second lymphoma type, or unclassified. Samples with the highest q values are classified as the first lymphoma type, while samples with the lowest q values are classified as the second lymphoma type. Samples with middle range q values are deemed unclassified. Classifying the samples in this manner requires two cut-off points: a lower cut-off point between the second lymphoma type and unclassified, and an upper cut-off point between unclassified and the first lymphoma type.
- the cut-off point would be adjusted to allow an additional error only if this adjustment resulted in four or more unclassified samples becoming correctly classified.
- the final model and cut-off point for a given pair-wise analysis was that which minimized this equation.
- the equation utilizes percentages rather than the actual number of cases in order to account for the different number of samples in each class.
- cut-off point optimality is defined in terms of dividing the data into subtypes, all cut-off points between a pair of borderline cases will be equally optimal.
- values were chosen that would lead to a larger unclassified region.
- a value would be chosen that was 1/5 of the way from the smallest borderline case to the largest.
- a value would be chosen that was 4/5 of the way from the smallest borderline case to the largest.
- Figure 25 illustrates the q -results of optimizing the cut-point for the FL versus DLBCL/BL samples.
- Figure 26 indicates how this choice of cut-off points divided the space of LPS's.
- each pair-wise model will produce one of three possible results: 1) the sample belongs to the first lymphoma type of the pair-wise model, 2) the sample belongs to the second lymphoma type of the pair-wise model, or 3) the sample is unclassified. If each of the n -1 models agrees that the sample belongs to a particular lymphoma type, then the sample is designated as belonging to that type. If the n -1 models do not all agree that the sample belongs to a particular lymphoma type, the sample is designated as unclassified.
- Tables 41 and 42 The results of the leave-one-out predictions are set forth in Tables 41 and 42, below.
- the rows in each table correspond to different sample groups, while the columns indicate the prediction results.
- the standard to which the prediction results were compared in this stage was the diagnoses of a panel of eight expert hematopathologists who used histological morphology and immunohistochemistry to classify the samples.
- Table 41 provides classification results for the five lymphoma types tested (DLBCL/BL, FL, FH, MCL, SLL), while Table 42 provides more specific results for classification of subtypes within these five lymphoma types.
- the results set forth in Table 41 are also summarized in Figure 27 .
- Example 17 Classification of DLBCL/BL samples into subtypes based on Bayesian analysis of gene expression data from the Lymph Dx microarray:
- Example 16 Samples identified as DLBCL/BL in Example 16 were subdivided into four types: ABC, GCB, PMBL, and BL. These samples were then used to generate six pair-wise models using the same procedure described in Example 16. The results of the leave-one-out predictions using these pair-wise models are set forth in Table 43, below. These results are also summarized in Figure 28 . The rows in the table correspond to different sample groups, while the columns indicate the prediction results. In this stage, the ability of the prediction method to identify BL was again measured against the diagnoses of hematopathologists.
- the above classification was implemented using S+ software and the S+ subtype predictor script contained in the file entitled "Subtype_Predictor.txt,” located in the computer program listing appendix contained on CD number 22 of 22.
- This S+ script implements the lymphoma prediction algorithm.
- this script is pasted into an S+ script window and run in a working directory containing the data set files discussed below, it will produce a text file entitled "PredictionResults.txt,” which indicates the results of the predictive algorithm.
- the other files in the computer program listing appendix contain the required data sets, in their required format, for carrying out the lymphoma type identification described above.
- the file entitled “GeneData.txt” contains the gene expression values for each sample analyzed.
- the file entitled “GeneID.txt” contains information about the genes in the GeneData.txt file, and is also included in the working directory when the S+ subtype predictor script is run. This file indicates the UNIQID for each gene, as well as the extent to which the gene is associated with the lymph node and proliferation signatures ("LN.cor” and "pro.cor,” respectively).
- the file entitled “SampleID.txt” contains information about the samples included in the "GeneData.txt” file, specifically the original classification of all the samples. This file is also included in the working directory when the S+ subtype predictor script is run.
- the file entitled “PredictionResults.txt” is an example of the productive output of the prediction algorithm.
- Tables 44-59 indicate for each of the pair wise models the list of genes used, the weight given to each of those genes, the signature with which each gene was associated, the mean values and covariance matrices associated with the subtypes being compared, and the q-value cut-points of the pairwise model.
- Table 44 ABC vs. BL Signature Scale UNIQID Unigene ID Build 167 http://www.ncbi.nlm.
- ABC activated B-cell-like diffuse large B cell lymphoma
- BL Burkitt lymphoma
- CHOP cyclophosphamide, doxorubicine, vincristine, and prednisone
- Cl confidence interval
- CNS central nervous system
- DLBCL diffuse large B-cell lymphoma
- ECOG Eastern Cooperative Oncology Group
- EST expressed sequence tag
- FACS fluorescence-activated cell sorting
- FH follicular hyperplasia
- FL follicular lymphoma
- GCB germinal center B-cell-like diffuse large B cell lymphoma
- IPI International Prognostic Index
- LPC lymphoplasmacytic lymphoma
- LPS linear predictor score
- MALT mucosa-associated lymphoid tissue lymphomas
- MCL mantle cell lymphoma
- MHC major histocompatibility complex
- NA not available
- NK natural killer
- NMZ NMZ
Applications Claiming Priority (2)
| Application Number | Priority Date | Filing Date | Title |
|---|---|---|---|
| US50037703P | 2003-09-03 | 2003-09-03 | |
| EP04783330A EP1664762A4 (fr) | 2003-09-03 | 2004-09-03 | Procedes d'identification, de diagnostic et de prediction pour la survie des lymphomes |
Related Parent Applications (1)
| Application Number | Title | Priority Date | Filing Date |
|---|---|---|---|
| EP04783330.6 Division | 2004-09-03 |
Publications (2)
| Publication Number | Publication Date |
|---|---|
| EP2157524A2 true EP2157524A2 (fr) | 2010-02-24 |
| EP2157524A3 EP2157524A3 (fr) | 2010-12-08 |
Family
ID=34272947
Family Applications (2)
| Application Number | Title | Priority Date | Filing Date |
|---|---|---|---|
| EP04783330A Withdrawn EP1664762A4 (fr) | 2003-09-03 | 2004-09-03 | Procedes d'identification, de diagnostic et de prediction pour la survie des lymphomes |
| EP09170243A Withdrawn EP2157524A3 (fr) | 2003-09-03 | 2004-09-03 | Procédés d'identification, de diagnostic et de prédiction pour la survie des lymphomes |
Family Applications Before (1)
| Application Number | Title | Priority Date | Filing Date |
|---|---|---|---|
| EP04783330A Withdrawn EP1664762A4 (fr) | 2003-09-03 | 2004-09-03 | Procedes d'identification, de diagnostic et de prediction pour la survie des lymphomes |
Country Status (5)
| Country | Link |
|---|---|
| US (1) | US7711492B2 (fr) |
| EP (2) | EP1664762A4 (fr) |
| AU (1) | AU2004271192B2 (fr) |
| CA (1) | CA2537254A1 (fr) |
| WO (1) | WO2005024043A2 (fr) |
Cited By (1)
| Publication number | Priority date | Publication date | Assignee | Title |
|---|---|---|---|---|
| WO2021064230A1 (fr) * | 2019-10-02 | 2021-04-08 | Ophiomics - Investigação E Desenvolvimento Em Biotecnologia, Sa | Marqueurs de pronostic clinique et moléculaire pour une transplantation hépatique |
Families Citing this family (48)
| Publication number | Priority date | Publication date | Assignee | Title |
|---|---|---|---|---|
| DK2537942T3 (en) | 2004-05-21 | 2015-12-14 | Trustees Of The University Of Arkansas System Board Of | Use of genudtryksprofilering to predict survival in cancer patients |
| US7741035B2 (en) * | 2004-05-21 | 2010-06-22 | Board Of Trustees Of The University Of Arkansas | Use of gene expression profiling to predict survival in cancer patient |
| WO2006014335A2 (fr) * | 2004-07-02 | 2006-02-09 | Genentech, Inc. | Compositions et procedes pour le traitement de lymphome non hodgkinien |
| US8293716B2 (en) * | 2005-05-26 | 2012-10-23 | Ramot At Tel Aviv University Ltd. | Method of treating cancer by modulation of mortalin |
| US20080280297A1 (en) * | 2005-07-15 | 2008-11-13 | The Trustees Of Columbia University In The City Of | Compositions and Methods for Differential Diagnosis of Chronic Lymphocytic Leukemia |
| ES2324435B1 (es) | 2005-10-27 | 2010-05-31 | Fundacion Para El Estudio De La Hematologia Y Hemoterapia De Aragon (Fehha) | Procedimiento y dispositivo de analisis in vitro de mrna de genes implicados en neoplasias hematologicas. |
| ES2526079T3 (es) | 2005-12-20 | 2015-01-05 | Sbi Biotech Co., Ltd. | Anticuerpo anti-ILT7 |
| WO2007071829A2 (fr) * | 2005-12-22 | 2007-06-28 | Dermagene Oy | Méthodes et moyens relatifs à des maladies |
| US20070243561A1 (en) * | 2006-02-16 | 2007-10-18 | Ben Geeraerts | Prognostic markers in chronic lymphocytic leukemia |
| GB2435882A (en) * | 2006-03-09 | 2007-09-12 | Bioinvent Int Ab | Detection and treatment of mantle cell lymphoma |
| EP2061464A2 (fr) * | 2006-09-14 | 2009-05-27 | Ramot, at Tel Aviv University Ltd. | Thérapie combinée pour le traitement d'une maladie tumorale |
| US8697373B2 (en) | 2006-10-06 | 2014-04-15 | Clarient Diagnostic Services, Inc. | Reagents and methods for use in cancer diagnosis, classification and therapy |
| AU2007221966A1 (en) * | 2006-12-08 | 2008-06-26 | Centenary Institute Of Cancer Medicine And Cell Biology | Assay for response to proteasome inhibitors |
| US20080233106A1 (en) * | 2007-03-22 | 2008-09-25 | National University Of Ireland | Markers for labour |
| EP2140025A2 (fr) * | 2007-04-16 | 2010-01-06 | Ipsogen | Procedes d'evaluation de l'aptitude d'un resultat clinique pour un mammifere femelle souffrant d'un cancer du sein |
| GB0709092D0 (en) * | 2007-05-11 | 2007-06-20 | Borrebaeck Carl | Diagnosis and method of disease |
| KR100936286B1 (ko) * | 2007-07-26 | 2010-01-14 | 한국과학기술연구원 | 아미오다론 처리에 따른, 폐독성 유발 약물 검색용마커유전자 및 이를 이용한 검색 방법 |
| US8470793B2 (en) * | 2007-09-25 | 2013-06-25 | Ramot At Tel-Aviv University Ltd. | Down-regulation of mortalin by siRNA |
| CN102099485A (zh) * | 2007-10-23 | 2011-06-15 | 临床基因组学有限公司 | 诊断新生物的方法-ⅱ |
| AU2008323701B2 (en) * | 2007-11-07 | 2015-03-26 | Genentech, Inc | Methods and compositions for assessing responsiveness of B-cell lymphoma to treatment with anti-CD40 antibodies |
| US8042073B1 (en) | 2007-11-28 | 2011-10-18 | Marvell International Ltd. | Sorted data outlier identification |
| WO2009149359A2 (fr) * | 2008-06-06 | 2009-12-10 | The United States Of America, As Represented By The Secretary, Dept. Of Health And Human Services | Indice de survie pour un lymphome à grandes cellules b diffus |
| BRPI1011394A8 (pt) | 2009-04-18 | 2018-06-26 | Genentech Inc | método para avaliação de responsividade de linforma de células b ao tratamento com anticorpos anti-cd40 |
| CN102422294B (zh) * | 2009-05-11 | 2015-11-25 | 皇家飞利浦电子股份有限公司 | 用于比较分子标签的设备和方法 |
| US20130143747A1 (en) * | 2011-12-05 | 2013-06-06 | Myriad Genetics, Incorporated | Methods of detecting cancer |
| WO2011097476A1 (fr) * | 2010-02-04 | 2011-08-11 | Indiana University Research And Technology Corporation | Batterie de biomarqueurs à quatre protéines utilisable pour le diagnostic d'un lymphome à partir de spécimens biologiques |
| CA2800913C (fr) | 2010-06-03 | 2019-07-23 | Pharmacyclics, Inc. | Utilisation d'inhibiteurs de la tyrosine kinase de bruton (btk) |
| US9138436B2 (en) | 2011-07-13 | 2015-09-22 | Pharmacyclics Llc | Inhibitors of Bruton's tyrosine kinase |
| US9589099B2 (en) * | 2011-07-21 | 2017-03-07 | The Chinese University Of Hong Kong | Determination of gene expression levels of a cell type |
| WO2013082105A1 (fr) * | 2011-11-29 | 2013-06-06 | Albert Einstein College Of Medicine Of Yeshiva University | Activation de stat3 en tant que marqueur pour classer et pronostiquer des patients atteints du lymphome diffus à grandes cellules b (dlbcl) |
| MA37711A1 (fr) | 2012-06-04 | 2017-05-31 | Pharmacyclics Inc | Formes cristallines d'un inhibiteur de tyrosine kinase de bruton |
| PL2880180T3 (pl) * | 2012-08-06 | 2019-04-30 | Assist Publique Hopitaux De Paris | Sposoby i zestawy do badań przesiewowych pacjentów z nowotworem |
| BR112015018929B8 (pt) * | 2013-02-06 | 2023-01-31 | Geissler Companies Llc | Sistema de saúde eletrônico para determinar a eficácia de uma droga administrada usando análise de auscultação |
| CA2912312C (fr) | 2013-05-20 | 2023-01-24 | Board Of Trustees Of The University Of Arkansas | Modele gep5 pour myelome multiple |
| CA2929826C (fr) * | 2013-11-06 | 2022-08-16 | The United States Of America, As Represented By The Secretary, Department Of Health And Human Services | Methode pour selectionner et traiter des types de lymphomes |
| ES2804308T3 (es) * | 2014-03-11 | 2021-02-05 | Inst Nat Sante Rech Med | Métodos y kits para clasificar linfoma de linfocitos B grande difuso (DLBCL) en GCB-DLBCL o en ABC-DLBCL |
| WO2015157291A1 (fr) * | 2014-04-07 | 2015-10-15 | The Brigham And Women's Hospital, Inc. | Classification de lymphomes b entraînés par des gènes myc |
| EP2995689B1 (fr) * | 2014-09-11 | 2017-09-13 | Warszawski Uniwersytet Medyczny | Stratification de cas de lymphome à cellules B à l'aide d'une signature d'expression génique |
| BR122023020985A2 (pt) | 2015-03-03 | 2023-12-26 | Pharmacyclics Llc | Formulação de comprimido sólido de um inibidor de tirosina quinase de bruton |
| MA41827A (fr) | 2015-03-27 | 2018-01-30 | Pharmacyclics Llc | Formes solvatées d'un inhibiteur de la tyrosine kinase de bruton |
| MA41828A (fr) | 2015-03-27 | 2018-01-30 | Pharmacyclics Llc | Co-cristaux d'un inhibiteur de la tyrosine kinase de bruton |
| US10689708B2 (en) * | 2015-09-25 | 2020-06-23 | Celgene Corporation | Methods for treating diffuse large B-cell lymphoma and the use of biomarkers as a predictor of responsiveness to drugs |
| CN108472258A (zh) | 2016-01-19 | 2018-08-31 | 詹森药业有限公司 | 包含btk抑制剂的配制品/组合物 |
| BR112018014590A2 (pt) | 2016-01-19 | 2018-12-11 | Janssen Pharmaceutica Nv | formulações/composições compreendendo um inibidor de btk |
| CA3021569A1 (fr) | 2016-04-20 | 2017-10-26 | The United States Of America, As Represented By The Secretary, Department Of Health And Human Services | Evaluation du lymphome a cellules du manteau et procedes associes |
| WO2017194670A1 (fr) * | 2016-05-13 | 2017-11-16 | Roche Diagnostics Gmbh | Procédés et compositions pour la classification du dlbcl |
| EP3638814B8 (fr) | 2017-06-14 | 2023-06-21 | The United States of America, as Represented by The Secretary, Department of Health and Human Services | Procédé de détermination de type de lymphome |
| CN111621565B (zh) * | 2020-05-07 | 2023-12-15 | 杭州可帮基因科技有限公司 | 弥漫性大b细胞淋巴瘤分子分型试剂盒及分型装置 |
Citations (30)
| Publication number | Priority date | Publication date | Assignee | Title |
|---|---|---|---|---|
| US5143854A (en) | 1989-06-07 | 1992-09-01 | Affymax Technologies N.V. | Large scale photolithographic solid phase synthesis of polypeptides and receptor binding screening thereof |
| US5242974A (en) | 1991-11-22 | 1993-09-07 | Affymax Technologies N.V. | Polymer reversal on solid surfaces |
| US5252743A (en) | 1989-11-13 | 1993-10-12 | Affymax Technologies N.V. | Spatially-addressable immobilization of anti-ligands on surfaces |
| US5324633A (en) | 1991-11-22 | 1994-06-28 | Affymax Technologies N.V. | Method and apparatus for measuring binding affinity |
| US5384261A (en) | 1991-11-22 | 1995-01-24 | Affymax Technologies N.V. | Very large scale immobilized polymer synthesis using mechanically directed flow paths |
| US5424186A (en) | 1989-06-07 | 1995-06-13 | Affymax Technologies N.V. | Very large scale immobilized polymer synthesis |
| US5491074A (en) | 1993-04-01 | 1996-02-13 | Affymax Technologies Nv | Association peptides |
| US5527681A (en) | 1989-06-07 | 1996-06-18 | Affymax Technologies N.V. | Immobilized molecular synthesis of systematically substituted compounds |
| US5550215A (en) | 1991-11-22 | 1996-08-27 | Holmes; Christopher P. | Polymer reversal on solid surfaces |
| US5571639A (en) | 1994-05-24 | 1996-11-05 | Affymax Technologies N.V. | Computer-aided engineering system for design of sequence arrays and lithographic masks |
| US5578832A (en) | 1994-09-02 | 1996-11-26 | Affymetrix, Inc. | Method and apparatus for imaging a sample on a device |
| US5599695A (en) | 1995-02-27 | 1997-02-04 | Affymetrix, Inc. | Printing molecular library arrays using deprotection agents solely in the vapor phase |
| US5624711A (en) | 1995-04-27 | 1997-04-29 | Affymax Technologies, N.V. | Derivatization of solid supports and methods for oligomer synthesis |
| US5631734A (en) | 1994-02-10 | 1997-05-20 | Affymetrix, Inc. | Method and apparatus for detection of fluorescently labeled materials |
| US5677195A (en) | 1991-11-22 | 1997-10-14 | Affymax Technologies N.V. | Combinatorial strategies for polymer synthesis |
| US5708153A (en) | 1991-09-18 | 1998-01-13 | Affymax Technologies N.V. | Method of synthesizing diverse collections of tagged compounds |
| US5744305A (en) | 1989-06-07 | 1998-04-28 | Affymetrix, Inc. | Arrays of materials attached to a substrate |
| US5795716A (en) | 1994-10-21 | 1998-08-18 | Chee; Mark S. | Computer-aided visualization and analysis system for sequence evaluation |
| US5800992A (en) | 1989-06-07 | 1998-09-01 | Fodor; Stephen P.A. | Method of detecting nucleic acids |
| US5837832A (en) | 1993-06-25 | 1998-11-17 | Affymetrix, Inc. | Arrays of nucleic acid probes on biological chips |
| US5856174A (en) | 1995-06-29 | 1999-01-05 | Affymetrix, Inc. | Integrated nucleic acid diagnostic device |
| US5858659A (en) | 1995-11-29 | 1999-01-12 | Affymetrix, Inc. | Polymorphism detection |
| US5936324A (en) | 1998-03-30 | 1999-08-10 | Genetic Microsystems Inc. | Moving magnet scanner |
| US5968740A (en) | 1995-07-24 | 1999-10-19 | Affymetrix, Inc. | Method of Identifying a Base in a Nucleic Acid |
| US5981185A (en) | 1994-05-05 | 1999-11-09 | Beckman Coulter, Inc. | Oligonucleotide repeat arrays |
| US5981956A (en) | 1996-05-16 | 1999-11-09 | Affymetrix, Inc. | Systems and methods for detection of labeled materials |
| US6033860A (en) | 1997-10-31 | 2000-03-07 | Affymetrix, Inc. | Expression profiles in adult and fetal organs |
| US6090555A (en) | 1997-12-11 | 2000-07-18 | Affymetrix, Inc. | Scanned image alignment systems and methods |
| US6410229B1 (en) | 1995-09-15 | 2002-06-25 | Affymetrix, Inc. | Expression monitoring by hybridization to high density nucleic acid arrays |
| US20030104411A1 (en) | 1990-12-06 | 2003-06-05 | Affymetrix, Inc. | Arrays for detecting nucleic acids |
Family Cites Families (2)
| Publication number | Priority date | Publication date | Assignee | Title |
|---|---|---|---|---|
| AU2001292802A1 (en) * | 2000-09-19 | 2002-04-02 | Dana-Farber Cancer Institute Inc. | Genetic markers for tumors |
| WO2003021229A2 (fr) * | 2001-09-05 | 2003-03-13 | The Brigham And Women's Hospital, Inc. | Tests diagnostiques et pronostiques |
-
2004
- 2004-09-03 EP EP04783330A patent/EP1664762A4/fr not_active Withdrawn
- 2004-09-03 AU AU2004271192A patent/AU2004271192B2/en active Active
- 2004-09-03 US US10/934,930 patent/US7711492B2/en active Active
- 2004-09-03 CA CA002537254A patent/CA2537254A1/fr not_active Abandoned
- 2004-09-03 WO PCT/US2004/029041 patent/WO2005024043A2/fr active Search and Examination
- 2004-09-03 EP EP09170243A patent/EP2157524A3/fr not_active Withdrawn
Patent Citations (42)
| Publication number | Priority date | Publication date | Assignee | Title |
|---|---|---|---|---|
| US5744305A (en) | 1989-06-07 | 1998-04-28 | Affymetrix, Inc. | Arrays of materials attached to a substrate |
| US5800992A (en) | 1989-06-07 | 1998-09-01 | Fodor; Stephen P.A. | Method of detecting nucleic acids |
| US5424186A (en) | 1989-06-07 | 1995-06-13 | Affymax Technologies N.V. | Very large scale immobilized polymer synthesis |
| US5445934A (en) | 1989-06-07 | 1995-08-29 | Affymax Technologies N.V. | Array of oligonucleotides on a solid substrate |
| US5527681A (en) | 1989-06-07 | 1996-06-18 | Affymax Technologies N.V. | Immobilized molecular synthesis of systematically substituted compounds |
| US5143854A (en) | 1989-06-07 | 1992-09-01 | Affymax Technologies N.V. | Large scale photolithographic solid phase synthesis of polypeptides and receptor binding screening thereof |
| US5482867A (en) | 1989-11-13 | 1996-01-09 | Affymax Technologies N.V. | Spatially-addressable immobilization of anti-ligands on surfaces |
| US5252743A (en) | 1989-11-13 | 1993-10-12 | Affymax Technologies N.V. | Spatially-addressable immobilization of anti-ligands on surfaces |
| US5451683A (en) | 1989-11-13 | 1995-09-19 | Affymax Technologies N.V. | Spatially-addressable immobilization of anti-ligands on surfaces |
| US20030104411A1 (en) | 1990-12-06 | 2003-06-05 | Affymetrix, Inc. | Arrays for detecting nucleic acids |
| US5708153A (en) | 1991-09-18 | 1998-01-13 | Affymax Technologies N.V. | Method of synthesizing diverse collections of tagged compounds |
| US5789162A (en) | 1991-09-18 | 1998-08-04 | Affymax Technologies N.V. | Methods of synthesizing diverse collections of oligomers |
| US5770358A (en) | 1991-09-18 | 1998-06-23 | Affymax Technologies N.V. | Tagged synthetic oligomer libraries |
| US5550215A (en) | 1991-11-22 | 1996-08-27 | Holmes; Christopher P. | Polymer reversal on solid surfaces |
| US5384261A (en) | 1991-11-22 | 1995-01-24 | Affymax Technologies N.V. | Very large scale immobilized polymer synthesis using mechanically directed flow paths |
| US5324633A (en) | 1991-11-22 | 1994-06-28 | Affymax Technologies N.V. | Method and apparatus for measuring binding affinity |
| US6040193A (en) | 1991-11-22 | 2000-03-21 | Affymetrix, Inc. | Combinatorial strategies for polymer synthesis |
| US5677195A (en) | 1991-11-22 | 1997-10-14 | Affymax Technologies N.V. | Combinatorial strategies for polymer synthesis |
| US5242974A (en) | 1991-11-22 | 1993-09-07 | Affymax Technologies N.V. | Polymer reversal on solid surfaces |
| US5491074A (en) | 1993-04-01 | 1996-02-13 | Affymax Technologies Nv | Association peptides |
| US5837832A (en) | 1993-06-25 | 1998-11-17 | Affymetrix, Inc. | Arrays of nucleic acid probes on biological chips |
| US5631734A (en) | 1994-02-10 | 1997-05-20 | Affymetrix, Inc. | Method and apparatus for detection of fluorescently labeled materials |
| US5981185A (en) | 1994-05-05 | 1999-11-09 | Beckman Coulter, Inc. | Oligonucleotide repeat arrays |
| US5856101A (en) | 1994-05-24 | 1999-01-05 | Affymetrix, Inc. | Computer-aided engineering system for design of sequence arrays and lithographic masks |
| US5571639A (en) | 1994-05-24 | 1996-11-05 | Affymax Technologies N.V. | Computer-aided engineering system for design of sequence arrays and lithographic masks |
| US5593839A (en) | 1994-05-24 | 1997-01-14 | Affymetrix, Inc. | Computer-aided engineering system for design of sequence arrays and lithographic masks |
| US6025601A (en) | 1994-09-02 | 2000-02-15 | Affymetrix, Inc. | Method and apparatus for imaging a sample on a device |
| US5578832A (en) | 1994-09-02 | 1996-11-26 | Affymetrix, Inc. | Method and apparatus for imaging a sample on a device |
| US5795716A (en) | 1994-10-21 | 1998-08-18 | Chee; Mark S. | Computer-aided visualization and analysis system for sequence evaluation |
| US5974164A (en) | 1994-10-21 | 1999-10-26 | Affymetrix, Inc. | Computer-aided visualization and analysis system for sequence evaluation |
| US5599695A (en) | 1995-02-27 | 1997-02-04 | Affymetrix, Inc. | Printing molecular library arrays using deprotection agents solely in the vapor phase |
| US5831070A (en) | 1995-02-27 | 1998-11-03 | Affymetrix, Inc. | Printing oligonucleotide arrays using deprotection agents solely in the vapor phase |
| US5624711A (en) | 1995-04-27 | 1997-04-29 | Affymax Technologies, N.V. | Derivatization of solid supports and methods for oligomer synthesis |
| US5856174A (en) | 1995-06-29 | 1999-01-05 | Affymetrix, Inc. | Integrated nucleic acid diagnostic device |
| US5922591A (en) | 1995-06-29 | 1999-07-13 | Affymetrix, Inc. | Integrated nucleic acid diagnostic device |
| US5968740A (en) | 1995-07-24 | 1999-10-19 | Affymetrix, Inc. | Method of Identifying a Base in a Nucleic Acid |
| US6410229B1 (en) | 1995-09-15 | 2002-06-25 | Affymetrix, Inc. | Expression monitoring by hybridization to high density nucleic acid arrays |
| US5858659A (en) | 1995-11-29 | 1999-01-12 | Affymetrix, Inc. | Polymorphism detection |
| US5981956A (en) | 1996-05-16 | 1999-11-09 | Affymetrix, Inc. | Systems and methods for detection of labeled materials |
| US6033860A (en) | 1997-10-31 | 2000-03-07 | Affymetrix, Inc. | Expression profiles in adult and fetal organs |
| US6090555A (en) | 1997-12-11 | 2000-07-18 | Affymetrix, Inc. | Scanned image alignment systems and methods |
| US5936324A (en) | 1998-03-30 | 1999-08-10 | Genetic Microsystems Inc. | Moving magnet scanner |
Non-Patent Citations (52)
Cited By (1)
| Publication number | Priority date | Publication date | Assignee | Title |
|---|---|---|---|---|
| WO2021064230A1 (fr) * | 2019-10-02 | 2021-04-08 | Ophiomics - Investigação E Desenvolvimento Em Biotecnologia, Sa | Marqueurs de pronostic clinique et moléculaire pour une transplantation hépatique |
Also Published As
| Publication number | Publication date |
|---|---|
| US20050164231A1 (en) | 2005-07-28 |
| EP1664762A4 (fr) | 2008-08-13 |
| WO2005024043A2 (fr) | 2005-03-17 |
| AU2004271192A1 (en) | 2005-03-17 |
| AU2004271192B2 (en) | 2011-11-17 |
| EP1664762A2 (fr) | 2006-06-07 |
| EP2157524A3 (fr) | 2010-12-08 |
| CA2537254A1 (fr) | 2005-03-17 |
| US7711492B2 (en) | 2010-05-04 |
| WO2005024043A3 (fr) | 2005-12-01 |
Similar Documents
| Publication | Publication Date | Title |
|---|---|---|
| AU2004271192B2 (en) | Methods for identifying, diagnosing, and predicting survival of lymphomas | |
| US10697975B2 (en) | Methods for identifying, diagnosing, and predicting survival of lymphomas | |
| US10370715B2 (en) | Methods for identifying, diagnosing, and predicting survival of lymphomas | |
| US20220325348A1 (en) | Biomarker signature method, and apparatus and kits therefor | |
| EP1723257B1 (fr) | Classification, diagnostic, et pronostic de leucemie myeloide par profilage de l'expression genique | |
| US7640114B2 (en) | Method of diagnosis of cancer based on gene expression profiles in cells | |
| Dunphy | Gene expression profiling data in lymphoma and leukemia: review of the literature and extrapolation of pertinent clinical applications | |
| AU2012200939B2 (en) | Methods for identifying, diagnosing, and predicting survival of lymphomas | |
| EP1683862B1 (fr) | Microreseau d'evaluation de pronostic neuroblastome et procede d'evaluation de pronostic de neuroblastome | |
| AU2014200767A1 (en) | Methods for identifying, diagnosing, and predicting survival of lymphomas | |
| US20220399116A1 (en) | Systems and methods for assessing a bacterial or viral status of a sample | |
| Kennedy et al. | Single Nucleotide Polymorphism (SNP) and Antibody-based Cell Sorting (SNACS): A tool for demultiplexing single-cell DNA sequencing data | |
| AU2007277142B2 (en) | Methods for identifying, diagnosing, and predicting survival of lymphomas | |
| Robinson | Detecting changes in alternative mRNA processing from microarray expression data | |
| Boerma | Molecular definition of Burkitt Lymphoma | |
| Class et al. | Patent application title: Classification, Diagnosis and Prognosis of Acute Myeloid Leukemia by Gene Expression Profiling Inventors: Michael John Moorhouse (Rotterdam, NL) Petrus Jaobus Maria Valk (Rotterdam, NL) Hendrik Rudolf Delwell (Westmaas, NL) Bob Lowenberg (Rotterdam, NL) Petrus Johannes Van Der Spek (Lille, BE) Assignees: Erasmus Universiteit Rotterdam |
Legal Events
| Date | Code | Title | Description |
|---|---|---|---|
| PUAI | Public reference made under article 153(3) epc to a published international application that has entered the european phase |
Free format text: ORIGINAL CODE: 0009012 |
|
| 17P | Request for examination filed |
Effective date: 20090914 |
|
| AC | Divisional application: reference to earlier application |
Ref document number: 1664762 Country of ref document: EP Kind code of ref document: P |
|
| AK | Designated contracting states |
Kind code of ref document: A2 Designated state(s): AT BE BG CH CY CZ DE DK EE ES FI FR GB GR HU IE IT LI LU MC NL PL PT RO SE SI SK TR |
|
| AX | Request for extension of the european patent |
Extension state: AL HR LT LV MK |
|
| RIC1 | Information provided on ipc code assigned before grant |
Ipc: C12Q 1/68 20060101ALN20100618BHEP Ipc: G06F 19/00 20060101AFI20091218BHEP |
|
| PUAL | Search report despatched |
Free format text: ORIGINAL CODE: 0009013 |
|
| AK | Designated contracting states |
Kind code of ref document: A3 Designated state(s): AT BE BG CH CY CZ DE DK EE ES FI FR GB GR HU IE IT LI LU MC NL PL PT RO SE SI SK TR |
|
| AX | Request for extension of the european patent |
Extension state: AL HR LT LV MK |
|
| 17Q | First examination report despatched |
Effective date: 20110819 |
|
| STAA | Information on the status of an ep patent application or granted ep patent |
Free format text: STATUS: THE APPLICATION IS DEEMED TO BE WITHDRAWN |
|
| 18D | Application deemed to be withdrawn |
Effective date: 20120301 |