EP1849301B1 - Umsetzung von videodaten aus einem verschachtelten in ein nichtverschachteltes format - Google Patents
Umsetzung von videodaten aus einem verschachtelten in ein nichtverschachteltes format Download PDFInfo
- Publication number
- EP1849301B1 EP1849301B1 EP06704581.5A EP06704581A EP1849301B1 EP 1849301 B1 EP1849301 B1 EP 1849301B1 EP 06704581 A EP06704581 A EP 06704581A EP 1849301 B1 EP1849301 B1 EP 1849301B1
- Authority
- EP
- European Patent Office
- Prior art keywords
- data
- correlation
- confidence measure
- pixel
- curve
- Prior art date
- Legal status (The legal status is an assumption and is not a legal conclusion. Google has not performed a legal analysis and makes no representation as to the accuracy of the status listed.)
- Active
Links
Images


Classifications
-
- H—ELECTRICITY
- H04—ELECTRIC COMMUNICATION TECHNIQUE
- H04N—PICTORIAL COMMUNICATION, e.g. TELEVISION
- H04N7/00—Television systems
- H04N7/01—Conversion of standards, e.g. involving analogue television standards or digital television standards processed at pixel level
- H04N7/0117—Conversion of standards, e.g. involving analogue television standards or digital television standards processed at pixel level involving conversion of the spatial resolution of the incoming video signal
- H04N7/012—Conversion between an interlaced and a progressive signal
-
- H—ELECTRICITY
- H04—ELECTRIC COMMUNICATION TECHNIQUE
- H04N—PICTORIAL COMMUNICATION, e.g. TELEVISION
- H04N5/00—Details of television systems
- H04N5/44—Receiver circuitry for the reception of television signals according to analogue transmission standards
-
- H—ELECTRICITY
- H04—ELECTRIC COMMUNICATION TECHNIQUE
- H04N—PICTORIAL COMMUNICATION, e.g. TELEVISION
- H04N7/00—Television systems
- H04N7/01—Conversion of standards, e.g. involving analogue television standards or digital television standards processed at pixel level
Definitions
- This invention relates to a method and apparatus for converting an interlaced video signal to the deinterlaced or progressive scan video signal, and in particular to a method and apparatus which provides appropriate control to the effectiveness of the conversion.
- Broadcast television signals are usually provided in interlaced form.
- the phase alternate line (PAL) system used in Europe is made up of video frames comprising two interlaced fields. Each field comprises alternate lines of the frame.
- the frame rate the rate at which frames comprising two interlaced fields are applied to a display is usually 50 Hz.
- BR border reconstructers
- BR One of the fundamental ideas behind a BR is the estimation of the correlation between two sets of pixels belonging to two vertically adjacent lines in a field at an instant of time.
- Figure 1 shows three representations of short sections of two adjacent lines in a video field.
- figure 1 three different possible interpolations schemes are shown and correlations are evaluated for these.
- the middle scheme comprises correlation of the data in the pixels above and below the pixel to be reconstructed and correlation of data between pairs of pixels positioned immediately adjacent to this.
- a further possible interpolation is evaluated in the left-hand example of figure 1 by looking at the correlation between pixels on lines which pass diagonally sloping down to the right through the pixel being reconstructed. The same process with the opposite diagonals is shown in the right-hand example of figure 1 .
- the correlation between the data in the various pairs of pixels can be derived using the sum of absolute differences (SAD) or the mean square error, or other well-known statistical techniques.
- SAD sum of absolute differences
- mean square error mean square error
- Ytop and Ybot represent the luminance of the pixels in the lines above and below the pixel to be reconstructed in a field, and n is the number of pixels in each row. The luminance of a pair of pixels is involved in each single difference.
- the graph on the right-hand side of figure 1 shows an example of SAD based procedure using five pixels only for each row and three correlations of symmetrically located sets of pixels, each set made up of the three pixel pairs.
- more pixels are involved in the computation to ensure greater accuracy.
- figure 1 leads to 3 SAD values.
- SAD 0, SAD 1 and SAD 2 which are shown graphically at the right-hand side of figure 1 .
- This can be considered the correlation curve for the various possible interpolations.
- the interpolation scheme which gives the smallest difference in SAD or the smallest means square error (MSE) does not always produce the best quality final image. This is because the content of the image in the neighbourhood of the pixel being reconstructed can affect the SAD or MSE. For example, if there are a few thin lines passing close to the pixel to be reconstructed there is a risk that in reconstruction, the lines result in pixelation or flickering in the final image.
- EP-A2-0 785 683 discloses a method for converting an interlaced video signal to a progressive video signal according to the preamble of claim 1.
- the local minima for various portions of the correlation data are detected and the selection of an adjustment curve to combine with the correlation curve to generate the most likely interpolation scheme to produce good results is made in dependence on the relative positions of minima in the correlation data.
- the correlation data is divided into segments and local minima detected in each segment.
- a method for converting an interlaced video signal to a progressive scan video signal comprising the steps of:
- unit 1 performs the derivation of correlation data for the correlation curve shown in figure 1 .
- 3 points are used.
- the number of points used will be proportional to the number of pixels used.
- an analysis of the information contained in the correlation curve is performed to produce a confidence evaluation for the curve in the form of confidence data. This comprises a measure as to the clarity of the information contained in the correlation data. Examples of the type of correlation curve which can be generated with the correlation data are shown in figure 3 .
- the two left-hand side curves have clear maxima and a single minimum each.
- the minimum value created by the SAD of figure 1 from the various sets of pairs of pixels is the correct minimum to use and therefore the correct set of pairs of pixels to use for the interpolation of the pixel of a missing line.
- the third curve of figure 3 has three minima and 3 maxima. Therefore the data for this graph gives no indication as to which of the minima detected is the most relevant.
- the fourth example in figure 3 gives a curve with 2 distinct minima. Either of these could be the correct one to use in determining the interpolation scheme to use. However, they are physically separated by a number of pixels and therefore it is unclear which of them should be used.
- the correlation data is generated in a logical sequence, for example in figure 1 starting with the left-hand interpolation scheme and moving to the right.
- a logical sequence is required so that there is an incremental change in the relative positions of the pixels being used by the interpolation scheme.
- the first SAD point plotted is that generated by the pixels selected in the left-hand side scheme of figure 1 i.e. the diagonal line joining the pixels slope downwards to the right through the pixel to be reconstructed.
- the lines joining the pairs of pixels are vertical and for point 2 the lines joining the pairs of pixels slope upwards to the right.
- a similar type of approach is taken whatever number of pixels or whatever interpolation scheme is used.
- the SAD measurements from figure 1 are received in turn from correlation analysis in unit 1.
- the data as it is received is compared with previous data to determine where local minima occur.
- the confidence evaluation unit 2 determines a confidence measure representing whether the correlation data is likely to produce the correct result for the interpolation scheme to be used and then uses this to select an adjustment data which is combined with the data for each point on the correlation curve.
- the confidence measure is supplied to adjustment curve unit 3 which selects the adjustment data to use in dependence on the output of the confidence evaluation unit 2 and supplies the data for this curve to a combination unit 4 which combines it with a correlation data from the correlation curve unit 1.
- the resultant data is then sent to a resultant data analysis unit 5 which can select the appropriate minimum from the resultant data and from this determine which interpolation system (see figure 1 ) should be used in interpolating the missing pixel.
- b is a parameter which is adjusted in dependence on the confidence evaluation derived from the confidence evaluation unit 2 i.e. the confidence measure
- a is either a constant in the preferred embodiment or can be related to the confidence measure as well.
- x relates to the position of the interpolation scheme to which the confidence evaluation relates in the logical sequence of interpolation schemes.
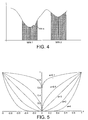
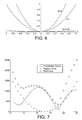
- Figure 5 shows various different curves for different values of a with a value of b equal to 1. Although all of these could deliver good performance in specific cases, we have appreciated that the best overall curve in dealing with many situations is produced by a curve with a fixed value of a equals to 2. Because this exponential value is relatively low, the continuity of the first derivative b is more significant. Examples of this curve for various values of b are shown in figure 6 . Thus it can be seen that as b increases, the steepness of the curve increases.
- the zero value of the curve is in the centre of the graph of figure 6 and figure 5 . This corresponds to the centre position of the logical incremental interpolation schemes. In figure 1 this would be a central interpolation scheme with the pairs of pixels being positioned vertically with respect to the pixel to be reconstructed.
- the curve selected in dependence on the confidence measure b is then passed to the resultant curve generation unit for which combines the data from the curve with the data from the correlation curve unit 1 to produce data for a resultant curve.
- This is fed to a resultant curve analysis unit 5 which looks for any minima in the resultant curve.
- An example of a resultant curve and the components of which it is formed is shown in figure 7 .
- a correlation curve with 2 minima which are physically separate after combination with an adjustment curve selected in accordance with a confidence measure derived from the correlation curve produces a resultant curve with one minimum much lower than the other.
- the position of this minimum is used to select the interpolation scheme to be used to generate the pixel. This process is performed in turn for each pixel to be interpolated on each line of each field of an input video sequence.
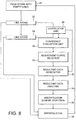
- FIG 8 A more detailed block diagram of an example of a system embodying the invention is shown in figure 8 .
- This comprises a field store 20 to which a field of a new video signal being converted from an interlaced video signal to a progressive scan video signal is stored. From this, each line of the field is read out in turn to line stores 22 and 24. Preferably, a first line is read to line store 22 and then passed to line store 24. At the same time, the next line which will be used with the first line for generating the missing lines of the field in the field store is read to line store 22. The system then analyses the lines to select the best interpolation schemes are used for each pixel in turn before passing the line stored in line store 22 to line store 24 and reading the next line of the field from the field store 20 to the line store 22.
- a correlation unit 26 produces, for each pixel in turn to be generated for the line position between the two lines in the line stores 22 and 24, a series of correlations in logical order for the different possible interpolation schemes to be used in generating that pixel. At the ends of the lines, not all the possible interpolations will be available.
- the correlation unit 26 calculates for example a sum of absolute differences or a least means squared analysis of the correlation between different pairs of pixels to be used in each of the interpolation schemes. The sums of absolute differences are provided in turn for each pixel to a confidence evaluation unit 28. When all the values from the correlation unit 26 have been added to the confidence evaluation unit 28 a confidence value is generated. This is related to the positions and numbers of local minima for the correlation values produced by the correlation unit 26.
- This confidence value is then provided to an adjustment curve selector 30 which uses it to modify a predetermined adjustment curve.
- the confidence value is used as a multiplier on the adjustment curve. More complex schemes can be used. Alternatively, the confidence value can be used to select between a plurality of predefined adjustment curves.
- the data representing the adjustment curve is then provided from the adjustment curve selector 30 to a resultant data generation unit 32.
- the data from the adjustment curve is combined with the data from the correlation unit 26.
- the resultant data generation unit 32 should by combining correlation data with the adjustment curve data produce a set of adjusted correlation data which has a clear minimum value. This clear minimum value is then detected in a resultant data analysis unit 34. This provides data about the correlation value for a pixel which gives the minimum adjusted value.
- an interpolation scheme selector 36 selects an interpolation scheme to be used to generate the pixel in question.
- the data for that interpolation is then provided either from the line stores 22 and 24 or from the field store 20 to an interpolator 38 which generates the value for the missing pixel.
- the system then proceeds to the next of the missing pixels to be generated until all missing pixels between the lines in the 2 line stores have been generated.
- the system then moves the pixel data from line store 22 to line store 24 and reads in the next available line from the field store 20. This continues until the missing lines for the whole field have been generated and the data is available for display.
- the process takes place in real time so that it can be performed on a video signal being received by a television receiver which converts the signal to a non-interlaced form ready for display.
- two or more sets of the hardware of figure 8 could be provided operating in parallel in different lines of the field store 20 to improve processing speed.
- system of the figure 8 can be implemented in a dedicated processor. Two or more of these can be provided in parallel to improve the speed of processing.
- One possibility is to have a processor available for each of the missing lines of the field stored in the field store 20 to minimise processing time. This of course would make the unit more expensive.
- the resultant data analysis unit 34 may generate data which remains unclear. In such a situation, some form of exception processing is provided. This could involve using a different adjustment curve to improve the quality of the resultant data output. Other schemes are possible.
- One further area where significant improvement in the reliability of the correct pixels being interpolated in missing lines is the confidence with which analysed correlation data can produce to a significant result.
- This confidence is used in the example given above to generate a confidence measure which can be used to select adjustment data to combine with the correlation data to produce a set of resultant data from which the correlation scheme most likely to produce the correct result for the pixel to be interpolated is selected. Confidence measures can be used in other methods of selecting interpolation schemes.
- the first step is to extract the topology of points from the correlation data. This is shown with regard to the graphs of figure 9 .
- the top example in figure 9 shows a reasonably smooth correlation curve with a maximum close to one end and a minimum approximately two-thirds of the way along the line. The significant points of this curve are selected in the central graph to give the resultant set of the data points on the right-hand side.
- a more complex graph is shown from the central line of figure 9 . This has two distinct minima at slightly different levels with a local maximum between them. A set of data points derived from this is shown on the right-hand side.
- the bottom example is the most straightforward and starts from a maximum on the left-hand side decreasing reasonably smoothly to a minimum on the right-hand side. This can be shown with only two data points.
- FIG. 10 An important additional step is shown in relation to figure 10 .
- This comprises what we refer to as cleaning the data. This is necessary to prevent the subsequent procedure from analysing extremes which are not significant when reconstructing the general shape or topology of the correlation data. It eliminates those maxima and minima which are too close to each other.
- the curve representing the correlation data has a local maximum close to the minimum value of the curve. Analysis of this by a cleaning procedure removes the local maximum leaving the two local minima and the local maximum represented by a single point in the topology.
- a relative extreme is found (maximum or minimum). Then, at 42 a determination is made as to whether or not the extreme is the first point of correlation data or the last point, corresponding to the first and last interpolation schemes which could be used. If it is not, the procedure goes to step 44. If it is, then the procedure skips directly to the end and the position in the correlation curve and whether or not it is a maximum or minimum are stored in a data array. If the extreme is at some other point on the curve, then at 44, if the extreme found is a minimum and the previous extreme is a maximum, or if the extreme just found is a maximum and the previous is a minimum then the procedure passes to 46. This determines whether or not the extreme was on the left border of the correlation curve.
- the procedure passes to 50. If determination is made as to whether or not the present extreme is on the right-hand border, i.e. is the last extreme in the correlation curve. If it is, then the present extreme is discarded at 52. Otherwise nothing changes as at 54. If the result from 44 was that the extreme found was a minimum and the previous had not been a maximum or if the extreme found had been a maximum and the previous extreme had not been a minimum then the procedure passes to 56.
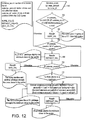
- the data is passed to a processor which performs the procedure set forth in figure 12 .
- the purpose of this is to examine the values of the data within the topology array and in response to this to return a value which gives an indication of the confidence of the correlation data being able to be used to select the correct interpolation scheme for reconstruction of a pixel in a missing line.
- This confidence measure is generated for each pixel in turn in a missing line, and for each missing line.
- the example of figure 12 uses three data values in determining the confidence measure to use. These are extreme count which is an integer value of the number of extremes but its maxima and minima found in the cleansed correlation data, extreme amount which is the magnitude of each maximum and minimum in the correlation data, and extreme ID which is a value representing the position of each maximum and minimum in the data. These values are selected from a cleansed correlation data array at 60.
- the procedure passes to 70 which determines whether or not the extreme count is 5. If it is, then if the first extreme is determined to be a maximum at 72 then the equation shown at 74 is performed on the correlation data corresponding to the maxima and minima to derive a confidence value. If the extreme count at 70 is determined not to be 5, then it is greater than 5, a result is set to be a value called Max-Val. This indicates that there are too many maxima and minima in the correlation data and that the minima closer to the centre, i.e. the position of the pixel to be reconstructed should be emphasised.
- the result is set to be Default - Val as was done at 68 indicating that some emphasis should be given to the new one closer to the centre point but not so much as with max under par val.
- the procedures shown in figure 12 can be extended to look for cleansed correlation data with more maxima and minima and therefore have more values of the confidence measure to be provided.
- the procedure can be modified to take account of the relative size of the relative maxima or minima and their proximity in determining which one is most likely to be useful in indicating the correct interpolation scheme to use.
Claims (8)
- Verfahren für die Konvertierung eines Videosignals mit Zeilensprung in ein Videosignal ohne Zeilensprung, folgende Schritte umfassend:für jedes Pixel in jeder fehlenden Zeile eines Videofelds in einem zu konvertierenden Videosignal, das Bereitstellen von Korrelationsdaten für jede aus einem Satz möglicher Interpolationen zwischen benachbarten Pixel, die bei der Rekonstruktion des fehlenden Pixels verwendet werden sollen;Ableiten eines Konfidenzmaßes aus den Korrelationsdaten;Bestimmen des Interpolationsschemas, das am wahrscheinlichsten ein genaues fehlendes Pixel produziert, aus dem Konfidenzmaß; undInterpolieren des fehlenden Pixels mithilfe des ausgewählten Interpolationsschemas, dadurch gekennzeichnet, dass der Schritt der Ableitung eines Konfidenzmaßes die Bestimmung der Anzahl der Maximal- und Minimalwerte in den Korrelationsdaten und die Ableitung des Konfidenzmaßes in Abhängigkeit von der Anzahl der so bestimmten Maximal- und Minimalwerte umfasst.
- Verfahren nach Anspruch 1, in dem der Schritt der Bestimmung des Konfidenzmaßes den Schritt der Bestimmung der relativen Positionen der Pixel beinhaltet, aus denen die jeweilige Korrelation erstellt wurde, und deren Verwendung bei der Ableitung des Konfidenzmaßes.
- Verfahren nach Anspruch 1 oder 2, das den Schritt der Auswahl von Anpassungsdaten für die Korrelationsdaten aus dem Konfidenzmaß und der Anpassung der Korrelationsdaten mit den Anpassungsdaten beinhaltet.
- Verfahren nach Anspruch 3, in dem der Schritt der Bestimmung des Interpolationsschemas in Abhängigkeit von den Anpassungsdaten erfolgt.
- Vorrichtung für die Konvertierung eines Videosignals mit Zeilensprung in ein Videosignal ohne Zeilensprung, umfassend:Mittel für jedes Pixel in jeder fehlenden Zeile eines Videofelds in einem zu konvertierenden Videosignal, das Korrelationsdaten für jede aus einem Satz möglicher Interpolationen zwischen benachbarten Pixel für die zu rekonstruierenden Pixel bereitstellt;Mittel für die Ableitung eines Konfidenzmaßes aus den Korrelationsdaten;Mittel für die Bestimmung des Interpolationsschemas, das am wahrscheinlichsten ein genaues fehlendes Pixel produziert, aus dem Konfidenzmaß; undMittel für die Interpolation eines fehlenden Pixels mithilfe des ausgewählten Interpolationsschemas;dadurch gekennzeichnet, dass die Mittel für die Ableitung eines Konfidenzmaßes Mittel für die Bestimmung der Anzahl von Maximal- und Minimalwerten in den Korrelationsdaten und Mittel für die Ableitung des Konfidenzmaßes in Abhängigkeit davon umfassen.
- Vorrichtung nach Anspruch 5, in dem die Mittel für die Ableitung eines Konfidenzmaßes auch Mittel für die Bestimmung der relativen Positionen der Pixel beinhalten, aus denen die jeweilige Korrelation erstellt wurde, und Mittel für die Ableitung des Konfidenzmaßes daraus.
- Vorrichtung nach Anspruch 5 oder 6, welche die Mittel für die Auswahl von Anpassungsdaten für die Korrelationsdaten aus dem Konfidenzmaß und Mittel für die Anpassung der Korrelationsdaten mit den Anpassungsdaten beinhaltet.
- Vorrichtung nach Anspruch 7, in der die Mittel für die Bestimmung des Interpolationsschemas dies in Abhängigkeit von den angepassten Korrelationsdaten tun.
Applications Claiming Priority (2)
| Application Number | Priority Date | Filing Date | Title |
|---|---|---|---|
| GB0502598A GB2422976B (en) | 2005-02-08 | 2005-02-08 | Conversion of video data from interlaced to non-interlaced format |
| PCT/GB2006/000432 WO2006085062A2 (en) | 2005-02-08 | 2006-02-08 | Conversion of video data from interlaced to non-interlaced format |
Publications (2)
| Publication Number | Publication Date |
|---|---|
| EP1849301A2 EP1849301A2 (de) | 2007-10-31 |
| EP1849301B1 true EP1849301B1 (de) | 2016-11-16 |
Family
ID=34355979
Family Applications (1)
| Application Number | Title | Priority Date | Filing Date |
|---|---|---|---|
| EP06704581.5A Active EP1849301B1 (de) | 2005-02-08 | 2006-02-08 | Umsetzung von videodaten aus einem verschachtelten in ein nichtverschachteltes format |
Country Status (5)
| Country | Link |
|---|---|
| US (1) | US7518655B2 (de) |
| EP (1) | EP1849301B1 (de) |
| JP (1) | JP5209323B2 (de) |
| GB (1) | GB2422976B (de) |
| WO (1) | WO2006085062A2 (de) |
Families Citing this family (5)
| Publication number | Priority date | Publication date | Assignee | Title |
|---|---|---|---|---|
| US7587376B2 (en) * | 2005-05-26 | 2009-09-08 | International Business Machines Corporation | Reformulation of constraint satisfaction problems for stochastic search |
| GB2443858A (en) * | 2006-11-14 | 2008-05-21 | Sony Uk Ltd | Alias avoiding image processing using directional pixel block correlation and predetermined pixel value criteria |
| CN101960843B (zh) * | 2008-03-21 | 2012-12-26 | 日本电气株式会社 | 图像处理方法、图像处理装置和图像处理程序 |
| US8355077B2 (en) * | 2008-03-27 | 2013-01-15 | Csr Technology Inc. | Adaptive windowing in motion detector for deinterlacer |
| GB2484071B (en) * | 2010-09-23 | 2013-06-12 | Imagination Tech Ltd | De-interlacing of video data |
Family Cites Families (11)
| Publication number | Priority date | Publication date | Assignee | Title |
|---|---|---|---|---|
| GB2277000B (en) * | 1993-04-08 | 1997-12-24 | Sony Uk Ltd | Motion compensated video signal processing |
| US5886745A (en) * | 1994-12-09 | 1999-03-23 | Matsushita Electric Industrial Co., Ltd. | Progressive scanning conversion apparatus |
| US5661525A (en) | 1995-03-27 | 1997-08-26 | Lucent Technologies Inc. | Method and apparatus for converting an interlaced video frame sequence into a progressively-scanned sequence |
| US5532751A (en) * | 1995-07-31 | 1996-07-02 | Lui; Sam | Edge-based interlaced to progressive video conversion system |
| MY117289A (en) * | 1996-01-17 | 2004-06-30 | Sharp Kk | Image data interpolating apparatus |
| JPH09200575A (ja) * | 1996-01-17 | 1997-07-31 | Sharp Corp | 画像データ補間装置 |
| US6133957A (en) * | 1997-10-14 | 2000-10-17 | Faroudja Laboratories, Inc. | Adaptive diagonal interpolation for image resolution enhancement |
| KR100393066B1 (ko) * | 2001-06-11 | 2003-07-31 | 삼성전자주식회사 | 적응 움직임 보상형 디-인터레이싱 장치 및 그 방법 |
| JP2004072528A (ja) * | 2002-08-07 | 2004-03-04 | Sharp Corp | 補間処理方法、補間処理プログラムおよびこれを記録した記録媒体ならびに画像処理装置およびこれを備えた画像形成装置 |
| GB2402288B (en) | 2003-05-01 | 2005-12-28 | Imagination Tech Ltd | De-Interlacing of video data |
| KR100580172B1 (ko) * | 2003-06-27 | 2006-05-16 | 삼성전자주식회사 | 디-인터레이싱 방법, 그 장치, 그 비디오 디코더 및 그재생 장치 |
-
2005
- 2005-02-08 GB GB0502598A patent/GB2422976B/en active Active
- 2005-05-09 US US11/125,412 patent/US7518655B2/en active Active
-
2006
- 2006-02-08 WO PCT/GB2006/000432 patent/WO2006085062A2/en active Application Filing
- 2006-02-08 EP EP06704581.5A patent/EP1849301B1/de active Active
- 2006-02-08 JP JP2007554631A patent/JP5209323B2/ja active Active
Also Published As
| Publication number | Publication date |
|---|---|
| GB0502598D0 (en) | 2005-03-16 |
| EP1849301A2 (de) | 2007-10-31 |
| WO2006085062A3 (en) | 2007-01-25 |
| US7518655B2 (en) | 2009-04-14 |
| WO2006085062A2 (en) | 2006-08-17 |
| US20060181647A1 (en) | 2006-08-17 |
| JP5209323B2 (ja) | 2013-06-12 |
| GB2422976B (en) | 2007-05-23 |
| JP2008530876A (ja) | 2008-08-07 |
| GB2422976A (en) | 2006-08-09 |
Similar Documents
| Publication | Publication Date | Title |
|---|---|---|
| JP4519396B2 (ja) | 適応動き補償型フレーム及び/又はフィールドレート変換装置及びその方法 | |
| US8340186B2 (en) | Method for interpolating a previous and subsequent image of an input image sequence | |
| JP4847040B2 (ja) | ビデオシーケンスでのティッカー処理 | |
| JP3850071B2 (ja) | 変換装置及び変換方法 | |
| KR100327395B1 (ko) | 움직임 보상을 기반으로 하는 격행주사 영상의 디인터레이싱 방법 | |
| JP3287864B2 (ja) | 映像信号のフィールド又はフレーム間の動きを表す運動ベクトルを導出する方法及びこれを使用する映像方式変換装置 | |
| US6563550B1 (en) | Detection of progressive frames in a video field sequence | |
| TWI410895B (zh) | 運動向量校正裝置及其方法 | |
| JP4932900B2 (ja) | ロバストな超解像度ビデオスケーリング方法及び装置 | |
| EP1736929A2 (de) | Detektion von Bewegungsausgleichsfehlern | |
| EP2564588B1 (de) | Verfahren und vorrichtung für bewegungskompensierte video interpolation | |
| EP1849301B1 (de) | Umsetzung von videodaten aus einem verschachtelten in ein nichtverschachteltes format | |
| EP1849300B1 (de) | Umsetzung von videodaten aus einem verschachtelten in ein nichtverschachteltes format | |
| JP2009207137A (ja) | ビデオ信号の処理方法、ビデオ信号の処理システムおよびコンピューター読み取り可能な記憶媒体 | |
| KR101050135B1 (ko) | 광류 정보를 이용한 중간 영상 생성 방법 | |
| EP2619977B1 (de) | Verfahren und vorrichtung zur zeilenentflechtung von videodaten | |
| US20060176394A1 (en) | De-interlacing of video data | |
| DE112004000063B4 (de) | Verfahren und Vorrichtung für ein adaptives Deinterlacing auf der Basis eines phasenkorrigierten Halbbildes und Aufzeichnungsmedium das Programme für das Ausführen des adaptiven Deinterlacingverfahrens speichert | |
| KR100351160B1 (ko) | 영상 움직임 보상 장치 및 방법 | |
| JP4366836B2 (ja) | 画像変換方法および画像変換装置 | |
| JP3862531B2 (ja) | 画像補間装置 | |
| JPH07327209A (ja) | 動きベクトル検出方法 |
Legal Events
| Date | Code | Title | Description |
|---|---|---|---|
| PUAI | Public reference made under article 153(3) epc to a published international application that has entered the european phase |
Free format text: ORIGINAL CODE: 0009012 |
|
| 17P | Request for examination filed |
Effective date: 20070905 |
|
| AK | Designated contracting states |
Kind code of ref document: A2 Designated state(s): DE FR |
|
| 17Q | First examination report despatched |
Effective date: 20071213 |
|
| DAX | Request for extension of the european patent (deleted) | ||
| RBV | Designated contracting states (corrected) |
Designated state(s): DE FR |
|
| GRAP | Despatch of communication of intention to grant a patent |
Free format text: ORIGINAL CODE: EPIDOSNIGR1 |
|
| INTG | Intention to grant announced |
Effective date: 20160614 |
|
| GRAS | Grant fee paid |
Free format text: ORIGINAL CODE: EPIDOSNIGR3 |
|
| GRAA | (expected) grant |
Free format text: ORIGINAL CODE: 0009210 |
|
| AK | Designated contracting states |
Kind code of ref document: B1 Designated state(s): DE FR |
|
| REG | Reference to a national code |
Ref country code: DE Ref legal event code: R096 Ref document number: 602006050921 Country of ref document: DE |
|
| REG | Reference to a national code |
Ref country code: FR Ref legal event code: PLFP Year of fee payment: 12 |
|
| REG | Reference to a national code |
Ref country code: DE Ref legal event code: R097 Ref document number: 602006050921 Country of ref document: DE |
|
| PLBE | No opposition filed within time limit |
Free format text: ORIGINAL CODE: 0009261 |
|
| STAA | Information on the status of an ep patent application or granted ep patent |
Free format text: STATUS: NO OPPOSITION FILED WITHIN TIME LIMIT |
|
| 26N | No opposition filed |
Effective date: 20170817 |
|
| REG | Reference to a national code |
Ref country code: FR Ref legal event code: PLFP Year of fee payment: 13 |
|
| PGFP | Annual fee paid to national office [announced via postgrant information from national office to epo] |
Ref country code: FR Payment date: 20230220 Year of fee payment: 18 |
|
| PGFP | Annual fee paid to national office [announced via postgrant information from national office to epo] |
Ref country code: DE Payment date: 20230216 Year of fee payment: 18 |
|
| P01 | Opt-out of the competence of the unified patent court (upc) registered |
Effective date: 20230516 |