EP1667044A2 - Verfahren und Vorrichtung zur Anzeige von Geninformation - Google Patents
Verfahren und Vorrichtung zur Anzeige von Geninformation Download PDFInfo
- Publication number
- EP1667044A2 EP1667044A2 EP05025675A EP05025675A EP1667044A2 EP 1667044 A2 EP1667044 A2 EP 1667044A2 EP 05025675 A EP05025675 A EP 05025675A EP 05025675 A EP05025675 A EP 05025675A EP 1667044 A2 EP1667044 A2 EP 1667044A2
- Authority
- EP
- European Patent Office
- Prior art keywords
- dna fragment
- unit
- results
- detection signal
- estimation
- Prior art date
- Legal status (The legal status is an assumption and is not a legal conclusion. Google has not performed a legal analysis and makes no representation as to the accuracy of the status listed.)
- Withdrawn
Links
Images





Classifications
-
- G—PHYSICS
- G16—INFORMATION AND COMMUNICATION TECHNOLOGY [ICT] SPECIALLY ADAPTED FOR SPECIFIC APPLICATION FIELDS
- G16B—BIOINFORMATICS, i.e. INFORMATION AND COMMUNICATION TECHNOLOGY [ICT] SPECIALLY ADAPTED FOR GENETIC OR PROTEIN-RELATED DATA PROCESSING IN COMPUTATIONAL MOLECULAR BIOLOGY
- G16B45/00—ICT specially adapted for bioinformatics-related data visualisation, e.g. displaying of maps or networks
Definitions
- the present invention relates to a method and apparatus for displaying gene information used for analysis for identifying genes involved in phenotypes, such as an individual's diseases or external features.
- the invention relates to a method and apparatus capable of displaying the results of analysis in which, when extracting and detecting a DNA fragment with a gene as the subject of analysis using PCR or electrophoresis, a signal from the subject of analysis and noise signals are clearly distinguished, and corrections are made so as to eliminate the influence of the noise signals on the desired signal.
- genotypes and genotype frequency which form the basis for a search for genes involved in phenotypes, such as the presence or absence of particular diseases, the extent of efficacy of medication, and the presence or absence of side effects.
- genomes of living organisms of the same species have substantially identical nucleotide sequences, with different nucleotides located at some sites. For example, at a certain genetic locus, some individuals may have A while other individuals may have T. Such presence of polymorphism in a single nucleotide of a genome among individuals is referred to as a SNP (Single Nucleotide Polymorphism).
- SNP Single Nucleotide Polymorphism
- the genome of individual A has a single nucleotide A between the nucleotide sequence "NNNNNNNN” and the nucleotide sequence "MMMMMMMMMMM,” while the genome of another individual B does not have such a nucleotide.
- NNNNNNNNN and MMMMMMMMMMM each represent arbitrary nucleotide sequences.
- the genome of individual B lacks the single nucleotide A from the viewpoint of individual A.
- the single nucleotide A is inserted in the genome of individual A.
- Such polymorphism based on a difference in terms of the presence or absence of a single nucleotide at a single genetic locus between individuals is referred to as "in/del” (short for insertion/deletion) of a single nucleotide.
- microsatellite The genomes of living organisms have many (tens of thousands or more) sites at which a short nucleotide sequence pattern that is two to six nucleotides long appears repeatedly several to a dozen times. Such a characteristic nucleotide sequence pattern is referred to as a microsatellite.
- An example of microsatellite that appears in a genome is shown in Fig. 13.
- a single repetition of a microsatellite is referred to as a unit, and the number of nucleotides in a unit is referred to as the unit length.
- the unit is "AT,” and the unit length is two nucleotides.
- the number of repetitions in a microsatellite may differ from one individual to another even if the individuals share the same unit and the unit length.
- a microsatellite regarding which the number of repetitions is known to vary among individuals is referred to as "a microsatellite with polymorphism”
- a microsatellite regarding which the number of repetitions is known to be the same in all individuals will be referred to as "a microsatellite without polymorphism.”
- a microsatellite regarding which it is not known whether the number of repetitions differs or not among individuals will be referred to as "a microsatellite regarding which the presence or absence of polymorphism is unknown.”
- SNPs, single nucleotide in/del, and microsatellites which can vary among individuals, are portions that can be easily distinguished from other nucleotide sequences in a genome, and they can also be easily detected experimentally.
- the approximate positions of SNPs, single-nucleotide in/del, and microsatellites in the genome are known, and therefore they can be used as indices of genomic positions. Because of these characteristics, SNPs, single-nucleotide in/del's, and microsatellites with polymorphisms are referred to as DNA markers.
- microsatellites with polymorphisms which include a plurality of nucleotides, contain much more amount of information than SNPs or single-nucleotide in/del's, and therefore they are used frequently as DNA markers.
- microsatellites with polymorphism have an added advantage that a plurality of samples can be subjected to experimentation simultaneously in a pooled typing experiment, as will be described later.
- Figs. 12 and 13 individuals of many different species have a pair of genomes (homologous chromosomes) that are derived from a female gamete and a male gamete. Genes that exist at corresponding sites on a set of genomes are referred to as alleles, and their combinations are referred to as genotypes.
- SNPs, single-nucleotide in/del's, and microsatellites with polymorphisms constitute portions that can contain different nucleotide sequences among individuals. Therefore, generally two to three alleles exist for an SNP, two alleles exist for a single-nucleotide in/del, and several to 20 or more kinds of alleles exist for a microsatellite with polymorphism.
- individual A has a microsatellite consisting of five repetitions of the "AT" unit, and a microsatellite consisting of seven repetitions of such unit.
- Individual B has two microsatellites each consisting of six "AT” units.
- heterozygous the condition where the individual has two alleles of different kinds, as in the case of individual A, is denoted by the term "heterozygous”
- homozygous the condition where the individual has two alleles of the same kind, as in individual B, is denoted by the term "homozygous."
- PCR Polymerase Chain Reaction
- electrophoresis is carried out to extract and detect the sites in the genome where microsatellites appear.
- PCR is an experimental technique whereby a pair of nucleotide sequences called primer sequences are designated at either end of a microsatellite, and then only those portions between the thus designated nucleotide sequences are repeatedly replicated as DNA fragments so as to obtain a predetermined amount of a sample.
- Electrophoresis examples of which include gel electrophoresis and capillary electrophoresis, is an experimental technique involving causing an amplified DNA fragment to electrophorese in an electrically charged migration path so as to separate DNA fragments with different lengths.
- electrophoresis is a sample separation technique that takes advantage of the difference in migration speeds in a migration path depending on the length of DNA fragments (the longer the DNA fragment, the smaller its migration speed).
- Fig. 14 schematically shows experimental procedures for extracting and amplifying DNA fragments in microsatellites using PCR and gel electrophoresis.
- a pair of primer sequences 1400 and 1401 at either end of a target microsatellite are designated, and then a genome region 1402 including the microsatellite and the primer sequences is amplified in a PCR experiment.
- the example shown in Fig. 14 is heterozygous, in which the number of repetitions of a microsatellite in each of the two homologous chromosomes is different.
- PCR amplification products namely, DNA fragments, that have different lengths (66 nucleotides and 58 nucleotides) are obtained from each allele.
- DNA fragments are subjected to electrophoresis on slab gel for a predetermined time, the two kinds of PCR amplification products are separated, depending on the difference in the length of the DNA fragments.
- Each of the DNA fragments is labeled with a fluorescent dye in advance. As shown in Fig.
- the intensity and position of fluorescent signals from each DNA fragment are detected, based on which a graph can be plotted in which the horizontal axis shows the length of DNA fragments (i.e., the distance of migration) and the vertical axis shows the intensity of fluorescent signals (i.e., the number of DNA fragments that are present).
- a DNA fragment with a known length referred to as a size maker
- a fluorescent signal from it can be detected. In this way, the length of each PCR amplification product can also be determined with reference to the position where the size marker is detected.
- capillary electrophoresis samples are caused to migration over a thin tube filled with gel, and the time it takes for each sample to complete migrating a predetermined distance (normally to the end of the capillary) is measured so as to determine the length of the DNA fragments.
- capillary electrophoresis instead of scanning the samples in gel for fluorescent signals, samples are generally detected using a fluorescent signal detector fitted at the end of the capillary.
- the experiment performed on a sample from a single individual involving PCR and electrophoresis, as in Fig. 14, is referred to as an individual typing experiment.
- the graph obtained from such an individual typing experiment, in which the horizontal axis shows the length of DNA fragments and the vertical axis shows fluorescent signal intensities is referred to as an individual typing waveform.
- an experiment performed on samples from a plurality of individuals in a single batch involving PCR and electrophoresis is referred to as a pooled typing experiment.
- the graph obtained from a pooled typing experiment (which is plotted in the same way as mentioned above) is referred to as a pooled typing waveform.
- the pooled typing experiment allows the frequency distribution of alleles in samples from a plurality of individuals to be measured in a single experiment.
- Fig. 15 schematically shows a procedure for a pooled typing experiment in which PCR and electrophoresis are carried out for samples from a plurality of individuals in a single batch.
- a sample DNA fragment of individual A is a heterozygote comprised of 58 nucleotides and 62 nucleotides.
- a sample DNA fragment of individual B is a homozygote comprised of 60 nucleotides.
- a sample DNA fragment of individual C is a heterozygote comprised of 58 nucleotides and 60 nucleotides. Equal amounts of samples are collected from individuals A to C and mixed, thereby preparing a pooled sample.
- This pooled sample includes the alleles of 58 nucleotides derived from individuals A and C, alleles of 60 nucleotides derived from individuals B and C, and an allele of 62 nucleotides derived from individual A. Because the sample DNA fragment of individual B is a homozygote comprised of alleles of 60 nucleotides, the amount of the allele of 60 nucleotides derived from individual B that is included in the pooled sample is twice as much as the amount of the allele of 60 nucleotides derived from individual C. During the amplification by PCR and the detection of fluorescent signals by electrophoresis, the aforementioned ratio of amounts is substantially unchanged.
- the heights of the peaks that appear at the location of each nucleotide length are substantially proportional to the amount of the allele of the corresponding nucleotide length that is present in the pooled sample.
- the frequency of appearance of each allele in the pooled sample can be calculated. Because the pooled typing experiment requires that PCR and electrophoresis be performed only once each, costs and time required for the experiment can be greatly reduced as compared with a case where individual typing experiments are repeated as many times as there are samples.
- a stutter peak which is a typical noise peak produced during the PCR and electrophoresis experiments, and polymorphisms that are produced in a combined manner will be described with reference to examples.
- the DNA marker in which a single-nucleotide in/del or a microsatellite with polymorphism appears in a combined manner is referred to as a compound marker.
- a compound marker complex polymorphisms are observed, such as an instance of polymorphism where, when microsatellites with the same number of repetitions exist, the fragment lengths are not necessarily the same.
- Fig. 16 shows DNA fragments containing two kinds of microsatellites with polymorphism as an example of a compound marker.
- the unit lengths or the number of repetitions of a unit could differ between the individual microsatellites.
- the DNA fragments even if they have the same length, could have different nucleotide sequences.
- the DNA fragment of individual A includes a microsatellite consisting of five repetitions of "AT” and a microsatellite consisting of seven repetitions of "GT” in one allele, and a microsatellite consisting of seven repetitions of "AT” and a microsatellite consisting of five repetitions of "GT” in the other allele.
- These two alleles have the same nucleotide length because the sum of the lengths of the two microsatellites in each allele is the same, but the nucleotide sequences are different.
- Fig. 17 shows DNA fragments containing a microsatellite with polymorphism and a single-nucleotide in/del, as another example of the compound marker.
- a single-nucleotide in/del exists, so that the nucleotide length of each allele can be different in various ways. Therefore, it is often the case that in the results of PCR and electrophoresis experiments, peaks do not appear in an orderly manner at unit-length intervals.
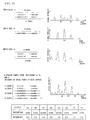
- Fig. 18 schematically shows a stutter peak, which is a typical form of noise caused during the process of PCR and electrophoresis experiments.
- Fig. 18 shows only the DNA fragment of 66 nucleotides (which contains a microsatellite in which "TA" is repeated 12 times) shown in Fig. 14 as an example.
- the stutter peak denotes noise caused by a phenomenon in which the number of repetitions in the microsatellite portion of a DNA fragment to be replicated increases or decreases due to slipped-strand mispairing during a PCR reaction. It is observed as a noise peak of a DNA fragment of which the number of repetitions has been increased or decreased during fluorescence analysis following electrophoresis.
- DNA fragments 1801 or 1802 containing abnormal microsatellites in which "TA” is repeated 11 or 13 times are produced, and they are observed in the form of stutter peaks in fluorescence analysis.
- Such an increase or decrease in the number of repetitions could occur to even a greater degree, so that there is a possibility that, in addition to the DNA fragment (66 nucleotides) of the same length as that of the original DNA fragment, DNA fragments whose length has been increased or decreased by an integer multiple of the unit length of the microsatellite could be produced.
- the aforementioned stutter peak becomes an issue when examining the genotype of an individual via an individual typing experiment, or when examining the frequency distribution of alleles in a group of samples via a pooled typing experiment.
- a peak that appears at the position corresponding to the nucleotide length of the original DNA fragment (to be hereafter referred to as "a true peak"), which should be observed, must be distinguished from a stutter peak, so that the true peak alone can be adopted as information indicating the genotype of the individual.
- a true peak caused by a single allele influences the height of the peaks of the surrounding alleles, which leads to the problem that the results obtained do not reflect the true frequency distribution of the allele.
- DNA fragments of 56 nucleotides, 60 nucleotides, and 64 nucleotides appear due to slipped-strand mispairing.
- DNA fragments of nucleotide lengths that are different from an original nucleotide length appear from the DNA fragments contained in individuals B or C due to slipped-strand mispairing.
- the waveform pattern obtained by electrophoresis is influenced by those fragments caused by slipped-strand mispairing, resulting in an frequency distribution that does not reflect the true frequency distribution of the alleles shown in Fig.
- a DNA sequencing experiment is conducted on several to dozens of sample DNA markers so as to determine whether any of the markers is a compound marker, what the polymorphism of the compound marker is like if such marker is indeed a compound marker, and whether or not a microsatellite with polymorphism or a single-nucleotide in/del is included in the compound marker.
- the formula for estimating the relative height of a stutter peak based on the length of a fragment can be determined from a line representing the linear relationship between the number of repetitions of a unit and the relative height of a stutter peak that is common to all the DNA markers, and the relationship between the fragment length and the number of repetitions that has been determined by the DNA sequencing experiment.
- the other method involves directly determining the relationship between the fragment length of a DNA marker and the relative height of a stutter peak based on an individual typing experiment for each of several to dozens of sample DNA markers.
- the resultant waveform is comprised of a complex superposition of the true peak, stutter peaks, and other noise peaks, which cannot be properly isolated. In view of this, it is necessary to prepare a large number of individuals for which individual typing experiments are conducted.
- the second method when correcting the experimental results of an individual typing experiment, the second method is employed. This is due to the fact that the second method can utilize the experimental results obtained by an individual typing experiment that has already been conducted, and that the fact that there is no need to perform an additional preliminary experiment. However, if many heterozygotes in which two true peaks appear in close proximity are included in the sample DNA markers used in an individual typing experiment, a problem arises that the relative height of a stutter peak cannot be estimated with sufficient accuracy due to the above-described reasons.
- both the first and the second methods are employed.
- a preliminary experiment a DNA sequencing experiment or an individual typing experiment
- the inventors conducted research and analysis on compound markers and have obtained the following information concerning regularity.
- the relative height of a stutter peak can be calculated for a particular nucleotide length if only information is available that the sample DNA that has been subjected to PCR amplification is a sample DNA of the published human genome sequence that has been increased or decreased by (unit length x n) nucleotides. This means that the relative height of a stutter peak can be calculated without the need to examine the nucleotide sequence of the PCR amplification product.
- the results of estimation of the relative height of a stutter peak using functions 1 to 6 are displayed on a screen.
- the user can be shown the results of estimation of the relative height of a stutter peak and the data on which the results are based.
- the invention provides an apparatus for displaying the results of analysis of the length of a DNA fragment based on a detection signal obtained from a PCR amplification product of said DNA fragment, comprising:
- the apparatus further comprises a means for storing known information about compound markers, wherein said compound marker determination unit determines whether or not said DNA fragment is a compound marker using said known information, and wherein said relative height estimation unit determines whether or not a relative relationship between the height of a true peak and the height of a stutter peak can be estimated using said known information.
- the invention further provides an apparatus for displaying the results of analysis of the length of a DNA fragment from a detection signal obtained from a PCR amplification product of said DNA fragment, comprising:
- the invention further provides an apparatus for displaying the results of analysis of the length of a DNA fragment from a detection signal obtained from a PCR amplification product of said DNA fragment, comprising:
- the apparatus further comprises a means for storing known information about compound markers, wherein said compound marker determination unit determining whether or not said DNA fragment is a compound marker using said known information, and wherein said relative height estimation unit determines whether or not a relative relationship between the height of a true peak and the height of a stutter peak can be estimated using said known information.
- the compound marker determination unit determines whether or not, based on the intervals of peaks in a waveform of said detection signal of said PCR amplification product of said DNA fragment, said DNA fragment includes a single-nucleotide in/del.
- the compound marker determination unit acquires information about the number of repetitions of a unit in a microsatellite included in said DNA fragment by referring to the published genome sequence of said DNA fragment.
- the relative height estimation unit when said DNA fragment includes a single-nucleotide in/del, adjusts the results of estimation based on a linear relationship between the length of said DNA fragment and the sum of the number of repetitions of a unit in each microsatellite included in said DNA fragment by referring to the published genome sequence of said DNA fragment.
- the relative height estimation unit when a plurality of microsatellites are included in said DNA fragment, adjusts the results of estimation based on a linear relationship between the length of said DNA fragment and the number of repetitions of a unit in each microsatellite included in said DNA fragment by referring to the published genome sequence of said DNA fragment.
- the display unit displays information on which the estimation made by said relative height estimation unit is based.
- the invention further provides a method for displaying the results of analysis of the length of a DNA fragment based on a detection signal obtained from a PCR amplification product of said DNA fragment, comprising the steps of:
- the method further comprises the step of acquiring known information about compound markers prior to the compound marker determination step, wherein it is determined, using said known information, in the compound marker determination step whether or not said DNA fragment is a compound marker, and wherein it is determined in the relative height estimation step whether or not it is possible to estimate the relative relationship between the height of said true peak and the height of a stutter peak using said known information.
- the invention further provides a method for displaying the results of analysis of the length of a DNA fragment based on a detection signal obtained from a PCR amplification product of said DNA fragment, comprising the steps of:
- the invention further provides a method for displaying the results of analysis of the length of a DNA fragment based on a detection signal obtained from a PCR amplification product of said DNA fragment, comprising the steps of:
- the method further comprises the step of acquiring known information about compound markers prior to the compound marker determination step, wherein it is determined, using said known information, in the compound marker determination step whether or not said DNA fragment is a compound marker, and wherein it is determined in the relative height estimation step whether or not it is possible to estimate the relative relationship between the height of said true peak and the height of a stutter peak using said known information.
- the compound marker determining step comprises determining, based on the intervals of peaks in the waveform of said detection signal of said PCR amplification product of said DNA fragment, whether or not said DNA fragment includes a single-nucleotide in/del.
- the compound marker determination step comprises acquiring information about the number of repetitions of a unit in a microsatellite included in said DNA fragment by referring to the published genome sequence of said DNA fragment.
- the relative height estimation step comprises adjusting, when a single-nucleotide in/del is included in said DNA fragment, the results of estimation by referring to the published genome sequence of said DNA fragment and estimation in accordance with a linear relationship between the length of said DNA fragment and the number of repetitions of a unit in a micro satellite included in said DNA fragment.
- the relative height estimation step comprises adjusting, when a plurality of microsatellites are included in said DNA fragment, the results of estimation by referring to the published genome sequence of the DNA fragment and based on a linear relationship between the length of said DNA fragment and the sum of the number of repetitions of a unit in each microsatellite included in said DNA fragment.
- the display step comprises displaying information on which the estimation made by the relative height estimation step is based.
- the invention further provides a program for causing a computer to carry out any one of the foregoing methods.
- the experiment results that have already been obtained can be utilized for estimating the relative height of a stutter peak with high accuracy without conducting an additional preliminary experiment, whether in an individual typing experiment or a pooled typing experiment.
- the experimental results or the like can then be corrected by eliminating the influence of stutter peaks based on the estimation made.
- the relative height of a stutter peak can be estimated, without requiring an additional experiment, for the following DNA markers that are yet to be known to be whether a compound marker or not: (1) DNA markers that include both a single-nucleotide in/del and a microsatellite with a unit length of 3 nucleotides or longer; (2) DNA markers that include a plurality of microsatellites with the same unit length; and (3) DNA markers that are actually not compound markers.
- FIG. 1 to 11 show the embodiments of the invention, in which identical reference numerals designate identical elements with similar structures and operations.
- Fig. 2 shows a schematic functional block diagram of the internal structure of a gene information display system according to an embodiment of the invention.
- the gene information display system includes: a waveform database 200 in which waveform data obtained as a result of fluorescence analysis of a PCR amplification product following a PCR and electrophoresis experiment is stored; a genome sequence database 201 in which published information about the human genome sequence of DNA markers is stored; a display unit 202 for displaying waveform data, the published human genome sequence data, and the result of analyzing them in the from of graphs; a pointing device 204 including a keyboard 203 and a mouse for performing operations for selecting a nucleotide sequence, an individual, or a peak in the displayed data; a central processing unit (CPU) 205 for performing required computations and control processes; a program memory 206 in which programs necessary for the processes performed by the CPU 205 are stored; and a data memory 207 in which data required for the processes performed by the CPU 205 are stored.
- CPU central processing unit
- the program memory 206 includes: a compound marker determination unit 208 for realizing the aforementioned functions 1, 2-1, 2-2, 3, and 4, namely, those functions for examining whether or not a DNA marker is a compound marker; a relative height estimation unit 209 for estimating the relative height of a stutter peak by realizing the aforementioned functions 1, 5, and 6, namely, functions for estimating the relative height of a stutter peak; an estimation result display unit 210 for displaying the results from the compound marker determination unit 208 and the relative height estimation unit 209; and an estimation result correction unit 211 for correcting waveform data using the results of estimation if the estimation is possible and a conventional technique.
- a compound marker determination unit 208 for realizing the aforementioned functions 1, 2-1, 2-2, 3, and 4, namely, those functions for examining whether or not a DNA marker is a compound marker
- a relative height estimation unit 209 for estimating the relative height of a stutter peak by realizing the aforementioned functions 1, 5, and 6, namely,
- the data memory 207 includes marker data 212 including the published human genome sequence data for each DNA marker, pooled typing data 213 including waveform data obtained as a result of a pooled typing experiment, and individual typing data 214 including waveform data obtained as a result of an individual typing experiment.
- Fig. 3 shows the data structure of the marker data 212 included in the data memory 207.
- the data structure, or MarkerData [] includes, for a number i of DNA markers: marker name 300 for each DNA marker; genome sequence 301; an estimation impossibility flag 302 indicating whether or not the relative height of a stutter peak can be estimated without performing a preliminary experiment; a single-nucleotide in/del presence flag 303 indicating whether or not a single-nucleotide in/del is contained; a unit length list 304 in which the position of each microsatellite with polymorphism contained in a DNA marker and its unit length are listed in pairs; the relationship between the fragment length and the number of repetitions 305; and the relationship 306 between the fragment length and the relative height of a stutter peak.
- the data 302 has a NULL value when no calculations have been made.
- the data 303 has a NULL value when no calculations have been made, or when it is unknown whether or not there is a single-nucleotide in/del.
- the data 304 has a NULL value when no calculations have been made, or when it is unknown whether or not the DNA marker is a compound marker that includes a plurality of microsatellite with polymorphism.
- the data 305 holds data in the form of a sequence of a data structure FragmentSizeRepeatNumberData, as will be described below, for DNA markers that are known to be compound markers and for which nucleotide sequence frequency information can be utilized. For other DNA markers, the data 305 has a NULL value.
- the data structure FragmentSizeRepeatNumberData [] includes, for a number j of fragment lengths that a single DNA marker has as an allele, fragment lengths 307 and a list 308 of structures of microsatellites that correspond to the fragment lengths.
- the data 308 are stored in the form of sequences of a data structure RepeatNumberData.
- the data structure RepeatNumberData [] includes, regarding the structures of a number k of microsatellites that a single allele has, an intra-group proportion 309 and a microsatellite structure content 310. In the data shown in Fig.
- Fig. 4 shows the data structure of the pooled typing data 213 included in the data memory 207.
- the data structure, or pooled typing data [] includes, for a single DNA marker for which a pooled typing experiment has been conducted, a marker name 400, waveform data 401 before correction obtained by the experiment, and corrected waveform data 402 obtained after correcting the waveform data 401 before correction using the results of estimation of the relative height of a stutter peak and a conventional technique.
- the data 401 and 402 are stored in the form of a list of the fragment length of each peak and fluorescent intensities.
- the pooled typing data [] would be empty.
- Fig. 5 shows the data structure of the individual typing data 214 included in the data memory 207.
- This data structure, or IndividualTypingData [] includes, for each of a number m of DNA markers for which individual typing experiments have been conducted, a marker name 500 and data 501 experimentally obtained for each individual.
- the data 501 is stored in the form of a sequence of data structure IndividualData[] as shown below.
- the data structure IndividualData[] includes, for a number n of individuals for which an individual typing experiment has been conducted with reference to a single DNA marker, an individual ID 502 for each individual, waveform data 503 obtained by the experiment, and a true peak 504 obtained using the results of estimation of the relative height of a stutter peak and a conventional technique.
- the data 503 is stored in the form of a list of pairs of the fragment length of each peak and fluorescent intensities.
- Fig. 6 shows a flowchart of the process performed by the gene information display system.
- data regarding a DNA marker for which an experiment has been conducted is read from the waveform database 200 and the genome sequence database 201 (step 600).
- the data that has been read is then held in the data memory 207 in the form of marker data 212, pooled typing data 213, and individual typing data 214.
- marker data 212 When either a pooled typing experiment or an individual typing experiment has been conducted exclusively, either data 213 or data 214 is read.
- TRUE or FALSE is stored in the single-nucleotide in/del presence flag 303 in the data structure MarkerData [] as shown in Fig. 3.
- the particular DNA marker is a compound marker that includes a plurality of microsatellites with polymorphism
- a pair of the position of each microsatellite and its unit length is stored in the unit length list 304.
- the particular DNA marker is a compound marker and when the nucleotide sequence frequency information is available, such information are stored in the relationship between the fragment length and the number of repetitions 305.
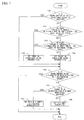
- the compound marker determination unit 208 determines whether or not the target DNA marker is a compound marker (step 601). This process will be described later with reference to Fig. 7.
- the result of the examination of whether or not the target DNA marker is a compound marker is stored in the single-nucleotide in/del flag presence 303 and the unit length list 304 of the data structure MarkerData [] shown in Fig. 3.
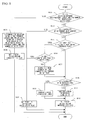
- the relative height of a stutter peak that appears in the waveform data of the target DNA marker is then estimated by the relative height estimation unit 209 (step 602). This process will be later described in detail with reference to Fig. 8.
- TRUE is set in the estimation impossibility flag 302 of the data structure MarkerData [] shown in Fig. 3.
- the results of estimation is stored in the relationship 306 between the fragment length and the relative height of a stutter peak of the data structure MarkerData [].
- the subsequent process branches out in one way or the other (step 603).
- the results of estimation is displayed on the screen by the estimation result display unit 210 (step 604).
- the details of the display process will be described later with reference to Figs. 9 and 10. then, using the results of estimation obtained at step 602, the experimental result is corrected by the estimation result correction unit 211 (step 605).
- This experimental result correction process can be performed using a conventional technique and is therefore not described herein.
- the estimation impossibility flag is set to be TRUE
- a message is displayed by the estimation result display unit 210 on the screen to the effect that an additional preliminary experiment is required (step 606).
- the process of this display will be described later in greater detail with reference to Fig. 11.
- the user enters the data obtained in the additional preliminary experiment (waveform data for the target DNA marker and data regarding the relative height of a stutter peak) into the system.
- the experimental result can then be corrected by the estimation result correction unit 211 using the data (step 607).
- Such experimental result correction process can be performed using a conventional technique and is therefore not described herein.
- step 601 of Fig. 6 the details are described of the process performed at step 601 of Fig. 6 for examining whether or not the target DNA marker is a compound marker.
- This flowchart consists of two major portions, namely, one in which it is examined whether or not the DNA marker is a compound marker with a single-nucleotide in/del, and the other, which comes later, in which it is examined whether or not the DNA marker is a compound marker that includes a plurality of microsatellites with polymorphism.
- step 700 it is examined whether or not it is known whether or not the target DNA marker is a compound marker that includes a single-nucleotide in/del.
- step 702 If such peaks appear, it can be known using function 2-1 (information 2) that a single-nucleotide in/del is included, and, therefore, TRUE is stored in the single-nucleotide in/del presence flag 303 in the data structure MarkerData [] (step702). If the condition was not met at step 701, it is then examined whether or not the data structure IndividualTypingData [] shown in Fig. 5 is empty (i.e.; whether or not an individual typing experiment has been conducted), and whether or not peaks appear at the intervals of a single nucleotide or (unit length - 1) nucleotides in one or more pieces of individual data 501 of this data structure (step 703).
- step 702 If such peaks appear, it can be known using function 2-2 (information 2) that a single-nucleotide in/del is included, and, therefore, TRUE is stored in the single nucleotide in/del presence flag 303 in the data structure MarkerData [] (step 702). If the condition was not met at step 703, it can be known by functions 2-1 and 2-2 (information 2) that no single-nucleotide in/del is included, and, therefore, FALSE is stored in the single nucleotide in/del presence flag 303 (step 704). Thereafter, it is examined whether or not it is known whether or not a plurality of microsatellites with polymorphism are included (step 705).
- step 706 it is examined, with reference to the genome sequence 301 of the data structure MarkerData [], whether or not a plurality of microsatellites with a large number of repetitions are included (step 706). If a plurality of such microsatellites are included, a pair of the position of microsatellite and its unit length is stored in the unit length list 304 of the data structure MarkerData [] for each microsatellite (step 707). If there is only one microsatellite that is included at step 706, a pair of the position of that microsatellite and its unit length is stored in the unit length list 304 of the data structure MarkerData [] as a sole factor (step 708).
- a target DNA marker is a compound marker and whether or not the relationship between the fragment length and the number of repetitions is available (step 800). This condition would be met unless the relationship between the fragment length and the number of repetitions 305 in the data structure MarkerData [] shown in Fig. 3 is set to be a NULL value.
- the relationship between the fragment length and the relative height of a stutter peak is determined using the relationship between the fragment length and the number of repetitions and is stored in the relationship between the fragment length and the number of repetitions 306 of the data structure MarkerData [] (step 801). This determination can be made using a conventional technique on the basis of the aforementioned known property 3. then, FALSE is stored in the estimation impossibility flag 302 of the data structure MarkerData [] (step 802). If the condition was not met at step 800, the following process is carried out. First, it is examined whether or not a plurality of different unit lengths are registered in the unit length list 304 of the data structure MarkerData [] (step 803).
- TRUE is stored in the estimation impossibility flag 302 of the data structure MarkerData [] (step 804). If the condition was not met at step 803, the following process is carried out. First, it is examined whether or not the single nucleotide in/del presence flag 303 in the data structure MarkerData [] is TRUE (step 805). If TRUE, the following process is carried out.
- step 806 It is first examined whether or not the unit length registered in the unit length list 304 of the data structure MarkerData [] is less than 3 nucleotides (step 806). (Note that it is only necessary to take one nucleotide length as the unit length into consideration herein because of the branching process at step 803). If the unit length is less than 3 nucleotides, it is impossible to estimate the relative height of a stutter peak without an additional preliminary experiment, and, therefore, TRUE is stored in the estimation impossibility flag 302 of the data structure MarkerData [] (step 804).
- step 806 a linear regression line common to all of the DNA markers is adjusted by one nucleotide using function 5 (information 5) (step 807). If the single-nucleotide in/del presence flag 303 was FALSE at step 805, the following process is performed. First, it is examined whether a plurality of microsatellites with polymorphism are included (step 808). This condition would be met if a plurality of unit lengths are registered in the unit length list 304 of the data structure MarkerData [].
- the relationship between the fragment length and the relative height of a stutter peak is determined by combining a plurality of linear regression lines using function 6 (information 6) and is then stored in the relationship 306 between the fragment length and the relative height of a stutter peak in the data structure MarkerData [] (step 809). Thereafter, FALSE is stored in the estimation impossibility flag 302 of the data structure MarkerData [] (step 810).
- a linear regression line common to all of the DNA markers is used as is using function 4 (information 4) so as to determine the relationship between the fragment length and the relative height of a stutter peak, which is then stored in the relationship 306 between the fragment length and the relative height of a stutter peak in the data structure MarkerData [] (step 811). Then, FALSE is stored in the estimation impossibility flag 302 of the data structure MarkerData [] (step 810).
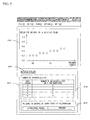
- a graph is displayed with reference to the relationship 306 between the fragment length and the relative height of a stutter peak in the data structure MarkerData [] shown in Fig. 3 (900).
- the values shown on the horizontal axis of the graph indicate fragment lengths represented in terms of the number of nucleotides.
- the vertical axis shows the relative height of stutter peaks.
- information about polymorphism included in a particular DNA marker is shown (901). What is displayed here is the outline of the information about polymorphism.
- What is displayed in 901 includes a display of the number of microsatellites with polymorphism in the form of a table according to unit lengths (903), and polymorphism other than microsatellites included in a particular DNA marker, namely, a display of the information about single-nucleotide in/del (904).
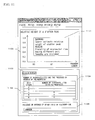
- Fig. 10 shows an example of a detailed display screen that is shown by pressing the detailed display button 902 shown in Fig. 9.
- Information about microsatellites with polymorphism and single-nucleotide in/del included in a particular DNA marker is displayed with reference to the genome sequence 301 in the data structure MarkerData [], the unit length list 304, and the single nucleotide in/del presence flag 303 shown in Fig. 3 (1000).
- the structural contents of a microsatellite is displayed for each fragment length with reference to the relationship 305 between the fragment length and the number of repetitions of the data structure MarkerData [] (1001).
- a message displayed at step 606 of Fig. 6 indicating the necessity of an additional preliminary experiment is described.
- a graph display 1100 of the relationship between the fragment length and the relative height of a stutter peak a message is displayed noting the impossibility of estimating the relative height of a stutter peak without an additional preliminary experiment and a reason therefor (1101).
- Display of information about polymorphism included in a particular DNA marker (1102), display of a detailed display button (1103), display of the number of microsatellites with polymorphism in the form of a table according to unit lengths (1104), and display of information about polymorphism other than microsatellite included in a particular DNA marker, namely, information about single-nucleotide in/del (1105) are made in the same way as described with reference to Fig. 9.
- information regarding the reason why the relative height of a stutter peak cannot be estimated information indicating that it is unclear whether or not there is a single-nucleotide in/del is also useful for the user when making a decision as to what additional experiment is to be conducted.
- a detailed display screen that is shown by pressing the detailed display button 1103 is the same as that shown in Fig. 10.
- the method and apparatus for displaying gene information can be realized on a computer having memory means, input means, display means, and so on.
- Information processing such as the displaying of the result of a gene analysis experiment, estimation of a noise peak, and correction of experimental result based on the estimated result, can be performed using the aforementioned hardware resources including the memory means, input means, and display means.
- the invention can be industrially utilized.
Landscapes
- Physics & Mathematics (AREA)
- Life Sciences & Earth Sciences (AREA)
- Engineering & Computer Science (AREA)
- Biotechnology (AREA)
- General Health & Medical Sciences (AREA)
- Health & Medical Sciences (AREA)
- Bioinformatics & Cheminformatics (AREA)
- Bioinformatics & Computational Biology (AREA)
- Biophysics (AREA)
- Evolutionary Biology (AREA)
- Data Mining & Analysis (AREA)
- Medical Informatics (AREA)
- Spectroscopy & Molecular Physics (AREA)
- Theoretical Computer Science (AREA)
- Information Retrieval, Db Structures And Fs Structures Therefor (AREA)
- Management, Administration, Business Operations System, And Electronic Commerce (AREA)
- Measuring Or Testing Involving Enzymes Or Micro-Organisms (AREA)
- Investigating Or Analysing Biological Materials (AREA)
Applications Claiming Priority (1)
| Application Number | Priority Date | Filing Date | Title |
|---|---|---|---|
| JP2004353068A JP4713138B2 (ja) | 2004-12-06 | 2004-12-06 | 遺伝子情報の表示方法及び表示装置及びプログラム |
Publications (2)
| Publication Number | Publication Date |
|---|---|
| EP1667044A2 true EP1667044A2 (de) | 2006-06-07 |
| EP1667044A3 EP1667044A3 (de) | 2007-06-20 |
Family
ID=36124014
Family Applications (1)
| Application Number | Title | Priority Date | Filing Date |
|---|---|---|---|
| EP05025675A Withdrawn EP1667044A3 (de) | 2004-12-06 | 2005-11-24 | Verfahren und Vorrichtung zur Anzeige von Geninformation |
Country Status (3)
| Country | Link |
|---|---|
| US (1) | US20060122791A1 (de) |
| EP (1) | EP1667044A3 (de) |
| JP (1) | JP4713138B2 (de) |
Families Citing this family (6)
| Publication number | Priority date | Publication date | Assignee | Title |
|---|---|---|---|---|
| JP4922646B2 (ja) * | 2005-12-14 | 2012-04-25 | 株式会社日立ソリューションズ | 遺伝子情報の表示方法及び表示装置 |
| EP1862929A1 (de) * | 2006-02-28 | 2007-12-05 | Hitachi Software Engineering Co., Ltd. | Verfahren und System zur Ergebnisbewertung der Genotypisierung |
| JP5065694B2 (ja) * | 2006-02-28 | 2012-11-07 | 株式会社日立ソリューションズ | 遺伝子型判定結果の評価方法及び評価システム |
| JP7272431B2 (ja) | 2019-05-31 | 2023-05-12 | 日本電気株式会社 | 情報処理装置、情報処理方法及び情報処理プログラム |
| JPWO2021100204A1 (de) * | 2019-11-22 | 2021-05-27 | ||
| WO2022196041A1 (ja) * | 2021-03-15 | 2022-09-22 | 日本電気株式会社 | 遺伝子情報処理システム、遺伝子情報処理方法、及び記録媒体 |
Family Cites Families (8)
| Publication number | Priority date | Publication date | Assignee | Title |
|---|---|---|---|---|
| US5580728A (en) * | 1994-06-17 | 1996-12-03 | Perlin; Mark W. | Method and system for genotyping |
| US6274317B1 (en) * | 1998-11-02 | 2001-08-14 | Millennium Pharmaceuticals, Inc. | Automated allele caller |
| CA2416764A1 (en) * | 2000-07-21 | 2002-01-31 | Applera Corporation | Methods, systems, and articles of manufacture for evaluating biological data |
| US20020116135A1 (en) * | 2000-07-21 | 2002-08-22 | Pasika Hugh J. | Methods, systems, and articles of manufacture for evaluating biological data |
| US6844152B1 (en) * | 2000-09-15 | 2005-01-18 | Promega Corporation | Detection of microsatellite instability and its use in diagnosis of tumors |
| US20020058265A1 (en) * | 2000-09-15 | 2002-05-16 | Promega Corporation | Detection of microsatellite instability and its use in diagnosis of tumors |
| JP4414823B2 (ja) * | 2004-06-30 | 2010-02-10 | 日立ソフトウエアエンジニアリング株式会社 | 遺伝子情報の表示方法及び表示装置 |
| JP4468773B2 (ja) * | 2004-09-09 | 2010-05-26 | 日立ソフトウエアエンジニアリング株式会社 | 遺伝子情報の表示方法及び表示装置 |
-
2004
- 2004-12-06 JP JP2004353068A patent/JP4713138B2/ja not_active Expired - Fee Related
-
2005
- 2005-11-23 US US11/285,061 patent/US20060122791A1/en not_active Abandoned
- 2005-11-24 EP EP05025675A patent/EP1667044A3/de not_active Withdrawn
Also Published As
| Publication number | Publication date |
|---|---|
| US20060122791A1 (en) | 2006-06-08 |
| JP4713138B2 (ja) | 2011-06-29 |
| JP2006163720A (ja) | 2006-06-22 |
| EP1667044A3 (de) | 2007-06-20 |
Similar Documents
| Publication | Publication Date | Title |
|---|---|---|
| JP6328934B2 (ja) | 非侵襲性出生前親子鑑定法 | |
| Cantsilieris et al. | Molecular methods for genotyping complex copy number polymorphisms | |
| US20250333788A1 (en) | Systems and methods for next generation sequencing uniform probe design | |
| US20260009073A1 (en) | Noninvasive prenatal diagnostic methods | |
| EA017966B1 (ru) | Диагностика фетальной хромосомной анэуплоидии с использованием геномного секвенирования | |
| US8906620B2 (en) | Exon grouping analysis | |
| US7783430B2 (en) | Genotyping result evaluation method and system | |
| Alame et al. | Implementation of a reliable next-generation sequencing strategy for molecular diagnosis of dystrophinopathies | |
| EP1667044A2 (de) | Verfahren und Vorrichtung zur Anzeige von Geninformation | |
| EP3612644B1 (de) | Verwendung von off-target-sequenzen zur dna-analyse | |
| JP4468773B2 (ja) | 遺伝子情報の表示方法及び表示装置 | |
| CN113355401A (zh) | 一种基于ngs的cnv分析检测脑胶质瘤染色体的方法 | |
| EP1798651B1 (de) | Vorrichtung und Verfahren zur Geninformationsanzeige | |
| CN118064563A (zh) | 脑胶质瘤1p19q、+7-10染色体异常的检测方法及装置、设备 | |
| US20240209417A1 (en) | Systems and methods for next generation sequencing uniform probe design | |
| WO2018223057A1 (en) | Array-based methods for analysing mixed samples using different allele-specific labels, in particular for detection of fetal aneuploidies | |
| Amr et al. | Targeted hybrid capture for inherited disease panels | |
| CN119464549B (zh) | 一种鉴定小麦粒重的kasp分子标记及应用 | |
| JP2007259847A (ja) | 遺伝子型判定結果の評価方法及び評価システム | |
| US20090182512A1 (en) | Gene information processing apparatus and gene information display apparatus | |
| JP2006017461A (ja) | 遺伝子情報の表示方法及び表示装置 | |
| JP2015073506A (ja) | 遺伝子多型の判定方法 | |
| JP2008237178A (ja) | イタリアンライグラスの品種識別用のオルガネラゲノム由来1塩基多型プライマー対及び当該プライマーセットを用いたイタリアンライグラス品種の識別方法 | |
| HK40004815B (en) | Method and device for acquiring fetal free dna concentration | |
| HK40004815A (en) | Method and device for acquiring fetal free dna concentration |
Legal Events
| Date | Code | Title | Description |
|---|---|---|---|
| PUAI | Public reference made under article 153(3) epc to a published international application that has entered the european phase |
Free format text: ORIGINAL CODE: 0009012 |
|
| 17P | Request for examination filed |
Effective date: 20051124 |
|
| AK | Designated contracting states |
Kind code of ref document: A2 Designated state(s): AT BE BG CH CY CZ DE DK EE ES FI FR GB GR HU IE IS IT LI LT LU LV MC NL PL PT RO SE SI SK TR |
|
| AX | Request for extension of the european patent |
Extension state: AL BA HR MK YU |
|
| PUAL | Search report despatched |
Free format text: ORIGINAL CODE: 0009013 |
|
| AK | Designated contracting states |
Kind code of ref document: A3 Designated state(s): AT BE BG CH CY CZ DE DK EE ES FI FR GB GR HU IE IS IT LI LT LU LV MC NL PL PT RO SE SI SK TR |
|
| AX | Request for extension of the european patent |
Extension state: AL BA HR MK YU |
|
| 17Q | First examination report despatched |
Effective date: 20070821 |
|
| AKX | Designation fees paid |
Designated state(s): DE FR GB |
|
| RAP1 | Party data changed (applicant data changed or rights of an application transferred) |
Owner name: HITACHI SOLUTIONS, LTD. |
|
| RIN1 | Information on inventor provided before grant (corrected) |
Inventor name: MATSUMOTO, TOSHIKO Inventor name: NAKASHIGE, RYO Inventor name: YUKAWA, WATARU |
|
| RAP1 | Party data changed (applicant data changed or rights of an application transferred) |
Owner name: HITACHI, LTD. |
|
| RAP1 | Party data changed (applicant data changed or rights of an application transferred) |
Owner name: HITACHI, LTD. |
|
| STAA | Information on the status of an ep patent application or granted ep patent |
Free format text: STATUS: THE APPLICATION IS DEEMED TO BE WITHDRAWN |
|
| 18D | Application deemed to be withdrawn |
Effective date: 20160601 |