EP1632580B1 - Methode für die Quantifizierung der Ausgangs-Konzentration von Nukleinsäuren ausgehend von real-time Amplifikationsdaten - Google Patents
Methode für die Quantifizierung der Ausgangs-Konzentration von Nukleinsäuren ausgehend von real-time Amplifikationsdaten Download PDFInfo
- Publication number
- EP1632580B1 EP1632580B1 EP05019029A EP05019029A EP1632580B1 EP 1632580 B1 EP1632580 B1 EP 1632580B1 EP 05019029 A EP05019029 A EP 05019029A EP 05019029 A EP05019029 A EP 05019029A EP 1632580 B1 EP1632580 B1 EP 1632580B1
- Authority
- EP
- European Patent Office
- Prior art keywords
- nucleic acid
- amplification
- fluorescence intensity
- initial concentration
- cycle number
- Prior art date
- Legal status (The legal status is an assumption and is not a legal conclusion. Google has not performed a legal analysis and makes no representation as to the accuracy of the status listed.)
- Expired - Lifetime
Links
Images

















Classifications
-
- C—CHEMISTRY; METALLURGY
- C12—BIOCHEMISTRY; BEER; SPIRITS; WINE; VINEGAR; MICROBIOLOGY; ENZYMOLOGY; MUTATION OR GENETIC ENGINEERING
- C12Q—MEASURING OR TESTING PROCESSES INVOLVING ENZYMES, NUCLEIC ACIDS OR MICROORGANISMS; COMPOSITIONS OR TEST PAPERS THEREFOR; PROCESSES OF PREPARING SUCH COMPOSITIONS; CONDITION-RESPONSIVE CONTROL IN MICROBIOLOGICAL OR ENZYMOLOGICAL PROCESSES
- C12Q1/00—Measuring or testing processes involving enzymes, nucleic acids or microorganisms; Compositions therefor; Processes of preparing such compositions
- C12Q1/68—Measuring or testing processes involving enzymes, nucleic acids or microorganisms; Compositions therefor; Processes of preparing such compositions involving nucleic acids
- C12Q1/6844—Nucleic acid amplification reactions
- C12Q1/6851—Quantitative amplification
Definitions
- the present invention relates to a method for quantifying the initial nucleic acid concentration, and more particularly, to a method for quantifying the initial nucleic acid concentration from real-time nucleic acid amplification data, which is obtained by polymerase chain reaction (PCR), ligase chain reaction (LCR), strand displacement amplification (SDA), nucleic acid sequence-based amplification (NASBA), transcription mediated amplification (TMA), rolling-circle amplification (RCA), and so on.
- PCR polymerase chain reaction
- LCR ligase chain reaction
- SDA strand displacement amplification
- NASBA nucleic acid sequence-based amplification
- TMA transcription mediated amplification
- RCA rolling-circle amplification
- PCR Polymerase chain reaction
- the real-time PCR uses an optical detection system to detect in real time the fluorescence intensity that is proportional to the concentration of an amplified DNA, such that a quantitative analysis of DNA is possible.
- a method for quantifying the initial concentration of a nucleic acid includes: amplifying a nucleic acid; producing a function representing a correlation between fluorescence intensity which increases or decreases in proportion to the amount of the nucleic acid and amplification cycle number or amplification time; using the function to calculate a characteristic amplification cycle number or a characteristic amplification time at which the fluorescence intensity of the nucleic acid subtracted by the background fluorescence intensity of the nucleic acid has half of its maximum value; and calculating the initial concentration of the nucleic acid from the characteristic amplification cycle number or the characteristic amplification time.
- a method for quantifying the initial concentration of a nucleic acid includes: amplifying a nucleic acid; producing a function representing a correlation between fluorescence intensity which is proportional to the amount of the nucleic acid and amplification cycle number or amplification time of the nucleic acid; using the function to calculate the prior-to-amplification fluorescence intensity of the nucleic acid subtracted by a background fluorescence intensity of the nucleic acid; and calculating the initial concentration of the nucleic acid from the calculated prior-to-amplification fluorescence intensity subtracted by a background fluorescence intensity.
- a method for quantifying the initial concentration of a nucleic acid includes: amplifying a nucleic acid; producing a function representing a correlation between the amplification efficiency of the nucleic acid and amplification cycle number or amplification time of the nucleic acid; using the function to calculate a characteristic amplification cycle number or a characteristic amplification time at which amplification efficiency has the maximum or the minimum value; and calculating the initial concentration of the nucleic acid from the characteristic amplification cycle number or the characteristic amplification time.
- the initial concentration of the nucleic acid can be quantified without differentiation or integration.
- FIG. 1 is a graph showing a mathematical model of the relation between the fluorescence intensity of the amplified nucleic acid and amplification cycle number.
- Nucleic acid amplification using enzyme is performed by [a] methods requiring a thermal cycle, such as PCR, RT-PCR, nested PCR and LCR, or isothermal nucleic acid amplification methods, such as SDA, NASBA, TMA and RCA.
- the nucleic acid may be extracted from an organism or a virus.
- Equation 1 The result of measuring the fluorescence intensity of the nucleic acid at each amplification cycle from a real-time PCR experiment can be modelled as the graph shown in FIG. 1 .
- a sigmoidal model of FIG. 1 can be expressed by Equation 1 below.
- R fluorescence intensity of a nucleic acid
- R b background fluorescence intensity of a nucleic acid
- R max the maximum fluorescence intensity of a nucleic acid
- n amplification cycle number
- n 1/2 characteristic amplification cycle number at which the fluorescence intensity of the nucleic acid subtracted by the background fluorescence intensity of the nucleic acid has half of its maximum value
- k a parameter related to the rate of change of the fluorescence intensity during amplification reaction
- Equation 2 ⁇ n R n ⁇ R b + R max 1 + e - n ⁇ n 1 / 2 k 2
- R n represents the actual fluorescence intensity of a nucleic acid at n-th amplification cycle in real-time PCR.
- nonlinear-equation set of Equation 3 or Equations 4a through 4d is obtained and this can be solved using the Newton-Raphson method.
- the fluorescence intensity of the nucleic acid before the amplification reaction subtracted by the background fluorescence intensity R b can be defined by Equation 5.
- R 0 R max 1 + e n 1 / 2 / k
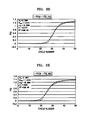
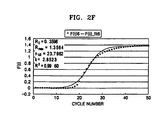
- FIGS. 2A through 2F are graphs showing the real amplification data of a HBV plasmid DNA and the least-square fitting results of those data with the mathematical model of FIG. 1 .
- FIG. 2A is the result when the initial concentration of the nucleic acid is 10 7 copy/rxn (the number of copies in a reaction volume)
- FIG. 2B is the result when the initial concentration is 10 6 copy/rxn
- FIG. 2C is the result when the initial concentration is 10 5 copy/rxn
- FIG. 2D is the result when the initial concentration is 10 4 copy/rxn
- FIG. 2E is the result when the initial concentration is 10 5 copy/rxn
- FIG. 2F is the result when the initial concentration is 2.5 ⁇ 10 6 copy/rxn. It can be seen that the cycle number at which the nucleic acid starts to be rapidly amplified decreases as the initial concentration of the nucleic acid increases.
- the amplification efficiency can be modelled as Equations 6a and 6b mathematically.
- R n 1 + E n ⁇ R n ⁇ 1
- R n the fluorescence intensity at n-th amplification cycle
- R n-1 the fluorescence intensity at (n-1)-th amplification cycle
- E n the amplification efficiency at n-th amplification cycle
- FIG. 3 is a graph showing the relation between the amplification efficiency and amplification cycle number for various initial concentrations of the nucleic acid. Referring to FIG. 3 , it can be seen that the amplification efficiency is not constant during PCR cycles.
- FIG. 4 is a graph showing a method of finding the characteristic amplification cycle number at which amplification efficiency has the maximum value in FIG. 3 .
- Equation 7a a ⁇ x 1 2 + b ⁇ x 1 + c
- y ⁇ 2 a ⁇ x 2 2 + b ⁇ x 2 + c
- y ⁇ 3 a ⁇ x 3 2 + b ⁇ x 3 + c
- Equation 7a If Equation 7a is rewritten in a matrix form, the result is given by Equation 7b.
- x 1 2 x 1 1 x 2 2 x 2 1 x 3 2 x 3 1 ⁇ a b c y 1 y 2 y 3
- x 1 2 x 1 1 x 2 2 x 2 1 x 3 2 x 3 1 det ( A )
- constants a, b and c can be represented by Cramer's rule as follows.
- x max can be calculated from Equation 7d below.
- FIG. 5 is a graph showing the relations of the characteristic amplification cycle number (n 1/2 ) at which the fluorescence intensity of the nucleic acid subtracted by the background fluorescence intensity of the nucleic acid has half of its maximum value in the mathematical model of FIG. 1 with the initial concentration of the nucleic acid, the characteristic amplification cycle number(n Emax ) at whcich the amplification efficiency has the maximum value in FIG. 3 with the initial concentration of the nucleic acid, and the conventional characteristic amplification cycle number C t at which the 2 nd derivative of the fluorescence intensity has the maximum value with the initial concentration of the nucleic acid.
- FIG. 6 is a graph showing the relation between R 0 in Equation 5 and the initial concentration of the nucleic acid. Referring to FIG. 6 , it can be seen that log (initial concentration of nucleic acid) is linearly proportional to log(R 0 ).
- the first method is to use the characteristic amplification cycle number or time n 1/2 at which the fluorescence intensity of the nucleic acid subtracted by the background fluorescence intensity of the nucleic acid has half of its maximum value
- the second method is to use the characteristic amplification cycle number or the characteristic amplification time at which the amplification efficiency of the nucleic acid becomes maximum(n Emax ) or minimum(n Emin ).
- the third method is to use R 0 , the prior-to-amplification fluorescence intensity subtracted by the background fluorescence intensity.
- a nucleic acid amplification reaction for example, PCR, LCR, SDA, NASBA, TMA, RCA, etc.
- a nucleic acid amplification reaction for example, PCR, LCR, SDA, NASBA, TMA, RCA, etc.
- the parameters of the mathematical model shown in FIG. 1 or 3 are calculated.
- the standard calibration curve like FIG. 5 or 6 is obtained using a parameter among n 1/2 , n Emax and R 0 .
- the same nucleic acid amplification reaction is performed on unknown samples and the same parameter(n 1/2 or n Emax or R 0 ) as used in the standard calibration curve is calculated. Then, the initial concentration of the unknown nucleic acid samples [is] are found from the standard calibration curve shown in FIG. 5 or 6 . Specifically, when n Emax is used, the amplification efficiency can be obtained and displayed in real time with much less numerical efforts. Moreover, the initial concentration of the nucleic acid can be quantified with a very simple calculation, thereby reducing the number of the amplification cycle number needed to quantify an unknown nucleic acid sample.
- FIGS. 7A through 7C are tables showing an example of quantification results of the nucleic acid using the methods in the present invention and those using C t from the 2 nd derivative of the fluorescence intensity in the prior art.
- FIG. 7A shows the calculated values of parameters used in quantification of the nucleic acid, whose initial concentrations are 10 4 , 10 5 , 10 6 and 10 7 copy/rxn so as to obtain the standard calibration curve, as shown in FIGS. 5 and 6 .
- FIGS. 7B and 7C show the quantification results of [the] trial nucleic acid samples using the standard calibration curve obtained in FIG. 7A according to the present invention, and those using the standard calibration curve in the prior art.
- Ct instead of Ct, n 1/2 , n Emax or R o can be used as the characteristic factor for the quantitative analysis of the nucleic acid.
- n 1/2 , n Emax or R o can be used as the characteristic factor for the quantitative analysis of the nucleic acid.
- Error is the percentage of a value obtained by dividing an absolute value of [(the copy/rxn value calculated from the calibration curve)-(true copy/rxn value)] by (true copy/rxn value).
- the first value in Error(Ct) is calculated as (5.4E+0.5 - 5.0E+05) / 5.0E+05, i.e., 8.08%.
- Avg error at 5.0E05 represents an average value of errors in FIG. 7B from 6-time repetitions.
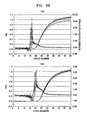
- FIGS. 8A through 8E show graphs showing variations of the relation between fluorescence intensity of a nucleic acid and amplification cycle number, and graphs showing variations of the relation between amplification efficiency and amplification cycle number for initial concentrations 10 0 , 10 1 , 10 2 ,10 3 , 10 4 , 10 5 , 10 6 , 10 7 , and 10 8 copy/rxn of the nucleic acid (9 repetitions).
- the background fluorescence signals of the nucleic acid are subtracted in the graphs showing the relations between the fluorescence intensity and the amplification cycle number.
- the fluorescence intensity starts from a positive value, decreases and again increases at the initial stages. This results from the photobleaching effect, the well-known characteristics of a fluorescence dye. All the minimum fluorescence intensities of FIGS. 11A through 11E are zero because the background fluorescence intensities are subtracted. This causes the amplification efficiency profiles to have a pointed and sharp maximum as in FIGS 8A through 8E .
- the maximum efficiencies in FIGS. 8A through 8E are larger than 1.0, which cannot be accepted as a concept of efficiency physically.
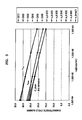
- FIG. 9 is a graph which shows the relation between the characteristic amplification cycle number n Emax and the initial concentration of the nucleic acid obtained from the test result of FIGS. 8A through 8E .
- the graph is linear in range of initial concentration of the nucleic acid from 10 3 to 10 7 so that it can be used as a standard calibration curve for that range to calculate the initial concentration according to the present invention.
- the data have an irregular pattern.
- Equation 6b which represents the amplification efficiency can be rewritten as below.
- R n is the fluorescence intensity in the n-th amplification cycle
- R n-1 is the fluorescence intensity in the (n-1)-th amplification cycle
- R b is an arbitrary constant which represents the background fluorescence intensity
- E n is the amplification efficiency in the n-th amplification cycle, respectively.
- FIG. 10 is a graph of the background-corrected amplification efficiency profiles according to four different definitions of the background fluorescence intensity R b in six repetitive tests when the initial concentration of the nucleic acid is 10 7 copy/rxn.
- R b is zero, that is, when the minimum value R min of the fluorescence intensity during amplification reaction is zero, the amplification efficiency profile has a pointed and sharp shape, as in FIGS. 8A through 8E .
- the amplification cycle numbers at which the maximum amplification efficiency occurs seem almost constant when R b is zero, it occurs at earlier cycle numbers and its value is not constant for 6 repetitions.
- Equation 8 -(R b ) sigmoidal , which results from the least-square fitting of the fluorescence intensity data at all amplification cycles to sigmoidal model in Equation 1, can be used as R b in Equation 8.
- the value corresponding to the initial fluorescence intensity can be used as the value of R b .
- the initial fluorescence intensity is slightly different for different initial concentrations of the nucleic acid, it is 0.01 on average. Therefore, the value of 0.01 can be used as the value of R b .
- the initial fluorescence intensity will not change significantly if the amplification conditions such as reagents, fluorescence dyes, and optical exposure time do not change.
- the value corresponding to the initial fluorescence intensity is determined experimentally, it can be used as R b from that time on.
- the amplification conditions such as reagents, fluorescence dyes, and optical exposure time change, the value corresponding to the initial fluorescence intensity must be determined again experimentally.
- the fluorescence intensity at the first amplification cycle, R 1 can be used as the value of R b . Even though the amplification conditions such as reagents, fluorescence dyes, and optical exposure time change, this method has the advantage that users need no additional efforts for determining R b because the fluorescence intensity at the first amplification cycle is always measured at every test. Although this method has this advantage over the second method, the quantification error may increase when the fluorescence intensity at the first amplification cycle is very close to zero.
- the value that makes the maximum amplification efficiency be "1" (unity) in the amplification efficiency function of Equation 8 can be used as the value of R b .
- the value of R b has to be found by iterative methods such as successive substitution at every amplification experiment. Although this method is ideal in principle, the iterative calculation may be complicated or time-consuming.
- the background fluorescence intensity R b can be set to one of the following values: 1) -(R b ) sigmoidal obtained through the least-square fitting of the fluorescence intensity data at all amplification cycles to the sigmoidal model in Equation 1; 2) the value (about 0.01 for FIGS. 11A through 11E ) corresponding to the initial fluorescence intensity; 3) [the strength R 1 of] the fluorescence intensity at the first amplification cycle, R 1 ; and 4) the value that makes the maximum amplification efficiency be "1".
- the use of -(R b ) sigmoidal of the background fluorescence intensity may be inconvenient because it must be calculated through the nonlinear curve fitting of sigmoidal model.
- other methods in the present invention (the initial fluorescence intensity, R 1 , and the value that makes the maximum amplification efficiency be "1") need not use the curve fitting.
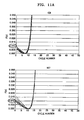
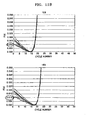
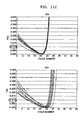
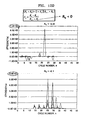
- FIGS. 12A through 12C and 12D through 12F are graphs illustrating variations of the background-corrected amplification efficiency for various values of the background fluorescence intensity using the same experimental data as in FIGS. 8A through 8E .
- the cases where R b are positive values of 0.01, 0.1, 1, 10, 100, and 1000 are shown in FIGS. 12A through 12C . Since the respective cases have well-distinguishable positive peaks in background-corrected amplification efficiency with almost an equal interval in amplification cycle number according to the initial concentration of the nucleic acid, they can be used to quantify the initial concentration of the nucleic acid according to the present invention.
- the maximum value of the background-corrected amplification efficiency becomes very smaller than 1, which has no physical meaning in terms of the amplification efficiency.
- the amplification cycles n Emax where the respective background-corrected amplification efficiency profiles have the maximum values are located at almost an equal interval. Thus, all of them can be used in qualifying the initial concentration of the nucleic acid.
- the background-corrected amplification efficiency is in range from 0 to 1, that is, the case where the value of R b is 0.01 (the value corresponding to the initial fluorescence intensity of the nucleic acid).
- R b are negative values of -0.01, -0.1, -1, -10, -100, and -1000 are shown in FIGS. 12D through 12F .
- the divisor of the background-corrected amplification efficiency function (Equation 8) approaches to zero very closely, so that the background-corrected amplification efficiency profiles have a pointed and sharp peaks and do not represent the regular-interval pattern when the absolute value of R b is large, the background-corrected amplification efficiency profiles have well-distinguishable negative peaks with almost an equal interval in amplification cycle number according to the initial concentration of the nucleic acid.
- the value of the background-corrected amplification efficiency is negative. Since the amplification efficiency has the physical meaning only in the range from 0 to 1, although the initial concentration of the nucleic acid can be quantified using the values given in FIGS. 12D through 12F , there is no physical meaning in terms of the amplification efficiency. However, as can be seen from FIGS. 12D through 12F , when the value of R b is less than -1 (e.g., -1, -10, -100, -1000), the amplification cycles n Emin where the respective background-corrected amplification efficiency profiles have the minimum values are located at almost an equal interval. Thus, all of them can be used in qualifying the initial concentration of the nucleic acid.
- -1 e.g., -1, -10, -100, -1000
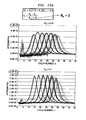
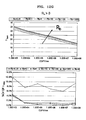
- FIGS. 12G and 12H show graphs of variations of the relation between the initial concentration of the nucleic acid and the characteristic amplification cycle number n Emax or n Emin where the background-corrected amplification efficiency has the maximum or the minimum value, and graphs of variations of the relation between the initial concentration of a nucleic acid and %CV of n Emax or n Emin for various values of R b in FIGS. 12A through 12C and 12D through 12F .
- FIGS. 12G and 12H when the value of R b increases to a positive value ( FIG. 12A ) or decreases to a negative value ( FIGS. 12D through 12F ), the graphs of the relation between the initial concentration of the nucleic acid and n Emax or n Emin converge to a curve, respectively. Except the case where the value of R b is 0 and -0.01, %CV of n Emax is within 5% when the initial concentration of the nucleic acid is in range from 10 3 to 10 8 copy/rxn. A relation between the quantification error in the initial concentration of the nucleic acid and %CV of n Emax or n Emin will be described with reference to FIG. 17 .
- FIG. 13 is a graph showing variations of the relations between fluorescence intensity and amplification cycle number for various methods of adopting the background fluorescence intensity.
- FIGS. 14A and 14B show graphs showing variations of the relations between the background-corrected amplification efficiency and amplification cycle number for various methods of adopting the background fluorescence intensity in FIG. 13 .
- R b the minimum value of the fluorescence intensity profiles
- the divisor (R n-1 +R b ) of Equation 8 approaches to zero.
- the amplification efficiency E n increases too large and E max peak becomes sharp and pointed.
- the amplification efficiency may be easily influenced by noise.
- both standard calibration curves are linear in the initial concentration of the nucleic acid ranging from 10 3 to 10 8 . [The latter graph is disposed above the former graph.] It is seen that he standard calibration curve with background fluorescence correction is located above that without background fluorescence correction.
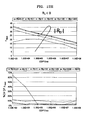
- FIG. 16 shows the effect of background fluorescence intensity correction on the accuracy of the quantification method of the initial concentration of the nucleic acid using the characteristic amplification cycle number n Emax , which is obtained using the standard calibration curve of FIG. 15 .
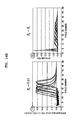
- FIG. 17 is a graph showing an example illustrating the effect of %CV of the characteristic amplification cycle number on the accuracy of quantification of the initial concentration of a nucleic acid.
- PCR, LCR, SDA, NASBA, TMA, RCA, etc. three novel methods for finding the initial concentration of the nucleic acid from the real-time nucleic acid amplification (PCR, LCR, SDA, NASBA, TMA, RCA, etc.) data are described using the characteristic amplification cycle number or time at which the fluorescence intensity of the nucleic acid subtracted by the background fluorescence intensity of the nucleic acid has half of its maximum value, the characteristic amplification cycle number or time at which the amplification efficiency has the maximum or the minimum value, and the prior-to-amplification fluorescence intensity subtracted by the background fluorescence intensity, based on the mathematical model with respect to the correlation between the amplification amount of the nucleic acid and the amplification cycle, without differentiation or integration.
- the amplification efficiency can be obtained and displayed in real time with much less numerical efforts from the real-time nucleic acid amplification data. Therefore, the initial concentration of the nucleic acid can be found more rapidly than other methods.
- the invention can also be embodied as computer readable codes on a computer-readable recording medium.
- the computer-readable recording medium is any data storage device that can store data which can be thereafter read by a computer system. Examples of the computer-readable recording medium include read-only memory (ROM), random-access memory (RAM), CD-ROMs, magnetic tapes, floppy disks, optical data storage devices, and carrier waves (such as data transmission through the Internet).
- ROM read-only memory
- RAM random-access memory
- CD-ROMs compact discs, digital versatile discs, digital versatile discs, digital versatile discs, and Blu-rays, etc.
- magnetic tapes such as magnetic tapes
- floppy disks such as magnetic tapes
- optical data storage devices such as data transmission through the Internet
- carrier waves such as data transmission through the Internet
Landscapes
- Chemical & Material Sciences (AREA)
- Life Sciences & Earth Sciences (AREA)
- Organic Chemistry (AREA)
- Engineering & Computer Science (AREA)
- Zoology (AREA)
- Wood Science & Technology (AREA)
- Proteomics, Peptides & Aminoacids (AREA)
- Health & Medical Sciences (AREA)
- Biophysics (AREA)
- Chemical Kinetics & Catalysis (AREA)
- Immunology (AREA)
- Microbiology (AREA)
- Molecular Biology (AREA)
- Analytical Chemistry (AREA)
- Physics & Mathematics (AREA)
- Biotechnology (AREA)
- Biochemistry (AREA)
- Bioinformatics & Cheminformatics (AREA)
- General Engineering & Computer Science (AREA)
- General Health & Medical Sciences (AREA)
- Genetics & Genomics (AREA)
- Measuring Or Testing Involving Enzymes Or Micro-Organisms (AREA)
- Investigating, Analyzing Materials By Fluorescence Or Luminescence (AREA)
Claims (6)
- Ein Verfahren zum Quantifizieren einer Anfangskonzentration einer Nukleinsäure aus Echtzeit-Nukleinsäure-Amplifikationsdaten, umfassend:Amplifizieren einer Nukleinsäure;Erstellen einer Funktion, die eine Korrelation zwischen einer Fluoreszenzintensität, welche proportional zu einer Menge der Nukleinsäure zunimmt oder abnimmt, und einer Amplifikationszyklusnummer oder einer Amplifikationszeit der Nukleinsäure beschreibt;Verwenden der Funktion zum Berechnen einer charakteristischen Amplifikationszyklusnummer oder einer charakteristischen Amplifikationszeit; undBerechnen der Anfangskonzentration der Nukleinsäure aus der charakteristischen Amplifikationszyklusnummer oder der charakteristischen Amplifikationszeit bei welcher die Fluoreszenzintensität minus einer Hintergrundfluoreszenzintensität die Hälfte ihres maximalen Werts aufweist,wobei die Anfangskonzentration der Nukleinsäure durch Verwenden einer Standard-Eichkurve, welche eine Beziehung zwischen der Anfangskonzentration der Nukleinsäure und der charakteristischen Amplifikationszyklusnummer oder der charakteristischen Amplifikationszeit beschreibt bei welcher die Fluoreszenzintensität minus der Hintergrundfluoreszenzintensität die Hälfte ihres Maximalwerts aufweist, errechnet wird.
- Das Verfahren nach Anspruch 1, wobei die Nukleinsäure durch ein Enzym amplifiziert wird.
- Das Verfahren nach Anspruch 1, wobei die Nukleinsäure unter Verwendung eines Nukleinsäureamplifikationsverfahrens amplifiziert wird, das Temperaturzyklen erfordert.
- Das Verfahren nach Anspruch 1, wobei die Nukleinsäure unter Verwendung eines isothermen Nukleinsäureamplifikationsverfahrens amplifiziert wird.
- Das Verfahren nach einem der Ansprüche 1 bis 4, wobei die Funktion, weiche die Korrelation beschreibt, unter Verwendung eines sigmoidalen Modells erstellt wird.
- Das Verfahren nach Anspruch 5, wobei die charakteristische Amplifikationszyklusnummer oder die charakteristische Amplifikationszeit bei welcher die Fluoreszenzintensität minus der Hintergrundfluoreszenzintensität die Hälfte ihres Maximalwerts aufweist, unter Verwendung einer nicht-linearen Methode der kleinsten Fehlerquadrate in Bezug auf die Funktion, die das sigmoidale Modell verwendet, errechnet wird.
Priority Applications (2)
| Application Number | Priority Date | Filing Date | Title |
|---|---|---|---|
| EP07014693A EP1842925B1 (de) | 2004-09-01 | 2005-09-01 | Verfahren zur Bestimmung einer anfänglichen Nukleinsäurekonzentration anhand von real-time Amplifikationsdaten |
| EP07014684A EP1842924B1 (de) | 2004-09-01 | 2005-09-01 | Verfahren zur Bestimmung einer anfänglichen Nukleinsäurekonzentration anhand von Echtzeit-Nukleinsäure-Verstärkungsdaten |
Applications Claiming Priority (2)
| Application Number | Priority Date | Filing Date | Title |
|---|---|---|---|
| KR20040069560 | 2004-09-01 | ||
| KR1020050030745A KR100738073B1 (ko) | 2004-09-01 | 2005-04-13 | 실시간 핵산 증폭 데이터로부터 초기 핵산 농도를정량화하는 방법 |
Related Child Applications (3)
| Application Number | Title | Priority Date | Filing Date |
|---|---|---|---|
| EP07014693A Division EP1842925B1 (de) | 2004-09-01 | 2005-09-01 | Verfahren zur Bestimmung einer anfänglichen Nukleinsäurekonzentration anhand von real-time Amplifikationsdaten |
| EP07014684A Division EP1842924B1 (de) | 2004-09-01 | 2005-09-01 | Verfahren zur Bestimmung einer anfänglichen Nukleinsäurekonzentration anhand von Echtzeit-Nukleinsäure-Verstärkungsdaten |
| EP07010827 Division | 2007-05-31 |
Publications (3)
| Publication Number | Publication Date |
|---|---|
| EP1632580A2 EP1632580A2 (de) | 2006-03-08 |
| EP1632580A3 EP1632580A3 (de) | 2006-04-05 |
| EP1632580B1 true EP1632580B1 (de) | 2008-07-16 |
Family
ID=36149261
Family Applications (1)
| Application Number | Title | Priority Date | Filing Date |
|---|---|---|---|
| EP05019029A Expired - Lifetime EP1632580B1 (de) | 2004-09-01 | 2005-09-01 | Methode für die Quantifizierung der Ausgangs-Konzentration von Nukleinsäuren ausgehend von real-time Amplifikationsdaten |
Country Status (3)
| Country | Link |
|---|---|
| US (3) | US7698072B2 (de) |
| EP (1) | EP1632580B1 (de) |
| JP (1) | JP4440857B2 (de) |
Families Citing this family (11)
| Publication number | Priority date | Publication date | Assignee | Title |
|---|---|---|---|---|
| FR2904833A1 (fr) * | 2006-08-11 | 2008-02-15 | Bioquanta Sarl | Procede de dosage d'acide nuclieque par fluorescence |
| US8346485B2 (en) | 2008-11-25 | 2013-01-01 | Quest Diagnostics Investments Incorporated | Methods and apparatuses for estimating initial target nucleic acid concentration in a sample by modeling background signal and cycle-dependent amplification efficiency of a polymerase chain reaction |
| US20100248348A1 (en) * | 2009-03-27 | 2010-09-30 | Olympus Corporation | Target nucleic acid measuring apparatus |
| JP2011015620A (ja) * | 2009-07-07 | 2011-01-27 | Olympus Corp | 標的核酸測定方法、標的核酸測定装置、標的核酸測定システム、および、標的核酸測定プログラム |
| ES2653916T3 (es) | 2011-03-08 | 2018-02-09 | Universite Laval | Dispositivo centrípeto fluídico |
| ITMO20120015A1 (it) * | 2012-01-26 | 2013-07-27 | Guescini Michele Proprieta Al 25 | Metodo di perfezionamento per la determinazione quantitativa degli acidi nucleici |
| USD799715S1 (en) | 2015-10-23 | 2017-10-10 | Gene POC, Inc. | Fluidic centripetal device |
| US10510436B2 (en) | 2016-07-05 | 2019-12-17 | Credo Biomedical Pte Ltd. | Using serial dilutions of reference samples to construct a reference table for sigmoidal fitting in real-time PCR copy number analysis |
| JP7221491B2 (ja) * | 2018-09-18 | 2023-02-14 | 株式会社ミズホメディー | 複数の標的核酸を検出するキットを用いる検出方法 |
| CN111426661B (zh) * | 2020-04-09 | 2022-10-18 | 基蛋生物科技股份有限公司 | 一种核酸扩增阶段的荧光数据采集及判别方法 |
| CN116287157A (zh) * | 2023-02-21 | 2023-06-23 | 北京吉因加医学检验实验室有限公司 | 一种确定pcr扩增循环数的方法 |
Family Cites Families (5)
| Publication number | Priority date | Publication date | Assignee | Title |
|---|---|---|---|---|
| US4683195A (en) * | 1986-01-30 | 1987-07-28 | Cetus Corporation | Process for amplifying, detecting, and/or-cloning nucleic acid sequences |
| US4683202A (en) * | 1985-03-28 | 1987-07-28 | Cetus Corporation | Process for amplifying nucleic acid sequences |
| US6303305B1 (en) * | 1999-03-30 | 2001-10-16 | Roche Diagnostics, Gmbh | Method for quantification of an analyte |
| US6691041B2 (en) | 2000-03-31 | 2004-02-10 | Roche Molecular Systems, Inc. | Method for the efficiency-corrected real-time quantification of nucleic acids |
| US6783934B1 (en) * | 2000-05-01 | 2004-08-31 | Cepheid, Inc. | Methods for quantitative analysis of nucleic acid amplification reaction |
-
2005
- 2005-08-26 JP JP2005246323A patent/JP4440857B2/ja not_active Expired - Fee Related
- 2005-09-01 US US11/217,694 patent/US7698072B2/en active Active
- 2005-09-01 EP EP05019029A patent/EP1632580B1/de not_active Expired - Lifetime
-
2010
- 2010-02-22 US US12/709,774 patent/US8340919B2/en not_active Expired - Fee Related
-
2011
- 2011-06-16 US US13/161,788 patent/US8386191B2/en not_active Expired - Lifetime
Also Published As
| Publication number | Publication date |
|---|---|
| US8386191B2 (en) | 2013-02-26 |
| US20110244469A1 (en) | 2011-10-06 |
| EP1632580A3 (de) | 2006-04-05 |
| US20060047443A1 (en) | 2006-03-02 |
| JP4440857B2 (ja) | 2010-03-24 |
| US7698072B2 (en) | 2010-04-13 |
| US20100221728A1 (en) | 2010-09-02 |
| US8340919B2 (en) | 2012-12-25 |
| EP1632580A2 (de) | 2006-03-08 |
| JP2006068011A (ja) | 2006-03-16 |
Similar Documents
| Publication | Publication Date | Title |
|---|---|---|
| US8340919B2 (en) | Method for quantifying initial concentration of nucleic acid from real-time nucleic acid amplification data | |
| EP1842925B1 (de) | Verfahren zur Bestimmung einer anfänglichen Nukleinsäurekonzentration anhand von real-time Amplifikationsdaten | |
| CN102576390B (zh) | 用于量化pcr产物的方法、仪器和计算机程序产品 | |
| US7788039B2 (en) | Quantitation of nucleic acids using growth curves | |
| US7668663B2 (en) | Levenberg-Marquardt outlier spike removal method | |
| CN101710363B (zh) | 通过无方程算法判定实时pcr拐点 | |
| US8321140B2 (en) | Quantification of nucleic acid molecules using multiplex PCR | |
| EP1798650A1 (de) | Analytisches Verfahren und Instrument | |
| US20070111246A1 (en) | Parametric calibration method | |
| CN113707219B (zh) | 用于分析核酸扩增反应的分析方法和系统 | |
| US8185324B2 (en) | Method of determining initial concentration of nucleic acid in sample using real-time amplification data | |
| US20050255483A1 (en) | System and method for smoothing melting curve data | |
| US20060271308A1 (en) | Identifying statistically linear data | |
| CN119943161A (zh) | 对扩增容器进行分类的方法及装置 |
Legal Events
| Date | Code | Title | Description |
|---|---|---|---|
| PUAI | Public reference made under article 153(3) epc to a published international application that has entered the european phase |
Free format text: ORIGINAL CODE: 0009012 |
|
| PUAL | Search report despatched |
Free format text: ORIGINAL CODE: 0009013 |
|
| 17P | Request for examination filed |
Effective date: 20050901 |
|
| AK | Designated contracting states |
Kind code of ref document: A2 Designated state(s): AT BE BG CH CY CZ DE DK EE ES FI FR GB GR HU IE IS IT LI LT LU LV MC NL PL PT RO SE SI SK TR |
|
| AX | Request for extension of the european patent |
Extension state: AL BA HR MK YU |
|
| AK | Designated contracting states |
Kind code of ref document: A3 Designated state(s): AT BE BG CH CY CZ DE DK EE ES FI FR GB GR HU IE IS IT LI LT LU LV MC NL PL PT RO SE SI SK TR |
|
| AX | Request for extension of the european patent |
Extension state: AL BA HR MK YU |
|
| AKX | Designation fees paid |
Designated state(s): DE FR GB |
|
| 17Q | First examination report despatched |
Effective date: 20061212 |
|
| 17Q | First examination report despatched |
Effective date: 20061212 |
|
| GRAP | Despatch of communication of intention to grant a patent |
Free format text: ORIGINAL CODE: EPIDOSNIGR1 |
|
| GRAS | Grant fee paid |
Free format text: ORIGINAL CODE: EPIDOSNIGR3 |
|
| GRAA | (expected) grant |
Free format text: ORIGINAL CODE: 0009210 |
|
| AK | Designated contracting states |
Kind code of ref document: B1 Designated state(s): DE FR GB |
|
| REG | Reference to a national code |
Ref country code: GB Ref legal event code: FG4D |
|
| REF | Corresponds to: |
Ref document number: 602005008146 Country of ref document: DE Date of ref document: 20080828 Kind code of ref document: P |
|
| PLBE | No opposition filed within time limit |
Free format text: ORIGINAL CODE: 0009261 |
|
| STAA | Information on the status of an ep patent application or granted ep patent |
Free format text: STATUS: NO OPPOSITION FILED WITHIN TIME LIMIT |
|
| 26N | No opposition filed |
Effective date: 20090417 |
|
| PGFP | Annual fee paid to national office [announced via postgrant information from national office to epo] |
Ref country code: DE Payment date: 20140818 Year of fee payment: 10 |
|
| PGFP | Annual fee paid to national office [announced via postgrant information from national office to epo] |
Ref country code: GB Payment date: 20140819 Year of fee payment: 10 |
|
| PGFP | Annual fee paid to national office [announced via postgrant information from national office to epo] |
Ref country code: FR Payment date: 20141117 Year of fee payment: 10 |
|
| REG | Reference to a national code |
Ref country code: DE Ref legal event code: R119 Ref document number: 602005008146 Country of ref document: DE |
|
| GBPC | Gb: european patent ceased through non-payment of renewal fee |
Effective date: 20150901 |
|
| REG | Reference to a national code |
Ref country code: FR Ref legal event code: ST Effective date: 20160531 |
|
| PG25 | Lapsed in a contracting state [announced via postgrant information from national office to epo] |
Ref country code: DE Free format text: LAPSE BECAUSE OF NON-PAYMENT OF DUE FEES Effective date: 20160401 Ref country code: GB Free format text: LAPSE BECAUSE OF NON-PAYMENT OF DUE FEES Effective date: 20150901 |
|
| PG25 | Lapsed in a contracting state [announced via postgrant information from national office to epo] |
Ref country code: FR Free format text: LAPSE BECAUSE OF NON-PAYMENT OF DUE FEES Effective date: 20150930 |