EP1609091B1 - Method and system for analysis of compounds - Google Patents
Method and system for analysis of compounds Download PDFInfo
- Publication number
- EP1609091B1 EP1609091B1 EP04722582.6A EP04722582A EP1609091B1 EP 1609091 B1 EP1609091 B1 EP 1609091B1 EP 04722582 A EP04722582 A EP 04722582A EP 1609091 B1 EP1609091 B1 EP 1609091B1
- Authority
- EP
- European Patent Office
- Prior art keywords
- profile
- spike
- cellular network
- compound
- data
- Prior art date
- Legal status (The legal status is an assumption and is not a legal conclusion. Google has not performed a legal analysis and makes no representation as to the accuracy of the status listed.)
- Expired - Lifetime
Links
- 150000001875 compounds Chemical class 0.000 title claims description 62
- 238000004458 analytical method Methods 0.000 title claims description 30
- 238000000034 method Methods 0.000 title claims description 27
- 230000001413 cellular effect Effects 0.000 claims description 44
- 239000013598 vector Substances 0.000 claims description 24
- 230000000694 effects Effects 0.000 claims description 22
- 230000008859 change Effects 0.000 claims description 9
- 238000007621 cluster analysis Methods 0.000 claims description 3
- 238000000151 deposition Methods 0.000 claims description 2
- 238000012360 testing method Methods 0.000 description 49
- 230000004044 response Effects 0.000 description 20
- 231100000765 toxin Toxicity 0.000 description 13
- 239000003053 toxin Substances 0.000 description 13
- 108700012359 toxins Proteins 0.000 description 13
- 238000003860 storage Methods 0.000 description 10
- 239000003814 drug Substances 0.000 description 9
- 238000005259 measurement Methods 0.000 description 9
- 230000008569 process Effects 0.000 description 9
- 229940079593 drug Drugs 0.000 description 8
- 238000011084 recovery Methods 0.000 description 8
- 241000894007 species Species 0.000 description 8
- 210000004413 cardiac myocyte Anatomy 0.000 description 7
- 210000004027 cell Anatomy 0.000 description 7
- 230000010412 perfusion Effects 0.000 description 7
- 238000005070 sampling Methods 0.000 description 7
- 238000001514 detection method Methods 0.000 description 6
- VZFRNCSOCOPNDB-AJKFJWDBSA-N domoic acid Chemical compound OC(=O)[C@@H](C)\C=C\C=C(/C)[C@H]1CN[C@H](C(O)=O)[C@H]1CC(O)=O VZFRNCSOCOPNDB-AJKFJWDBSA-N 0.000 description 6
- VZFRNCSOCOPNDB-UHFFFAOYSA-N domoic acid Natural products OC(=O)C(C)C=CC=C(C)C1CNC(C(O)=O)C1CC(O)=O VZFRNCSOCOPNDB-UHFFFAOYSA-N 0.000 description 6
- VZFRNCSOCOPNDB-OXYNIABMSA-N isodomoic acid D Natural products CC(C=C/C=C(/C)C1CNC(C1CC(=O)O)C(=O)O)C(=O)O VZFRNCSOCOPNDB-OXYNIABMSA-N 0.000 description 6
- 238000012545 processing Methods 0.000 description 6
- 230000002123 temporal effect Effects 0.000 description 6
- 238000012935 Averaging Methods 0.000 description 5
- 230000003595 spectral effect Effects 0.000 description 5
- 239000012981 Hank's balanced salt solution Substances 0.000 description 4
- 230000036982 action potential Effects 0.000 description 4
- 238000013459 approach Methods 0.000 description 4
- 238000006243 chemical reaction Methods 0.000 description 4
- NOESYZHRGYRDHS-UHFFFAOYSA-N insulin Chemical compound N1C(=O)C(NC(=O)C(CCC(N)=O)NC(=O)C(CCC(O)=O)NC(=O)C(C(C)C)NC(=O)C(NC(=O)CN)C(C)CC)CSSCC(C(NC(CO)C(=O)NC(CC(C)C)C(=O)NC(CC=2C=CC(O)=CC=2)C(=O)NC(CCC(N)=O)C(=O)NC(CC(C)C)C(=O)NC(CCC(O)=O)C(=O)NC(CC(N)=O)C(=O)NC(CC=2C=CC(O)=CC=2)C(=O)NC(CSSCC(NC(=O)C(C(C)C)NC(=O)C(CC(C)C)NC(=O)C(CC=2C=CC(O)=CC=2)NC(=O)C(CC(C)C)NC(=O)C(C)NC(=O)C(CCC(O)=O)NC(=O)C(C(C)C)NC(=O)C(CC(C)C)NC(=O)C(CC=2NC=NC=2)NC(=O)C(CO)NC(=O)CNC2=O)C(=O)NCC(=O)NC(CCC(O)=O)C(=O)NC(CCCNC(N)=N)C(=O)NCC(=O)NC(CC=3C=CC=CC=3)C(=O)NC(CC=3C=CC=CC=3)C(=O)NC(CC=3C=CC(O)=CC=3)C(=O)NC(C(C)O)C(=O)N3C(CCC3)C(=O)NC(CCCCN)C(=O)NC(C)C(O)=O)C(=O)NC(CC(N)=O)C(O)=O)=O)NC(=O)C(C(C)CC)NC(=O)C(CO)NC(=O)C(C(C)O)NC(=O)C1CSSCC2NC(=O)C(CC(C)C)NC(=O)C(NC(=O)C(CCC(N)=O)NC(=O)C(CC(N)=O)NC(=O)C(NC(=O)C(N)CC=1C=CC=CC=1)C(C)C)CC1=CN=CN1 NOESYZHRGYRDHS-UHFFFAOYSA-N 0.000 description 4
- 235000015170 shellfish Nutrition 0.000 description 4
- 238000001228 spectrum Methods 0.000 description 4
- UCSJYZPVAKXKNQ-HZYVHMACSA-N streptomycin Chemical compound CN[C@H]1[C@H](O)[C@@H](O)[C@H](CO)O[C@H]1O[C@@H]1[C@](C=O)(O)[C@H](C)O[C@H]1O[C@@H]1[C@@H](NC(N)=N)[C@H](O)[C@@H](NC(N)=N)[C@H](O)[C@H]1O UCSJYZPVAKXKNQ-HZYVHMACSA-N 0.000 description 4
- 239000000126 substance Substances 0.000 description 4
- 208000004891 Shellfish Poisoning Diseases 0.000 description 3
- 230000006399 behavior Effects 0.000 description 3
- 238000004113 cell culture Methods 0.000 description 3
- 239000006285 cell suspension Substances 0.000 description 3
- 230000001054 cortical effect Effects 0.000 description 3
- 238000013480 data collection Methods 0.000 description 3
- 230000007613 environmental effect Effects 0.000 description 3
- 230000005484 gravity Effects 0.000 description 3
- 238000011835 investigation Methods 0.000 description 3
- 238000012216 screening Methods 0.000 description 3
- 239000000758 substrate Substances 0.000 description 3
- 210000001519 tissue Anatomy 0.000 description 3
- 238000012546 transfer Methods 0.000 description 3
- 241000238631 Hexapoda Species 0.000 description 2
- 102000004877 Insulin Human genes 0.000 description 2
- 108090001061 Insulin Proteins 0.000 description 2
- ZDXPYRJPNDTMRX-VKHMYHEASA-N L-glutamine Chemical compound OC(=O)[C@@H](N)CCC(N)=O ZDXPYRJPNDTMRX-VKHMYHEASA-N 0.000 description 2
- 229930182816 L-glutamine Natural products 0.000 description 2
- 229930182555 Penicillin Natural products 0.000 description 2
- JGSARLDLIJGVTE-MBNYWOFBSA-N Penicillin G Chemical compound N([C@H]1[C@H]2SC([C@@H](N2C1=O)C(O)=O)(C)C)C(=O)CC1=CC=CC=C1 JGSARLDLIJGVTE-MBNYWOFBSA-N 0.000 description 2
- 102000004338 Transferrin Human genes 0.000 description 2
- 108090000901 Transferrin Proteins 0.000 description 2
- 102000004142 Trypsin Human genes 0.000 description 2
- 108090000631 Trypsin Proteins 0.000 description 2
- 238000003556 assay Methods 0.000 description 2
- 230000003542 behavioural effect Effects 0.000 description 2
- 230000003915 cell function Effects 0.000 description 2
- 230000036978 cell physiology Effects 0.000 description 2
- 210000003850 cellular structure Anatomy 0.000 description 2
- 239000002537 cosmetic Substances 0.000 description 2
- 238000010586 diagram Methods 0.000 description 2
- 230000000763 evoking effect Effects 0.000 description 2
- 238000000605 extraction Methods 0.000 description 2
- 230000006870 function Effects 0.000 description 2
- 210000005003 heart tissue Anatomy 0.000 description 2
- 229940125396 insulin Drugs 0.000 description 2
- 230000003993 interaction Effects 0.000 description 2
- 238000004519 manufacturing process Methods 0.000 description 2
- 239000011159 matrix material Substances 0.000 description 2
- 210000002569 neuron Anatomy 0.000 description 2
- 229940049954 penicillin Drugs 0.000 description 2
- 229940082569 selenite Drugs 0.000 description 2
- MCAHWIHFGHIESP-UHFFFAOYSA-L selenite(2-) Chemical compound [O-][Se]([O-])=O MCAHWIHFGHIESP-UHFFFAOYSA-L 0.000 description 2
- 229960005322 streptomycin Drugs 0.000 description 2
- 239000006228 supernatant Substances 0.000 description 2
- 239000012581 transferrin Substances 0.000 description 2
- 239000012588 trypsin Substances 0.000 description 2
- XLYOFNOQVPJJNP-UHFFFAOYSA-N water Substances O XLYOFNOQVPJJNP-UHFFFAOYSA-N 0.000 description 2
- IVVNZDGDKPTYHK-JTQLQIEISA-N 1-cyano-2-[(2s)-3,3-dimethylbutan-2-yl]-3-pyridin-4-ylguanidine Chemical compound CC(C)(C)[C@H](C)N=C(NC#N)NC1=CC=NC=C1 IVVNZDGDKPTYHK-JTQLQIEISA-N 0.000 description 1
- 206010001497 Agitation Diseases 0.000 description 1
- OYPRJOBELJOOCE-UHFFFAOYSA-N Calcium Chemical compound [Ca] OYPRJOBELJOOCE-UHFFFAOYSA-N 0.000 description 1
- 102000016911 Deoxyribonucleases Human genes 0.000 description 1
- 108010053770 Deoxyribonucleases Proteins 0.000 description 1
- 108090000790 Enzymes Proteins 0.000 description 1
- 102000004190 Enzymes Human genes 0.000 description 1
- 102000016359 Fibronectins Human genes 0.000 description 1
- 108010067306 Fibronectins Proteins 0.000 description 1
- 241000282412 Homo Species 0.000 description 1
- 238000012351 Integrated analysis Methods 0.000 description 1
- JVTAAEKCZFNVCJ-UHFFFAOYSA-M Lactate Chemical compound CC(O)C([O-])=O JVTAAEKCZFNVCJ-UHFFFAOYSA-M 0.000 description 1
- 241001465754 Metazoa Species 0.000 description 1
- 241000237509 Patinopecten sp. Species 0.000 description 1
- 208000005374 Poisoning Diseases 0.000 description 1
- HATRDXDCPOXQJX-UHFFFAOYSA-N Thapsigargin Natural products CCCCCCCC(=O)OC1C(OC(O)C(=C/C)C)C(=C2C3OC(=O)C(C)(O)C3(O)C(CC(C)(OC(=O)C)C12)OC(=O)CCC)C HATRDXDCPOXQJX-UHFFFAOYSA-N 0.000 description 1
- 238000009825 accumulation Methods 0.000 description 1
- 230000003321 amplification Effects 0.000 description 1
- QVGXLLKOCUKJST-UHFFFAOYSA-N atomic oxygen Chemical compound [O] QVGXLLKOCUKJST-UHFFFAOYSA-N 0.000 description 1
- 230000035559 beat frequency Effects 0.000 description 1
- 230000009286 beneficial effect Effects 0.000 description 1
- 230000008238 biochemical pathway Effects 0.000 description 1
- 239000003124 biologic agent Substances 0.000 description 1
- 230000004071 biological effect Effects 0.000 description 1
- 239000008280 blood Substances 0.000 description 1
- 210000004369 blood Anatomy 0.000 description 1
- RYYVLZVUVIJVGH-UHFFFAOYSA-N caffeine Chemical compound CN1C(=O)N(C)C(=O)C2=C1N=CN2C RYYVLZVUVIJVGH-UHFFFAOYSA-N 0.000 description 1
- 229910052791 calcium Inorganic materials 0.000 description 1
- 239000011575 calcium Substances 0.000 description 1
- 230000036755 cellular response Effects 0.000 description 1
- 108091008690 chemoreceptors Proteins 0.000 description 1
- OEYIOHPDSNJKLS-UHFFFAOYSA-N choline Chemical compound C[N+](C)(C)CCO OEYIOHPDSNJKLS-UHFFFAOYSA-N 0.000 description 1
- 229960001231 choline Drugs 0.000 description 1
- 238000010367 cloning Methods 0.000 description 1
- 230000001143 conditioned effect Effects 0.000 description 1
- 230000001186 cumulative effect Effects 0.000 description 1
- 238000007405 data analysis Methods 0.000 description 1
- 238000013481 data capture Methods 0.000 description 1
- 238000013500 data storage Methods 0.000 description 1
- 230000008021 deposition Effects 0.000 description 1
- 238000013461 design Methods 0.000 description 1
- 238000011161 development Methods 0.000 description 1
- 230000009699 differential effect Effects 0.000 description 1
- 201000010099 disease Diseases 0.000 description 1
- 208000037265 diseases, disorders, signs and symptoms Diseases 0.000 description 1
- 238000007877 drug screening Methods 0.000 description 1
- 238000005516 engineering process Methods 0.000 description 1
- 231100000317 environmental toxin Toxicity 0.000 description 1
- 230000001787 epileptiform Effects 0.000 description 1
- 238000002474 experimental method Methods 0.000 description 1
- 238000001914 filtration Methods 0.000 description 1
- 230000037406 food intake Effects 0.000 description 1
- 230000004927 fusion Effects 0.000 description 1
- 239000001963 growth medium Substances 0.000 description 1
- 210000002064 heart cell Anatomy 0.000 description 1
- 230000000971 hippocampal effect Effects 0.000 description 1
- 230000002401 inhibitory effect Effects 0.000 description 1
- 238000003780 insertion Methods 0.000 description 1
- 230000037431 insertion Effects 0.000 description 1
- 238000009434 installation Methods 0.000 description 1
- 230000003834 intracellular effect Effects 0.000 description 1
- 230000007774 longterm Effects 0.000 description 1
- 239000000463 material Substances 0.000 description 1
- 230000007246 mechanism Effects 0.000 description 1
- 239000012528 membrane Substances 0.000 description 1
- 238000012544 monitoring process Methods 0.000 description 1
- 230000001386 multineuronal effect Effects 0.000 description 1
- 210000000653 nervous system Anatomy 0.000 description 1
- 230000001537 neural effect Effects 0.000 description 1
- 238000003199 nucleic acid amplification method Methods 0.000 description 1
- 229910052760 oxygen Inorganic materials 0.000 description 1
- 239000001301 oxygen Substances 0.000 description 1
- 238000012856 packing Methods 0.000 description 1
- 230000037361 pathway Effects 0.000 description 1
- 239000002572 performance enhancing substance Substances 0.000 description 1
- 229960002310 pinacidil Drugs 0.000 description 1
- 231100000572 poisoning Toxicity 0.000 description 1
- 230000000607 poisoning effect Effects 0.000 description 1
- 238000012805 post-processing Methods 0.000 description 1
- 238000002360 preparation method Methods 0.000 description 1
- 238000004886 process control Methods 0.000 description 1
- 239000000047 product Substances 0.000 description 1
- 230000001902 propagating effect Effects 0.000 description 1
- 238000011002 quantification Methods 0.000 description 1
- 238000010223 real-time analysis Methods 0.000 description 1
- 108020003175 receptors Proteins 0.000 description 1
- 238000009781 safety test method Methods 0.000 description 1
- 235000020637 scallop Nutrition 0.000 description 1
- 230000035945 sensitivity Effects 0.000 description 1
- 238000000926 separation method Methods 0.000 description 1
- 239000000243 solution Substances 0.000 description 1
- 238000000638 solvent extraction Methods 0.000 description 1
- 230000000638 stimulation Effects 0.000 description 1
- 239000000725 suspension Substances 0.000 description 1
- IXFPJGBNCFXKPI-FSIHEZPISA-N thapsigargin Chemical compound CCCC(=O)O[C@H]1C[C@](C)(OC(C)=O)[C@H]2[C@H](OC(=O)CCCCCCC)[C@@H](OC(=O)C(\C)=C/C)C(C)=C2[C@@H]2OC(=O)[C@@](C)(O)[C@]21O IXFPJGBNCFXKPI-FSIHEZPISA-N 0.000 description 1
- 231100000331 toxic Toxicity 0.000 description 1
- 230000002588 toxic effect Effects 0.000 description 1
- 231100000041 toxicology testing Toxicity 0.000 description 1
- 210000002700 urine Anatomy 0.000 description 1
- 230000000007 visual effect Effects 0.000 description 1
Images


Classifications
-
- G—PHYSICS
- G16—INFORMATION AND COMMUNICATION TECHNOLOGY [ICT] SPECIALLY ADAPTED FOR SPECIFIC APPLICATION FIELDS
- G16C—COMPUTATIONAL CHEMISTRY; CHEMOINFORMATICS; COMPUTATIONAL MATERIALS SCIENCE
- G16C20/00—Chemoinformatics, i.e. ICT specially adapted for the handling of physicochemical or structural data of chemical particles, elements, compounds or mixtures
- G16C20/70—Machine learning, data mining or chemometrics
-
- G—PHYSICS
- G16—INFORMATION AND COMMUNICATION TECHNOLOGY [ICT] SPECIALLY ADAPTED FOR SPECIFIC APPLICATION FIELDS
- G16C—COMPUTATIONAL CHEMISTRY; CHEMOINFORMATICS; COMPUTATIONAL MATERIALS SCIENCE
- G16C20/00—Chemoinformatics, i.e. ICT specially adapted for the handling of physicochemical or structural data of chemical particles, elements, compounds or mixtures
- G16C20/50—Molecular design, e.g. of drugs
Definitions
- the present invention relates to the analysis of compounds, particularly, although not exclusively chemical compounds utilised in the healthcare, pharmaceutical, cosmetic and environmental sectors.
- the target is then screened in a series of tests against these compounds with a view to eliminating those compounds which are unsuitable and to identify those compounds that are potentially valuable. It is sometimes the case that there may be sufficient biostructural information on the molecular target to suggest the design of potentially valuable compounds. Even so, for the most part hundreds of thousands of compounds are typically screened using robotic technology. Typically, the entire process from initial selection of a target through to the identification of candidate compounds can take several years.
- the patent discloses a relatively unsophisticated analysis mechanism based on interpreting the power spectral density (PSD) of a cellular response.
- PSD power spectral density
- a compound analysis method comprises determining a vector having a number of dimensions equal to a number of features derived from the electrical output of an electrically active cellular network, with each component of said vector being representative of a change in said feature resulting from the application of a compound to said electrically active cellular network and classifying said vector in accordance with a predetermined cluster analysis methodology.
- cellular activity When stimulated, cellular activity may change.
- the stimulus By analysing the changes in the signal and comparing with a library of pre-determined behavioural features, the stimulus can be characterised and/or the impact on the cellular network quantified.
- signal features can be related to molecular events occurring within the cellular structure. Such features may be electrical, chemical or fluorescent in nature, the requirement being that a suitable transducer is provided.
- a compound analysis system comprising a micro-electrode array provided by a bio-compatible
- a substrate having a plurality of electrodes situated thereon, said electrodes having an arrangement on said substrate corresponding substantially to that of an electrically active cellular network disposable in use thereon a multi-channel amplifier coupled to said electrodes and an analyser operatively connected to said amplifier to determine for each active channel a vector quantity having a number of dimensions equal to a number of features derived from the electrical output of said electrically active cellular network with each component of said vector being representative of a change in said feature.
- the system may be used for the testing of blood/ urine samples for drugs.
- a particular application may be to test for performance enhancing drugs in athletes or for patient compliance.
- the delivery of a compound to the system may be placed under the control of a perfusion system.
- a perfusion system By utilising such a perfusion system it is possible to be more confident that accurate delivery of a compound, such as a drug takes place.
- a perfusion system allows correct and potentially varying doses of the drug, to be delivered at a know time. Furthermore, the perfusion system may ensure that the drug is added at the correct temperature with a controlled and smooth delivery.
- the system is particularly suitable for the needs of the pharmaceutical market, in that it may identify and quantify behavioural changes in the cellular structure when exposed to external stimuli.
- post-processing activities could include comparison with a pre-determined library of responses to identify the stimulator, or a simple output to determine whether the reaction falls within acceptable limits
- a compound analysis apparatus including a processor and a memory, the processor being operable in response to signals derived from a micro-electrode array connected, in use, thereto, to determine a vector quantity having a number of dimensions equal to a number of features derived from the electrical output of said micro-electrode array with each component of said vector being representative of a change in said feature, wherein said memory contains a library of features characterising known compounds such that classification of said vector enables identification of a compound deposited, in use, on said array, in accordance with a predetermined measure of statistical reliability.
- the signals derived from the micro-electrode array although electrical in nature may originate from not only electrical activity but also other changes in the physical characteristics of a cellular network deposited, in use, on the array.
- a transducer on or in proximity to the array is capable of providing electrical signal representative of the characteristics being monitored.
- a sensor for compound detection comprising a receptacle for a micro-electrode array, said receptacle having a connector for receiving electrical signals from said array when received in said receptacle, an amplifier for amplifying said signals and a processor, the processor being operable in response to said signals to determine a vector quantity having a number of dimensions equal to a number of features derived from the electrical output of said micro-electrode array with each component of said vector being representative of a change in said feature.
- Such a sensor may be packaged to suit a variety of applications such as, but not exclusively, water quality analysis, environmental monitoring and process control in, for example, the production of pharmaceuticals, cosmetics, foodstuffs and the like.
- any change in cellular behaviour can be identified and quantified. Such changes may be induced through exposure to a stimulus.
- the stimulus would be in the form of a chemical compound.
- an automated perfusion system may facilitate delivery of drug compounds to the cellular network in a smooth and controlled manner.
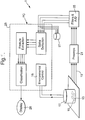
- an analysis system 1 in which an MEA 3 (see Figure 2 ) provides a site onto which a cellular network is deposited.
- the nature of the cellular network is described in respect of a particular example below, namely a network made up of a plurality of cardio-myocytes.
- this particular example of a cellular network is purely exemplary and any reference to cellular network should not be taken to mean purely the example 5 cited herein.
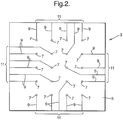
- the MEA 3 comprises a bio-compatible substrate 5 on which are surface mounted a plurality of electrodes 7 each of which is connected by traces 9 to an edge connector 11.
- the MEA 3 is insertable within a receptacle 13 formed at the bottom of a well 15.
- the receptacle 13 is provided with contacts for the edge connector 11.
- the well 15 is hermetically sealed and forms the environment or chamber 17 within which a compound is analysed.
- the chamber is itself connected via a ribbon connector 19 to the input of an amplifier unit 21.
- the combination of the edge connector 11 and receptacle 13 provides for easy insertion and removal of MEAs 3 for analysis of different compounds.
- Figure 2 illustrates a square array made up of equidistant electrodes
- alternative array layouts are contemplated having, for example, non-uniform electrode pitch and layout.
- the adoption of a particular layout is predicated on the requirement that an electrode 7 should be capable of detecting electrical activity from a single cell in a network when arranged on the MEA 3.
- the packing or form factor of the MEA 3 must be such that it can be correctly and easily inserted and removed from the receptacle 13 in the well 15.
- the amplifier unit 21 is a multichannel device capable of providing a gain of around 1000 to each channel. Typically, sufficient channels are available to allow each electrode 7 of the MEA 3 to be mapped to a channel. Depending on the configuration of the MEA 3 there may be need for more or less channels for satisfactory data collection.
- the amplifier unit 21 itself is interfaced to a PC -based data acquisition system 23.
- the PC system 23 incorporates an Analogue to Digital conversion card 25 coupled via a PCI bus to a central processor unit.
- the card 25 provides the external connections necessary to interface the analogue output of the amplifier 21 to the acquisition system 23.
- the card 25 is capable of sampling the amplified channel data from the amplifier unit 21 at up to 50 kHz/channel.
- the central processor unit carries out instructions provided by software and/or firmware necessary to analyse the digitised data.
- the data may be analysed in real time as events occur on the MEA 3 or retrieved later from a storage device 27 such as a hard disk. In the former case, the storage device 27 may still be utilised to archive the data for later repeated or further analysis.
- the ability to proceed with real time as opposed to or off-line analysis will in some part depend on the rate at which data is generated and the storage capacity of the system 23.
- the nature of the cellular network placed on the MEA 3 determines the sampling rate.
- the software and/or firmware is provided with logic to enable the system 23 to operate at an optimum sampling rate for the particular cellular network taking into account any limitations of processor speed and storage capacity.
- activity may occur relatively slowly over a 100mS window whereas in the case of neurones, activity may be present in much shorter windows of around 15 to 25mS.
- a relatively lower sampling rate may be adopted by the system 23, with the relevant control signals being provided to the Analogue to Digital Converter 25, than is needed for equivalent resolution of detail in the data derived from a neurone network.
- the PC system 23 is provided with a VDU 29 and printer for the presentation of results.
- each analogue channel which, in the example whose preparation is described below, namely a cardio-myocyte cellular network, has a pre-amplification value of around 100microvolts to 2 millivolts.
- the output from the electrodes 7 on the MEA 3 is an analogue signal.
- the rate at which the analogue signal is sampled must be selected to be high enough to ensure that all the features of interest in the electrical activity of a cellular network deposited on the MEA 3 are available to the digital signal processing unit.
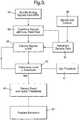
- the signals are amplified 31 and, the analogue signal from each electrode 7 is conditioned 33, in this case by low pass-filtering to remove unwanted high-frequency components.
- the filtered analogue signal on each channel is sampled 35 at a rate which may be as much as 50kHz the actual rate 37 depending 39 on the nature of the cellular network placed on the MEA 3. In the case of a cardio-myocyte network, an effective sampling rate has been found to be 10kHz.
- data may be stored as a series of 'cutouts' of the electrical activity from the cardiac myocyte cells.
- Each cellular event stored as a 'cut-out' is determined by setting 41 a threshold level (usually a positive value) of at least 2 root-mean-square values of the noise above the baseline.
- a time stamp is recorded at the point at which the threshold level is crossed 43.
- electrode raw data 15msec before and 85msec after the threshold level has been crossed is stored. Data is saved to a file on the hard disk in a .mcd file format (approximately 10Mb per electrode for a 60 second recording).
- the data stored on the hard disk is representative of the changes in electrical activity that occur within a cellular network and are typically in the form of action potentials or spikes. As will be described further below changes occur to the shape of the spikes and their temporal and spatial pattern when a compound is introduced to a cellular network.
- the electrical activity data from the cellular network is analysed in software by imposing temporal and spatial information onto a model of the electrode array. In this way, both local and global properties of the electrical activity across the tissue sample can be identified and quantified. Examples of local properties are the peak height, amplitude or depolarisation time of an action potential detected at an individual electrode. Examples of global properties are the beat frequency and propagation speed of action potentials across the culture. These various properties are referred to as features.
- the process of feature extraction 47 may then be performed on this digitised data.
- the features themselves may be used to reduce the requirements for data storage.
- the spikes can first be identified using a threshold detector, catalogued and stored, the rest of the data being ignored. Since the temporal length of a spike is typically much less than the time separation between spikes this procedure requires less storage capacity.
- Mean Spike Rate the number of spikes observed in a channel divided by the record length.
- the mean spike rate feature may be updated every minute or few minutes rather than over the whole course of an experiment.
- Spike Rate Variability calculated from the time differences between consecutive spikes, averaged over all channels.
- Spike Speed the propagation speed of the spike pulse across the MEA plate, calculated for each pulse from the spike time arrivals at each selected channel using a least mean squares fit to the data on the assumption of a single plane wave pulse propagating with constant speed.
- Peak Level the relative increase between control and test data in the maximum level of the spike profile averaged over all spikes and all selected channels.
- Trough Level the relative increase between control and test data in the minimum level of the spike profile averaged over all spikes and all selected channels.
- Peak-to-Trough Level the relative increase in the range of spike profile averaged over all spikes and all selected channels.
- Peak-to-Trough Time the relative increase in the time between the maximum level and the minimum level in a spike profile, averaged over all spikes and all selected channels.
- Increase in variance of wavelet transform the relative increase in the variance of the wavelet transform values of the spike profile, summed over scale and time delay, averaged over all spikes and all selected channels.
- Wavelet cross-correlation coefficient the normalised cross-correlation in scale and time delay between the wavelet transforms of the control and test spike profiles, averaged over all spikes and all selected channels.
- Increase in profile entropy the relative increase in the entropy of the spike profile as determined from its histogram, averaged over all spikes and all selected channels.
- Instantaneous Spike Rate the relative increase between control and test data in the instantaneous spike rate averaged over all selected channels.
- Instantaneous Spike Rate Variability the relative increase between control and test data in the temporal variability of the instantaneous spike rate.
- Spike Speed the relative increase between control and test data in propagation speed of the spike pulse across the MEA plate, calculated for each pulse from the spike time arrivals recorded at each selected each channel.
- Spike Speed Variability the relative increase between control and test data in the temporal variability of the spike speed.
- Peak Level the relative increase between control and test data in the maximum value in the averaged spike profile obtained by averaging the profiles of all the spikes in each selected channel.
- Trough Level the relative increase between control and test data in the minimum value in the averaged spike profile obtained by averaging the profiles of all the spikes in each selected channel.
- Peak-to-Trough Level the relative increase between control and test data in difference between the maximum and minimum values in the averaged spike profile obtained by averaging the profiles of all the spikes in each selected channel.
- Absolute Peak Level the relative increase between control and test data in the maximum value in the absolute averaged spike profile obtained by averaging the profiles of all the spikes in each selected channel.
- Peak-to-Trough Time the increase between control and test data in the time between the maximum level and the minimum level in the averaged spike profile.
- Profile decay rate the increase between control and test data in the decay rate of the tail of the averaged profile.
- Absolute Profile Area the relative increase between control and test data in the area under the modulus of the avaereged profile.
- Profile Rise Area the relative increase between control and test data in the area under the averaged profile between the start and the maximum value.
- Absolute Profile Recovery Area the relative increase between control and test data in the area under the modulus of the averaged profile between the minimum value and the end.
- Profile turning moment - the relative increase between control and test data of the temporal turning moment of the averaged profile.
- Absolute profile centre of gravity the relative increase between control and test data of the centre of gravity of the absolute averaged profile.
- Absolute profile radius of gyration the relative increase between control and test data of the radius of gyration of the absolute averaged profile measured about its centre of gravity.
- Amplitude Variance the relative increase between control and test data in the variance of the averaged spike profile.
- Maximum spectral value the relative increase between control and test data in the maximum value of the power spectrum of the averaged spike profile.
- Frequency of maximum spectral value the relative increase between control and test data in the frequency of the maximum value of the power spectrum of the averaged spike profile.
- Amplitude Variance in Frequency Band 1 the relative increase between control and test data in the variance of the averaged spike profile, normalised by the total variance, in the frequency band 0-250 Hz.
- Amplitude Variance in Frequency Band 2 the relative increase between control and test data in the variance of the averaged spike profile, normalised by the total variance, in the frequency band 250-500 Hz.
- Amplitude Variance in Frequency Band 3 the relative increase between control and test data in the variance of the averaged spike profile, normalised by the total variance, in the frequency band 500-750 Hz.
- Amplitude Variance in Frequency Band 4 the relative increase between control and test data in the variance of the averaged spike profile, normalised by the total variance, in the frequency band 750-1000 Hz.
- Amplitude Variance in Band 2 / Band 1 the relative increase between control and test data in the ratio of the variances in bands 2 and 1 in the spectrum of the averaged spike profile.
- Amplitude Variance in Band 3 / Band 2 the relative increase between control and test data in the ratio of the variances in bands 3 and 2 in the spectrum of the averaged spike profile.
- Amplitude Correlation Coefficient the normalised cross-correlation between the averaged control and averaged test spike profiles.
- Amplitude Skewness (normalied) - the relative increase between control and test data in the skewness, normalised with respect to the total variance, of the averaged spike profile.
- Amplitude Kurtosis (normalied) - the relative increase between control and test data in the kurtosis, normalised with respect to the total variance, of the averaged spike profile.
- Entropy of profile the relative increase between control and test data in the entropy of the averaged spike profile as determined from its histogram.
- Entropy of absolute profile the relative increase between control and test data in the entropy of the absolute averaged spike profile as determined from its histogram.
- Maximum wavelet transform coefficient the relative increase between control and test data in the maximum value over scale and time delay of the wavelet transform of the averaged spike profile, using a Daubechies wavelet of order 2 here and below.
- Variance of wavelet transform the relative increase between control and test data in the variance of the wavelet transform values of the averaged spike profile, summed over scale and time delay.
- Wavelet transform transfer coefficient - wavelet cross-correlation coefficient normalised by the autocorrelation of the wavelet transform of the control data.
- Variance of wavelet transform ridge values the relative increase between control and test data in the variance of the vector of wavelet transform values of the averaged spike profile obtained by taking the maximum value at each scale.
- Figure 7 exemplifies the results of a feature set analysis in a matrix format for a set of different compounds aetyl choline I, cafeine II, pinacidil III, salubutamol IV and drug C V, such as might result from carrying out activities set out in the examples below.
- the numerals 100 beneath the columns are indicative of respective features in a feature set and the level of shading of the boxes indicates the nature of the response. Results from a control VI are shown separately.
- Figure 8 shows the outcome of plotting the results of a feature set as a vector quantity in three-dimensional space for the compounds of Figure 7 where clustering of the results is evident for each of the compounds identified by their respective reference numerals.
- the sequence of activities necessary to analyse a compound is set out below. These activities are a combination of physical processes taken in relation to the deposition of a cellular network on the MEA and the compound to be tested together with signal processing activity which is carried out utilising the PC-based system 23. Firstly a cellular network is cultured and deposited on the MEA 3. An example of the steps required in this regard using cardio-myocyte cells is as follows:
- the cell suspension is deposited on the MEA 3 such that each electrode 7 is in contact with a respective cell.
- the MEA 3 is inserted within the receptacle 13 in the well 15 such that a set of baseline measurements may be recorded. Accordingly, the analogue output from the electrodes 7 is amplified 31, filtered 33 and stored 45 utilising the equipment and methodology set out above. Throughout this baseline assessment stage and subsequently during the analysis of a compound, it is desirable to maintain the cell culture conditions substantially constant.
- the environment is monitored utilising sensors deployed in the cell culture chamber 17 encompassing the MEA.
- the sensor output is monitored by a software module 18 running on the PC-based data acquisition system 23 or it may be monitored independently. In either case, the signals received form the sensor are employed to adjust environmental controls.
- the parameters which may be monitored could include temperature, pH and dissolved oxygen concentration of the culture medium.
- the recording process for the baseline measurements is performed for each data channel corresponding to an electrode 7.
- a set of so-called healthy channels is identified as follows by identifying the set of channels with the most frequently occurring non-zero number of spikes.
- a compound to be analysed is then introduced to the cellular network covering the MEA 3. This may be applied directly to the network on the MEA 3 used for baseline assessment or a further equivalent sample of cultured network may be prepared on a further MEA 3 and inserted in the receptacle 13 in the well 15 in its place.
- a set of so-called healthy channels is selected by identifying the set of channels with the most frequently occurring non-zero number of spikes.
- the healthy channels in each set i.e. the baseline measurements and the subsequent measurements in the presence of the compound are then compared further to identify the channels which are common to both sets. These common channels are then subjected to feature extraction to form a feature set.
- a feature must be readily extractable from the data and numerically quantifiable.
- Various processing algorithms are used to extract features meeting this requirement. As many such features as possible are included in the set to encompass as much of the information content of the data as possible. The presence of redundant features in the set is tolerated. Furthermore, by averaging as late as possible in the process, the sensitivity of the features is found to be enhanced. The significance of a measured feature can also be estimated by calculating the standard deviation of that measure over all the selected channels.
- the feature set can then be viewed as a vector quantity, with dimensions equal to the number of features; each component representing the numerical change to the feature in question equal to the difference between the baseline and subsequent measurements.
- Detection and classification reduces to performing manipulations on the response vectors.
- the detection process has been described above.
- the classification process is achieved by the use of standard cluster analysis by which is to be understood those mathematical clustering and partitioning techniques which can be used to group cases on the basis of their similarity over a range of variables e.g. component.
- Many clustering algorithms are available; they differ with respect to the method used to measure similarities (or dissimilarities) and the points between which distances are measured. Thus, although clustering algorithms are objective, there is scope for subjectivity in the selection of an algorithm.
- the most common clustering algorithms are polythetic agglomerative, i.e. a series of increasingly larger clusters are formed by the fusion of smaller clusters based on more than one variable.
- This hierarchical approach is particularly suited to computer based analysis in view of the large data sets which are to be analysed.
- a less computationally intensive and therefore more rapid approach is the non-hierarchical k means, or iterative relocation algorithm.
- Each case is initially placed in one of k clusters, cases are then moved between clusters if it minimises the differences between cases within a cluster.
- one of the aforementioned processes may be adopted.
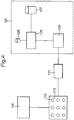
- FIG. 4 shows a schematic diagram of the sensor in which the cellular network is provided by a culture of cells derived from a species that is subject to a threat or a species whose response to a toxin, for example, may be extrapolated to another species such as humans.
- the cellular network may comprise scallop heart cells.
- the sensor 101 includes a plurality of chambers 117 each capable of housing an MEA 103.
- a perfusion system 118 permits the delivery of samples to be tested, for example a test sample derived from river water, to each MEA 103.
- the MEA 103 is as previously described in relation to the first embodiment in that it has a plurality of electrodes 107 arranged to contact the cellular network, in use. Electrical signals output from the electrodes 107 pass via an interconnect 119 to the amplifier unit 121 where the output is amplified.
- the amplifier unit 121 is a multichannel device capable of providing a gain of around 1000 to each channel. Typically, sufficient channels are available to allow each electrode 107 of the MEA 103 to be mapped to a channel.
- the amplifier unit itself is interfaced to a PC -based data acquisition system 123.
- the PC system 123 incorporates an Analogue to Digital conversion card 125 coupled via PCI bus to a central processor unit 126.
- the card 125 provides the external connections necessary to interface the analogue output of the amplifier 121 to the acquisition system 123.
- the card 125 is capable of sampling the amplified channel data from the amplifier unit 121 at up to 50 kHz/channel. The actual rate is determined by reference to the nature of cellular network and the resolution required to identify features of interest.
- the central processor unit 126 carries out instructions provided by software and/or firmware necessary to analyse the digital data.
- the data may be analysed in real time as events occur on the MEA 103 or retrieved from a storage device 127 such as a hard disk. In the former case, the storage device 127 may still be utilised to archive the data for later repeated or further analysis.
- the ability to proceed with real time as opposed to or off-line analysis will in some part depend on the rate at which data is generated and the storage capacity of the system 123.
- the software and/or firmware includes a library 128 of feature sets corresponding to experimental or otherwise derived responses to a particular toxin or toxins for a particular cellular network under threat.
- the sensor 101 typically is required to perform an identification and preferably classification function in relation to a pre-defined set of feature sets, i.e. there is no requirement for the sensor 101 to identify every compound that is present in the sample only those whose effect might be toxic to the species under threat.
- different libraries of feature sets may be loaded into the sensor 101.
- the sensor 101 is provided with software specific to the species with which a user is intending to work. Such software will contain the libraries as integrated portions of the software or as user loadable software modules.
- toxins For example, accumulation of toxins in shellfish represents a growing problem.
- Two toxins are of particular importance because of their profound effects on the human nervous system. These are amnesiac shellfish poisoning (ASP) and paralytic shellfish poisoning (PSP) toxins. Ingestion of large doses of these toxins can result in death.
- ASP amnesiac shellfish poisoning
- PSP paralytic shellfish poisoning
- the toxin primarily involved in ASP is domoic acid. Accordingly, before the sensor 101 may be utilised to detect the presence or otherwise of a particular toxin, it is necessary to provide a feature set for inclusion in the library 128 for subsequent use in the sensor. The creation of such a feature set or vector can be carried out using the system - described in the first embodiment.
- the primary toxin is domoic acid.
- a network of cortical neurone cells from a mouse is applied to an MEA.
- FIG. 5 is a graph illustrating the mean spike rate from rat cortical neurone culture when exposed to domoic acid of 100nM concentration at 10 minutes from the start of the data as indicated by the heavy line T. This response is then parameterised and stored in a file for inclusion in a software library of features.
- a sensor 101 is used to determine the presence or otherwise of ASP in a sample of shellfish.
- the sensor 101 incorporates storage for a library of feature sets or vectors indicative of the responses to particular toxins realised by particular species.
- the library may be downloaded to the sensor such that it is held on a hard disk or other storage media 127 or it may be accessed via a network connection to a database.
- the library is stored in an integrated circuit formed on the MEA 103 itself.
- an appropriate MEA 103 is selected having the requisite prestored library of feature sets or vectors applicable to a particular species under study.
- the integrated circuit is provided with the appropriate connections to the card edge connector to allow the library to be accessed by the sensor when installed in the receptacle in the well 115.
- a cellular network of rat derived cortical neurone cellular material is deposited on an MEA 103.
- the MEA 103 is placed within the receptacle 113 in the well 115 of the sensor 101 and a shellfish sample is placed upon the MEA 103.
- the electrical response of the network to the addition of the compound is extracted by the electrodes 107, amplified and the active channels identified and the relevant data captured. This data is then analysed against a library of feature sets including that obtained for ASP in relation to the MSR feature.
- a positive result is flagged and an appropriate warning indication is given by the sensor 101 which may be visual, audio or a combination thereof.
- an appropriate warning indication is given by the sensor 101 which may be visual, audio or a combination thereof.
- no such response is identified, again with a particular statistical confidence, then no such warning is given merely an indication with a level of confidence that the sample seems to be toxin free.
- further features may exist which are found to correlate strongly with the presence or otherwise of a particular toxin. Such a feature set may be utilised in the analysis of unknown compounds and a match with one or more may be sufficient to cause the sensor to generate a warning indication.
- the PC system 23 may be utilised as a measuring tool.
- the system 23 may be utilised to assess the physical and/or chemical characteristics of a known compound. For example, it has been recognised that the response of the system 23 to a particular compound may depend on the concentration of that compound. By establishing a library of features or feature set indicative of particular concentration levels at predetermined levels of statistical confidence, the concentration of a particular known compound may be identified.
- the measurement tool may be integrated with the identification and classification function such that an initially unknown compound may be both identified and particularised in terms of its physical/chemical properties.
Landscapes
- Engineering & Computer Science (AREA)
- Chemical & Material Sciences (AREA)
- Life Sciences & Earth Sciences (AREA)
- Computer Vision & Pattern Recognition (AREA)
- Data Mining & Analysis (AREA)
- Databases & Information Systems (AREA)
- Evolutionary Computation (AREA)
- General Health & Medical Sciences (AREA)
- Medical Informatics (AREA)
- Software Systems (AREA)
- Health & Medical Sciences (AREA)
- Artificial Intelligence (AREA)
- Bioinformatics & Cheminformatics (AREA)
- Crystallography & Structural Chemistry (AREA)
- Bioinformatics & Computational Biology (AREA)
- Computing Systems (AREA)
- Theoretical Computer Science (AREA)
- Investigating Or Analysing Biological Materials (AREA)
- Investigating Or Analyzing Materials By The Use Of Electric Means (AREA)
- Measuring Or Testing Involving Enzymes Or Micro-Organisms (AREA)
- Apparatus Associated With Microorganisms And Enzymes (AREA)
- Investigating, Analyzing Materials By Fluorescence Or Luminescence (AREA)
Applications Claiming Priority (3)
| Application Number | Priority Date | Filing Date | Title |
|---|---|---|---|
| GBGB0307352.5A GB0307352D0 (en) | 2003-03-29 | 2003-03-29 | Improvements in and relating to the analysis of compounds |
| GB0307352 | 2003-03-29 | ||
| PCT/GB2004/001228 WO2004088536A2 (en) | 2003-03-29 | 2004-03-23 | Method and system for analysis of compounds |
Publications (2)
| Publication Number | Publication Date |
|---|---|
| EP1609091A2 EP1609091A2 (en) | 2005-12-28 |
| EP1609091B1 true EP1609091B1 (en) | 2019-01-09 |
Family
ID=9955846
Family Applications (1)
| Application Number | Title | Priority Date | Filing Date |
|---|---|---|---|
| EP04722582.6A Expired - Lifetime EP1609091B1 (en) | 2003-03-29 | 2004-03-23 | Method and system for analysis of compounds |
Country Status (5)
| Country | Link |
|---|---|
| US (1) | US10140427B2 (enExample) |
| EP (1) | EP1609091B1 (enExample) |
| JP (2) | JP2006521550A (enExample) |
| GB (1) | GB0307352D0 (enExample) |
| WO (1) | WO2004088536A2 (enExample) |
Families Citing this family (12)
| Publication number | Priority date | Publication date | Assignee | Title |
|---|---|---|---|---|
| GB0307352D0 (en) | 2003-03-29 | 2003-05-07 | Qinetiq Ltd | Improvements in and relating to the analysis of compounds |
| JP5203357B2 (ja) * | 2006-05-26 | 2013-06-05 | ジーイー・ヘルスケア・バイオサイエンス・コーポレイション | 容器中のパラメータを監視するシステム及び方法 |
| US8923771B2 (en) * | 2010-08-30 | 2014-12-30 | Agency For Science, Technology And Research | Method, apparatus and computer program product for identifying frequency bands, and a method, apparatus and computer program product for evaluating performance |
| US9094493B2 (en) | 2012-04-25 | 2015-07-28 | Compliance Software, Inc. | Capturing and processing instant drug test results using a mobile device |
| WO2013162631A1 (en) | 2012-04-25 | 2013-10-31 | Compliance Software, Inc. | Capturing and processing instant drug test results using a mobile device |
| USD701320S1 (en) | 2012-04-25 | 2014-03-18 | Compliance Software, Inc. | Adaptable housing for mobile device based drug testing |
| TWI619809B (zh) * | 2012-08-24 | 2018-04-01 | 佐竹股份有限公司 | 微生物之檢查方法及其裝置 |
| JP6221210B2 (ja) * | 2012-09-11 | 2017-11-01 | 株式会社サタケ | 微生物の検査方法及びその装置 |
| US9279801B2 (en) * | 2013-07-26 | 2016-03-08 | Axion Biosystems, Inc. | Devices, systems and methods for high-throughput electrophysiology |
| WO2016025646A1 (en) | 2014-08-12 | 2016-02-18 | Axion Biosystems, Inc. | Cell-based biosensor array and associated methods for manufacturing the same |
| US10430395B2 (en) * | 2017-03-01 | 2019-10-01 | International Business Machines Corporation | Iterative widening search for designing chemical compounds |
| JP2021179319A (ja) * | 2020-05-11 | 2021-11-18 | アルファメッドサイエンティフィック株式会社 | 解析方法および解析装置 |
Family Cites Families (19)
| Publication number | Priority date | Publication date | Assignee | Title |
|---|---|---|---|---|
| US6075879A (en) * | 1993-09-29 | 2000-06-13 | R2 Technology, Inc. | Method and system for computer-aided lesion detection using information from multiple images |
| US5772983A (en) * | 1995-10-16 | 1998-06-30 | Worcester Foundation For Biomedical Research | Methods of screening for compounds which modulate insect behavior |
| JPH10170422A (ja) | 1996-12-12 | 1998-06-26 | Sanyo Electric Co Ltd | 複合型匂いセンサ |
| US5981268A (en) | 1997-05-30 | 1999-11-09 | Board Of Trustees, Leland Stanford, Jr. University | Hybrid biosensors |
| US6453241B1 (en) * | 1998-12-23 | 2002-09-17 | Rosetta Inpharmatics, Inc. | Method and system for analyzing biological response signal data |
| US6377057B1 (en) * | 1999-02-18 | 2002-04-23 | The Board Of Trustees Of The Leland Stanford Junior University | Classification of biological agents according to the spectral density signature of evoked changes in cellular electric potential |
| US6721754B1 (en) * | 1999-04-28 | 2004-04-13 | Arena Pharmaceuticals, Inc. | System and method for database similarity join |
| DE60041443D1 (de) * | 1999-05-21 | 2009-03-12 | James J Hickman | Vorrichtung für die analyse der elektrophysiologie von neuronalen zellen und ihre verwendung in hochdurchsatzverfahren zur funktionellen genanalyse |
| AU2606901A (en) | 1999-12-28 | 2001-07-09 | Pindi Products, Inc. | Method and apparatus for non-invasive analysis of blood glucose |
| CA2403874A1 (en) | 2000-03-28 | 2001-12-06 | Dana-Farber Cancer Institute, Inc. | Molecular database for antibody characterization |
| MXPA03000160A (es) * | 2000-07-07 | 2003-09-22 | Bristol Myers Squibb Co | Configuracion de electrofisiologia adecuada para separacion por exclusion de alta produccion de compuestos para el descubrimiento de farmacos. |
| WO2002099408A1 (fr) * | 2001-06-05 | 2002-12-12 | Matsushita Electric Industrial Co., Ltd. | Capteur de detection de signaux pourvu de multiples electrodes |
| GB0117715D0 (en) | 2001-07-19 | 2001-09-12 | Mrbp Res Ltd | Microwave biochemical analysis |
| CA2495021A1 (en) * | 2001-08-06 | 2003-07-03 | Vanderbilt University | System and methods for measuring at least one metabolic rate of a plurality of cells |
| WO2003017177A2 (en) * | 2001-08-13 | 2003-02-27 | Beyong Genomics, Inc. | Method and system for profiling biological systems |
| US20040265830A1 (en) * | 2001-10-17 | 2004-12-30 | Aniko Szabo | Methods for identifying differentially expressed genes by multivariate analysis of microaaray data |
| US6993440B2 (en) | 2002-04-22 | 2006-01-31 | Harris Corporation | System and method for waveform classification and characterization using multidimensional higher-order statistics |
| GB0307352D0 (en) | 2003-03-29 | 2003-05-07 | Qinetiq Ltd | Improvements in and relating to the analysis of compounds |
| JP5332647B2 (ja) | 2009-01-23 | 2013-11-06 | 日本電気株式会社 | モデル選択装置、モデル選択装置の選択方法及びプログラム |
-
2003
- 2003-03-29 GB GBGB0307352.5A patent/GB0307352D0/en not_active Ceased
-
2004
- 2004-03-23 EP EP04722582.6A patent/EP1609091B1/en not_active Expired - Lifetime
- 2004-03-23 JP JP2006505994A patent/JP2006521550A/ja not_active Withdrawn
- 2004-03-23 US US10/551,070 patent/US10140427B2/en not_active Expired - Fee Related
- 2004-03-23 WO PCT/GB2004/001228 patent/WO2004088536A2/en not_active Ceased
-
2011
- 2011-10-26 JP JP2011235495A patent/JP5542285B2/ja not_active Expired - Fee Related
Non-Patent Citations (1)
| Title |
|---|
| SOKAL D M ET AL: "MULTI-NEURONAL RECORDINGS REVEAL A DIFFERENTIAL EFFECT OF THAPSIGARGIN ON BICUCULLINE- OR GABAZINE-INDUCED EPILEPTIFORM EXCITABILITY IN RAT HIPPOCAMPAL NEURONAL NETWORKS", NEUROPHARMACOLOGY, PERGAMON PRESS, OXFORD, GB, vol. 39, no. 12, 1 January 2000 (2000-01-01), pages 2408 - 2417, XP000986328, ISSN: 0028-3908, DOI: 10.1016/S0028-3908(00)00095-2 * |
Also Published As
| Publication number | Publication date |
|---|---|
| WO2004088536A3 (en) | 2005-03-24 |
| GB0307352D0 (en) | 2003-05-07 |
| JP5542285B2 (ja) | 2014-07-09 |
| JP2006521550A (ja) | 2006-09-21 |
| US20060177869A1 (en) | 2006-08-10 |
| EP1609091A2 (en) | 2005-12-28 |
| WO2004088536A2 (en) | 2004-10-14 |
| JP2012053056A (ja) | 2012-03-15 |
| US10140427B2 (en) | 2018-11-27 |
Similar Documents
| Publication | Publication Date | Title |
|---|---|---|
| JP5542285B2 (ja) | 化合物を分析するための方法 | |
| Lamers et al. | Identification of disease-and nutrient-related metabolic fingerprints in osteoarthritic Guinea pigs | |
| Schiff et al. | Neuronal spatiotemporal pattern discrimination: the dynamical evolution of seizures | |
| Stashuk | Decomposition and quantitative analysis of clinical electromyographic signals | |
| Bologna et al. | Investigating neuronal activity by SPYCODE multi-channel data analyzer | |
| Halford | Computerized epileptiform transient detection in the scalp electroencephalogram: Obstacles to progress and the example of computerized ECG interpretation | |
| Nelson | The importance of invariant and distinctive features in species recognition of bird song | |
| US5285793A (en) | Noninvasive detection of rejection in heart transplant patients | |
| Nádasdy et al. | Extracellular recording and analysis of neuronal activity: from single cells to ensembles | |
| Hu et al. | MEA-toolbox: an open source toolbox for standardized analysis of multi-electrode array data | |
| Gerstein et al. | Neural assemblies: technical issues, analysis, and modeling | |
| US8150795B2 (en) | Methods and devices for analysis of clustered data, in particular action potentials (i.e. neuron firing signals in the brain) | |
| Raihan et al. | Multi-class electrogastrogram (EGG) signal classification using machine learning algorithms | |
| US20040106101A1 (en) | System and method for quality control of a shipped neural cell culture on a microelectrode array | |
| Mouleeshuwarapprabu et al. | Nonlinear vector decomposed neural network based EEG signal feature extraction and detection of seizure | |
| Castelli et al. | Hippocampal ripple diversity organizes neuronal reactivation dynamics in the offline brain | |
| Abbaspoor et al. | Circuit dynamics of superficial and deep CA1 pyramidal cells and inhibitory cells in freely moving macaques | |
| JP4950993B2 (ja) | 複数のサンプルから得られる代謝物のデータを、コンピュータシステムのデータベースを用いて比較および編集するためのシステムおよび方法 | |
| US20120221256A1 (en) | Functional characterization of biological samples | |
| Yang et al. | A biosensing system employing nonlinear dynamic analysis-assisted neural network for drug-induced cardiotoxicity assessment | |
| Takahashi et al. | Classification of neuronal activities from tetrode recordings using independent component analysis | |
| EP1444506A2 (en) | Detection and characterization of pyschoactives using parallel multi-site assays in neuronal tissue | |
| WO2022034802A1 (ja) | 脳から取得される波形データに対してバースト解析を行う方法、コンピュータシステム、プログラム、ならびに、バースト解析を用いて標的の状態を予測する方法、コンピュータシステム、プログラム | |
| Moukadem et al. | Automatic heart sound analysis module based on Stockwell transform | |
| Klempíř et al. | Automated neurons recognition and sorting for diamond based microelectrode arrays recording: A feasibility study |
Legal Events
| Date | Code | Title | Description |
|---|---|---|---|
| PUAI | Public reference made under article 153(3) epc to a published international application that has entered the european phase |
Free format text: ORIGINAL CODE: 0009012 |
|
| 17P | Request for examination filed |
Effective date: 20050924 |
|
| AK | Designated contracting states |
Kind code of ref document: A2 Designated state(s): AT BE BG CH CY CZ DE DK EE ES FI FR GB GR HU IE IT LI LU MC NL PL PT RO SE SI SK TR |
|
| AX | Request for extension of the european patent |
Extension state: AL LT LV MK |
|
| DAX | Request for extension of the european patent (deleted) | ||
| 17Q | First examination report despatched |
Effective date: 20110523 |
|
| RAP1 | Party data changed (applicant data changed or rights of an application transferred) |
Owner name: MEDIAS MEDISCIENCE LIMITED |
|
| RAP1 | Party data changed (applicant data changed or rights of an application transferred) |
Owner name: MIDAS MEDISCIENCE LIMITED |
|
| TPAC | Observations filed by third parties |
Free format text: ORIGINAL CODE: EPIDOSNTIPA |
|
| STAA | Information on the status of an ep patent application or granted ep patent |
Free format text: STATUS: EXAMINATION IS IN PROGRESS |
|
| GRAP | Despatch of communication of intention to grant a patent |
Free format text: ORIGINAL CODE: EPIDOSNIGR1 |
|
| STAA | Information on the status of an ep patent application or granted ep patent |
Free format text: STATUS: GRANT OF PATENT IS INTENDED |
|
| INTG | Intention to grant announced |
Effective date: 20180705 |
|
| TPAC | Observations filed by third parties |
Free format text: ORIGINAL CODE: EPIDOSNTIPA |
|
| GRAS | Grant fee paid |
Free format text: ORIGINAL CODE: EPIDOSNIGR3 |
|
| GRAA | (expected) grant |
Free format text: ORIGINAL CODE: 0009210 |
|
| STAA | Information on the status of an ep patent application or granted ep patent |
Free format text: STATUS: THE PATENT HAS BEEN GRANTED |
|
| AK | Designated contracting states |
Kind code of ref document: B1 Designated state(s): AT BE BG CH CY CZ DE DK EE ES FI FR GB GR HU IE IT LI LU MC NL PL PT RO SE SI SK TR |
|
| REG | Reference to a national code |
Ref country code: GB Ref legal event code: FG4D |
|
| REG | Reference to a national code |
Ref country code: CH Ref legal event code: EP Ref country code: AT Ref legal event code: REF Ref document number: 1088158 Country of ref document: AT Kind code of ref document: T Effective date: 20190115 |
|
| REG | Reference to a national code |
Ref country code: DE Ref legal event code: R096 Ref document number: 602004053622 Country of ref document: DE |
|
| REG | Reference to a national code |
Ref country code: IE Ref legal event code: FG4D |
|
| REG | Reference to a national code |
Ref country code: CH Ref legal event code: NV Representative=s name: PATENTANWAELTE SCHAAD, BALASS, MENZL AND PARTN, CH |
|
| REG | Reference to a national code |
Ref country code: NL Ref legal event code: MP Effective date: 20190109 |
|
| PG25 | Lapsed in a contracting state [announced via postgrant information from national office to epo] |
Ref country code: NL Free format text: LAPSE BECAUSE OF FAILURE TO SUBMIT A TRANSLATION OF THE DESCRIPTION OR TO PAY THE FEE WITHIN THE PRESCRIBED TIME-LIMIT Effective date: 20190109 |
|
| REG | Reference to a national code |
Ref country code: AT Ref legal event code: MK05 Ref document number: 1088158 Country of ref document: AT Kind code of ref document: T Effective date: 20190109 |
|
| PG25 | Lapsed in a contracting state [announced via postgrant information from national office to epo] |
Ref country code: SE Free format text: LAPSE BECAUSE OF FAILURE TO SUBMIT A TRANSLATION OF THE DESCRIPTION OR TO PAY THE FEE WITHIN THE PRESCRIBED TIME-LIMIT Effective date: 20190109 Ref country code: FI Free format text: LAPSE BECAUSE OF FAILURE TO SUBMIT A TRANSLATION OF THE DESCRIPTION OR TO PAY THE FEE WITHIN THE PRESCRIBED TIME-LIMIT Effective date: 20190109 Ref country code: ES Free format text: LAPSE BECAUSE OF FAILURE TO SUBMIT A TRANSLATION OF THE DESCRIPTION OR TO PAY THE FEE WITHIN THE PRESCRIBED TIME-LIMIT Effective date: 20190109 Ref country code: PT Free format text: LAPSE BECAUSE OF FAILURE TO SUBMIT A TRANSLATION OF THE DESCRIPTION OR TO PAY THE FEE WITHIN THE PRESCRIBED TIME-LIMIT Effective date: 20190509 Ref country code: PL Free format text: LAPSE BECAUSE OF FAILURE TO SUBMIT A TRANSLATION OF THE DESCRIPTION OR TO PAY THE FEE WITHIN THE PRESCRIBED TIME-LIMIT Effective date: 20190109 |
|
| PG25 | Lapsed in a contracting state [announced via postgrant information from national office to epo] |
Ref country code: BG Free format text: LAPSE BECAUSE OF FAILURE TO SUBMIT A TRANSLATION OF THE DESCRIPTION OR TO PAY THE FEE WITHIN THE PRESCRIBED TIME-LIMIT Effective date: 20190409 Ref country code: GR Free format text: LAPSE BECAUSE OF FAILURE TO SUBMIT A TRANSLATION OF THE DESCRIPTION OR TO PAY THE FEE WITHIN THE PRESCRIBED TIME-LIMIT Effective date: 20190410 |
|
| REG | Reference to a national code |
Ref country code: DE Ref legal event code: R097 Ref document number: 602004053622 Country of ref document: DE |
|
| PG25 | Lapsed in a contracting state [announced via postgrant information from national office to epo] |
Ref country code: MC Free format text: LAPSE BECAUSE OF FAILURE TO SUBMIT A TRANSLATION OF THE DESCRIPTION OR TO PAY THE FEE WITHIN THE PRESCRIBED TIME-LIMIT Effective date: 20190109 Ref country code: RO Free format text: LAPSE BECAUSE OF FAILURE TO SUBMIT A TRANSLATION OF THE DESCRIPTION OR TO PAY THE FEE WITHIN THE PRESCRIBED TIME-LIMIT Effective date: 20190109 Ref country code: CZ Free format text: LAPSE BECAUSE OF FAILURE TO SUBMIT A TRANSLATION OF THE DESCRIPTION OR TO PAY THE FEE WITHIN THE PRESCRIBED TIME-LIMIT Effective date: 20190109 Ref country code: EE Free format text: LAPSE BECAUSE OF FAILURE TO SUBMIT A TRANSLATION OF THE DESCRIPTION OR TO PAY THE FEE WITHIN THE PRESCRIBED TIME-LIMIT Effective date: 20190109 Ref country code: AT Free format text: LAPSE BECAUSE OF FAILURE TO SUBMIT A TRANSLATION OF THE DESCRIPTION OR TO PAY THE FEE WITHIN THE PRESCRIBED TIME-LIMIT Effective date: 20190109 Ref country code: IT Free format text: LAPSE BECAUSE OF FAILURE TO SUBMIT A TRANSLATION OF THE DESCRIPTION OR TO PAY THE FEE WITHIN THE PRESCRIBED TIME-LIMIT Effective date: 20190109 Ref country code: SK Free format text: LAPSE BECAUSE OF FAILURE TO SUBMIT A TRANSLATION OF THE DESCRIPTION OR TO PAY THE FEE WITHIN THE PRESCRIBED TIME-LIMIT Effective date: 20190109 Ref country code: DK Free format text: LAPSE BECAUSE OF FAILURE TO SUBMIT A TRANSLATION OF THE DESCRIPTION OR TO PAY THE FEE WITHIN THE PRESCRIBED TIME-LIMIT Effective date: 20190109 |
|
| PLBE | No opposition filed within time limit |
Free format text: ORIGINAL CODE: 0009261 |
|
| STAA | Information on the status of an ep patent application or granted ep patent |
Free format text: STATUS: NO OPPOSITION FILED WITHIN TIME LIMIT |
|
| PG25 | Lapsed in a contracting state [announced via postgrant information from national office to epo] |
Ref country code: LU Free format text: LAPSE BECAUSE OF NON-PAYMENT OF DUE FEES Effective date: 20190323 |
|
| REG | Reference to a national code |
Ref country code: BE Ref legal event code: MM Effective date: 20190331 |
|
| 26N | No opposition filed |
Effective date: 20191010 |
|
| PG25 | Lapsed in a contracting state [announced via postgrant information from national office to epo] |
Ref country code: IE Free format text: LAPSE BECAUSE OF NON-PAYMENT OF DUE FEES Effective date: 20190323 |
|
| PG25 | Lapsed in a contracting state [announced via postgrant information from national office to epo] |
Ref country code: BE Free format text: LAPSE BECAUSE OF NON-PAYMENT OF DUE FEES Effective date: 20190331 Ref country code: SI Free format text: LAPSE BECAUSE OF FAILURE TO SUBMIT A TRANSLATION OF THE DESCRIPTION OR TO PAY THE FEE WITHIN THE PRESCRIBED TIME-LIMIT Effective date: 20190109 |
|
| PG25 | Lapsed in a contracting state [announced via postgrant information from national office to epo] |
Ref country code: TR Free format text: LAPSE BECAUSE OF FAILURE TO SUBMIT A TRANSLATION OF THE DESCRIPTION OR TO PAY THE FEE WITHIN THE PRESCRIBED TIME-LIMIT Effective date: 20190109 |
|
| PGFP | Annual fee paid to national office [announced via postgrant information from national office to epo] |
Ref country code: FR Payment date: 20210325 Year of fee payment: 18 |
|
| PG25 | Lapsed in a contracting state [announced via postgrant information from national office to epo] |
Ref country code: CY Free format text: LAPSE BECAUSE OF FAILURE TO SUBMIT A TRANSLATION OF THE DESCRIPTION OR TO PAY THE FEE WITHIN THE PRESCRIBED TIME-LIMIT Effective date: 20190109 |
|
| PG25 | Lapsed in a contracting state [announced via postgrant information from national office to epo] |
Ref country code: HU Free format text: LAPSE BECAUSE OF FAILURE TO SUBMIT A TRANSLATION OF THE DESCRIPTION OR TO PAY THE FEE WITHIN THE PRESCRIBED TIME-LIMIT; INVALID AB INITIO Effective date: 20040323 |
|
| PGFP | Annual fee paid to national office [announced via postgrant information from national office to epo] |
Ref country code: CH Payment date: 20210422 Year of fee payment: 18 |
|
| PGFP | Annual fee paid to national office [announced via postgrant information from national office to epo] |
Ref country code: GB Payment date: 20210702 Year of fee payment: 18 Ref country code: DE Payment date: 20210721 Year of fee payment: 18 |
|
| REG | Reference to a national code |
Ref country code: DE Ref legal event code: R119 Ref document number: 602004053622 Country of ref document: DE |
|
| REG | Reference to a national code |
Ref country code: CH Ref legal event code: PL |
|
| GBPC | Gb: european patent ceased through non-payment of renewal fee |
Effective date: 20220323 |
|
| PG25 | Lapsed in a contracting state [announced via postgrant information from national office to epo] |
Ref country code: LI Free format text: LAPSE BECAUSE OF NON-PAYMENT OF DUE FEES Effective date: 20220331 Ref country code: GB Free format text: LAPSE BECAUSE OF NON-PAYMENT OF DUE FEES Effective date: 20220323 Ref country code: FR Free format text: LAPSE BECAUSE OF NON-PAYMENT OF DUE FEES Effective date: 20220331 Ref country code: DE Free format text: LAPSE BECAUSE OF NON-PAYMENT OF DUE FEES Effective date: 20221001 Ref country code: CH Free format text: LAPSE BECAUSE OF NON-PAYMENT OF DUE FEES Effective date: 20220331 |